SMALLMOU TH BA SS INN DOOR COUNTY - dnr.wi.gov filend Spo rces N DOOR eon Ba rt Fishe COU y Popu ry...
14
S B W S S 2 Scott Hans Bureau of F Wisconsin Sturgeon B SMALL 2015 Stu sen and Em Fisheries M Departme Bay Fisher LMOU urgeon B Asses mily Kursz Managem ent of Natu ries Office UTH BA Bay/Litt ssment a zewski ment ural Resou ASS IN tle Sturg and Spo urces N DOOR geon Ba ort Fishe R COU ay Popu ery UNTY lation
Transcript of SMALLMOU TH BA SS INN DOOR COUNTY - dnr.wi.gov filend Spo rces N DOOR eon Ba rt Fishe COU y Popu ry...
SBWS
S2
Scott HansBureau of FWisconsin Sturgeon B
SMALL2015 Stu
sen and EmFisheries MDepartme
Bay Fisher
LMOUurgeon B
Asses
mily KurszManagement of Naturies Office
UTH BABay/Littssment a
zewski ment
ural Resou
ASS INtle Sturgand Spo
urces
N DOORgeon Ba
ort Fishe
R COUay Popuery
UNTY lation

1
Executive Summary
Smallmouth bass populations in the Sturgeon Bay/Little Sturgeon Bay areas of Door County waters of Green Bay were evaluated during the pre-spawn period during the spring of 2015. The populations were generally in good condition regarding abundance, fish size, and recruitment. However, size and numbers of fish (as measured by catch-per-unit effort) have declined somewhat since the last assessment of this area in 2009; though the age compositions were fairly well distributed with greater percentages of fish in the mid to younger age classes (ages 5-8) than in 2009. The percentage of age-4 fish was considerably lower than in 2009. This was likely a result of poor recruitment in 2011 but other factors may also contribute. In recent years anglers have reported a higher prevalence of lesions on smallmouth bass in areas around Door County. The cause for this malady is still being researched. The sport catch rate (number caught per hour of fishing) for smallmouth bass has decreased in recent years from 0.82 in 2013 to 0.64 fish per hour in 2015. Angling effort has continued to climb however and in 2015 reached the third highest level in the time series beginning in 1986. Fishing tournaments have reached an all-time high in recent years. The impacts of relocating tournament caught fish away from smaller, localized populations remains a concern. The recovery of Lake Michigan water levels over the last two years, after a record low in 2013, has been very positive news that has greatly curtailed the number of requests for riparian zone dredging and has increased the overall level of habitat available for smallmouth bass spawning and rearing.
I TptbtSpd
M
P
FsaatdaSmonmwoSieeacipSb C T1tsm
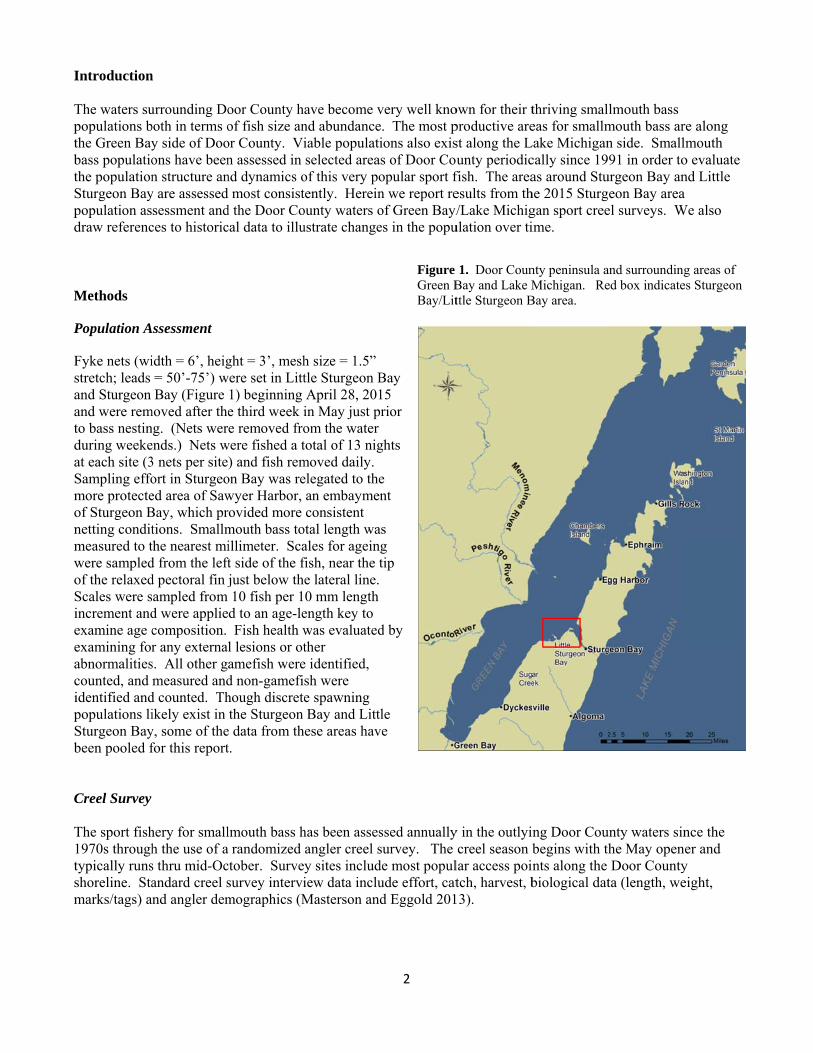
Introduction
The waters supopulations bthe Green Baybass populatiothe populationSturgeon Baypopulation asdraw referenc
Methods
Population A
Fyke nets (wistretch; leads and Sturgeon and were remto bass nestinduring weekeat each site (3Sampling effomore protecteof Sturgeon Bnetting conditmeasured to twere sampledof the relaxedScales were sincrement andexamine age cexamining forabnormalitiescounted, and identified andpopulations liSturgeon Baybeen pooled f
Creel Survey
The sport fish1970s throughtypically runsshoreline. Stamarks/tags) a
n
urrounding Doboth in terms oy side of Dooons have beenn structure an
y are assessedsessment and
ces to historic
ssessment
idth = 6’, heig= 50’-75’) wBay (Figure
moved after theng. (Nets werends.) Nets w3 nets per siteort in Sturgeoed area of SawBay, which prtions. Smallmthe nearest mid from the leftd pectoral fin jampled from d were appliecomposition. r any external
s. All other gmeasured and
d counted. Thikely exist in y, some of thefor this report
hery for smallh the use of as thru mid-Ocandard creel snd angler dem
oor County hof fish size anor County. Vin assessed in nd dynamics od most consistd the Door Cocal data to illu
ght = 3’, meshwere set in Litt
1) beginning e third week ie removed fro
were fished a t) and fish rem
on Bay was rewyer Harbor, rovided more mouth bass toillimeter. Sca
ft side of the fjust below th10 fish per 1d to an age-le Fish health wl lesions or otamefish wered non-gamefihough discretethe Sturgeon
e data from tht.
lmouth bass ha randomized ctober. Survesurvey intervimographics (M
ave become vnd abundanceiable populatiselected area
of this very potently. Hereinounty waters oustrate change
h size = 1.5” tle Sturgeon BApril 28, 201in May just pom the water total of 13 nigmoved daily. elegated to thean embaymenconsistent
otal length waales for ageinfish, near the te lateral line. 0 mm length
ength key to was evaluatedther e identified, sh were e spawning Bay and Littese areas hav
has been assesangler creel sy sites includiew data incluMasterson and
2
Figure Green BBay/Lit
very well knoe. The most pions also exiss of Door Couopular sport fn we report reof Green Bay/es in the popu
Bay 15 rior
ghts
e nt
as g tip
d by
le ve
ssed annuallysurvey. The de most populude effort, catd Eggold 201
1. Door CounBay and Lake Mttle Sturgeon B
own for their tproductive arest along the Lunty periodic
fish. The areaesults from th/Lake Michig
ulation over ti
y in the outlyincreel season b
lar access pointch, harvest, b
13).
nty peninsula aMichigan. Re
Bay area.
thriving smaleas for smallm
Lake Michigancally since 19as around Stu
he 2015 Sturggan sport creeime.
ng Door Coubegins with thnts along the biological dat
and surroundinged box indicate
lmouth bass mouth bass arn side. Small91 in order to
urgeon Bay aneon Bay area
el surveys. W
unty waters sinhe May openDoor County
ta (length, we
g areas of es Sturgeon
re along lmouth o evaluate nd Little a
We also
nce the er and
y eight,

Su C N1,StCSt Nbo(nre A Tleposupono
FBan
urvey Result
Catch
Nets were fish,059 smallmoturgeon Bay.
Catch rates weturgeon Bay (
Nearly 3,000 fowfin (n=126n=25), pumpkedhorse spp. (
ge Compositi
he smallmouteast 5 year claopulation (Figuggesting 201otentially not ot have been
igure 2. AgeBay and Sturgend older fish.)
ts
ed for a total outh bass were
There were ere 15.7 fish c(a mean of 13
fish of other sp6), white suckkinseed (n=23(n=2), freshw
ion
th bass samplasses were wegure 2). The 10 and 2007 w
fully samplea strong year
e compositioneon Bay. (Be)
of 78 net nighe caught durin16 and 10 fish
caught per net3.6 smallmout
pecies were cker (n=84), lon3), common cater drum (n=
led in Little Sell representedage-5 and ag
were stronger d) were captuclass.
n of smallmoueyond age-9 a
hts (no. nets xng this surveyh recaptured t night in Sawth bass caugh
captured in thngnose gar (narp (n=17), m
=2), largemou
Sturgeon and Sd (age-5 to age-8 fish stoodyear classes.
ured during th
uth bass fromageing accura
3
x no. nights fiy; 613 in Sawin Sawyer Ha
wyer Harbor aht per net nigh
he survey inclun=66), walleymuskellunge (uth bass (n=1)
Sturgeon Bayge-9), each mad out and mad Fewer age-
his survey tha
2004, 2009, acy likely decr
fished), 39 netwyer Harbor (arbor and Littand 11.4 fish cht overall).
uding bullheaye (n=60), yel(9), gizzard sh), and round g
ys in 2015 ranaking up apprde up nearly 5-4 fish (youngan in the 2009
and 2015 spareases consid
t nights in eacSturgeon Baytle Sturgeon Bcaught per ne
ad spp. (n=15llow perch (n=had (n=5), chgoby (n=1).
nged from 3 toroximately 1050% of the fisgest fish samp9 assessment i
awning surveyderably so age
ch location. Ay) and 446 in Bay, respectivet night in Litt
585), rock bas=49), northern
hannel catfish
o 15 years of 0% or more osh in the samppled by the geindicating 20
ys in Little Stes are pooled
A total of Little
vely. tle
ss (n=865), n pike (n=3),
f age and at of the ple ear, though 11 may
turgeon for age 10

Si
Tdim22(s17prsp Mapcl14 ERis(Gisw
Fsubi
ize
he length comistributed tho
medium size c2.6 inches. Insame site as re7 inches whilrominent in thpawning surv
Mean length atpparent decrelasses. Grow4” legal size l
vidence that tRelative Stocks the stock sizGabelhouse 1s still consider
with a minimu
igure 3. Lenurvey years. Lin could have
mposition of sugh there waategories in 2ncidentally, thecapture in 20e 18% were 1he populationeys remained
t age has increase in mean lth in 2015 is limit until aro
the overall Stk Density of fize as determin984) In 2009rably higher t
um sample siz
ngth compositLength bins a
e been betwee
smallmouth bs somewhat o
2015 (Figure 3his fish had b015) and mea18 inches or gn than they wed similar acros
reased considelength at age still considera
ound 7 years o
turgeon Bay/Lish ≥ 18” (RSned using Am9 the RSD-18 than the meanze of 100 bass
tions for Littleare delineateden 16 and 16.9
bass in the Litof a shift from3). Fish lengteen tagged du
asured 19.7 ingreater (declinere in 2004. Tss years (2004
erably from thfrom 2009 to ably greater tof age, now fi
Little SturgeoSD-18) using t
merican Fisherwas 24 but b
n RSD-18 of 7s. However, i
e Sturgeon Bad by any fish t99 inches long
4
ttle Sturgeon am more fish in
th ranged fromuring the 200
nches at that tining from 25%The average l4 - 16.1 inche
he mid-1990s2015 is smal
than historicalfish on averag
on Bay size cothe formula: (
ries Society leby 2015 it had7.3 for 14 inlait is below the
ay/Sturgeon Bthat fell withig).
and Sturgeonn the larger cam 11 to 22 in9 smallmouthime. Over 70% in 2009). Llength of smaes, 2009 - 16.
s to the 2009 ll with considl. Whereas h
ge reach the le
omposition ha(No. fish ≥ 18ength standardd fallen to 18.and Wisconsie upper 95th p
Bay smallmouin a particular
n Bay areas duategories in 20nches and the h bass survey 0% of the fishLarger fish wallmouth bass5 inches, and
and 2015 surderable overlahistorically a fegal limit by 5
as decreased i8”/ No. fish ≥ds for smallm. The 2015 vain lakes asses
percentile (24.
uth bass in 20r inch group (
uring 2015 wa009 to more flargest fish min Little Stur
h were betweewere still much
sampled in thd 16.3 inches i
rveys (Figure ap in lengths ofish did not re5 years of age
is indicated b≥ 7”) x 100. (mouth bass) alue for Sturg
ssed in 2014 a.6) of those la
004, 2009 and(e.g. a fish in
as well fish in the measured rgeon en 14 and h more he in 2015).
4). The of the age each the e.
by the (Note: 7”
geon Bay and 2015 akes.
d 2015 the 16”

F F Tde20fioflale5/reis(hafStth
Fspcish Health
Fish Health
here have beeecade (Figure008 and 2009eld survey obften circular iamprey attackesion or woun/5a) It’s likelecording wous a bacterial inhttp://dnr.wi.ffected fish apturgeon Bay f
he Door Coun
Figure 4. Mepawning perionsiderably t
en episodes oes 5/5a). The 9. The incidenbservations. Tin shape, and ks. Fourteen ond site on the ly that 1% wands in the surnfection that i.gov/topic/Fisppeared to befisheries staff
nty area.
an length (in)ods in Little S
though the tre
f apparently hfirst angler re
nce of lesionsThese specificcan severely
of the 1,033 sskin surface (
as the minimurveys. Samplis common toshing/fishhea in good condf have observ
) at age of smSturgeon Bayends in increa
high levels ofeports and fies apparently sc lesions haveerode the ski
smallmouth ba(just over 1%um percentageles from affeco a number of alth/index.htmdition. No larved low level
mallmouth basy and Sturgeosed growth ra
5
f external lesield survey obssubsided untile typically ben and muscleass handled d
%). (Note: not e of fish affeccted fish in 20f fish species dml). Aside frorge scale fish mortality fro
ss sampled dun Bay. (Noteate are genera
ions affectingservations of l reemerging
een observed oe tissue. Wouduring the 201all lesions/wo
cted since the015 revealed Cduring certainom the extremkills were rep
om apparent C
uring the 1994e that beyond ally consistent
g smallmouth f lesion-affectein 2015 fromon the upper p
unds often res15 survey shoounds were c
ere was no forColumnaris inn times of yeame severity ofported during
Columnaris ou
4/1995, 2004,age-9 ageingt.)
bass over theed fish occurr
m angler reportportion of the
semble scars lowed some foonsistent withrmal protocol nfections. Coar f some of theg this time perutbreaks perio
, 2009, and 20g accuracy lik
e past red in late ts and e fish, are left by orm of h Figure for
olumnaris
lesions, riod. odically in
015 spring kely decreasess
6
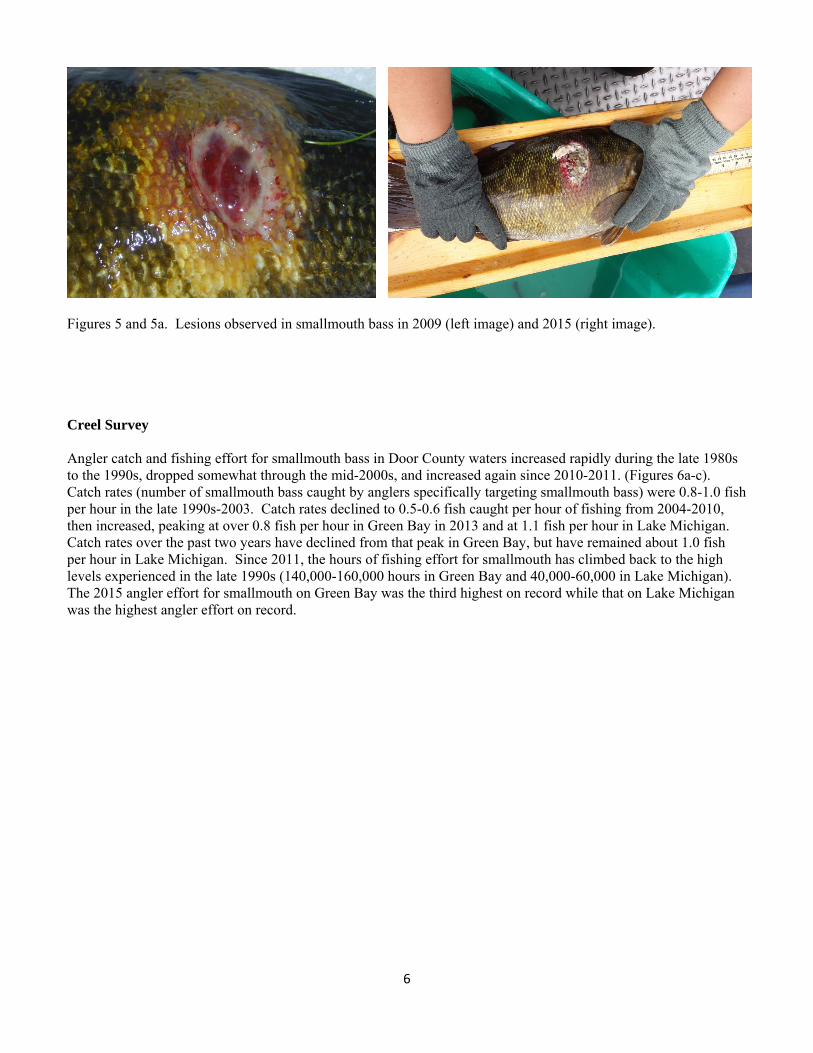
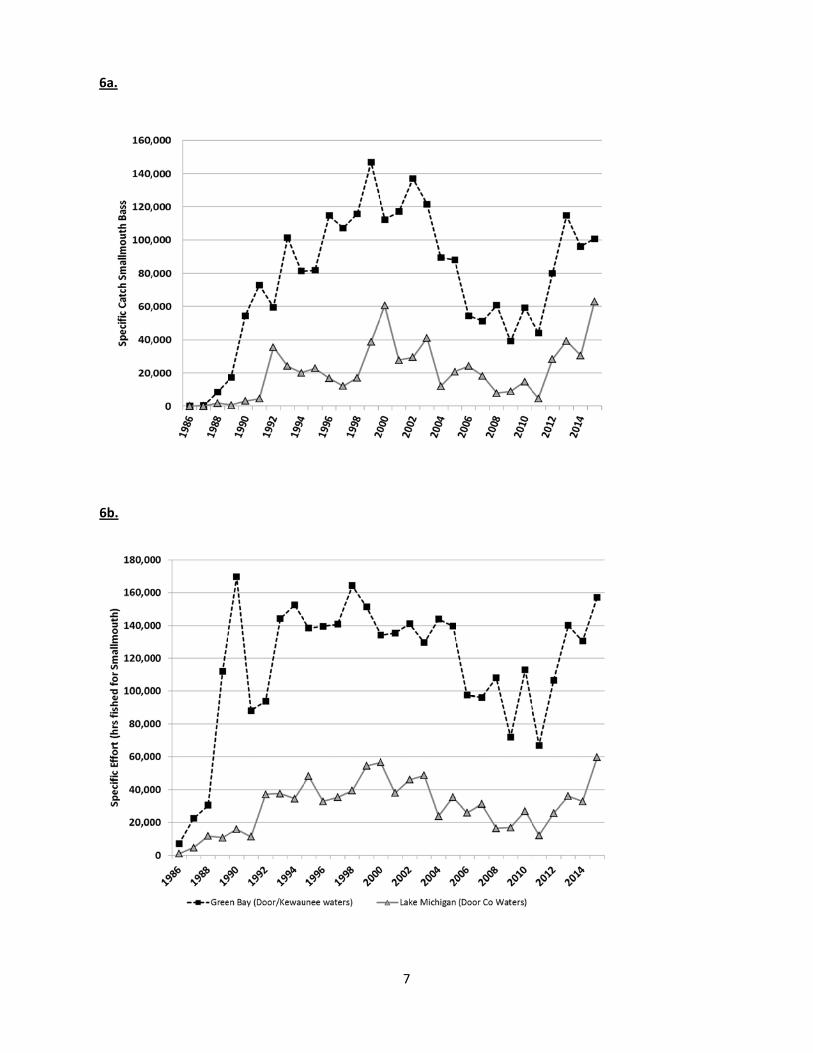
Figures 5 and 5a. Lesions observed in smallmouth bass in 2009 (left image) and 2015 (right image). Creel Survey Angler catch and fishing effort for smallmouth bass in Door County waters increased rapidly during the late 1980s to the 1990s, dropped somewhat through the mid-2000s, and increased again since 2010-2011. (Figures 6a-c). Catch rates (number of smallmouth bass caught by anglers specifically targeting smallmouth bass) were 0.8-1.0 fish per hour in the late 1990s-2003. Catch rates declined to 0.5-0.6 fish caught per hour of fishing from 2004-2010, then increased, peaking at over 0.8 fish per hour in Green Bay in 2013 and at 1.1 fish per hour in Lake Michigan. Catch rates over the past two years have declined from that peak in Green Bay, but have remained about 1.0 fish per hour in Lake Michigan. Since 2011, the hours of fishing effort for smallmouth has climbed back to the high levels experienced in the late 1990s (140,000-160,000 hours in Green Bay and 40,000-60,000 in Lake Michigan). The 2015 angler effort for smallmouth on Green Bay was the third highest on record while that on Lake Michigan was the highest angler effort on record.
6b.
6a.
7

Fef
DlikTdo19be19re±asyebosi
igure 6a-c. Cffort, and catc
During the midkely due to lohis occurred oubling betwe991 to 1997 ietween 1986 998-2004 aveemained relati1,286 (1 SD) s Green Bay aears. Howeveoat access andide of Door C
6c.
Creel survey rch rates are sp
ddle to late 19ower populatidespite the imeen 1990 andn Green Bay and 1990. Im
eraged 14,566ively low evefish annually
although the rer, harvest ond lower, more
County.
results for Dopecific to ang
980s harvest oion abundancemplementationd 1991 in Gree
waters was 3mplementation6 ±3,690 (1 SDer since. Betwy. Harvest in reduction in hn Lake Michige concentrated
oor County wlers targeting
of smallmouthe. However, n of a 12” sizen Bay water4,649 ±6,314n of the 14” sD) fish annuaween 2005 anLake Michig
harvest after thgan generallyd smallmouth
8
waters of Greeng smallmouth
h bass in Doosmallmouth he limit in 198s of Door Cou
4 (1 SD), morsize limit in 19ally. By 2005nd 2015 the hagan waters of Dhe 1998 size
y is substantiah populations
n Bay and Labass.
or County outharvest increa89 (there was unty (Figure
re than 5 time998 likely red
5, a trend of loarvest in GreeDoor Countylimit change
ally lower thancharacterize
ake Michigan
tlying waters ased dramaticno size limit 7). The mean
es the averageduced harvestower harvest en Bay watersy generally fol
has perpetuatn the harvest the fishery on
n, 1986-2015.
was relativelcally in the eaprior), more
n annual harve annual harvet dramaticallybegan and has averaged 6,2llows the samted through toin Green Bayn the Lake M
Catch,
y low, arly 1990s. than
vest from est (5,793) y and from as 274
me patterns o recent y. Limited
Michigan

FA
D
PosuRTththimStabpoapbyhagoinA
igure 7. SmaArrows indicat
Discussion
opulations in urvey catch p
Recruitment ofhis could be a
he gear due tohey have not rmpact of rounturgeon Bay ibundance throopulation untpparent in they round gobieas decreased ood. Despite ncreased size
Although the r
allmouth basste size limit c
the Sturgeoner unit effort f the 2011 yeaas result of fe
o slower growreached repro
nd goby as a nin 1999 (Steinoughout this ail around 200
e catch rates ines or other strslightly from the continuedat age in sma
recent creel ca
1
s harvest histohanges in 198
n Bay/Little Stand size strucar class to the
ewer fish in thwth. It is not poductive matunest predator onhart et al., 20area, their imp09 or later. Ton the fishery.ressors curren2009, it rema
d concern oveallmouth bass atch per unit o
12”
ory in Door C89 and 1998.
turgeon Bay acture have dee survey gear hat year class possible to sayuration. It doeon smallmout004). Becauspact on smallo date no maj Future surve
ntly occurringains well abover the adversemay be the re
of effort decre
14”
9
County waters
areas are in gcreased sincein 2015 was or a result ofy how strong es appear thatth bass has bese it took sevelmouth likely jor negative imeys will show
g in Green Bayve that of the e impacts of result of predaeased, the las
”
s of Green Ba
good conditione the last asseslow relative t
f the year clasthe year clas
t the 2010 yeaeen a concerneral years for would have n
mpact of rounw if recent yeay and Lake M mid-ninetiesround gobiesation on roundst two year’s l
ay and Lake M
n. However, ssment of thisto age 4 fish iss not being esses since 201ar class was r
n since the firsgobies to rea
not been notend goby on smar classes (sin
Michigan. Alts and the size on smallmoud goby (Cranlevels are still
Michigan, 198
certain indices area in 2009in other surveffectively cap
11 have been brelatively strost round gobyach high leveled in the adultmallmouth bance 2011) arethough fish sicomposition
uth bass populne et. al., 2016l around the a
86-2015.
es such as 9. ey years. ptured by because
ong. The y record in ls of t ass are impacted
ize at age is still lations, the 6). average

10
angler catch per effort of 0.69 smallmouths per hour since 1990 when the strong smallmouth fishery began. With changes in growth, populations can endure some density-dependent fluctuations in abundance due to a high level of competition between year classes. Furthermore, population abundance cycling is common for fishery populations and recent levels could be reflective of smallmouth bass populations naturally declining from very high levels. We will continue to monitor both the population abundance and the angler catch statistics.
Fyke net catch per unit effort (CPE) can be a general indication of relative abundance when the sampling locations and times are consistent. The overall CPE for Little Sturgeon/Sawyer Harbor combined in 2015 was 13.6 smallmouths per net night, down from 19.4 smallmouths per net night in 2009. Although the specific net locations changed somewhat, the general sampling locations were consistent between survey years. For Little Sturgeon, where two of the three nets were fished in the same location between the surveys, the CPE decreased from 25.1 to 11.4 smallmouths per net night. The CPE for Sawyer Harbor increased from 10.7 to 15.7 smallmouths per net night between surveys. However, the Sawyer Harbor nets, although in the same general area, were not fished in consistent locations between surveys. While nets were initially set in original locations, some were moved due to low capture rates. Catch per effort can be somewhat misleading if environmental conditions (e.g. water temperature), sampling dates, and ecological conditions are not somewhat similar between surveys. Sampling dates and water temperatures were relatively consistent between these surveys though fish behavior (as a reflection of other ecological conditions) could be a factor (see further discussion below).
The age composition from the 2015 survey demonstrates well distributed age classes for adult smallmouth bass in their first years of spawning. Even what appears to be a weaker 2011 age class could be a matter of these younger fish are not showing up in typical spawning areas because they may not yet be reproductively mature. Caution should be used when interpreting age composition (and other metrics) in smallmouth bass populations. These levels can be affected by ageing error (potential under-aging using scales), sampling dates, and survey water temperatures. Ageing error when using scales increases beyond around age-6 when compared to otolith ageing techniques in some smallmouth bass populations (Maceina and Sammons, 2006). We assume there is some ageing error associated with using scales to age smallmouth bass; though higher growth rates characteristic of Sturgeon Bay smallmouth populations help alleviate some uncertainties in younger to middle age classes. The netting efforts were similar between the 2009 and 2015 assessments of the Sturgeon Bay area (both began at end of April; 71 net nights of effort in 2009 and 78 net nights of effort in 2015). Mean surface water temperatures were nearly identical between the last two survey years although the variation in 2009 was much greater. Average water temperature during the survey in 2009 was 55.3 F (min/max: 49-67 F; SD: 4.30) while in 2015 the average was 55.4 (min/max: 50-63 F; SD: 2.05). Larger smallmouth bass tend to come into the spawning areas early in the season while the younger/smaller fish are more prominent later in the season. The large decrease in age-4 fish between 2009 and 2015 (three-fold decrease) suggests poor recruitment for the 2011 year class though other factors, as discussed above, may be partially responsible.
The length at age and overall size structure in 2015 are still well above those of a decade ago. Some measures have decreased slightly since the 2009 survey. The decrease in average size at age since 2009 is very small and may be explained by natural variations and cycling within the populations. Furthermore, there is considerable overlap in deviations around the average size at age between years. However, there does appear to be a change in the overall size structure since 2009. The difference in RSD-18 values between the surveys supports this though those levels may be influenced by shifts in the number of small fish in the population. However, the number of fish ≥ 18” captured per net night dropped from 4.8 to 2.5 between 2009 and 2015. On average smallmouth are reaching the 14” size limit within 5 years vs 6 years in earlier surveys. Interestingly, increasing growth rates could reduce the effectiveness of the 14” size limit, implemented in 1998. The goal of the 14” size limit was to protect fish through age-5, the age when many female smallmouth are likely reproductively mature (Becker 1983). At the observed larger lengths at age, this size limit may be less effective at protecting fish until they are reproductively mature. Our data indicate that the average length of an age-5 fish in 2009 was 14.9 inches and in 2015 was 14.3 inches; while in 1994/1995 and 2004 a fish of this age measured 12.1 and 13.4 inches, respectively. Therefore, as of 2009 the 14” minimum size limit may have no longer been as effective in allowing at least one spawning event before being susceptible to harvest. However, that is based upon the assumption that age at maturity is static. If bass are growing fast enough to mature at an earlier age, then the size limit may still afford these fish some protection prior to spawning. In fact, there is some historical reference to fast growing females maturing at age-4 in parts of Lake

11
Michigan (Becker 1983). The abundance of larger fish, recently strong recruitment, and relatively low harvest in these populations suggests, however, that this overharvest at a young age is not occurring.
Observations of higher percentages of lesions on smallmouth bass have occurred in two episodes 2008-2009 and 2015. During these periods, fish with healed or partially-healed wounds have been observed; suggesting fish can recover from these lesions. The main hypothesis in 2009 was that the lesions were the result of secondary infections due to VHS-compromised immune systems that allowed other bacteria to proliferate in the fishes’ systems. (In 2009 a limited number of disease tests were run so the actual disease agent could have been overlooked.) However, in 2015 none of the fish tested were VHS positive. Of the diseases tested for, Columnaris seemed the most likely culprit given isolation of the bacteria and lesions that were consistent with this disease. Columnaris outbreaks are common in the spring when water temperatures increase above 60° F and other stressors are present (e.g., spawning, poor water quality, co-viral infection). Though Columnaris lesions can be upsetting to the general public, this disease is naturally-occurring and not known to cause significant long-term consequences for fish populations even when a die-off occurs. Observations of fish with lesions in Green Bay waters have been recorded with water temperatures well below the 60° F threshold, adding some uncertainty to identifying the disease agent responsible. To our knowledge, no large scale epizootic event occurred since these lesions appeared in the fishery. There were no observations of a high level of affected fish in the 2012 Rowley Bay survey on the Lake Michigan side of Door County nor were there a substantial number of reports from anglers or creel technicians during the years between outbreaks.
Sport catch and harvest for smallmouth bass in Door County waters of Green Bay have shown some interesting trends over time. After reaching record levels during the mid-late 1990s catch rates dropped between 2003 and 2004 and remained at moderate levels for seven years. Catch rates after 2010 began to rise and although they were not among the highest, given the increase in size at age and composition, the “quality” of the fish caught in recent years was likely greater than during the record catch years. Over the last two years catch rates have dropped though still are around the long term average. The 2015 catch rate of 0.64 fish caught per hour fished approximates the recent 10 year average of 0.63 fish caught per hour fished. Possible explanations for these trends include high recruitment and changes to the Green Bay ecology including changes due to invasive species (Hansen and Kroeff, 2014). Harvest numbers for smallmouth bass are often tied to changes in minimum size limits. The large reduction in harvest between 2004 and 2005 does not mirror the trend for catch rates which decreased a year earlier. However, an artifact of our creel survey design is that if only a small number of anglers are actually interviewed, then one or two interviews can have a strong effect on the results. This may explain why the drop in harvest was not apparent immediately. Increased catch rates in recent years have not resulted in an increase in harvest numbers. This may be a reflection of increased “catch-and-release” fishing by bass anglers. Fishing effort for smallmouth bass has risen over the last four years. Between 2011 and 2015 effort had more than doubled on Green Bay and was nearly five times as high on Lake Michigan waters of Door County. This large jump in effort may be explained by the current high quality of the smallmouth bass fishery. The increase has also been facilitated by national promotion of the Green Bay smallmouth bass fishery, ranking it among the best places to fish in the U.S. The installation of a public boat launch on Rowley Bay (Lake Michigan side) recently improved access to that area considerably.
The change in water levels between the 2009 and 2015 surveys may also be a potential factor affecting abundance and catch composition. The mean Lake Michigan water level was 9” higher in May, 2015 than it was in May, 2009. This difference in water levels for nearshore species such as smallmouth bass has the potential to concentrate both adult and juvenile smallmouth in areas of limited quality habitat during low water years and better distribute fish across more quality habitat during higher water years. This phenomenon may have made it appear that there were more fish in 2009 when they were just more concentrated. Higher water levels will provide better spawning conditions with additional spawning substrate and nursery habitat available for young of year bass in flooded emergent vegetation (e.g., bulrush). Although there was an overall rise in water level between these survey years, there was a substantial drop between 2009 and 2013. So, in contrast to the additional habitat available in 2015, the loss of habitat (from lower water around 2013) may have affected recruitment success during low water years and could also explain the decrease in catch rates over the 6 year period between surveys.
12
Summary and future outlook
The smallmouth bass population in 2015 in the Sturgeon Bay/Little Sturgeon Bay area is in good condition. Although age-4 fish do not seem to be in great abundance, ages 5-8 are well represented in the fishery. Sport catch remains relatively high and fish size at age is considerably higher than a decade ago.
Recent increases in Lake Michigan water levels have alleviated some of the fishery concerns associated with low water levels discussed recently (Hansen and Kroeff, 2014) such as impacts from loss of nearshore habitat and increased dredging activity. We have increased our smallmouth bass sampling to include a survey of Washington Island in 2014 and North Bay in 2016 (reports pending). However, the areas in Northern Door County between Egg Harbor and Sister Bay have not been sampled, as these sites are difficult to effectively sample. Some funding has recently been obtained to examine potential differences in genetic composition between the populations of smallmouth bass in various areas of Green Bay and Lake Michigan. Tissues for genetic testing have been collected opportunistically over the last several years during population assessments and further samples will be collected in 2017.
There are some management needs and concerns that should be addressed to ensure future robust smallmouth bass populations in Door County waters of Green Bay and Lake Michigan. Invasive species remain a threat to smallmouth bass and other fish species. Although we are cautiously optimistic that the impact of round gobies on smallmouth bass recruitment may not be as extensive as once feared, given the short time period that gobies have been a part of the Green Bay and Lake Michigan ecology it would be prudent to continue consistent monitoring of the populations. A more effective means of examining round goby impacts would be to annually assess recruitment of young-of-year smallmouth bass including nest success evaluations. We have conducted a limited amount of recruitment and nesting success assessments historically. Limited resources have precluded further development of these index surveys. The potential population-level impacts of the movement of large numbers of smallmouth relocated from their “home range” via catch-hold-release fishing tournaments in this area remains a concern. A related research priority is to evaluate the movement patterns for smallmouth bass populations in Door County waters of Green Bay including homing tendencies. Past surveys have indicated smallmouth generally do not move extensively and tend to have a “home range” (Wiegert 1966; Kroeff 1993, Hansen and Kroeff 2014). The latest technological advances in acoustic telemetry may help to answer whether fish remain in their newly relocated areas, and to what extent; as well as whether fish that are in their assumed home range remain in this area. Acoustic telemetry has the potential to answer a variety of life history questions. External funding would need to be obtained as movement studies can be costly and difficult to support within current operational budgets.
References
Becker, G. C. 1983. Fishes of Wisconsin. The University of Wisconsin Press. Madison, Wisconsin.
Crane, D. and D. Einhouse. 2016. Changes in growth and diet of smallmouth bass following invasion of Lake Erie by the round goby. Journal of Great Lakes Research. 42:405-412.
Gabelhouse, D.W. , Jr. 1984. A length-categorization system to assess fish stocks. North American Journal of Fisheries Management 4:371-384. Hansen, S. and T. Kroeff. 2014. Smallmouth Bass in Door County: 2009/2012 Population Assessments and Sport Fishery. Wisconsin Department of Natural Resources Fisheries Management Report. Sturgeon Bay, Wisconsin. 16 pp.
Kroeff, T. 1992. Tagging, Recapture, Growth, and Age Composition of Sport Caught Bass from the Sturgeon Bay/Door County Area. Wisconsin Department of Natural Resources Fisheries Management Report. Sturgeon Bay, Wisconsin. 14 pp.
Kroeff, T. 1993. A Summary of Recapture Data from Fish Tagged at the 1993 Sturgeon Bay Open Bass

13
Tournament with Additional Age Information. Wisconsin Department of Natural Resources Fisheries Management Report. Sturgeon Bay, Wisconsin. 8pp.
Kroeff, T. and M. Toneys. 2004. Summary of Smallmouth Bass Assessments in Selected Areas of Door County 2004. Wisconsin Department of Natural Resources Fisheries Management Report. Sturgeon Bay, Wisconsin. 5 pp.
Maceina, M.J., Sammons, S.M., 2006. An evaluation of different structures to age freshwater fish from a northeastern US river. Fish. Manag. Ecol. 13, 237–242. Masterson, C. and B. Eggold. 2013. Wisconsin’s Open Water Sportfishing Harvest and Effort from Lake Michigan and Green Bay. Wisconsin Department of Natural Resources Fisheries Management Report. Milwaukee, Wisconsin. 12 pp. http://dnr.wi.gov/topic/fishing/Documents/LakeMichigan/LakeMichiganSportHarvestReport2012.pdf
Steinhart, G.B., E.A. Marschall, and R. Stein. 2004. Round goby predation on smallmouth bass offspring in nests during simulated catch-and-release angling. Trans. Am. Fish. Soc. 133(1): 121-131.
Wiegert, L. 1966. A Four-year Study of the Smallmouth Bass in the Outlying Waters of Door County. Wisconsin Conservation Department Division of Fish Management Report No. 1, 11pp.
For further information or questions, please contact:
Scott Hansen 920-746-2864 Scott. [email protected]