Smaller Footprint Drilling System for Deep and Hard Rock .../67531/metadc891466/m2/1/high... ·...
37
Smaller Footprint Drilling System for Deep and Hard Rock Environments; Feasibility of Ultra-High-Speed Diamond Drilling Phase I Final Report Reporting Period Start Date – 1 September 2005 Reporting Period End Date – 30 June 2006 Authors: Arnis Judzis, TerraTek Homer Robertson, TerraTek Alan Black, TerraTek Report Date – January 2007 DOE Award Number – DE-FC26-03NT15401 TerraTek, a Schlumberger Company 1935 Fremont Dr. Salt Lake City, UT 84104
Transcript of Smaller Footprint Drilling System for Deep and Hard Rock .../67531/metadc891466/m2/1/high... ·...

Smaller Footprint Drilling System for Deep and Hard Rock Environments;
Feasibility of Ultra-High-Speed Diamond Drilling
Phase I Final Report
Reporting Period Start Date – 1 September 2005
Reporting Period End Date – 30 June 2006
Authors: Arnis Judzis, TerraTek
Homer Robertson, TerraTek Alan Black, TerraTek
Report Date – January 2007
DOE Award Number – DE-FC26-03NT15401
TerraTek, a Schlumberger Company 1935 Fremont Dr.
Salt Lake City, UT 84104

Feasibility of Ultra-High Speed Diamond Drilling DE-FC26-03NT15401
ii
DISCLAIMER This report was prepared an as account of work sponsored by an agency of the United States Government. Neither the United States Government nor any agency thereof, nor any of their employees, makes any warranty, express or implied, or assumes any legal liability or responsibility for the accuracy, completeness, or usefulness of any information, apparatus, product, or process disclosed, or represents that its use would not infringe privately owned rights. Reference herein to any specific commercial product, process, or service by trade name, trademark, manufacturer, or otherwise does not necessarily constitute or imply its endorsement, recommendation, or favoring by the United States Government or any agency thereof. The views and opinions of authors expressed herein do not necessarily state or reflect those of the United States Government or any agency thereof.

Feasibility of Ultra-High Speed Diamond Drilling DE-FC26-03NT15401
iii
ABSTRACT The two phase program addresses long-term developments in deep well and hard rock drilling. TerraTek believes that significant improvements in drilling deep hard rock will be obtained by applying ultra-high rotational speeds (greater than 10,000 rpm). The work includes a feasibility of concept research effort aimed at development that will ultimately result in the ability to reliably drill “faster and deeper” possibly with smaller, more mobile rigs. The principle focus is on demonstration testing of diamond bits rotating at speeds in excess of 10,000 rpm to achieve high rate of penetration (ROP) rock cutting with substantially lower inputs of energy and loads.
The significance of the “ultra-high rotary speed drilling system” is the ability to drill into rock at very low weights on bit and possibly lower energy levels. The drilling and coring industry today does not practice this technology. The highest rotary speed systems in oil field and mining drilling and coring today run less than 10,000 rpm—usually well below 5,000 rpm.
This document details the progress at the end of Phase 1 on the program entitled “Smaller Footprint Drilling System for Deep and Hard Rock Environments: Feasibility of Ultra-High-Speed Diamond Drilling” for the period starting 1 March 2006 and concluding 30 June 2006. (Note: Results from 1 September 2005 through 28 February 2006 were included in the previous report (see Judzis, Black, and Robertson). Summarizing the accomplished during Phase 1:
• TerraTek reviewed applicable literature and documentation and convened a project kick-off meeting with Industry Advisors in attendance (see Black and Judzis).
• TerraTek designed and planned Phase I bench scale experiments (See Black and Judzis). Some difficulties continued in obtaining ultra-high speed motors. Improvements were made to the loading mechanism and the rotational speed monitoring instrumentation. New drill bit designs were developed to provided a more consistent product with consistent performance. A test matrix for the final core bit testing program was completed.
• TerraTek concluded Task 3 “Small-scale cutting performance tests.”
o Significant testing was performed on nine different rocks.
o Five rocks were used for the final testing. The final tests were based on statistical design of experiments.
o Two full-faced bits, a small diameter and a large diameter, were run in Berea sandstone.
• Analysis of data was completed and indicates that there is decreased specific energy as the rotational speed increases (Task 4). Data analysis from early trials was used to direct the efforts of the final testing for Phase I (Task 5).
• Technology transfer (Task 6) was accomplished with technical presentations to the industry (see Judzis, Boucher, McCammon, and Black).

Feasibility of Ultra-High Speed Diamond Drilling DE-FC26-03NT15401
iv

Feasibility of Ultra-High Speed Diamond Drilling DE-FC26-03NT15401
v
TABLE OF CONTENTS
ABSTRACT................................................................................................................................... iii
EXECUTIVE SUMMARY .............................................................................................................1
INTRODUCTION ...........................................................................................................................2
TASK ACCOMPLISHMENTS.......................................................................................................2
METHODS, ASSUMPTIONS, and PROCEDURES......................................................................3
Theory ..................................................................................................................................... 3
Test Apparatus ........................................................................................................................ 4
Statistical Design of Experiments........................................................................................... 5
Test Procedure ........................................................................................................................ 6
Data Reduction and Statistics ................................................................................................. 6
RESULTS AND DISCUSSION......................................................................................................7
Results of the Core Bit Trials.................................................................................................. 7
Results of the Full-faced Bit Trials......................................................................................... 8
CONCLUSIONS AND RECOMMENDATION ............................................................................8
REFERENCES ................................................................................................................................9
FIGURES.........................................................................................................................................9
APPENDIX A. TABLES OF DRILLING PARAMETERS AND RESULTS ............................18
APPENDIX B. GRAPHS OF CORE BIT RESULTS..................................................................23

Feasibility of Ultra-High Speed Diamond Drilling DE-FC26-03NT15401
vi
List of Figures Figure 1. Core drilling bits used for the high speed drilling tests...................................................9
Figure 2. Photograph of the high speed drilling test setup. ..........................................................10
Figure 3. Two factor central composite design used in designing tests........................................10
Figure 4. Specific Energy data plot for Berea Sandstone. ............................................................11
Figure 5. Specific Energy results in a response surface plot for Berea sandstone trials...............11
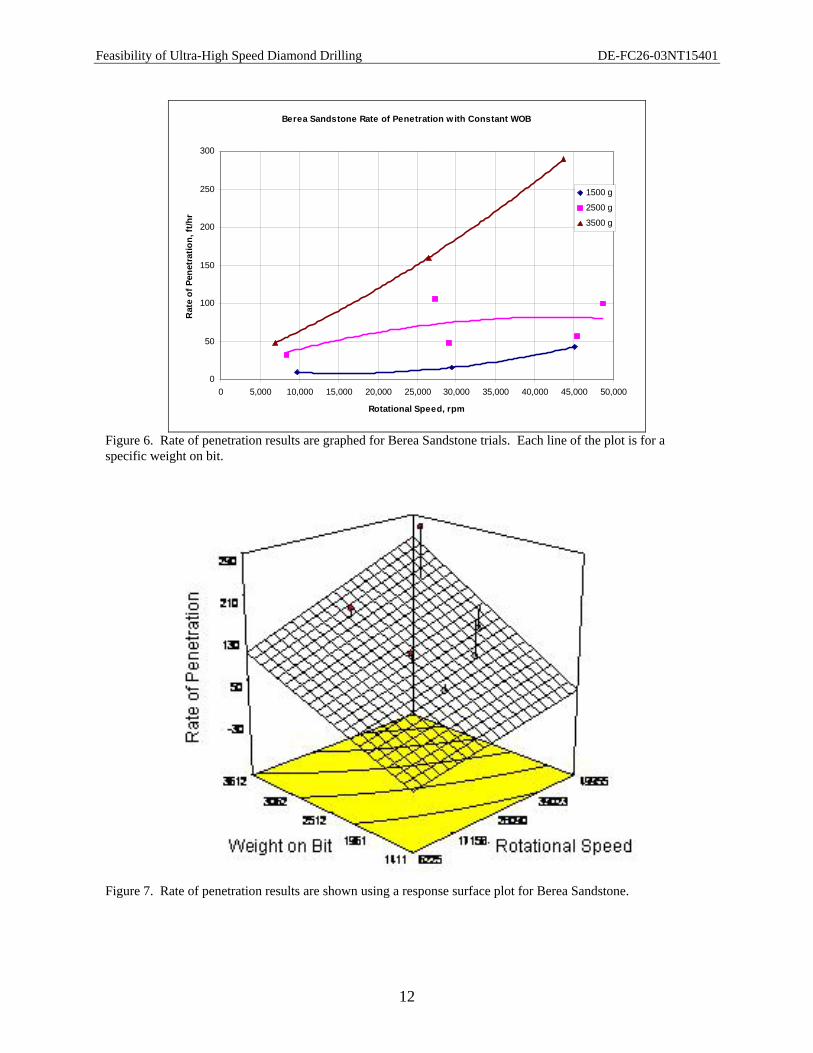
Figure 6. Rate of penetration results are graphed for Berea Sandstone trials...............................12
Figure 7. Rate of penetration results are shown using a response surface plot for Berea Sandstone. ......................................................................................................................................12
Figure 8. Small and large full-faced drill bits used in the UHSDD..............................................13
Figure 9. Rate of Penetration data plot for the large full-faced drill bit. ......................................13
Figure 10. Response surface plot of the rate of penetration data when using the large full-faced drill bit............................................................................................................................................14
Figure 11. Large full-faced bit specific energy plots with the weight on bit held constant..........14
Figure 12. Specific energy response surface plot of data from the large full-faced bit. ...............15
Figure 13. Small full-faced bit rate of penetration results are shown with the weight on bit held constant. .........................................................................................................................................15
Figure 14. Response surface plot of the rate of penetration data from the small full-faced drill bit. ..................................................................................................................................................16
Figure 15. Specific energy plot of data from the small full-faced drill bit. ..................................16
Figure 16. Response surface plot of the specific energy from the small full-faced drill bit data. 17

Feasibility of Ultra-High Speed Diamond Drilling DE-FC26-03NT15401
1
EXECUTIVE SUMMARY
Background The “Smaller Footprint Drilling System for Deep and Hard Rock Environments; Feasibility of Ultra-High-Speed Diamond Drilling” (UHSDD) Phase 1 tests have been conducted to explore trends in penetration rates and specific energy at various rotational speeds and bit loads and investigate any evidence of changes in rock removal mechanisms at varying speeds and loads.
Accomplishments Significant accomplishments during Phase 1 of the UHSDD are listed below. Details of earlier accomplishments were reported during the regular reporting periods (see Black and Judzis and Judzis, Black, and Robertson).
• TerraTek reviewed applicable literature and documentation and convened a project kick-off meeting with Industry Advisors in attendance.
• TerraTek has designed and planned Phase I bench scale experiments. Some difficulties in obtaining ultra-high speed motors for this feasibility work were encountered.
• Some improvements over early NASA experiments were identified.
• Six preliminary drilling tests were run in Berea sandstone at various rotational speeds using nitrogen as a drilling fluid.
• Tests were conducted in Berea and Colton sandstones at various rotational speeds to determining the best drilling fluid (nitrogen or water) and flow rate. Water was selected for the drilling fluid and the optimum flow rate of 0.55 gal/min determined.
• Design improvements were made in the loading mechanism and the sensor for monitoring rotational speed.
• Methods of statistical design of experiments were introduced to provide direction in determine the sequence for bit loading, rotational speed and rock tested for the final series of tests.
• Once all operational and sensor issues were resolved, testing continued with more than 80 tests using Berea sandstone, Colton sandstone, Nugget sandstone, Sulurian dolomite, and Winfield anhydrite. These tests were run with a core type bit at various rotational speeds and bit loads using water as a drilling fluid.
• A paper titled “Investigation of Smaller Footprint Drilling System; Ultra-High Rotary Speed Diamond Drilling Has Potential for Reduced Energy Requirements,” authored by Arnis Judzis, et al. (see Judzis, Boucher, McCammon, and Black), was prepared and presented at the IADC/SPE Drilling Conference in February 2006. This paper outlined accomplishments to date on the Ultra-High Speed Diamond Drilling project.
• More than 20 tests were run with full-faced drilling bits using various loads and rotational speeds.

Feasibility of Ultra-High Speed Diamond Drilling DE-FC26-03NT15401
2
• Statistical analysis of the data revealed a general trend to more efficient drilling as rotational speeds increased above approximately 30,000 rpm.
• Preliminary engineering and assessment of high speed motors was begun. Contact was made with four parties regarding high speed motors for Phase 2 testing.
INTRODUCTION
Objective The objective of the first phase of this test program was to explore trends in specific energy and penetration rates with high rotation speed.
Scope The two phase program addresses long-term developments in deep well and hard rock drilling. TerraTek believes that significant improvements in drilling deep hard rock will be obtained by applying ultra-high rotational speeds (greater than 10,000 rpm). The work includes a feasibility of concept research effort aimed at development that will ultimately result in the ability to drill ‘faster and deeper’ with smaller, more mobile rigs. The principle focus is on demonstration testing of diamond bits rotating at speeds in excess of 10,000 rpm to achieve high ROP rock cutting with substantially lower energy and load.
This document details the progress during the last stages of Phase 1 and analytical results of Phase 1 of the UHSDD program.
Plan The plan of Phase 1 of the program was to develop equipment necessary (on a small scale) to test the high rotational speed drilling concept to determine if less specific energy is required to drill at higher rotational speeds. The test apparatus and instrumentation were developed, testing was conducted, and analysis of results concluded. With the concept proven, Phase 2 work will provide a “scale up” to ultra high speed drilling in mining-sized drill bits.
Industry Partners Contributions in technical expertise and research have come from ReedHycalog, Shell International, and ConocoPhillips. Additionally, Impact Technologies, Technology International, and Smith International plan on supporting Phase 2 testing.
TASK ACCOMPLISHMENTS The following is a summary of the accomplishments for each of the Phase I tasks.
Task 1.0 – Assessment of deep and hard rock drilling environments requiring novel technologies and tools. This work was completed and reported previously (see Black and Judzis and Judzis, Black, and Robertson).
Task 2.0 – Design, engineer, and plan ultra-high speed drilling program concepts. This task was addressed in the previous report. However, some improvements have been made to improve the test operation data collection and quality. Drill bits were redesigned and methods of

Feasibility of Ultra-High Speed Diamond Drilling DE-FC26-03NT15401
3
manufacture developed to produce a consistent core bit configuration during this reporting period.
Task 3.0 – Small-scale cutting performance tests. Extensive tests were run with various rock, bits, fluids, and loads. Testing was extended to full-faced drill bits that were run in Berea sandstone. The data has been summarized and is presented in table form in Appendix A.
Task 4.0 – Analysis of data and concept evaluation. Data analysis was performed after each series of tests to evaluate the trends in rate of penetration and specific energy for each rock. Design and analysis were improved by using statistical design and analytical techniques.
Task 5.0 – Engineering design. Preliminary engineering for the demonstration of the ultra-high speed drilling concept at mining bit size has been conducted. Four companies have been contacted regarding high speed motors.
Task 6.0 – Transfer of technology. A paper titled “Investigation of Smaller Footprint Drilling System; Ultra-High Rotary Speed Diamond Drilling Has Potential for Reduced Energy Requirements,” (see Judzis) authored by Arnis Judzis, et al., was prepared and presented at the IADC/SPE Drilling Conference held in Miami, Florida on 23 February 2006. This paper outlined accomplishments to date on the Ultra-High Speed Diamond Drilling project. Arnis Judzis gave a presentation on test findings and potential for ultra high speed drilling at the Petroleum Technology Transfer Council’s (PTTC) Microhole Integration Meeting in Houston, TX on 22 March 2006. The DOE/NETL and industry partners A met on 19 June 2006 for a Phase 1 lessons learned presentation and discussion of test findings.
All Phase 1 tasks have been completed. Accomplishments since the March 2006 report include:
1. Statistical design of experiment was completed for the final trials.
2. The motor support housing was modified to improve cooling and motor support.
3. New test bits were obtained.
4. Full-face drill bits were acquired.
5. Bit wear was evaluated.
6. A thorough statistical analysis of all data was completed and findings determined.
7. The preliminary engineering was completed for equipment scale up.
8. A “lesson’s learned” meeting was held.
An additional task was defined during the test program: to determine the mechanism of rock failure when drilling at ultra high speeds. Cuttings analysis was deemed to be an important tool in this investigation. However, the equipment configuration did not allow collection of representative cuttings samples and analysis could not be conducted.
METHODS, ASSUMPTIONS, and PROCEDURES
Theory Specific Energy refers to the amount of energy required to remove a volume of rock while drilling. The total specific energy for rotary drilling is the sum of the rotational component and axial components (Equation 1). The rotational specific energy was calculated using the voltage

Feasibility of Ultra-High Speed Diamond Drilling DE-FC26-03NT15401
4
across the motor, the current used by the motor, the ROP, and the area of rock removed (Equation 2). The axial component was determined using the weight on bit and the area of the rock removed (Equation 3). Reported units for specific energy are ft-lb/in3.
AxRotTot SESESE += (1)
)()(726.1
22io
Rot DDROPVISE−
= (2)
22
00043.0
ioAx DD
WOBSE−
= (3)
Where:
Di = inside diameter, inches D0 = outside diameter, inches
I = current, amperes SETot = total specific energy, ft-lbs/in3
SERot = rotational specific energy, ft-lbs/in3 SEAx = axial specific energy, ft-lbs/in3
ROP = rate of penetration, inches/sec V = voltage, volts
WOB = weight on bit, g
For applications of high rotary speeds and low weight on bit, the rotational component is significantly greater than the axial component.
Test Apparatus Rock Samples. Initially, samples of nine different lithologies were tested. Five of the rock types were used for the final testing and analysis. They included: Berea sandstone, Colton sandstone, Nugget sandstone, Sulurain dolomite, and Winfield anhydrite. Berea sandstone was used as a baseline rock and repeat tests in Berea sandstone were run to detect any performance changes due to bit wear. The rock types used in this study and their properties are listed in Table 1. Rock samples 3” x 5” x 1.5” were prepared by first cutting the rocks such that the bedding planes ran parallel to the largest face, the face where the rocks were to be drilled. Ten holes, 3/16 inch in diameter, were drilled through each rock (two rows of five holes) for the introduction of fluid to assist in cooling and cleaning the bits. The back of the samples were counter bored and fittings attached with adhesive.
The rocks used for the final, statistically designed trials, included Berea sandstone, Colton sandstone, Nugget sandstone, Sulurain dolomite, and Winfield anhydrite.
Coring Bits and Drive Motor. Diamond coring bits (Figure 1), nominally 0.82” outside diameter x 0.51” inside diameter x 0.5” drilling length with a kerf area of about 0.324 in2, were sized to allow drilling with a commercially available “Hall Effect” ultra-high speed motor. Natural diamonds (20/25 mesh) were applied to the core bit head using an electrolysis coating

Feasibility of Ultra-High Speed Diamond Drilling DE-FC26-03NT15401
5
technique. The early bits used in these tests typically had about 60 diamonds on the cutting kerf. Of these 60 diamonds, only a small number were in contact with the formation due to variability in diamond height. Bit designs used for the final series of core tests had about 25 diamonds on the cutting surface. The diamond spacing was more controlled to improve drilling performance. The bits were dynamically balanced at about 6,000 rpm.
The Hall Effect drive motor is no load rated for 51,000 rpm. The drill bit is mounted directly to the motor shaft.
Drilling Apparatus and Instrumentation Setup. The rock samples were clamped to a low friction table. A steel cable was attached to the front of the table, passed over a pulley, and then attached to a hanging rod of known mass. The rod was restricted only to axial translation by Thompson bearings. The motor and bit were rigidly mounted such that the weight pulled the table and rock sample into the stationary bit during drilling. Pins were set up as stops to control the travel of the table and sample to 0.375” distance. Figure 2 is a photograph of the test apparatus setup.
Displacement was measured by means of a linear variable displacement transducer (LVDT) mounted to the table and the frame of the apparatus. An optical tachometer measured revolutions of the bit by recording the number of times a black strip on a white background painted on the bit passed the sensor. The setup included the sample, fluid lines, and instruments. Measurements of the current and voltage supplied to the motor were taken.
Test Parameters. The test parameters used in the final round of testing (DOEH103 through DOEH217 included:
• Rotational speeds (at the start of each test) were 10,000 rpm, 30,000 rpm, and 50,000 rpm (40,000 rpm maximum for the larger full-faced drill bit).
• The weight on bit was 1500, 2500, and 3500 grams for the final statistically designed trials.
Statistical Design of Experiments Beginning with test DOEH103, a two factor central composite statistical design was used to select the parameters to be used in each test as illustrated in Figure 3. Typically, ten trials were
Table 1. Properties of the rock used for Ultra-High Speed Diamond Drilling tests.
Rock Type Compressive Strength,
Unconfined (psi) Porosity
(%) Bulk Density
(g/cm3) Berea Sandstone 8,600 20.0 2.230 Castlegate Sandstone 1,500 25.0 1.970 Colton Sandstone 7,600 10.9 2.380 Nugget Sandstone 18,500 9.7 2.393 Austin Chalk 2,000 29.0 1.960 Leuders Limestone 7,000 18.9 2.190 Sulurain Dolomite 8,150 20.9 2.864 Winfield Anhydrite 6,200 1.1 2.925 Burlington Limestone 16,000 1.4 2.650

Feasibility of Ultra-High Speed Diamond Drilling DE-FC26-03NT15401
6
run on each rock type with all combinations of weight on bit and rotational speed factors tested and a replicate run at the mid setting of each factor. The sequence of factor combinations was selected randomly.
Test Procedure The motor was initially brought up to the nominal rotary speed with the rock sample very near but not in contact with the bit. The low friction table was then released allowing the sample to be forced into the bit at a constant weight on bit by means of gravitational forces on the attached mass. Samples of the cuttings were collected during each test for later analysis.
The detailed procedure included the following steps:
1. Measure no load amps to detect pending motor failure. 2. Install bit on motor shaft. 3. Clamp rock sample to table, aligning hole to the bit. 4. Set start pin to space the bit off the rock 0.002 inch. 5. Move bit forward to engage start pin. 6. Attach water line to back of sample making sure that the ball valve is closed and the
needle valve is set. 7. Check the optical tachometer alignment. 8. Place an aluminum tray, to catch cuttings, on the table under the bit. 9. Zero Instruments. 10. Setup x-y-y’ recorder. 11. Open ball valve to start water flow at 0.55 gpm. 12. Rotate drill bit to specified rotational speed. 13. Start the high rate data acquisition. 14. Pull start pin. 15. When stop pin is reached, or if ROP is less than slope line on x-y-y’ (20 ft/hr), or if motor
stalls, lift weight to stop drilling. 16. Bring rotational speed to zero. 17. Stop water flow. 18. Remove cuttings in aluminum tray, label and dry. 19. Label hole drilled and measure inside diameter and outside diameter of the hole. 20. Photograph bit. 21. Examine cuttings under microscope and photograph. 22. Calculate ROP (in/rev), average voltage, average amperage change (subtract initial
amps), rotational speed, pressure, and perform specific energy calculations. 23. Generate plots and add test data and calculated specific energy to a table.
Data Reduction and Statistics After each test the data were plotted and analyzed. Key plots were used to analyze each test, including: penetration and rotational speed versus time and current and voltage versus time. The slope of the penetration curve was examined and areas of steady penetration rate identified. The slope of this line over the steady interval was used to calculate the penetration rate and also average values of rotational speed, current and voltage over the same interval were used in the specific energy calculations. Intervals of steady penetration rates are indicated on the penetration plot. For each test, the dimensions of the annulus cut in the rock were also measured and used in

Feasibility of Ultra-High Speed Diamond Drilling DE-FC26-03NT15401
7
the calculation of specific energy. A summary of performance for tests DOEH103 through DOEH193 is on Table A-1 in Appendix A.
Statistical analysis was conducted on each individual rock type beginning with test DOEH143. Three-dimensional response surface plots were generated for the rate of penetration and specific energy for each type of rock as a function of weight on bit and rotational speed.
RESULTS AND DISCUSSION A summary of all data obtained since the last report are presented in Tables A-1 through A-3 of Appendix A. This includes trials DOEH103 through DOEH217. Graphical presentation of the results of the core bit tests from DOEH143 to DOEH193 and full face bit tests from DOEH194 to DOEH217 are presented. Analysis of core bit trials was limited to DOEH143 through DOEH193 because the test matrix for these trials was statistically designed to enhance the analysis. The full-faced bit trials were also statistically designed, but the complexity was reduced because they were run using only one rock type.
The rock selected for the core bit trials was based upon preliminary work done with the full suite of rock. It was determined to use rock that represented a reasonable range of properties while generally excluding those with issues, such as bit balling, which created significant outliers in their results. Discussion will consider the core bit trails and the full-faced bit trials separately.
As noted previously, the trials used in the final analysis were statistically designed to sequence the tests in a random fashion with weight on bit, rotational speed, rock type, and bit number being model input factors. The responses were rate of penetration and specific energy. An exception to the evaluation of all rock types was made for the Nugget sandstone because of the excessive bit wear observed in previous trials. The Nugget trials were designed and executed in the same statistically relevant manner, but were run after all the other trails were concluded.
Trials with the full-faced bits were conducted with Berea sandstone only. The two sizes of bits were run independently.
To determine the effects of bit wear on the results, control trials were run in a single block of Berea sandstone. These trials were run at 1500 g WOB and 10,000 rpm rotational speed. Plots were made of the specific energy and rate of penetration as a function of trial number to develop equations to eliminate the effects of bit wear on the results.
The rate of penetration and specific energy results of the trials with each rock type were graphed with the weight on bit held constant. These graphs provided general trends of the effect of rotational speed. Examples of these trends in Berea sandstone using core bits are provided in Figures 4 and 6. Similar plots for other rock types are found in Appendix B.
Statistical design and analysis was accomplished using software for that purpose. The results of this analysis are provided in response surface plots for each rock type. The Berea sandstone plots are provided in Figures 5 and 7 and the surface plots for the other rock types are in Appendix B.
Results of the Core Bit Trials Though the general trends in specific energy and ROP were consistent with the expectations, both of these values are somewhat unstable from test to test. Inconsistencies in strength and composition within a single rock sample account for some of the ROP variation observed. Also,

Feasibility of Ultra-High Speed Diamond Drilling DE-FC26-03NT15401
8
the placement of diamonds on each bit and the number of diamonds on each bit varies from bit to bit. Additionally, bit wear is a factor in the performance. Special drill bits were designed for the final trails which had a uniform configuration and distribution of diamond cutters (see Figure 1). The final tests were designed to monitor the reduction in performance due to wear and where appropriate, adjustments were made to account for the observed wear.
Figures 4 through 7 provide examples of the specific energy and rate of penetration as the weight on bit and rotational speeds varied. It will be noted that the performance at low weight on bit was very erratic for most of the rocks. A line graph and surface plot of the specific energy with varying rotational speed and weight on bit for Berea sandstone are given in Figures 4 and 5. Figures 6 and 7 provide the same graphics for rate of penetration in Berea sandstone. This analysis considered all five rock types together. As expected, ROP generally increased with higher rotational speed. As a general trend, specific energy decreased with increasing rotational speed once higher rotational speeds were reached. The ROP trend is consistent with existing theory and the trend in specific energy, while a departure from existing theory is consistent with the expectations of this testing program. Plots of the results of the trials of the other four rock types are in Appendix B.
Results of the Full-faced Bit Trials Two sizes of full-faced bits (Figure 8) were run to determine the trends in specific energy and rate of penetration. The smaller full-faced bit, configured to have the same contact area as the core bits, was run with the same set of parameters as the core bits. The larger full-faced bit had a diameter similar to the core bits. Because of the mass of the larger full-faced bit, the motor was run at a maximum rotational speed of 40,000 rpm. Vibrations prevented the large full-faced bit from being run at 1500 g weight on bit and 40,000 rpm. A summary of the full-faced trials and the calculated values for specific energy and rate of penetration are included in Table A-2 of Appendix A. The diameter of the bore through the rock is listed on the table (refer to Rock Samples section in Test Apparatus). The “Rock Bore Diameter” measurement was used in calculating the rock removed during drilling.
The results of the analysis of the full-faced bits are presented in graphical format in Figures 9 through 16. There was a general increase in rate of penetration with the larger bit to approximately 25,000 rpm and then a decrease (see Figures 9 and 10). This is contrary to what was experienced with the core bits, where there was a general trend toward higher rate of penetration with increasing weight on bit and rotational speed. Figures 11 and 12 show a decrease in specific energy with increased rotational speed at the low to middle weights on bit. At higher weights on bit, the trend was similar to the core bits; however, the curve of the specific energy was more favorable with the full-faced bit. At 3500 g weight on bit, the specific energy began to decline at around 20,000 rpm.
The rate of penetration trend for the small full-faced core bit was generally increasing with rotational speed. This is illustrated in Figures 13 and 14. The specific energy was somewhat steady at 2500 g weight on bit and declined at 25,000 rpm with 3500 g weight on bit (see Figures 15 and 16).
CONCLUSIONS AND RECOMMENDATION The results of test analysis for Phase 1 of UHSDD program for the coring bits indicate that after reaching a certain rotational speed level, the specific energy decreases with increased rotational

Feasibility of Ultra-High Speed Diamond Drilling DE-FC26-03NT15401
9
speed. The rate of penetration increases with increased rotational speed and weight on bit. When drilling with full-faced bits, the data indicate that there may be some speed/weight combination that is optimum. The rate of penetration declined at higher weights while the specific energy showed significant decline with the larger bit and was flat with the smaller.
It is recommended that testing continue with the Phase 2 scale up to mining sized bits. This will provide additional data to confirm the study findings to date and will provide, with proper design for cuttings collection, an opportunity to evaluate rock failure mechanisms at high rotational speeds.
REFERENCES Judzis, Arnis, Black, Alan, Robertson, Homer, “Smaller Footprint Drilling System for Deep and Hard Rock Environments; Feasibility of Ultra-High Speed Diamond Drilling,” March 2006, Technical Progress Report for the Department of Energy, DOE Award Number: DE-FC26-03NT15401.
Black, Alan, Judzis, Arnis, “Smaller Footprint Drilling System for Deep and Hard Rock Environments; Feasibility of Ultra-High Speed Diamond Drilling,” October 2004, Technical Progress Report for the Department of Energy, DOE Award Number: DE-FC26-03NT15401.
Judzis, Arnis, Boucher, Marcel, McCammon, Jason, Black, Alan, 2006, “Investigation of Smaller Footprint Drilling System; Ultra-High Rotary Speed Diamond Drilling has Potential for Reduced Energy Requirements,” IADC/SPE 99020, presented at the IADC/SPE Drilling Conference, Miami, Florida, U.S.A., 21-23 February 2006.
FIGURES
Figure 1. Core drilling bits used for the high speed drilling tests. The one on the left was used earlier in the program and the one on the right was designed for consistency of diamond placement. Two of these bits were used in the final statistically designed and analyzed trials.

Feasibility of Ultra-High Speed Diamond Drilling DE-FC26-03NT15401
10
ROCK CLAMP
ROCK
MOTOR HOUSING
LVDT
BIT
TACHOMETER SENSOR
Figure 2. Photograph of the high speed drilling test setup.
Figure 3. Two factor central composite design used in designing tests. Factor A was typically rotational speed and Factor B the weight on bit.

Feasibility of Ultra-High Speed Diamond Drilling DE-FC26-03NT15401
11
Berea Sandstone Specific Energy with Constant WOB
0
500
1000
1500
2000
2500
3000
3500
4000
4500
0 5,000 10,000 15,000 20,000 25,000 30,000 35,000 40,000 45,000 50,000
Rotational Speed, rpm
Spec
ific
Ener
gy, f
t-lb
/in3
1500 g
2500 g
3500 g
Figure 4. Specific Energy data plot for Berea Sandstone. Each line of the plot represents a specific weight on bit.
Figure 5. Specific Energy results in a response surface plot for Berea sandstone trials.
Feasibility of Ultra-High Speed Diamond Drilling DE-FC26-03NT15401
12
Berea Sandstone Rate of Penetration w ith Constant WOB
0
50
100
150
200
250
300
0 5,000 10,000 15,000 20,000 25,000 30,000 35,000 40,000 45,000 50,000
Rotational Speed, rpm
Rat
e of
Pen
etra
tion,
ft/h
r1500 g
2500 g
3500 g
Figure 6. Rate of penetration results are graphed for Berea Sandstone trials. Each line of the plot is for a specific weight on bit.
Figure 7. Rate of penetration results are shown using a response surface plot for Berea Sandstone.

Feasibility of Ultra-High Speed Diamond Drilling DE-FC26-03NT15401
13
Rate of Penetration with Large Full-faced Bit
0
2040
60
80
100120
140
160
0 5,000 10,000 15,000 20,000 25,000 30,000 35,000 40,000
Rotary Speed, rpm
Rate
of P
enet
ratio
n, ft
/hr
1500 g2500 g3500 g
Figure 9. Rate of Penetration data plot for the large full-faced drill bit.
Figure 8. Small and large full-faced drill bits used in the UHSDD.

Feasibility of Ultra-High Speed Diamond Drilling DE-FC26-03NT15401
14
Figure 10. Response surface plot of the rate of penetration data when using the large full-faced drill bit.
Specific Energy with Large Full-faced Bit
0
200
400
600
800
1000
1200
0 5,000 10,000 15,000 20,000 25,000 30,000 35,000 40,000
Rotary Speed, rpm
Spec
ific
Ene
rgy,
ft-lb
/in3
1500 g2500 g3500 g
Figure 11. Large full-faced bit specific energy plots with the weight on bit held constant.

Feasibility of Ultra-High Speed Diamond Drilling DE-FC26-03NT15401
15
Rate of Penetration with the Small Full-faced Bit
0
50
100
150
200
250
300
0 10,000 20,000 30,000 40,000 50,000
Rotational Speed, rpm
Rate
of P
enet
ratio
n, ft
/hr
1500 g2500 g3500 g
Figure 13. Small full-faced bit rate of penetration results are shown with the weight on bit held constant.
Figure 12. Specific energy response surface plot of data from the large full-faced bit.

Feasibility of Ultra-High Speed Diamond Drilling DE-FC26-03NT15401
16
Specific Energy with the Small Full-faced Bit
0
500
1000
1500
2000
2500
0 10,000 20,000 30,000 40,000 50,000
Rotational Speed, rpm
Spe
cific
Ene
rgy,
ft-lb
/in3
1500 g2500 g3500 g
Figure 15. Specific energy plot of data from the small full-faced drill bit.
Figure 14. Response surface plot of the rate of penetration data from the small full-faced drill bit.

Feasibility of Ultra-High Speed Diamond Drilling DE-FC26-03NT15401
17
Figure 16. Response surface plot of the specific energy from the small full-faced drill bit data.

Feasibility of Ultra-High Speed Diamond Drilling DE-FC26-03NT15401
18
APPENDIX A Tables of Drilling Parameters and Results
List of Tables Table A-1. Drilling parameters and results for core bit trials DOEH103 through DOEH193. ....19
Table A-2. Drilling parameters and results for small full face bit testing for Trials DOEH194 through DOEH205 in Berea sandstone..........................................................................................22
Figure A-3. Drilling parameters and results for large full face bit testing for trials DOEH206 through DOEH217. ........................................................................................................................22

Feasibility of Ultra-High Speed Diamond Drilling DE-FC26-03NT15401
19
Table A-1. Drilling parameters and results for core bit trials DOEH103 through DOEH193.
Trial Test Date Bit Rock Block
Target Weight on Bit
(g)
Target Rotary Speed (rpm)
Actual Weight on Bit
(g)
Actual Rotary Speed (rpm)
Hole Outside Diameter
(in)
Hole Inside
Diameter(in)
Total Specific Energy
(ft-lbs/in3)
Rate of Penetration
(ft/hr) DOEH103 2/28/06 20 Berea 9 3000 40,000 3083 32949 0.844 0.565 4623 90.540 DOEH104 2/28/06 20 Berea 9 3000 20,000 2913 15976 0.834 0.570 5405 47.220 DOEH105 2/28/06 20 Berea 11 3000 25,000 2997 22136 0.839 0.570 2707 41.940 DOEH106 2/28/06 20 Berea 11 3000 30,000 2990 26583 0.847 0.565 2618 50.490 DOEH107b 2/28/06 20 Berea 11 3000 40,000 3000 36152 0.843 0.566 3841 84.720 DOEH107c 2/28/06 20 Berea 27 3000 40,000 2999 33161 0.844 0.565 5596 70.920 DOEH108 3/30/06 29 Berea 24 1500 10,000 1443 9661 0.783 0.618 3031 8.760 DOEH109 3/30/06 29 Berea 24 1500 10,000 1442 9324 0.784 0.617 2961 6.630 DOEH110 3/31/06 29 Winfield 22 1500 30,000 1528 29198 0.786 0.610 10970 9.790 DOEH111 3/31/06 29 Winfield 22 1500 30,000 1477 28640 0.783 0.616 13636 8.520 DOEH112 3/31/06 29 Winfield 22 1500 10,000 1476 7469 0.777 0.622 5518 5.567 DOEH113 3/31/06 29 Winfield 22 1500 10,000 1458 9689 0.778 0.624 16219 3.525 DOEH114 3/31/06 29 Winfield 22 1500 50,000 1516 43794 0.813 0.584 7159 8.850 DOEH115 3/31/06 29 Berea 24 1500 10,000 1474 10198 0.782 0.622 3089 4.620 DOEH116 4/3/06 30 Berea 24 1500 10,000 1458 9259 0.781 0.622 3423 6.254 DOEH117 4/3/06 30 Berea 24 1500 10,000 1477 9462 0.782 0.624 3372 5.655 DOEH118 4/3/06 30 Berea 23 1500 50,000 1548 44351 0.787 0.615 6849 14.850 DOEH119 4/3/06 30 Berea 23 1500 30,000 1572 30465 0.783 0.622 4346 18.510 DOEH120 4/3/06 30 Berea 23 1500 10,000 1490 9816 0.775 0.627 330 3.900 DOEH121 4/3/06 30 Berea 23 1500 50,000 1559 44345 0.779 0.618 2482 21.750 DOEH122 4/3/06 30 Berea 23 1500 30,000 1554 29978 0.777 0.625 5959 10.860 DOEH123 4/3/06 30 Berea 23 1500 10,000 1487 9947 0.781 0.625 2023 6.600 DOEH124 4/3/06 30 Berea 23 1500 10,000 1478 9376 0.778 0.626 2107 5.370 DOEH125 4/3/06 30 Berea 4 1500 10,000 1476 9354 0.774 0.625 2732 4.620 DOEH126 4/6/06 30 Berea 23 1500 50,000 1555 45207 0.781 0.617 6285 20.730 DOEH127 4/6/06 30 Winfield 22 1500 50,000 1538 44549 0.780 0.618 9388 11.610 DOEH128 4/6/06 30 Winfield 22 1500 20,000 1513 19947 0.779 0.621 10680 5.640 DOEH129 4/6/06 30 Berea 23 1500 20,000 1502 20556 0.782 0.623 6329 6.000 DOEH130 4/6/06 30 Berea 23 1500 40,000 1494 40260 0.779 0.621 6989 15.690 DOEH131 4/6/06 30 Berea 24 1500 10,000 1508 10510 0.772 0.631 3864 2.280 DOEH132 4/7/06 30 Winfield 22 1500 50,000 1511 45162 0.782 0.617 8528 11.304

Feasibility of Ultra-High Speed Diamond Drilling DE-FC26-03NT15401
20
Table A-1. Drilling parameters and results for core bit trials DOEH103 through DOEH193 (continued).
Trial Test Date Bit Rock Block
Target Weight on Bit
(g)
Target Rotary Speed (rpm)
Actual Weight on Bit
(g)
Actual Rotary Speed (rpm)
Hole Outside Diameter
(in)
Hole Inside
Diameter(in)
Total Specific Energy
(ft-lbs/in3)
Rate of Penetration
(ft/hr) DOEH134 4/11/06 31 Berea 21 1500 10,000 1453 8822 0.804 0.589 2089 12.990 DOEH137 4/12/06 31 Berea 21 3500 50,000 3489 45273 0.820 0.579 2637 275.131 DOEH138 4/13/06 31 Berea 21 1500 10,000 1501 9153 0.783 0.618 2714 8.173 DOEH139 4/13/06 31 Winfield 22 1500 50,000 1484 44870 0.784 0.617 12450 18.210 DOEH140 4/13/06 31 Winfield 22 3500 50,000 3532 41261 0.786 0.610 8331 112.800 DOEH141 4/13/06 31 Sulurain 25 1500 10,000 1464 8949 0.786 0.610 5168 7.080 DOEH142 4/13/06 31 Winfield 22 2500 30,000 2459 26488 0.783 0.616 8577 42.480 DOEH143 4/13/06 31 Berea 29 1500 50,000 1508 45049 0.826 0.588 2816 41.885 DOEH144 4/13/06 31 Winfield 22 3500 10,000 3456 6225 0.777 0.622 9919 19.560 DOEH145 4/13/06 31 Berea 29 3500 50,000 3186 43699 0.818 0.583 2036 287.580 DOEH146 4/13/06 31 Sulurain 25 1500 10,000 3388 6517 0.815 0.584 3906 29.610 DOEH147 4/13/06 31 Sulurain 25 1500 50,000 1516 44241 0.821 0.589 9627 16.680 DOEH148 4/13/06 31 Colton 26 1500 10,000 1454 9191 0.770 0.611 3602 8.447 DOEH149 4/13/06 31 Berea 21 1500 10,000 1487 9092 0.788 0.603 2381 8.264 DOEH150 4/17/06 31 Winfield 22 1500 10,000 1485 8926 0.801 0.592 4651 8.096 DOEH151 4/17/06 31 Colton 26 3500 10,000 3368 6423 0.823 0.579 5073 25.250 DOEH152 4/17/06 31 Colton 26 1500 50,000 1504 45317 0.825 0.586 5012 15.176 DOEH153 4/17/06 31 Berea 29 2500 30,000 2490 27275 0.821 0.582 2098 103.912 DOEH154 4/17/06 31 Berea 29 3500 10,000 3347 6910 0.816 0.582 2318 45.307 DOEH155 4/17/06 31 Colton 26 3500 50,000 3537 44354 0.816 0.582 6871 54.240 DOEH156 4/17/06 31 Colton 26 2500 30,000 2514 28214 0.820 0.583 4325 34.661 DOEH157 4/17/06 31 Sulurain 25 3500 50,000 3612 43766 0.817 0.581 6593 68.831 DOEH158 4/17/06 31 Berea 29 1500 10,000 1489 9738 0.789 0.590 1950 6.474 DOEH159 4/17/06 31 Sulurain 25 2500 30,000 2519 27433 0.810 0.582 4486 42.783 DOEH160 4/17/06 31 Berea 21 1500 10,000 1446 9428 0.785 0.600 1832 7.676 DOEH161 4/18/06 31 Berea 29 1500 30,000 1411 29426 0.802 0.595 3911 12.049 DOEH162 4/18/06 31 Winfield 22 3500 30,000 3232 26703 0.813 0.581 6724 40.308 DOEH163 4/18/06 31 Winfield 22 2500 50,000 2561 44225 0.819 0.583 9114 24.731 DOEH164 4/18/06 31 Winfield 22 1500 30,000 1499 29601 0.795 0.593 6690 9.080 DOEH165 4/18/06 31 Colton 26 3500 30,000 3112 26580 0.822 0.581 5154 39.020 DOEH166 4/18/06 31 Colton 26 1500 30,000 1513 29742 0.790 0.601 9081 4.943

Feasibility of Ultra-High Speed Diamond Drilling DE-FC26-03NT15401
21
Table A-1. Drilling parameters and results for core bit trials DOEH103 through DOEH193 (continued).
Trial Test Date Bit Rock Block
Target Weight on Bit
(g)
Target Rotary Speed (rpm)
Actual Weight on Bit
(g)
Actual Rotary Speed (rpm)
Hole Outside Diameter
(in)
Hole Inside
Diameter (in)
Total Specific Energy
(ft-lbs/in3)
Rate of Penetration
(ft/hr) DOEH167 4/18/06 31 Colton 26 2500 30,000 2346 28388 0.817 0.583 4589 27.772 DOEH168 4/18/06 31 Sulurain 25 1500 30,000 1515 29635 0.780 0.620 18036 3.578 DOEH169 4/18/06 31 Sulurain 25 2500 10,000 2362 8521 0.796 0.593 5182 8.888 DOEH170 4/18/06 31 Berea 29 2500 50,000 2507 45353 0.822 0.586 3457 51.430
DOEH170r1 6/14/06 31 Berea 29 2500 50,000 2618 48690 0.821 0.583 2589 91.632 DOEH135 4/11/06 32 Berea 21 1500 10,000 1496 9060 0.839 0.565 1653 9.922 DOEH136 4/11/06 33 Berea 21 1500 10,000 1495 8940 0.812 0.588 1965 12.618 DOEH171 4/18/06 33 Berea 21 1500 10,000 1329 9855 0.783 0.620 2639 4.335
DOEH171B 4/19/06 33 Berea 21 1500 10,000 1378 9447 0.811 0.591 1837 7.899 DOEH172 4/18/06 33 Berea 29 2500 30,000 2139 28992 0.820 0.583 2335 43.176 DOEH173 4/18/06 33 Sulurain 25 3500 30,000 3232 27994 0.819 0.581 4628 41.699 DOEH174 4/18/06 33 Sulurain 25 2500 50,000 2487 44722 0.810 0.585 5570 51.746 DOEH175 4/18/06 33 Winfield 22 2500 10,000 2352 8721 0.805 0.589 6580 12.922 DOEH176 5/4/06 33 Colton 26 2500 50,000 2482 48553 0.810 0.577 4314 46.740 DOEH177 5/4/06 33 Colton 26 2500 10,000 2452 8176 0.812 0.585 4595 11.015 DOEH178 5/4/06 33 Sulurain 25 2500 30,000 2469 28003 0.809 0.589 6980 26.196 DOEH179 5/4/06 33 Berea 29 3500 30,000 3267 26450 0.811 0.588 2371 153.960 DOEH180 5/4/06 33 Winfield 22 2500 30,000 2505 27987 0.812 0.589 7058 22.802 DOEH181 5/4/06 33 Berea 29 2500 10,000 2380 8414 0.810 0.588 1873 25.897 DOEH182 5/4/06 33 Berea 21 1500 10,000 1454 9929 0.781 0.599 3393 4.148 DOEH183 5/4/06 33 Nugget 28 1500 10,000 1516 10206 0.761 0.612 866 1.744 DOEH184 5/15/06 33 Nugget 28 3500 10,000 3413 7282 0.812 0.587 5241 12.089 DOEH185 5/15/06 33 Nugget 28 3500 50,000 3480 47856 0.823 0.574 7327 15.768 DOEH186 5/15/06 33 Nugget 28 3500 30,000 3506 27731 0.811 0.589 5917 28.793 DOEH187 5/15/06 33 Nugget 28 1500 50,000 1505 49955 0.815 0.577 17222 3.798 DOEH188 5/15/06 33 Nugget 28 2500 30,000 2497 28770 0.812 0.583 5704 13.206 DOEH189 5/15/06 33 Nugget 28 2500 30,000 2509 29432 0.815 0.582 5603 14.027 DOEH190 5/15/06 33 Nugget 28 2500 50,000 2496 49881 0.818 0.574 5484 13.747 DOEH191 5/15/06 33 Nugget 28 1500 30,000 1511 29689 0.816 0.585 8771 4.021 DOEH192 5/15/06 33 Nugget 28 2500 10,000 2416 9534 0.801 0.586 7043 3.902 DOEH193 5/15/06 33 Berea 21 1500 10,000 1516 10296 0.809 0.595 3371 2.796

Feasibility of Ultra-High Speed Diamond Drilling DE-FC26-03NT15401
22
Table A-2. Drilling parameters and results for small full face bit testing for Trials DOEH194 through DOEH205 in Berea sandstone.
Trial Test Date Bit Block
Target Weight
on Bit (g)
Target Rotary Speed (rpm)
Actual Weight
on Bit (g)
Actual Rotary Speed (rpm)
Drilled Hole
Diameter (in)
Rock Bore
Diameter (in)
Total Specific Energy
(ft-lbs/in3)
Rate of Penetration
(ft/hr) DOEH194 5/16/06 34 30 1500 10,000 1400 9,940 0.516 0.196 1,338 12.174 DOEH195 5/16/06 34 31 3500 10,000 3450 7,844 0.535 0.196 1,075 71.539 DOEH196 5/16/06 34 31 2500 30,000 2320 29,237 0.533 0.196 1,182 124.183 DOEH197 5/16/06 34 31 2500 10,000 2361 9,582 0.535 0.196 1,034 35.163 DOEH198 5/16/06 34 31 2500 50,000 1830 48,820 0.545 0.196 1,402 119.155 DOEH199 5/16/06 34 31 3500 30,000 3338 28,573 0.538 0.196 1,154 217.796 DOEH200 5/16/06 34 31 1500 50,000 1321 49,819 0.555 0.196 1,087 46.699 DOEH201 5/16/06 34 31 1500 10,000 1493 10,175 0.502 0.196 1,663 3.547 DOEH202 5/16/06 34 31 1500 30,000 1129 29,972 0.524 0.196 2,222 14.808 DOEH203 5/16/06 34 31 2500 30,000 2086 29,075 0.534 0.196 1,503 65.523 DOEH204 5/16/06 34 31 3500 50,000 3063 48,287 0.547 0.196 1,046 221.373 DOEH205 5/16/06 34 30 1500 10,000 1430 10,217 0.501 0.196 1,701 3.987
Table A-3. Drilling parameters and results for large full face bit testing for trials DOEH206 through DOEH217 in Berea sandstone.
Trial Test Date Bit Block
Target Weight on Bit
(g)
Target Rotary Speed (rpm)
Actual Weight on Bit
(g)
Actual Rotary Speed (rpm)
Drilled Hole
Diameter (in)
Rock Bore
Diameter (in)
Total Specific Energy
(ft-lbs/in3)
Rate of Penetration
(ft/hr) DOEH206 5/16/06 35 30 1500 10,000 1444 9,857 0.800 0.196 1,294 8.843 DOEH207 5/16/06 35 32 3500 30,000 3130 25,871 0.820 0.196 1,014 146.490 DOEH208 5/16/06 35 32 2500 40,000 1989 38,066 0.834 0.196 814 42.495 DOEH209 5/16/06 35 32 1500 30,000 1195 29,334 0.812 0.196 1,100 30.248 DOEH210 5/16/06 35 32 2500 10,000 2373 8,484 0.800 0.196 1,154 21.640 DOEH211 5/16/06 35 32 2500 30,000 2139 27,763 0.811 0.196 1,093 77.798 DOEH212 5/16/06 35 32 3500 10,000 3417 7,051 0.806 0.196 1,109 33.000 DOEH213 5/16/06 35 32 3500 40,000 3114 38,803 0.836 0.196 530 57.557 DOEH214 5/16/06 35 32 2500 30,000 2159 28,079 0.815 0.196 1,129 67.242 DOEH215 5/16/06 35 32 1500 10,000 1467 10,311 0.786 0.196 1,540 2.402 DOEH216 5/16/06 35 32 1500 50,000 0 0 0.000 0.000 0 0.000 DOEH217 5/16/06 35 30 1500 10,000 1469 10,284 0.801 0.196 1,801 596.842

Feasibility of Ultra-High Speed Diamond Drilling DE-FC26-03NT15401
23
APPENDIX B Graphs of Core Bit Results
List of Figures Figure B-1. Specific energy graph and response surface plot for Colton sandstone at various rotational speeds and weights on bit. .............................................................................................24
Figure B-2. Rate of penetration graph and response surface plot for Colton sandstone at various rotational speeds and weights on bit. .............................................................................................25
Figure B-3. Specific energy graph and response surface plot for Nugget sandstone at various rotational speeds and weights on bit. .............................................................................................26
Figure B-4. Rate of penetration graph and response surface plot for Nugget sandstone at various rotational speeds and weights on bit. .............................................................................................27
Figure B-5. Specific energy graph and response surface plot for Sulurain dolomite at various rotational speeds and weights on bit. .............................................................................................28
Figure B-6. Rate of penetration graph and response surface plot for Sulurain dolomite at various rotational speeds and weights on bit. .............................................................................................29
Figure B-7. Specific energy graph and response surface plot for Winfield anhydrite at various rotational speeds and weights on bit. .............................................................................................30
Figure B-8. Rate of penetration graph and response surface plot for Winfield anhydrite at various rotational speeds and weights on bit. ................................................................................31

Feasibility of Ultra-High Speed Diamond Drilling DE-FC26-03NT15401
24
Colton Sandstone Specific Energy w ith Constant WOB
0
1000
2000
3000
4000
5000
6000
7000
8000
9000
10000
0 10,000 20,000 30,000 40,000 50,000
Rotational Speed, rpm
Spec
ific
Ener
gy, f
t-lb
/in3
1500 g2500 g3500 g
Figure B-1. Specific energy graph and response surface plot for Colton sandstone at various rotational speeds and weights on bit.

Feasibility of Ultra-High Speed Diamond Drilling DE-FC26-03NT15401
25
Colton Sandstone Rate of Penetration w ith Constant WOB
0
10
20
30
40
50
60
70
0 5,000 10,000 15,000 20,000 25,000 30,000 35,000 40,000 45,000 50,000
R o t at io nal Sp eed, rp m
1500 g2500 g3500 g
Figure B-2. Rate of penetration graph and response surface plot for Colton sandstone at various rotational speeds and weights on bit.

Feasibility of Ultra-High Speed Diamond Drilling DE-FC26-03NT15401
26
Nugget Sandstone Specific Energy w ith Constant WOB
0
2,000
4,000
6,000
8,000
10,000
12,000
14,000
16,000
18,000
0 5,000 10,000 15,000 20,000 25,000 30,000 35,000 40,000 45,000 50,000
Rotational Speed, rpm
Spec
ific
Ener
gy, f
t-lb
/in3
1500 g
2500 g
3500 g
Figure B-3. Specific energy graph and response surface plot for Nugget sandstone at various rotational speeds and weights on bit.

Feasibility of Ultra-High Speed Diamond Drilling DE-FC26-03NT15401
27
Nugget Sandstone Rate of Penetration w ith Constant WOB
0
5
10
15
20
25
30
35
40
0 5,000 10,000 15,000 20,000 25,000 30,000 35,000 40,000 45,000 50,000
Rotational Speed, rpm
Rat
e of
Pen
etra
tion,
ft/h
r
1500 g
2500 g
3500 g
Figure B-4. Rate of penetration graph and response surface plot for Nugget sandstone at various rotational speeds and weights on bit.

Feasibility of Ultra-High Speed Diamond Drilling DE-FC26-03NT15401
28
Sulurain Dolomite Specific Energy with Constant WOB
0
2000
4000
6000
8000
10000
12000
14000
16000
18000
20000
0 5,000 10,000 15,000 20,000 25,000 30,000 35,000 40,000 45,000 50,000
Rotational Speed, rpm
Spec
ific
Ener
gy, f
t-lb
/in3
1500 g
2500 g
3500 g
Figure B-5. Specific energy graph and response surface plot for Sulurain dolomite at various rotational speeds and weights on bit.

Feasibility of Ultra-High Speed Diamond Drilling DE-FC26-03NT15401
29
Sulurain Dolomite Rate of Penetration with Constant WOB
0
10
20
30
40
50
60
70
80
0 5,000 10,000 15,000 20,000 25,000 30,000 35,000 40,000 45,000 50,000
Rotational Speed, rpm
Rat
e of
Pen
etra
tion,
ft/h
r
1500 g
2500 g
3500 g
Figure B-6. Rate of penetration graph and response surface plot for Sulurain dolomite at various rotational speeds and weights on bit.

Feasibility of Ultra-High Speed Diamond Drilling DE-FC26-03NT15401
30
Winfield Anhydrite Specific Energy w ith Constant WOB
0
2000
4000
6000
8000
10000
12000
14000
0 5,000 10,000 15,000 20,000 25,000 30,000 35,000 40,000 45,000 50,000
Rotational Speed, rpm
Spec
ific
Ener
gy, f
t-lb
/in 3
1500 g
2500 g
3500 g
Figure B-7. Specific energy graph and response surface plot for Winfield anhydrite at various rotational speeds and weights on bit.

Feasibility of Ultra-High Speed Diamond Drilling DE-FC26-03NT15401
31
Winfield Anhydrite Rate of Penetration w ith Constant WOB
0
20
40
60
80
100
120
0 5,000 10,000 15,000 20,000 25,000 30,000 35,000 40,000 45,000 50,000
Rotational Speed, rpm
Rat
e of
Pen
etra
tion,
ft/h
r 1500 g
2500 g
3500 g
Figure B-8. Rate of penetration graph and response surface plot for Winfield anhydrite at various rotational speeds and weights on bit.