Small strain behavior and crushability of Ballyconnelly ...
29
Small strain behavior and crushability of Ballyconnelly carbonate sand under monotonic and cyclic loading Nanda, S., Sivakumar, V., Donohue, S., & Graham, S. (2017). Small strain behavior and crushability of Ballyconnelly carbonate sand under monotonic and cyclic loading. Canadian Geotechnical Journal. https://doi.org/10.1139/cgj-2016-0522 Published in: Canadian Geotechnical Journal Document Version: Peer reviewed version Queen's University Belfast - Research Portal: Link to publication record in Queen's University Belfast Research Portal Publisher rights © 2017 Canadian Science Publishing. This work is made available online in accordance with the publisher’s policies. Please refer to any applicable terms of use of the publisher. General rights Copyright for the publications made accessible via the Queen's University Belfast Research Portal is retained by the author(s) and / or other copyright owners and it is a condition of accessing these publications that users recognise and abide by the legal requirements associated with these rights. Take down policy The Research Portal is Queen's institutional repository that provides access to Queen's research output. Every effort has been made to ensure that content in the Research Portal does not infringe any person's rights, or applicable UK laws. If you discover content in the Research Portal that you believe breaches copyright or violates any law, please contact [email protected]. Download date:08. Oct. 2021
Transcript of Small strain behavior and crushability of Ballyconnelly ...

Small strain behavior and crushability of Ballyconnelly carbonate sandunder monotonic and cyclic loading
Nanda, S., Sivakumar, V., Donohue, S., & Graham, S. (2017). Small strain behavior and crushability ofBallyconnelly carbonate sand under monotonic and cyclic loading. Canadian Geotechnical Journal.https://doi.org/10.1139/cgj-2016-0522
Published in:Canadian Geotechnical Journal
Document Version:Peer reviewed version
Queen's University Belfast - Research Portal:Link to publication record in Queen's University Belfast Research Portal
Publisher rights© 2017 Canadian Science Publishing.This work is made available online in accordance with the publisher’s policies. Please refer to any applicable terms of use of the publisher.
General rightsCopyright for the publications made accessible via the Queen's University Belfast Research Portal is retained by the author(s) and / or othercopyright owners and it is a condition of accessing these publications that users recognise and abide by the legal requirements associatedwith these rights.
Take down policyThe Research Portal is Queen's institutional repository that provides access to Queen's research output. Every effort has been made toensure that content in the Research Portal does not infringe any person's rights, or applicable UK laws. If you discover content in theResearch Portal that you believe breaches copyright or violates any law, please contact [email protected].
Download date:08. Oct. 2021

Small strain behavior and crushability of Ballyconnelly carbonate sand under monotonic and cyclic
loading
S. Nanda, V. Sivakumar, S. Donohue and S. Graham
Article submitted to Canadian Geotechnical Journal
1Corresponding author:
Dr. Shane Donohue
School of Natural and Built Environment
Queen’s University Belfast
BT9 5AG
Page 1 of 28C
an. G
eote
ch. J
. Dow
nloa
ded
from
ww
w.n
rcre
sear
chpr
ess.
com
by
QU
EE
NS
UN
IVE
RSI
TY
BE
LFA
ST o
n 11
/10/
17Fo
r pe
rson
al u
se o
nly.
Thi
s Ju
st-I
N m
anus
crip
t is
the
acce
pted
man
uscr
ipt p
rior
to c
opy
editi
ng a
nd p
age
com
posi
tion.
It m
ay d
iffe
r fr
om th
e fi
nal o
ffic
ial v
ersi
on o
f re
cord
.

Small strain behavior and crushability of Ballyconnelly carbonate sand under monotonic and cyclic
loading
S. Nanda, V. Sivakumar, S.Donohue and S. Graham
ABSTRACT
In various parts of the globe, carbonate sands are found at shallow sea water depth. These types of
sands are very susceptible to large scale particle breakage. Offshore structures like wind turbines
and sea defences are constructed on these types of soils. From a design perspective, it is essential to
assess the extent of particle breakage and the subsequent change in soil properties that occur under
working load conditions. This paper presents the data obtained from a number of drained
monotonic and cyclic triaxial tests on crushable carbonate sand (“Ballyconnelly sand”) in conjunction
with small strain shear stiffness (Gmax) measurements using the bender element technique. The soils
were allowed to shear under three different loading patterns in order to understand the factors
influencing the breakage of particles.
The degree of crushing was quantified and analysed based on the total energy input. It was observed
that, apart from applied stress, the total strain accumulation governs the amount of particle
breakage. It was observed that Gmax increased significantly under high stress ratio. Gmax also
increased noticeably during resting periods without any change in loading conditions as a result of
creep, and subsequently during cyclic loading although at a reduced rate.
Key words: Carbonate sand, crushing, Ballyconnelly sand, stress path, stiffness and cyclic loading
Page 2 of 28C
an. G
eote
ch. J
. Dow
nloa
ded
from
ww
w.n
rcre
sear
chpr
ess.
com
by
QU
EE
NS
UN
IVE
RSI
TY
BE
LFA
ST o
n 11
/10/
17Fo
r pe
rson
al u
se o
nly.
Thi
s Ju
st-I
N m
anus
crip
t is
the
acce
pted
man
uscr
ipt p
rior
to c
opy
editi
ng a
nd p
age
com
posi
tion.
It m
ay d
iffe
r fr
om th
e fi
nal o
ffic
ial v
ersi
on o
f re
cord
.

INTRODUCTION
The mechanical behaviour of granular soils may be significantly affected by particle crushing. Soils
that are more susceptible to crushing can range from skeletal carbonate sediments to highly
weathered decomposed granite, mainly from coastal areas and offshore sea beds, and even recycled
aggregates (Sivakumar et.al. 2003). Loose carbonate sands of biogenic origin tend to crush more
easily and at relatively low pressures when compared to silica based sands, as their fragile shell
particles fracture. When the soil is loaded, the fragile nature of the particles together with an initially
loose state, results in a very high compressibility (Coop 1990). The engineering behaviour and
properties of the carbonate sands have been examined in detail by a number of researchers (e.g.
Houlsby et al. 1988; Golightly 1989; Coop 1990; Coop and Lee 1993; Yasufuku and Hyde 1995; Hyodo
et al. 1998; Brandini and Coop 2001; Nakata et al. 2001; Coop et al. 2004; Tarantino and Hyde 2005;
Leleu and Valdes 2007; Qadimi and Coop 2007; Donohue et al. 2009; Sadrekarimi and Olson 2010;
López-Querol and Coop 2012; Miao and Airey 2013; Lui et al. 2016; Nardelli and Coop 2016).
The amount of particle breakage depends on several factors including stress level, particle
grading, void ratio, size, shape, strength and mineral composition (Coop et al. 2004). In general,
increases in particle size and angularity increases the amount of particle crushing (Lade et al. 1996;
Vilhar et al 2013). Increases in stress levels in coarse grain soils enhance the chances of particle
breakage but the amount of breakage also depends on the strain accumulation at that stress level,
as particles may undergo significant amounts of rolling and sliding before crushing occurs.
Dynamic/cyclic loading of geotechnical structures may cause further particle crushing.
Examples of cyclic loading on geotechnical structures include repeated axle loading of roads and
railways (Vallejo et. al. 2006). Cyclic loading is also associated with offshore structures such as oil rigs
and wind farms. This coincides with the work carried out by Cheng et al. (2001) and Vallejo et al.
(2006) which showed that the force network through the particle contacts is not the same in every
loading cycle. Particle crushing is therefore only associated with particles participating in the
strongest force chains. Donohue et al. (2009), López-Querol and Coop (2012) and Lui et al. (2016)
carried out studies on drained cyclic loading of carbonate sand. Donohue et al. (2009) observed that
while particles may not be loaded to their full capacity in a given cycle, they could be crushed in
subsequent cycles without any variation in the amplitude of cyclic loading. The above studies have
focused mainly on cyclic loading at large strains; however for complex geotechnical design the
behaviour of soils at small strains is often required.
This paper presents and discusses the data obtained from a series of drained triaxial tests on
carbonate sand subjected to monotonic and cyclic loading in conjunction with small strain
Page 3 of 28C
an. G
eote
ch. J
. Dow
nloa
ded
from
ww
w.n
rcre
sear
chpr
ess.
com
by
QU
EE
NS
UN
IVE
RSI
TY
BE
LFA
ST o
n 11
/10/
17Fo
r pe
rson
al u
se o
nly.
Thi
s Ju
st-I
N m
anus
crip
t is
the
acce
pted
man
uscr
ipt p
rior
to c
opy
editi
ng a
nd p
age
com
posi
tion.
It m
ay d
iffe
r fr
om th
e fi
nal o
ffic
ial v
ersi
on o
f re
cord
.

measurements using bender elements. The amount of breakage that occurred was quantified in
terms of a relative breakage factor proposed by Hardin (1984). The observed relative breakage
factor further was analysed in terms of total input energy and mean effective stress.
METHODOLOGY
Characterisation of the material: For this study a crushable calcareous sand of biogenic origin was
used. This sand, known locally as “Ballyconnelly sand” was collected from Clifden Bay, Connemarra
in Ireland. The sand is whitish orange in colour with rounded grains and consists almost entirely of
fragments of calcareous algae. The initial void ratio, e0 of all tests carried out on Ballyconnelly sand
was 0.68 ± 5%. Physical characteristics of this material are: Sphericity 0.85; Roundness 0.8; CaCo3
content ≈93%; Grain size D10 &D50 1.0mm and 1.45mm; and Specific gravity (Gs) 1.72. For
determining Gs, the procedure outlined in BS 812-2:1995, was adopted.
Sample preparation: The sand was initially soaked in water under vacuum for 1 hour prior to use.
The samples were prepared using the procedure typically used for preparing sand samples for
triaxial testing. A rubber membrane was secured on the pedestal and this was then surrounded by a
split mould. A small amount of water was poured into the membrane and previously soaked sand
was gently poured into the membrane. Membrane effects can cause errors in the volumetric strain
measurements, particularly if the confining pressure was gradually increased. However, in all of the
tests the confining pressure remained the same and therefore the effects are minimal. A gentle tap
was applied to compact the sand in layers. Upon reaching the required height, the top cap was
located and secured with “O” rings. As a single membrane punctured under higher loading in a trial
test, an additional membrane was then carefully placed around the sample. A small amount of
suction was applied in the drainage line prior to the removal of the split mould.
In order to measure the shear wave velocity (Vs) and the corresponding small strain shear
stiffness during each test, the pedestal and the top cap were incorporated with bender elements,
which are piezoelectric transducers capable of generating and detecting shear or compressional
motion (Dyvik and Madshus 1985; Donohue et al. 2010; Blewett et.al. 2000; Kawaguchi et al. 2001;
Bonal et al. 2012). A function generator and data logger, supplied by V J Tech, were used to generate
and capture the transmitted and received signals respectively. In each test, the volume change, axial
displacement and the deviator load were measured using standard devices.
Testing programme: The testing programme consisted of three stages: (A) monotonic loading until
failure; (B) monotonic loading to a fraction of the anticipated failure load and subsequent cyclic
Page 4 of 28C
an. G
eote
ch. J
. Dow
nloa
ded
from
ww
w.n
rcre
sear
chpr
ess.
com
by
QU
EE
NS
UN
IVE
RSI
TY
BE
LFA
ST o
n 11
/10/
17Fo
r pe
rson
al u
se o
nly.
Thi
s Ju
st-I
N m
anus
crip
t is
the
acce
pted
man
uscr
ipt p
rior
to c
opy
editi
ng a
nd p
age
com
posi
tion.
It m
ay d
iffe
r fr
om th
e fi
nal o
ffic
ial v
ersi
on o
f re
cord
.

loading; and (C) monotonic and cyclic loading under various stress ratio µ (= q/p’) values. All tests
were conducted under drained conditions. The diameter and the height of the samples were 100mm
and 200 mm respectively in the case of (A) and (B). The height of the sample was reduced to 100 mm
in the stage (C) tests. In order to achieve a more reliable shear wave signal, the size of the samples
were reduced in stage (C) to accommodate the bender elements, as a sample of 200mm height
produced more scattering of the output signal. The samples were saturated using a back pressure
and ensuring a pore water pressure parameter B value of at least 0.95. Table 1 includes details of the
various tests carried out. In Stage A, four samples were subjected to effective consolidation
pressures of 100kPa, 250kPa, 500kPa and 1050kPa. The samples were then sheared under drained
conditions. Particle size analyses were carried out on the raw and tested samples. In Stage B, six
tests were carried out in which the samples were loaded to one third or two thirds of the anticipated
failure load based on samples initially consolidated to 100 kPa, 250 kPa and 500 kPa of mean
effective stress. The samples were then subjected to cyclic loading of up to 1000 cycles. The cyclic
loading amplitudes ∆q (triangular wave form) were ±20kPa and 40kPa for samples consolidated to
100 kPa; ±40kPa and 80kPa for samples consolidated to 250 kPa; ±80kPa and 160kPa for samples
consolidated to 500 kPa. Based on the triangular waveform, pressure was increased (and reduced) at
a rate 50 kPa per minute.
In Stage C of the testing programme, five tests were carried out at various values of µ (=0, 0.25, 0.5,
1 and 1.25), as shown in Figure 1. In the case of µ>0, the samples were initially subjected to an
effective consolidation pressure of 250 kPa under isotopic stress conditions (Point A in Figure 1) and
then an axial load was applied to meet the required value of µ. The samples were then taken along
the µ line (for example Bµ=1
in the case of µ = 1.0) and the shear wave velocity was measured at four
different stress states as illustrated in Figure 1 (Cµ=1
, Dµ=1
and Eµ=1
). In the present investigation the
shear wave velocity was consistently determined based on the peak-to-peak travel time, although
this duration was very similar to the wave travel time based on the first arrival. A relatively high
frequency (20kHz) sine pulse was adopted throughout in order to reduce the near field effects
(Bonal et al 2012). All received signals were averaged 20 times in order to reduce noise. The shear
modulus, Gmax, was subsequently determined using the following equation:
Gmax = ρVs2 (1)
where ρ is bulk density (kg/m3) and Vs is the shear wave velocity (m/s). It should be pointed out that
Gmax is influenced by a range of parameters, the most important of which are void ratio, e, and mean
effective stress, σ' (Hardin and Dnervich 1972).
Page 5 of 28C
an. G
eote
ch. J
. Dow
nloa
ded
from
ww
w.n
rcre
sear
chpr
ess.
com
by
QU
EE
NS
UN
IVE
RSI
TY
BE
LFA
ST o
n 11
/10/
17Fo
r pe
rson
al u
se o
nly.
Thi
s Ju
st-I
N m
anus
crip
t is
the
acce
pted
man
uscr
ipt p
rior
to c
opy
editi
ng a
nd p
age
com
posi
tion.
It m
ay d
iffe
r fr
om th
e fi
nal o
ffic
ial v
ersi
on o
f re
cord
.

Upon reaching the maximum loading the samples were allowed to rest for 24 hours prior to
cyclic loading. The amplitude of the cyclic loading was ±100 kPa. In order to assess the effect of
cyclic loading on particle size, a particle size analysis was also carried out at the end of each test
(Figure 2). It should be pointed out that the sample tested under µ = 0 did not undergo cyclic loading
or shearing, and the relevant particle breakage is very marginal (Figure 2).
RESULTS AND DISCUSSION
Stage A, Monotonic loading: Figure 3 shows the responses of the samples subjected to monotonic
loading under various initial effective consolidation pressures. The sample subjected to 100 kPa of
initial consolidation pressure showed a prominent peak and then reached an assumed critical state
at an axial strain of 20%. During this process the sample initially contracted and subsequently dilated
by about 5.5%. The sample consolidated to 250 kPa also showed a marginal peak and a small
amount of dilation (about 0.5%). There is no evidence of peak state in either of the samples
consolidated to 500 kPa and 1050 kPa. This indicates simultaneous dilation and breakage of
particles. In both cases the samples contracted significantly and the relevant magnitudes of
contractions are 7% and 14% respectively for samples consolidated to 500 kPa and 1050 kPa (Fig 3b).
A marginal volume change still continuing even after a vertical strain of about 20%. The failure
envelope based on the ultimate state or assumed critical state is shown Figure 3c. Representing
crushable soils under critical state framework is still difficult as uncertainty prevails for coarse grain
soils to achieve constant volume change under all loading conditions. Experimental observations
suggest critical state may be achieved by coarse grain soil either at very low stress (small amounts of
particle breakage) or at very high stress (where complete breakage has occurred) (Ghafghazi et al.
2014; Lade and Yamamuro 1996; Russel and Khalili 2004). As shown in Fig. 3c, the assumed critical
state line can be drawn by using test results under initial consolidation pressures of 100, 250 and
500 kPa as no volume change was noticed at the end of the tests. The result from the 1050 kPa test
falls below this critical state line. Similar observation was reported by Ghafghazi et al. (2014) where
the critical state line moves downward with particle breakage. It is clear from Fig. 3(c) that the
assumed critical state line is not in fact linear (though the same could be expected for other types of
granular material), and it may be affected by the intense crushing during shearing, altering the
particle size distribution at each stress level. The angle of internal friction at low consolidation
pressure is about 38o and it reduces to 35
o at high pressures. The intense contraction observed
during shearing is largely due to particle crushing and the particle size analysis carried out on the
tested material, shown in Figure 3d, confirms this. The process of particle crushing produced more
Page 6 of 28C
an. G
eote
ch. J
. Dow
nloa
ded
from
ww
w.n
rcre
sear
chpr
ess.
com
by
QU
EE
NS
UN
IVE
RSI
TY
BE
LFA
ST o
n 11
/10/
17Fo
r pe
rson
al u
se o
nly.
Thi
s Ju
st-I
N m
anus
crip
t is
the
acce
pted
man
uscr
ipt p
rior
to c
opy
editi
ng a
nd p
age
com
posi
tion.
It m
ay d
iffe
r fr
om th
e fi
nal o
ffic
ial v
ersi
on o
f re
cord
.

fine material, as the consolidation pressure increased from 100kPa to 1050kPa. The particle sizes
retained 10% and 30% (D10 and D30 ) of the original material were 1mm and 0.7mm, respectively, and
they reduced to 0.7mm and 0.3mm when sheared under 1050 kPa of consolidation pressure.
Stage B, Cyclic loading: Figure 4 shows the responses of the samples subjected to cyclic loading. Six
samples were tested under drained conditions (two samples each at initial consolidation pressures
of 100 kPa, 250 kPa and 500 kPa). In the first set of tests, the samples were initially taken to one
third of the peak load as identified from the monotonic tests (Figure 4). In the second set of tests,
the samples were taken to two thirds of the peak load. The amplitudes of cyclic loading noted earlier
are approximately 5 and 10% of the peak deviator stress identified from monotonic tests. The
volumetric strain shown in Figure 4 is solely due to the cyclic loading, excluding the volumetric strain
experienced by the sample leading up to the target deviator stress at which the cyclic loading began.
The amplitude of the cyclic loading is indicated in the relevant figures. At a compression pressure of
250 kPa, the sample began to dilate after about 1000 loading cycles. It should also be noted that the
recoverable strain in each loading cycle (indicated by the bandwidth) is highly variable. This is likely
due to differences in loading amplitudes in each cycle although it could also indicate that the
particle-particle loading is not necessarily the same in each loading cycle. This was also discussed by
Donohue et al. (2009) and O’Neill (2005), who observed, through discrete element simulations that
when loaded, the force network in granular soils is highly heterogeneous and that different particles
experience the largest forces from cycle to cycle. It has been suggested that degradation in the form
of breakdown of asperities and particle crushing is associated with particles participating in the
strongest force chains (McDowell et al., 1996; Cheng et al., 2001; Vallejo et al., 2006; Donohue et al.
2009). If these force chains are not static, as shown by O’Neill (2005), then additional damage to the
material should occur in each cycle.
The particle size analysis carried out on the tested material also indicated a small amount of
crushing with increasing consolidation pressure and loading amplitude. The relative breakage factor
Br (discussed further later) at 500kPa and ± q = 160 kPa is 0.02. Similar observations were also
reported by Querol and Coop (2012).
The development of shear strain with the cyclic loading could provide further insight into
the particle crushing and reorientation etc. Figure 5 shows the shear strain developed during cyclic
loading under the three consolidation pressures. There is clear evidence that the permanent shear
strain begin to develop rapidly after a certain number of loading cycles. The most obvious case
being, the sample subjected to 500 kPa of initial consolidation pressure (Figure 5c) which was
Page 7 of 28C
an. G
eote
ch. J
. Dow
nloa
ded
from
ww
w.n
rcre
sear
chpr
ess.
com
by
QU
EE
NS
UN
IVE
RSI
TY
BE
LFA
ST o
n 11
/10/
17Fo
r pe
rson
al u
se o
nly.
Thi
s Ju
st-I
N m
anus
crip
t is
the
acce
pted
man
uscr
ipt p
rior
to c
opy
editi
ng a
nd p
age
com
posi
tion.
It m
ay d
iffe
r fr
om th
e fi
nal o
ffic
ial v
ersi
on o
f re
cord
.

subjected to two loading amplitudes: ∆q = ±80 kPa and ±160 kPa. Under a loading amplitude of ±80
kPa, the plastic strain becomes noticeable after 200 loading cycles and reduced to 10 cycles when
the loading amplitude was ±160 kPa. This “threshold” shear strain, where the rate of plastic strain
increases appears to be affected by various factors including the loading amplitude and initial
consolidation. In the case of the sample subjected to 100 kPa of initial consolidation pressure, the
number of loading cycles required to initiate a significant shear strain is between 8-20 for both
loading amplitudes, and, as expected, the threshold shear strains are larger for the higher value of
∆q. In the case of the test with initial consolidation pressure of 250 kPa (Figure 5b), the number of
loading cycles required to initiate a significant shear strain is generally similar to that of the sample
subjected to 500 kPa. The threshold shear strains are, however, different (even though the ∆q/p’0
ratio’s are directly comparable), with higher threshold strains measured at higher consolidation
pressures. It is plausible that as the samples subjected to higher consolidation pressures would have
tighter grain packing and be less prone to dilation (which can lead to an increase in volume in non-
crushable soils), but such response in crushable soils may contribute to additional crushing. It should
also be noted that although the number of loading cycles required to initiate rapid plastic shear
strain is high under significant consolidation pressures, the rate of plastic shear strain, when
expressed in terms of log cycle, is much higher. For example the rate of plastic shear strain for 1 log
cycle is approximately 0.17 for ∆q = ±80 kPa (250 kPa of consolidation pressure). Under the same
amplitude of loading, the rate of plastic shear strain is 0.25 when the sample was subjected to 500
kPa of consolidation pressure.
Stage C, Cyclic loading and small strain behaviour: In this stage of testing, samples were taken
through stress paths with various µ values. The initial dimensions of the samples together with the
volume changes during loading were used to determine the bulk density at a given stress state.
Figure 6 shows the deviator stress plotted against axial strain for various values of µ in which a
maximum of 9% axial strain took place at µ=1.25 under the largest loading applied. The shear wave
velocity was calculated at each stress state, corresponding to effective consolidation pressure (i.e.
effective cell pressure) of 250 kPa, 500 kPa, 750 kPa and 1000 kPa. The bender tip-tip distance was
corrected for the relevant axial compression of the sample. Figure 7a shows the relationship
between Gmax and the effective consolidation pressure. Gmax is also plotted against p’ (mean effective
stress) in Figure 7b. As shown, Gmax increases with the effective consolidation pressure (or mean
effective stress), However the Gmax–p’ line at µ = 0.25 falls slightly below the µ = 0 line before
regaining stiffness at approximately µ = 0.5. The relationship between the shear modulus and the
Page 8 of 28C
an. G
eote
ch. J
. Dow
nloa
ded
from
ww
w.n
rcre
sear
chpr
ess.
com
by
QU
EE
NS
UN
IVE
RSI
TY
BE
LFA
ST o
n 11
/10/
17Fo
r pe
rson
al u
se o
nly.
Thi
s Ju
st-I
N m
anus
crip
t is
the
acce
pted
man
uscr
ipt p
rior
to c
opy
editi
ng a
nd p
age
com
posi
tion.
It m
ay d
iffe
r fr
om th
e fi
nal o
ffic
ial v
ersi
on o
f re
cord
.

consolidation pressure is approximately the same at µ of zero and 0.5. Further increases in µ
resulted in significant increases in Gmax. The angle of internal friction of the material varied from 35°
to 38° and, based on the average angle of internal friction, the value of Ko (coefficient of earth
pressure at rest) is about 0.45. This Ko value corresponds to a µ value of 0.55. It is possible that Gmax
reduces with increasing µ in the passive state (i.e. µ < µKo) and increases with increasing µ in the
active state (i.e. µ>µKo) combined with enhanced particle crushing and densification under active
loading.
Upon reaching the maximum loading (at each µ value), the sample was allowed to rest until
it stabilised its vertical and volumetric strain. Observations have shown that stabilisation occurred
within a period of 24 hours. The relevant axial strain of the sample with time is shown in Figure 8a.
The samples underwent significant axial compression and the magnitude of axial strain increased
with the µ value. A maximum axial strain of 1.1% at a µ value of 1.25 was observed. This is significant
as it has taken place during a resting period without any change in loading conditions. Particle
breakage showed time dependant behaviour; similar behaviour was also reported by Yamamuro and
Lade (1993), where particle breakage continued with time at a reducing rate, and by McDowell and
Khan (2003) who suggested that creep of granular materials is accompanied by particle crushing. The
axial strain during cyclic loading is shown in Figure 8b. The loading amplitude, Δq, was ±100 kPa in all
four tests. In the case of µ = 1, the cyclic loading was stopped temporarily for 12 hours
(unintentionally) and during this additional resting period the sample continued to experience axial
straining.
Figure 9 (a) shows Gmax/Gi plotted against time (i.e. during the resting period), where Gi is the
initial small strain shear stiffness (immediately prior to application of prerequisite load as shown in
Fig.1) and Gmax is the small strain shear stiffness measured at each time interval during the resting
period. Figure 9(b) shows Gmax/Gi plotted against number of cycles. Where, Gi is the initial stiffness
immediately before application of cyclic loading and Gmax is the stiffness after application of cyclic
loading. An increase of about 6 to 10% in Gmax can be seen at the end of the resting period. The
increase in Gmax as a result of cyclic loading was less than that observed during the resting period
(only 2 to 5 % increase in Gmax). It is suggested that the increase in Gmax during both periods is
associated with (a) an increase in density of the sample (Equation 1) and (b) a greater number of
particle to particle contacts following particle crushing.
Particle size analysis was also carried out on the test material and is shown in Figure 2. The degree
of particle crushing was significant at higher values of µ. The authors accept that some of this
particle crushing may have been taken place during compression, however this aspect is minimal, as
Page 9 of 28C
an. G
eote
ch. J
. Dow
nloa
ded
from
ww
w.n
rcre
sear
chpr
ess.
com
by
QU
EE
NS
UN
IVE
RSI
TY
BE
LFA
ST o
n 11
/10/
17Fo
r pe
rson
al u
se o
nly.
Thi
s Ju
st-I
N m
anus
crip
t is
the
acce
pted
man
uscr
ipt p
rior
to c
opy
editi
ng a
nd p
age
com
posi
tion.
It m
ay d
iffe
r fr
om th
e fi
nal o
ffic
ial v
ersi
on o
f re
cord
.

shown in Figure 2. The sample tested under µ = 0 did not undergo cyclic loading and the relevant
particle breakage is marginal.
The tests conducted in this investigation to study the crushability of Ballyconnelly carbonate
sand has been summarised in � − log �, plane as shown in Figure 10. The line ABB*C represents the
assumed critical state line obtained from Stage A testing. Line ABB* signifies the zone of small
particle breakage, together with sliding/rolling actions, whereas line B*C signifies a very high degree
of particle breakage together with sliding/rolling. Any stress conditions moving towards line B*C
produced more particle breakage. For the Stage C tests, the results are also plotted on the same
figure at different stress ratios (Figure 10), including for the resting period and cyclic loading.
µ = 0 represents the normal compression line (NCL). As µ increases, the state of the soil moves more
towards the line B*C and produces higher particle breakage. Resting time may increase particle
breakage by a small amount. The stress range for severe particle crushing found in this investigation
is 600 to 2000 kPa, similar to the “breakage threshold” observed by Ghafghazi et al. 2014.
Particle breakage factors: In order to quantify the amount of particle breakage, various particle
brakeage factors have been proposed using sieve analysis results (Marsal 1967; Lee and Farhoomand
1967; Hardin 1985; Lade et al. 1996). Marsal (1967) proposed a breakage index which depends on
the difference in the percentage retained in each sieve between initial (without any load) and final
(after shearing) grain size distribution. Lee and Farhoomand (1967) adopted the change in D15 on the
grain size curve to quantify particle breakage. Their main focus was to address the crushing of filter
material in earth dams. Lade et al. (1996) proposed a particle breakage factor (B10) which is defined
as:
� = 1 − ���
��� (2)
where �� is the effective grain size of final gradation and �� is the effective grain size of initial
gradation. Lade et al. (1996) argued that grain size cannot be used to express the shear strength of
soil but can effectively be used to express the soil permeability and therefore, using D10 to describe
the particle breakage, have some meaningful use. Hardin (1985) used three parameters to describe
the particle brakeage: ��, �� and ��, where �� is the total breakage, �� is the breakage potential
and �� is the relative breakage. �� can be defined as the area between the initial and final grain size
curve whereas �� is the area between original grain size curve and particle size greater than
0.074mm. The relative breakage (��) is the ratio between the total breakage and the breakage
potential.
Page 10 of 28C
an. G
eote
ch. J
. Dow
nloa
ded
from
ww
w.n
rcre
sear
chpr
ess.
com
by
QU
EE
NS
UN
IVE
RSI
TY
BE
LFA
ST o
n 11
/10/
17Fo
r pe
rson
al u
se o
nly.
Thi
s Ju
st-I
N m
anus
crip
t is
the
acce
pted
man
uscr
ipt p
rior
to c
opy
editi
ng a
nd p
age
com
posi
tion.
It m
ay d
iffe
r fr
om th
e fi
nal o
ffic
ial v
ersi
on o
f re
cord
.

�� = ����
(3)
The use of the relative breakage factor is limited to the particle size of 0.074mm (i.e not applicable
to silt), Hardin (1985). Usually �� has been preferred to represent the particle breakage as it covers
the entire particles distribution curve which makes this method robust and stable (Coop and Lee
1993; Vilhar et al. 2013; Lade et al. 1996; Qadimi and Coop 2007; Querol and Coop 2012).
Lade et al. 1996 suggest that total energy input should be used to express relative breakage
instead of effective mean normal stress. Crushing primarily depends on the amount of energy
actually absorbed by the soil specimen. Another advantage of this approach is that it links both
stress and strain to particle breakage. Lade et al. 1996 proposed that, during a drained shearing the
total input energy is:
�� = ∑ �� !"#�$%%$� + '∑ (� − �)*!"+,$%
�$% + ∑ �� !"#,$%�$% - (4)
where �� = average confining pressure; !"#= corresponding volumetric strain increment; � − �)=
average stress difference; !"+= axial strain increment; ./0= start of test; �/.= beginning of
shearing; �/. = end of Shearing .
Figure 11 (a) represents the variation in particle breakage in terms of relative breakage with
mean effective stress for Stage A and Stage C loading. The mean effective stress is based on the
assumed critical state for Stage A testing and the corresponding value for Stage C testing was based
on the stress conditions at the end of cyclic loading. The figure also includes the observations
reported by Coop and Lee (1993) on Dogs Bay. In Stage A, the sample sheared in axial compression
whereas Stage C sheared while maintaining equal stress ratio as shown in Figure 1. At a given mean
effective stress Stage A produced more particle breakage compared to Stage C. The difference may
be due to the difference in the accumulated strain, as Stage C testing produced less strain compare
to Stage A. Thus the above observations underline the fact that the study of particle breakage using
mean effective stress alone, ignoring strain accumulation may give a misleading intensity of
breakage. The difference in particle breakage between Stage A and Stage C reduced with increase in
mean effective stress. The particle breakage increased with the stress ratio which signifies the
importance of deviator stress q and accumulation of vertical strain. In comparison to Dogs Bay Sand,
Ballyconnelly Sand produced more breakage at a given mean effective stress (Figure 11). The higher
crushability of Ballyconnelly sand may be due to its larger particle size than that of Dogs Bay Sand.
Coop 1990 reported D50 and D10 for Dogs Bay Sand are 0.2 and 0.15 respectively. McDowell and
Bolton (1998), reported that a significant reduction in tensile strength of the particles with
increasing particle size of various crushable soils.
Page 11 of 28C
an. G
eote
ch. J
. Dow
nloa
ded
from
ww
w.n
rcre
sear
chpr
ess.
com
by
QU
EE
NS
UN
IVE
RSI
TY
BE
LFA
ST o
n 11
/10/
17Fo
r pe
rson
al u
se o
nly.
Thi
s Ju
st-I
N m
anus
crip
t is
the
acce
pted
man
uscr
ipt p
rior
to c
opy
editi
ng a
nd p
age
com
posi
tion.
It m
ay d
iffe
r fr
om th
e fi
nal o
ffic
ial v
ersi
on o
f re
cord
.

The energy approach given in Equation (4) is applied to Stage A and Stage C testing. The
strain up to which particle breakage occurs should be considered for this particular analysis. From
Figure 3 (a) it can be seen that peak deviator stress was reached at about 2.5 and 6 % of axial strain
for p’0 of 100 and 250 kPa initial consolidation pressure respectively. After passing the peak and
moving towards the softening stage, this reduces the chance of crushing of particles but increases
the likelihood of particle slip/roll occurring. Taking into account the flat peak q-axial strain
relationship, for Stage A and p’0 of 100 and 250 kPa, an energy calculation was done up to vertical
strains of 12 and 17 % respectively. Figure 11(b) shows the relationship between �� and the energy
input calculated using Equation (4). There is a clear trend of increase in particle breakage with the
total energy exhibited in both types of loading. A similar trend was also observed by Lade et al.
(1996) from high pressure drain triaxial compression tests). Contrary to Fig 11 (a), Stage C loading
produced slightly more particle breakage compared to Stage A loading at a given energy level. This
may be due to the presence of higher effective mean stress at the same energy level and the smaller
height of sample used in Stage C loading. The rigid boundary conditions (ie. the top cap and the
pedestal) in triaxial testing will restrict the dilatancy of granular soil. Such boundary conditions may
lead to higher level of particle breakage close to the rigid interface. If this is the case then the overall
quantity of particle breakage in longer samples would be less than shorter sample for a given
diameter. The approaches discussed above to describe particle breakage have advantages as well as
disadvantages, but the total energy method may be considered an advancement on other methods
as it includes volumetric and axial strain, which can be included conveniently into the constitutive
behaviour of crushable course grain soils.
CONCLUSIONS
A number of drained monotonic and cyclic triaxial tests were carried out on crushable calcareous
sand in conjunction with small strain stiffness measurements using bender elements. The degree of
crushing was quantified using particle size analysis. The particle breakage observed during the
investigation was quantified by using the relative breakage parameter, Br. It was observed that
intense contraction observed during monotonic loading was largely thought to be due to particle
crushing, which was also more apparent at higher consolidation pressures. Overall, it appears that
the degree of particle crushing was dependent on the effective confining pressure, deviator stress,
the amplitude of cyclic loading and the accumulation of strains. Particle breakage usually increases
with increases in these stresses and strain. Evidence was also presented that indicates the
permanent shear strain develops rapidly after a certain number of loading cycles. In comparison to
Page 12 of 28C
an. G
eote
ch. J
. Dow
nloa
ded
from
ww
w.n
rcre
sear
chpr
ess.
com
by
QU
EE
NS
UN
IVE
RSI
TY
BE
LFA
ST o
n 11
/10/
17Fo
r pe
rson
al u
se o
nly.
Thi
s Ju
st-I
N m
anus
crip
t is
the
acce
pted
man
uscr
ipt p
rior
to c
opy
editi
ng a
nd p
age
com
posi
tion.
It m
ay d
iffe
r fr
om th
e fi
nal o
ffic
ial v
ersi
on o
f re
cord
.

the well characterised Dogs Bay Sand, Ballyconnelly Sand produced more breakage at a given mean
effective stress. The higher crushability of Ballyconnelly sand may be due to its higher particle size
than that of Dogs Bay Sand.
Small strain shear stiffness (Gmax) was observed to increase as a result of both creep and
cyclic loading. This increase is associated with (a) an increase in density of the sample and (b) a
greater number of particle to particle contacts following particle crushing. Gmax also reduced initially
with increasing stress ratio q/p’ (µ), but increased significantly under high stress ratios, representing
lateral expanding conditions. The condition of rest under constant stress resulted in a noticeable
increase in the shear modulus (particularly at higher pressures), as the particles continued to crush.
The corresponding effect under cyclic loading was less significant.
The total energy approach to express the relative breakage appears to be more reliable to
understand the intensity of particle breakage as it includes volumetric and axial strain, which can be
included conveniently into the constitutive behaviour of crushable course grain soils. A small
contribution to particle breakage of Ballyconnelly sand was observed due to cyclic loading and creep
action.
REFERENCES
Bandini V., and Coop, M.R. 2011. The influence of particle breakage on the location of the critical
state line. Soils and Foundations, 51 (4), 591–600.
Blewett, I.J., and Woodward, P.K. 2000. ‘Phase amplitude responses associated with the
measurement of shear-wave velocity in sand by bender elements’. Can. Geotech. J., 37,
1348-1357.
Bonal, J., Donohue, S., and McNally, C. 2012. ‘Wavelet analysis of bender element signals’.
Géotechnique. 62 (3), 243-252.
Cheng, Y. P., White, D. J., Bowman, E. T., Bolton, M. D., and Soga, K. 2001.‘The observation of soil
microstructure under load’.Proc. Powders and Grains 2001, Sendai, 69–72.
Coop, M.R. 1990. ‘The mechanics of uncemented carbonate sands’. Geotechnique,40, No. 4, 607–
626.
Coop, M.R., and Lee, I.K. 1993. ‘The behaviour of granular soils at elevated stress’. Proceedings of
the C.P. Wroth Memorial Symposium: Predictive Soil Mechanics, London, 186-198.
Coop, M.R., Sorensen, K. K., Bodas Freitas, T., and Georgoutos, G. 2004. ‘Particle breakage during
shearing of a carbonate sand’. Geotechnique, 54, No. 3, 157–163.
Page 13 of 28C
an. G
eote
ch. J
. Dow
nloa
ded
from
ww
w.n
rcre
sear
chpr
ess.
com
by
QU
EE
NS
UN
IVE
RSI
TY
BE
LFA
ST o
n 11
/10/
17Fo
r pe
rson
al u
se o
nly.
Thi
s Ju
st-I
N m
anus
crip
t is
the
acce
pted
man
uscr
ipt p
rior
to c
opy
editi
ng a
nd p
age
com
posi
tion.
It m
ay d
iffe
r fr
om th
e fi
nal o
ffic
ial v
ersi
on o
f re
cord
.

Donohue, S., O’Sullivan, C., and Long, M. 2009. ‘Particle breakage during cyclic triaxial loading of a
carbonate sand’. Geotechnique, 59, No. 5, 477–482.
Donohue, S. and Long, M. 2010.‘Assessment of sample quality in soft clay using shear wave velocity
and suction measurements’. Géotechnique 60 (11), 883-889.
Dyvik, R., and Madshus, C 1985.‘Lab measurements of Gmax using bender elements’.Proceedings of
the Conference on the Advances in the Art of Testing Soil under Cyclic Conditions. ASCE
Geotechnical Engineering Division, New York, 186-196.
Ghafghazi, M., Shuttle, D.A., and DeJong, J.T. 2014. ‘Particle breakage and the critical state of sand’.
Soils and Foundations, 54(3), 451-461.
Golightly, C. R. 1989. Engineering properties of carbonate sands. PhD thesis, University of Bradford,
UK.
Hardin, B.O. 1985. ‘Crushing of soil particles’. Journal of Geotechnical Engineering, 111(10), 1177-
1192.
Hardin, B.O., and Drnevich, V.P. 1972. Shear Modulus and Damping in Soil: Measurement and
Parameter Effects. Journal of the Soil Mechanics and Foundation Division, ASCE, 98(7), 603–
624.
Houlsby, G.T., Evans, K.M., and Sweeney, M. 1988. End bearing capacity of model piles in layered
carbonate soils. Proc. Int. Conf. on Calcareous Sediments, Perth, Australia, 1, 209-214.
Hyodo, M., Hyde, A.F.L., and Aramaki, N. 1998. Liquefaction of crushable soils. Géotechnique 48, No.
4, 527-543.
Kawaguchi, T, Mitachi, T., and Shibuya, S. 2001. ‘Evaluation of shear wave travel time in laboratory
bender element test’. Proceedings of the 15th.International Conference on Soil Mechanics
and Geotechnical Engineering (ICSMGE), 1: 155-158.
Lade, P. V., Yamamuro, J.A., and Bopp, P.A. 1996. ‘Significance of particle crushing in granular
materials’. Journal of Geotechnical Engineering, 122(4), 309-316.
Lee, K.L., and Farhoomand, I. 1967. ‘Compressibility and crushing of granular soils in anisotropic
triaxial compression’. Canadian Geotechnical Journal, 4 (1), 68-86.
López-Querol, S., and Coop, M. R. 2012. Drained cyclic behaviour of loose Dogs Bay sand
Géotechnique 62, No. 4, 281–289
Lui E.L., Chen, S., Lai, Y., Wei, W. and Fu, Z. 2016. Particle breakage of artificially crushable materials
subject to drained cyclic triaxial loading. Soil Dynamics and Earthquake Engineering, 89, 262-
268.
Page 14 of 28C
an. G
eote
ch. J
. Dow
nloa
ded
from
ww
w.n
rcre
sear
chpr
ess.
com
by
QU
EE
NS
UN
IVE
RSI
TY
BE
LFA
ST o
n 11
/10/
17Fo
r pe
rson
al u
se o
nly.
Thi
s Ju
st-I
N m
anus
crip
t is
the
acce
pted
man
uscr
ipt p
rior
to c
opy
editi
ng a
nd p
age
com
posi
tion.
It m
ay d
iffe
r fr
om th
e fi
nal o
ffic
ial v
ersi
on o
f re
cord
.

Marsal, R.J. 1967. ‘Large scale testing of rockfill materials’. Journal of the Soil Mechanics and
Foundations Division, 93(2), 27-43.
McDowell, G.R., and Bolton, M.D. 1998. On the micro mechanics of crushable aggregates.
Geotechnique, 48(5), 667-679.
McDowell, G. R., and Khan, J. J. 2003. Creep of granular materials. Granular Matter, 5(3), 115–120.
Miao, G., and Airey, D. 2013. Breakage and ultimate states for a carbonate sand. Géotechnique, 63
(14), 1221–1229.
Nakata, Y., Hyodo, M., Hyde, A. F. L., Kato, Y., and Murata, H. 2001. Microscopic particle crushing of
sand subjected to high pressure one dimensional compression. Soils and Foundations 41, No.
1, 69–82.
Nardelli, V., and Coop, M.R. 2016. The Micromechanical Behaviour of a Biogenic Carbonate Sand.
Procedia Engineering, 158, 39-44
O’Neill, S. 2005. A fundamental examination of the behaviour of granular media and its application
to discrete element modeling. MEngSc thesis, University College Dublin, Ireland.
Qadimi, A., and Coop, M. R. 2007. ‘The undrained cyclic behaviour of a carbonate sand’.
Geotechnique, 57, No. 9, 739–750.
Querol, S.L., and Coop, M.R. 2012.‘Drained cyclic behaviour of loose Dogs Bay sand’. Geotechnique,
62(4), 281-289.
Russell, A.R., and Khalili, N. 2004. ‘A bounding surface plasticity model for sands exhibiting particle
crushing ’. Canadian Geotechnical Journal, 41(6), 1179-1192.
Sadrekarimi, A., and Olson, S. M. 2010. "Particle damage observed in ring shear tests on sands."
Canadian Geotechnical Journal, 47(5), 497-515.
Sivakumar, V., McKinley, J. D., and Ferguson, D. 2003. ‘Reuse of construction waste: performance
under repeated loading’. Geotechnical Engineering, 157, 91–96.
Tarantino, A., and Hyde, A.F.L. 2005. An experimental investigation of work dissipation in crushable
materials Géotechnique 55, No. 8, 575-584.
Vallejo, L. E., Lobo-Guerrero, S., and Hammer, K. 2006. ‘Degradation of a granular baseunder a
flexible pavement: DEM simulation’. Int. J. Geomech, No. 6, 435–439.
Viggiani, G., and Atkinson, J. H. 1995. ‘Stiffness of fine-grained soils at very small strains’.
Geotechnique, 45 (2), 249-265.
Vilhar, G., Jovicic, V., and Coop, M.R. 2013. ‘The role of particle breakage in the mechanics of a non-
plastic silty sand’. Soils and Foundations, 53(1), 91-104.
Wang, C. G. J., and Guo, Y. C. L. 2014. ‘Influence of cyclic loading history on small strain shear
modulus of saturated clays’. Soil Dynamics and Earthquake Engineering, 66, 1-12
Page 15 of 28C
an. G
eote
ch. J
. Dow
nloa
ded
from
ww
w.n
rcre
sear
chpr
ess.
com
by
QU
EE
NS
UN
IVE
RSI
TY
BE
LFA
ST o
n 11
/10/
17Fo
r pe
rson
al u
se o
nly.
Thi
s Ju
st-I
N m
anus
crip
t is
the
acce
pted
man
uscr
ipt p
rior
to c
opy
editi
ng a
nd p
age
com
posi
tion.
It m
ay d
iffe
r fr
om th
e fi
nal o
ffic
ial v
ersi
on o
f re
cord
.
Yamamuro, J. A., and Lade, P. V. 1993. ‘Effect of strain rate on instability of granular soils’.
Geotechnical Testing Journal, 16(3), 304-313.
Yasufuku, N., and Hyde, A. F. L. 1995. Pile end-bearing capacity in crushable sands. Géotechnique 45,
No. 4, 663-676.
Figure Captions
Figure 1. Stress paths during bender element tests
Figure 2. Particle size distribution of samples subjected to loading around stress ratio line (Stage C
loading)
Figure 3. Stress-strain behaviour, failure state and particle crushing (Stage A loading)
Figure 4. Volumetric strain of samples subjected to cyclic loading (Stage B loading)
Figure 5. Shear strain of samples subjected to cyclic loading (Stage B loading)
Figure 6. Axial strain during loading along different stress ratio (Stage C loading)
Figure 7. Shear modulus along stress ratio line plotted against mean effective stress
Figure 8. Axial strain during (a) resting period and (b) cyclic loading
Figure 9. Shear modulus during resting period and cyclic loading
Figure 10. Pressure-volume relationship.
Figure 11. (a) Variation of Br with effective mean stress, (b) Variation of Br with total energy input.
Page 16 of 28C
an. G
eote
ch. J
. Dow
nloa
ded
from
ww
w.n
rcre
sear
chpr
ess.
com
by
QU
EE
NS
UN
IVE
RSI
TY
BE
LFA
ST o
n 11
/10/
17Fo
r pe
rson
al u
se o
nly.
Thi
s Ju
st-I
N m
anus
crip
t is
the
acce
pted
man
uscr
ipt p
rior
to c
opy
editi
ng a
nd p
age
com
posi
tion.
It m
ay d
iffe
r fr
om th
e fi
nal o
ffic
ial v
ersi
on o
f re
cord
.

Table-1
Test
ID
Test
type Test description
Effective
consolidation
pressure (kPa)
Length
of
sample
(mm)
Diameter
of sample
(mm)
Stress
ratio µµµµ
Cyclic load
amplitude
± q (kPa)
A1
A
Monotonic loading
until failure
100 200 100 - -
A2 250 200 100 - -
A3 500 200 100 - -
A4 1050 200 100 - -
B5
B
Monotonic loading
to a fraction of the
anticipated failure
load and
subsequent cyclic
loading
100 200 100 - 20
B6 250 200 100 - 40
B7 500 200 100 - 80
B8 100 200 100 - 40
B9 250 200 100 - 80
B10 500 200 100 - 160
C11
C
Monotonic and
cyclic loading under
various stress ratio
µ
250 100 100 0.00 100
C12 250 100 100 0.25 100
C13 250 100 100 0.5 100
C14 250 100 100 1.00 100
C15 250 100 100 1.25 100
Page 17 of 28C
an. G
eote
ch. J
. Dow
nloa
ded
from
ww
w.n
rcre
sear
chpr
ess.
com
by
QU
EE
NS
UN
IVE
RSI
TY
BE
LFA
ST o
n 11
/10/
17Fo
r pe
rson
al u
se o
nly.
Thi
s Ju
st-I
N m
anus
crip
t is
the
acce
pted
man
uscr
ipt p
rior
to c
opy
editi
ng a
nd p
age
com
posi
tion.
It m
ay d
iffe
r fr
om th
e fi
nal o
ffic
ial v
ersi
on o
f re
cord
.

Figure 1
279x230mm (96 x 96 DPI)
Page 18 of 28C
an. G
eote
ch. J
. Dow
nloa
ded
from
ww
w.n
rcre
sear
chpr
ess.
com
by
QU
EE
NS
UN
IVE
RSI
TY
BE
LFA
ST o
n 11
/10/
17Fo
r pe
rson
al u
se o
nly.
Thi
s Ju
st-I
N m
anus
crip
t is
the
acce
pted
man
uscr
ipt p
rior
to c
opy
editi
ng a
nd p
age
com
posi
tion.
It m
ay d
iffe
r fr
om th
e fi
nal o
ffic
ial v
ersi
on o
f re
cord
.

Figure 2
354x265mm (96 x 96 DPI)
Page 19 of 28C
an. G
eote
ch. J
. Dow
nloa
ded
from
ww
w.n
rcre
sear
chpr
ess.
com
by
QU
EE
NS
UN
IVE
RSI
TY
BE
LFA
ST o
n 11
/10/
17Fo
r pe
rson
al u
se o
nly.
Thi
s Ju
st-I
N m
anus
crip
t is
the
acce
pted
man
uscr
ipt p
rior
to c
opy
editi
ng a
nd p
age
com
posi
tion.
It m
ay d
iffe
r fr
om th
e fi
nal o
ffic
ial v
ersi
on o
f re
cord
.

Figure 3
396x455mm (96 x 96 DPI)
Page 20 of 28C
an. G
eote
ch. J
. Dow
nloa
ded
from
ww
w.n
rcre
sear
chpr
ess.
com
by
QU
EE
NS
UN
IVE
RSI
TY
BE
LFA
ST o
n 11
/10/
17Fo
r pe
rson
al u
se o
nly.
Thi
s Ju
st-I
N m
anus
crip
t is
the
acce
pted
man
uscr
ipt p
rior
to c
opy
editi
ng a
nd p
age
com
posi
tion.
It m
ay d
iffe
r fr
om th
e fi
nal o
ffic
ial v
ersi
on o
f re
cord
.
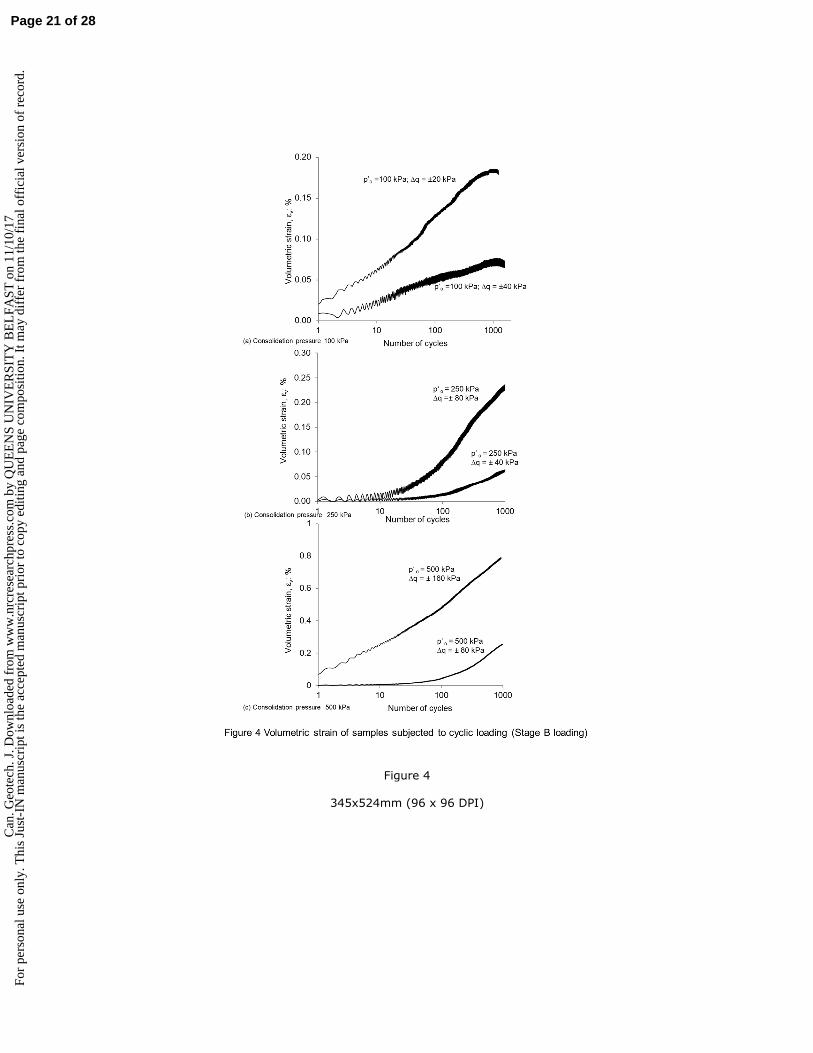
Figure 4
345x524mm (96 x 96 DPI)
Page 21 of 28C
an. G
eote
ch. J
. Dow
nloa
ded
from
ww
w.n
rcre
sear
chpr
ess.
com
by
QU
EE
NS
UN
IVE
RSI
TY
BE
LFA
ST o
n 11
/10/
17Fo
r pe
rson
al u
se o
nly.
Thi
s Ju
st-I
N m
anus
crip
t is
the
acce
pted
man
uscr
ipt p
rior
to c
opy
editi
ng a
nd p
age
com
posi
tion.
It m
ay d
iffe
r fr
om th
e fi
nal o
ffic
ial v
ersi
on o
f re
cord
.
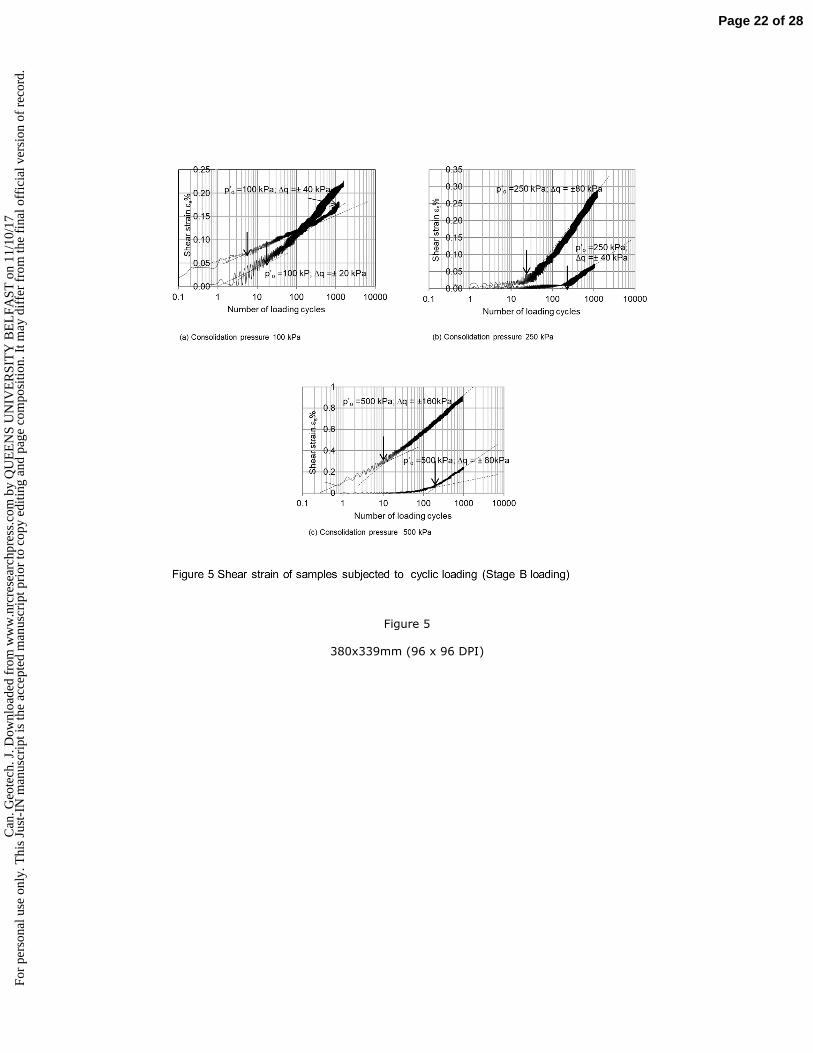
Figure 5
380x339mm (96 x 96 DPI)
Page 22 of 28C
an. G
eote
ch. J
. Dow
nloa
ded
from
ww
w.n
rcre
sear
chpr
ess.
com
by
QU
EE
NS
UN
IVE
RSI
TY
BE
LFA
ST o
n 11
/10/
17Fo
r pe
rson
al u
se o
nly.
Thi
s Ju
st-I
N m
anus
crip
t is
the
acce
pted
man
uscr
ipt p
rior
to c
opy
editi
ng a
nd p
age
com
posi
tion.
It m
ay d
iffe
r fr
om th
e fi
nal o
ffic
ial v
ersi
on o
f re
cord
.

Figure 6
335x243mm (96 x 96 DPI)
Page 23 of 28C
an. G
eote
ch. J
. Dow
nloa
ded
from
ww
w.n
rcre
sear
chpr
ess.
com
by
QU
EE
NS
UN
IVE
RSI
TY
BE
LFA
ST o
n 11
/10/
17Fo
r pe
rson
al u
se o
nly.
Thi
s Ju
st-I
N m
anus
crip
t is
the
acce
pted
man
uscr
ipt p
rior
to c
opy
editi
ng a
nd p
age
com
posi
tion.
It m
ay d
iffe
r fr
om th
e fi
nal o
ffic
ial v
ersi
on o
f re
cord
.

Figure 7
396x288mm (96 x 96 DPI)
Page 24 of 28C
an. G
eote
ch. J
. Dow
nloa
ded
from
ww
w.n
rcre
sear
chpr
ess.
com
by
QU
EE
NS
UN
IVE
RSI
TY
BE
LFA
ST o
n 11
/10/
17Fo
r pe
rson
al u
se o
nly.
Thi
s Ju
st-I
N m
anus
crip
t is
the
acce
pted
man
uscr
ipt p
rior
to c
opy
editi
ng a
nd p
age
com
posi
tion.
It m
ay d
iffe
r fr
om th
e fi
nal o
ffic
ial v
ersi
on o
f re
cord
.

Figure 8
396x250mm (96 x 96 DPI)
Page 25 of 28C
an. G
eote
ch. J
. Dow
nloa
ded
from
ww
w.n
rcre
sear
chpr
ess.
com
by
QU
EE
NS
UN
IVE
RSI
TY
BE
LFA
ST o
n 11
/10/
17Fo
r pe
rson
al u
se o
nly.
Thi
s Ju
st-I
N m
anus
crip
t is
the
acce
pted
man
uscr
ipt p
rior
to c
opy
editi
ng a
nd p
age
com
posi
tion.
It m
ay d
iffe
r fr
om th
e fi
nal o
ffic
ial v
ersi
on o
f re
cord
.

Figure 9
396x529mm (96 x 96 DPI)
Page 26 of 28C
an. G
eote
ch. J
. Dow
nloa
ded
from
ww
w.n
rcre
sear
chpr
ess.
com
by
QU
EE
NS
UN
IVE
RSI
TY
BE
LFA
ST o
n 11
/10/
17Fo
r pe
rson
al u
se o
nly.
Thi
s Ju
st-I
N m
anus
crip
t is
the
acce
pted
man
uscr
ipt p
rior
to c
opy
editi
ng a
nd p
age
com
posi
tion.
It m
ay d
iffe
r fr
om th
e fi
nal o
ffic
ial v
ersi
on o
f re
cord
.

Figure 10
396x340mm (96 x 96 DPI)
Page 27 of 28C
an. G
eote
ch. J
. Dow
nloa
ded
from
ww
w.n
rcre
sear
chpr
ess.
com
by
QU
EE
NS
UN
IVE
RSI
TY
BE
LFA
ST o
n 11
/10/
17Fo
r pe
rson
al u
se o
nly.
Thi
s Ju
st-I
N m
anus
crip
t is
the
acce
pted
man
uscr
ipt p
rior
to c
opy
editi
ng a
nd p
age
com
posi
tion.
It m
ay d
iffe
r fr
om th
e fi
nal o
ffic
ial v
ersi
on o
f re
cord
.

Figure 11
356x500mm (96 x 96 DPI)
Page 28 of 28C
an. G
eote
ch. J
. Dow
nloa
ded
from
ww
w.n
rcre
sear
chpr
ess.
com
by
QU
EE
NS
UN
IVE
RSI
TY
BE
LFA
ST o
n 11
/10/
17Fo
r pe
rson
al u
se o
nly.
Thi
s Ju
st-I
N m
anus
crip
t is
the
acce
pted
man
uscr
ipt p
rior
to c
opy
editi
ng a
nd p
age
com
posi
tion.
It m
ay d
iffe
r fr
om th
e fi
nal o
ffic
ial v
ersi
on o
f re
cord
.