Small-Molecule Targeting of E3 Ligase Adaptor SPOP in Kidney ...
25
Cancer Cell, Volume 30 Supplemental Information Small-Molecule Targeting of E3 Ligase Adaptor SPOP in Kidney Cancer Zhong-Qiang Guo, Tong Zheng, Baoen Chen, Cheng Luo, Sisheng Ouyang, Shouzhe Gong, Jiafei Li, Liu-Liang Mao, Fulin Lian, Yong Yang, Yue Huang, Li Li, Jing Lu, Bidong Zhang, Luming Zhou, Hong Ding, Zhiwei Gao, Liqun Zhou, Guoqiang Li, Ran Zhou, Ke Chen, Jingqiu Liu, Yi Wen, Likun Gong, Yuwen Ke, Shang-Dong Yang, Xiao-Bo Qiu, Naixia Zhang, Jin Ren, Dafang Zhong, Cai-Guang Yang, Jiang Liu, and Hualiang Jiang
Transcript of Small-Molecule Targeting of E3 Ligase Adaptor SPOP in Kidney ...

Cancer Cell, Volume 30
Supplemental Information
Small-Molecule Targeting of E3 Ligase
Adaptor SPOP in Kidney Cancer
Zhong-Qiang Guo, Tong Zheng, Baoen Chen, Cheng Luo, Sisheng Ouyang, ShouzheGong, Jiafei Li, Liu-Liang Mao, Fulin Lian, Yong Yang, Yue Huang, Li Li, JingLu, Bidong Zhang, Luming Zhou, Hong Ding, Zhiwei Gao, Liqun Zhou, GuoqiangLi, Ran Zhou, Ke Chen, Jingqiu Liu, Yi Wen, Likun Gong, Yuwen Ke, Shang-DongYang, Xiao-Bo Qiu, Naixia Zhang, Jin Ren, Dafang Zhong, Cai-Guang Yang, JiangLiu, and Hualiang Jiang
Supplemental Data
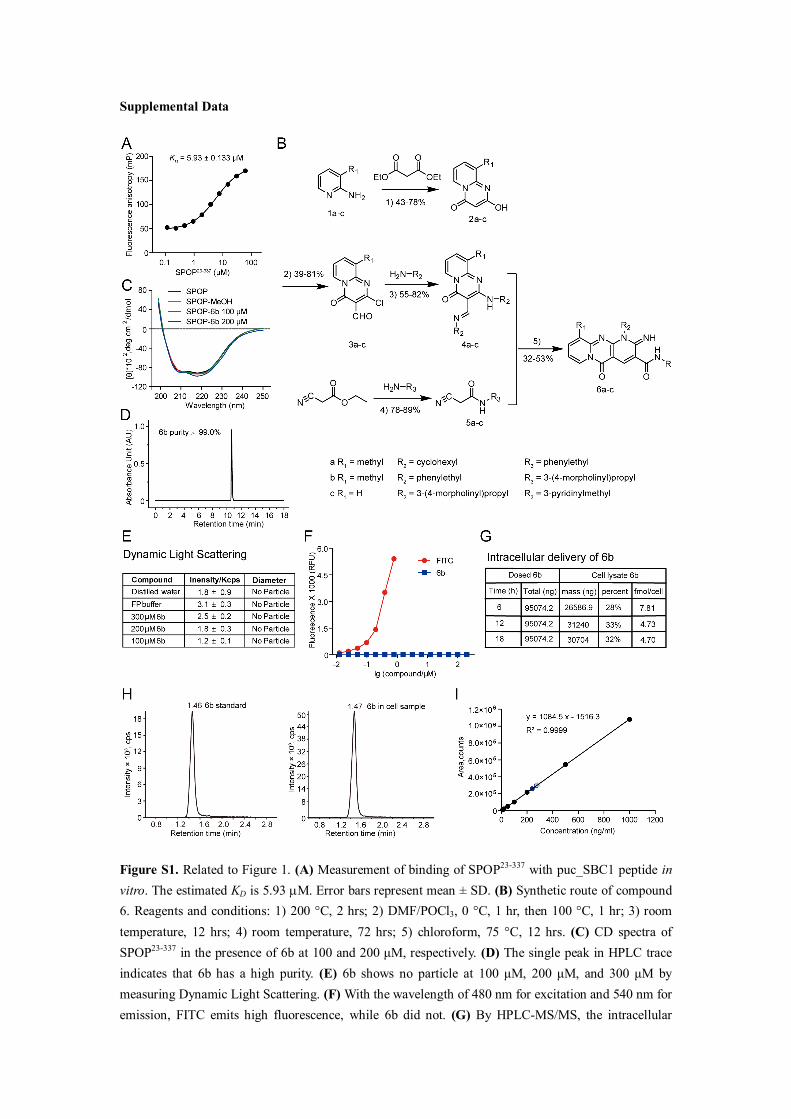
Figure S1. Related to Figure 1. (A) Measurement of binding of SPOP23-337 with puc_SBC1 peptide in vitro. The estimated KD is 5.93 M. Error bars represent mean ± SD. (B) Synthetic route of compound 6. Reagents and conditions: 1) 200 °C, 2 hrs; 2) DMF/POCl3, 0 °C, 1 hr, then 100 °C, 1 hr; 3) room temperature, 12 hrs; 4) room temperature, 72 hrs; 5) chloroform, 75 °C, 12 hrs. (C) CD spectra of SPOP23-337 in the presence of 6b at 100 and 200 μM, respectively. (D) The single peak in HPLC trace indicates that 6b has a high purity. (E) 6b shows no particle at 100 μM, 200 μM, and 300 μM by measuring Dynamic Light Scattering. (F) With the wavelength of 480 nm for excitation and 540 nm for emission, FITC emits high fluorescence, while 6b did not. (G) By HPLC-MS/MS, the intracellular

delivery of 6b is quantified to be around 30% penetration into A498 cells when dosed at 10 μM. The intracellular delivery of 6b is recorded at time course. (H) The HPLC peak diagram of 6b for standard curve, and sample analysis, respectively. The sample is extracted from cells treated with 10 μM 6b.The retention time of 6b in the cell lysate is identical to the standard compound. (I) The standard curve of 6b is calculated in HPLC and calibrated. R2 = 0.9999.


Figure S2. Related to Figure 2. (A) 6b binds to the full-length SPOP protein in SPR measurement. Graphs of equilibrium RU responses versus compound concentrations are plotted. The estimated KD is 19.0 μM. (B) 6c is unable to bind to SPOP23-337 protein in SPR experiment. (C) The T1ρ NMR spectra is shown for 6b (red), 6b with 5 μM (green), 6b with 10 μM (blue) SPOP23-337, respectively, indicating that 6b has interactions with SPOP23-337. (D) The STD spectrum for 6b is shown in the presence of 5 μM SPOP23-337. (E, F) In the presence of 5 μM SPOP23-337 (cyan), T1ρ NMR spectra and STD spectra show that 6c has no interaction with SPOP23-337. (G) T1ρ NMR spectra (top and middle panel) and STD data (down panel) for 6b. The T1ρ NMR spectrum is shown for 6b (red), 6b in the presence of 5 μM SPOP23-337 (K129A D130A W131A K133A) mutant (cyan), respectively. 6b displays a weak interaction with the SPOP23-337 mutant. (H) T1ρ NMR spectra (top and middle panel) and STD data (down panel) show that 6b has relatively weak interaction with SPOP23-337 (Y87A W131A) mutant assayed at 5 μM. (I) CD spectra of SPOP23-337, SPOP23-337(Y87A W131A) and SPOP23-337(K129A D130A W131A K133A), respectively. (J) Surface representatives of 6b (in cyan stick) bound in the hydrophobic pocket of SPOP (green). The putative interaction mode was docked on the basis of the measured binding affinities between 6b and different SPOP mutants. (K) Schematic diagram showing putative interactions between 6b and SPOP. Residues involved in the hydrophobic interactions are shown as starbursts, and hydrogen-bonding interactions are denoted by dotted green lines. (L) CETSA was performed in the presence of 20 μM and 5 μM 6c, when assayed in HEK293 cell lysate and intact cell, respectively.

Figure S3. Related to Figure 3. (A) Six ccRCC cell lines and one non-tumor HK-2 cell line were assayed for cell proliferation in the presence of 6b-HCl. (B) Effect of 6b on the cell viability of different cancer cell lines. 6b inhibits cell proliferation of other cell lines with much higher IC50 than that of A498 cells. (C) A498 cells with SPOP knockdown become resistant upon treatment with 6b. The cellular abundance of the SPOP protein was detected by Western blot. After 72 hrs, the cell viability was assayed and the percentage of each stable cell lines treated with 6b was normalized to that treated with DMSO. (D) 6b-HCl represses the cell viability of primary cells isolated from seven clinical ccRCC patients. The assays were performed in triplicate, and error bars represent mean ± SD.

Figure S4. Related to Figure 4. (A) 6b-HCl disrupts SPOP-PTEN protein interaction in HEK293 cell as detected in the Co-IP experiment. GAPDH is used as a loading control. (B) PTEN ubiquitination was assayed in HEK293 cells in the presence of SPOP inhibitors. The ubiquitination of PTEN is almost completely abolished in the presence of 5 μM 6b-HCl. 6c did not impair the ubiquitination of PTEN at 5 μM. (C) Representative Western blots to show the effect of 6b-HCl on SPOP-signaling pathway. 6b-HCl inhibits the degradation of PTEN and DUSP7 in a concentration-dependent manner in A498 cells. The down-stream p-AKT (Thr308) and p-ERK1/2 proteins are also quantified for reduction in abundance. (D) 6b or 6b-HCl could not induce the accumulation of PTEN and DUSP7 proteins or decrease p-AKT and p-ERK1/2 levels in HK-2 cells, in which SPOP protein is not misallocated within the cytoplasm. (E) RT-qPCR detection to show the cellular levels of transcription of SPOP, PTEN, or DUSP7 gene in A498 cells exposure to 3 μM 6b or 6b-HCl for 12 hrs. The assays were performed in triplicate, and Error bars represent mean ± SD. SPOP inhibitors do not alter cellular levels of transcription of SPOP, PTEN, or DUSP7 gene. (F) 6b could not inhibit the self-ubiquitination of RNF5 in HEK239T cells. HEK293T cells were transfected with Flag-RNF5. 32 hrs after transfection, cell lysates were extracted and RNF5 (R5) was immunoprecipitated by anti-Flag resins. The self-ubiquitination of RNF5 was detected by immunoblotting using anti-Ub and anti-Flag antibodies. Indicated dosage of 6b was added for 12 hrs after 32 hrs of Flag-RNF5 transfection.

Figure S5. Related to Figure 5. (A) 6b effectively distributes to the blood serum after intraperitoneal administration. The concentrations of 6b in serum were measured after the intraperitoneal administration of 80 mg/kg to nude mice. Blood samples were collected at several time points after the intraperitoneal administration and the 6b concentrations in plasma were quantitated by LC-MS/MS. (B) The body weight of female (n = 3, left graph) and male BALB/c mice (n = 3, right graph) treated with different dosages of 6b daily for 6 days. (C) The weight of different organs (heart, liver, spleen, lung,

and kidney) in BALB/c mice treated with vehicle or 80 mg/kg/day 6b for 6 days. (D) The body weight of female (n = 3, left graph) and male ICR mice (n = 3, right graph) treated with 80 mg/kg 6b-HCl daily for 7 days. (E) Volume measurements of A498 xenograft tumors treated with vehicle or 6b-HCl at the indicated dosages for 21 days. Changes in the mean tumor volume are given relative to the untreated tumor volumes. (F) Tumor weight distribution at day 21 of A498 xenograft tumors treated with a vehicle or 6b-HCl. (G) Body weight from nude mice treated with either vehicle or 6b-HCl is shown. (H) Body weight from nude mice treated with either vehicle or 6b are shown. (I) Histological morphology of H&E-stained tissue sections of representative nude mice in 6b-treated or vehicle control groups. The results of H&E staining show no significant differences between the vehicle and the compound-treated groups, suggesting the low toxicity of 6b. Error bars represent mean ± SD. P values are obtained by unpaired t-test.
Table S1. The Pharmacokinetic results of the nude mice after the intraperitoneal administration of 80 mg/kg 6b, related to Figure 5.
Tmax (hr) Cmax (ng/ml) AUC0-t
(hr × ng/ml) AUC0-∞
(hr × ng/ml) MRT (hr) t1/2 (hr)
0.5 1070 3321 3515 6.96 6.52
Table S2. CBC analysis of BALB/c mice (n = 3) treated with 6b for 6 days, related to Figure 5.
Test Name (units)
Reference (low-high)
Vehicle control (♀)
(Mean±SD)
80 mg/kg (♀) 6b (Mean±SD)
Vehicle control (♂)
(Mean±SD)
80 mg/kg (♂) 6b
(Mean±SD) WBC (×109/L) 2.6-10.1 4.68±1.00 11.64±2.76 5.1±0.48 13.26±4.40
LYMPH (109/L) 1.3-8.4 3.20±0.54 2.12±0.24 3.40±0.56 2.26±0.75
MONO (109/L) 0-0.3 0.09±0.03 0.37±0.06 0.07±0.03 0.39±0.16 NEUT (109/L) 0.4-2.0 1.16±0.37 8.97±2.80 1.50±0.45 10.04±2.81 RBC (1012/L) 6.5-10.1 10.22±0.29 10.18±0.65 11.6±0.98 11.03±1.01
MCV (fL) 42.3-55.9 44.10±0.70 44.50±0.66 42.43±0.57 41.83±1.00 HCT (%) 32.8-48 45.07±0.61 45.30±2.65 49.17±3.87 46.13±3.93 MCH (pg) 13.7-18.1 15.40±0.10 15.40±0.20 15.03±0.25 15.13±0.15
MCHC (g/L) 295-351 349.0±6.24 345.33±4.16 354.67±3.51 362.00±13.23 RDW-SD (fL) 29.50±0.52 32.20±1.04 28.13±1.53 27.30±1.75 RDW-CV (%) 0-99.9 21.87±0.38 22.93±0.40 22.53±1.19 22.37±1.81
HGB (g/L) 100-161 157.3±4.62 156.33±8.08 174.3±12.50 167.00±15.87 EO (109/L) 0.23±0.07 0.17±0.11 0.18±0.02 0.55±0.68
BASO (109/L) 0.00±0.01 0.01±0.00 0.01±0.01 0.01±0.01
Table S3. CBC analysis of ICR mice (n = 3) treated with 6b-HCl for 7 days, related to Figure 5.
Test Name (units)
Vehicle Control (♀) (Mean±SD)
80 mg/kg (♀) 6b-HCl
(Mean±SD)
Vehicle Control (♂) (Mean±SD)
80 mg/kg (♂) 6b-HCl
(Mean±SD)

RBC (1012/L) 8.350±0.469 7.650±0.607 8.530±0.277 7.507±0.794 HGB (g/L) 125.7±8.6 112.7±9.3 129.0± 3.6 111.3±12.7 HCT (%) 41.10±2.72 36.23±2.20 41.80± 1.31 36.17±3.96 MCV (fL) 49.20±0.56 47.43±1.01 49.03± 0.67 48.27± 0.32 MCH (pg) 15.07±0.32 14.70±0.10 15.13± 0.12 14.83±0.21
MCHC (g/L) 306.3±4.0 310.0±7.5 309.0± 1.0 307.7±6.5 RDW (%) 14.83±0.42 14.73±0.78 14.23± 0.38 13.90±0.10
RET (109/L) 380.63±40.30 225.97±37.29 351.80± 50.01 331.50±63.37 PLT (109/L) 1155.7±66.0 1258.0±18.5 987.3± 56.3 990.7±168.2
WBC (109/L) 2.180±0.468 4.493±0.904 3.647± 0.250 3.983±0.746 NEUT (109/L)
0.473±0.145 2.020±0.389 0.543±0.061 1.303±0.352
LYMP (109/L)
1.617 ±0.563 2.197±0.441 2.933±0.227 2.423±0.421
MONO (109/L)
0.017±0.006 0.063±0.031 0.027± 0.006 0.037±0.038
EOS (109/L) 0.033± 0.021 0.050±0.020 0.073± 0.015 0.073±0.023 BASO (109/L)
0.010±0.000 0.387±0.360 0.037± 0.015 0.043±0.006
Table S4. Plasma biochemical analysis of ICR mice (n = 3) treated with 6b-HCl for 7 days, related to Figure 5.
Test Name (units)
Vehicle Control (♀) (Mean±SD)
80 mg/kg (♀) 6b-HCl
(Mean±SD)
Vehicle Control (♂) (Mean±SD)
80 mg/kg (♂) 6b-HCl
(Mean±SD) ALT (U/L) 41.67± 20.37 32.83±26.86 29.17± 5.60 23.93±0.67 AST (U/L) 87.30±42.59 106.57±58.99 80.77± 31.22 117.10±45.60 ALP (U/L) 77.3± 11.4 31.3±1.5 81.3±10.1 30.0±6.2 CK (U/L) 782.7±630.1 368.7±45.7 496.0±273.5 627.0±330.2
TBIL (µmol/L) 3.60± 1.51 1.93±0.42 2.13±0.15 3.10±1.47 GLU (mmol/L) 9.253±3.088 9.467±0.665 11.430±3.003 11.510±1.049
UREA (mmol/L)
14.37±4.11 6.07±0.35 10.20±1.87 8.30±0.72
CREA (µmol/L) 7.3±1.2 7.7±2.5 9.0±0.0 7.7±0.6 TG (mmol/L) 0.833±0.594 0.347±0.065 0.660±0.217 0.293±0.067
CHOL (mmol/L)
1.667± 0.349 1.940±0.061 1.293±0.032 1.320±0.010
TP (g/L) 44.70± 2.01 43.00±2.43 49.30± 2.25 44.30±1.39 ALB (g/L) 28.90± 3.70 22.20±1.73 35.13±1.26 25.20±1.77
GLOB (g/L) 15.80±2.04 20.80±0.90 14.17±1.25 19.10±1.20 A/G 1.87± 0.40 1.03±0.06 2.50± 0.17 1.30±0.17

A
B

C
D

E
F

G
H

I
Figure S6. Related to Synthesis of Inhibitors used in the study in the section of Supplemental Procedures. NMR spectrum of the synthesized compounds. (A) 1H NMR (400 MHz, CDCl3) spectrum of compound 6a. (B) 13C NMR (126 MHz, CDCl3) spectrum of compound 6a. (C) 1H NMR (500 MHz, CDCl3) spectrum of compound 6b. (D) 1H NMR (600 MHz, DMSO-d6) spectrum of compound 6b. (E)
13C NMR (126 MHz, CDCl3) spectrum of compound 6b. (F) 1H NMR (400 MHz, CD3OD) spectrum of compound 6b-HCl. (G) 13C NMR (126 MHz, CDCl3) spectrum of compound 6b-HCl. (H) 1H NMR (400 MHz, CDCl3) spectrum of compound 6c. (I) 13C NMR (126 MHz, CDCl3) spectrum of compound 6c.
Supplemental Procedures
Pharmacophore Modelling. To construct three-dimensional pharmacophore model for SPOP-substrate interactions, peptide ADSTT from SPOP substrate MacroH2A.1 (PDB entry: 3IVB) was chosen as template. Catalyst module in LigandScout2.0.2 program was used to create pharmacophore and seven features were derived (Wolber and Langer, 2005). Next we collected available structures of SPOP-substrate complexes (PDB entries: 3HQH, 3HSV, 3HQI, 3HQL, 3HU6, 3IVV, 3HQM and 3IVQ) and generated pharmacophores using the same method. Four common pharmacophore characteristics that existed in all models were selected: one lipophilic aromatic area, one H-bond donor and two H-bond acceptors. In addition, centers of residues within 6Å around ADSTT motif were defined as exclusion sphere restraints to avoid collision. 2251 hits from SPECS database were identified after primary screening based on the pharmacophore model using DiscoveryStudio2.1 (Accelrys Inc., San Diego, CA).
Molecular Docking. We employed molecular docking to estimate the tightness of the interaction between small molecules and SPOP pocket in the secondary screening. To minimize bias, we evaluated three molecular docking programs (DOCK 4.0 (Ewing et al., 2001), AutoDock 3.0 (Morris et al., 1998) and Glide (Friesner et al., 2004)) by comparing reproducing SBC motif poses with the X-ray conformation. It turned out that the accuracy was Glide>AutoDock>Dock, therefore Glide was chosen for further docking. As mentioned in pharmacophore modeling, there were nine complex structures available in Protein Data Bank, and our following step was to determine the inputs in order to achieve better performance. Among the nine structures, 3HQM showed lowest Gscore (lower Gscore predicts better binding affinity) suggesting that it had relatively superior capability to identify potential hits under tested parameters.
The receptor structure was prepared for docking by refining hydrogen atoms, assigning ionization and tautomeric states and reorienting side chains (Maestroversion 7.5, Schrödinger, LLC, NY, 2005). The position of carbon atom of serine from ADSTT motif was defined as ligand center and surrounding residues within 10Å radius sphere were treated as binding sites to generate receptor grids. Then 479 molecules with lowest Gsocre were selected after docking simulation. Pipeline Pilot (Accelrys Inc., San Diego, CA) was employed to analyze their chemical scaffold diversity. Finally, 109 compounds with diverse scaffolds were chosen for further inhibition activity assessment.
Molecular Similarity Calculation. Given the remarkable activity of original hit, SHAFTS algorithm (Liu et al., 2011) was applied to measure molecular properties matching to discover molecules possessing similar binding potential. SHAFTS adopts hybrid strategy by considering both molecular geometric and chemistry characteristics to calculate maximum overlays between targets and the query molecules. Subsequently, 97 molecules from SPECS database with hybrid similarity score greater than 1 were selected to evaluate their inhibitory activity.
Proteins Expression and Purification. The DNA sequence encoding wild-type SPOP (residues 23-337 and 1-374) and mutations were cloned into the BamHI-XhoI restriction sites of the modified pET 23a with MBP-tag (Invitrogen). The Escherichia coli BL21 (DE3) strain was transformed with the recombinant plasmids and grown at 37 °C in Lysogeny broth (LB) medium in the presence of 100 μg/ml ampicillin. When the A600 reached 0.6, protein expression was induced by isopropyl

β-D-1-thiogalactopyranoside (IPTG) with a final concentration of 0.5 mM for an additional 16 h at 16 °C. The cells were harvested by centrifugation at 5,000 × g for 10 min and stored at -80 °C until use.
For protein purification, the cells were suspended in 35 ml lysis buffer (20 mM Tris-HCl (pH 7.5), 150 mM NaCl, 1 mM DTT), lysed by sonification, and then centrifuged at 13,000 × g for 25 min at 4 °C. The supernatant was then passed through 0.45 μm syringe filters and loaded onto HisTrap HP columns (5 ml, GE Healthcare), washed with five column volumes of 30 mM imidazole, and eluted with 300 mM imidazole. Proteins were concentrated via centrifugal filtration (Millipore) with a molecular weight cutoff of 10 kDa and the concentration was determined. N-terminal MBP-His tag was cleaved by TEV protease following a standard protocol (GE Healthcare), and then loaded onto HisTrap HP columns to remove MBP-His tag by affinity chromatography. Further purification was conducted through gel filtration on HiLoad 16/60 Superdex200 columns (GE Healthcare). The eluted proteins were analyzed by 12% (w/v) SDS/PAGE, and purity was estimated at >95%. Combined protein was concentrated and stored in buffer (20 mM HEPES (pH 7.5), 150 mM NaCl, and 30% (v/v) glycerol) at −80 °C.
Fluorescence Polarization (FP) Assay. FITC-labeled peptide substrate puc_SBC1 (FITC-puc_SBC1, FITC-LACDEVTSTTSSSTA) was purchased (GL Biochem Ltd, Shanghai). Serial dilutions of competitors for SPOP23-337 were prepared from the 20 mM DMSO stocks. The diluted compound was added to the reaction mixture in 100 μl of HEPES (25 mM, pH 7.5) containing 10 μM SPOP23-337 and 50 nM FITC-puc_SBC1. After incubation for 1 hr at 4 °C, FP was measured on an Envision Multilabel Plate Reader (Perkin Elemer) using the wavelengths of 480 nm for excitation and 535 nm for emission, respectively. Each reaction was repeated for three times. Binding or competitive parameters were calculated from nonlinear regression using GraphPad Prism 5.0.
In vitro Pull-down Assay. For in vitro SPOP and PTEN interaction, SPOP23-337 protein was purified from the bacterial lysates of BL21 competent cells as His-MBP fusions expressed by a modified pET 23a with MBP-tag, using the MBP-Agarose beads according to the manufacturer’s standard procedures. The MBP-SPOP protein bound to MBP sepharose beads was then incubated with His-PTEN protein for 2 hrs at 4°C in the binding buffer (20 mM Tris pH 7.5, 150 mM NaCl) with or without compound, washed by the wash buffer (20 mM Tris, pH 7.5, 150 mM NaCl, 1% Triton-X100) for seven times, and subjected to 12 % SDS-PAGE, followed by Western blot.
Pan Assay Interference Compounds (PAINS) Test. Purity: Compound 6b standard solution was analyzed on agilent1200 HPLC system with a Phenomenex Luna 5 μm C18 analyses column (150 × 4.6 mm). The purity was calculated form the area percentage.
Dynamic Light Scattering (DLS): Compound 6b was diluted into buffer (25 mM HEPES, 100 mM NaCl, pH 7.5) and incubated at room temperature for 30 min. After a 0.22 μm membrane filtration, the samples were loaded to measure the grain diameter with a Zetasizer ZEN3690 analyzer (Malvern UK). Fluorescence: Compound 6b and FITC were series diluted into buffer (25mM HEPES, pH 7.5), and fluorescence intensity was measured on a Microplate Reader at the wavelength of 480 nm for excitation and 540 nm for emission, respectively CD: Compound 6b dissolved in methanol were incubated with 10 μM SPOP23-337 protein and subsequently the mixture was checked on a J-810 Spectropolarimeter to measure the circular dichroism

spectrum.
Quantification of Cellular 6b. The Prominence LC-20A HPLC system coupled with an Applied Biosystems 6500 QTrap mass spectrometer operated in ESI-positive form were used in order to analyze the cellular concentration of compound 6b. The precursor ion and product ion m/z were 501.2 and 386.03, respectively. A498 cells were harvested after exposure in the mediums with 10 μM 6b for 6, 12, and 18 hrs, respectively, and then washed thrice with phosphate buffered saline buffer. The cells were then diluted to 100 μl with water containing 0.1% formic acid (v/v), followed by the addition of 400 μl of cold methanol, vortexed sharply and combined with several shock freeze-thaw cycles. Samples were centrifuged and the supernatant was collected and dried using a vacuum evaporator. The residue was dissolved in 100 μl methanol and centrifuged at 10,000 g at 4 °C for 20 min in order to obtain a clear extract for analysis with a Gemini C18 (50 × 2.0 mm) column. The mobile phase binding buffer (2 mM ammonium formate in 0.05% formate) and elution buffer (methanol) were gradient mixed.
Surface Plasmon Resonance (SPR). SPR technology-based binding assays were performed using a Biacore T200 instrument (GE Healthcare) with running buffer HBS-EP (10 mM HEPES (pH 7.4), 150 mM NaCl, 3 mM EDTA, and 0.5% (v/v) surfactant P20,5% DMSO) at 25 °C. The wild-type SPOP were covalently immobilized onto sensor CM5 chips by a standard amine-coupling procedure in 10 mM sodium acetate (pH 4.5). Compounds were serially diluted and injected onto a sensor chip at a flow rate of 30 μl/min for 120 s (contact phase), followed by 120 s of buffer flow (dissociation phase). The KD value was derived using Biacore T200 Evaluation software Version 1.0 (GE Healthcare) and steady state analysis of data at equilibrium.
Nuclear Magnetic Resonance (NMR). Ligand observed T1ρ and saturation transfer difference (STD) NMR experiments were performed to investigate ligand−protein interactions. All NMR spectra were acquired at 25 °C on a Bruker Avance III-600 MHz (proton frequency) spectrometer equipped with a cryogenically cooled probe (Bruker biospin, Germany). Samples containing 200 μM compound and 200 μM compound in addition of 2.5 μM, 5 μM or 10 μM SPOP. Compound and protein were dissolved in phosphate buffer (20 mM sodium phosphate, pH 7.4, 100 mM NaCl, 10% DMSO) and then used in NMR data acquisition.
Cell Culture. The human kidney proximal tubular epithelial cell line HK-2, the human embryonic kidney cell line HEK293, and ccRCC cell lines A498, Caki-2, 786-O, 769-P were purchased from ATCC (Rockville, MD, USA). The other two ccRCC cell lines, OS-RC-2 and Ketr-3, were purchased from the National Platform of Experimental Cell Resources for Sci-Tech (Beijing, China). HK-2 was maintained in Keratinocyte Serum Free Medium (K-SFM), supplied with bovine pituitary extract (BPE) and human recombinant epidermal growth factor (EGF) (Gibco, #17005-042). HEK293, A498, and Ketr-3 were maintained in Dulbecco's modified Eagle's medium (DMEM) supplemented with 10% (v/v) fetal bovine serum (FBS) (Gibco). 786-O, 769-P, and OS-RC-2 were maintained in RPMI1640 medium supplemented with 10% (v/v) FBS. Caki-2 was maintained in McCoy's 5a modified medium supplemented with 10% (v/v) FBS. All cells were tested for mycoplasma contamination and cultured at 37 °C in a humidified, 5% CO2-containing-atmosphere incubator (Thermo Scientific).
Generation of Stable SPOP Knockdown Cell Lines. For SPOP knockdown, SPOP shRNA Lentiviral vector (TCR Number: TRCN0000139181) and shRNA control Lentiviral vector (SHC202V) were

purchased from Sigma. A498 cells were infected with the lentivires and selected with 2 μg/ml puromycin. Untransfected A498 cells were also placed under the same selection. While untransfected A498 cells exhibited extensive cell death about 1 week, the infected cells developed puromycin-resistant clones, indicating a proportion of stably infected cells. SPOP knockdown efficiency was analyzed by Western blot. The mixed cell populations were used in the experiments.
Cellular Thermal Shift Assay (CETSA). Cellular thermal shift assay was conducted according to the protocol as previously described (Jafari et al., 2014). HEK293 cells were transiently transfected with the p3 × Flag-CMV10-SPOP vector for 48 hrs. For intact cell assay, after treated with 5 μM SPOP inhibitors or DMSO for 1 hr, HEK293 cells were collected and washed with PBS buffer several times to avoid excess compound residue. Distribute each cell suspension into different 0.2 ml PCR tubes (~1 million cells per tube). Then denature samples at various temperatures for 3 min on PCR instrument (Eppendorf), and freeze-thaw the cells twice using liquid nitrogen. Samples were centrifuged and the supernatants were analyzed by Western blot. For cell lysate assay, HEK293 cells were collected and harvested with RIPA lysis buffer. Then, 20 μM SPOP inhibitors or DMSO was added to the supernatant and incubated at 25 ºC for 30 min. After denaturing at various temperatures for 3 min, samples were centrifuged and the supernatants were analyzed by Western blot. All experiments were performed in triplicate.
Real-time Quantitative PCR (RT-qPCR). Total RNA was extracted using Trizol reagent (Sigma) according to the manufacturer’s instructions. The concentration and purity of RNA were verified spectroscopically. After quantification, equivalent amounts of RNA were reversed transcribed into cDNA using GoScript Reverse Transcription System (Promega). RT-qPCR was performed using the Power SYBR Green PCR Master Mix (Applied Biosystems) in the CFX96 Touch Real-Time PCR Detection System (Bio-Rad). Gene expression was calculated using the comparative ΔΔCT method with the housekeeping gene GAPDH for normalization. The primers used are as follows: SPOP, gccctctgcagtaacctgtc (forward), gtctccaagacatccgaagc (reverse); DUSP7, tctgactgctccgacggcga (forward), ccttggcgcagccgaggtag (reverse); PTEN, ttgagccgctgtgaggcgag (forward), agccgaggaagaggctgcac (reverse); GAPDH, cgaccactttgtcaagctca (forward), ccctgttgctgtagccaaat (reverse).
Cell Proliferation Assay. Cell proliferation was tested using the CellTiter-Blue Reagent (Promega) according to the manufacturer’s instructions. ccRCC cells (1,000 - 5,000/well) were seeded into 96-well plates and cultured for 12 hrs before fresh medium containing different concentration of SPOP inhibitors was added. Cells were cultured for an additional 72 hrs, and then we added 20 l CellTiter-Blue reagent to each well, incubated the plate for 4 hrs at 37 °C. Fluorescence was determined on a Labsystems Fluoroskan Ascent plate reader (Thermo, Boston, USA) using the wavelengths of 560 nm for excitation and 590 nm for emission, respectively.
Co-immunoprecipitation (Co-IP) and Immunoblotting (Western blot). HEK293 cells were transiently transfected with the indicated plasmids. 36 hrs after transfection, cells were treated with different dosages of SPOP inhibitors for 12 hrs. The cells were harvested with RIPA lysis buffer (50 mM Tris-HCl, pH 7.4, 150 mM NaCl, 1% Triton X100, 1 mM EDTA, 1 mM NaF, 1 mM Na3VO4 and 1 × proteinase inhibitor cocktail (Sigma, P8340)) at 4 °C. Lysates were immunoprecipitated with anti-myc-conjugated agarose beads (Sigma, rabbit antibody) for 4 hrs. Beads were washed 7 times

using the lysis buffer and analyzed on SDS–PAGE.
For whole cell lysates, cells were washed several times with ice-cold phosphate-buffered saline (PBS), scraped in lysis buffer as mentioned above, and centrifuged at 14,000 g for 20 min. Protein concentration of the supernatants was quantified using a BCA assay (CWbiotech, China). SDS-PAGE was carried out with equal amount of whole-cell lysate from each sample. The proteins in SDS-PAGE were transferred onto nitrocellulose membrane and blocked with 5% skim milk for 1 hr at room temperature. The membrane was incubated with primary antibody overnight at 4 °C. HRP-labeled Goat Anti-mouse or Anti-rabbit IgG was used as secondary antibody. The membrane was visualized using the ECL detection system (GE Healthcare Bioscience, USA). Equivalent amounts of total protein were monitored by GAPDH.
In vivo Ubiquitination Assay. In vivo ubiquitination assay was conducted according to the protocol as previously described. Briefly, HEK293 cells were transfected in 60 mm dishes with 1 µg each of the following constructs: myc-PTEN or myc-DUSP7, Flag-SPOP-cyto, HA-Ub. 36 hrs after transfection, cells were treated with different dosages of SPOP inhibitors. 8 hrs later, cells were treated with 10 μM MG132 (Calbiochem) for 4 hrs before harvesting. Cells were harvested in denaturing buffer (1% SDS, 50 mM Tris-HCl, pH 7.5, 0.5 mM EDTA, 1 mM DTT). The lysate was incubated for 5 min at 100 ºC immediately, and then sonicated and diluted 10 times with RIPA lysis buffer. The lysate was subjected to co-immunoprecipitation using anti-c-myc-conjugated agarose beads as described in Co-IP assay.
Human Tissue Samples and Primary Cells. All human tissue samples were obtained from individuals undergoing kidney resection at the Peking University First Hospital (Beijing, China). All subjects provided written informed consent, and approval for the study was obtained from the Ethical Committee of the Beijing Institute of Genomics, CAS.
Tumor samples were shredded and minced in a small amount of PBS. The shredded tissue was treated with enzyme contain 0.14% collagenase and 0.01% hyaluronidase in a 37 oC shaking bath for 30 min. After digestion, the dissociated cells were filtered through a 40 μm mesh (BD Falcon). Cells were centrifuged for 5 min at 200 g, and washed twice with PBS. Cells were re-suspended in DMEM/F-12 1:1 medium (Gibco) with 15% (v/v) FBS and then plated onto 6 well plates. Primary cells were used in cell proliferation assay about 7 days later.
Toxicity Study. 6 to 8-week-old BALB/c and ICR mice were obtained from Shanghai SLAC Laboratory Animals Co. Ltd. and Shanghai Sippr-BK Laboratory Animal Co. Ltd. (Shanghai, China). Mice were randomly grouped and treated daily with either vehicle control or compounds (80 and 120 mg/kg) intraperitoneally for 6 or 7 days. Peripheral blood samples were collected for hematological analysis and plasma biochemical analysis. The vital organs (heart, kidney, lung, liver and spleen) were collected and weighed.
Pharmacokinetics. The compound was formulated in 0.9% saline solution containing 0.5% 2-phenylethanol and 1.5% Tween-80, 8 g/l of 6b. Nude mice (BALB/c nu, male 4 - 6 weeks old) were treated intraperitoneally with 10 ml/kg formulated compound. One blood sample of approximately 0.15 ml was taken from each mouse (n = 3 mice per time point) by retro-orbital bleeding. Blood samples were collected at 0.25, 0.5, 1, 2, 4, 6, 10 and 24 hrs after the intraperitoneal administration. Blood was

collected into EDTA-containing tubes and plasma was obtained by centrifugation at 2,000 g for 5 min. All procedures were according to standard operating procedures approved by the Institutional Animal Care and Use Committee (IACUC), Shanghai Institute of Materia Medica, Chinese Academy of Sciences. 6b concentrations in plasma were quantitated by LC-MS/MS method. Noncompartmental analysis with Phoenix 1.3 (Pharsight, USA) was used for all analytical measurements. Area under the concentration-time curve (AUC) was calculated using trapezoidal method. AUC0-∞= AUC0-t + Ct/ke, ke is elimination rate constant. Elimination half life (t1/2) = 0.693/ke, mean residence time (MRT) = AUMC/AUC.
Liquid Chromatography-tandem Mass Spectrometry (LC-MS/MS) for Quantification of 6b In Plasma. The concentrations of compound 6b in plasma were quantitated by LC-MS/MS method using a standard curve prepared in blank plasma. Briefly, 20 μl of plasma was treated with 400 μl of methanol. A 3.0 μl aliquot of supernatant is injected using the Prominence LC-20A HPLC system. Mobile phase A was water with 2 mM ammonium formate (contain 0.05% formic acid). Mobile phase B was methanol. Flow rate was 500 μl/min using linear gradients (0-1.0 min from 80% A/20% B to 50% A/50% B, 1 - 1.5 min is 50% A/50% B, 1.5 - 1.6 min from 50% A/50% B to 80% A/20% B, 1.6 - 3 min is 80% A/20% B). An API6500 mass spectrometer equipped with ion spray source was used for all analytical measurements. Peak areas of the analyst were detected using positive ion mode with the mass transition of m/z 501→357.
H&E Staining. Tumor tissues were fixed in 4% formaldehyde solution and processed routinely for paraffin embedding. Sections were cut at around 4 µm thickness and placed on glass slides, and counterstained with hematoxylin and eosin.
Statistical Analysis. Values are expressed as mean ± SD. The statistical significance of the data was analyzed using t-test using the GraphPad Prism 5.0 software. P < 0.05 was considered as significant.
Synthesis of Inhibitors. General methods: All solvents and reagents were purchased from commercial sources and used as received. 1H NMR and 13C NMR spectra were recorded with a Varian-MERCURY Plus-400 NMR spectrometer at room temperature. NMR spectra were calibrated to the solvent signals of deuterated DMSO-d6 or CDCl3. Chemical shifts are reported in ppm (δ scale) as referenced to TMS and coupling constant (J) values are reported in hertz (Hz). Data are presented as follows: chemical shift, multiplicity (s = singlet, d = doublet, dd = doublet of doublet, t = triplet, q = quartet, m = multiplet, br = broad), coupling constant in Hz, and integration. Low-resolution electrospray ionization mass spectrometry (LRESI) was recorded on a Finnigan LCQ/DECA spectrometer, and high-resolution electrospray ionization mass spectrometry (HRESI) was recorded on a Micromass Ultra Q-TOF spectrometer. Flash and column chromatography was performed using silica gel (230–400 mesh). Analytical TLC was performed silica gel plates and visualized under ultraviolet light (254 nm).
General procedure of the synthesis of 2-Imino-1-substituted-3-Carboxamido-10 -substituted-4-oxo-3H-1,2-dihydropyrido-[1,2-a]pyrimido[4,5-b]pyrimidine. As shown in Supplementary Figure S2, starting with the 2-aminopyridine 1, cyclization reaction between compound 1 and diethyl malonate achieved second ring closure to yield compound 2. The pyrido [1,2-a]-pyrimidine nucleus can be functionalized by the Vilsmeier-Haack reaction to yield product 3.

Condensation of compound 3 with 2-phenylethylamine in ethanol generated intermediate 4. Cyclization between compound 4 and cyanoacetamide 5 achieved third ring closure to yield target compound 6.
1. Procedure of the synthesis of 9-substituted pyrido [1,2-a]-pyrimidine 2. The mixture of 2-aminopyridine 1 (0.05 mole) and diethyl malonate (12 g, 0.075 mole) was heated at 200 °C for 2 hrs during which time ethanol was distilled. The residue was washed with ethanol and the solid precipitate was collected and recrystallized from hot ethanol to give the pure product 2 in a yield of 43-78% (Ingalls and Popp, 1967).
9-methyl-2-hydroxyl-4-oxo-3H-pyrido-[1,2-a]pyrimidine (2a-b) 1H NMR (400 MHz, DMSO-d6): δ 11.46 (s, 1H), 8.78 (d, J = 7.2 Hz, 1H), 7.82 (d, J = 6.9 Hz, 1H), 7.15 (t, J = 7.0 Hz, 1H), 5.39 (s, 1H), 2.42 (s, 3H).
2, 3-dihydro-2,4-dioxopyrid [1,2-a]pyrimidine (2c) 1H NMR (400 MHz, CDCl3): δ 10.66 (s, 1H), 8.32 (d, J = 3.9 Hz, 1H), 8.06 (d, J = 8.2 Hz, 1H), 7.83 – 7.74 (m, 1H), 7.12 (dd, J = 6.3, 4.9 Hz, 1H), 3.65 (s, 1H).
2. Procedure of the synthesis of 9-substituted2-chloro-3-formyl-4-oxo-3H-pyrido [1,2-a] pyrimidine 3. To an ice-cooled DMF (25 ml) was added phosphorus oxychloride (40 mmol) slowly. The reaction mixture was stirred at 0 °C for 30 min, then slowly warmed to room temperature and stirred for 1 hr, followed by the addition of compound 2 (10 mmol) at 0 °C. The reaction was stirred for 1 hr, then warmed to room temperature for 1 hr and then refluxed for 1 hr, then poured into the ice water and stirred for 1 hr. The precipitate was filtered and washed thoroughly with cold water. The solid was recrystallized from ethanol to afford compound 3 in a yield of 39-81% (George et al., 1971).
9-methyl-2-chloro-3-formyl-4-oxo-3H-pyrido [1,2-a] pyrimidine (3a-b) 1H NMR (400 MHz, CDCl3): δ 10.44 (s, 1H), 9.15 – 9.07 (m, 1H), 7.94 (d, J = 7.0 Hz, 1H), 7.34 (t, J = 7.0 Hz, 1H), 2.66 (s, 3H).
2-chloro-3-formyl-4-oxo-4H-pyrido [1,2-a] pyrimidine (3c) 1H NMR (400 MHz, DMSO-d6): δ 10.66 (s, 1H), 8.32 (d, J = 4.7 Hz, 1H), 8.06 (d, J = 8.2 Hz, 1H), 7.83 – 7.70 (m, 1H), 7.12 (dd, J = 6.9, 5.3 Hz, 1H).
3. Procedure of the synthesis of 2,9-substituted amino-3-(N-substituted) formimidoyl-4-oxo-3H-pyrido-[1,2-a]pyrimidine 4. To an ice-cooled anhydrous ethanol (15 ml) was added phenethylamine (10 mmol) and compound 3 (40 mmol). The reaction mixture was stirred at 0 °C for 1 hr, then warmed slowly to room temperature and stirred overnight. The precipitate was filtered and washed thoroughly with ethanol. The solid was dissolved in dichloromethane and filtered. The filtrate was evaporated under reduced pressure to afford compound 4 in a yield of 55-82%.
9-methyl-2-cyclohexylamino-3-(N-cyclohexyl)formimidoyl-4-oxo-3H-pyrido-[1,2-a]pyrimidine (4a) 1H NMR (400 MHz, CDCl3): δ 11.01 (s, 1H), 8.90 (s, 1H), 8.77 (d, J = 7.6 Hz, 1H), 7.42 (d, J = 7.0 Hz, 1H), 6.72 (t, J = 6.9 Hz, 1H), 2.41 (s, 3H), 2.01 (t, J = 12.9 Hz, 3H), 1.77 (t, J = 10.7 Hz, 8H),
1.52 – 1.37 (m, 11H).

9-methyl-2-phenylethylamino-3-(N-phenylethyl)formimidoyl-4-oxo-3H-pyrido-[1, 2-a]pyrimidine (4b) 1H NMR (400 MHz, CDCl3): δ 10.69 (s, 1H), 8.85 (s, 1H), 8.78 (d, J = 7.0 Hz, 1H), 7.47 (d, J = 6.6 Hz, 1H), 7.37 – 7.27 (m, 5H), 7.23 (dd, J = 10.6, 5.9 Hz, 5H), 6.77 (t, J = 7.0 Hz, 1H), 3.80 (dt, J = 15.8 , 7.1 Hz, 4H), 2.88 (dt, J = 22.8, 7.4 Hz, 4H), 2.47 (s, 3H), 1.26 (s, 1H).
2-phenylethyamino-3-(N-phenylethy)formimidoyl-4-oxo-3H-pyrido-[1,2-a]pyrimidine (4c) 1H NMR (400 MHz, CDCl3): δ 10.74 (s, 1H), 8.87 (d, J = 4.7 Hz, 2H), 7.66 – 7.52 (m, 1H), 7.23 (dd, J = 9.0, 0.5 Hz, 1H), 6.85 (td, J = 7.1, 1.3 Hz, 1H), 3.70 (s, 2H), 3.68 (s, 1H), 3.61 (dd, J = 20.4, 6.2 Hz, 5H), 2.50 – 2.37 (m, 14H), 1.83 (dt, J = 14.2, 7.0 Hz, 6H).
4. Procedure of the synthesis of N-(substituted)cyanoacetamide 5. To a solution of amine (100 mmol) was added ethyl cyanoacetate (110 mmol), and the mixture was refluxed for 3 days. The crude product was extracted with 5 ml ether 4 times. The combined ether solution was evaporated to afford the intermediate 5 in a yield of 78-89%.
2-cyano-N-(2-phenylethyl)acetamide (5a) 1H NMR (400 MHz, CD3OD): δ 8.32 (s, 1H), 7.29 (dd, J = 7.7, 6.9 Hz, 2H), 7.20 (dd, J = 7.4, 5.8 Hz, 3H), 3.58 (s, 2H), 3.29 (m, 2H), 2.71 (t, J = 7.3 Hz, 2H).
2-cyano-N-[3-(4-morpholinyl)propyl]-acetamide (5b) 1H NMR (400 MHz, CDCl3): δ 3.84 – 3.69 (m, 4H), 3.42 (dt, J = 11.3, 5.6 Hz, 2H), 3.35 (s, 2H), 2.47 (m, 6H), 1.87 (s, 1H), 1.72 (q, J = 6.1 Hz, 2H).
2-cyano-N-(3-pyridinylmethyl)acetamide (5c) 1H NMR (400 MHz, CDCl3): δ 8.46 (dd, J = 4.5, 1.7 Hz, 2H), 7.64 (d, J = 8.3 Hz, 1H), 7.27 (dd, J = 8.1, 4.5 Hz, 1H), 4.43 (d, J = 5.9 Hz, 2H), 3.68 (dt, J = 8.4, 6.3 Hz, 1H), 1.21 (dt, J = 7.0, 1.3 Hz, 2H).
5. Procedure of the synthesis of 2-imino-1,3,10-(substituted)-4-oxo-3H-1,2-dihydropyrido-[1,2-a]pyrimido[4,5-b]pyrimidine 6. To a solution of intermediate 4 (2.03 g, 0.01 mol) in chloroform (15 ml), was added the solution of intermediate 5 (0.72 g, 0.011 mol) in chloroform. The mixture was refluxed for 2 hrs. The yellow crystalline product 6 was filtered and recrystallized from methanol-chloroform. The yield of pure compound 6 is about 32-53%.
2-imino-1-cyclohexyl-3-(N-phenylethyl)carboxamino-10-methyl-4-oxo-3H-1,2-dihydropyrido-[1,2-a]pyrimido[4,5-b]pyrimidine (6a) 1H NMR (400 MHz, CDCl3): δ 11.07 (s, 1H), 8.86 (d, J = 7.1 Hz, 1H), 7.62 (dt, J = 6.9 and 1.5 Hz, 1H), 7.37-7.17 (m, 6H), 6.98 (t, J = 7.0 Hz, 1H), 3.69 (ddd, J = 7.6, 6.6, 5.5 Hz, 2H), 2.93 (t, J = 7.3 Hz, 2H), 2.58 (s, 3H), 1.96 (d, J = 10.0 Hz, 2H), 1.80 (d, J = 12.4 Hz, 3H), 1.63 (s, 3H), 1.54-1.39 (m, 2H), 1.36-1.21 (m, 2H); 13C NMR (126 MHz, CDCl3): δ 23.12, 24.08, 39.86, 49.45, 53.59, 55.15, 66.94, 96.32, 114.67, 119.85, 125.56, 126.20, 126.88, 128.03, 128.50, 135.95, 138.08, 144.32, 150.47, 153.55, 154.81, 155.76, 163.00; LRESI m/z (% relative abundance) 456.1 ([M+H]+, 100); HRESI m/z calcd for C27H29N5O2 [M+H]+ 456.2403, found 456.2394.
2-imino-1-(N-phenylethyl)-3-(3-(N- propyl-(N-morpholinyl))carboxamino)-10-methyl- 4-oxo-3H-1,2-dihydropyrido-[1,2-a]pyrimido[4,5-b]pyrimidine (6b) 1H NMR (500 MHz, CDCl3): δ 8.90 (d, J = 7.0 Hz, 1H), 7.68 (d, J = 6.8 Hz, 1H), 7.35 (s, 4H), 7.26 (d, J = 5.3 Hz, 1H), 7.03 (t, J = 7.0 Hz, 1H), 4.65 (s, 2H), 3.74 (t, J = 4.5 Hz, 4H), 3.54 (d, J = 5.6 Hz, 2H), 3.07 (t, J = 8.1 Hz, 2H), 2.61 (s,

3H), 2.51 (s, 6H), 1.89 – 1.78 (m, 4H), 1.27 (s, 1H); 1H NMR (600 MHz, DMSO-d6) δ 9.16 (s, 1H), 8.79 (d, J = 6.9 Hz, 1H), 8.71 (s, 1H), 8.01 – 7.86 (m, 2H), 7.38 – 7.20 (m, 6H), 4.66 – 4.53 (m, 2H), 3.59 (t, J = 4.3 Hz, 4H), 3.34 (s, 2H), 3.27 (d, J = 5.4 Hz, 2H), 3.03 – 2.88 (m, 2H), 2.53 (s, 2H), 2.44 – 2.31 (m, 5H), 1.77 – 1.62 (m, 2H); 13C NMR (126 MHz, CDCl3): δ 18.20, 25.48, 32.78, 38.78, 43.45, 53.76, 57.44, 58.31, 66.98, 95.53, 114.25, 120.06, 126.11, 126.68, 128.69, 128.77, 133.97, 137.03, 138.40, 150.09, 152.89, 155.41, 156.13, 164.50; LRESI m/z (% relative abundance) 501.3 ([M+H]+, 100); HRESI m/z calcd for C28H32N6O3 [M+H]+ 501.2621, found 501.2614.
2-imino-1-(N-phenylethyl)-3-(3-(N- propyl-(N-morpholinyl))carboxamino)-10-methyl - 4-oxo-3H-1,2-dihydropyrido-[1,2-a]pyrimido[4,5-b]pyrimidine (6b-HCl) 1H NMR (400 MHz, CD3OD): δ 9.10 (d, J = 0.5 Hz, 1H), 8.99 (d, J = 7.0 Hz, 1H), 8.07 (d, J = 7.0 Hz, 1H), 7.39 (t, J = 7.0 Hz, 1H), 7.31 (d, J = 7.0 Hz, 2H), 7.23 (t, J = 7.4 Hz, 2H), 7.15 (t, J = 7.3 Hz, 1H), 5.02 (s, 2H), 4.05 (s, 2H), 3.85 (s, 2H), 3.55 (t, J = 6.6 Hz, 4H), 3.33 – 3.27 (m, 5H), 3.19 (t, J = 7.5 Hz, 4H), 2.63 (s, 3H), 2.15 (dt, J = 14.7, 6.7 Hz, 2H); 13C NMR (126 MHz, CDCl3): δ 18.20, 25.66, 32.78, 38.60, 43.45, 53.76, 57.41, 58.31, 66.98, 95.52, 114.25, 120.06, 126.11, 126.68, 128.69, 128.77, 133.97, 137.03, 138.40, 150.09, 152.89, 155.41, 156.13, 164.82; LRESI m/z (% relative abundance) 501.3 ([M+H]+, 100); HRESI m/z calcd for C28H32N6O3 [M+H]+ 501.2627, found 501.2614.
2-imino-1-(N-propyl-(N-morpholinyl))-3-((3-pyridinylmethyl)carboxamino)-4-oxo-4H-1,2-dihydropyrido-[1,2-a]pyrimido[4,5-b]pyrimidine (6c) 1H NMR (400 MHz, CDCl3): δ 11.88 (t, J = 6.0 Hz, 1H), 9.07 (s, 1H), 9.01 (d, J = 7.1 Hz, 1H), 8.63 (d, J = 1.4 Hz, 1H), 8.51 (dd, J = 4.6, 1.0 Hz, 1H), 8.07 (s, 1H), 7.82 – 7.71 (m, 2H), 7.50 (t, J = 8.7 Hz, 1H), 7.11 (td, J = 6.9, 1.4 Hz, 1H), 4.68 (d, J = 5.6 Hz, 2H), 4.36 (s, 2H), 3.77 (t, J = 4.7 Hz, 4H), 2.50 (s, 4H), 2.42 (t, J = 6.2 Hz, 2H), 1.94 (q, J = 7.0 Hz, 2H), 1.69 (s, 1H) ; 13C NMR (126 MHz, CDCl3): δ 25.47, 41.40, 42.54, 55.02, 56.63, 68.38, 97.85, 116.20, 120.88, 124.85, 127.05, 129.56, 136.12, 136.84, 137.85, 139.67, 149.89, 150.25, 152.02, 155.09, 156.29, 157.22, 165.73; LRESI m/z (% relative abundance) 474.2 ([M+H]+, 100); HRESI m/z calcd for C25H27N7O3 [M+H]+ 474.2245, found 474.2254.

Supplemental References
Ewing, T. J., Makino, S., Skillman, A. G., and Kuntz, I. D. (2001). DOCK 4.0: search strategies for automated molecular docking of flexible molecule databases. J. Comput. Aided. Mol. Des. 15, 411-428. Friesner, R. A., Banks, J. L., Murphy, R. B., Halgren, T. A., Klicic, J. J., Mainz, D. T., Repasky, M. P., Knoll, E. H., Shelley, M., Perry, J. K., et al. (2004). Glide: A new approach for rapid, accurate docking and scoring. 1. Method and assessment of docking accuracy. J. Med. Chem. 47, 1739-1749. George, T., Mehta, D. V., and Dabholka.Da (1971). Synthesis of Pyrido[1,2-a]Pyrimido[4,5-B]Pyridine and Related Tricyclic Systems. J. Org. Chem. 36, 2192-2196. Ingalls, E. A., and Popp, F. D. (1967). The preparation, structure and reactions of some “malonyl-α-aminopyridines". J. Heterocyclic Chem. 4, 523-526. Jafari, R., Almqvist, H., Axelsson, H., Ignatushchenko, M., Lundback, T., Nordlund, P., and Martinez Molina, D. (2014). The cellular thermal shift assay for evaluating drug target interactions in cells. Nat. Protoc. 9, 2100-2122. Liu, X. F., Jiang, H. L., and Li, H. L. (2011). SHAFTS: A Hybrid Approach for 3D Molecular Similarity Calculation. 1. Method and Assessment of Virtual Screening. J. Chem. Inf. Model. 51, 2372-2385. Morris, G. M., Goodsell, D. S., Halliday, R. S., Huey, R., Hart, W. E., Belew, R. K., and Olson, A. J. (1998). Automated docking using a Lamarckian genetic algorithm and an empirical binding free energy function. J. Comput. Chem. 19, 1639-1662. Wolber, G., and Langer, T. (2005). LigandScout: 3-D pharmacophores derived from protein-bound ligands and their use as virtual screening filters. J. Chem. Inf. Model. 45, 160-169.