SMALL ISLAND DEVELOPING STATES IN NUMBERSunohrlls.org/custom-content/uploads/2017/09/SIDS... ·...
44
SMALL ISLAND DEVELOPING STATES IN NUMBERS UPDATED CLIMATE CHANGE EDITION 2017 Office of the High Representative for the Least Developed Countries, Landlocked Developing Countries and Small Island Developing States (UN-OHRLLS)
Transcript of SMALL ISLAND DEVELOPING STATES IN NUMBERSunohrlls.org/custom-content/uploads/2017/09/SIDS... ·...

SMALL ISLANDDEVELOPING STATESIN NUMBERSUPDATED CLIMATE CHANGE
EDITION 2017
Office of the High Representative for the LeastDeveloped Countries, Landlocked DevelopingCountries and Small Island Developing States(UN-OHRLLS)

01 02
PG. 8PG. 4
• About ‘SIDS In Numbers 2017’
• What are SIDS?• Climate Change in SIDS
• Economic Losses • Cost of Inaction• Climate Finance• Impact of Climate
Change on Economic Sectors
– Fisheries & Marine Resources
– Tourism
ECONOMICINTRODUCTION
Fron
t cov
er: P
apua
New
Gui
nea,
Ste
ven
Now
akow
ski,
New
Zea
land
MFA
T.
Beliz
e Ba
rrier
Ree
f, Be
lize
Caye
Cau
lker
Bel
ize d
rone
.

03 04 05
TABLE OF CONTENTS
1
PG. 38PG. 31PG. 18
• SIDS on the Frontline of a Changing Climate
• Sea-Level Rise: Implications for SIDS
• Extreme Weather Events
• Natural Resources – Coral Reefs – Freshwater – Biodiversity
• Public Health• Migration and
Displacement• Natural World Heritage
Listed Sites• Food Security
• References• Acknowledgements
KEY POINTSSOCIALENVIRONMENT

2
ABBREVIATIONS
AAL Average Annual Loss
AIMS Atlantic, Indian Ocean, Mediterranean and South China Sea
AOSIS Alliance of Small Island States
AR5 Fifth Assessment Report by IPCC
BPOA Barbados Progamme of Action
COP Conference of the Parties
DRR Disaster Risk Reduction
ENSO El Ñino Southern Oscillation
EVI Environmental Vulnerability Index
GHG Greenhouse gas(es)
IPC Intergovernmental Panel on Climate Change
LDCs Least Developed Countries
NASA National Aeronautics and Space Administration
PIPA Phoenix Island Protected Area
RCP Representative Concentration Pathways
SAMOA Pathway SIDS Accelerated Modalities of Action Pathway
SIDS Small Island Developing States
SPREP Secretariat of the Pacific Regional Environment Programme
UN United Nations
UN-DESA United Nations Department of Economic and Social Affairs
UNEP United Nations Environment Programme
UNFCCC United Nations Framework Convention on Climate Change
UNISDR United Nations Office for Disaster Risk Reduction
UN-OHRLLS United Nations Office of the High Representative for Least Developed Countries, Least Developed Countries and Small Island Developing States
UNU-EHS United Nations University – Institute for Environment and Human Security
WMO World Meteorological Organization

UN-OHRLLS @UNOHRLLShttp://unohrlls.org/FIND US:
3
UN-OHRLLS MANDATE
The UN Office of the High Representative for the Least Developed Countries, Landlocked Developing Countries and Small Island Developing States (UN-OHRLLS) was established by the United Nations General Assembly in 2001 through its resolution 56/227 with functions recommended by the Secretary-General in paragraph 17 of his report A/56/645.
The UN-OHRLLS mandate from the General Assembly calls upon the Office to engage in advocacy and mobilization of international support and resources for the implementation of the Programme of Action for Small Island Developing States (SIDS), known also as the Barbados Programme of Action (BPOA). The latter outcome is known as the Mauritius Strategy for Implementation of the Programme of Action for the Sustainable Development of Small Island Developing States (MSI).
With the successful conclusion of the Third International Conference on SIDS in 2014, the office’s mandate was further amplified to ensure the mainstreaming of the Samoa Pathway and issues related to SIDS in the work of the United Nations system and to enhance the coherence of the issues of those States in United Nations processes, including at the national, regional and global levels.

4
INTRODUCTION
1. About ‘SIDS In Numbers 2017 – Climate Change’
The Paris Climate Agreement is the first-ever universal, legally binding document on climate change which was adopted by 195 countries at the Paris climate conference (COP21) in December 2015. It has set precedence for greater collaboration in the global efforts to combating climate change and adapt to its impact, thereby rekindling hopes for safer climate regimes. During the COP21 negotiations on the Paris Climate Agreement, SIDS continued to highlight the special circumstances and particular vulnerability they face with the onset of climate change and stated that they wanted the agreement to recognize their special circumstances. As of 8 May 2017, 32 out of the 38 SIDS are State Parties to the Paris Agreement. While this renewed commitment from Members States is welcome, SIDS continue experiencing the consequences of climate change often with adverse effects such as rises in temperature and sea level.
SIDS In Numbers – Updated Climate Change Edition 2017 provides, at a glance, a snapshot of select key SIDS indicators under the three dimensions of sustainable development: Environment, Social, and Economic, to highlight the impacts of climate change on SIDS.
The presentation of the data and statistics contained in this publication should not be taken as authoritative. They are being presented in a manner that attempts to illustrate and advocate for the special case of SIDS in the context of climate change. Data was obtained from a variety of sources, including the IPCC’s AR5 on Climate Change published in 2013, The World Bank’s Report “Turn Down The Heat”, recent publications by various UN agencies including UNEP, UNISDR, UNDESA and from the broader scientific community.
The data used in this publication is exclusively obtained from publicly available sources. While extensive literature on climate change and related issues exist on a global scale, SIDS regions and individual countries in general remain under-researched. As a consequence, specific data on climate change impacts in SIDS is often sparsely available.

5
2. What are SIDS?
SIDS are a distinct group of 38 UN Member States and 20 Non-UN Members/Associate Members of regional commissions facing unique social, economic and environmental vulnerabilities. The three geographical regions in which SIDS are located are the: Caribbean, Pacific, and the Atlantic, Indian Ocean and South China Sea (AIMS).
SIDS were recognized as a special case both for their environment and development at the 1992 United Nations Conference on Environment and Development held in Rio de Janeiro, Brazil. This recognition was made specifically in the context of Agenda 21 (Chapter 17 G). In 1994, the Barbados Programme of Action (BPOA) prescribed specific actions enabling SIDS to achieve sustainable development and in 2005, the Mauritius Strategy for further Implementation of the BPOA was adopted to address remaining gaps in implementation.
In 2014, the international community gathered in Samoa for the Third International Conference on Small Island Developing States to forge a new pathway for the sustainable development of this group of countries. The SAMOA Pathway, recognizes the adverse impacts of climate change and sea-level rise on SIDS’ efforts to achieve sustainable development as well as to their survival and viability, and addresses economic development, food security, DRR and ocean management, among other issues. While many SIDS have made advances in achieving sustainable development, their inherent vulnerabilities including small size, remoteness, climate change impacts, biodiversity loss and narrow resource base mean that progress for many continues to be hampered, and their special case status remains.

6
3. Climate Change and SIDS
As recognized in the Barbados Programme of Action for the Sustainable Development of SIDS adopted in 1994, SIDS are particularly vulnerable to global climate change1. Their climate is influenced by large ocean-atmosphere interactions such as trade winds, El Niño, monsoons and tropical cyclones. With populations, agricultural lands and infrastructure tending to be concentrated in the coastal zone, any rise in sea-level will have significant and profound effects on settlements, living conditions and island economies2. These climate characteristics, combined with their particular socio-economic situations make SIDS, among which are 9 LDCs, some of the most vulnerable countries in the world to climate change. In addition, the fact that SIDS have a combined population of around 65 million people contributing to less than 1 percent of global GHG emissions, means that they will suffer disproportionately from the damaging impacts of climate change3 and that some may become uninhabitable.
1 Barbados Plan of Action (BPOA), 1994. 2 UNFCCC, 2007.3 UNFCCC, 2007.
Western Province, Solom
on Islands, Wade Fairley.

7
Tim
or-L
este
, Oec
usse
. Lou
ise
Stod
dard
.

8
ECONOMIC
Given SIDS’ unique economic vulnerabilities such as a narrow resource base, remoteness from markets, and limited ability to benefit from economies of scale, it comes as no surprise that climate change puts additional burden on their respective economies. In particular, damages incurred due to climate-related phenomena are often enormous in comparison to their economies’ sizes and they experience great difficulties trying to raise funds for adaptation and mitigation measures4. In particular, high public debt levels constrain SIDS governments in their ability to invest in public infrastructure development and climate change adaptation measures. SIDS typically need to borrow further funds to address the loss of earnings resulting from disasters, and invest in disaster relief, reconstruction and infrastructure improvements to accommodate higher sea-levels.
The economic costs of climate change for small states are projected at 15 percent of GDP or more. For Caribbean small states, a one-meter sea-level rise by 2080 is projected to result in losses and damages of about 8 percent of projected GDP (Simpson et al., 2010). For Pacific island small states, a sea level rise of between 1 and 1.7 meters is projected to result in an economic impact of between 3 and 15 percent of GDP due to lost agricultural production, tourism and fisheries and infrastructure damage (Asia Development Bank, 2013). These figures compare with projections for market and nonmarket losses and damages for the global economy ranging from 1 to 4 percent of output for a 4°C increase in global mean temperature.

9
4 IPCC, 2014.5 DARA and the Climate Vulnerability Forum, Fundacion DATA Internacional, 2010.
1. Economic Losses & Cost of Inaction
The estimated economic stresses, globally due to climate change, project losses of USD 63 billion per year starting in 2010. This impact will rise by more than 100 percent to USD 157 billion each year by 20305. Average Annual Losses (AAL) as a percentage of GDP is much higher in SIDS compared with the global average as shown in Chart 1 below. In the climate change negotiations in Paris, SIDS called for an international mechanism on Loss and Damage which they argued must be a central and distinct element of the Paris Agreement. The resulting standalone article 8 of the Paris Agreement speaks to this call.
Perc
enta
ge
of
GD
P
Vanu
atu
7
6
5
4
3
2
1
0
Tong
a
Sol
omon
Isla
nds
Fede
rate
d S
tate
sof
Mic
rone
sia
Mar
shal
l Isl
ands
Sam
oa
Pala
u
P apu
a N
ew G
uine
a
Tuva
lu
Tim
or-L
este
Wor
ld a
vera
geFiji
Chart 1. Worst affected by the consequences of climate change
by share of GDP: Pacific Region

10
2. Cost of Inaction
SIDS may choose between several options to adapt to and combat climate change impacts. These options range from complete inaction to managed retreat to more proactive adaptation measures such as coastal engineering. In order to help decision-making, calculations are typically undertaken using a variety of different scenarios. With regard to inaction, i.e. if governments decide against any form of action to combat the impacts of climate change, the cost of inaction in the Caribbean alone is projected to amount to over US$22 billion annually by 2050 and US$46 billion by 2100 - equalling 10 percent and 22 percent of the current size of the Caribbean economy6.
3. Climate Finance
Sixteen dedicated climate funds are active in the SIDS (see Chart 3). A total of USD 798 million was approved for 172 projects between 2003 and 2015. The biggest contributor of finance is the Pilot Program for Climate Resilience (PPCR), which approved USD 179 million for SIDS between 2003 and 2015. The second largest contributor is the Least Developed Countries Fund (LDCF), which approved USD 135 million. Multilateral sources provide the most funding for SIDS (USD 701 million or 88%).
Perc
enta
ge
of
GD
P
25%
20%
207520502025 2100
15%
10%
5%
0
Cost of Inaction as a % of GDP (Carribean SIDS)
Chart 2. Inaction could prove extremely costly and
will only grow more expensive in the future: Caribbean SIDS
6 US Center; Global Development Institute, 2008.

11
Climate change financing for small island developing states is also growing, but from a low base. Climate finance increased significantly after COP15, but the overall amount remains small, reaching less than US$1 billion in 2014 (see Table 1). A majority of small states financing is for climate change mitigation, falling short of adaptation needs. Although COP16 placed increased emphasis on adaptation for low-income and small developing countries, mitigation still accounts for some 58 percent of total climate change financing for small developing states. According to the most recent estimates, global adaptation costs are 2 to 3 times higher than international public finance available for this purpose and to close this gap adaptation finance would have to be between 6 to 13 times larger by 2030 (United Nations, 2016).
Amount approvedProjects approved (right axis)
USD
mill
ion
Proj
ects
app
rove
d
0
200
160
120
80
40
0
50
45
40
35
30
25
20
15
10
5
PPCRLDCF
GCCAAF
Norway’s I
CFIGCF
GEF5SCCF
CTF
Germany’s I
CI
SPREPFCPF
GEF6GEF4
UN-REDD
Australia
’s IFCI
ASAP
Chart 3. Funds supporting SIDS (2003-16)
Funds and Initiatives Amount Approved (Current USD millions)
Projects approved
Pilot Programme for Climate Resilience (PPCR) 217.18 17
Least Developed Countries Fund (LDCF) 187.22 49
Green Climate Fund (GCF) 170.68 4
Adaptation Fund (AF) 72.78 10
Global Climate Change Alliance (GCCA) 71.59 16
Norway’s International Climate Forest Initiative (ICFI) 65.95 1
Global Environment Facility (GEF 5) 41.1 19
Scaling up Renewable Energy Programme (SREP) 39.4 5
Global Environment Facility (GEF 6) 36.97 13
Special Climate Change Fund (SCCF) 36.1 6
Clean Technology Fund (CTF) 36 6
Global Environment Facility (GEF 4) 32.21 17
Germany’s International Climate Initiative (ICI) 27.73 9
Forest Carbon Partnership Facility (FCPF) 27.7 9
Adaptation for Smallholder Agriculture Programme (ASAP) 11.5 3
United Nations REDD+ Programme (UNREDD) 6.93 2
Australia’s International Forest Carbon Initiative (IFCI) 3.04 1
Note: Bilateral fund data correct as of 2014.
Source: Heinrich Böll Stiftung North America, 2016.

12
Asset replacement costs arise out of inaction in preparing for climate change impacts. The total value of infrastructure, buildings, and cash crops considered at some level of risk in the Pacific is estimated at over US$111 billion. In the Pacific Region, the asset replacement cost is on average 4 times greater than the GDP (in 2013), for some countries such as Timor-Leste the ratio of asset replacement cost is 14 times their GDP.
7 FAO, 2014.8 FAO, 2014.
Table 1. Climate Change Financing to SIDS in 2014 (US$ millions)
Source: IMF, 2016.
Perc
enta
ge
of
foo
d in
to
tal i
mp
ort
s (%
)
Asset replacement costVa
nuat
u
Tuva
luFiji
Fede
rate
d S
tate
sof
Mic
rone
sia
Kiri
bati
Mar
shal
l Isl
ands
Pala
u
P apu
a N
ew G
uine
a
Sam
oa
Sol
omon
Isla
nds
Tim
or-L
este
Tong
a
15
10
5
0
Chart 4. The asset replacement costs due to climate change
impacts is several folds greater than the GDPs of SIDS: Pacific SIDS

13
Kiribati. AusAID.
4. Impact of Climate Change on Economic Sectors
Due to their relative remoteness and size, many SIDS have a relatively narrow resource base to drive their industrial development. A few key industries including fisheries, tourism and agriculture help in contributing a significant share to national GDP. The adverse impact of climate change make SIDS’ already open and exposed economies even more vulnerable.
Fisheries & Marine Resources
Many SIDS are in fact large ocean States. Their vast ocean spaces comprise a significant portion of the world’s ocean – on average 28 times more than their actual land space. For example, the Republic of Kiribati has the 13th largest exclusive economic zone on Earth. Typically, oceans, more specifically the oceanic and coastal fishing industry, represent an important source of nutrition and revenue for SIDS populations.

14
Figure 1. Warming oceans are reshaping fisheries
Source: Cheung, Watson, & Pauly, 2013.
In the Pacific SIDS, the fishing industry contributes up to 10 percent of total GDP. Of the total 2.4 million tonnes of tuna caught in the Western Pacific Ocean, 58 percent had been caught in the waters of Pacific SIDS, generating a total of USD 2.8 billion
9 Cheung, Watson, & Pauly, 2013.
% of GDP
Vanuatu
Kiribati
0 10 20 30 40 50 60 70
Tonga
Solomon Islands
Maldives
Micronesia
Marshall Islands
Cook Islands
Palau
Papua New Guinea
Tuvalu
Fiji
Share of fish export in GDP (2013)
Chart 5. Export in fisheries: A significant source of income for many SIDS

15
in revenues7. In the CARICOM countries alone, more than 64,000 people are directly employed in small-scale fisheries and aquaculture, with another approximately 200,000 people working indirectly in fishing related activities including: processing, retail, boat construction and net repair. The main fish producing countries in the Caribbean were Guyana (31 percent of total production), Suriname (21 percent), the Bahamas (11 percent) and Trinidad and Tobago (7 percent)8.
The impact of climate change could fundamentally alter the fishing industry in SIDS. Marine species are gradually moving away from the equator into cooler waters, and, as a result, species from warmer waters are replacing those traditionally caught in many fisheries worldwide. These shifts could have negative effects including loss of traditional fisheries, decreased in profits and jobs, conflicts over new fisheries that emerge because of distribution shifts, food security concerns and a large decrease in catch in the tropics9.
0
10
20
30
40
50
60
Share of tourism on total GDP Percentage
Source: UN-Data, The World Bank, online statistical databases.
Note: The chart shows only those countries for which data were available
Tourism in SIDS
Haiti
São Tomé and Principe
Guyana
Trinidad and Tobago
Dominican Republic
Singapore
Tonga Jamaica
Fiji
St. Vincent and the Grenadines
Note: figures refer to most recent year available (2007 or 2008)
Dominica
Grenada
Cape Verde
Belize
St. Kitts and Nevis
St. Lucia
The Bahamas
MauritiusBarbados
Antigua and Barbuda
Seychelles
Maldives
Suriname
PopulationTourists
8 700
2 00050050
Annual tourist arrivals
Figure 2. Tourism-dependent Islands – share of tourism in GDP
Source: GRID-Arendal, 2013.
10 IPCC, 2014.11 EP/GRID-Geneva and ZMT Leibniz Center for Tropical Marine Biology, 2014.

16
Tourism
The social, economic and environmental well-being of many SIDS is tied to the tourism sector. Revenues generated by the tourism sector and tourism related activities represent an important source of income for many SIDS10. The Caribbean SIDS in particular base most of their livelihoods on revenues from tourism. Annually, about 12 percent of the total labour force, i.e. approximately 2 million people, are estimated to work in the Caribbean tourist sector, generating around 47 billion USD of revenue in 2012, i.e. 14 percent of GDP and 25 billion USD of exports, 15 percent of total exports11.
Research on sea-level rise has shown that as much as 29 percent of major resort properties in the CARICOM countries would be partially or fully inundated by a one-meter sea-level rise. Furthermore, about 49 percent are estimated to be damaged or destroyed by combined sea-level rise and storm surge and sea-level rise-enhanced erosion given their lack extensive coastal protection in order to preserve aesthetics of natural beach areas and views to the sea12. Across the Caribbean, Moore et al. (2010) estimate that by 2050 visitor expenditures could decline from US$ 25 to US$ 15 billion as a direct result from the consequences of climate change on the area13.
US
D M
illio
ns 3,000
2,500
2,000
1,500
1,000
500
2025 20752050
Year
2100
Projected loss from tourism in USD millions
Chart 6. The economic impact of climate change on the tourism sector
will be significant: Caribbean region (in USD millions)
12 Journal of Sustainable Tourism, 2012. 13 Current Issues in Tourism, 2010.
17
Mal
dive
s, N
ew Z
eala
nd M
FAT.

18
ENVIRONMENT
1. SIDS on the Frontline of a Changing Climate
According to the IPCC, CO2 concentrations in the atmosphere have reached ‘unprecedented’ level not seen for the last 800,000 years. As greenhouse gas emissions continue to rise, an average global temperature increase of 2.6 – 4.8°C by 2100 is expected - as per the highest emissions scenario. SIDS as a group of countries contribute less than 1 per cent to total greenhouse gas emissions but have been and will continue to be among the earliest and most impacted countries. SIDS may experience both rapid-onset and temporary events, such as storms and flooding, and slow-onset processes including land erosion and changes in the global water cycle. More specifically this includes: marine inundation of low-lying areas, coral bleaching, saline intrusion into terrestrial systems, degrading ecosystems, species shifts in terrestrial systems, habitat loss, climate-induced diseases as well as casualties and damage from extreme events. For the regions where SIDS are located, significant changes are expected in average temperature, rainfall and sea level rise as illustrated in Figure 3..
Haiti. Marco Dorm
ino, UN Photo/Flickr.

19
14 UNEP, 2014.15 CDKN, 2014.
Figure 3. Climate Change Projections for the IPCC Intermediate
Low-Emissions scenario (RCP4.5)
Source: Based on data from IPCC AR5 - RCP4.5 low emissions scenario.

20
2. Sea-Level Rise: Implications for SIDS
The most obvious distributional effects of climate change relate to the rise in sea level (Group of Experts of the Regular Process, 2016). Sea level rise coupled with extreme weather events induced by climate change poses one of the most immediate threats to SIDS. In particular, the majority of communities, infrastructure and economic activities are located in low-lying coastal areas. For low-lying atoll nations with a majority of land area within 5m above sea level (refer to Table 2) and those with a majority of population living within 5m above sea level (refer to Table 3), the dangers and challenges of rising seas are significant. According to UNEP (2008), approximately 70 percent of the Caribbean population lives in coastal areas. In the tropical Western Pacific where a large number of SIDS communities exist, rates of sea level rise of up to four times the global average (approximately 12 mm per year) have been reported between 1993 and 200916. In addition, as populations grow, and coupled with climate change impacts, relocation to higher ground or beyond national borders will be a major challenge. Owing to higher projections of sea level rise in AR5, it is clear that many – particularly low lying atoll nations – face an existential threat.
A case in point is Tuvalu where removing all the factors which affect short-term sea level fluctuation (including relative sea level rise of 10 percent due to subsidence and effects of ENSO), the long-term sea level around Tuvalu rose at the rate of 5.1 (±0.7) mm per year from 1950-200917. This is almost 3 times greater than the global average sea level over that time of 1.8 mm per year.
16 IPCC, 2014.17 Becker et al., 2011.

21
Table 2. Highest and lowest share of land area within 5m above sea level
COUNTRY % OF LAND AREA
WITHIN 5M ABOVE SEA LEVEL
Maldives, Tuvalu 100%
Marshall Islands 99%
Kiribati 96%
Cook Islands 88%
Average 26%
Haiti 4%
Suriname, Timor-Leste, Guyana 3%
Papua New Guinea 2%
Source: UN-OHRLLS, Small Island Developing States in Numbers, 2013.
Table 3. Highest and lowest share of population living within 5 m above sea level
COUNTRY % OF POPULATION LIVING
WITHIN 5M ABOVE SEA LEVEL
Maldives, Tuvalu 100%
Marshall Islands 99%
Kiribati 95%
Suriname 68%
Average 29%
Mauritius 6%
Haiti 5%
Timor-Leste 4%
Dominican Republic 3%
Papua New Guinea 2%
Source: UN-OHRLLS, Small Island Developing States in Numbers, 2013.

22
3. Extreme Weather Events
About 90 percent of SIDS are located in the tropics – areas naturally prone to suffer more frequently from severe weather events ranging from rapid-onset and temporary events, such as storms and flooding, slow-onset processes including land erosion and changes in the global water cycle18. What is more, as SIDS populations grow and move into more at-risk areas in search of livelihoods, the number of people exposed to risk stemming from severe weather events also increases19.
18 UNEP, 2014.19 Internal Displacement Monitoring Center, Norwegian refugee Council, 2015.
NAS
A/Fl
ickr.

23
Figure 4. Top 15 SIDS: Tropical cyclone AAL (storm surge and cyclone wind)
in relation to capital stock
Source: UNISDR, 2015.
According to UNISDR in the case of a one-in-250 year cyclone, six of the ten countries most at risk are SIDS20. Due to high coastal exposure, storm surge further exacerbates tropical cyclone AAL in SIDS. As illustrated in Figure 4, Cayman Islands and Antigua and Barbuda have the highest relative AAL in relation to cyclone wind while the highest relative risk with respect to storm surge is found in the Bahamas, Montserrat and Dominica.
20 UNISDR, 2015.

24
It is clear that climate change will exacerbate the impacts of tropical cyclone winds on SIDS. For the Caribbean basin as a whole, climate change contributes an additional US$1.4 billion to expected average annual losses associated with wind damage alone as illustrated in Figure 5.
Source: UNISDR, 2015.
Figure 5. AAL from tropical cyclone wind for
Caribbean and Central American countries, with and without climate change

25
4. Natural Resources
Coral Reefs
Coral reefs play an important role in the wellbeing of many island communities. Healthy reefs are highly efficient in breaking waves, storing carbon and supporting biodiversity. Furthermore, they function as important sources of sand, slow down (beach) erosion and support a variety of tourism activities. Rising sea surface temperatures and more acidic oceans in combination with other unsustainable practices, however, can severely impact the growth and resilience of corals21 exposing them, amongst others, to thermal stress. Figure 6 illustrates the extent of coral bleaching projected in the 2030s and 2050s with a significant amount of bleaching expected to occur in SIDS regions.
Across the SIDS regions, the abundance of coral species is rapid, particularly across the Pacific as well as the Caribbean where it has decreased by over 80 percent. Coral reefs are likely to be affected due to combined impact of bleaching caused by stress from both increased water temperature and acidification. The IPCC estimates that one third of global coral reefs will experience degradation over the coming decades – even under a low-emissions scenario22. In the World Resources Institute’s Reefs at Risk Revisited report, Haiti, Grenada, Comoros, Vanuatu, Kiribati and Fiji were identified as the SIDS most vulnerable to the effects of coral reef degradation23. AR5 reported that the annual damage of coral reef loss caused by ocean acidification has been calculated at between
21 SREP, 2013.22 IPCC, 2014.
23 World Resource Institute, 2011.24 IPCC, 2014.
Jamaica. Evo Flash/ Flickr.

26
Figure 6. Projected: coral reef bleaching events in the 2030s and 2050s
Source: World Resource Institute, 2011.

27
US$528 and US$870 billion (depending on scenario) and can represent large portions of GDP for SIDS that are impacted24.
According to UNEP (2007), almost 50 percent of reefs in the Pacific region are currently considered threatened, with about 20% rated as highly or very highly threatened, including, for example, in the Federated States of Micronesia and the Republic of the Marshall Islands.
Fresh Water
Having access to a reliable, safe, sustainable and affordable supply of drinking water remains a critical issue for the majority of SIDS25. SIDS are directly affected by limited freshwater resources likely compromised by human-induced and natural stressors such as rising sea level and climate variability. Typical sources of potable water for SIDS communities include groundwater, surface water and desalinated water which are commonly recharged during the wetter season of the year. Many countries rely entirely
25 UNEP, 2012.26 UNFCCC, 2005.
Figure 7. SIDS freshwater availability
Source: SIDS-Focused Green Economy: An Analysis of Challenges and Opportunities.
UNEP, UNDESA & FAO, 2012.

28
on a single source of water supply26.
Contamination leading to water quality degradation, over-extraction and shortcomings in national water management, however, threaten the efficient operation and maintenance of freshwater sources. With many SIDS facing water stress and scarcity (refer to Figure 6), the impacts of climate change, such as extreme tides, sea-level rise and saline intrusion into coastal aquifers adds further pressure on SIDS. In addition, communities that depend primarily on rainwater harvesting will be particularly vulnerable to changes in precipitation patterns and prolonged drought conditions.
Varying degrees of water insecurity resulting from these challenges are already being experienced by many SIDS. For example, Mauritius is projected to become a “water-stressed” country, and Comoros a “water-scarce” country by the year 202527. Further, as many SIDS economies are heavily dependent on agriculture or tourism activities, both major consumers of freshwater, economic losses are likely to result when operations have to be discontinued. What makes the matter of water security particularly challenging in a SIDS context, is the immediacy of water-related problems, and many SIDS’ limited capacity to respond28. In the World Resources Institute’s
27 UNEP, 2012.28 UNEP, 2012.
Haiti
. FM
SC D
istri
butio
n Pa
rtner
.
Aqueduct Country and River Basin Ranking, ranking the Baseline Water Stress (i.e. the ratio of total annual water withdrawals to total available annual renewable supply) by country and for agricultural, municipal, and industrial sectors, 9 out of the 16 countries tied for highest possible score - meaning extremely high water stress - are SIDS. In the Caribbean, Antigua and Barbuda, Barbados, Dominica, Jamaica, St. Lucia, St. Vincent and the Grenadines and and Trinidad and Tobago. In the AIMS SIDS, these are Bahrain, Comoros and Singapore.
Biodiversity
While many SIDS are home to large numbers of endemic flora and fauna, it is also amongst SIDS that alarming rates of biodiversity loss are taking place. According to SPREP, there is a high degree of confidence that projected changes in climate will result in the degradation, redistribution, and/or fragmentation of ecosystems and the loss of biodiversity, species, and ecosystem services in the Pacific over the coming decades.
Comoros Islands. Daryl W
allace/Flickr.
29

30
Source: Based on data from the Secretariat of the Convention
on Biological Diversity and Conservation International.

31
SOCIAL
For SIDS, the impacts of climate change pose distinctive challenges to their social sector including on their public health, food security, migration, cultural and natural heritage and their ongoing efforts to attain their sustainable development aspirations. These challenges stem from SIDS’ inherent characteristics of high dependency on natural resources and ecosystem services, small markets, isolated geographic locations and large coastal populations, most of which are located in low-lying communities.
1. Public Health
Climate change will have the greatest effect on health in societies with scarce resources, little technology and frail infrastructure29 in low- and middle-income countries and populations including sub-Saharan Africa, South Asia and SIDS30. Higher temperatures, changes in precipitation and an increase in the frequency and intensity of extreme weather events will increase the risk of food – and water borne diseases; vector-borne diseases; undernutrition resulting from diminished food production; lost work capacity and reduced labour productivity31.
The IPCC’s projections and qualitative assessments of the future burden (for the period 2030–2040) of ill-health due to current climate change, in which the world will inevitably experience approximately 1.5°C of warming due to past and present greenhouse gas emissions, already paints an alarming picture. The IPCC’s projections for the period 2080–2100, for which the global mean temperature is expected to increase by approximately 4°C above preindustrial levels, however, depicts a scenario of increased health risk concerns including those on air quality and prevalence of food and water borne diseases32. SIDS will undoubtedly be affected with the rest of the world.
29 GWHO, 2009.30 WHO, 2014. 31 OWHO, 2015.32 WHO, 2015.

32
Figure 8. Summary of the main expected health impacts of climate variability
and climate change globally by the middle of the current century
Source: Operational framework for building climate resilient health systems, WHO, 2015.

33
2. Migration and Displacement
It is clear that there is the potential for human movement as a response to climate change33. With high percentage of SIDS populations living near the coast, many of which in low-lying areas, coastal floods, storm surges and inland flooding can cause serious social migration and/or displacement challenges. High sea levels and swells have already resulted in the displacement of people in a number of SIDS including Kiribati, Solomon Islands, the Marshall Islands, and the Federated States of Micronesia34. The displacement of people is likely to increase over the 21st century as a direct result of climate change35. These induced or forced migration and resettlement could have a significant impact on the social fabric, traditional culture and way of life of many SIDS.
Figure 9. Links between loss of land,
livelihood and habitat security, and migration
Source: UN-ESCAP 201436.
33 IPCC, 2014. 34 OCHA, 2008.35,36 IPCC, 2014.
34
37 ‘Issues Related to the State of the conservation of properties inscribed on the World heritage List’, WHC-06/30/COM/7.1, p.18.
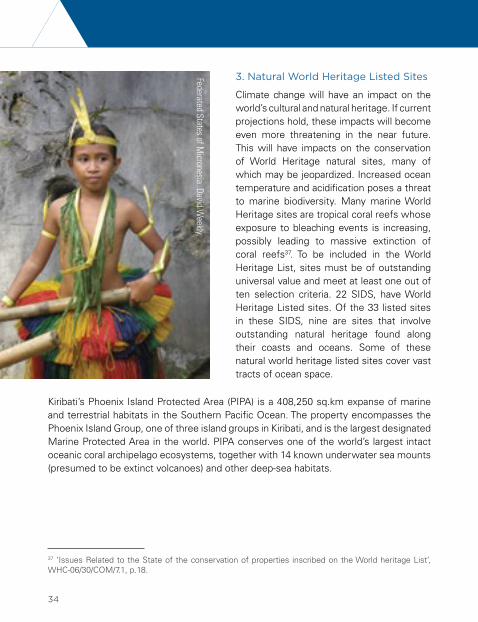
3. Natural World Heritage Listed Sites
Climate change will have an impact on the world’s cultural and natural heritage. If current projections hold, these impacts will become even more threatening in the near future. This will have impacts on the conservation of World Heritage natural sites, many of which may be jeopardized. Increased ocean temperature and acidification poses a threat to marine biodiversity. Many marine World Heritage sites are tropical coral reefs whose exposure to bleaching events is increasing, possibly leading to massive extinction of coral reefs37. To be included in the World Heritage List, sites must be of outstanding universal value and meet at least one out of ten selection criteria. 22 SIDS, have World Heritage Listed sites. Of the 33 listed sites in these SIDS, nine are sites that involve outstanding natural heritage found along their coasts and oceans. Some of these natural world heritage listed sites cover vast tracts of ocean space.
Kiribati’s Phoenix Island Protected Area (PIPA) is a 408,250 sq.km expanse of marine and terrestrial habitats in the Southern Pacific Ocean. The property encompasses the Phoenix Island Group, one of three island groups in Kiribati, and is the largest designated Marine Protected Area in the world. PIPA conserves one of the world’s largest intact oceanic coral archipelago ecosystems, together with 14 known underwater sea mounts (presumed to be extinct volcanoes) and other deep-sea habitats.
Federated States of Micronesia. David W
eekly.

35
4. Food Security
All aspects of food security are potentially affected by climate change, including food access, utilization, and price stability38. SIDS being among the most vulnerable to the adverse impacts of climate change and are already experiencing an increase in such impacts, including persistent drought and extreme weather events, sea-level rise, coastal erosion and ocean acidification, further threatening food security39.
Climate change would exacerbate food security and nutrition in SIDS. Over the 15 years life period of the MDGS, proportion of malnourished people in SIDS fell by 26 percent. This compares with a fall in 33 percent in LDCs and 36 percent in LLDCs. Globally, the figure went down by 41 percent. While the aggregate figure for SIDS masks notable progress achieved in individual countries, as a group, SIDS are facing constraints across the four dimensions of food security – food availability, food accessibility, food utilization, stability across time.
Perc
enta
ge
chan
ge
% 0
-10
-36.1
-41.6
-33.2
-26.3
-20
-30
-40
-50
Fall in proportion of undernourished in total population 1990-2015
World LLDCs LDCs SIDS
Chart 7. Progress towards the MDG target on reducing proportion
of undernourished in total population
38 IPCC, 2014. 39 SAMOA Pathway, Paragraph 31.

36
SIDS are primarily net food-importing countries and are exceptionally vulnerable to the fluctuating availability and excessive price volatility of food imports. It is therefore important to support the right of everyone to have access to safe, sufficient and nutritious food, the eradication of hunger and the provision of livelihoods while conserving, protecting and ensuring the sustainable use of land, soil, forests, water, plants and animals, biodiversity and ecosystems40. Some SIDS expend up to 50 percent of total import on food, compared with the world average of 7 percent.
Perc
enta
ge
of
foo
d
in t
ota
l im
po
rts
(%)
Vanu
atu
50
40
30
20
10
0
Tong
aCa
bo V
erde
Sao
Tom
e an
d...
Com
oros
Solo
mon
Isla
nds
Sam
oa
Pala
u
Papu
a N
ew...
Surin
ame
Beliz
eGu
yana
Dom
inic
an...
Jam
aica
Cuba
Baha
mas
, The
Barb
ados
Mal
dive
sGr
enad
aSt
. Kitt
s an
d N
evis
Mau
ritiu
sSt
. Luc
iaSe
yche
lles
Dom
inic
a
St. V
ince
nt a
nd...
Antig
ua a
nd...
Tuva
lu
Tim
or-L
este Fiji
Kirib
ati
Guin
ea-B
issa
u
Wor
ldTr
inid
ad a
nd ..
.
Chart 8. Share of food imports in total imports
Source: Secretariat of the Convention of Biological Diversity and Conservation
International.
40 SAMOA Pathway, Paragraph 59.

37
foo
d im
po
rt b
ill a
s a
% o
f ex
po
rt e
arn
ing
s 160
120
80
40
0
Tong
a
Cabo
Ver
de
Sao
Tom
e an
d Pr
inci
ple
Guya
na
Solo
mon
Isla
nds
Guin
ea-B
issa
u
Sam
oa
Papu
a N
ew G
uine
a
Beliz
e
Dom
inic
a
Dom
inic
an R
epub
lic
Jam
aica
Baha
mas
, The
Barb
ados
Mal
dive
s
Surin
ame
Mau
ritiu
s
Gren
ada
St. K
itts
and
Nev
is
St. L
ucia
Seyc
helle
s
vanu
atu
St. V
ince
nt a
nd th
e Gr
enad
ines
Antig
ua a
nd B
arbu
da
Tuva
lu
Tim
or-L
este
Com
oros Fiji
Kirib
ati
Wor
ld
Trin
idad
and
Toga
bo
Chart 9. SIDS ratio of food imports to foreign exchange
Climate-related hazards affect the vulnerable and poor people’s lives directly through impacts on livelihoods, reductions in crop yields, or destruction of homes and indirectly through, for example, increased food prices. Over the period 2005 to 2013, food import bills in SIDS accounted for over a third (or 33 percent) of all exports of goods and services. A high degree of volatility is also observed across time, with the figure reaching 40-42 percent during the spikes in global food prices around 2008. To put this into context, globally ratio of food imports relative to exports has remained relatively steady at 7 percent over the same time period. Furthermore, for a handful of SIDS (Kiribati, Tuvalu and Sao Tome and Principe) food imports to exports was consistently over 100 percent in 2005 to 2013, indicating some SIDS are already suffering from unsustainably high food bills.
SIDS in general face high food import bills with some experiencing food import bills that are more than their export earnings.

38
KEY POINTS
Source: Adapted from: Climate and Development Knowledge Network, 2014.
1
The climate is already changing and SIDS area already feeling
the impacts
2
Further climate change is inevitable in the coming decades
3
Climate change is affecting SIDS’
growth and development
4
Climate change poses an existential threat to
some SIDS
5
Adaptation can reduce the impacts
of climate change, but there are limits and
risks involved
6
The economic cost of adaptation to climate
change is high in SIDS relative to the size
of their economies
7
SIDS stand to benefit from further
integration of climate adaptation, mitigation
and development approaches
8
Transformation to a low-carbon economy implies new patterns
of investment
9
International cooperation is vital to avert dangerous climate change and
SIDS governments can promote ambitious global
action

39
REFERENCES
For a detailed list of references please visit our website at http://unohrlls.org/sids-numbers-2017/
Acknowledgments
This publication has been made possible thanks to the work of the SIDS sub-programme and Advocacy Unit at UN-OHRLLS. Valuable contributions have been provided from Malwina Buldys, Ebrima S. Dem , Roberto Falangola and Lisa Neuner.

SurinameGuyana
Trinidad & Tobago
Belize
Bahamas
Cuba
JamaicaHaiti
Dominican Republic
Puerto Rico
BarbadosSt. Vincent & the Grenadines
Sint Maarten
Grenada
St. Lucia
Dominica
St. Kitts & Nevis
Guadeloupe
Curacao
Cabo Verde
Guinea-Bissau
Sao Tome & Principe
Comoros
Mauritius
Seychelles
MaldivesSingapore
Tonga
Solomon Islands
Papua New Guinea
Guam
Federated States of Micronesia
Vanuatu
Marshall Islands
Tuvalu
Fiji
New Caledonia
Kiribati
American Samoa
French Polynesia
Cook IslandsTimor-Leste
Bahrain
Palau
Nauru
Niue
Bermuda
Anguilla
Turks and Caicos
Antigua & BarbudaMontserrat
Aruba
Cayman Islands
Martinique
British Virgin Islands
Commonwealth of Northern Marianas
U.S. Virgin Islands
Samoa
40
UN Members * Also Least Developed Country
Antigua and Barbuda Bahamas BahrainBarbadosBelizeCabo Verde Comoros*Cuba DominicaDominican Republic
Federated States of Micronesia
FijiGrenada Guinea-Bissau*Guyana Haiti*Jamaica Kiribati*Maldives Marshall Islands
MauritiusNauruPalauPapua New GuineaSamoa Sao Tome and
Principe*SeychellesSingapore Solomon Islands*St. Kitts and Nevis
St. LuciaSt. Vincent and the
GrenadinesSuriname Timor-Leste*Tonga Trinidad and Tobago Tuvalu*Vanuatu*

SurinameGuyana
Trinidad & Tobago
Belize
Bahamas
Cuba
JamaicaHaiti
Dominican Republic
Puerto Rico
BarbadosSt. Vincent & the Grenadines
Sint Maarten
Grenada
St. Lucia
Dominica
St. Kitts & Nevis
Guadeloupe
Curacao
Cabo Verde
Guinea-Bissau
Sao Tome & Principe
Comoros
Mauritius
Seychelles
MaldivesSingapore
Tonga
Solomon Islands
Papua New Guinea
Guam
Federated States of Micronesia
Vanuatu
Marshall Islands
Tuvalu
Fiji
New Caledonia
Kiribati
American Samoa
French Polynesia
Cook IslandsTimor-Leste
Bahrain
Palau
Nauru
Niue
Bermuda
Anguilla
Turks and Caicos
Antigua & BarbudaMontserrat
Aruba
Cayman Islands
Martinique
British Virgin Islands
Commonwealth of Northern Marianas
U.S. Virgin Islands
Samoa
41
The boundaries and names shown and the designations used on this map do not imply official endorsement or acceptance by the United Nations.
Non-UN Members / Associate Members of the Regional Commissions
American Samoa AnguillaArubaBermudaBritish Virgin IslandsCayman Islands
Commonwealth of Northern Marianas
Cook IslandsCuracaoFrench PolynesiaGuadeloupe
GuamMartiniqueMontserratNew CaledoniaNiuePuerto Rico
Sint MaartenTurks and Caicos
IslandsU.S. Virgin Islands

Copyright © United Nations 2017
UN-OHRLLS
Online Version