SMALL-HOLDER OUTGROWER SUGAR-CANE PRODUCTION PROJECT ... · PDF fileafrican development bank...
52
AFRICAN DEVELOPMENT BANK AFRICAN DEVELOPMENT FUND MAI/PAAI/99/01 Language: English Original: English APPRAISAL REPORT SMALL-HOLDER OUTGROWER SUGAR-CANE PRODUCTION PROJECT (SOSPP) REPUBLIC OF MALAWI NB: This document contains errata or corrigenda (see Annexes) COUNTRY DEPARTMENT OCDS SOUTH REGION OCTOBER 1999
Transcript of SMALL-HOLDER OUTGROWER SUGAR-CANE PRODUCTION PROJECT ... · PDF fileafrican development bank...

AFRICAN DEVELOPMENT BANK AFRICAN DEVELOPMENT FUNDMAI/PAAI/99/01Language: EnglishOriginal: English
APPRAISAL REPORT
SMALL-HOLDER OUTGROWER SUGAR-CANE PRODUCTION PROJECT
(SOSPP)
REPUBLIC OF MALAWI
NB: This document contains errata or corrigenda (see Annexes)
COUNTRY DEPARTMENT OCDSSOUTH REGION OCTOBER 1999

TABLE OF CONTENTS
PROJECT INFORMATION SHEET, CURRENCY AND MEASURES, LIST OF TABLES, LISTOF ANNEXES, LIST OF ABBREVIATIONS, BASIC DATA SHEET, LOGICAL FRAMEWORK,AND EXECUTIVE SUMMARY (i-ix)
Page
1. ORIGIN AND HISTORY OF THE PROJECT
2. THE AGRICULTURAL SECTOR
2.1 Salient Features2.2 Institutional Arrangements and Governance2.3 Sector Policy Framework2.4 Land Tenure and Land Use2.5 Constraints to Agricultural Development2.6 Donor Co-ordination and Intervention
3. THE SUGAR-CANE SUB-SECTOR
4. THE PROJECT
4.1 Project Concept and Rationale4.2 Project Area and Project Beneficiaries4.3 Strategic Context4.4 Project Objectives4.5 Project Description4.6 Production, Markets and Prices4.7 Environmental Impact4.8 Social Impact4.9 Project Costs4.10 Sources of Finance and Expenditure Schedule
5. PROJECT IMPLEMENTATION
5.1 Executing Agency5.2 Institutional Arrangements5.3 Supervision and Implementation Schedule5.4 Procurement Arrangements5.5 Disbursement Arrangements5.6 Monitoring and Evaluation5.7 Financial Reporting and Audit5.8 Aid Co-ordination
6. PROJECT SUSTAINABILITY AND RISKS
6.1 Recurrent Costs6.2 Project Sustainability6.3 Critical Risks and Mitigating Measures
1
1
133444
5
7
78
1010101112121314
15
1516171820212122
22
222223

7. PROJECT BENEFITS
7.1 Financial Analysis7.2 Economic Analysis7.3 Social Impact Analysis7.4 Sensitivity Analysis
8. CONCLUSIONS AND RECOMMENDATIONS
8.1 Conclusions8.2 Recommendations
23
23242425
25
2526
________________________________________________________________________________This report was prepared by Messrs. Patrick C. Agboma (Senior Agronomist/Project TaskManager, OCDS.2), M.M. Msuya (Principal Agricultural Economist/Mission Leader, OCDS.2),and M. Tafesse (Consultant Civil Engineer) following their appraisal mission to Malawi, between17 and 30 July, 1999. Contributions from Messrs. Benedict S. Kanu (Senior AgriculturalEconomist/Alternate Project Officer, OCDS.2) and Wael R. Soliman (Senior Environmentalist,OCDS.2) are gratefully acknowledged. Further enquiries on this report may be addressed to Mr. D.Tripathy (Manager, OCDS.2, Extension 4162).
AFRICAN DEVELOPMENT FUND01 B.P. 1387, ABIDJAN 01
Tel: (225) 20 44 44Fax: (225) 20 49 02
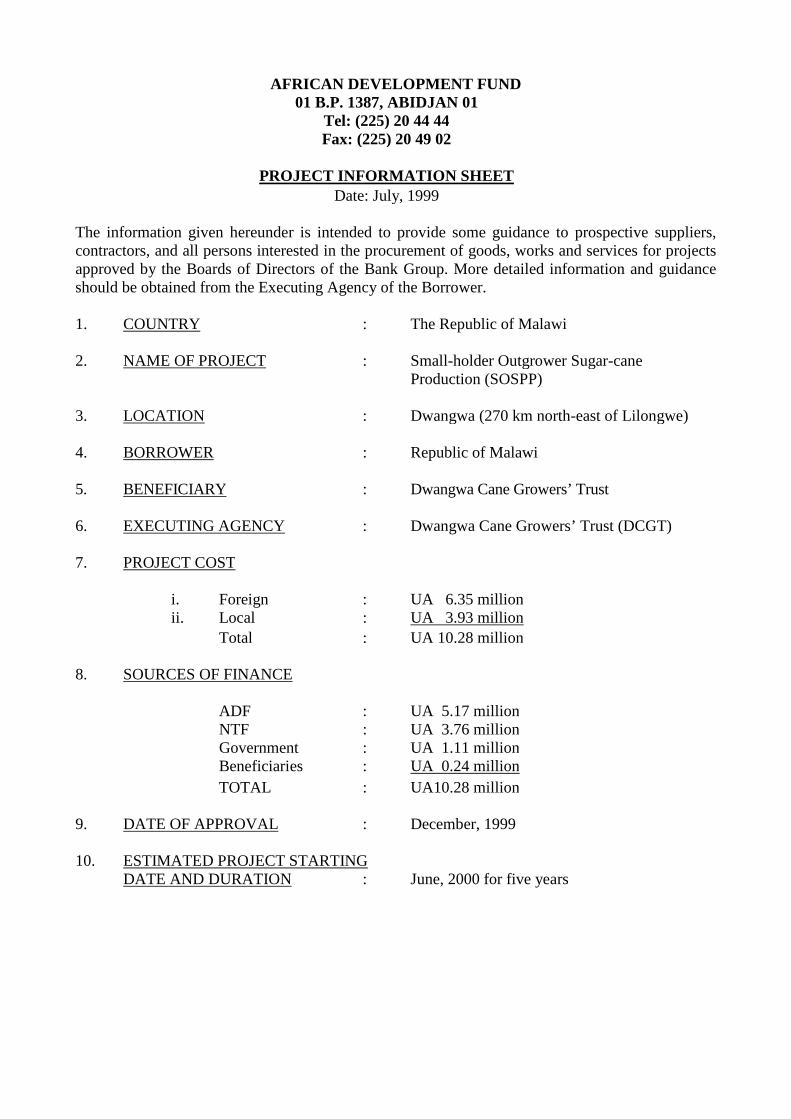
PROJECT INFORMATION SHEETDate: July, 1999
The information given hereunder is intended to provide some guidance to prospective suppliers,contractors, and all persons interested in the procurement of goods, works and services for projectsapproved by the Boards of Directors of the Bank Group. More detailed information and guidanceshould be obtained from the Executing Agency of the Borrower.
1. COUNTRY : The Republic of Malawi
2. NAME OF PROJECT : Small-holder Outgrower Sugar-caneProduction (SOSPP)
3. LOCATION : Dwangwa (270 km north-east of Lilongwe)
4. BORROWER : Republic of Malawi
5. BENEFICIARY : Dwangwa Cane Growers’ Trust
6. EXECUTING AGENCY : Dwangwa Cane Growers’ Trust (DCGT)
7. PROJECT COST
i. Foreign : UA 6.35 millionii. Local : UA 3.93 million
Total : UA 10.28 million
8. SOURCES OF FINANCE
ADF : UA 5.17 millionNTF : UA 3.76 millionGovernment : UA 1.11 millionBeneficiaries : UA 0.24 million
TOTAL : UA10.28 million
9. DATE OF APPROVAL : December, 1999
10. ESTIMATED PROJECT STARTINGDATE AND DURATION : June, 2000 for five years

ii
11. PROCUREMENT : Project goods, works and services financedby the Bank will be procured in accordancewith Bank rules and procedures. Irrigationequipment and farm inputs will be procuredthrough International Competitive Bidding(ICB), while construction of buildings,purchase of vehicles, motorcycles and bicycles,and land preparation will be through NationalCompetitive Bidding (NCB); construction oftubewells, roads, waterways and associateddrainage structures will be by NationalShopping (NS); furthermore, office equipmentand supplies will be procured through NationalShopping (NS). Technical assistance,engineering design and training services will beprocured through limited competition using ashortlist.
12. CONSULTING SERVICES NEEDED: Technical Assistance Experts comprising a Fin-ancial Controller (24 person-months), aProcurement Officer (48 person-months) and aProject Co-ordinator (60 person-months).
iii
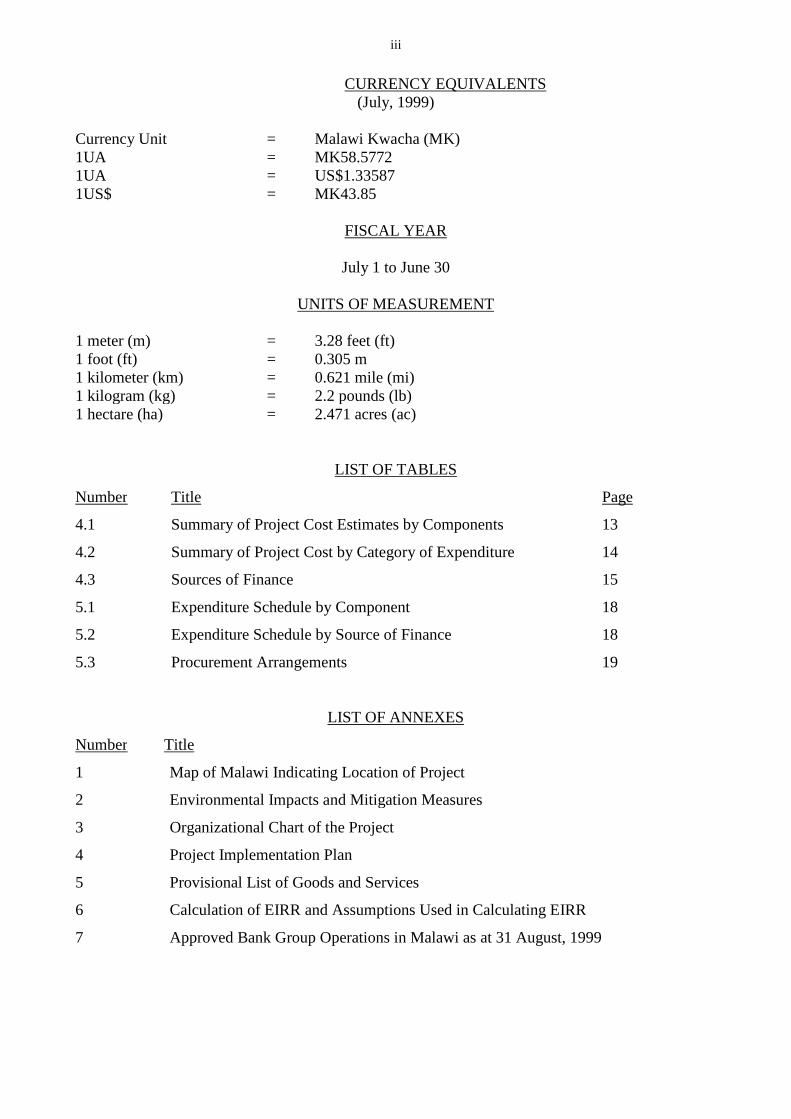
CURRENCY EQUIVALENTS(July, 1999)
Currency Unit = Malawi Kwacha (MK)1UA = MK58.57721UA = US$1.335871US$ = MK43.85
FISCAL YEAR
July 1 to June 30
UNITS OF MEASUREMENT
1 meter (m) = 3.28 feet (ft)1 foot (ft) = 0.305 m1 kilometer (km) = 0.621 mile (mi)1 kilogram (kg) = 2.2 pounds (lb)1 hectare (ha) = 2.471 acres (ac)
LIST OF TABLES
Number Title Page
4.1 Summary of Project Cost Estimates by Components 13
4.2 Summary of Project Cost by Category of Expenditure 14
4.3 Sources of Finance 15
5.1 Expenditure Schedule by Component 18
5.2 Expenditure Schedule by Source of Finance 18
5.3 Procurement Arrangements 19
LIST OF ANNEXES
Number Title
1 Map of Malawi Indicating Location of Project
2 Environmental Impacts and Mitigation Measures
3 Organizational Chart of the Project
4 Project Implementation Plan
5 Provisional List of Goods and Services
6 Calculation of EIRR and Assumptions Used in Calculating EIRR
7 Approved Bank Group Operations in Malawi as at 31 August, 1999

iv
LIST OF ABBREVIATIONS
ADB : African Development BankADD : Agricultural Development DivisionADF : African Development FundADMARC : Agricultural Development & Marketing CorporationCIF : Cost, Insurance, FreightDCGC : Dwangwa Cane Growers’ CompanyDCGT : Dwangwa Cane Growers’ TrustDWASCO : Dwangwa Sugar CorporationEPA : Extension Planning AreaETHCO : Ethanol Company of MalawiEU : European UnionFAO : Food and Agriculture OrganizationFOB : Free On BoardGDP : Gross Domestic ProductGOM : Government of MalawiLCA : Local Currency AccountMK : Malawian KwachaMOAI : Ministry of Agriculture and IrrigationNGO : Non-Governmental OrganizationNTF : Nigerian Trust FundRDP : Rural Development ProgrammeSOSPP : Small-holder Outgrower Sugar-cane Production ProjectSA : Special AccountSSA : Small-holder Sugar AuthorityTA : Technical AssistanceUS : United StatesUSA : United States of America

v
BASIC DATA SHEET
DEMOGRAPHIC AND SOCIO-ECONOMIC INDICATORS
Comparative IndicatorsDeveloping Developed
A. GENERAL Year Malawi Africa Countries Countries
Area (Sq. Km '000) 1998 118 30060 80946 135575Population size (in million) 1997 11 747 4592 1175Sex Ratio (100 female) 1997 97 99 104 94Population under fifteen years (%) 1996 49 45 35 19Population sixty-five years and over (%) 1996 3 3 4.5 12.1Dependency ratio 1996 104 92.3 67 50.4Urban Population % 1996 14 34 37 74Rural Population (%) 1996 86 66 63 26Population Density (per km2) 1998 93 21 51 21Population per sq. km of arable land 1998 500 363 - -Adult Literacy rate (Total) 1996 57 51 70 99
- Male 1997 72 63 75 99- Female 1996 42 42 62 99
Labor Force Participation Rate (%)- Male 1995 50 – 50 –- Female 1995 32 – 35 –
GNP per inhabitant (USD) 1997 180 662 1222 27086Annual growth rate of GNP (%) 1997 -0.2 -0.4 4.0 1.1
B. DEMOGRAPHIC INDICATORS
Annual population growth rate (%) 1998 2.6 2.7 1.8 0.4Urban population growth rate (%) 1998 4.0 5 3.8 0.8Crude death rate (per 1000 population) 1997 22 13 9.0 9.0Infant mortality rate (per 1000 live birth) 1997 135 87 68 13Child mortality rate (/1000 child age 1 - 4) 1997 215 147 96 7Maternal mortality ratio (/100,000 1.birth) 1997 620 877 479 27Life expectancy at birth (years) - Total 1998 40 52 64 78
- Male 1998 40.3 – – –- Female 1998 41.1 – – –
Crude birth rate (per 1000 pop.) 1998 48 40 27 12Total fertility rate (N of children) 1997 6.7 5.6 3.3 1.7Median age 1997 17 17.3 22.2 33.6Population doubling time (years) 1998 28 24 34 148Women of child bearing age (% of all women) 1997 44.2 45 – –Proportion of women using contraceptive (%) 1998 14 18 55 72
C. HEALTH & NUTRITIONAL INDICATORS
Population per physician 1993 50000 18000 7000 390Population per nursing persons 1993 16666 – 1700 180Access to safe water 1997 47 60 70 –Percentage of fully immunized children 1997 94 – 85 87Average per capita calorie intake 1996 1827 2328 2546 3412Babies born with birth weight<2500 gm (%) 1997 20 15 18 6Percentage of GNP spent on health 1998 7.8 4.0 4.0 14Average per capita spending on health (USD) 1993 11 14 41 1958
D. EDUCATION INDICATORS
Gross enrolment ratio :- Primary School Total 1996 135 79 99 104
Female 1996 128 63 92 103- Secondary School Total 1996 5.5 58 50 107
Female 1996 4 21 45 96Percentage of GDP spent on education 1998 10.4 12 10 4
Source: - Malawi Social Indicators Survey, 1995- The World Bank Development Report, 1997- The World Health Report, WHO 1997- State of the World Population 1998, UNFPA- African Development Report, 1998- La situation des enfants dans le Monde, UNICEF, 1999
*Natural rate of increase only

vi
LOGICAL FRAMEWORK
Malawi: Small-holder Outgrower Sugar-cane Production Project
Narrative Summary Measurable Performance Indicators Means of Verifications Important AssumptionsSector Goal
1. To increase sugar-cane production, whichwill in turn improve foreign exchange positionand increase farmers’ income.
1.1 5% annual increase in the export of sugar asfrom PY2.
1.2 Import substitution of petrol increased by 10%annually beginning from PY2
1.1 Monitoring and evaluationreports
1.2 Data of the Central StatisticsOffice and MOAI.
(Goal to Supergoal)
Project Specific Objective
1. The project’s specific objectives are toalleviate poverty of small-holder sugar-caneoutgrower farmers (including women) aroundDwangwa by increasing their income andimproving household food security.
1.1 Average net farm income for sugar-caneoutgrowers increased from current MK42,636 toMK170,100 as from PY2
1.2 20% increase in domestic food supply as fromPY2
1.1 Crushing mill reports
1.2 Quarterly Progress Reports
1.3 Farm survey
1.1 GOM's reform programmeremains on track
1.2 Price of sugar remain steady
1.3 Cane marketing arrangement isstable
Outputs
1. Sugar-cane Production Support system isestablished and efficiently managed by theTrust
1.1 All the farmers in the area are aware of thescheme, with 80% having access to input andirrigation facility by PY5.
1.1 Farmer groups sample surveys
1.2 Farmers’ Trust records
1.3 Quarterly Progress Reports
1.1 Market interest rates applied to farminputs are affordable to outgrowerfarmers
1.2 No serious natural disaster such asdrought or flood occurs
2. Farm related infrastructure is used andmanaged by farmers
2.1 Additional irrigated land under sugarcaneincreased by 2,140 ha by PY5
2.2 All 39 units of irrigation equipment installedand 600 ha of surface irrigation system constructedby PY5
2.3 70% of farmers use new equipment with allmaintenance costs recovered beginning PY2
2.3 1,070 farmers reached, 12 farmer groupsleaders trained by end of PY5
2.4 130 km of roads rehabilitated or constructed byPY5
2.1 Annual Report of Farmers’Trust
3. Institutional and human resource capacityin irrigation technology and cane husbandryare enhanced for project beneficiaries.Potable water supply and sanitationimprovements are made for beneficiaries.
3.1 100% of project audits and progress reports areon time and in line with Bank procedures by PY2
3.2 Performance of Technical Assistant issatisfactory throughout the project
3.1 Farmer survey
3.2 Audit of extension services
3.3 Supervision reports
3.4 Progress reports
3.5 Procurement reviews
Activities
1.1 Establish and promote the loan System
1.2 Strengthen capacity of Farmers’ Trust tomanage the loan scheme
2.1 Install surface and 39 pivot irrigationunits and machinery/equipment
2.2 Rehabilitate and build feeder roads
2.3 Provide potable water supply andsanitation facilities
3.1 Train extension personnel
3.2 Train the trainer program
3.3 Provide PIC with equipment needed foreffective supervision/management
3.4 Train PIC on management techniques
Inputs and Resources (UA million)
2.20
0.72
6.71
0.23
0.01
0.01
0.11
0.28
0.0110.28
1.1 Progress reports
1.2 Audit and procurementreports
1.3 FLAD disbursement records
1.1 Farmers participate in theformation of associations starting inPY1
1.2 Adequate Government support tothe project

vii
EXECUTIVE SUMMARY
1. BORROWER: : Republic of Malawi (GOM)
2. EXECUTING AGENCY : Dwangwa Cane Growers Trust (DCGT)P.O. Box 49, Dwangwa, MalawiTelephone: 265 295 208Fax: 265 295 291
3. ADF LOAN : UA5.17 million
Terms
i) Service Charge : 0.75% per annum on the amount disbursed andoutstanding.
ii) Commitment Charge : 0.5% on the undisbursed portion 120 days aftersignature of loan agreement.
iii) Duration : 50 years including a grace period of 10 years.
iv) Repayment : 1% of the principal loan amount payableannually from the 11th year after the signingof the loan agreement through the 20th yearand 3% per annum thereafter.
NTF LOAN : UA3.76 million
Terms
i) Period of amortization : 25 years, including a grace period of 5 years.
ii) Commitment fee : 0.75% per annum, payable on the undisbursedbalance commencing 120 days after signatureof the relevant loan agreement.
iii) Interest : 4% per annum on disbursed outstandingbalances.
4. PROJECT BACKGROUND
In pursuance of its policy of diversifying agricultural production, enhancing foreign reserve positionand alleviating rural poverty, the Government of Malawi (GOM) sought the Bank Group’sassistance to finance the Small-holder Outgrower Sugar-cane Production Project (SOSPP). Theproject falls within the Public Sector Investment Programme that has placed priority on projects thatseek to alleviate poverty (especially in the rural areas), encourage economic growth and supportprivate sector development. The project will provide an enabling economic environment for privatesector development, improve essential agricultural and health services to farmers, increaseinvestment in rural road infrastructure and give appropriate training to farmers and field staff.

viii
5. PURPOSE OF THE LOAN AND GRANT
The ADF loan of UA5.17 million, amounting to 50.3% of total project cost, will be used to finance40.8% of foreign currency cost (UA6.35 million) and 65.6% of local cost (UA3.93 million). TheNTF loan of UA3.76 million (amounting to 36.6% of total project cost) will all be utilized tofinance 59.2% of foreign currency based expenditure.
6. SECTOR GOAL AND PROJECT OBJECTIVES
The sector goal is to increase sugar-cane production, which will in turn improve foreign exchangeposition and increase farmers’ income. The project’s specific objective is to alleviate poverty of small-holder sugar-cane outgrower farmers (including women) around Dwangwa by increasing their incomeand improving household food security.
7. BRIEF DESCRIPTION OF PROJECT’S OUTPUTS
In order to achieve its objectives, the project will provide inputs and irrigation infrastructure forsugar-cane production, purchase vehicles and heavy farm machinery, rehabilitate and construct in-field and access roads, ease rural unemployment, provide internal and external training for farmers,field supervisors and managers, construct health enhancing facilities and administrative officeblocks. The project will also provide seeds and fertilizers to enable outgrower farmers cultivate thefringes of the irrigated project sites with rice, maize, soybean, cassava and other food crops.
8. PROJECT COST
The total project cost is estimated at UA10.28 million out of which UA6.35 million or 61.77% willbe in foreign currency and UA3.93 million or 38.23% will be in local currency.
9. SOURCES OF FINANCE
The project will be financed by the ADF, NTF, GOM and the beneficiaries. The ADF loan of UA5.17million will cover the cost of input for sugar-cane production, purchase motorcycles and bicycles,and finance part of the costs related to operation and maintenance of irrigation equipment. It willalso finance part of local cost related to civil works, and all costs related to capacity building (suchas technical assistance, farmer training, radio communication, vehicles and office equipment). TheNTF loan of UA3.76 million (36.6% of total project costs), will be used to procure foreign costbased equipment related to the pivot irrigation system, construct tubewells and procure materialsassociated with them. It will also finance part of the costs related to operation and maintenance ofirrigation equipment. Government’s contribution of UA1.11 million (10.8% of total project cost)will be used for civil works related to the irrigation system (such as earth works, construction ofelectric power lines and roads). Project beneficiaries’ contribution of UA0.24 million, equivalent to2.3% of total project cost, will be used to pay salaries of additional staff recruited for the project.
10. PROJECT IMPLEMENTATION
The project will be implemented over a five-year period with 2000/2001 being Project Year 1. TheDwangwa Cane Growers’ Trust (a Government agency) will be the executing agency for the project.The Dwangwa Cane Growers’ Company (The Company) will, based on a management agreement withthe Trust, implement the project. The managerial and supervisory capacities of the Trust will bestrengthened by providing technical assistance in the form of a Financial Controller, a ProcurementOfficer and a Project Co-ordinator.

ix
11. CONCLUSIONS AND RECOMMENDATIONS
Conclusions
The Small-holder Outgrower Sugar-cane Production Project (SOSPP) has a high priority in thedevelopment objectives of the GOM. The project seeks to improve the country’s foreign exchangeposition through increased export earnings and petrol import substitution and help alleviate ruralpoverty by increasing small-holder farmers’ incomes through the expansion of the outgrower sugar-cane production scheme by an additional 2,140 ha of land. The project will also contribute to foodsecurity by enabling farmers to grow food crops on the fringes of their irrigated sugar-cane farms,and as a result of increased incomes to purchase adequate supplies of food. Furthermore, the projectwill be an important source of revenue for the Government. In all, about UA2.2 million in tax revenueis expected to be collected as income tax paid by the participating farmers, and corporate and surtaxesto be paid on account of the sugar-cane, sugar and ethanol produced by this project, annually. At theend of project implementation, the Trust, on behalf of the Government of Malawi, will convert thevalue of project assets (estimated at UA3.7 million) into shares to be held under DCGC. The shareswill be offered for purchase to the new entrants into small-holder cane production. The project willcontribute to the provision of an enabling economic environment for private sector development,increasing investment in rural road infrastructure and giving appropriate training.
The sustainable development and improvement measures to be taken under the project will assist inenvironmental conservation and protection of biodiversity. The project is consistent with theinstitutional framework and implementation strategies proposed under the Sectoral InvestmentProgramme and complementary to the recommendations of Bank’s Country Strategy Paper forMalawi. The project's overall financial and economic internal rates of return are estimated at 14%and 42%, respectively, and provide a good investment opportunity for the country. The project istechnically feasible, financially sound and socially and economically viable.
Recommendations
It is therefore recommended that a loan not exceeding UA5.17 million from ADF resources and anadditional UA3.76 million from NTF resources be granted to the Government of Malawi for thepurpose of implementing the project as described in this report.

1. ORIGIN AND HISTORY OF THE PROJECT
1.1 Hitherto, Malawi had been overly dependent on tobacco as the main export crop and on maizeas the principal staple food. In order to reduce the risks associated with over dependence on this limitedrange of agricultural commodities, the Government of Malawi has in recent years pursued a policy ofagricultural diversification. It is in this light that the Government sought to exploit the existingpotentials in the country’s sugar industry both in terms of available export opportunities resulting fromMalawi’s relatively low cost of sugar production, and the expanding domestic and regional demand forsugar and sugar products. The successful exploitation of these potentials would enable the countryincrease the size and reliability of its export earnings, and substitute fuel imports (by ethanol producedas a by-product of cane sugar production). It is noteworthy that Malawi imports petrol through thePetroleum Commission who in turn distributes it after blending with ethanol it procures from theEthanol Company of Malawi (ETHCO). Presently, Malawi’s petrol contains 19% ethanol and it isenvisaged that this level of blending could be raised to 20% ethanol. Sugar-cane production wouldincrease small-holder (including women) farmers’ incomes and enhance the Government’s policy goalof alleviating rural poverty.
1.2 An outgrower sugar-cane production scheme was started in 1996 around Dwangwa (Annex1) with a few farmers (including women), producing cane on customary land. The cane producedwas sold to Dwangwa Sugar Corporation (DWASCO), then with a majority Government share-holding, but now fully privately-owned, through the Small-holder Sugar Authority (SSA), aGovernment parastatal, and on an average, each farmer received UA877 per annum after alloperating costs had been discounted. This return was much higher than for rice, cassava and othercrops grown on customary land in the area. With the upsurge in demand on both the domestic andinternational sugar market, and with Malawi having a competitive record in low cost of sugarproduction, the opportunity to expand the sugar industry became imperative.
1.3 In pursuance of its policy of diversifying agricultural production and alleviating poverty, theGovernment of Malawi (GOM) on behalf of the SSA, sought the Bank Group’s assistance in March,1998, to finance the Small-holder Outgrower Sugar-cane Production Project (SOSPP), located atDwangwa, about 270 km north-east of Lilongwe. The Bank launched a preparation mission in August,1998 followed by a pre-appraisal mission in December, 1998, and an appraisal mission in July, 1999.This report reflects the findings of the appraisal mission, as well as agreements reached with the GOMand other stakeholders.
2. THE AGRICULTURAL SECTOR
2.1 Salient Features
2.1.1 Agriculture is the mainstay of Malawi's economy contributing 37% to the Gross DomesticProduct (GDP), 95% of the foreign exchange earnings, and accounting for 87% of employment of therural labor force during 1998. The sector also provides two-thirds of raw materials for themanufacturing sector. Malawian agriculture is dualistic. Small-holder farmers (contributing more than80% to agricultural GDP) engage mainly in subsistence farming on plots of less than one hectare perfamily while the estate sub-sector mostly produce export crops such as tobacco, tea, coffee and sugaron farms of 10 ha and more. Livestock numbers are low, especially in the Northern Region, due toshortage of fodder during the long dry season. Women comprise 70% of those actively engaged inagriculture.

2
2.1.2 Small hectarage and low productivity resulting from poor technology, and especially heavydependence on rainfall in a country with an increasing incidence of severe droughts underlie thepoverty that characterize Malawian small-holder farmers. These factors combined with the largeaverage family size of six persons result in the crops (such as maize, cassava and beans) produced bymost small-holder families being enough to feed them for only 6 months of the year. During the rest ofthe year, these farmers depend on off-farm activities to raise the necessary cash for their food supply.Consequently, food insufficiency is pervasive in most Malawian households.
2.1.3 A 1996 Vulnerability Assessment and Mapping study estimated rural annual per capita incomein Malawi at US$66 per annum with the poorest households earning as low as US$35 per annum. Thestudy estimates that if nutrition standard, access to health facilities, education, sanitation and genderdisparities are taken into account, those living in absolute poverty would reach 80% of the population.Increasing health problems, especially the worsening AIDS epidemic, has aggravated the incidence ofpoverty in Malawi. Persons directly affected (the sick) can not contribute to production; relatives andothers around them, though not personally affected, spend much time and resources attending to thesick and attending funerals. The care of orphans and parents left behind by dead members of familiespose an additional strain on family and national resources.
2.1.4 Women are entrusted with the primary responsibility for decision making in food production(both crops and livestock) and utilization within households. They also play a supportive role in respectof cash crop production. As a result of the growing number of female-headed households (due to risingdivorce rate, deaths, and out-of-the-farm employment by men), women are becoming increasinglyempowered to make decisions concerning cash crop production. Presently, female-headed householdsconstitute 40% of small-holder households and about 40% of the ‘absolutely poor’. Their farmholdings average 0.5 hectare and they have limited access to agricultural resources and services. Theconstraints that prevent women from increasing their agricultural production include inadequate on-farm labor and land, lack of credit, inputs, training, and extension advice. Additionally, women spend alarge part of their time and energy on household chores such as child raising, water and firewoodcollection that take much of their time.
2.1.5 Tobacco is the main export earner, and accounts for over 80% of the real value ofagricultural exports, while tea, sugar and coffee account for about 7.5%, 7.4% and 4.1%,respectively. Due to an increase in the area put to hybrid maize cultivation, maize production for the1997/98 season increased by 32% (over the previous year) to 1.77 million mt. Rice productionincreased by 4.5% over the previous year to 68,658mt in the 1997/98 season largely on account ofan increase in productivity. The production of pulses increased by 16.3% from the previous year to209,000mt in 1997/98, due to favorable weather conditions. Owing to the diversification of thesmall-holder production system, the production pattern has changed in recent years such that theshare of maize in small-holder crop plantings has decreased from 70% in 1989-91 to 55% in1995/96 and 51% in 1997/98.
2.1.6 In order to support the Government’s efforts towards overcoming constraints in the sector, theBank Group strategy in the Agriculture sector over the 1999-2001 period emphasizes irrigationdevelopment and diversification of agricultural production. Particular emphasis is placed ondiversifying food production from over dependence on maize to other crops, including roots and tuberswhich are drought tolerant. Government is also promoting the production of high value crops such assugar-cane, fruits, vegetables, spices, etc.

3
2.2 Institutional Arrangements and Governance
2.2.1 Within the Ministry of Agriculture and Irrigation (MOAI) the Controller of AgriculturalServices (CAS) is responsible for the formulation, implementation and co-ordination of agriculturaldevelopment programs. The unit co-ordinates MOAI’s relations with national and internationalagricultural institutions, including farmers’ organizations (such as sugar estates and out-growerschemes), and agricultural marketing parastatals. In this capacity, the CAS represents the Secretary forAgriculture in the respective Boards for these organizations. The Controller of Agricultural PlanningServices (CAPS), is responsible for planning, monitoring and evaluating agricultural developmentprograms and projects. The Department of Irrigation (DOI) formulates irrigation policies and overseesthe development of sustainable and economically sound irrigation systems. The Salima AgriculturalDevelopment Division (SLADD) co-ordinates project activities with other agricultural field services inNkhotha-Kota district.
2.2.2 The financial institutions providing relevant services to the sub-sector in Malawi include theNational Bank of Malawi, the Commercial Bank of Malawi, the Investment and Development Bank ofMalawi, Malawi Rural Finance Company, the Small Enterprise Development Organization of Malawi,the Malawi Mudzi Fund and the Malawi Union of Savings Co-operatives Ltd. These institutions playan essential role in the transfer of resources to resource-poor rural farmers.
2.2.3 The GOM with the assistance of the donor community are working on the Malawi AgriculturalSector Investment Program (MASIP) that will form the focus of agricultural sector developmentprograms. Some steps have been taken with a view to improving the performance of certain aspects ofthe sector, including the privatization of the SSA (in April, 1999) and progressive liberalization of thesugar marketing system in the country.
2.3 Sector Policy Framework
2.3.1 In its policy paper issued in November 1998, the Government pledged to continue with effortsthat could alleviate poverty, address gender inequality and enhance welfare and incomes of agriculturalcommunities. This will be achieved principally through agricultural expansion, incorporating increasedfood production with a view to achieving food self-sufficiency, and diversification of agriculturalexports whilst conserving natural resources; commercialization of subsistence agricultural economy,combined with improvements in infrastructure and marketing arrangements. To strengthen the role ofthe private sector in agriculture the Government will continue in its efforts to divest its directinvolvement in economic activity through the commercialization of the Agricultural Development andMarketing Corporation (ADMARC) and the privatization of the small-holder crop (tobacco, tea, coffeeand sugar) authorities.
2.3.2 Furthermore, Government will take steps to minimize long-term constraints to agriculturalperformance, including raising soil fertility, increasing land and water use efficiencies andstrengthening farmer and rural community organizations. Following the recommendations made by thePresidential Commission of Inquiry on Land Policy released in mid-1999, the Government hasembarked on a land policy reform. Most of these reforms are being brought together in the MASIP,whose modalities are being finalized with the assistance of donors.

4
2.4 Land Tenure and Land Use
The Land Act of 1971 categorizes land into public, private or customary land, whose proportions are22%, 13% and 65%, respectively. Land in the small-holder sector is primarily held under customaryland tenure system. In villages, land is generally sub-divided into three categories: communal land,such as grazing land and forest reserve; reserve land which is not yet allocated but is entrusted to thevillage headman; and leasehold land which is subject to individual or nuclear family rights. Rights toleasehold land are transferred from one generation to another in accordance with the system ofinheritance. In accordance with the Malawi Land Act of 1971, small-holder farmers (includingwomen) have, in principle, been able to register customary land assigned to them by authority of thevillage headman, as leasehold of 21 years duration with a possibility of extension to 99 years subject tocompletion of survey and registration formalities. Furthermore, The new Land Policy being finalizedis expected to improve the security of tenure for small-holder farmers and address the issues of landuse, ownership, transfer, gender, etc. It is noteworthy that the law of land inheritance (section 24 ofthe 1995 Constitution) confers on women full and equal protection against discrimination in respectto access to land, including that obtained by inheritance.
2.5 Constraints to Agricultural Development
Although the structural and sectoral adjustment measures adopted by GOM since the mid-1980s haveimproved agricultural performance, the small-holder farmer is still faced with an array of constraints.The constraints to agricultural development in Malawi include low and declining productivity ofcropland that has no fallow, lack of capital or credit to purchase inputs and farm implements, high costof credit and farm inputs, lack of marketing channels and marketing information systems, inadequateextension advice, inadequate supply of improved seed varieties, and insufficient village-level storageand processing facilities. Furthermore, small-holder agricultural production is considered byCommercial Banks as a risky venture (especially with the recurrent droughts and floods), and withlack of collateral it is difficult for small-holder farmers to secure loans. The feature of theagricultural sector which is predominantly small-holder-based, exacerbates these constraints. Whilemost of these constraints are being addressed under the Government’s agricultural adjustment program,erratic rainfall patterns and recurrent droughts continue to severely constrain small-holder agriculturalproduction. For small-holders to achieve higher productivity and efficiency, such barriers as socio-economic and gender disparities need to be removed.
2.6 Donor Co-ordination and Intervention
2.6.1 The donor community in Malawi has generally welcomed the project and commended it forbeing consistent with the MASIP framework, which is the agreed framework for donor support tooperations in the sector. In consonance with the MASIP framework, the project seeks to expand anddiversify agricultural exports, raise farm incomes and therefore alleviate poverty, improve foodsecurity, promote economic growth, and conserve natural resources while, for the most part usingexisting management structures.
2.6.2 Donor interventions in the agriculture sector include the following on-going Bank Groupfinanced operations: Agriculture Services Project, Lilongwe Forestry Project, Mwanza RuralDevelopment Project, Zomba Rural Development Project, National Livestock Development Project,Small-holder Macadamia Development Project, Small-holder Irrigation Project, Horticulture and FoodCrops Project, and Rural Incomes Enhancement Project. Similar intervention by other donors in thesector include the provision of institutional support to the DOI by the German Government and theIFAD-financed small-scale irrigation component of the country’s FAO-sponsored Special FoodSecurity Project (SFSP). The French Government has financed the construction of a pilot small-holderirrigation scheme south of the existing Kasinthula irrigation scheme in Nkhota-kota district; the

5
Chinese Government has donated 200 irrigation pumps to assist Government irrigation projects; theJapanese International Cooperation Agency (JICA) is financing the design for, and construction of a800-ha irrigation scheme in Bwange Valley in Salima ADD. In addition, the European Union (EU) isfinancing the construction of 10 self-help irrigation schemes using river diversion and gravitytechnology in Blantyre, Liwonde and Mzuzu ADDs. The Danish International Development Agency(DANIDA) is providing significant support to the irrigation sub-sector, assisting in finalizing theirrigation policy, institutional assessment and studies of dam and water catchment potential.
3. THE SUGAR-CANE SUB-SECTOR
3.1 Sugar-cane production in Malawi dates back to the 1960s when the Lonrho-owned SugarCorporation of Malawi (SUCOMA) began operations in the Shire Valley. In 1978, a second estate,Dwangwa Sugar Corporation (DWASCO) was established with a majority Government share-holding.Same year, an additional 698 ha at DWASCO was allocated to some 200 small-holder farmers underthe aegis of the Small-holder Sugar Authority (SSA), a Government parastatal. The SSA provided thesmall-holder farmers with an array of services such as loans (for seedcane, fertilizer, cane cutting andhaulage) and training which assisted them in cultivating their plots. The harvest was collectivelymarketed through the SSA who deducted the loan given to the farmers. The combined area of bothestates (SUCOMA and DWASCO) was gradually increased and in 1998/99 stood at 16,800 ha with acombined annual cane production of 1.68 million mt.
3.2 There is a high demand for sugar-cane as raw material for the production of sugar and ethanol.The two cane crushing mills in Malawi (DWASCO and SUCOMA) crystallized 195,300mt of sugarfrom the 1.68 million mt of sugar-cane produced in 1998/99 season. Out of this raw cane production,small-holder outgrower farmers accounted for 93,500mt (or 5.5%). The Ethanol Company (ETHCO)uses 50,000mt of spent molasses (from SUCOMA and DWASCO) to produce about 15 million litersof ethanol for domestic and foreign markets, each year. The processing patterns of DWASCO andETHCO indicate that there is need to increase cane production to meet the installed capacities of thecompanies, especially as DWASCO has recently expanded its mill cane crushing capacity from 150 to175mt of cane per hour. Furthermore, plans are under way to increase the capacity to 210mt of caneper hour, enough to cater for cane to be produced by this project and other potential growers.
3.3 Sugar is Malawi's third largest agricultural export item, after tobacco and tea. In 1998, Malawiproduced about 207,000mt of sugar, with 17% sold into preferential markets and 77% solddomestically; the rest was sold to the USA. (World sugar production in 1998/99 was 123 million mt).Prospects for sugar (and hence for sugar-cane) in the local market are good and reliable. Sugarconsumption in the South African Development Community (SADC) region has shown an averageincrease of 4% per annum over the past seven years and so substantial growth in domestic markets isanticipated.
3.4 Malawi is unable to meet its guaranteed annual sugar export quotas (ranging from 45,300 to56,000mt of sugar) to the preferential markets at preferential prices in the EU, Portugal and the USA.Under the 1996 Lome IV agreement, Malawi exports a guaranteed 21,000mt of sugar annually to theEU at a preferential price per mt of £458 (UA540), CIF or £428 (UA504) FOB. Furthermore, aguaranteed 14,000mt is exported annually to Portugal at CIF prices of US$495 (UA370) per mt orFOB US$446 (UA334) per mt. Malawi’s annual sugar export quota to the US market is based on 1%of the USA global import requirement, and ranges from a minimum of 10,300mt to a maximum of21,000mt at per mt price of US$501 (UA375), CIF and US$428 (UA320), FOB. Capacity exists in thedomestic market to absorb future incremental production because of the low per capita domesticconsumption of 14kg (compared to 19kg/capita for the SADC region).

6
3.5 Average export prices for 1998/99 season was UA295/mt. Current retail price of white sugar inMalawi is UA379/mt compared to UA451, UA487, UA497, UA553, UA531, and UA686 per mt inSouth Africa, Mozambique, Zimbabwe, Kenya, Tanzania and Zambia, respectively. Hence local sugarprices are quite competitive sub-regionally. With an export parity price of UA290 per mt, world sugarcannot be imported into Malawi competitively.
3.6 Irrigated production is the most effective way to increases raw cane production. However,because of the high initial investment cost and lack of finance for production inputs, small-holderfarmers have not been able to benefit from the potential gains inherent in the sugar industry. The twoestates (at Nchalo and Dwangwa) have been supporting outgrowers with production services such asland preparation, provision of seed cane and fertilizers with the ultimate aim of purchasing theirharvests, thereby enabling the farmers to benefit from the industry.
3.7 The largest irrigation scheme so far (over 9,000 ha) in Malawi was developed by the SugarCompany of Malawi (SUCOMA) and came on stream in 1965. This was followed by theestablishment of 6,000 ha of irrigated sugarcane by Dwangwa Sugar Company (DWASCO) in 1979.Currently, the harvested irrigated area for all crops is estimated at 26,000 ha, inclusive of 3,650 ha ofself-help water catchment holdings. The estimated total potential irrigation area is 200,000 ha locatedalong the Lake littoral and River Shire valley. On the formal irrigation schemes at the special cropestates, the most widely used (about 60%) system of irrigation is surface type, using both furrows andbasins. Sprinkler irrigation is the next popular system used on the large estates. This status quo iscurrently being replaced with pivot systems because of the need to have higher water use efficiencyand conservation for sustainable production.
3.8 The Bank Group has not financed an irrigated sugar-cane production project in Malawibefore. However, it is currently financing the Smallscale Irrigation Development Study (UA1.12million) and four projects that have irrigation sub-components in them as follows: AgricultureServices (co-financed by the World Bank), Rural Income Enhancement, Small-holder Irrigation,and Horticulture and Food Crops (all totaling UA28.78 million).
3.9 Sugar-cane has generally been considered by the GOM as a special crop, because its cultivationrequires special skills. With its acquired experience in sugar-cane agronomy since 1978, Governmentregarded the Small-holder Sugar Authority (SSA) as the appropriate agency to carry out developmentof sugar-cane production, including provision of extension services and input loans to farmers, byoptimally utilizing scarce resources for increased production and productivity of sugar-cane by small-holder (including women) farmers. SSA’s overall performance in sugar-cane production has beengenerally satisfactory over the years. Apart from the headquarters facilities, SSA acquired specializedskills in group dynamics and organization, small-holder loan administration, irrigation engineering, andequipment (farm machinery, transportation equipment, etc.).
3.10 In its drive to foster broadbased economic development and private sector involvement in thesector, the Government recently privatized the SSA. In a farmer/staff/management buy-out, thefarmers, staff and management (all totaling 215) of the former SSA acquired the technical arm of theSSA which became the Dwangwa Cane Growers’ Company (The Company). With its experience inthe sugar-cane production industry, the Company continues to provide advisory, management andmarketing services to both the old and new sugar-cane farmers. In order to consolidate the gains of theformer SSA, the Government created the Dwangwa Cane Growers’ Trust (The Trust) and saddled itwith the responsibility for providing sub-sector policies on sugar-cane production and promoting theexpansion of small-holder sugar cane production around Dwangwa. A similar Trust for the 1,544-haKasinthula Outgrower Scheme that feeds the Nchalo Sugar Factory has been operational since 1997.

7
4. THE PROJECT
4.1 Project Concept and Rationale
4.1.1 The Government of Malawi recognizes that the potential exists for increasing sugar-caneproduction in the Dwangwa area of Nkhota-Kota district. The realization of this potential willenable the country to improve its foreign exchange position both through increased sugar exportearnings and substitution of ethanol for imported fuel. It would help provide employment for thefarmers, improve incomes and food security among the poor, and improve social and physicalinfrastructure in the rural areas around Dwangwa. The factors underlying the comparativeadvantage in producing sugar-cane in Dwangwa area include: availability of land suitable for sugar-cane production in the vicinity of Dwangwa Sugar Corporation milling facilities; low cost ofproduction for Malawi cane sugar being lower than that in most competing producers in the sub-region (mainly due to low cost of labour); sucrose extraction rate for cane produced in theDwangwa area being higher than the average for Malawi generally and for the Southern Africansub-region; impressive experience since 1978 of co-operative arrangements between DWASCO andsmall-holder outgrower farmers operating under the DCGC; ready market for sugar-cane asDWASCO’s cane milling capacity has been expanded to cater for increased cane production;DWASCO’s willingness to source a proportion of its expanded requirement for cane fromoutgrowers in the vicinity of its plant and to extend its co-operative arrangement to these newoutgrowers; and expressed interest by potential outgrowers to enter into a co-operative arrangementsimilar to that existing between DWASCO and outgrowers under DCGC.
4.1.2 To realize this potential it is deemed necessary to employ appropriate technologies, supplyfarm inputs and production support services as are currently being done under theDWASCOC/DCGC/Outgrower Scheme. The center pivot irrigation system has been chosen for agreater land area of the project because it is more water-efficient and has less adverse environmentaleffects. The selection of the system has been based on an analytical examination of time series rainfallrecords, ground water sources, and water evaporation trends for the project area. The overhead, centerpivot irrigation system consists of a single sprinkler lateral with one end anchored to a fixed ortravelling pivot structure. The lateral pipe with sprinklers is supported on drive units and suspendedcables or by trusses between the drive units. The drive units are mounted on wheels with low-pressurepneumatic tires that are located 45m apart along the length of the lateral pipe, which may vary from300 to 440m. All three project sites will consist of a total of 39 center pivot units of 40, 50 and 60 hacoverage. By using this combination of pivots, it is possible to cover areas of different topographicpatterns.
4.1.3 The system is also reliable because in arid areas, it could be operated up to 2,200 or morehours/season, both night and day. Its uniform application of droplets of irrigation water over the soilsurface translates to efficient and effective irrigation water application and use, with minimum erosionand drainage problems. Irrigation requirements for cane production have been determined based oncrop water requirements for each stage of growth in accordance with experiments and experiencegarnered from DWASCO and DCGC. All cane at Dwangwa had hitherto been produced with floodirrigation technology, but since 1997, all expansion by DWASCO has been irrigated by center pivotirrigation technology. However, due to cost constraints and topographical reasons, 600 ha (28%) out ofthe 2,140 ha will be put to surface irrigation.
4.1.4 This kind of operation requires a heavy investment in infrastructure development(communication network, irrigation systems, power transmission, etc). The Government has thereforeapproached the Bank Group to provide resources for financing the project. The loan will provide

8
financial resources to enable new outgrowers pay for inputs, and agricultural services provided, financeinfrastructure development, farm machinery and other equipment, and capacity building for farmersand support staff.
4.1.5 The project is consistent with the institutional framework and implementation strategiesproposed under the MASIP because it uses and intends to strengthen an already existing managementstructure. It is also complementary to the recommendations of the Bank’s Country Strategy Paper forMalawi that seeks to support Government’s medium-term strategy, with emphasis on small-holderagriculture and its diversification, transport sector, health, education, participation of the private sectorin the economy, and building of institutional capacity, especially in the area of management and donorco-ordination.
4.2 Project Area and Project Beneficiaries
Location
4.2.1 Dwangwa is located 270 km north-east of Lilongwe in Salima ADD (Central Region). Threesites (Liwaladzi, Kasitu and Katimbila) totaling 2,140 ha have been selected for this project, usingcriteria such as distance from the crushing mill, source of and means of abstracting irrigation water.
Climate
4.2.2 The climate of Lake Malawi shoreline, where the project sites are located, is characterized bythree seasons: a) wet season from December to April (25oC mean temperature); b) cool and dry seasonbetween May and August (20oC mean temperature); and c) hot and dry season between September andNovember (28oC mean temperature). There is adequate annual solar radiation of about 7,000 Langleysand mean daily sunshine of 9 hours (especially at cane ripening between) for optimum sucrosedevelopment.
Rainfall
4.2.3 Rainfall distribution between December and April displays a characteristic peak inMarch/April and is adequate for the sugar-cane crop. However, the values of effective rainfallduring the remaining months of May to October are low and water evapotranspiration is too highfor optimum cane growth, requiring supplementary irrigation for plant growth. Long-term rainfallrecords estimate the annual rainfall for different frequencies of occurrence as a): wet (1,700 mm) at20% frequency of occurrence, b): average (1,388 mm) at 50% frequency of occurrence and c): dry(1,066 mm) at 30% frequency of occurrence.
Topography, Soil and Vegetation
4.2.4 Land topography is generally flat, characteristic of the Lake Malawi lowlands, with a gentleslope (1:450) towards Lake Malawi which is located eastwards. The soils of the Dwangwa delta andidentified neighboring areas have high water tables in the wet season but with low transmissivity in thedry season. The soils are variable alluvial or colluvial deposits, poor to imperfectly drained and ofvariable texture. The topography and soils of the project sites are suitable for sugar-cane, as well as agreat variety of other crops such as rice and cassava. Natural vegetation is mainly grass and sedges(such as Setaria spacelata, Erasgrostis pyramidalis, and Panicum spp.) interspersed with trees andshrubs (such as Azadirachta indica, Acaia nigrescens, Pterocarpus angulensis, Moringa oleifera andRaphia farinifera palms.

9
Water Resources for Sugar-cane Irrigation
4.2.5 Presently, the total licensed water abstraction from Dwangwa River and Lake Malawi in thearea is 408,000 m3/d and 192,000 m3/d, respectively. The groundwater table in the project area isrelatively close to the surface, but tubewells (up to 50m deep) have poor water yield due to lowtransmissivity of the aquifer layers. Consequently, there is no groundwater available in the Dwangwaarea for further irrigation purposes.
4.2.6 Lake Malawi will supply irrigation water to Liwaladzi site (610 ha) through the Hippo Pool.Although a sand bar presently blocks the estuary feeding the pool, a channel will be opened to allowinflow into the estuary. The Mkoma River will supply the Kasitu site (600 ha) with irrigation water.The river has of recent, especially after the March 1999 floods exhibited a meandering course. For itswaters to be abstracted the river will be trained and diverted to its original course. The Dzandza swampwill supply Katimbila site (930 ha) with irrigation water. The swamp is naturally replenished byground water intrusion from Lake Malawi.
4.2.7 Shallow groundwater (1.5-4.5m) from 25 wells sampled monthly over a year and samples ofwater taken from the rivers in the project sites show an average conductivity of 200 mhos/cm and apH of 6.6, indicating water of very satisfactory quality for sugar-cane irrigation. Lake Malawi hassimilar properties. With these waters, there will be no need for leaching requirements.
Demography
4.2.8 The total population of Dwangwa area is 23,200, of which 51% are males and 49% females.Settlement is of a scattered nature with more people living near their farm fields or in small villages.Dwangwa town is the only semi-urban center where health and other social amenities are availablewithin 40-km radius of the three sites. Average population density is 62 persons/km2 and annualpopulation growth is estimated as 3.6%. Most people make their living by farming and fishing (onLake Malawi). The Dwangwa Sugar Corporation is a major employer in the area. Although poverty ispervasive in Malawi, poverty has been ameliorated in the project area because a significant proportionof the population is employed either as farmers, fishermen and traders in agricultural produce such astobacco and sugar.
Project Beneficiaries
4.2.9 The project’s target group is the 1,070 farmers (of which 210 are women) around Dwangwawho desire to come into the expanded outgrower sugar-cane production scheme that is being promotedby the Government through the Trust. The Dwangwa Sugar Corporation will also benefit from theextra raw cane that will feed their crushing mill whose capacity has recently been expanded, while theEthanol Company will obtain an increased tonnage of molasses for ethanol distillation. Project’sactivities will provide long-term employment, income and food security for the targeted small-holdersugar-cane farmers in Salima ADD, thus assisting in reducing poverty in the project area.
4.2.10 Road development activities in the project will enhance transportation of goods and persons,and as such, promote human mobility, communication and trade in the project area. DCGC staffwill benefit through their participation in project funded training scheme, as well as their interfacewith the TA Financial Controller. Farmers will also be organized into groups to empower their lotand receive training in basic sugar-cane agronomy.

10
4.3 Strategic Context
4.3.1 From a national economic point of view, the project will increase Malawi's agriculturalearnings through the increased quantities of refined sugar that will be sold on the local andinternational markets. A by-product of sugar extraction, ethanol, will lead to import substitution forpetrol (up to 20%) which will conserve scarce foreign exchange for other pressing needs. At fulldevelopment in 2004, the project will result in annual production of 248,240mt of sugar-cane, fromwhich 34,754mt of raw sugar will be produced. At 1998 constant prices of UA150 per mt, this willtranslate to a value of UA5.21 million annually. Furthermore, 2.8 million liters of ethanol will beproduced from spent cane molasses annually, and at the present off-the-pump price per liter of petrol atUA0.44, it will result in the saving of UA1.24 million annually from petrol imports.
4.3.2 The project will contribute to poverty reduction by providing opportunities for increasedrural labor employment and incomes for small-holder sugar-cane farmers. Higher incomes willincrease the ability of rural farm families to purchase food items, thereby contributing to enhancedfood security. From the average land holding of 2 ha per outgrower farmer at full projectdevelopment in 2004/05, each farmer will realize an estimated UA2,900 net annual income, whichis four times as much as the value (UA728) each farmer under rainfed production gets.
4.3.3 The average land holding in the present scheme at Dwangwa is 3 ha per outgrower. In order tospread the benefits of the investment in the project to a larger number of beneficiaries, while at thesame time maintaining a holding size that is economically viable, and considering the technology andinvestment employed, the average size of holding has been reduced to 2 ha.
4.3.4 At the inception of the sugar-cane outgrower scheme in 1978 in Dwangwa, women wereexcluded from ownership of sugar-cane plots because they were considered as being unable to copewith the physical requirements of cane planting, management and harvesting. Since then, 19 women(10% of current sugar-cane outgrowers) have inherited their deceased spouses’ plots and beenshown to perform well and earn as much income as their male counterparts. The project intends toenhance women participation in its activities by allocating at least 20% of total number of plots towomen. The Government will be required to give an undertaking to this effect as a condition forloan effectiveness.
4.4 Project Objectives
The sector goal is to increase sugar-cane production, which will in turn improve foreign exchangeposition and increase farmers’ income. The project’s specific objective is to alleviate poverty of small-holder sugar-cane outgrower farmers (including women) around Dwangwa by increasing their incomeand improving household food security.
4.5 Project Description
4.5.1 The project will increase small-holder sugar-cane production area by 2,140 ha and productivity(by over 130%) through better access to inputs, irrigation and advisory services. The project will pumpthe waters of Lake Malawi and River Mkoma via lined canals to supply surface and center pivotirrigation systems for 2,140 ha of land planted to sugar-cane.

11
Sugar-cane Production Support
4.5.2 The project will provide farmers with loans to purchase inputs (such as seed cane andfertilizers) and pay for activities (such as land preparation and cane transport). The project will alsoprovide loans to enable outgrower farmers purchase seed and fertilizers to crop the fringes of theirrigated project sites (an estimated 206 ha) with maize, beans, cassava and vegetables. This willenhance household food security and efficient labor use during periods in the growing season whenlabor requirement is low.
Infrastructure Development
4.5.3 The main component of the irrigation system will comprise surface and central pivot systemsthat will be supplied with water pumped by electricity or stationary and mobile diesel engines. Thewater supply infrastructure and distribution network for the identified project areas consists of a total of46 km of canals, 17 lifting plants and 39 units of center pivot irrigation equipment with variable landarea coverage to suit land terrain. The project will also construct a river diversion structure and fourpumping stations for lifting plants, and expand national electricity network by constructing anadditional 15-km power line to bring power to the pumping stations. The project will purchase fieldmachinery such as tractors, trailers, cultivators, harrows and other operational tools for effective andtimely implementation of cane production activities. Furthermore, tubewells and ancillary structureswill be constructed to upgrade water supply to the farmers, just as sanitation will be improved by theconstruction of latrines in the farmers’ communities.
Capacity Building
4.5.4 The Dwangwa Cane Growers’ Trust has limited capacity to carry out its responsibility ofsupervising and monitoring the project. Its capability will be enhanced with the services of aProcurement Officer and Project Supervisor to be acquired by the project. Financial managementcapacity of the project will be enhanced by the procurement of the services of a TA FinancialController to manage project funds in the first two years of the project’s life. The TAs are expectedto train counterpart staff to take over their functions at the expiration of their tenures. The projectwill also train farmers, supervisors and managers in the techniques of irrigated sugar-caneproduction, especially as the proposed irrigation technology is relatively new in the country.Management of the project will be enhanced by the purchase of vehicles and sundry officeequipment. A radio communication system of 50-km radius will be installed for effective co-ordination of the three sites. One main, and three satellite administration blocks will be constructedto accommodate additional staff. Furthermore, a central warehouse will be constructed to storesundry farm inputs, equipment, spares and other materials.
4.6 Production, Markets and Prices
Yields and Production
4.6.1 The present sugar-cane yields under rainfed, surface and center pivot-irrigated conditions are50, 107 and 140mt/ha, respectively. For the purpose of the project and bearing in mind that 600 out ofthe 2,140 ha will be put to surface irrigation, cane yield of the project has been aggregated and put at aconservative 116mt/ha and sucrose content at 14% (as against the present content of 14.85%). Over thenext twenty years, average yields per ha under irrigated conditions are expected to remain at about116mt of cane (and 14% of sucrose content) per hectare. It is noteworthy that sucrose content ofMalawi small-holder outgrower sugar-cane at 14.85%, is higher than the average (13.6%) for the sub-region, including Mauritius.

12
4.6.2 Current annual sugar-cane production at the DCGC scheme (estate small-holders andoutgrowers) is 93,500mt, which represents 13% of total production at Dwangwa (701,500mt of cane).At full capacity the project will produce 248,240mt of cane i.e. 35% of total production at Dwangwa.In 1998, DCGC cane production accounted for 5% of cane crushed by the industry countrywide. Atfull project capacity, this is expected to increase to 19%.
Market Prospects and Marketing Arrangements
4.6.3 There is a ready market for farmers’ raw cane at DWASCO that has recently expanded its millcane crushing capacity from 150 to 175mt of cane per hour. Plans are under way to further increase thecapacity to 210mt of cane per hour, enough to cater for cane produced by this project and otherpotential growers in the area. The distance that farmers’ cane would be transported to the mill gateformed a criterion for site selection, hence the maximum distance is 35 km from the mill.
4.6.4 Under the terms of the sugar-cane sales agreement signed in 1996 between DCGC, theFarmers’ Association and DWASCO, outgrowers produce sugar-cane that is marketed directly andsolely to DWASCO. Sugar-cane produced by each farmer is hauled by contractors from the farm gateto DWASCO's weighbridge and the weight is recorded. A sample of juice is taken from the farmer'sharvest to determine sucrose content. Both cane weight and especially, sucrose content are used todetermine price and overall sugar production of the farmer concerned.
Prices
4.6.5 The sugar-cane produced by the DCGC is sold to DWASCO according to the price formulaagreed in the sugar sales agreement noted above. The price is an indirect reflection of production costsand market forces and is updated from time to time when costs of production fluctuate. The sucrosecontent directly determines the price per ton of sugar-cane sold to DWASCO. A higher price is paid tofarmers whose cane lots record higher sucrose content. Prior to the 60% devaluation of the MalawiKwacha in August 1998, the prices that DWASCO paid for a metric tonne of sucrose and cane wereUA131 and UA19, respectively. After devaluation, the sales agreement was revised and commensurateincreases in the prices for sucrose and cane were effected. The prices per tonne of sucrose and cane arestill UA131 and UA19, respectively. For the 1999/2000 production season, combined price per metrictonne for sucrose and cane is projected to remain at UA150.
4.7 Environmental Impact
The project is classified as Category II according to the Bank Environmental guidelines. All projectsites have to a greater extent been put to crop cultivation, except for limited sections of shrubs andyoung bushes that resulted from natural re-growth of fallow land. The scale of the project is small withneither major hydraulic infrastructures nor alteration of existing hydrologic systems involved.Irrigation will provide vegetation cover almost around the year and help reduce soil and sheet erosiondue to heavy rains and strong winds. Contingency plans have been put in place to mitigate anticipatednegative environmental impacts of the project (see Annex 2).
4.8 Social Impact
4.8.1 The project economy will benefit through long term employment, income and food security forthe 1,070 targeted small-holder sugar-cane farmers in Salima ADD. With a per hectare net income ofUA1,452 per annum, the project will reduce poverty in the project area and improve the standard ofliving of the beneficiaries. Furthermore, the provision of sanitation facilities and potable water willenhance the health of the community where the farmers live. With better incomes, farmers can affordbetter education for their children. Road development activities in the project will enhance

13
transportation of goods and persons, and as such, promote human mobility, communication and tradein the project area. Training of farmers in sugar-cane agronomy and management will lead to increasedknowledge and therefore improved agricultural practice and better management of cane productioninputs and other resources. The formation of farmer groups will enable farmers work together with acommon goal and strengthen their bargaining position with regards produce prices and other rights.Lastly, the project will create seasonal jobs for some 300 farm hands that will be hired for threemonths during cane harvesting. There will also be a private sector linkage as cane haulage will becontracted out to local transporters.
4.8.2 The project has been designed with the recognition of the need to enhance female sugar-caneout-grower farmers’ well-being by giving at least 210 women increased opportunities to grow sugar-cane and generate incomes. By so doing, the project will have a direct impact on women’s activities bytargeting female small-holder farmers.
4.8.3 While helping with agricultural diversification the project will enable beneficiaries afford ahigher level of quality inputs to cultivate traditional food crops such as maize, rice and cassava on thefringes of their irrigated sugar-cane farm plots thereby further reinforcing household food security.
4.9 Project Costs
The total project cost is estimated at UA10.28 million out of which UA6.35 million or 61.77% will bein foreign currency and UA3.93 million or 38.23% will be in local currency. A summary of the projectcost estimates by components and by category of expenditure are shown in Tables 4.1 and 4.2,respectively. According to the Unit Value Index of Manufactured Exports from the G-5 IndustrialCountries to Developing Countries (MUV Index), price contingencies of 5% (for foreign exchangebased expenditures) and 15% (for local cost based expenditures) have been applied to the cost items.Total contingencies amount to UA0.84 million or 8.2% of total project cost. Cost estimates are basedvariously on quotations received from contractors, suppliers, government agencies and internationalrates (for consultancy services) net of taxes.
Table 4.1: Summary of Project Cost Estimates by Components
MK million UA million %
Components
Foreign
Exchange
Local
Cost
Total
Cost
Foreign
Exchange
Local
Cost
Total
Cost
Foreign
Exchange
Sugar-cane Production
Infrastructure Development
Capacity Building
36.15
269.45
31.17
87.74
121.68
8.59
123.89
391.13
39.76
0.62
4.60
0.53
1.48
2.06
0.15
2.10
6.66
0.68
29.52
69.07
77.94
Total Base Cost
Physical Contingency
Price Contingency
336.77
14.11
20.84
218.01
5.17
7.50
554.78
19.28
28.34
5.75
0.24
0.36
3.69
0.10
0.14
9.44
0.34
0.50
60.91
70.59
72.00
TOTAL PROJECT COST 371.72 230.68 602.40 6.35 3.93 10.28 61.77

14
Table 4.2: Summary of Project Cost by Category of Expenditure
MK million UA million %
Category of ExpenditureForeign
ExchangeLocalCost
TotalCost
ForeignExchange
LocalCost
TotalCost
ForeignExchange
A. Civil WorksLined CanalCulvertPump StationsLand LevelingRiver DredgingElectric Power LinesFlood ProtectionDrainage WorksWater SupplyRoadsBuildingsLand Preparation
B. Irrigation SystemEquipmentLifting PlantSteel PipelineMeteorological gadgets
C. VehiclesD. Farm Machinery and EquipmentE. Office Equipment and SuppliesF. Farm InputsG. Staff SalariesH. TrainingI. Technical AssistanceJ. Operation and Maintenance
102.9625.5029.67
0.706.368.761.16
34.20
4.6817.55
105.23
39.884.566.28
16.205.004.26
20.387.201.939.852.86
14.03
67.686.030.098.503.28
39.884.566.28
16.205.004.26
20.387.201.939.852.86
14.03
102.9625.5039.67
0.706.368.761.16
101.886.034.77
26.05108.51
1.760.430.510.010.110.150.020.58
0.080.301.80
0.680.080.110.270.080.070.350.120.030.170.050.24
1.150.10
*0.000.140.05
0.680.080.110.270.080.070.350.120.030.170.050.24
1.760.430.510.010.110.150.021.730.100.080.441.85
0.000.000.000.000.000.000.000.000.000.000.000.00
100.00100.00100.00100.00100.00100.00100.0033.53
0.0098.1168.1897.30
Total Base CostPhysical ContingencyPrice Contingency
336.7714.1120.84
218.015.177.50
554.7819.2828.34
5.750.240.36
3.690.100.14
9.440.340.50
60.9170.5972.00
TOTAL PROJECT COST 371.72 230.68 602.40 6.35 3.93 10.28 61.77
* Figure rounded to two digits. Actual = 0.005
4.10 Sources of Finance and Expenditure Schedule
4.10.1 The project will be financed by the ADF, NTF, GOM and the beneficiaries (Tables 4.3). TheADF loan of UA5.17 million (50.3% of total project costs) will cover the cost of input for caneproduction, purchase motorcycles and bicycles, and finance part of the costs related to operationand maintenance of irrigation equipment. It will also finance part of local cost relating to civilworks, and all costs related to capacity building (such as technical assistance, training, radiocommunication, vehicles and office equipment). In all, ADF will cover 40.8% of the project foreigncosts and contribute 25.1% of total project cost towards financing some local costs relating to civilworks. The NTF loan of UA3.76 million (36.6% of total project costs, or 59.2% of foreign cost),will be used to procure foreign cost based equipment related to the pivot irrigation systemequipment, construct tubewells and procure materials associated with them. It will also finance partof the costs related to operation and maintenance of irrigation equipment. Government’scontribution of UA1.11 million (10.8% of total project cost) will be used for civil works related tothe irrigation system, construction of electric power lines and roads. Project beneficiary contributionof UA0.24 million, equivalent to 6.1% of local costs or 2.3% of total project cost, will be used topay salaries of additional staff recruited for the project.
4.10.2 The financing of part of the project’s local costs, using ADF resources, is justified on thefollowing grounds: first and foremost, the Government is implementing a broad-based program ofmacroeconomic adjustment and structural policy reforms whose objectives are to address long-termfinancial imbalances, and has mobilized its resources to meet the requirements of this program; the

15
Government has rationalized public expenditure and increased budgetary allocations to the socialsector and can not sustainably finance a high proportion of this project without hurting its otherprograms; finally, one of the principal objectives of the project is to alleviate rural poverty withtarget beneficiaries being resource-poor rural farmers.
Table 4.3: Sources of Finance (UA million)
Source Foreign Costs Local Costs Total Costs % of Total Costs
ADF
NTF
Government
Beneficiary
2.59
3.76
0.00
0.00
2.58
0.00
1.11
0.24
5.17
3.76
1.11
0.24
50.3
36.6
10.8
2.3
Total 6.35 3.93 10.28 100.0
5. PROJECT IMPLEMENTATION
5.1 Executing Agency
5.1.1 The Dwangwa Cane Growers’ Trust (DCGT or the Trust) which has the overallresponsibility for promoting small-holder sugar-cane production, will be the Executing Agency forthe project. The Trust has been created as a permanent organ of Government to provide sub-sectorpolicies on sugar-cane production and promote the expansion of small-holder sugar-cane productionaround Dwangwa. In accordance with its statutes, the Trust holds on behalf of Government, theownership of immovable assets of the former SSA, including land and buildings. The BoardMembers (Trustees) of the Trust are the Chairman of the Malawi Law Society (Board Chairman),Secretary of Agriculture and Irrigation, Chairman of the Malawi Society of Accountants, GeneralManager of DWASCO, General Manager of DCGC, two representatives of the Cane GrowersAssociation (association of the participating cane outgrower farmers), and the Traditional Authorityof the project area.
5.1.2 While the DCGT is now fully and legally constituted, and operational, it does not haveadequate human resource capacity to effectively perform the functions expected of it as theproject’s Executing Agency. Presently its secretariat comprises the Secretary to the Trust, anaccountant and some support staff. In order to give the Trust the capacity necessary for it to overseeproject implementation, it is proposed to assign to its secretariat a Project Co-ordinator, and aProcurement Officer. The Project Co-ordinator will be responsible for ensuring that projectimplementation is in accordance with the stated objective of the project. He/she will oversee theliaison among the various stakeholders towards the successful implementation of the project. TheProcurement Officer will be responsible for checking procurement documents prepared by DCGCto ensure that they adhere to approved Bank and Government rules and procedures. In addition tothese two officers, a Financial Controller will be recruited for the first two years of projectimplementation and posted at the Trust’s secretariat. His/her principal responsibility will be tomanage the loan funds and monitor the use of these funds by DCGC in implementing the project.The officer will also function as adviser to the DCGC Financial Controller who will serve ascounterpart to the TA and will take over responsibility for monitoring the financial operations of theproject implementation agency at the end of the TA’s contract period. As indicated in paragraph6.2.1, at the end of the project financing phase, the beneficiaries will have become shareholders ofDCGC and the operations in the new development areas will have been part and parcel of theCompany operations.

16
5.2 Institutional Arrangements
5.2.1 Considering the experience gained by the Management and staff of the DCGC under theformer SSA, the Trust will enter into a management agreement with the DCGC1 to implement theproject (Annex 3). The DCGC inherited from the SSA, human resources (management andsupervisory personnel), specialized skills (in group dynamics, small-holder loan administration,irrigation engineering and organization), and movable assets (including office equipment, farmmachinery, transportation equipment, etc.). The agreement, whose terms will have to be acceptableto the Fund (this will be retained as a loan condition), will spell out the detailed functions to beperformed by the Company. These, amongst others, will include the provision of farm managementservices to the outgrowers in the new expansion areas (the primary beneficiaries of the project), andproviding liaison between the outgrowers and DWASCO in respect of cane sales and productionsupport services provided to the outgrowers by the Corporation. Payment for these services will bemade through deductions from the proceeds of sugar-cane sale by the beneficiaries. The Companywill also keep records of sales and expenses on behalf of the outgrowers, receive cane salesproceeds from DWASCO and pay farmers, after deducting the agreed management fees andoperational costs (farm inputs, the cost of cane haulage, irrigation and drainage expenses, andmachinery use charges).
5.2.2 A Project Implementation Committee (PIC) will be formed with members frommanagements of DCGC and DWASCO, and representatives of beneficiary out-grower farmers andMinistry of Agriculture and Irrigation. The General Manager of DCGC will chair the committee.The PIC will have a purely technical role, advising the implementing agency on technical mattersrelating to sugar-cane production, land allocation, tenure and husbandry practices, and on groupdynamics.
5.2.3 The General Manager of the Implementing Agency will be responsible for all projectactivities. He will ensure that all procurement arrangements are conducted in accordance withapproved Bank procedures. He will prepare work plans and ensure the implementation of programsfor capacity building, including recruitment and training of personnel and project beneficiaries. Hewill ensure that quarterly project implementation reports are prepared regularly and forwarded tothe Trust for approval. He will also ensure that project financial statements are prepared regularlyby the Company and audited regularly. The Trust will submit the approved QuarterlyImplementation Reports (QIRs) to the Bank at the end of each quarter, and the approved auditedaccounts at the end of each financial year.
5.2.4 In respect of the reporting responsibilities for this project, at the apex of the organizationalchart is the Office of the Vice President of the Republic of Malawi, who is also the Ministerresponsible for Privatization and to the Ministry of Finance, that represents the Borrower. Next isthe National Privatization Commission (NPC) to which the DCGT reports. The DCGC reports tothe Trust through its Board of Directors comprising the General Managers of DCGC andDWASCO, three representatives of sugar-cane outgrower farmers, and the Traditional Authority ofthe area. The Board is chaired by the General Manager of the DCGC. At the base of theorganization hierarchy, the individual out-grower farmers in each of the participating out-growerschemes constitute themselves into Cane Growers Committees which elect representatives to theCane Growers’ Association.
5.2.5 While the capacities and assets inherited from SSA will be very useful in running theproject, they will need to be strengthened and augmented in order to cope with the increaseddemands of the new project. To this end, the project’s financial management team will, be
1 DCGC is owned by the cane out-grower farmers, the Staff and Management of the Company with each of these groupsof shareholders being represented in the company’s Board of Directors (paragraph 3.10).

17
strengthened with technical assistance in the form of advice from the internationally recruitedFinancial Controller, who although posted in the DCGT Secretariat (paragraph 5.1.2), will beadvising the team on financial matters.
5.2.6 Additional Agricultural and Extension Officers (10) will be recruited to strengthen thecapacity for providing advisory services for out-grower sugar-cane production, including the day today supervision of land development, planning, irrigation, fertilizer application, disease and weedcontrol, etc. Through demonstrations and meetings, these officers will train new out-growers incane husbandry practices. In addition, the agricultural and extension staff will liaise with the out-grower associations and committees on land husbandry, distribution and tenurial arrangements aswell as on other matters affecting the beneficiaries. Other local staff to be recruited will includeindustrial electricians (2), irrigation supervisors (2), harvesting supervisors (5), disease checkers(43) and water guards (39). In all cases of recruitment, women, especially heads of households, willbe encouraged to apply.
5.2.7 Given the importance of training to the success and sustainability of the project, funds willbe set aside to support internal and external training for project staff and beneficiary farmers. Seniorproject staff will receive external training in various fields related to irrigated sugar cane productionand general management. Field staff will be trained in financial management, extension services,irrigation water management techniques, sugar-cane agronomy and disease control. A team of localconsultants will be contracted to carry out in-country training of staff and out-grower farmers.Subsequently, farmers will continue to be trained in cane husbandry and receive extension advicefrom project field staff in the management of their sugar-cane plots2. To strengthen existingfarmers’ associations and to stimulate the formation of new groups, farmers will also receivetraining in group-formation and group dynamics.
5.3 Supervision and Implementation Schedule
5.3.1 The project will be implemented over a five-year period with 2000/2001 being Project Year1 (PY1). The first supervision mission during which the project will be formally launched isplanned for June 2000. It is contemplated that at least one supervision mission will be undertakenfor each year of project implementation. To the extent possible, supervision missions will beplanned to coincide with critical stages of project implementation. In view of the complexity of thetechnology being employed, the supervision teams will have the full contingent of the requiredexpertise – irrigation and civil engineer, agronomist, economist and other specialists depending onspecific issues to be addressed. A project implementation plan is given in Annex 4.
5.3.2 The first stage of the project will take one year and will include preparation of detailed designfor the irrigation infrastructure, including topographic surveys and construction of surface irrigationinfrastructure, including water intake structures, main and secondary canals, and the infield works anddrainage system. The expenditure schedules by component and by source of finance are given inTables 5.1 and 5.2, respectively. The second stage, to commence during the second year of the project,will continue with the construction of the center pivot irrigation infrastructure, and will include waterintake structures, main and secondary canals, and infield works including surface water structures anddrainage system. This stage is expected to take three years during which the demarcation of theirrigation plots and their allocation to the farmers will continually be undertaken.
2 Among the activities the farmers will undertake in the project are: cane planting, weeding, irrigating their plots,fertilizer application, drainage and harvest.
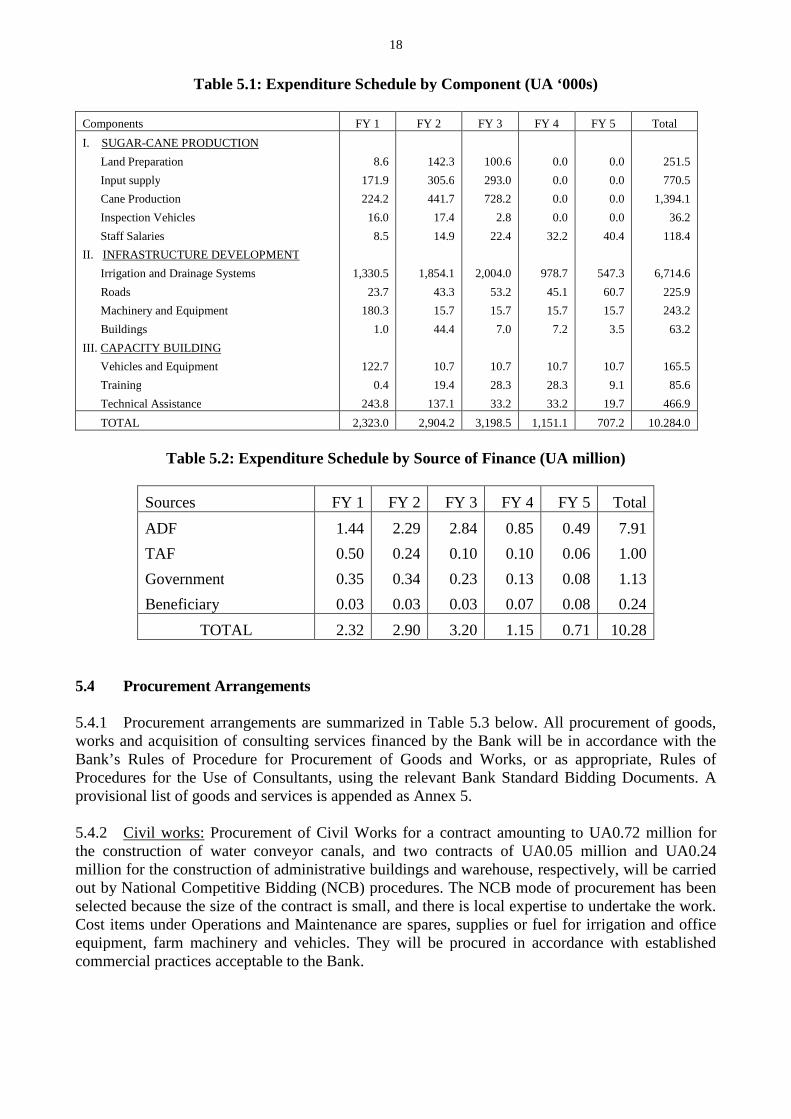
18
Table 5.1: Expenditure Schedule by Component (UA ‘000s)
Components FY 1 FY 2 FY 3 FY 4 FY 5 Total
I. SUGAR-CANE PRODUCTION
Land Preparation
Input supply
Cane Production
Inspection Vehicles
Staff Salaries
II. INFRASTRUCTURE DEVELOPMENT
Irrigation and Drainage Systems
Roads
Machinery and Equipment
Buildings
III. CAPACITY BUILDING
Vehicles and Equipment
Training
Technical Assistance
8.6
171.9
224.2
16.0
8.5
1,330.5
23.7
180.3
1.0
122.7
0.4
243.8
142.3
305.6
441.7
17.4
14.9
1,854.1
43.3
15.7
44.4
10.7
19.4
137.1
100.6
293.0
728.2
2.8
22.4
2,004.0
53.2
15.7
7.0
10.7
28.3
33.2
0.0
0.0
0.0
0.0
32.2
978.7
45.1
15.7
7.2
10.7
28.3
33.2
0.0
0.0
0.0
0.0
40.4
547.3
60.7
15.7
3.5
10.7
9.1
19.7
251.5
770.5
1,394.1
36.2
118.4
6,714.6
225.9
243.2
63.2
165.5
85.6
466.9
TOTAL 2,323.0 2,904.2 3,198.5 1,151.1 707.2 10.284.0
Table 5.2: Expenditure Schedule by Source of Finance (UA million)
Sources FY 1 FY 2 FY 3 FY 4 FY 5 Total
ADF
TAF
Government
Beneficiary
1.44
0.50
0.35
0.03
2.29
0.24
0.34
0.03
2.84
0.10
0.23
0.03
0.85
0.10
0.13
0.07
0.49
0.06
0.08
0.08
7.91
1.00
1.13
0.24
TOTAL 2.32 2.90 3.20 1.15 0.71 10.28
5.4 Procurement Arrangements
5.4.1 Procurement arrangements are summarized in Table 5.3 below. All procurement of goods,works and acquisition of consulting services financed by the Bank will be in accordance with theBank’s Rules of Procedure for Procurement of Goods and Works, or as appropriate, Rules ofProcedures for the Use of Consultants, using the relevant Bank Standard Bidding Documents. Aprovisional list of goods and services is appended as Annex 5.
5.4.2 Civil works: Procurement of Civil Works for a contract amounting to UA0.72 million forthe construction of water conveyor canals, and two contracts of UA0.05 million and UA0.24million for the construction of administrative buildings and warehouse, respectively, will be carriedout by National Competitive Bidding (NCB) procedures. The NCB mode of procurement has beenselected because the size of the contract is small, and there is local expertise to undertake the work.Cost items under Operations and Maintenance are spares, supplies or fuel for irrigation and officeequipment, farm machinery and vehicles. They will be procured in accordance with establishedcommercial practices acceptable to the Bank.

19
Table 5.3: Procurement Arrangements
UA millionProject Categories ICB NCB OTHER NON-BANK
FUNDED
SHORTLIST TOTAL
Civil Works
Construction of lined canal, culvert,
tubewells and associated drainage structures
Construction of electric power lines
River dredging
Construction of Roads
Construction of Buildings
Land Preparation
0.72[0.72]
0.05[0.05]
0.24[0.24]
0.92
0.07
0.08
0.17
1.64 [0.72]
0.07
0.08
0.17
0.05 [0.05]
0.24 [0.24]
Goods
Irrigation and Drainage equipment
Vehicles, motorcycles and bicycles
Farm Machinery and Equipment
Office Equipment and Supplies
Farm Inputs
2.71[2.71]
1.73[1.73]
0.11[0.11]
0.15[0.15]
0.02[0.02]
2.71 [2.71]
0.11 [0.11]
0.15 [0.15]
0.02 [0.02]
1.73 [1.73]
Consulting Services
Studies and Engineering
Training
Local/External
Technical Assistance
0.10 [0.10]
0.08 [0.08]
0.44 [0.44]
0.10 [0.10]
0.08 [0.08]
0.44 [0.44]
Miscellaneous
Operation and Maintenance Cost
Other Operating Cost
Contingencies 0.51[0.51] 0.32[0.32]
1.85[1.85]
0.10
0.01
1.85 [1.85]
0.10
0.84 [0.81]
TOTAL 4.95[4.95] 1.61[1.61] 1.85[1.85] 1.35 0.52 [0.52] 10.28 [8.93]
* Figures in brackets are amounts financed by the ADF and NTF.
5.4.3 Goods: Irrigation equipment amounting to UA2.71 million and farm inputs such asfertilizers) amounting to UA1.73 million will be procured through International CompetitiveBidding (ICB). Because of the large number of the goods, the contract will be packaged in lots anda supplier can bid for one of more lots. Vehicles, which will cost UA0.11 million and farmmachinery that will cost UA0.15 million will be procured through NCB procedures. Office andradio communication equipment that will cost UA0.02 million will be procured through NCBprocedures also. The NCB mode of procurement has been selected due to the small size of theindividual contracts and availability of the goods in the borrowing country. Furthermore, there is anadequate number of national suppliers and agents of qualified foreign suppliers that will ensurecompetitive prices.
5.4.4 Consulting Services: Procurement of consulting services for the design and supervision ofcivil works, monitoring, evaluating and training, as well as the Financial Controller, ProcurementOfficer and Project Co-ordinator will be undertaken in accordance with the Bank's "Rules ofProcedure for the Use of Consultants", on the basis of short-listing, following the selectionprocedure of technical quality with price consideration. Such consulting services are estimated tocost, in aggregate UA0.62 million (UA0.10 million for irrigation design, UA0.08 million fortraining and UA0.44 million for Technical Assistance).

20
5.4.5 Executing Agency: The Trust will be responsible for the procurement of goods, works,consulting and training services, even though the task of preparing procurement documents will becarried out by the Company. To enable the Trust carry out this responsibility, its capacity will beenhanced by the acquisition of the services of a Procurement Officer for the project as a member ofthe Trust’s Secretariat. He/she will be assisted by the experienced Procurement Advisor attached tothe MOAI.
5.4.6 General Procurement Notice: The text of the General Procurement Notice (GPN) will bediscussed with the Government of Malawi during the project’s loan negotiations, and will be issuedfor publication in the United Nations Development Business, upon approval by the Board ofDirectors of the Loan Proposal.
5.4.7 Review Procedures: The following documents are subject to review and approval by theBank before promulgation:
Specific Procurement Notices
Tender Documents or Requests for Proposals from Consultants
Tender Evaluation Reports or Reports on Evaluation of Consultants' Proposals, includingrecommendations for Contract Award
Draft contracts, if these have been amended from the drafts included in the tender invitationdocuments.
5.5 Disbursement Arrangements
5.5.1 The project loan will be granted to the Government of Malawi through the Ministry of Finance.The Executing Agency, DCGT, will supervise administration of the loan proceeds, ensuring that theloan funds are effectively used for the purposes contemplated in the loan agreement. However, theactual day-day administration of the utilization of the funds for the implementation of the projectactivities will be carried out by the DCGC under a management agreement with the DCGT.
5.5.2 To ensure transparency of resources utilization and quick disbursement of funds to approvedactivities, DCGT will open and maintain an interest-bearing Special Account (SA) in foreigncurrency and three Local Currency Accounts (LCA) at banks acceptable to ADF. The SA will beused to deposit part of loan resources for procuring inputs, and operating and maintenance costs.Funds will be withdrawn periodically from the SA based on approved work programmes anddeposited into two LCAs opened respectively for (i) operating and maintenance costs, (ii) inputloan resources. The third LCA will be used to receive repayment of the principal and interest earnedon input loans extended to beneficiaries and will function as Revolving Fund. The ADF willreplenish the SA after DCGT has used at least 50% of the previous deposit and provided validjustifications for its use.
Cane Growers’ Company Loan System
5.5.3 The funds for inputs and agricultural services will be provided to the outgrowers in the newdevelopment sites through the Special Account in local currency. The fund in the said local accountwill be owned by the DCGT and managed by DCGC as part of the company’s contractual obligation toDCGT. Management of the loan system will be modeled along the system hitherto successfullymanaged by the SSA, which used funds borrowed from the commercial banking system. As conditionfor accessing the input loan, participating outgrower farmers were required to agree that the recoveryof the loan the SSA provided would be deducted directly from cane sales before proceeds were paid tothe farmers. Consequently, the recovery rate was 100%. That system will be adopted under this project

21
with appropriate modifications made to suit the requirements of the project and its proposed financingmodalities. It should be noted, however, that the project funding is from the Bank Group and notcommercial banks as before. Outgrowers will continue to pay for input loans at market interest rate,with both the principal and interest being deposited into the third LCA. To facilitate loan recovery andpayment of sugar cane sales proceeds, the DCGC would maintain the crop accounts (production costsand sales) for each participating outgrower farmer. With advice from the TA Financial Controller, theProject Management team will establish proper financial management systems, including setting up atraining programme for the relevant personnel.
5.6 Monitoring and Evaluation
5.6.1 Periodic implementation reporting of project activities is an essential management function ofthe project implementation agency, as a means of assessing progress towards achieving projectobjectives. To this end, the PIC will design and implement a management information system with achecklist of activities and achievement benchmarks to facilitate effective and efficient control andmonitoring of all project activities. On a quarterly basis, each head of a management unit will prepare areport on the project activities carried out in his/her unit. A Project Monitoring and EvaluationCommittee (PMEC), comprising the heads of DCGC departments will summarize the reportsproducing the Quarterly Progress Report (QPR). In accordance with the terms of the Loan Agreement,QPRs will be submitted to the Fund regularly by the DCGT, no later than 4 weeks after the end of eachquarter, in the format satisfactory to the Bank Group.
5.6.2 ADF will undertake a Mid-Term Review (MTR) at the end of the third year of projectimplementation. The purpose of the MTR will be to assess the physical and financial implementationprogress made against targets agreed at appraisal, identify constraints encountered and their causes, andassess the need for adjustments in the project design with a view to ensuring better implementationprogress over the remaining project life.
5.7 Financial Reporting and Audit
5.7.1 The project will maintain an internationally acceptable accounting and control system forrecording and reporting all project financial transactions. To this end, the implementing agency willprepare, on a monthly basis, budgets and financial statements based on data received from the variousout-grower units as a tool for the monitoring of project finances. The TA Financial Controller willdesign and institute a suitable accounting management system, as well as train DCGC's counterpartFinancial Controller. Both will ensure that (i) project accounts are maintained by category ofexpenditure, by component and by source of funding; and (ii) introduce a system of internal controlwhich will ensure prompt recording of all project transactions, timely preparation of accounts andreports, as well as records of project assets. The DCGC will prepare monthly financial statements thatwill be consolidated into quarterly financial statements to be included in the QPRs.
5.7.2 The financial statements of the project will be audited annually by an independent audit firmand submitted by the Trust to the Fund for review and comments within six months after the end ofeach financial year. At the same time, the Trust will prepare and submit to the Fund an Annual StatusReport summarizing implementation progress made and achievements as well as lessons learned todate. The cost of the audit will be borne by the Trust from its own resources.
22
5.8 Aid Co-ordination
A donors’ agricultural sector co-ordination committee meets on an ad hoc basis to co-ordinateoperations in the sector. Furthermore, a donors’ co-ordination forum meets quarterly to review policydevelopments and to exchange experience on their respective operations. The Bank will be encouragedto establish an organic and continuous relationship with these collaborative activities, even though theproject is not co-financed with any other donor.
6. PROJECT SUSTAINABILITY AND RISKS
6.1 Recurrent Costs
Project recurrent costs comprise staff salaries, running costs, and operation and maintenance ofvehicles, farm machinery and irrigation equipment. These costs are estimated at UA1.95 million duringthe 5-year implementation period. The ADF loan will provide funds for the maintenance of vehicles,irrigation equipment, farm machinery, and purchase of office supplies. Local staff salaries will be paidfor by the Trust while access roads’ maintenance costs will be borne by the Government. After thefinancing phase, the responsibility for maintaining access roads will lay with the Government. Thiswill not pose a burden to the Government since it will realize substantial revenues from the project. Anundertaking that Government will maintain access roads will be a loan condition. Responsibility formaintaining in-field roads and irrigation systems will fall on the DCGC, of which the projectbeneficiaries would have been share-holders. The infrastructure maintenance expenses will not be aburden to the Company because the costs will be met from charges that are paid by farmers fromsugar-cane sales. Any other maintenance cost beyond the project completion will have a marginaleffect on Government budget, especially as the project will generate revenue of about UA2.20million on an annual basis for the Government.
6.2 Project Sustainability
6.2.1 At the end of project implementation, the Trust, on behalf of the Government of Malawi, willconvert the value of project assets (estimated at UA3.7 million) into shares to be held under DCGC.The shares will be offered for purchase to the new entrants into the small-holder sugar-ane production.By that time, cane production from the sites developed under the project will be fully self-financingand highly profitable. There will therefore be no additional recurrent expenditure required from theGovernment on account of this project.
6.2.2 The project management and capacity building support provided in the form of short and long-term training for project staff at all levels and farmers will ensure the availability of capable staff andinformed farmers which will further ensure sustainability of project activities. Project beneficiaries willbe empowered through assistance that is provided under the project to assist them organize themselvesinto farmer associations. The associations will strengthen their bargaining/negotiating power vis-à-visother stakeholders to gain better terms and to have more equitable access to resources and otherbenefits. This will assist in assuring long-term profitability and project sustainability.
6.2.3 The Revolving Fund to be created (see paragraph 5.5.2) will continue beyond the financingphase of the project. This will guarantee the availability of funds for the supply of production inputsand services, including financing for extension services, fertilizers, herbicides, land preparation,irrigation, etc., to beneficiaries for the entire economic life of the project. This will also ensurefinancing for beneficiaries joining the out-grower program beyond the investment phase of the project.

23
6.3 Critical Risks and Mitigating Measures
6.3.1 In view of the observed variability in agricultural performance over the years as a result ofinadequate and poor distribution of annual rainfall, drought is a risk to the project. However, the useof surface and efficient center pivot irrigation technology will minimize this risk.
6.3.2 Low recovery by DCGC of input loan will be a risk to the sustainability of the program. Tominimize this risk, the project will ensure that DCGC, which has been administering a similarprogram since 1978 will properly manage the loan recovery. The established system of loanrecovery whereby it deducts input and operational costs before giving the farmer his/her net profithad resulted in the DCGC recovering 100% of loan it gave to farmers. Also, the financial analysisshows that the net profit of the farmers will enable them to repay their debts. The TA FinancialController will set the guidelines to monitor and evaluate the input loan activities regularly.
6.3.3 Observance of the marketing and pricing arrangement (for cut cane produced by small-holder outgrower farmers) signed between DCGC and DWASCO will be important, as it willguarantee a ready and nearby marketing outlet for cane produced. The sugar-cane sales agreementsigned in 1996 between DCGC and DWASCO binds both parties as seller and buyer respectivelyand will help mitigate the risk that farmers will not have a sales outlet. The milling capacity ofDWASCO has recently been increased from 150 to 175mt of cane per hour to accommodateincreased cane production from around Dwangwa area. Plans are under way to further increase thecapacity to 210mt of cane per hour, enough to cater for cane from this project and other potentialgrowers.
6.3.4 Insecurity of land tenure is a potential risk to the project. Some of the prospective participantsin the project will have individual leasehold rights for the land they wish to bring into the scheme.Others will come in with land assigned to them by the Traditional Authority under the customary landtenure system. As a condition precedent to participation in the scheme, prospective participants will berequired to cede their rights to specific plots of land to the Trust. The Trust will make arrangementswith the Government to obtain 99-year lease on the land as a block. The Trust will then issue eachparticipating farmer with a 20-year (renewable) land use certificate for the exclusive production ofsugar-cane. This guarantees that all the participants in the scheme operate under a uniform land tenureregime. In the event that a participant wishes to withdraw from the scheme, in the interest ofmaintaining the block operation modality, the Trust would transfer the piece of land to an otherinterested outgrower and, in collaboration with the Traditional Authority would arrange to provide thewithdrawing outgrower with an alternative piece of land.
7. PROJECT BENEFITS
7.1 Financial Analysis
A farm model was prepared for small-holder sugar-cane outgrowers who are the project'sbeneficiaries. This was compared with another farm model for sugar-cane production under rainfedconditions. The resulting financial analysis shows that annual gross revenue from sugar-caneproduction is expected to rise from its present level of UA2.24 million under rainfed conditions toUA5.20 million under irrigated conditions at full project development in the sixth year. The averagenet income per sugar-cane farmer is estimated to increase from the present UA628 to UA2,900 perannum at full development. The project’s financial internal rate of return was estimated as 14%,indicating that the project is an attractive investment.

24
7.2 Economic Analysis
7.2.1 An economic analysis was undertaken in order to assess the economic viability of the projectby calculating the Economic Internal Rate of Return (EIRR). The project benefits have been projectedfor a period of 20 years to allow for optimum use of irrigation infrastructure. Costs include investment,operating, replacement, incremental variable crop production and sugar processing costs. The resultingestimated EIRR is 42%. This rate reflects the expected high returns from the advanced irrigationtechnology (central pivot system) that is to be employed, in combination with a highly structured crophusbandry and management systems, including the intensive and centrally controlled application ofyields improving farm inputs. The calculation of EIRR is presented in Annex 6.
7.2.2 The following assumptions have been adopted in carrying out the project’s economic analysis:
i) Benefits: incremental irrigated production of sugar cane, and the net benefits arising fromprocessing of sugar and ethanol;
ii) Costs: incremental investment and operating cost for sugar-cane production (cost of sugar andethanol processing at factory level is taken at 70% of the production value). All costs are takenat market prices (without taxes and subsidies). Foreign exchange cost is taken at the marketrate. The export parity price of a metric tonne of sugar in Malawi, i.e. UA290 has been usedin computing the project’s economic benefit.
7.2.3 Benefits derived from capacity building, training, institutional support, roads, potable waterand improved sanitation which though substantial but not easily quantifiable, have not beenincluded in the analysis.
7.3 Social Impact Analysis
7.3.1 The project will contribute to poverty reduction by providing opportunities for increasedemployment, especially for the rural poor, while increasing incomes for small-holder sugar-canefarmers. Higher incomes will increase the ability of rural farm families to purchase food, therebycontributing to enhanced household food security. Furthermore, the project will allocate 0.2 ha of landand providing inputs such as seeds and fertilizers to support food production by beneficiaries andenhance household food security. Compared to net annual income of UA628 under rainfed (withoutproject) conditions, it is anticipated that at full development net annual farmer incomes of UA2,900will be realized. The economy at large will benefit from the project’s activities which will provide longterm employment, income and food security for the targeted small-holder sugar-cane farmers in SalimaADD, thus assisting in reducing poverty in the project area.
7.3.2 By supporting the production of sugar-cane and traditional food crops, the project thuspromotes the efficient utilization of productive resources and increase land use efficiency. It willenhance food security and incomes for participating farmers, thereby improving their standard ofliving and fostering private sector led economic growth.
7.3.3 The construction of new, and rehabilitation of farm access roads will improve transport ofgoods and persons and facilitate communication in the project area and with other areas. Improvedsupply of potable water and sanitation facilities will improve the health status of small-holder farmersand their families, thus improving their productivity. These improvements will be of particularimportance to women farmers as they will reduce the time spent carrying out such activities as takingcare of the sick, and fetching water, which are not directly productive thereby freeing them to spendmore time in directly productive activities. In addition, participating women farmers will be treated

25
equally with men in respect of the allocation of land and production inputs, thus alleviating theproblem of inadequate access to funds and farm inputs that often constrain production by womenfarmers.
7.4 Sensitivity Analysis
Sensitivity analyses were also undertaken for various possible scenarios that could have an effect onthe EIRR. Labour (hired and family) are costed at market rate and all inputs are costed at marketprices (minus taxes and subsidies) to reflect true value. An assumption was made of a possible 20%increase in crop production costs; this reduced the EIRR to 38%. When as assumption was made ofa possible 20% increase in both crop production and sugar processing costs, the EIRR dropped to30%. An assumed 20% decline in cane yield (and therefore sucrose yield) per hectare resulted in anEIRR of 10%. Given the use of irrigation and proper disease and pest controls in the project, thechances of a serious drop in cane yield are minimised. When an assumption was made of a possiblereduction in expected benefits due to a 20% drop in the price of sugar, the EIRR dropped to 11%.The analysis indicated that the EIRR is more sensitive to changes in cane production and sugarprice than to rising cane production or sugar processing costs. However, in all cases, the rates ofreturn remained at acceptable levels.
8 CONCLUSIONS AND RECOMMENDATIONS
8.1 Conclusions
8.1.1 The Small-holder Outgrower Sugar-cane Production Project has a high priority in thedevelopment objectives of the Government of Malawi. The project seeks to improve the country’sforeign exchange position through increased sugar export and petrol import substitution and helpalleviate rural poverty by increasing small-holder farmers’ incomes. The project will also contributeto household food security by enabling farmers to grow food crops on the fringes of their irrigatedsugar-cane farms, and as a result of increased incomes to purchase adequate supplies of food.Furthermore, the project will be an important source of revenue for the Government. In all, aboutUA2.2 million in tax revenue is expected to be collected as income tax paid by the participatingfarmers, and corporate and surtaxes to be paid on account of the sugar-cane and sugar produced by thisproject, annually. At the end of project implementation, the Trust, on behalf of the Government ofMalawi, will convert the value of project assets (estimated at UA3.7 million) into shares to be heldunder DCGC. The shares will be offered for purchase to the new entrants into small-holder caneproduction. The project will contribute to the provision of an enabling economic environment forprivate sector development, increasing investment in rural road infrastructure and givingappropriate training.
8.1.2 With its focus on small-holder farmers, including women, the project is supporting groupsthat have hitherto been generally marginalised, notwithstanding their untapped growth potential. Akey feature of the design of the project is its emphasis on strengthening existing farmer groups, aswell as new farmer group formation, mobilization and empowerment, all in an effort to enable themto better manage individual and community-owned resources.
8.1.3 The sustainable development and improvement measures to be taken in the project willassist conserve the environmental and protect biodiversity. The project is consistent with theinstitutional framework and implementation strategies proposed under the Sectoral InvestmentProgramme and complementary to the recommendations of Bank’s Country Strategy Paper forMalawi.

26
8.1.4 The project's overall financial and economic internal rates of return are estimated at 14%and 42%, respectively, and provide a good investment opportunity for the country. The project istechnically feasible, financially sound, economically viable and socially desirable.
8.2 Recommendations
It is therefore recommended that a loan not exceeding UA5.17 million from ADF resources and anadditional UA3.76 million from NTF resources be granted to the Government of Malawi for thepurpose of implementing the project as described in this report, subject to the following conditions:
Conditions of Entry into Force
A. The entry into force of the Loan Agreement shall be subject to the fulfillment by the Borrowerof the provisions of Section 5.01 of the General Conditions Applicable to Loans and GuaranteeAgreement of the ADF.
Conditions Precedent to First Disbursement
B. The obligations of the Fund to make the first disbursement shall be conditional upon the entryinto force of the loan agreement and the fulfillment of the following conditions:
The Borrower shall have:
(i) opened and undertaken to maintain a special foreign currency account in a financialinstitution acceptable to the Fund into which the proceeds of the loan will be deposited(paragraph 5.5.2);
(ii) established a Project Implementation Committee (PIC) comprising of SeniorManagement of DCGC, DWASCO, representatives of outgrower farmers, and theProject Manager for Salima ADD (paragraph 5.2.2);
(iii) provided evidence satisfactory to the ADF confirming that the Dwangwa Cane GrowersTrust (DCGT) is a permanent public body (an organ of the Government of Malawi) thatis fully legally constituted and operational;
(iv) undertaken to contract the implementation of the project to the Dwangwa CaneGrowers’ Company (DCGC) under terms and conditions acceptable to the Fund(paragraph 5.2.1);
(v) given an undertaking that tenurial arrangements including the rights to the use of landgiven by traditional authorities or leasehold given by the relevant governmentalauthorities to small-holder farmers, including women farmers, will not change, exceptin respect of ceding land rights to DCGT in order to enable the Trust to obtain a 99-yearlease on the land in block (paragraph 6.2.4);

27
Other Conditions
C. The Borrower shall:
(i) make its contribution (at least 10% of total project cost) in respect of all civil works;
(ii) provide the Fund with satisfactory evidence that a Financial Controller whose CVshall be acceptable to the Fund shall serve as a counterpart to the TA FinancialController (paragraph 5.1.2);
(iii) provide the Fund with satisfactory evidence that the farm access roads constructed andrehabilitated with project financing will be included in the National Road Authority’sannual infrastructure maintenance programme, and that buildings to be constructed orrehabilitated are included in DCGT's annual maintenance programme (paragraph 6.1);
(iv) provide the Fund with a comprehensive list of project small-holder farmers and landareas allocated to each (paragraph 4.2.9);
(v) ensure that cane haulage services from the farm gate to DWASCO’s mill will becompetitively contracted to private transporter/s (paragraph 4.6.4).
Undertakings
D. The Borrower shall undertake:
(i) to ensure that the proceeds of the loan will not be used in such a way as to compromisethe privatization efforts of the Government;
(ii) to advise the Fund within 3 months of any changes made to the list and land holdings offarmers and the specific reasons for such changes;
(iii) to ensure that women beneficiaries have an equitable access to the project resources andthat project's loan funds accruing to women beneficiaries approaches the proportion ofwomen participating in the outgrower scheme (paragraph 4.3.4).


Annex 1
MALAWI: SMALL-HOLDER OUTGROWER SUGAR-CANE PRODUCTION PROJECTPROJECT LOCATION MAP
Chitipa
CHITIPA
Karonga
KA
RO
NG
A
Livingstonia
RUMPHI
Rumphi
Ekwenden
Mzulu
Nkhata BaySt. Augustine
Chikangawa
NKHATABAYMzimba
MZIMBA
Jenda
Chisumulu I.
Likoma I.
Dwangwa
NkhotakotaNK
HO
TAK
OTA
KasunguKASUNGU
NtchisiNTCHISI
Mchinji
MCHINJI DowaDOWA SALIMA
Senga
SalimaLILONGWE
LilongweLikuni
DEDZA
Dedza
Makanjila
Monkey Bay
To Nacaia
MangochiLakeMalombe
MANGOCHI
Ntcheu
NT
CH
EU
Balaka
Machinga
MACHINGA
LIWONDE
ZOMBA
Zomba
PALOMBE
LakeChilwa
ChiradzuluCHIRADZULU
BLANTYRE
MWANZA
Mwanza
To TeleBlantyre
Chikwawa
CHIKWAWA
Mulanje
MULANJE
Luchenza
Thyolo
TH
YO
LO
NgabuChirama
Nsanje
To Dar es Salaam
To Lusaka
Principal roads
Towns
District capitals
National capital
District boundaries
International boundaries
TANZANIA
ZAMBIA
MOZAMBIQUE
MOZAMBIQUE
This map has been drawn by the African Development Bank Group exclusively for the use of the readers of the report to which it is attached. The names used andthe borders shown do not imply on the part of the Bank and its members any judgement concerning the legal status of a territory nor any approval or acceptance ofthese borders.
Project Area
Lake
Malawi

Annex 2Page 1 of 2
ENVIRONMENTAL IMPACTS AND MITIGATION MEASURES
The project’s objectives are to contribute to the overall economic growth and poverty alleviation.This will be done through the achievement of a sustainable increase in household income and foodsecurity in the small-holder sector via greater and more efficient agricultural production byexpanded use of small-scale irrigation. The project is classified as Category II according to theBank Environmental guidelines.
Hydrology
The scale of the project is small with neither major hydraulic infrastructures involved nor alterationof existing hydrologic systems. Impacts due to reduced flow with the use of the Mkoma River will bemanaged by the maintenance of minimum flows in the river to support aquatic and riverineenvironments. On the other hand, no hydrologic impacts are expected due to water abstraction fromDzanza Swamps in Katimbila and the Hippo Pool in Liwaladzi. Both wetlands are highlyinterconnected to Lake Malawi, which will provide continuous supply to replenish the dischargedwater.
Pollution
The use of pesticides and chemical fertilizers will be kept at the minimum possible levels to avoidpollution to both surface and groundwater. The use of non-residual pesticides and organic fertilizers(e.g. manure and compost) in proper quantities will be recommended by the project.
Soils
While salinity poses high risk during the dry seasons, water logging represents the main threat duringthe rainy season. The former is mainly because of high evapotranspiration with limited or no rainfall.The later results from poor land leveling and inefficient drainage.
Problems of salinity, water logging and groundwater table rising will be avoided through theintroduction of irrigation Best Management Practices (BMP) in the project. These include amongothers: i) the design and implementation of a good drainage network; ii) proper on-farm waterapplication (via good leveling, water control, etc.) to minimize agrochemical transport to surfaceand groundwater; and iii) cultivation and deep tillage when necessary.
On the other hand, irrigation will provide dense land coverage (crop vegetation) all around the year.This in turn will reduce soil and sheet erosion due to heavy rains and winds. In addition, the use oforganic fertilizers together with crop residuals will increase soil stability on the long term.
Ecology and Biodiversity
The areas to be irrigated under the project are not likely to be virgin land. All has almost beencultivated in the recent past and there is no danger to any native species of fauna and flora due tocultivation. Moreover, the project as mentioned before, will promote the use of limited amounts ofpesticides of non-residual or short residual periods.

Annex 2Page 2 of 2
On the other hand, there will be risks of negative impact on the ecology of the currently undisturbedwater bodies due to convulsion expected by the project in terms of noise and human intrusion.However, irrigation is likely to have some beneficial effects on many living organisms includingaquatic and terrestrial annual and perennial plants, soil and air microorganisms, fish, smallmammals and birds.
Socio-economics
The project does not involve any displacement or non-voluntary resettlement. Contrarily, theproject will result in higher incomes, an improvement in the role of women and empowerment ofproducers through their involvement in identification, design and implementation and managementof the project schemes.
Health
Positive impact is the better nutrition resulting from higher incomes and increased production offood crops. The risk of water borne diseases (e.g. malaria and schistosomiasis) in the irrigationwater will be minimized through proper canal design to avoid stagnant water. In addition, the useof overhead sprinkler irrigation systems will reduce the exposure of farmers to water and hencereduce health risks.
Pests and weeds (as habitats for snails) will be reduced using biological methods when possible orthe application of limited quantities of pesticides. In all project areas, especially when newcommunities are formed on the bigger schemes, the Ministry of Health should provide the healthservices deemed necessary.
Mitigation and Monitoring of Environmental Measures
Preventive measures are included in the design and implementation aspects. Among the mitigationmeasures proposed to counter possible negative impacts are soil analyses to monitor changes, sothose potential soil and soil-water problems are detected in time and managed adequately. Anothermitigation measure will be the introduction of BMP and Integrated Pest Management methods inthe project and training the technical staff of the DCGC and farmers on these practices.Consequently, those can then act as an “early warning system” for environmental hazards. Thedisturbed bird habitat due to tree cutting will easily re-established on adjacent areas outside theproject.
The DCGC will have the mandate to implement the recommended mitigation measures and monitorthe environmental status in the project areas. In addition, project activities will be monitoredregularly by the Department of Environmental Affairs (DEA) as part of their routine activities.Further, the DEA is expected to commence specific missions to monitor certain pollution problemsas discussed above and those arising during project implementation. Environmental aspects of theproject will also be monitored by the Bank supervision missions.

Government of Malawi(Vice Presidency, MOF and MOAI)
Dwangwa Cane Growers’ Trust
OutgrowerFarmers(Farmer
Associations)
Dwangwa Cane Growers’Company
DwangwaSugar
Corporation
Annex 3
MALAWISMALL-HOLDER OUTGROWER SUGAR-CANE PRODUCTION PROJECT
ORGANISATIONAL CHART OF THE PROJECT

Annex

MALAWI: SMALL-HOLDER OUTGROWER SUGAR-CANE PRODUCTION PROJECT Annex 4
IMPLEMENTATION PLAN Page 1 of 2
Component Sub-Component Activities Initiator Approximate Dates
Loan Processing Commencement Completion
1 Board Approval ADF Dec-99 Dec-99
2 Loan Agreement Signed ADF/GOM Feb-00 Feb-00
3 Loan Effectiveness ADF/GOM May-00 May-00
4 Supervision/Launching Jun-00 Jun-00
1 Sugar-cane Production Seasonal Inputs Supply Tender Documents prepared and approved GOM/ADF Jul-00 Sep-00
Short-list of bidders drawn-up and approved GOM/ADF Oct-00 Oct-99
Bids invited GOM Dec-00 Dec-00
Bids received, evaluated and report approved GOM/ADF Jan-01 Mar-01
Inputs supply tenders awarded GOM Apr-01 May-01
Production inputs received Suppliers Jul-01 Aug-01
Cane Transportation Tender documents prepared and approved GOM/ADF Oct-00 Nov-00
Bidders short-listed and approved GOM/ADF Nov-00 Dec-00
Bids invited GOM Feb-01 Feb-01
Bids received, evaluated and report approved GOM/ADF Apr-01 Jun-01
Tender awarded GOM Jul-01 Aug-01
Cane transportation begins Contractors Oct-01 Continuous
2 Infrastructure Development Detailed Design Tender Documents prepared and approved GOM/ADF Jul-00 Sep-00
Short-list of bidders drawn-up and approved GOM/ADF Oct-00 Oct-99
Bids invited GOM Nov-00 Nov-00
Bids received, evaluated and report approved GOM Jan-01 Feb-01
Detailed design work Consultants Mar-01 Aug-01
Irrigation System/Farmmachinery
Tender documents for the procurement of irrigation, relatedequipment and farm machinery prepared and approved GOM/ADF Jul-00 Sep-00Bids invited GOM Oct-00 Oct-99
Bids received, evaluated and report approved GOM/ADF Dec-00 Dec-00
Bids Evaluation Report approved GOM/ADF Jan-01 Mar-01
Tenders awarded GOM Apr-01 May-01
Equipment received Suppliers Aug-01 Aug-03
Equipment installation Suppliers Sep-01 Sep-04

MALAWI: SMALL-HOLDER OUTGROWER SUGAR-CANE PRODUCTION PROJECT Annex 4
IMPLEMENTATION PLAN Page 2 of 2
Component Sub-Component Activities Initiator Approximate Dates
Commencement Completion
3 Capacity Building Technical Assistance Shortlist and letter of invitation, prepared and approved GOM/ADF Jul-00 Sep-00
Proposal from approved candidates invited for theassignment
GOM Sep-00 Sep-00
Expressions of interest received, evaluated and approved GOM/ADF Dec-00 Jan-01
Contract awarded and signed GOM Jan-01 Jan-01
Selected TA commences assignment Consultant Feb-01 Feb-03
Farmers and staff training Identification of farmers and staff to be trained DCGC Aug-01 Continuous
Identification of and contracting of trainers and traininginstitutions
GOM Sep-01 Continuous
Staff and farmers training commences DCGC Oct-01 Oct-04
Organizational support Tender documents for vehicles, motorcycles, bicycles, officeequipment and supplies prepared and approval received GOM/ADF Aug-00 Oct-00Bids invited GOM Nov-00 Nov-00
Bids received, evaluated and report approved GOM/ADF Jan-01 Feb-01
Tenders awarded GOM Apr-01 Apr-01
Goods received Suppliers Aug-01 Aug-03

MALAWI: SMALL-HOLDER OUTGROWER SUGAR CANE PRODUCTION PROJECT Annex 5
Table 1: Sugar-cane Production - Cost Components Page 1 of 3
UA 1 = MK 58.5772 UA 1 = US $ 1.33587
Quantities Unit Cost Base Cost (MK '000) Base Cost (UA '000)UNIT Yr 1 Yr 2 Yr 3 Yr 4 Yr 5 Total MK '000 2000 2001 2002 2003 2004 TOTAL 2000 2001 2002 2003 2004 TOTAL
Area ha 300 300 400 580 560 2,140
I. INVESTMENT COSTS Kas Kas Liw Liw/Kat Kat
a. Land Preparation
Bush Clearing ha 0 300 200 0 0 500 24.86 0.0 7,458.0 4,972.0 0.0 0.0 12,430.0 0.0 127.3 84.9 0.0 0.0 212.2
Harrowing ha 300 300 400 0 0 1,000 1.60 480.0 480.0 640.0 0.0 0.0 1,600.0 8.2 8.2 10.9 0.0 0.0 27.3
Base Cost 480.0 7,938.0 5,612.0 0.0 0.0 14,030.0 8.2 135.5 95.8 0.0 0.0 239.5
Price Contingency (5%) 24.0 396.9 280.6 0.0 0.0 701.5 0.4 6.8 4.8 0.0 0.0 12.0
Land Preparation Costs 504.0 8,334.9 5,892.6 0.0 0.0 14,731.5 8.6 142.3 100.6 0.0 0.0 251.5
b. Input Supply
Seedcane ha 300 300 400 0 0 1,000 12.66 3,798.0 3,798.0 5,064.0 0.0 0.0 12,660.0 64.8 64.8 86.5 0.0 0.0 216.1
Seeds and fertilizer for food crops No. 350 350 370 0 0 1,070 14.00 4,900.0 4,900.0 5,180.0 0.0 0.0 14,980.0 83.7 83.7 88.4 0.0 0.0 255.7
Base Cost 8,698.0 8,698.0 10,244.0 0.0 0.0 27,640.0 148.5 148.5 174.9 0.0 0.0 471.9
Price Contingency (5%) 434.9 434.9 512.2 0.0 0.0 1,382.0 7.4 7.4 8.7 0.0 0.0 23.6
Physical Contingency (5%) 434.9 434.9 512.2 0.0 0.0 1,382.0 7.4 7.4 8.7 0.0 0.0 23.6
Input Supply Costs 9,567.8 9,567.8 11,268.4 0.0 0.0 30,404.0 163.3 163.3 192.4 0.0 0.0 519.0
Total Investment Costs 10,071.8 17,902.7 17,161.0 0.0 0.0 45,135.5 171.9 305.6 293.0 0.0 0.0 770.5
II. CANE PRODUCTION COSTS
a. Cane Production
Cane Planting ha 300 300 400 0 0 1,000 1.20 360.0 360.0 480.0 0.0 0.0 1,200.0 6.1 6.1 8.2 0.0 0.0 20.5
Fertilizer and Application ha 300 600 1,000 0 0 1,900 18.00 5,400.0 10,800.0 18,000.0 0.0 0.0 34,200.0 92.2 184.4 307.3 0.0 0.0 583.8
Weed Control ha 300 600 1,000 0 0 1,900 3.92 1,176.0 2,352.0 3,920.0 0.0 0.0 7,448.0 20.1 40.2 66.9 0.0 0.0 127.1
Cane Harvesting ha 300 600 1,000 0 0 1,900 1.60 480.0 960.0 1,600.0 0.0 0.0 3,040.0 8.2 16.4 27.3 0.0 0.0 51.9
Transportation of cut cane tonne 34,800 69,600 113,680 0 0 218,080 0.13 4,524.0 9,048.0 14,778.4 0.0 0.0 28,350.4 77.2 154.5 252.3 0.0 0.0 484.0
Base Cost 11,940.0 23,520.0 38,778.4 0.0 0.0 74,238.4 203.8 401.5 662.0 0.0 0.0 1,267.4
Price Contingency (5%) 597.0 1,176.0 1,938.9 0.0 0.0 3,711.9 10.2 20.1 33.1 0.0 0.0 63.4
Physical Contingency (5%) 597.0 1,176.0 1,938.9 0.0 0.0 3,711.9 10.2 20.1 33.1 0.0 0.0 63.4
Cane Production Costs 13,134.0 25,872.0 42,656.2 0.0 0.0 81,662.2 224.2 441.7 728.2 0.0 0.0 1,394.1
b. Inspection Vehicles
Motorcycles No. 6 6 0 0 0 12 108.00 648.0 648.0 0.0 0.0 0.0 1,296.0 11.1 11.1 0.0 0.0 0.0 22.1
Bicycles No. 52 52 0 0 0 104 2.50 130.0 130.0 0.0 0.0 0.0 260.0 2.2 2.2 0.0 0.0 0.0 4.4
Operation and Maintenance (10%) 77.8 155.6 155.6 0.0 0.0 389.0 1.3 2.7 2.7 0.0 0.0 6.6
Base Cost 855.8 933.6 155.6 0.0 0.0 1,945.0 14.6 15.9 2.7 0.0 0.0 33.2
Price Contingency (5%) 42.8 46.7 7.8 0.0 0.0 97.3 0.7 0.8 0.1 0.0 0.0 1.7
Physical Contingency (5%) 38.9 38.9 0.0 0.0 0.0 77.8 0.7 0.7 0.0 0.0 0.0 1.3
Inspection Vehicle Costs 937.5 1,019.2 163.4 0.0 0.0 2,120.1 16.0 17.4 2.8 0.0 0.0 36.2
Total Production Costs 14,071.5 26,891.2 42,819.6 0.0 0.0 83,782.3 240.2 459.1 731.0 0.0 0.0 1,430.3
III. OPERATING COSTS (Salaries)
Beneficiary Contribution
Irrigation Engineer M-Yr 1 1 1 1 1 5 60.00 60.0 60.0 60.0 60.0 60.0 300.0 1.0 1.0 1.0 1.0 1.0 5.1
Agricultural Officers M-Yr 1 2 3 3 3 12 55.00 55.0 110.0 165.0 165.0 165.0 660.0 0.9 1.9 2.8 2.8 2.8 11.3
Extension Officers M-Yr 2 3 4 6 7 22 48.00 96.0 144.0 192.0 288.0 336.0 1,056.0 1.6 2.5 3.3 4.9 5.7 18.0
Industrial Electricians M-Yr 1 2 2 2 2 9 48.00 48.0 96.0 96.0 96.0 96.0 432.0 0.8 1.6 1.6 1.6 1.6 7.4
Irrigation Supervisors M-Yr 1 2 2 2 2 9 48.00 48.0 96.0 96.0 96.0 96.0 432.0 0.8 1.6 1.6 1.6 1.6 7.4
Harvesting supervisors M-Yr 1 2 3 4 5 15 48.00 48.0 96.0 144.0 192.0 240.0 720.0 0.8 1.6 2.5 3.3 4.1 12.3
Disease Checkers M-Yr 6 12 20 32 43 113 13.00 78.0 156.0 260.0 416.0 559.0 1,469.0 1.3 2.7 4.4 7.1 9.5 25.1
Waterguards M-Yr 0 0 10 25 39 74 13.00 0.0 0.0 130.0 325.0 507.0 962.0 0.0 0.0 2.2 5.5 8.7 16.4
Base Cost 433.0 758.0 1,143.0 1,638.0 2,059.0 6,031.0 7.4 12.9 19.5 28.0 35.2 103.0
Price Contingency (15%) 65.0 113.7 171.5 245.7 308.9 904.7 1.1 1.9 2.9 4.2 5.3 15.4
Total Operating Costs 498.0 871.7 1,314.5 1,883.7 2,367.9 6,935.7 8.5 14.9 22.4 32.2 40.4 118.4
Operation and Maintenance Cost 77.8 155.6 155.6 0.0 0.0 389.0 1.3 2.7 2.7 0.0 0.0 6.6
Investment Cost 10,071.8 17,902.7 17,161.0 0.0 0.0 45,135.5 171.9 305.6 293.0 0.0 0.0 770.5
Cane Production Cost 13,993.7 26,735.6 42,664.0 0.0 0.0 83,393.3 238.9 456.4 728.3 0.0 0.0 1,423.6
Operating Cost 498.0 871.7 1,314.5 1,883.7 2,367.9 6,935.7 8.5 14.9 22.4 32.2 40.4 118.4
Total Sugar-cane Production Cost 24,641.2 45,665.6 61,295.1 1,883.7 2,367.9 135,853.4 420.7 779.6 1046.4 32.2 40.4 2,319.2

MALAWI: SMALL-HOLDER OUTGROWER SUGAR CANE PRODUCTION PROJECT Annex 5Table 2: Infrastructure Development - Cost Components Page 2 of 3UA 1 = MK 58.5772 UA 1 = US $ 1.33587
Quantities Unit Cost Base Cost (MK '000) Base Cost (UA '000)UNIT Yr 1 Yr 2 Yr 3 Yr 4 Yr 5 Total MK '000 2000 2001 2002 2003 2004 TOTAL 2000 2001 2002 2003 2004 TOTAL
Cumulative area ha 300 300 400 580 560 2,140I. INVESTMENT COSTS Kas Kas Liw Liw/Kat Kata. Irrigation and Drainage Systems
Center Pivot Irrigation Units (30 ha units) No. 0 1 0 0 0 1 2,596.0 0.0 2596.0 0.0 0.0 0.0 2,596.0 0.0 44.3 0.0 0.0 0.0 44.3Center Pivot Irrigation Units (40 ha units) No. 0 12 9 0 0 21 2,745.0 0.0 32940.0 24705.0 0.0 0.0 57,645.0 0.0 562.3 421.8 0.0 0.0 984.1Center Pivot Irrigation Units (50 ha units) No. 0 2 3 0 0 5 3,097.0 0.0 6194.0 9291.0 0.0 0.0 15,485.0 0.0 105.7 158.6 0.0 0.0 264.4Center Pivot Irrigation Units (60 ha units) No. 0 0 7 0 0 7 3,890.0 0.0 0.0 27230.0 0.0 0.0 27,230.0 0.0 0.0 464.9 0.0 0.0 464.9Conveyor Canal Lined (1000 l/s) Km 1 0 0 0 0 1 1,930.0 1930.0 0.0 0.0 0.0 0.0 1,930.0 32.9 0.0 0.0 0.0 0.0 32.9Conveyor Canal Lined (500 l/s) Km 5 5 5 5 0 20 1,200.0 6000.0 6000.0 6000.0 6000.0 0.0 24,000.0 102.4 102.4 102.4 102.4 0.0 409.7Conveyor Canal Lined (100 l/s) Km 10 15 0 0 0 25 558.0 5580.0 8370.0 0.0 0.0 0.0 13,950.0 95.3 142.9 0.0 0.0 0.0 238.1Main Conveyor Pipeline (700mm Steel) Km 6.4 0 0 0 0 6.4 2,580.0 16512.0 0.0 0.0 0.0 0.0 16,512.0 281.9 0.0 0.0 0.0 0.0 281.9Main Conveyor Pipeline (500mm Steel) Km 0 1.8 0 1.8 0 3.6 3,655.0 0.0 6579.0 0.0 6579.0 0.0 13,158.0 0.0 112.3 0.0 112.3 0.0 224.6Lifting Plants No. 8 2 3 4 0 17 1,500.0 12000.0 3000.0 4500.0 6000.0 0.0 25,500.0 204.9 51.2 76.8 102.4 0.0 435.3
Road Culvert and Cross-drainage No. 4 2 2 2 4 14 326.0 1304.0 652.0 652.0 652.0 1304.0 4,564.0 22.3 11.1 11.1 11.1 22.3 77.9Pump Stations No. 2 0 1 1 0 4 1,570.0 3140.0 0.0 1570.0 1570.0 0.0 6,280.0 53.6 0.0 26.8 26.8 0.0 107.2Land Leveling ha 300 300 0 0 0 600 27.0 8100.0 8100.0 0.0 0.0 0.0 16,200.0 138.3 138.3 0.0 0.0 0.0 276.6River Dredging 1,000m3 45 45 5 5 0 100 50.0 2250.0 2250.0 250.0 250.0 0.0 5,000.0 38.4 38.4 4.3 4.3 0.0 85.4Flood Protection Dykes 1000m3 25 26 40 21 0 112 182.0 4550.0 4732.0 7280.0 3822.0 0.0 20,384.0 77.7 80.8 124.3 65.2 0.0 348.0Drainage Works 1000m3 20 14 15 47 48 144 50.0 1000.0 700.0 750.0 2350.0 2400.0 7,200.0 17.1 12.0 12.8 40.1 41.0 122.9Electric Power Lines Km 5 5 5 0 0 15 284.0 1420.0 1420.0 1420.0 0.0 0.0 4,260.0 24.2 24.2 24.2 0.0 0.0 72.7Tubewells No. 3 3 4 0 0 10 153.0 459.0 459.0 612.0 0.0 0.0 1,530.0 7.8 7.8 10.4 0.0 0.0 26.1Afrider Hand Pump + Piping + Chloride No. 3 3 4 0 0 10 40.0 120.0 120.0 160.0 0.0 0.0 400.0 2.0 2.0 2.7 0.0 0.0 6.8Tensiometers No. 12 12 0 0 0 24 20.0 240.0 240.0 0.0 0.0 0.0 480.0 4.1 4.1 0.0 0.0 0.0 8.2Evaporimeters Class A standard No. 1 2 0 0 0 3 72.0 72.0 144.0 0.0 0.0 0.0 216.0 1.2 2.5 0.0 0.0 0.0 3.7Operation and Maintenance (10%) 6467.7 14917.3 23359.3 26081.6 26652.4 97,478.3 110.4 254.7 398.8 445.3 455.0 1,664.1
Base Cost 71144.7 99413.3 107779.3 53304.6 30356.4 361,998.3 1,214.5 1,697.1 1,840.0 910.0 518.2 6,179.8Price Contingency (5%) 3557.2 4970.7 5389.0 2665.2 1517.8 18,099.9 60.7 84.9 92.0 45.5 25.9 309.0Physical Contingency (5%) 3233.9 4224.8 4221.0 1361.2 185.2 13,226.0 55.2 72.1 72.1 23.2 3.2 225.8Irrigation and Drainage Systems Costs 77935.8 108608.8 117389.3 57331.0 32059.4 393,324.2 1,330.5 1,854.1 2,004.0 978.7 547.3 6,714.6
b. Roads
New Access Roads km 10 15 20 10 20 75 63.0 630.0 945.0 1260.0 630.0 1260.0 4,725.0 10.8 16.1 21.5 10.8 21.5 80.7Rehab Existing Rural Roads km 10 20 20 20 20 90 57.0 570.0 1140.0 1140.0 1140.0 1140.0 5,130.0 9.7 19.5 19.5 19.5 19.5 87.6Operation and Maintenance (10%) 120.0 328.5 568.5 745.5 985.5 2,748.0 2.0 5.6 9.7 12.7 16.8 46.9Base Cost 1320.0 2413.5 2968.5 2515.5 3385.5 12,603.0 22.5 41.2 50.7 42.9 57.8 215.2Price Contingency (15%) 66.0 120.7 148.4 125.8 169.3 630.2 1.1 2.1 2.5 2.1 2.9 10.8Roads Costs 1386.0 2534.2 3116.9 2641.3 3554.8 13,233.2 23.7 43.3 53.2 45.1 60.7 225.9
c. Machinery and Equipment
Tractors No. 3 0 0 0 0 3 972.0 2916.0 0.0 0.0 0.0 0.0 2,916.0 49.8 0.0 0.0 0.0 0.0 49.8Waterbouzers No. 3 0 0 0 0 3 600.0 1800.0 0.0 0.0 0.0 0.0 1,800.0 30.7 0.0 0.0 0.0 0.0 30.7Ploughs No. 3 0 0 0 0 3 320.0 960.0 0.0 0.0 0.0 0.0 960.0 16.4 0.0 0.0 0.0 0.0 16.4Harrows No. 3 0 0 0 0 3 330.0 990.0 0.0 0.0 0.0 0.0 990.0 16.9 0.0 0.0 0.0 0.0 16.9Tine Cultivators No. 3 0 0 0 0 3 85.0 255.0 0.0 0.0 0.0 0.0 255.0 4.4 0.0 0.0 0.0 0.0 4.4Rippers No. 2 0 0 0 0 2 250.0 500.0 0.0 0.0 0.0 0.0 500.0 8.5 0.0 0.0 0.0 0.0 8.5Trailers No. 3 0 0 0 0 3 410.0 1230.0 0.0 0.0 0.0 0.0 1,230.0 21.0 0.0 0.0 0.0 0.0 21.0Knapsacks Sprayers No. 10 0 0 0 0 10 0.4 4.3 0.0 0.0 0.0 0.0 4.3 0.1 0.0 0.0 0.0 0.0 0.1Cutting cane Knives No. 500 0 0 0 0 500 0.2 110.0 0.0 0.0 0.0 0.0 110.0 1.9 0.0 0.0 0.0 0.0 1.9Operation and Maintenance (10%) 876.5 876.5 876.5 876.5 876.5 4,382.7 15.0 15.0 15.0 15.0 15.0 74.8
Base Cost 9641.8 876.5 876.5 876.5 876.5 13,148.0 164.6 15.0 15.0 15.0 15.0 224.5Price Contingency (5%) 482.1 43.8 43.8 43.8 43.8 657.4 8.2 0.7 0.7 0.7 0.7 11.2Physical Contingency (5%) 438.3 0.0 0.0 0.0 0.0 438.3 7.5 0.0 0.0 0.0 0.0 7.5Machinery and Equipment Costs 10562.2 920.4 920.4 920.4 920.4 14,243.6 180.3 15.7 15.7 15.7 15.7 243.2
d. Buildings
Headquarters Office Block No. 0 1 0 0 0 1 2,000.0 0.0 2000.0 0.0 0.0 0.0 2,000.0 0.0 34.1 0.0 0.0 0.0 34.1Site Admin Blocks No. 0 1 1 1 0 3 200.0 0.0 200.0 200.0 200.0 0.0 600.0 0.0 3.4 3.4 3.4 0.0 10.2Latrines No. 4 4 4 4 4 20 13.0 52.0 52.0 52.0 52.0 52.0 260.0 0.9 0.9 0.9 0.9 0.9 4.4Operation and Maintenance (5%) 2.6 115.2 127.8 140.4 143.0 529.0 0.0 2.0 2.2 2.4 2.4 9.0Base Cost 54.6 2367.2 379.8 392.4 195.0 3,389.0 0.9 40.4 6.5 6.7 3.3 57.9Price Contingency (5%) 2.7 118.4 19.0 19.6 9.8 169.5 0.0 2.0 0.3 0.3 0.2 2.9
Physical Contingency (5%) 2.6 112.6 12.6 12.6 2.6 143.0 0.0 1.9 0.2 0.2 0.0 2.4Buildings Cost 59.9 2598.2 411.4 424.6 207.4 3,701.5 1.0 44.4 7.0 7.2 3.5 63.2
Operation and Maintenance Cost 7466.8 16237.5 24932.1 27844.0 28657.4 105,138.0 127.5 277.2 425.6 475.3 489.2 1,794.9Investment Cost 82477.1 98423.9 96905.8 33473.2 8084.5 319,364.5 1,408.0 1,680.2 1,654.3 571.4 138.0 5,452.0Total Infrastructure Development Costs 89943.9 114661.5 121837.9 61317.2 36741.9 424,502.4 1,535.5 1,957.4 2,080.0 1,046.8 627.2 7,246.9

MALAWI: SMALL-HOLDER OUTGROWER SUGAR CANE PRODUCTION PROJECT Annex 5
Table 3: Capacity Building - Cost Components Page 3 of 3
UA 1 = MK 58.5772 UA 1 = US $ 1.33587
Quantities Unit Cost Base Cost (MK '000) Base Cost (UA '000)
Unit Yr 1 Yr 2 Yr 3 Yr 4 Yr 5 Total MK '000 2000 2001 2002 2003 2004 Total 2000 2001 2002 2003 2004 Total
I -INVESTMENT COSTS
a. Vehicles and Equipment
Twin Cabs 4x4 No. 3 0 0 0 0 3 750.0 2,250.0 0.0 0.0 0.0 0.0 2,250.0 38.4 0.0 0.0 0.0 0.0 38.4
Double Cabin 4x4 No. 3 0 0 0 0 3 850.0 2,550.0 0.0 0.0 0.0 0.0 2,550.0 43.5 0.0 0.0 0.0 0.0 43.5
Desk Computers No. 5 0 0 0 0 5 51.0 255.0 0.0 0.0 0.0 0.0 255.0 4.4 0.0 0.0 0.0 0.0 4.4
Laser Printers No. 4 0 0 0 0 4 35.0 140.0 0.0 0.0 0.0 0.0 140.0 2.4 0.0 0.0 0.0 0.0 2.4
Dot Matrix Printer No. 1 0 0 0 0 1 30.0 30.0 0.0 0.0 0.0 0.0 30.0 0.5 0.0 0.0 0.0 0.0 0.5
Radio, two-way non-Fitted (50 km radius) No. 20 0 0 0 0 20 37.0 740.0 0.0 0.0 0.0 0.0 740.0 12.6 0.0 0.0 0.0 0.0 12.6
Operation and Maintenance (10%) 596.5 596.5 596.5 596.5 596.5 2,982.5 10.2 10.2 10.2 10.2 10.2 50.9
Base Cost 6,561.5 596.5 596.5 596.5 596.5 8,947.5 112.0 10.2 10.2 10.2 10.2 152.7
Price Contingency (5%) 328.1 29.8 29.8 29.8 29.8 447.4 5.6 0.5 0.5 0.5 0.5 7.6
Physical Contingency (5%) 298.3 0.0 0.0 0.0 0.0 298.3 5.1 0.0 0.0 0.0 0.0 5.1
Vehicles and Equipment Costs 7,187.8 626.3 626.3 626.3 626.3 9,693.1 122.7 10.7 10.7 10.7 10.7 165.5
b. Training
Short-term consultant for farmer training M-mth 2 2 2 2 1 9 10.0 20.0 20.0 20.0 20.0 10.0 90.0 0.3 0.3 0.3 0.3 0.2 1.5
External (Short-term for Agric. Officers) No. 0 1 1 1 0 3 1,060.0 0.0 1060.0 1060.0 1060.0 0.0 3,180.0 0.0 18.1 18.1 18.1 0.0 54.3
External (Short-term for Managers) No. 0 0 1 1 1 3 500.0 0.0 0.0 500.0 500.0 500.0 1,500.0 0.0 0.0 8.5 8.5 8.5 25.6
Base Cost 20.0 1,080.0 1,580.0 1,580.0 510.0 4,770.0 0.3 18.4 27.0 27.0 8.7 81.4
Price Contingency (5%) 1.0 54.0 79.0 79.0 25.5 238.5 0.0 0.9 1.3 1.3 0.4 4.1
Training Costs 21.0 1,134.0 1,659.0 1,659.0 535.5 5,008.5 0.4 19.4 28.3 28.3 9.1 85.5
c. Technical Assistance
Financial Controller/Credit Expert M-Yr 1 1 0 0 0 2 5,800.0 5,800.0 5,800.0 0.0 0.0 0.0 11,600.0 99.0 99.0 0.0 0.0 0.0 198.0
Project Co-ordinator M-Yr 1 1 1 1 1 5 1,100.0 1,100.0 1,100.0 1,100.0 1,100.0 1,100.0 5,500.0 18.8 18.8 18.8 18.8 18.8 93.9
Procurement Officer M-Yr 1 1 1 1 0 4 750.0 750.0 750.0 750.0 750.0 0.0 3,000.0 12.8 12.8 12.8 12.8 0.0 51.2
Detailed design (6% of Irrigation Civil Works) Sum 5,948.9 0.0 0.0 0.0 0.0 5,948.9 101.6 0.0 0.0 0.0 0.0 101.6
Base Cost 13,598.9 7,650.0 1,850.0 1,850.0 1,100.0 26,048.9 232.2 130.6 31.6 31.6 18.8 444.7
Price Contingency (5%) 679.9 382.5 92.5 92.5 55.0 1,302.4 11.6 6.5 1.6 1.6 0.9 22.2
Technical Assistance Costs 14,278.8 8,032.5 1,942.5 1,942.5 1,155.0 27,351.3 243.8 137.1 33.2 33.2 19.7 466.9
Operation and Maintenance Cost 596.5 596.5 596.5 596.5 596.5 2,982.5 10.2 10.2 10.2 10.2 10.2 50.9
Investment Cost 20,891.2 9,196.3 3,631.3 3,631.3 1,720.3 39,070.5 356.6 157.0 62.0 62.0 29.4 667.0
Total Capacity Building 21,487.7 9,792.8 4,227.8 4,227.8 2,316.8 42,053.0 366.8 167.2 72.2 72.2 39.6 717.9
TOTAL PROJECT COSTS 136,073 170,120 187,361 67,429 41,427 602,408.9 2,323.0 2,904.2 3,198.5 1,151.1 707.2 10,284.0
TOTAL CANE PRODUCTION COST 13,994 26,736 42,664 0 0 83,393.3 238.9 456.4 728.3 0.0 0.0 1,423.6
TOTAL INVESTMENT COST 113,440 125,523 117,698 37,105 9,805 403,570.5 1,936.6 2,142.9 2,009.3 633.4 167.4 6,889.5
TOTAL OPERATING COST 498 872 1,315 1,884 2,368 6,935.8 8.5 14.9 22.4 32.2 40.4 118.4
TOTAL OPERATION AND MAINTENANCE COST 8,141 16,990 25,684 28,441 29,254 108,509.3 139.0 290.0 438.5 485.5 499.4 1,852.4
TOTAL PROJECT COSTS 136,073 170,120 187,361 67,429 41,427 602,408.9 2,323.0 2,904.2 3,198.5 1,151.1 707.2 10,284.0

MALAWI: SMALL-HOLDER OUTGROWER SUGAR-CANE PRODUCTION PROJECT Annex 6
Calculation of Economic Internal Rate of Return
Costs (MK000) Benefits (MK000)
Project Investment Operating Replace- Crop Production Cost Conversion to Total Incre- Total benefits Total Benefits Total Incre- Net Incre-
Year ment Production Total Without Project Sugar and Ethanol mental Cost With Project Without Project mental Benefit mental Benefit
1 111,498 8,639 13,994 134,131 12,030 19,488 141,589 85,904 35,700 50,204 (91,385)
2 123,580 17,862 26,736 168,178 24,060 38,976 183,094 171,809 71,400 100,409 (82,685)
3 115,756 26,999 42,664 185,419 40,100 64,960 210,279 286,348 119,000 167,348 (42,931)
4 35,162 30,325 67,409 132,896 63,358 102,636 172,174 452,429 188,020 264,409 92,235
5 8,650 31,622 91,300 131,572 85,814 139,016 184,774 612,784 254,660 358,124 173,350
6 0 31,622 25,243 91,300 148,165 85,814 139,016 201,367 612,784 254,660 358,124 156,757
7 0 31,622 91,300 122,922 85,814 139,016 176,124 612,784 254,660 358,124 182,000
8 0 31,622 91,300 122,922 85,814 139,016 176,124 612,784 254,660 358,124 182,000
9 0 31,622 91,300 122,922 85,814 139,016 176,124 612,784 254,660 358,124 182,000
10 0 31,622 91,300 122,922 85,814 139,016 176,124 612,784 254,660 358,124 182,000
11 0 31,622 81,743 91,300 204,665 85,814 139,016 257,867 612,784 254,660 358,124 100,257
12 0 31,622 91,300 122,922 85,814 139,016 176,124 612,784 254,660 358,124 182,000
13 0 31,622 91,300 122,922 85,814 139,016 176,124 612,784 254,660 358,124 182,000
14 0 31,622 91,300 122,922 85,814 139,016 176,124 612,784 254,660 358,124 182,000
15 0 31,622 91,300 122,922 85,814 139,016 176,124 612,784 254,660 358,124 182,000
16 0 31,622 25,243 91,300 148,165 85,814 139,016 201,367 612,784 254,660 358,124 156,757
17 0 31,622 91,300 122,922 85,814 139,016 176,124 612,784 254,660 358,124 182,000
18 0 31,622 91,300 122,922 85,814 139,016 176,124 612,784 254,660 358,124 182,000
19 0 31,622 91,300 122,922 85,814 139,016 176,124 612,784 254,660 358,124 182,000
20 0 31,622 91,300 122,922 85,814 139,016 176,124 612,784 254,660 358,124 182,000
EIRR= 42%
This high returns reflect the advanced irrigation technology (central pivot system) that is to be employed, in combination with a highly structured crop husbandry andmanagement systems, including the intensive and centrally controlled application of yields improving farm inputs. Some benefits are quantifiable while others arenot; the quantifiable project benefits have been identified as the value of incremental production of the sugar-cane under irrigation. The unquantifiable benefitsare the benefits derived from capacity building, training, institutional support, roads, potable water and improved sanitation.

Annex 7
Approved Bank Group Operations in Malawi(As At 31 August, 1999)
Sector/Project (Window)
Date
Approved
Date
Signed
Date of
Entry into
Force
Amount Net of
Cancellations
Amount
Disbursed
%
Disbursed
A. Agriculture1- Namwera Rural Dev. (ADF) 26/10/76 10/12/76 10/10/77 4,600.7 4,600.6 100.02- Blantyre-Shire Rural Dev. (ADF) 16/12/83 09/05/84 23/03/85 10,500.0 9,616.8 91.63- Zomba Rural Dev. Proj. (ADF) 25/11/87 22/02/88 25/09/89 8,713.2 5,606.4 64.34- National Livestock Dev. (ADF) 18/01/88 22/02/89 10/05/90 10,978.9 4,379.4 39.95- Insitit'l Support to SDA (TAF) 28/08/90 01/02/91 10/02/93 746.1 538.6 72.26- Macadamia Nuts Study (TAF) 18/12/90 01/03/91 18/06/91 458.0 458.0 100.07- Agricultural Sector Study (TAF) 18/03/91 31/01/92 20/11/92 1,436.8 1,410.5 98.28- Mwanza Rural Dev. Proj. (ADF) 27/08/91 13/05/92 11/03/93 8,013.2 1,816.1 22.79- Lilongwe Forestry Proj. (ADF) 29/10/92 05/03/93 24/02/95 3,868.4 1,321.3 34.210- Lower Shire Irrig. Study (TAF) 29/10/92 15/01/93 10/03/93 672.4 675.2 100.411- Agric. Sector Adj. Prog. (ADF) 03/09/93 01/10/93 19/05/94 15,657.9 15,290.6 97.712- Agric. Services Proj. (ADF) 03/09/93 01/10/93 05/10/94 9,210.5 5,551.2 60.313- Smallholder Sugar Cane Study (TAF) 19/12/90 01/02/91 19/06/91 1,050.0 20.0 1.914- Rural Income Enhancement Proj. (ADF)* 10/12/97 27/05/98 7,060.015- Macadamia Smallholder Dev. Proj. (ADF)* 15/07/98 13/01/99 6,850.016 Smallholder Irrig. Proj. (ADF)* 26/11/98 5,020.017- Small Scale Irrig. Study (TAF)* 26/11/98 13/01/99 1,119.018 Horticulture & Food Crops Dev. (ADF + TAF)* 15/12/98 7,490.0
Sub-Total 103,445.1 51,284.7 49.6B. Transport
1- Engineering Serv. Lilongwe Airport Study (ADB) 08/05/74 01/07/74 14/12/74 500.0 500.0 100.02- Muzuzu-Muhuju Road Studies (ADF) 30/04/75 19/08/75 21/06/76 276.0 276.0 100.03- Lilongwe International Airport I (ADB) 23/02/97 23/03/77 23/11/77 4,982.8 4,982.8 100.04- Lilongwe International Airport II (ADB) 28/12/77 25/01/78 30/06/78 4,956.3 4,956.3 100.05- John-Mzumara-Ekwendeni Road (ADF) 28/02/79 17/05/79 22/08/79 7,368.4 7,368.4 100.06- Kamuzu International Airport III (ADB) 09/11/82 31/01/83 11/11/93 14,783.4 14,783.4 100.07- Road Maintenance and Construction - ROMAC (ADB) 25/01/84 09/05/84 20/09/84 11,110.2 11,238.8 101.28- Champoyo-Mbowe Road (ADF) 24/10/85 24/03/86 12/07/86 11,793.1 11,793.1 100.09- ROMAC Institutional Strengthrening (TAF) 15/02/90 29/05/90 23/05/91 2,394.7 1,967.0 82.110- ROMAC II (ADF) 15/02/90 30/11/90 23/10/90 18,421.0 11,662.2 63.311- Mchinji-Kasungu-Msulira Road (ADF) 18/12/91 31/01/91 28/02/91 15,096.0 14,751.4 97.712- Msulira-Nkhotakota Road (ADF) 25/11/91 13/05/92 22/09/93 12,065.8 814.5 6.813- Mcinji-Kasungu Road Studies (TAA) 23/09/86 17/03/87 12/10/87 1,330.0 1,311.4 98.614- Mchinji-Kasungu Supplementary Loan (ADF) 02/10/97 25/03/98 05/05/98 6,600.0 3,007.7 45.6
Sub-Total 111,677.7 89,413.0 80.1C. Industry
1- Industrial Sector Opportunities (TAF) 19/11/90 31/01/91 04/07/91 690.8 525.9 76.12- Mulanje Bauxite Study (TAF) 25/11/92 15/01/93 21/10/93 636.9 636.9 100.03- Line of Credit to MDC (ADB) 22/11/72 11/12/72 16/04/73 1,486.0 1,486.0 100.04- Line of Credit to INDEBANK (ADF)* 12/12/96 08/01/98 31/03/99 5,000.0
Sub-Total 78,13.70 2,648.8 33.9D. Public Utilities
1- Tedzane Falls Hydro Power (ADB) 15/12/69 09/03/70 23/09/71 3,114.8 3,114.8 100.02- Nkula Lilongwe Electricity Lines (ADB) 24/06/75 08/08/75 22/05/76 5,000.0 5,000.0 100.03- Nkula Falls "B" Hydro Elec. Power (ADB) 07/06/77 16/07/77 02/08/77 4,229.1 4,229.1 100.04- Blantyre Water Supply (ADF) 19/09/77 07/10/77 02/02/78 4,602.0 4,602.0 100.05- Rural Electrifications (ADF) 17/06/80 24/06/80 17/02/81 5,485.8 5,485.8 100.06- Malawi District Water supply (ADF) 14/12/76 07/02/77 07/07/77 4,605.3 4,605.3 100.07- Study of District Water Supply (TAA) 25/08/83 09/05/84 08/11/84 477.3 477.3 100.08- Mpira Balaka Water Supply (ADF) 19/11/84 01/07/85 10/09/86 11,651.3 11,479.7 98.59- District Water Supply II (ADF) 12/06/90 01/02/91 26/05/92 11,356.6 13,307.0 117.210- District Water Supply and Sanitation II Study (TAF) 12/06/90 31/01/91 26/05/92 865.8 808.6 93.411- Blantyre Water Supply Phase IV (ADF) 21/04/92 05/03/93 30/12/93 7,644.7 6,615.9 86.512- Blantyre Sanitation Masterplan Study (TAF) 21/04/92 05/03/93 13/02/95 828.9 677.5 81.713- Telecommunications I (ADB) 08/11/83 09/05/84 08/11/84 7,933.2 7,933.2 100.014- Telecommunications II (ADB) 22/05/91 02/08/91 10/02/94 15,000.0 12,916.5 86.115- Telecommunications II (ADF) 22/05/91 13/05/92 10/02/94 11,052.6 7,326.5 66.316- District Water Supply III (ADF)* 03/12/97 27/05/98 12,420.017- District Centres Sanitation Study (TAF)* 18/11/98 13/01/99 1,280.0
Sub-Total 107,547.4 88,579.2 82.4E. Social
1- Primary and Tertiary Education(ADF) 24/04/80 24/06/80 16/01/81 7,315.3 7,315.3 100.02- Rural Health (ADF) 04/12/81 12/02/82 24/09/82 7,368.4 7,006.3 95.13- Second Rural Health (ADF) 17/12/84 01/07/85 24/04/86 10,131.6 7,734.9 76.34- Primary and Secondary Education (ADF) 23/09/86 17/03/93 10/08/87 15,657.9 14,854.0 94.95- Women in Development (ADF) 29/10/93 05/03/93 08/07/94 4,973.7 3,505.4 70.56- Education III (ADF) 05/05/97 29/05/97 05/08/98 12,000.0 282.6 2.47- Health Study (TAF)* 20/11/97 27/05/98 1,000.08- Poverty reduction & Instit. Support (ADF + TAF)* 10/12/98 9,000.0
Sub-Total 67,446.9 40,698.5 60.3F. Multi-Sector
1- Industry-Trade Policy Adjust. Prog. (ADF) 23/02/89 22/09/89 16/11/89 13,815.8 13,854.3 100.32- Enterpreneurship-Capital Markets Adjust. Prog. (ADF) 30/10/91 31/01/92 23/11/92 9,210.5 9,210.5 100.03- Structural Adjustment Loan (ADF)* 15/12/98 13/01/99 16/02/99 15,000.0 10,000.0 66.7
Sub-Total 38,026.3 33,064.8 87.0
TOTAL 435,957.1 305,689.0 70.1
* Approved but not yet effective.
Shaded area represents on-going projects excluding approved but not yet effective.