
Small Firms' Tactics in a Mature Industry - Semantic Scholar · Mature industries are characterised...
33
WORKING PAPER SERIES NO. 49 STRATEGIC RE-ENGINEERING - SMALL FIRMS’ TACTICS IN A MATURE INDUSTRY NOLA HEWITT-DUNDAS and STEPHEN ROPER NORTHERN IRELAND ECONOMIC RESEARCH CENTRE
Transcript of Small Firms' Tactics in a Mature Industry - Semantic Scholar · Mature industries are characterised...
WORKING PAPER SERIES
NO. 49
STRATEGIC RE-ENGINEERING -SMALL FIRMS’ TACTICS IN A MATURE INDUSTRY
NOLA HEWITT-DUNDAS and STEPHEN ROPER
NORTHERN IRELANDECONOMIC RESEARCH CENTRE

Strategic Re-Engineering - Small Firms' Tactics in aMature Industry
January 2000
Nola Hewitt-Dundas* and Stephen Roper**
*Northern Ireland Economic Research Centreand CAM Benchmarking Ltd
46-48 University Road, BelfastNorthern Ireland, BT7 1NJTel: (028 90) 237767 / 261811
e-mail: [email protected]
** Northern Ireland Economic Research Centre andDept of Economics, Queen’s University of Belfast
Acknowledgements
This paper would not have been possible without the generosity of the 39 ManagingDirectors who spoke to us, and our team of market researchers. We would also like tothank Brendan McFerran of CAM Benchmarking Ltd for his support for this researchand Lynne Rainey for her diligence in the data collection process. Comments on anearlier draft of this paper were received from participants at the 22nd National SmallFirms’ Conference: European Strategies, Growth and Development, Leeds, November1999. This research was undertaken as part of the CAM Benchmarking project, whichis funding by the EU Special Programme for Peace and Reconciliation.
Abstract
Mature industries are characterised by static or declining sales, low average marginsand intense competition between firms for market share. This paper develops atypology of strategic options for small firms in the furniture industry and examines theextent to which firms are adopting simple or complex strategies. Empirical analysis isbased on data from 39 firms with between 10 and 100 employees in the Irish furnitureindustry.
Three main results emerge from the analysis. First, there is some support for thesuggestion that firms in mature industries such as furniture tend to adopt simplebusiness development strategies. Second, in terms of strategy success, we find noevidence that simple strategies unambiguously out-perform more complexapproaches. Instead, the success of either a simple or complex business strategy isdirectly related to the strength of firms’ resource base. Finally, marked differenceswere found in firms' ability or willingness to re-engineer their strategies in the light oftheir experience.

1
1 Introduction
Two main schools of thought exist on the importance of firm specific influences on
businesses’ choice of market development strategy (Mauri and Michaels, 1998).
While the industrial organisation literature stresses the role of market or industry
structure in determining firm conduct or behaviour (e.g. Bain, 1972; Caves 1980;
Demsetz, 1973; Clarke, 1985), newer resource based perspectives stress the
importance of firm-specific characteristics (Barney, 1991; Conner, 1991; Wernerfelt,
1984; Grant, 1991; Peteraf, 1993; Dooley et al., 1996). In isolation, each perspective
leads to very different predictions about the type of strategy choices that firms will
make within a given industry or market. An industrial organisation perspective
suggests, for example, that in the longer term firms’ strategies will converge, as the
optimal strategy for each market context steadily becomes clearer. Resource-based
perspectives on the other hand suggest that variation in firms’ strategy choices within
a market will persist reflecting the diversity of firms’ core competencies and their
search for competitive advantage (Variyam and Kraybill, 1993; Roper, 1997; 1998)1.
Recent empirical studies have sought to synthesise these two perspectives. Mauri and
Michaels (1998), for example, examined the performance of 264 large US
manufacturing enterprises over a fifteen-year period and concluded that "firms' unique
resource endowments, and not the participation in a particular industry, are the cause
of differences in performance… [but] firms competing in the same industry tend to
develop homogeneous competitive strategies for investing in technology and
marketing resources". The suggestion is that while firms' resource endowments may
determine strategy success, strategy choice is – as the industrial organisation literature
suggests – restricted by market structure.
One important aspect of market structure, determining as it does the scope for
technologically based product innovation, is the maturity of the industry. As Porter
outlines, industry structure not only determines the rules of competition but also the
“strategies potentially available to the firm” (1980:3). For example, firms operating in
dynamic and fast growing market environments will face markedly different
1 This is not necessarily inconsistent with the idea of strategic convergence. For example,indivisibilities or economies of scale or scope in an industry or market might lead to uniformity in thetechnological or production resources of competing companies. In this situation even if strategy wasresource determined, strategic convergence might occur.
2
competitive forces to firms in mature and stable markets. Miller et al. (1996) in
examining strategy choice across a range of industries, distinguish between simple
and complex business strategies. They argue that simple, one dimensional strategies
involving either price or quality based competition are likely to be most appropriate to
mature industries (e.g. furniture) while complex, multi-dimensional strategies may be
more suited to more dynamic markets (e.g. software)2. Mintzberg (1979), reflects an
essentially similar argument, suggesting that decision making processes (or co-
ordinating mechanisms) within a firm should be attuned to the complexity of the
firm’s business environment.
In what follows we make use of the distinction between simple and complex strategies
suggested by Miller et al. (1996) to explore the process of strategy formation, success
or failure, learning and strategic re-engineering by small firms in the Irish furniture
industry3. More specifically, we develop a typology of strategic options for small
furniture manufacturers in their search for higher profits. This defines the range of
possible strategies and allows us to identify the extent to which firms are adopting
simple or complex approaches.
Section 2 of the paper describes the context for the study and outlines the main
hypotheses to be investigated. Section 3 outlines the methodology we adopt and
describes the data sources. Section 4 then describes the main empirical results
considering first the extent to which firms’ choices between simple and complex
strategies depend on their resource base. This is followed by an assessment of the
success of alternative strategies in terms of their profit payoff. Again, we consider the
extent to which firms’ resource-base was contributing to the success of their adopted
strategy. Finally, we address the question of whether our sample of small firms was
learning from the success or otherwise of their strategic choices and undertaking
strategic re-engineering. The results emphasise the importance of firms’ resource base
2 Miller et al.’s empirical evidence for large US companies does not, however, support this argument.In their data simple strategies prove most effective in raising profitability in both stable and dynamicmarket environments (Miller et al., 1996, pp. 880-884).3 Miller et al. (1996) distinguish between two mechanisms which may lead to strategic re-engineering:passive adaption and opportunistic adaption or learning. In the former, firms follow incrementalbehaviours designed to maintain stability and enhance organisational competence within currentactivities. In the latter, firms seek out and explore a wide variety of alternative goals, activities andmodels of operation.

3
in determining strategy success but provide little support for the universal superiority
of simple strategies suggested by Miller et al. (1996).
2 Industry Context and Hypotheses
Furniture manufacturing is a mature industry typified by low profit margins, low entry
costs, limited market growth and intense competition between firms for market share
(Porter, 1980). Pressure on firms to increase the scale of their production operations
does exist but the sector remains highly fragmented with a disproportionate share of
small firms. In the United Kingdom in 1997, for example, 96.5 per cent of all
furniture manufacturers had less than 100 employees. Similarly, all furniture
manufacturers in Northern Ireland and 95.7 per cent of those in the Republic of
Ireland have less than 100 employees (Table 1)4.
Table 1: Size Structure of Businesses in the Northern Ireland and Republic ofIreland Furniture Industries
Furniture All ManufacturingEmploymentSizeband
NorthernIreland
Republicof
Ireland
NorthernIreland
Republicof Ireland
% % % %
1-9 employees 82.9 51.2 66.9 33.110-19 employees 9.9 20.5 13.5 21.220-99 employees 7.2 24.0 14.7 34.4100-499 employees 0.0 4.3 4.4 10.2500 plus employees 0.0 0.0 0.5 1.1
Total (%) 100.0 100.0 100.0 100.0Total (no. of units) 555 391 4280 4599
Sources: Republic of Ireland: Table 10, p. 96, Census of Industrial Production, 1996, CSO. NorthernIreland: Table 9.2, p.126, Size Band Analysis of UK Business, PA1003, 1998, ONS.
4 See also on the US furniture industry Vlosky, 1996, Muth and Falk, 1994; Seldon and Bullard, 1992;on Denmark, Maskell, 1998 and on South Africa, Kaplinsky and Manning, 1998, pp. 144-147.
4
Similar fragmentation is also characteristic of the UK and Irish furniture markets with
demand and sales growth varying widely between different product groups. From
1992 to 1997, for example, sales of living room furniture in the UK rose 44 per cent
compared to a 38 per cent increase in sales of bedroom furniture and an 85 per cent
increase in sales of dining room furniture (Mintel, 1998, p. 8). Significant variability
also exists between the cost structure, value added and profitability of firms in
different industry sub-sectors. Data from the Republic of Ireland Census of
Production, for example, suggests that gross output (a measure of sales) per employee
varied from £63,700 pa in firms manufacturing chairs, seats etc. to £46,800 pa in the
production of office furniture. Labour productivity (measured by net output per
employee), however, varied less markedly between furniture sub-sectors but was less
than a third of the manufacturing average (Table 2)5. In part, this reflects the low
capital intensity of furniture manufacture as well as the fact that labour costs as a
percentage of gross output were more than double the manufacturing average (Table
2).
5 Furniture production is also characterised by relatively low elasticities of substitution between labour,capital and raw material inputs (Seldon and Bullard, 1992). This, together with the relatively highlabour share of costs emphasises the importance of labour productivity and unit costs (Maskell, 1998).

5
Table 2: Cost and Productivity Indicators by Furniture Industry Sub-Sector:Republic of Ireland, 1996
Furniture Industry Sub-SectorsChairs/Seats
Office/Shop
Furniture
OtherKitchen
Furniture
OtherTables
AllManufacturing
Firms
A. Cost Structure (% Gross Output)Cost of Materials 55.9 44.5 53.9 51.1 47.4Cost of Services 1.6 5.1 1.1 1.6 1.4Fuel Costs 1.9 1.5 1.6 2.2 1.2Net Output 40.5 48.9 43.4 45.1 45.0Labour Costs 18.5 24.4 20.1 20.3 9.9
B. Productivity Indicators (£000 pa)Gross Output perEmployee
63.7 46.8 47.1 49.5 161.1
Net Output per Employee 25.8 22.9 20.5 22.3 80.5
Note: Average employment in all manufacturing firms was 49 compared to 22 in firmsmanufacturing chairs and seating, 16 in firms manufacturing office and shop furniture, 11 inkitchen furniture and 17 in firms manufacturing other tables.
Source: Table 1, p. 54 Census of Production, Republic of Ireland, 1996, CSO
Differences in the market prospects of the various sub-sectors of the furniture industry
also offer firms considerable scope for developing alternative business strategies.
Standard technologies, low capital intensity and low switching costs between sub-
sectors enables furniture firms to choose between changing their sales composition by
diversifying their product lines across a range of products and thereby targeting more
profitable sub-sectors, or changing their market position by pursuing differentiation
strategies that raise their profitability compared to the average in that sub-sector.
Miller et al. (1996) argue that in the absence of market threats or resource shortages,
firms in a mature market environment will tend to simplify their strategic repertoires
and pursue increasingly focused strategies (Miller, 1990; Miller and Chen, 1993) 6.
Porter (1980, p. 211) also suggests that unless firms are large enough to dominate
6 The coefficient of variation on sales, as a measure of the industry turbulence has been used in the pastto highlight relatively high market stability in furniture manufacturing. Furniture manufacturing wasfound not only to have lower market growth rate, but also lower R&D intensity, with this beinginterpreted as an index of product obsolescence. (Tosi, Aldag & Storey, 1973).

6
their operating environment the most feasible strategy is one of "focus or
specialisation on some tight strategic concept". Hence, we expect that in the mature
furniture industry:
Hypothesis 1 - Simple strategies relating to either changes in sales
composition or changing market position are more common than more
complex or ‘mixed’ strategies.
As suggested earlier, resource-based perspectives argue that firms’ choice of strategy
will be driven by their internal capabilities (Wernerfelt, 1984; Barney, 1991; Peteraf
1993; Castrogiovanni, 1991). For example, firms with strongly developed design and
R&D capabilities may seek competitive advantage through superior product quality
(Porter 1980). Similarly, where there is 'administrative slack' in a firm, this may
discourage the adoption of a focused and simple strategy by allowing an organisation
to pursue a wider variety of activities such as advertising, R&D, engineering and
training (Levinthal and March, 1981; March, 1981; Nelson and Winter, 1982).
Because of their limited managerial resources, small firms’ strategy choices will be
more strongly resource constrained than those of larger businesses (Variyam and
Kraybill, 1993), with the background and attitudes of the owner-manager affecting
both the firm’s strategic capacity and attitude to risk-taking (Wozniak, 1987). This
suggests that:
Hypothesis 2 – The choice between simple and mixed strategies will vary
systematically with differences in firms’ resource-base.
In mature industries, the evidence to date suggests that simple strategies that build on
firms’ key strengths can be highly successful (Miller et al., 1996). Porter (1980, p.
211) also argues that excessive complexity in a firm's strategy may lead to "confusion,
mediocrity, and inefficiency in the use of resources". Rodgers (1992) also suggests
that a focused and simple strategy can help firms to acquire competitive advantage
while multi-faceted strategies may scatter resources too broadly. Hence, we expect
that:

7
Hypothesis 3 - Simple strategies (relating to either changes in sales
composition or changing market position) will have greater profit pay-off than
more complex strategies.
Central to the success of either a simple or complex strategy, however, is the
consistency of the strategy with a firm’s resource-base7. Therefore, we anticipate that:
Hypothesis 4 – The profit payoff of simple and complex strategies will vary
systematically with differences in firms’ resource-base.
We assume that firms evaluate the success of alternative strategy approaches in terms
of their profit payoff, or more specifically by their contribution to increasing gross
profit margins. Unsuccessful strategies will then be re-engineered as firms seek a
better ‘fit’ between their chosen strategy, their resource base and their market
environment. Thus we expect that:
Hypothesis 5 – Through a process of learning, firms re-engineer their strategy
towards those strategies that have the greatest profit payoffs.
Such strategic re-engineering may involve a more efficient use of resources in support
of a firm’s current strategy, or alternatively, the re-allocation of resources and the
adoption of a new strategic direction. Human capital resources, particularly that of
the owner-manager, is likely to be central to the ability or willingness of a firm to re-
engineer its strategic approach. Variyam and Kraybill (1993), for example, suggest
that "Firms with higher levels of human capital have a better command over technical
information for implementing strategies. Such firms also have higher allocative
abilities and, hence, are more efficient in utilising the knowledge they acquire"
(Variyam and Kraybill, 1993, p. 138). Hence we expect that:
7 Chandler and Hanks (1994, p. 336), for example, conclude that "performance is a function not only ofthe attractiveness of the market- and resource-based capabilities, but also of the fit between resource-based capabilities and chosen firm strategies".
8
Hypothesis 6 – Firms’ ability or willingness to 'learn' and re-engineer their
strategy to achieve greater profit payoffs will vary systematically with
differences in their resource base.
3 Methodology
Data for this investigation of strategy choice was collected during an interview survey
with small furniture companies in Ireland during late 1998 and early 1999. All Irish
companies in the target employment sizeband (i.e. 10-100 employees) were contacted
by letter and invited to participate in the study. Those firms choosing to participate
received a benchmarking report comparing their strategic position to that of other
similar small firms8. In all, 129 companies were approached of which 44 (34 per
cent) took part in the benchmarking exercise and 39 (30 per cent) provided
sufficiently full information to be included in this study. Average employment of the
final group of 39 sample firms in 1997 was 33, with average sales of £1.68m.
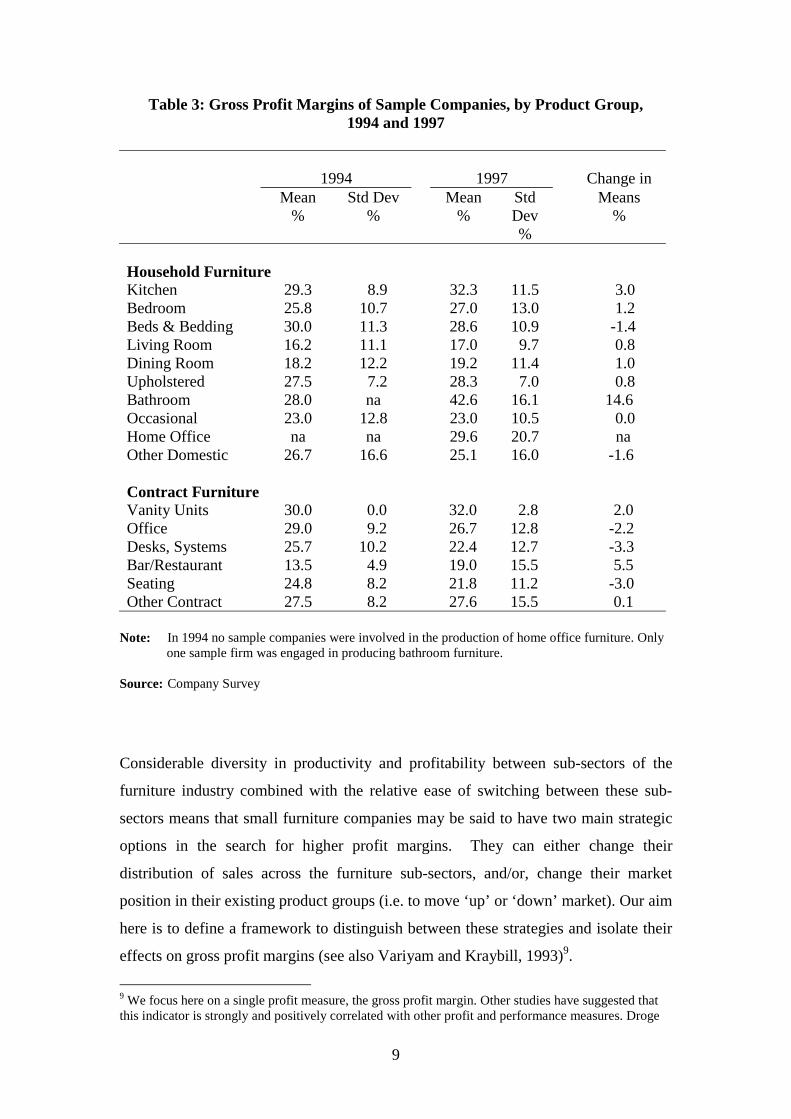
In the company interviews, sixteen product groups were distinguished of which 10
related to goods produced for household use and six to contract markets (see Table 3).
On average, each firm was selling in 2.7 of these product groups. As expected, gross
profit margins varied considerably between product groups, with some of the highest
gross margins in 1997 occurring in the manufacture of contract vanity units (32 per
cent), fitted bathroom furniture (42.6 per cent) and kitchens (32.3 per cent), and the
lowest gross margins in household living and dining room furniture (17-19 per cent).
The growth in average margins between product groups from 1994 to 1997 also
varied substantially. Large increases in gross margins on bathroom furniture (14.6 per
cent) and contract bar and restaurant furniture (5.5 per cent) contrasting sharply with
declining margins on contract desks and furniture systems (-3.3 per cent) and seating
(-3.0 per cent).
8 This study is part of an EU funded benchmarking initiative for small firms in Northern Ireland and theRepublic of Ireland being conducted by CAM Benchmarking Ltd (e.g. McFerran et al., 1996; Hewitt-Dundas and Roper, 1998).
9
Table 3: Gross Profit Margins of Sample Companies, by Product Group,1994 and 1997
1994 1997 Change inMean
%Std Dev
%Mean
%StdDev%
Means%
Household FurnitureKitchen 29.3 8.9 32.3 11.5 3.0Bedroom 25.8 10.7 27.0 13.0 1.2Beds & Bedding 30.0 11.3 28.6 10.9 -1.4Living Room 16.2 11.1 17.0 9.7 0.8Dining Room 18.2 12.2 19.2 11.4 1.0Upholstered 27.5 7.2 28.3 7.0 0.8Bathroom 28.0 na 42.6 16.1 14.6Occasional 23.0 12.8 23.0 10.5 0.0Home Office na na 29.6 20.7 naOther Domestic 26.7 16.6 25.1 16.0 -1.6
Contract FurnitureVanity Units 30.0 0.0 32.0 2.8 2.0Office 29.0 9.2 26.7 12.8 -2.2Desks, Systems 25.7 10.2 22.4 12.7 -3.3Bar/Restaurant 13.5 4.9 19.0 15.5 5.5Seating 24.8 8.2 21.8 11.2 -3.0Other Contract 27.5 8.2 27.6 15.5 0.1
Note: In 1994 no sample companies were involved in the production of home office furniture. Onlyone sample firm was engaged in producing bathroom furniture.
Source: Company Survey
Considerable diversity in productivity and profitability between sub-sectors of the
furniture industry combined with the relative ease of switching between these sub-
sectors means that small furniture companies may be said to have two main strategic
options in the search for higher profit margins. They can either change their
distribution of sales across the furniture sub-sectors, and/or, change their market
position in their existing product groups (i.e. to move ‘up’ or ‘down’ market). Our aim
here is to define a framework to distinguish between these strategies and isolate their
effects on gross profit margins (see also Variyam and Kraybill, 1993)9.
9 We focus here on a single profit measure, the gross profit margin. Other studies have suggested thatthis indicator is strongly and positively correlated with other profit and performance measures. Droge

10
Let ijπ be the gross profit margin of firm i, for product group j. The average gross
profit margin for firm i is then ∑=j
ijijij λππ , where ijλ is the share of firm i’s output
in product group j. To assess the success of firms’ strategy choices we examine the
extent to which their average gross margins increased over the 1994 to 1997 period
due to changes in sales composition (i.e. changes in ijλ ) and changes in market
positioning (i.e. changes in jij ππ − , where jπ is the mean profit margin for product
group j). The change in firm i’s average gross margin from 1994 to 1997 can then be
written:
∑∑ −=−j
ijijj
ijijii949497979497 λπλπππ = ∑∑ −+−
jijijijij
jijij
949497949797 )()( λππλλπ (1)
Here, the first term reflects the profit impact of changes in sales composition, and the
second term reflects the profit impact of changes in firm i’s gross profit rate for each
product group. Moves in the firm’s gross profit rates for each product group may,
however, reflect either changes in the firm’s market positioning or secular movements
in average profit rates for that particular product group. To separate these two effects
and enable us to identify the strategically determined element of profit change note
that:
)()()( 9497949497979497jjjijjijijij ππππππππ −+−−−=− (2)
Which, when substituted into (1), gives:
[ ] ∑∑
∑−+−−−+
−=−
jjjij
jjijjijij
ijj
ijijii
)()()(
)(
9497949494979794
9497979497
ππλππππλ
λλπππ
(3)
et al., (1994) for example, in their study of US furniture manufacturers found that return on sales waspositively correlated at the 1 per cent level with both return on investment and market share (Table 3B,p. 679).
11
We regard the first and second terms in this decomposition of profit change (denoted
Ai and Bi respectively below) as strategically determined reflecting the profit impact
of changes in sales composition and firms’ market position respectively. The third
term (denoted Ci below) reflects the exogenous impact on firms’ profit rates of secular
changes in average profit rates for each product group.
The very different levels and growth in gross profit margins between product groups
suggests the potential importance for firms of selecting the ‘right’ target markets. In
the next section we consider the strategies adopted by firms, the success of these
strategies and the extent to which firms were re-engineering their strategic approach
in the light of their experience.
4 Empirical Results
4.1 Strategic Choice and Its Determinants
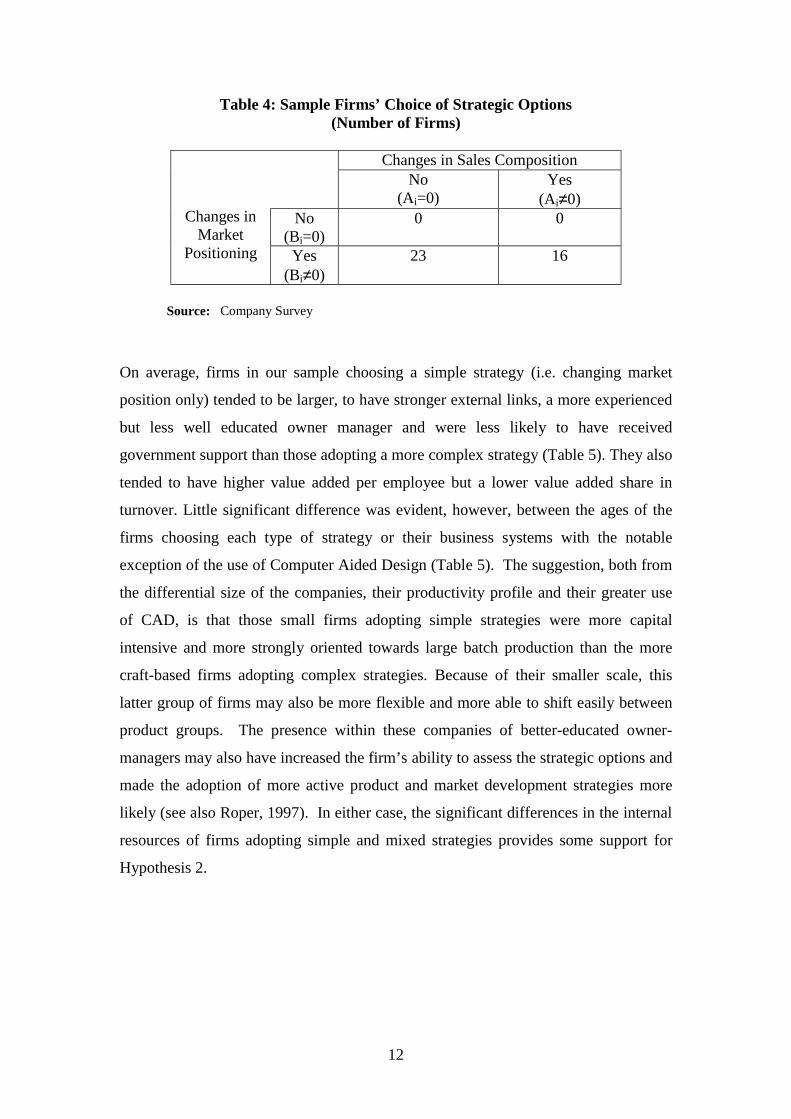
The framework defined above distinguishes four possible strategies: changing nothing
(i.e. Ai=0, Bi=0), changing sales composition only (i.e. Ai ≠ 0, Bi=0), changing market
position only (i.e. Ai=0, Bi ≠ 0), or changing both sales composition and market
position (i.e. Ai ≠ 0, Bi ≠ 0). In terms of the distinctions made by Miller et al. (1996)
the second and third of these strategic options might be regarded as ‘simple’ strategies
with the fourth option (changing everything) reflecting a more ‘complex’ approach.
On this basis it is possible to divide firms in the sample into those pursuing each type
of strategy over the 1994 to 1997 period (Table 4). What emerges is that among our
sample of companies two strategic options are dominant: twenty-three firms (59 per
cent) chose to pursue a simple strategy changing only their market position while
maintaining their sales composition (i.e. Ai=0, Bi ≠ 0). The remaining 16 companies
(41 per cent) adopted a complex strategy, changing both their sales composition and
market position. The larger proportion of companies choosing a simple strategy
provides some support for Hypothesis 1 outlined above and is consistent with the idea
that simple strategies may be seen by firms as appropriate to a mature industry like
furniture (Mintzberg, 1979; Miller et al., 1996). In section 4.2 below we consider the
success of these alternate approaches but focus for the moment on examining the
internal resources of those firms choosing simple and complex business strategies.
12
Table 4: Sample Firms’ Choice of Strategic Options(Number of Firms)
Changes in Sales CompositionNo
(Ai=0)Yes
(Ai≠0)No
(Bi=0)0 0Changes in
MarketPositioning Yes
(Bi≠0)23 16
Source: Company Survey
On average, firms in our sample choosing a simple strategy (i.e. changing market
position only) tended to be larger, to have stronger external links, a more experienced
but less well educated owner manager and were less likely to have received
government support than those adopting a more complex strategy (Table 5). They also
tended to have higher value added per employee but a lower value added share in
turnover. Little significant difference was evident, however, between the ages of the
firms choosing each type of strategy or their business systems with the notable
exception of the use of Computer Aided Design (Table 5). The suggestion, both from
the differential size of the companies, their productivity profile and their greater use
of CAD, is that those small firms adopting simple strategies were more capital
intensive and more strongly oriented towards large batch production than the more
craft-based firms adopting complex strategies. Because of their smaller scale, this
latter group of firms may also be more flexible and more able to shift easily between
product groups. The presence within these companies of better-educated owner-
managers may also have increased the firm’s ability to assess the strategic options and
made the adoption of more active product and market development strategies more
likely (see also Roper, 1997). In either case, the significant differences in the internal
resources of firms adopting simple and mixed strategies provides some support for
Hypothesis 2.

13
Table 5: Characteristics of Sample Firms by Strategy Choice
SimpleStrategies
ComplexStrategies
Number of Firms 23 16
Firm CharacteristicsAge of Firm (Years) 25.0 33.8Sales Turnover in 1997 (£000stg) 2445 1625.0Employment in 1997 42.6 32.1Turnover per Employee (£000) 61.0 ** 38.0Value Added per Employee (£000) 25.9 21.1Value Added to Turnover (%) 45.4 * 55.4Founder still in firm (% of firms) 52.2 ** 18.8Age of Owner-Manager (3) ** (2)Owner Manager - Years in Industry 21 ** 14Owner Manager - Years in Firm 16 * 11Owner Manager - Highest Qualification (2) ** (4)
Business Systems (% of Firms)ISO 9000 in 1994 13.0 6.3ISO 9000 during 1994 - 97 21.7 6.3Use of Robotics 0.0 12.5Use of CAD 73.7 * 43.8MAS in 1994 34.8 18.8
External Relationships (% of Firms)Universities 4.3 12.5Other group companies 13.0 * 0.0Suppliers 21.7 * 12.5
Government Assistance (% of Firms)Plant Machinery and Equipment 4.3 43.8Managerial or Clerical Training 17.4 ** 50.0Supervisory Training 0.0 ** 25.0Quality Assurance 4.3 18.8Strategic Planning 4.3 ** 25.0
Notes1. ** Denotes a significant difference between those firms choosing simple and complex
strategies at the 5 per cent level on the basis of a Kruskal-Wallis H test. * Denotes asignificant difference at the 10 per cent level.
2. Turnover per employee, value added per employee and value added to turnover are averagesfor the 1994-97 period.
3. Figures in brackets refer to categorical variables. The coding for the age of the owner-manageris 1, 20-29; 2, 30-39; 3, 40-49; 4, 50-59; 5, 60 plus. The coding for the highest qualification ofthe owner-manager is 0, none; 1, GCSE; 2, apprenticeship or OND; 3, A-levels; 4, HND orequivalent; 5, degree.
Source: Company Survey.
14
4.2 Strategy Success
To isolate the impact of firms’ strategy choices on gross margins we isolate and
remove the impact of secular or cyclical changes in average profit rates for each
product group using equation (3)10. Strategic changes in firms’ market position and
sales composition may then counteract, balance or exaggerate the effect of these
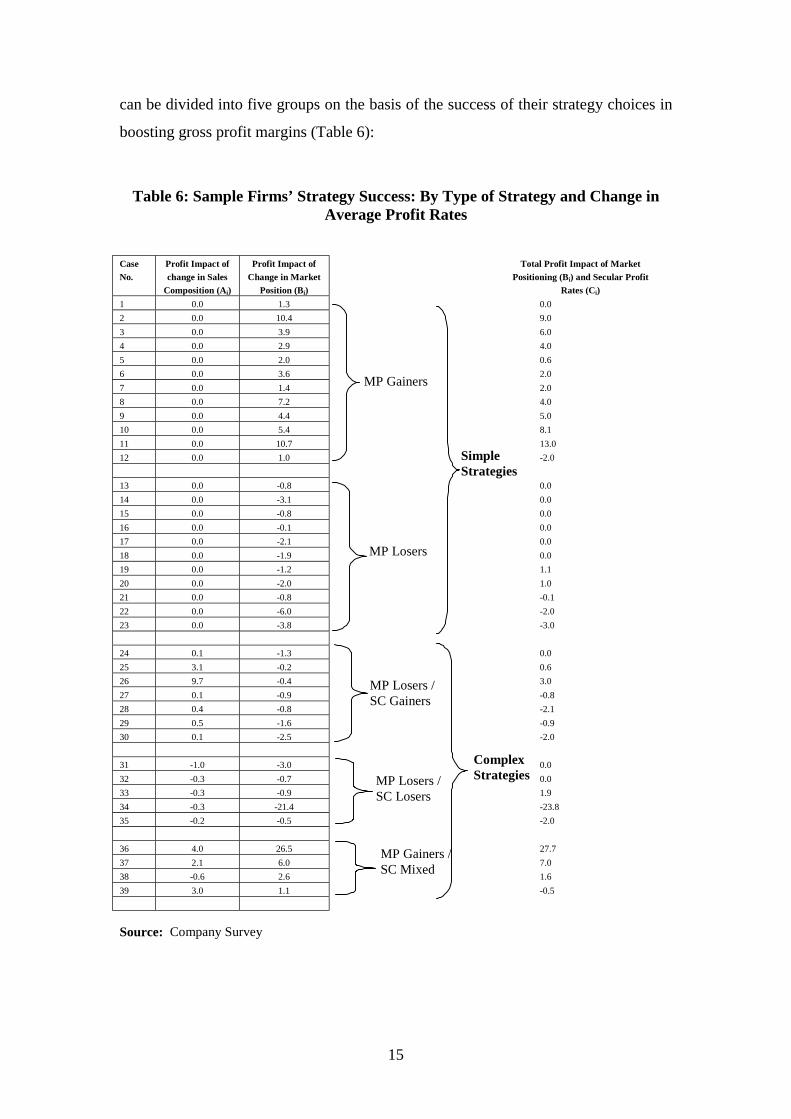
secular or cyclical changes on firms’ average gross profit. Table 6 displays the
individual impact on gross profit due to, changing sales composition (Ai) and market
positioning (Bi). The impact on gross profit of both market positioning and secular
changes in average profit rates (Bi+Ci) is also highlighted.
Twenty-three firms pursuing simple strategies (Cases 1 to 23) had no change in gross
profit due to changing sales composition (i.e. Ai=0), and mixed impacts on gross
profit due to market positioning (i.e. Bi≠0). Of these 23 furniture firms, 12 (Cases 1
to 12) had successfully positioned themselves in their market, acquiring increased
profit between 1994 and 1997 with 11 firms (Cases 13 to 23) experiencing
deterioration in profit in their product markets. For those firms where the sum effect
on gross profit of both market positioning and secular changes in profit rates was zero,
(i.e.Bi+Ci=0, see cases 13 to 18), deterioration of gross profit due to market
positioning (i.e. Bi<0) was counteracted by secular or cyclical movements in average
profitability in the firms’ product markets (i.e. Ci>0).
Of the 16 firms pursuing complex strategies (Cases 24 to 39), combining both
changes in sales composition (i.e. Ai≠0) and market positioning (i.e. Bi≠0), mixed
impacts on gross profit were found. Twelve of these 16 firms (cases 24 to 35)
experienced deterioration in their market position (i.e. Bi<0). While 7 of the 12 firms
achieved gross profit gains through changes in their sales composition (i.e. Ai>0, see
cases 24 to 30), for the remaining 5 firms gross profit loses through market
positioning were exacerbated by loses through sales composition (cases 31 to 35).
These alternative combinations of positive and negative profit impacts from changes
in market position (MP) and sales composition (SC) suggest that our sample of firms
10 Average profitability for each product group was taken as the simple average of the gross profit ratesof sample firms selling that group of products.
15
can be divided into five groups on the basis of the success of their strategy choices in
boosting gross profit margins (Table 6):
Table 6: Sample Firms’ Strategy Success: By Type of Strategy and Change inAverage Profit Rates
Case
No.
Profit Impact of
change in Sales
Composition (Ai)
Profit Impact of
Change in Market
Position (Bi)
Total Profit Impact of Market
Positioning (Bi) and Secular Profit
Rates (Ci)
1 0.0 1.3 0.0
2 0.0 10.4 9.0
3 0.0 3.9 6.0
4 0.0 2.9 4.0
5 0.0 2.0 0.6
6 0.0 3.6 2.0
7 0.0 1.4 2.0
8 0.0 7.2 4.0
9 0.0 4.4 5.0
10 0.0 5.4 8.1
11 0.0 10.7 13.0
12 0.0 1.0 -2.0
13 0.0 -0.8 0.0
14 0.0 -3.1 0.0
15 0.0 -0.8 0.0
16 0.0 -0.1 0.0
17 0.0 -2.1 0.0
18 0.0 -1.9 0.0
19 0.0 -1.2 1.1
20 0.0 -2.0 1.0
21 0.0 -0.8 -0.1
22 0.0 -6.0 -2.0
23 0.0 -3.8 -3.0
24 0.1 -1.3 0.0
25 3.1 -0.2 0.6
26 9.7 -0.4 3.0
27 0.1 -0.9 -0.8
28 0.4 -0.8 -2.1
29 0.5 -1.6 -0.9
30 0.1 -2.5 -2.0
31 -1.0 -3.0 0.0
32 -0.3 -0.7 0.0
33 -0.3 -0.9 1.9
34 -0.3 -21.4 -23.8
35 -0.2 -0.5 -2.0
36 4.0 26.5 27.7
37 2.1 6.0 7.0
38 -0.6 2.6 1.6
39 3.0 1.1 -0.5
Source: Company Survey
MP Gainers
SimpleStrategies
MP Losers
MP Losers /SC Gainers
MP Losers /SC Losers
MP Gainers /SC Mixed
ComplexStrategies
16
MP Gainers – twelve firms (see Table 6, Cases 1 to 12), adopting a simple strategy
whose average gross profit margins increased as a result of changing their market
position but whose sales composition was unchanged. One firm in this group was Up
Market Furniture Ltd.
Case Number 7 – Up Market Furniture Ltd has 85 employees engaged in the
manufacture of bedroom (10 per cent), dining room (45 per cent) and
occasional (45 per cent) furniture for the Irish household market. The firm has
a highly automated production facility and is run by a 45-year-old owner-
manager who is educated to degree level and who has over 20 years
experience in the furniture industry. From 1994 to 1997 the firm made no
change in its sales composition but either replaced or upgraded its entire
product range. These product modifications improved the firm’s market
position and added 1.4 pp to gross margins. The firm also benefited from a
secular rise in average profit margins for the products it was selling (see Table
3), a factor which added 0.6 pp to its gross profit rates.
MP Losers – eleven firms (see Table 6, cases 13 to 23), adopting a simple strategy
whose margins fell as a result of changes in market position but whose sales
composition was unchanged. Fred Bear Upholstery Ltd is an example of a firm in the
group of MP Losers.
Case Number 23 - Fred Bear Upholstery Ltd is a long established company
employing 20 people in the manufacture of upholstered furniture. The
company serves a local market and is run by a 63-year-old owner-manager
whose highest qualification is an apprenticeship. Over the 1994 to 1997 period
the firm did modify all of its products but experienced deterioration in its
market position. This reduced gross margins by 3.8 pp. This loss was partially
offset by an increase of 0.8 pp in the average gross margins on upholstered
furniture.
MP Losers/SC Gainers – seven firms (see Table 6, cases 24 to 30), adopting a
complex strategy whose gains in gross margins due to changes in sales composition
17
were offset by losses due to strategic shifts in their market position. One firm in this
group was T. Imber Projects Ltd.
Case Number 26 – T. Imber Projects Ltd employ 20 people in the manufacture
of kitchen, bathroom and bar/ restaurant furniture for the contract market.
Around a quarter of the firm’s sales are made in Europe with the remainder in
Ireland. The company is highly automated and has been heavily assisted by
government in recent years. The owner-manager of the firm is 45 years old,
has a degree and 17 years experience in the furniture industry. From 1994-97
the firm changed its sales composition radically moving away from kitchen
and bathroom furniture towards the more profitable bar/ restaurant furniture.
This change in sales composition contributed 9.7 pp to average gross margins.
Over the same period the firm’s market position deteriorated slightly reducing
average margins by –0.4 pp but the company gained from an increase in
average profitability in its markets which added 3.4 pp to average gross
margins.
MP Losers/SC Losers – five firms (see Table 6, cases 31 to 35) adopting a complex
strategy whose gross margins fell due to changes in both sales composition and
market position. One such case was W. Worm Furniture Ltd.
Case Number 31 – W. Worm Furniture Ltd employs 15 people in the
manufacture of kitchen and bedroom furniture. The firm sells all of its output
in the Irish market and largely continued to manufacture the same products
over the 1994 to 1997 period. The owner-manager of the business is 34 and
began work in the furniture industry 15 years ago without any qualifications.
Over the 1994 to 1997 period the firm sought to diversify into the manufacture
of occasional furniture. Lower average margins in this sector (see Table 3)
meant that this change in sales composition reduced average gross margins by
–1.0 pp. Over the same period the firm lost some ground relative to its
competitors in its main markets resulting in a worsening market position and a
reduction in gross margins of –3.0 pp. Over the 1994 to 1997 period, however,
these strategy-induced profit effects were offset by an increase in average
margins of 3.0 pp in the markets for kitchen and bathroom furniture (Table 3).
18
Four other firms (see Table 6, cases 36 to 39), adopting a complex strategy form a
residual category (MP Gainers/Mixed SC) whose gross profit margins increased due
to changes in market position but who experienced a variety of sales composition
effects.
Table 7 summarises the profit performance of each of these groups of companies over
the 1994 to 1997 period. The table distinguishes between that element of profit
growth that was strategy related (i.e. Ai, Bi) and that due to secular or cyclical trends
(i.e. Ci). As we would expect, no statistical difference was observed between the five
groups of firms in the size of the cyclical or secular movement in average gross
margins. Statistically significant differences were evident, however, between the
strategy-determined components elements of the change in average gross margins for
the five groups of companies11. The implication is that over the 1994 to 1997 period
strategy choice did have a significant impact on the growth in gross margins of our
sample of firms, although our data suggests no clear distinction between simple and
complex strategies. More specifically, the distribution of the strategically determined
element of profit growth was not significantly different between the groups of firms
adopting simple and complex strategies12. This result is at odds with Hypothesis 3,
and contrasts with the results of Miller et al. (1996) who found that strategic
simplicity was positively related to profit success in both the furniture and software
sectors13.
11 A Kruskal-Wallis test for equality of means for gross profit effect of changes in sales compositionχ(4)=29.48 (ρ<0.001); for effect of changes in market positioning χ(4)=27.70 (ρ<0.001); and forsecular/cyclical effects χ(4)=5.77 (ρ=0.22).12 A Mann-Whitney test of the difference in the distribution of the strategy determined elements of theprofit growth of companies in the simple strategy groups compared to those in the mixed strategygroups had Z=-0.314 (ρ=0.753).13 Miller et al. (1996) suggest that ‘perhaps in turbulent settings strategic parsimony confers somecompetitive advantage to firms vying against less focussed rivals’ (p. 880).

19
Table 7: Decomposition of Change in Sample Firms’ Gross Profit Rates(Percentage Points)
SimpleStrategies
Mixed Strategies
MPGainers
MPLosers
MPLosers/
SCGainers
MPLosers/
SCLosers
MPGainers/
MixedSC
Number of Firms 12 11 7 5 4
% % % % %Strategy EffectsMean Change in SalesComposition (Ai)
0.0 0.0 2.0 -0.4 2.1
Mean Change in MarketPosition (Bi)
4.5 -2.1 -1.1 -5.3 9.0
Total Mean Strategy Effect 4.5 -2.1 0.9 -5.7 11.1
Mean Secular/Cyclical Effects(Ci)
-0.2 1.8 0.8 0.5 -0.1
Total Mean Change in GrossProfit
4.3 -0.3 1.7 -5.2 11.0
Source: Company Survey
For the firms in our sample, adopting a simple strategy provided no guarantee of an
increase in average gross margins. Rather, significant variation exists in the profit
performance of those firms within the groups adopting simple and complex
strategies14. One possibility is that the success or failure of each strategy choice to
contribute positively to gross margins is linked to firms’ characteristics or resource
base. It may be, for example, that firms achieving positive profit benefits from their
strategy choices had a richer resource base than their less successful counterparts thus
allowing them to pursue their chosen strategy with more vigour or imagination. Table
8 reports a number of indicators describing the characteristics and resource base of
sample firms in the four main categories identified above. Statistical tests are also
reported to identify any significant differences between the characteristics of firms
whose strategy choices had positive and negative impacts on average gross margins.
14 Mann-Whitney tests of the difference in the distribution of the strategy determined elements of theprofit growth of companies between the simple strategies groups had Z=-4.066 (ρ<0.001). A similartest for the groups MP Losers/SC Gainers and MP Losers/SC Losers had Z=-2.049 (ρ<0.040).
20
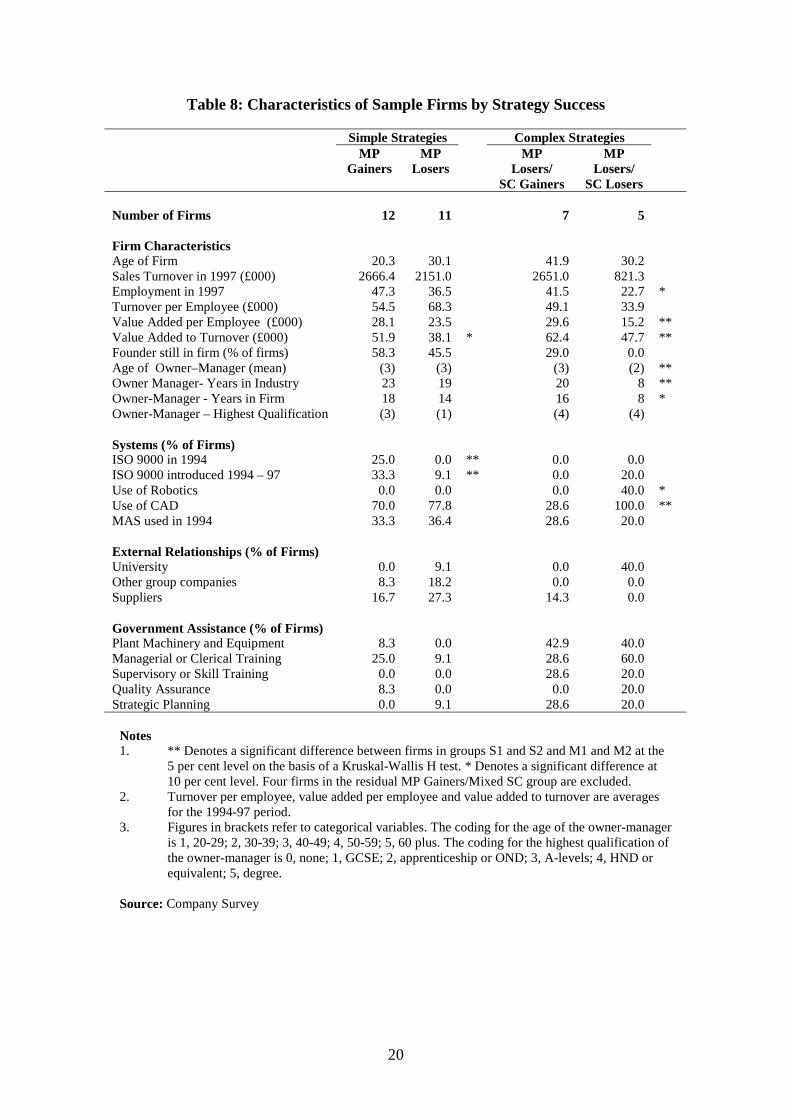
Table 8: Characteristics of Sample Firms by Strategy Success
Simple Strategies Complex StrategiesMP
GainersMP
LosersMP
Losers/SC Gainers
MPLosers/
SC Losers
Number of Firms 12 11 7 5
Firm CharacteristicsAge of Firm 20.3 30.1 41.9 30.2Sales Turnover in 1997 (£000) 2666.4 2151.0 2651.0 821.3Employment in 1997 47.3 36.5 41.5 22.7 *Turnover per Employee (£000) 54.5 68.3 49.1 33.9Value Added per Employee (£000) 28.1 23.5 29.6 15.2 **Value Added to Turnover (£000) 51.9 38.1 * 62.4 47.7 **Founder still in firm (% of firms) 58.3 45.5 29.0 0.0Age of Owner–Manager (mean) (3) (3) (3) (2) **Owner Manager- Years in Industry 23 19 20 8 **Owner-Manager - Years in Firm 18 14 16 8 *Owner-Manager – Highest Qualification (3) (1) (4) (4)
Systems (% of Firms)ISO 9000 in 1994 25.0 0.0 ** 0.0 0.0ISO 9000 introduced 1994 – 97 33.3 9.1 ** 0.0 20.0Use of Robotics 0.0 0.0 0.0 40.0 *Use of CAD 70.0 77.8 28.6 100.0 **MAS used in 1994 33.3 36.4 28.6 20.0
External Relationships (% of Firms)University 0.0 9.1 0.0 40.0Other group companies 8.3 18.2 0.0 0.0Suppliers 16.7 27.3 14.3 0.0
Government Assistance (% of Firms)Plant Machinery and Equipment 8.3 0.0 42.9 40.0Managerial or Clerical Training 25.0 9.1 28.6 60.0Supervisory or Skill Training 0.0 0.0 28.6 20.0Quality Assurance 8.3 0.0 0.0 20.0Strategic Planning 0.0 9.1 28.6 20.0
Notes1. ** Denotes a significant difference between firms in groups S1 and S2 and M1 and M2 at the
5 per cent level on the basis of a Kruskal-Wallis H test. * Denotes a significant difference at10 per cent level. Four firms in the residual MP Gainers/Mixed SC group are excluded.
2. Turnover per employee, value added per employee and value added to turnover are averagesfor the 1994-97 period.
3. Figures in brackets refer to categorical variables. The coding for the age of the owner-manageris 1, 20-29; 2, 30-39; 3, 40-49; 4, 50-59; 5, 60 plus. The coding for the highest qualification ofthe owner-manager is 0, none; 1, GCSE; 2, apprenticeship or OND; 3, A-levels; 4, HND orequivalent; 5, degree.
Source: Company Survey

21
Two significant differences exist between those firms whose simple strategies had
positive and negative impacts on average gross margins. First, MP Gainers had a
significantly higher value added to turnover ratio than MP Losers. Secondly, MP
Gainers were significantly more likely to have implemented ISO 9000 quality
certification procedures either prior to 1994 or during the 1994 to 1997 period than
MP Losers. Both the high value added share in output and the significant effort
required by small firms to obtain ISO 9000 certification suggest that the MP Gainers
group have a particularly strong commitment to high product quality (Karlton,
Axelsson and Eklund, 1998). This commitment is likely to have played a key role in
determining the success of the firms’ attempts to improve their market position.
A wider range of differences was evident between firms adopting successful and
unsuccessful complex strategies. First, MP Losers/SC Losers were significantly
smaller on average than MP Losers/SC Gainers. Secondly, MP Losers/SC Losers
were also more likely to have introduced new production and design systems (e.g.
robotics, CAD) over the 1994 to 1997 period than MP Losers/SC Gainers (Table 8)15.
One possibility is that the demands of managing both a complex market development
strategy and this internal up-grading may have overloaded the limited managerial
resources available within the small MP Loser/SC Loser firms leading to less
effective strategy implementation and weaker profit outcomes. The suggestion is that
for these firms a complex strategy may have been inappropriate given their limited
managerial resources. This provides support for Hypothesis 4 that there exists a
systematic relationship between firms’ resource base and strategy success.
4.4 Strategic re-engineering
A firm’s assessment of the need to re-think its business strategy will be based on an
evaluation of the success of past strategies and expectations of future market
developments (Nelson and Winter, 1982; Buzzell and Gale, 1987). We assume that
for the firms in our sample the main impetus for re-engineering or re-thinking their
business strategy for the post-1997 period was their success in achieving growth in
15 Note also that the impact of these new production and design systems was not evident in either salesper employee or productivity, both of which were lower than among this group than among MPLosers/SC Gainers.

22
gross margins over the 1994 to 1997 period (e.g. Table 7)16. Sample companies in the
MP Gainers group may therefore have little incentive to rethink their strategic
approach compared to, say, those in the MP Losers/SC Losers Group. For Miller et
al. (1996), strategic re-engineering comes about when firms’ failure to achieve gross
profit growth translates into managerial discomfort. Other factors, notably managerial
or financial resource constraints or the particular characteristics of the furniture sector,
may limit firms’ scope for strategy development17.
Our assessment of the extent of strategic re-engineering among firms in our sample is
based on an interview question asking firms to identify their main strategic objective
post-1997. Reflecting the framework defined earlier, firms were offered four
alternatives:
Consolidation – i.e. not to undertake any strategic market development but to focus
instead on maintaining or increasing their sales of their current product range in their
existing markets
New Market Development - i.e. a simple strategy intended to develop new markets
for the firm’s existing products. This means either that firms intend to sell their
products originally developed for the household sector in contract markets, or vice-
versa.
Market Repositioning – i.e. a simple strategy intended to reposition the company in its
existing markets by the development and marketing of new or improved products.
New Market Development and Market Repositioning – i.e. a complex strategy
combining a search for new markets and the development of new products.
Table 9 summarises the main strategic objectives of sample firms for the post-1997
period on the basis of their strategy choices and success over the 1994-97 period. It is
16 Other objectives or criteria for evaluating the success of past strategic choices are possible. Firmsmay, for example, wish to build market share in order to establish a more dominant market position(Buzzell and Gale, 1987). In this case, the strategy choices firms make are likely to be very differentfrom those made to maximise gross profit margins (e.g. Roper, 1997).
23
worth noting however, that for this analysis our sample sizes are small because we are
comparing the proportions of firms within each group adopting different strategy
options for the post-1997 period. Some caution is therefore necessary in the
interpretation of the results.
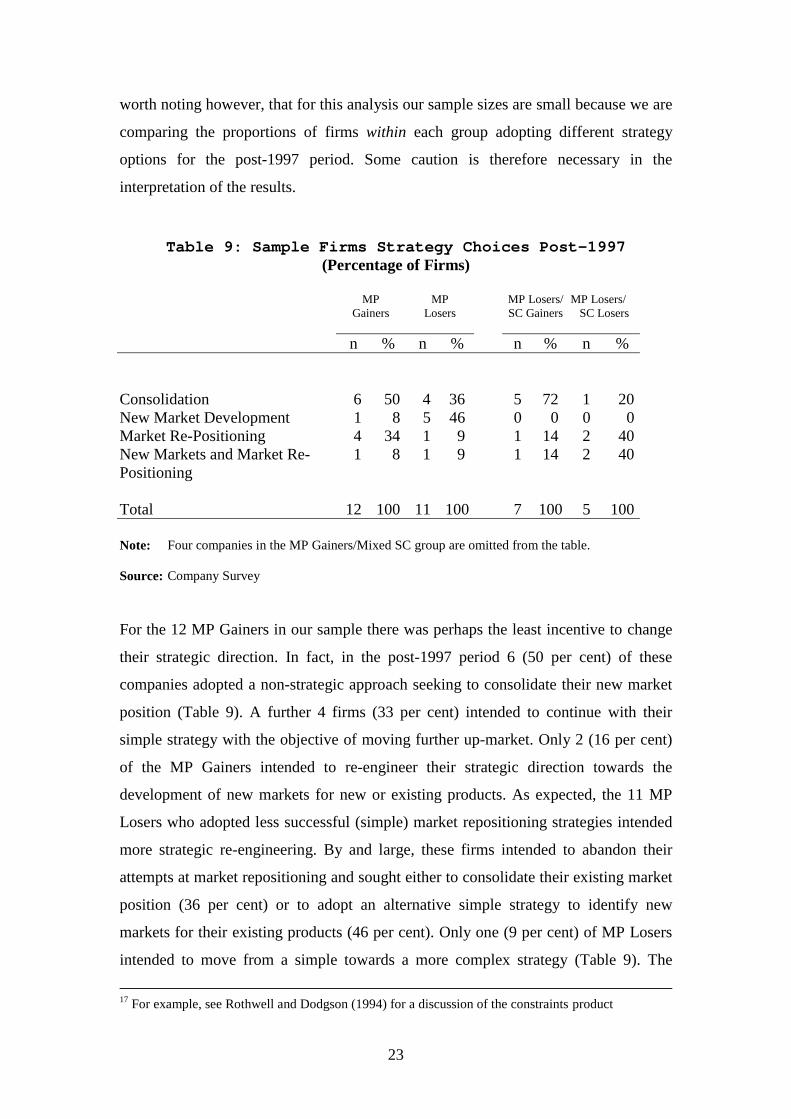
Table 9: Sample Firms Strategy Choices Post-1997(Percentage of Firms)
MPGainers
MPLosers
MP Losers/SC Gainers
MP Losers/SC Losers
n % n % n % n %
Consolidation 6 50 4 36 5 72 1 20New Market Development 1 8 5 46 0 0 0 0Market Re-Positioning 4 34 1 9 1 14 2 40New Markets and Market Re-Positioning
1 8 1 9 1 14 2 40
Total 12 100 11 100 7 100 5 100
Note: Four companies in the MP Gainers/Mixed SC group are omitted from the table.
Source: Company Survey
For the 12 MP Gainers in our sample there was perhaps the least incentive to change
their strategic direction. In fact, in the post-1997 period 6 (50 per cent) of these
companies adopted a non-strategic approach seeking to consolidate their new market
position (Table 9). A further 4 firms (33 per cent) intended to continue with their
simple strategy with the objective of moving further up-market. Only 2 (16 per cent)
of the MP Gainers intended to re-engineer their strategic direction towards the
development of new markets for new or existing products. As expected, the 11 MP
Losers who adopted less successful (simple) market repositioning strategies intended
more strategic re-engineering. By and large, these firms intended to abandon their
attempts at market repositioning and sought either to consolidate their existing market
position (36 per cent) or to adopt an alternative simple strategy to identify new
markets for their existing products (46 per cent). Only one (9 per cent) of MP Losers
intended to move from a simple towards a more complex strategy (Table 9). The
17 For example, see Rothwell and Dodgson (1994) for a discussion of the constraints product
24
tendency for the MP Losers to move towards alternative simple rather than more
complex strategies is at odds with some of the arguments put forward in Miller et al.
(1996). They argued that firms experiencing managerial discomfort due to negative
profit growth resulting from a simple strategy would be likely to move towards a
more complex approach. Our evidence suggests instead that experience of an
unsuccessful simple strategy is more likely to stimulate firms to seek alternate simple
strategies rather than a more complex strategic approach.
Among those firms in our sample pursuing complex strategies with positive profit
outcomes over the 1994 to 1997 period (i.e. the MP Losers/SC Gainers) we also
observe a considerable degree of strategic re-engineering. Only one (14 per cent) of
these firms intended to continue their complex strategic approach post-1997, with 5
(72 per cent) firms intending to consolidate their market position. The remaining firm
(14 per cent) in the MP Losers/SC Gainers group moved towards a simpler strategic
approach designed to move up-market. It is difficult to account for the degree of
strategic reorientation by these companies given the (albeit small) positive gross profit
effect of their previous complex strategy (Table 6). One possibility, however, is that
these firms were hoping to exploit the positive profit benefits of previous changes in
sales composition while avoiding a recurrence of the profit falls from market
repositioning they incurred over the 1994 to 1997 period (see Table 7).
Our final main group of companies (i.e. the MP Losers/SC Losers) had, if anything
the greatest incentive to re-engineer their strategic approach. Over the 1994 to 1997
period these firms experienced falls in gross profit due both to changes in their market
position and changes in sales composition (Table 7). Added to this, these firms were
notably smaller than others in our sample and were also undertaking internal up-
grading with the adoption of CAD and robotic systems (Table 8). In terms of the
Miller et al. (1996) analysis, the combination of this poor profit performance and
stretched managerial resources, would suggest these firms would be particularly likely
to move towards a simpler strategic approach. In fact, of the five firms in this group,
two (40 per cent) indicated their intention to continue with a complex strategy (Table
9). Another two firms (40 per cent) were also intending to adopt a simple strategy
aimed at market repositioning despite the fact that over the 1994 to 1997 period this
innovation by small companies.

25
was the source of the majority of the deterioration in their gross profit rates (Table 7).
Despite the small number of companies in this group, the impression given is that the
MP Losers/SC Losers were maintaining rather than substantially re-engineering their
strategic direction regardless of their experience over the 1994 to 1997 period. Two
significant differences between the firms in the MP Losers/SC Losers group and the
remainder of the sample may be contributing to these firms apparent reticence to learn
from their previous experience (Table 8). First, the MP Losers/SC Losers were
significantly smaller than other sample companies, a factor that is likely to be
reflected in a lack of specialised managerial functions and/or developed management
and information systems. For example, the proportion of MP Losers/SC Losers
having a management accounting system (MAS) was lower (albeit insignificantly)
than that in any other group. Secondly, the owner-managers of the MP Losers/SC
Losers were, on average, 10 years younger and had less than half the years of
experience in the furniture industry than those owner-managers running the other
three groups of companies (Table 8). These limitations probably made it more
difficult for the MP Losers/SC Losers to monitor and/or evaluate their strategic
successes and failures and modify their strategic approach (Variyam and Kraybill,
1993; Kotay and Meredith, 1997).
Although sample sizes here are small, these results provide some tentative evidence
that firms were learning from their experience over the 1994-97 period and re-
engineering their strategies towards those having greatest profit payoff. This provides
some positive support for Hypothesis 5. Firms in the MP Losers/SC Losers group,
however, which had the worst strategy experience over the 1994 to 1997 period were
also undertaking the least extensive strategic re-engineering. This group of firms were
also the smallest and had the youngest and least experienced owner-managers
suggesting that, as Hypothesis 6 suggests, the extent of firms’ ability to undertake any
strategic re-engineering will depend on the quality of their resource base.

26
5 Conclusions
Our analysis of the business strategies and profit growth of small furniture companies
in Ireland suggests three main empirical results. First, in terms of strategy choice, like
Miller et al. (1996) we find some support for the notion that firms in mature sectors
such as furniture tend to adopt simple business development strategies. Among the
thirty-nine firms considered here, 23 (59 per cent) chose a simple strategy based
around changing market position. The remaining 16 firms (41 per cent) adopted a
more complex strategy intended to boost gross margins by changing both sales
composition and market position. The choice between simple and more complex
business strategies was strongly conditioned by the quality of firms’ resource-base.
Second, in terms of strategy success, we find no evidence that simple strategies
unambiguously out-perform more complex approaches even in the mature furniture
sector. What is evident, however, is that significant differences exist between the
characteristics and resource bases of those firms increasing gross margins by adopting
both simple and complex strategies. For our sample of firms, achieving success with a
simple strategy aimed at improving market position was strongly associated with
attempts to improve product quality and quality certification. Similarly, achieving
success with a more complex strategy involving changes in both sales composition
and market positioning was associated with larger businesses and more mature and
experienced owner-managers.
Third, although our analysis is limited by relatively small sample sizes, we find some
differences in firms’ ability or willingness to re-engineer their business strategies in
the light of their experience. Sample firms, which had adopted successful strategies
over the 1994 to 1997 period, tended to adopt a more conservative approach for the
post-1997 period often emphasising consolidation rather than further product or
market development. A group of smaller, more resource constrained firms, however,
which had the worst profit experience also undertook the least extensive strategic re-
engineering. The suggestion being that the extent of small firms’ ability to undertake
any strategic re-engineering is again strongly conditioned by the quality of their
internal resource base.
27
Although care is required in drawing more general conclusions from small-scale
studies such as this, some points are worth drawing out. Perhaps the most basic of
these is the contrast between our evidence and the superiority of simple, one-
dimensional strategies frequently emphasised in the strategic management literature
(e.g. Porter, 1980). The evidence from our study does not support this view. For our
firms it was not strategy choice per se that determined success, rather it was the
consistency between firms’ strategy choice and the quality and application of their
resource base. In policy terms, our results suggest that measures designed to improve
the resource base of small firms through training, promoting product and service
quality and quality assurance are likely to have positive profit payoffs in the longer
term. Equally, if not more important, however is giving small firms the capability to
evaluate the various strategic options and, where necessary, the support to re-engineer
their strategic approach.
28
References
Bain, J.S. (1972). Essays on Price Theory and Industrial Organisation. HarvardUniversity Press, Cambridge, MA.
Barney, J. (1991). “Firm resources and sustained competitive advantage”, Journal ofManagement, 17(1), pp.99-120.
Buzzell, R.D., and Gale, B.T. (1987). The PIMS Principles: Linking Strategy toPerformance. New York: Free Press.
Castrogiovanni, G.J. (1991). “ Environmental Munificence: A TheoreticalAssessment.” Academy Of Management Review, 16(3), pp. 542-565.
Caves, R.E. (1980). “Industrial organisation, corporate strategy, and structure: Asurvey”, Journal of Economic Literature, 18(1), pp. 64-92.
Chandler, G.N. & Hanks S.H (1994), “Market Attractiveness, Resource-BasedCapabilities, Venture Strategies, and Venture Performance”, Journal Of BusinessVenturing 9, pp.331-349.
Clarke R.,(1985), Industrial Economics, Blackwell, Oxford.
Conner, K.R. (1991). “A historical comparison of resource-based theory and fiveschools of thought within
Demsetz, H. (1973). “Industry structure, market rivalry and public policy”, Journal ofLaw and Economics, 16(1), pp.1-9.
Dooley, R S Fowler, D M and Miller, A (1996) ‘The Benefits of StrategicHomogeneity and Strategic Heterogeneity: Theoretical and Empirical EvidenceResolving Past Differences, Strategic Management Journal, 17, 293-305.
Droge, C Vickery, S and Markland, R E (1994) ‘Source and Outcomes of CompetitiveAdvantage: An Exploratory Study of the Furniture Industry, Decision Sciences, 25,5/6, 669-689.
Grant, R.B. (1991) “ A resource base theory of competitive advantage: Implicationsfor strategy formulation”, California Management Review, 33(3), pp.114-135.
Hewitt-Dundas, N and Roper, S (1998) ‘Benchmarking Company Profitability andGrowth: Some Measurement Issues for Small Firms in Ireland’, Economic and SocialReview, 29,2, 201-208.
Kaplinsky, R and Manning, C (1998) ‘Concentration, Competition Policy and theRole of Small and Medium-Sized Enterprises in South Africa’s IndustrialDevelopment’, Journal of Development Studies, 35,1, 139-161.
29
Karltun, J Axelsson, J and Eklund, J (1998) ‘Working Conditions and Effects of ISO9000 in six furniture-making companies: implementation and processes’, AppliedErgonomics, 29,4, 2225-232.
Kotay, B and Mereidth, G G (1997) ‘Relationships among Owner/Manager PersonalValues, Business Strategies and Enterprise Performance, Journal of Small BusinessManagement, 35, 2, 37-64.
Levinthal, D.A. & March, J.G. (1981). “A model of adaptive organisational search.”Journal of Economic Behaviour and Organisation, 2, pp.307-333.
March,J.G. (1981). “Footnotes to Organisational Change”. Administrative ScienceQuarterly, 26,pp.563-577.
Maskell, P (1998) ‘Low-Tech Competitive Advantages and the Role of Proximity:The Danish Wooden Furniture Industry’, European Urban and Regional Studies, 5,2,99-118.
Mauri, A. J. & Michaels, M.P. (1998), “Firm and Industry Effects Within StrategicManagement: An Empirical Examination”, Strategic Management Journal,19, pp.211-219.
Mc Ferran, B Hewitt-Dundas, M N and Roper, S (1996) ‘Performance Benchmarks forDeveloping Firms’, The CAM Project, Belfast.
Miller, D. & Chen, M.J. (1993). “The Simplicity of Strategic Repertoires”, Best PaperProceedings of the Academy of Management Meetings: pp.32-36.
Miller, D. (1990) The Icarus Paradox. New York: HarperCollins.
Miller, D., Lant, K.T., Milliken, F.J. & Korn H.J., (1996), “The Evolution of StrategicSimplicity: Exploring Two Models of Organisational Adaption”, Journal ofManagement, 22(6), pp.863-887.
Mintzberg H., (1979), The Structuring of Organisations, Prentice-Hall, Inc.,Englewood Cliffs, N.J.
Muth, T M and Falk, E.T., (1994), ‘Multi-factor Productivity in Household Furniture’,Monthly Labour Review, June, 35-47.
Nelson, R.R. & Winter, S.G.(1982). An Evolutionary Theory Of Economic Change.Cambridge, M.A: Harvard University Press.
Peteraf, M.A. (1993). “ The cornerstones of competitive advantage: A resource-basedview”, Strategic Management Journal, 14(3), pp. 179-191.
Porter, M.E. (1980). Competitive Strategy. New York: Free Press.
Rodgers, D. (1992). The Future Of American Banking. New York: McGraw Hill.
30
Roper, S (1998) ‘Strategic Choice and Small Business Performance - An ExploratoryAnalysis’, Small Business Economics.
Roper, S (1997) ‘Strategic Initiatives and Small Business Performance: AnExploratory Analysis of Irish Companies’, Entrepreneurship and RegionalDevelopment, 9, 353-364.
Rothwell R., & Dodgson M., (1994) Innovation & Size of Firm. Handbook ofIndustrial Innovation, eds. Dogson & Rothwell, Edward Elgar. Aldershot.
Seldon, B J and Bullard, S H (1992) ‘Input Substitution, Economies of Scale andProductivity Growth in the US Upholstered Furniture Industry’, Applied Economics,24, 1017-1025.
Tosi, H., Aldag, R. & Storey, R.G. (1973). “On the Measurement of the Environment:An Assessment of the Lawrence and Lorsch Environmental Uncertainty Scale.”Administrative Science Quarterly, 18, pp.27-36.
Variyan J.N., Kraybill D. S. (1993), “Small Firms Choice Of Business Strategies”,Southern Economic Journal, 60(1), pp.136-145.
Vlonsky, R P (1996) ‘Profile of Furniture Manufacturers in the US South: Structureand Industry Growth Factors’, Wood and Fibre Science’, 28, 4, 450-460.
Wernerfelt, B. (1984). “ A resource based view of the firm”, Strategic ManagementJournal, 5(2), pp.171-180.
Wozniak, G.D., (1987), “Human Capital, Information, and The Early Adoption ofNew Technology.” The Journal of Human Resources, pp.101-12.


![Characterised Control Valves with Actuators - Belimo15.04.2011].pdf · Characterised Control Valves with Actuators Version 5.1. ... Select the Characterised Control Valve according](https://static.fdocuments.net/doc/165x107/5a9df4b67f8b9a29228b9d94/characterised-control-valves-with-actuators-15042011pdfcharacterised-control.jpg)

