Alternative Positron-Target Design for Electron-Positron ...

Small Explorer (SMEX)
POsitron Electron Magnet Spectrometer (POEMS)
Phase I Final Report
NASA ContractNAS5-38098
Ji
rrepareu Dy meBartol Research Institute
University of Delaware
Newark, DE 19716
(_AS_CR-/_?_/Z_ SMALLEXPLORER(SMFX) POSITRON ELECTRON MAGNEI
SPECTROMETER (POEMS) (Oe] aware
Univ.) 165 p LIMIT NASA PERS. ONLY
X95-36018
Unclas
00/35 OO4O944
January1995

Small Explorer (SMEX)POsitron Electron Magnet Spectrometer (POEMS)
Phase I Final Report
Signatures
Prepared by:
Jacques L'Heureux
Instrument Manager
Principal Investigator
Date
_ g/,/e_7----Date

Table of Contents
Final Report from the Bartol Research Institute: .................................................... 1
Final Reports from theCollaborating Institutions
Appendix A
Appendix B
Appendix C
Appendix D
Appendix E
Final Report from the Louisiana State University
Final Report from the University of Chicago
Final Report from the Goddard Space Flight Center
Final Report from the University of Arizona
Final Presentation to the Associate Administrator for the Office of
Space Science at NASA Headquarters.

SMEX/POEMS - Phase I Final Report
Final Report from the Bartol Research Institute:
Phase I was from December 1993 to October 1994 with funding extended to December 1994.
The SMEX/POEMS Team consist of five US and of three European groups. The collaborating
institutions, the Lead Co-Is and their institution's abbreviated names are listed in Table 1.
Table 1 Collaborating Institutions and their Abbreviated Names
Institution/Lead Co-I Abbreviated Name
Bartol Research Institute
Paul A. Evenson, POEMS PI
GSFC - Laboratory for High Energy Astrophysics
Louis M. Barbier, Lead Co-I
Louisiana State University
John P. Wefel, Lead Co-I
University of Arizona
J. Randy Jokipii, Lead Co-I
University of Chicago
Simon P. Swordy, Lead Co-I
Commissariat a l'Energie Atomique, Saclay
Philippe Ferrando, Lead Co-I
University of Kiel
Horst Kunow, Lead Co-I
University of Turku
Jarmo Torsti, Lead Co-I
Bartol or BRI
GSFC/LHEA
LSU
Arizona or UA
Chicago or UC
CEA-Saclay or CEA
Kiel or UK
Turku or UT
The Bartol Research Institute (BRI) was awarded the full contract amount in December of
1993 and subcontracts were set up later that month with the four other US institutions.
Approximately one man-month of time was expended on setting up those four subcontracts.
The work that I will summarize from here on refers to that done by BRI personnel and by the
group as a whole. Work done by the BRI subcontractors is summarized in the attached
appendices. More information can also be found in the proposal that we submitted in July of 1994
as document BRI-SMEX-010 (Volume 1 - Technical Proposal and Volume 2 - Cost Proposal).
Copies of these documents will be made available if requested.
The month of January was mainly devoted to instrument definition. A group meeting between
the 8 institutions was held at the Bartol Research Institute on January 11-12 which was followed
by the Technical Interchange Meeting with the SMEX Project Office (PO) on January 13-14.
Material presented at these meetings are collected in the document BRI-SMEX-001 on file at
BRI.
From then until the next Science Team Meeting on February 9-10, a considerable effort was
devoted to finalizing the design of the instrument, defining the mission and reviewing the
requirements that it imposed on the mission (and spacecraft). This culminated with the Mission
Requirements Review on February 11 at GSFC with the SMEX PO. A draft of the Mission
Requirement Document (MRD) was reviewed at that meeting. Material presented at these two
meetings are collected in the document BRI-SMEX-002 on file at BRI.
1

SMEX/POEMS - Phase I Final Report
The month of March was spent doing instrument simulations and calculating radiation levels
for the proposed orbit. In addition, the double Mass Spectrometer (MS) design was replaced by a
single MS mainly for weight considerations. This work culminated with a Science Team Meeting
on March 22-23 and a Mission Concepts Review with the PO on March 21. Material presented at
these meetings are collected in the document BRI-SMEX-003 on file at BRI.
The Mission Requirements Document for POEMS was signed on April 20, 1994 by Bartol
and the Project Office.
The month of May was devoted to the study of a possible combined mission for POEMS and
TRACE. The mission was to be called TRAPEM and was extensively discussed at a Science
Team Meeting on May 2-3 and at a Requirements Review with the PO on May 4. Material
presented at these meetings are collected in the document BRI-SMEX-004 on file at BRI.
The combined mission was abandoned shortly thereafter and both POEMS and TRACE teams
returned to their separate concepts. The team is now busily working on Phase IIIflV schedule and
is developing a cost estimate. These were reviewed at a Team Meeting in Kiei, Germany on June
20-22. GEANT simulations of the EES detector were also presented. Material presented at this
meeting are collected in the document BRI-SMEX-005 on file at BRI.
A Mission Implementation Plan Review was held at the University of Chicago on July 21. At
that meeting, the team presented its hardware implementation plan, its fabrication and test
schedule, its data processing plan and its cost estimates with a spending profile. Material
presented at this meeting are collected in the document BRI-SMEX-006 on file at BRI.
A preliminary Payload Assurance Implementation Plan (PAIP) was also delivered to the PO in
this time frame.
On August 5, the POEMS team and the project team from GSFC had a combined Mission
Implementation Review by the GSFC Engineering Directorate. Viewgraphs presented at that
meeting are on file at BRI.
On August 24, the POEMS PI and the Project Director for SMEX presented the
SMEX/POEMS mission to the Astrophysics and Space Physics directors of the Office of Space
Science at NASA Headquarters. Viewgraphs presented at that meeting are on file at BRI.
On September 1, the POEMS PI gave the final presentation to the Associate Administrator for
the Office of Space Science at NASA Headquarters. A copy of the viewgraphs presented are
included here in Appendix E.
Later that month, the announcement was made that POEMS had not been chosen and that
Phase II of the contract would not be exercised.
The remaining time in the contract was used to close out the subcontracts with our
collaborators and to write this final report.
The final reports from the four US institutions under subcontract to Bartol are included here
as appendices A to D. A good description of the instrument and of the mission planned for it as
well as the proposed schedule and data analysis plans can be found in those reports.
January 31, 1994
2

SMEX/POEMS - Phase I Final Report
DISTRIBUTION:
Catherine Cavey
SMEX/POEMS Contracting Officer
NASA/GSFC Code 287
Greenbelt, MD 20771
(1 copy)
Roberto Aleman
SMEX/POEMS Technical Representative
NASA/GSFC Code 740.4
Greenbelt, MD 20771
(4 copies)
Publications and Graphics Services
NASA/GSFC Code 253.1
Greenbelt, MD 20771
(1 copy)
Center for AeroSpace Information
Attn.: Accessioning Department
800 Elkridge Landing Road
Linthicum Heights, MD 21090-2934
(2 copies)
3

Appendix A
Final Report from the
Louisiana State University

POsitron Electron Magnet Spectrometer(POEMS)
A Small Explorer Mission (SMEX)
Final Report
for Subcontract 26053-EX to NASA Contract NAS5-38098
Submitted to
Bartol Research Institute
University of Delaware
by
John P. Wefel and T. Gregory Guzik
Department of Physics and Astronomy
Louisiana State University
Baton Rouge, LA 70803-4001
30 November 1994

Summary
This report covers the activities of Louisiana State University under subcontract
26053-EX between LSU and the Bartol Research Institute (Bartol), which began 1 January1994. The purpose of this subcontract was for LSU to participate in and support Bartol inthe work to define the SMEX/POEMS spaceflight mission under NASA Contract NAS5-38098 between NASA and Bartol. LSU's role(s) in this Phase-I definition effort was theevaluation of the radiation environment, orbit/altitude determination, count rate and data rate
evaluation, "signal to noise" studies for the magnet spectrometer (MS) subsystem, anddevelopment of the data processing and analysis component for the SMEX/POEMSMission, should it have been selected for flight.
The conclusions of this study were that for a 1998 launch into a 600 km altitude,
98 °, approximately sun synchronous orbit, (a) the total radiation dose would be typically afew k-rad per year, certainly < 20 k-rad per year for the anticipated shielding and potentialsolar flare environment, (b) detector counting rates would be dominated by the SouthAtlantic Anomaly (SAA) and the horns of the Van Allen belts, (c) the galactic electron and
positron "signal" can be extracted from the albedo background and the trapped populationsby detailed evaluation of the geomagnetic transmission function (cut-off) for each event, (d)POEMS could make significant contributions to magnetospheric science if sufficient down-link capacity were provided and (e) a fully functioning, cost efficient, data processing andanalysis facility design was developed for the mission. Overall, POEMS was found to be a
relatively simple experiment to manifest, operate and analyze and had potential forfundamental new discoveries in cosmic, heliospheric, solar and magnetospheric science.
ii

TABLE OFCONTENTS
I. Introduction.................................................................................................................1
II.
III.
IV.
ThePOEMSPackagefor aSMEX Mission................................................................ 2
A°
B.Science Objectives ........................................................................................... 2Instrumentation and Mission Concept. ............................................................. 3
The Orbit and the Radiation Environment. .................................................................. 5
A°
B.C.D.E.
Galactic Cosmic Rays and Geomagnetic Transmission .................................. 5Solar Energetic Particles. ................................................................................. 10Trapped Particle Populations ........................................................................... 10Orbit Selection ................................................................................................. 14
Radiation Specification. ................................................................................... 18
Data Rates and Telemetry ............................................................................................ 18
V. Heliospheric Modulation. ............................................................................................ 28
VI. Data Processing Plan ................................................................................................... 28
A°
B.C.D.E.
Standards. ....................................................................................................... 32
Data Processing Levels. .................................................................................. 33Data Distribution ............................................................................................. 36
Hardware Requirements .................................................................................. 41Implementation Timeline ................................................................................. 41
iii

POEMS/SMEX
I. INTRODUCTION
The POsitron Electron Magnet Spectrometer (POEMS) Investigation was submittedin response to NASA AO OSSA 2-92 and was selected as a candidate mission for thesecond round of the Small Explorer Program Missions. NASA initiated a Phase Iinstrument and mission definition contract, NAS5-38098, with the Bartol ResearchInstitute (Bartol), University of Delaware, the lead institution for the investigation. Bartolawarded a subcontract (26053-EX) to Louisiana State University (LSU) to assist in themission definition studies, working with the POEMS team and the SMEX office at GSFC.
POEMS is a joint US-European effort. The team consists of."
Bartol Research Institute, USA (Lead Institution)
University of Kiel, Germany (Lead European Institution)
CEA, Service d'Astrophysique, Saclay, France
Goddard Space Flight Center, USA
Louisiana State University, USA
University of Arizona, USA
University of Chicago, USA
University of Turku, Finland
Different institutions provide portions of the overall hardware, software and analysisneeded for the success of the project. LSU's role is principally in the development of thedata processing system, handling/distribution of the flight data and submission of the finaldata and science products to the NASA archive. All institutions participate in the scienceanalysis and publication of the results.
In the initial selection, NASA picked four potential SMEX Missions, JUNO,POEMS, TRACE and WIRE, all to undergo a Phase I definition study. Based upon theproposal, the cost, the mission plan and the GSFC/SMEX office assessment which wereall submitted to GSFC, NASA Headquarters selected two of the four - - TRACE andWIRE - - to move ahead to launch and data acquisition. Thus, this document represents thefinal report on the LSU effort for the POEMS Phase I definition.
The LSU subcontract required the following deliverables to be provided:
°
2.
3.
4.
5.
6.
REVIEWS AND PLANS
Technical Interchange Meeting Input
Input to Mission Requirements Review
Input to Mission Concept Review
Input to Systems Requirements Review
Input to Mission Implementation Plan Review
Input to Instrument/Spacecraft ICD

.
8.
.
I0.
11.
12.
13.
14.
15.
Input to Mission Requirements Document
Input to Implementation Plan
REPORTS
a) Monthly Progress Reports
b) Quarterly Progress Reports
Final Report Phase I Definition Study
a) Monthly Financial Reports (533M)
b) Final Financial Report
TECHNICAL DOCUMENTATION
Input to Performance Assurance Implementation Plan
Preliminary Phase m-IV Proposal
Final Phase m-IV Proposal
Input to Presentation to the Associate Administrator
as well as input to the POEMS team meetings. With this.report and the final financialreport to follow, LSU has met the deliverable requirements of the project.
II. THE POEMS PACKAGE FOR A SMEX MISSION
The POEMS Investigation for a Small Explorer Mission (SMEX) was designed tomake detailed measurements of anti-electrons (positrons) whose relative abundance is
largely unknown. In addition, the total electron (e ÷ plus e-) spectra would be determinedfrom below 1 MeV to beyond 10 GeV in energy.
The Small Explorer Program (SMEX) provides an opportunity for space flight of
small, lightweight experiments for missions in near-Earth orbit lasting typically one year(with possible continuation for a subsequent period). The SMEX/POEMS project is apayload consisting of two instruments: the Magnet spectrometer (MS) and the EnergyExtension Subsystem (EES). Together these instruments will provide a cohesive set ofresults to address the science objectives of the mission.
A. SCIENCE OBJECTIVES
Precise measurements of the cosmic positron-electron ratio, as a function of energy
and time, are required to conquer one of the "final frontiers" in cosmic ray research.Although the total positron plus electron spectrum is relatively well measured, the ratio ofpositrons to electrons is not well determined either from measurements or from theoreticalarguments concerning the expected ratio in cosmic rays in interstellar space. The timevariations and energy dependence of this ratio hold the key to answering many basicquestions concerning the origin, acceleration, and interstellar propagation of galactic cosmicrays, the interaction of the cosmic rays with the solar wind in the heliosphere (solarmodulation), and the acceleration of energetic particles in solar flares, in the solar wind,and at the outer boundaries of the heliosphere.
2

Particleastrophysicsresearchwascitedasimportantfor understandingviolenteventsin thegalaxyby theAstronomySurveyCommittee("Field Report"). Positron-electronmeasurementsspecificallywererecommendedby theNASA CosmicRayProgramWorkingGroupin 1982andreaffirmedin its 1985update"TheParticleAstrophysicsProgramfor 1985-1995".POEMSwouldbeamajorsteptowardsachievingthescientificgoalsoutlinedby thesescientificadvisorygroups.
ThePOEMSscienceobjectivesin theCosmic,Heliospheric,Solar,andMagnetosphericdisciplinesaresummarizedbelow.
• Primary Positrons. Determine the degree to which primary sources ofpositrons contribute to the Galactic Cosmic Radiation.
• Cosmic Secondary Positrons. Utilize secondary positrons to trace thepropagation history of the Galactic Cosmic Radiation.
• Charge Sign Dependent Modulation. Measure the charge sign dependenceof heliospheric modulation using particles of the same mass and velocity.
Solar Modulation of Energetic Particles. Monitor and separate those
components of solar heliospheric modulation that depend only on rigidity andvelocity.
• Solar Flare Positrons. Investigate the positron fraction among solar energeticparticles emitted from different types of flares.
• Solar Energetic Neutral Radiation. Relate high energy gamma-rayproduction in solar flares to electron and positron production.
• Magnetospheric Acceleration. Investigate time variations and energyspectra of electron burst events and of trapped electrons.
• Trapped Heavy Ions. Monitor the spatial and temporal structure of the highenergy trapped helium.
In addition, to these objectives achievable with POEMS alone, there is much additional
science that can be accomplished by combining POEMS data with other spacecraft results.
For example, the propagation of particles in the interplanetary medium can be investigatedwith data from well separated spacecraft, possibly POEMS combined with SOHO, WIND,
ULYSSES and maybe GALILEO, depending upon which are operational during thePOEMS flight period. In like manner, solar particle acceleration and propagation can alsobe investigated. If the ISTP/GGS spacecraft are operational, POEMS can provide data thatcomplements these missions as well.
B. INSTRUMENTATION AND MISSION CONCEPT
The two instruments, MS and EES, for the POEMS payload each measure theelectron component over different energy ranges. A schematic representation of the twoinstruments and associated electronics boxes mounted on the spacecraft (S/C) is shown in
Figure 1. Both sensors view the zenith with opening cones of half-angle 20 ° (MS) and 40 °fEES). The MS contains a permanent magnet that will be used to deflect the oppositelycharged electrons (e-) and positrons (e+). Coupled with a silicon strip detector hodoscopeto measure the particle trajectory, a conical gas Cherenkov counter to indicate velocity and a
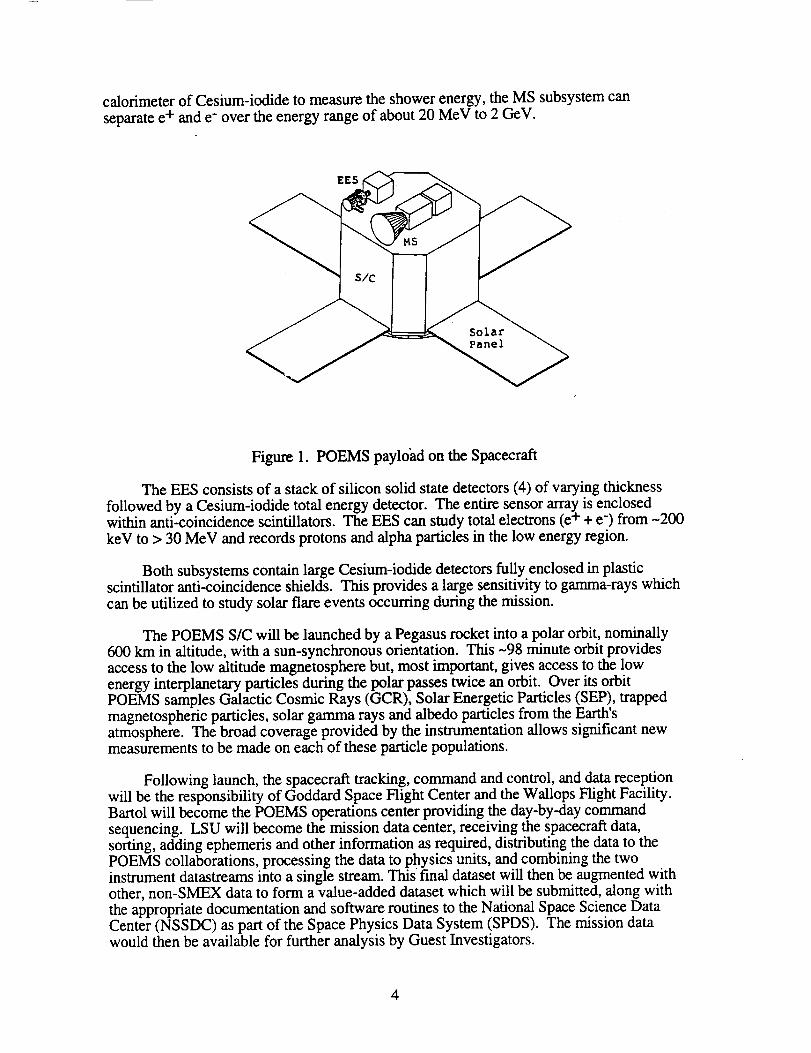
calorimeterof Cesium-iodideto measuretheshowerenergy,theMS subsystemcanseparatee+ ande-overtheenergyrangeof about20MeV to 2 GeV.
A
Figure 1. POEMS payload on the Spacecraft
The EES consists of a stack of silicon solid state detectors (4) of varying thickness
followed by a Cesium-iodide total energy detector. The entire sensor array is enclosedwithin anti-coincidence scintillators. The EES can study total electrons (e + + e-) from -200
keV to > 30 MeV and records protons and alpha particles in the low energy region.
Both subsystems contain large Cesium-iodide detectors fully enclosed in plasticscintillator anti-coincidence shields. This provides a large sensitivity to gamma-rays whichcan be utilized to study solar flare events occurring during the mission.
The POEMS S/C will be launched by a Pegasus rocket into a polar orbit, nominally600 km in altitude, with a sun-synchronous orientation. This -98 minute orbit provides
access to the low altitude magnetosphere but, most important, gives access to the lowenergy interplanetary particles during the polar passes twice an orbit. Over its orbitPOEMS samples Galactic Cosmic Rays (GCR), Solar Energetic Particles (SEP), trappedmagnetospheric particles, solar gamma rays and albedo particles from the Earth'satmosphere. The broad coverage provided by the instrumentation allows significant newmeasurements to be made on each of these particle populations.
Following launch, the spacecraft tracking, command and control, and data receptionwill be the responsibility of Goddard Space Flight Center and the Wallops Flight Facility.Bartol will become the POEMS operations center providing the day-by-day commandsequencing. LSU will become the mission data center, receiving the spacecraft data,sorting, adding ephemeris and other information as required, distributing the data to thePOEMS collaborations, processing the data to physics units, and combining the twoinstrument datastreams into a single stream. This final dataset will then be augmented withother, non-SMEX data to form a value-added dataset which will be submitted, along with
the appropriate documentation and software routines to the National Space Science DataCenter (NSSDC) as part of the Space Physics Data System (SPDS). The mission datawould then be available for further analysis by Guest Investigators.
4

III. THE ORBIT AND THE RADIATIONENVIRONMENT
As partof its supportof theSMEX/POEMSmission,LSUundertooka taskdesignedto studytheradiationenvironment,theorbitalparameters,theexpectedcountingrates(galacticcosmicrays,solarenergeticparticles,trappedradiation),theorbit/altitudeknowledgerequiredandthebackgroundsto beexpectedin boththeMS andtheEESinstrumentsof thepayload.
A. GALACTIC COSMICRAYSAND GEOMAGNETICTRANSMISSION
For the galactic cosmic rays (GCR), local interstellar spectra were obtained andincorporated as input into the SOLMOD solar modulation computer program. Using ourprevious work on solar cycle predictions, the spectrum for 1998 was calculated at the orbitof Earth. A geomagnetic transmission function was developed and applied to calculate theexpected intensities at the spacecraft orbit. Evaluations were made for circular polar orbits
of varying altitude. Figure 2 shows the GCR proton and helium spectra in interplanetaryspace (dashed) and at orbits ranging from 400-700 km in altitude. There is little differencefor these components between the different altitude orbits.
Figure 3 shows the electron spectrum in interstellar space outside the heliosphere(LIS, long dash), in interplanetary space for 1998 (short dash) and in low altitude polarorbit (solid). There is a large reduction in intensity in penetrating the heliosphere, and thenthe Earth's magnetosphere. Note also the small bumps in the electron spectrum at lowenergy. These are an artifact of the transmission function calculations.
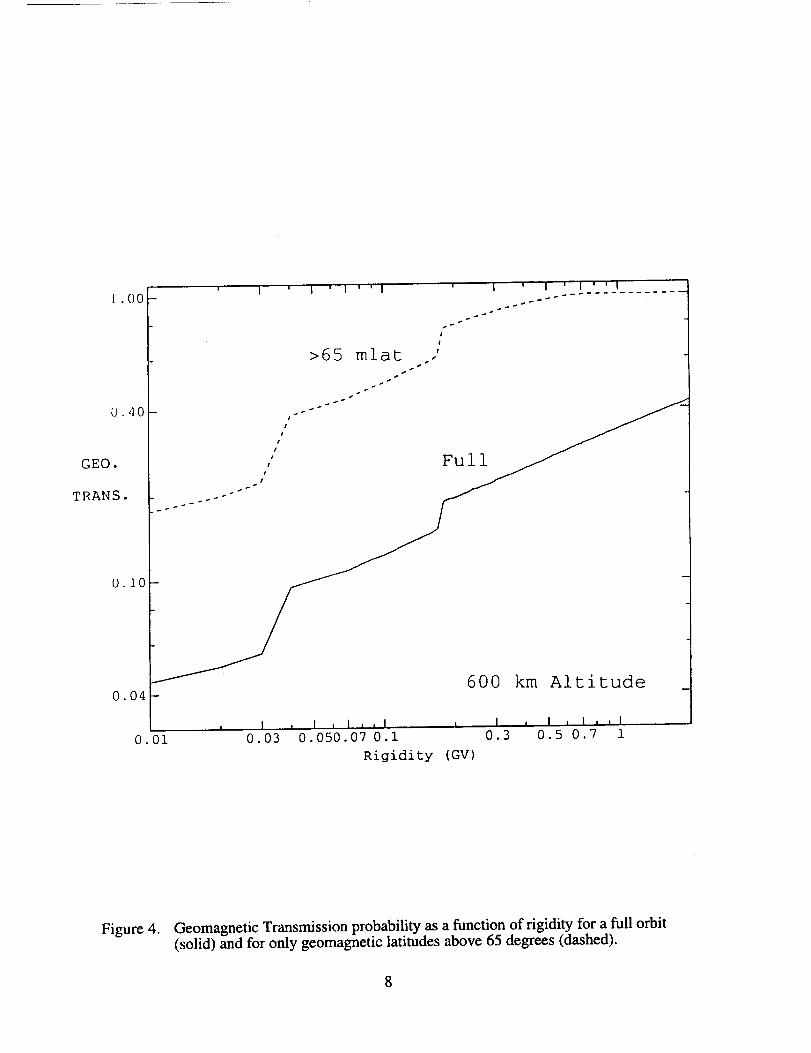
Predicting the spectrum to be observed on the SMEX Mission depends on theaccuracy of the geomagnetic field transmission function employed. Figure 4 shows thetransmission function both for the full orbit (solid curve) and for only magnetic latitudesgreater than 65 degrees (dashed curve). This is based upon the CREME model which uses
a calculated worldwide grid of geomagnetic cut-off values to interpolate for positions in aspecific orbit. The two discontinuities in Figure 4 (c. f. Figure 3) had to be analyzed sincethey affect the low energy electrons which are the focus of POEMS.
These discontinuities prompted a review of the geomagnetic transmission question.The transmission was studied in the St6rmer approximation, as a function of zenith andazimuth angles and as a function of latitude and longitude. This provided a fullerunderstanding of the particle penetration process, and resolved the issue of the glitches in
Figure 4. Basically, the grid interpolation scheme in CREME was ineffective at highmagnetic latitudes (low rigidities) and had to be modified. When this was accomplished,the discontinuities in Figures 3 and 4 were eliminated. What this effort did indicate,
however, is that detailed trajectory tracing in accurate models of the Earth's magnetic fieldwill be needed to fully analyze the POEMS data.
With the anticipated 1998 cosmic ray intensity and the corrected geomagnetictransmission function, we can predict the event rate for galactic positrons and electrons inPOEMS. A sample calculation for one 27 day solar rotation period is shown in Figure 5,which assumes only a secondary positron contribution to the ratio. The uncertainties reflect
purely the event statistics and demonstrate that POEMS, with one full year of data, will beable to resolve the discrepancy in the previous balloon results.
5

GCR
1.00
0.50
0.10
0.05
0.01
1
H Spectra - 400,500,600,700km Orbits
' I I I I ' I ' '
, I , m I _ I , J J , I , ,
1 102 103
Kinetic Energy (MeV/nucleon)
04
GCR
1.000
0.500
P
a
r
t
I0.i00
m
* 0.050
2
S
S
[
0.010M
e
V 0.005
He Spectra - 400,500,600,700km Orbits
I ' ' I 1 ' ' 1
0.001 i I J , I , I , , I ,, I _
I01 102 103 104
Kinetic Energy (MeV/nucleon)
Figure 2. Calculated energy spectra in 1998 for cosmic ray H and He in interplanetaryspace (dashed) and in polar orbits of 400-700 km altitude (solid).
6

10 3
10 2
P
a 101r
t
/ I0 0
-iml0
2 10-2
S
s 10-3
r
MIO -4
e
V
10-5
-6i0
10 -7
i0
' I ' ' i ' i ' ' i ' I ' ' i ' i
Electron Spectra
, I , ,I t I , , i , i l ,I , I ,
10 2 10 3 10 4
Kinetic Energy (MeV)
!
10
Figure 3. The electron spectrum outside the heliosphere in Local Interstellar Space (LIS,long dash), at the orbit of Earth in interplanetary space in 1998 (short dash) andin a low altitude polar orbit (solid curve).
] .00
0.40
GEO.
TRANS.
0.10
0.04
0.01
' I ' I ' I ' ' I ' I ' I ' I ' ' I
>65 mlat.....'
600 km Altitude
I , I , I ,,I .0.03 0.050.07 0.i
Rigidity (GV)
I , I i I , ,I0.3 0.5 0.7 1
Figure 4. Geomagnetic Transmission probability as a function of rigidity for a full orbit(solid) and for only geomagnetic latitudes above 65 degrees (dashed).

.5
.2I
0.1
0.05
+-,.
0.02
0.01
---0- -
0 kIuellol and Tang '87
Golden et ¢L '85
- _7 Bufflnglon et _. '75
• Daugherfy el aL '750 Fanselow et _. '69
Agrinier et e]. '69
- • Secondary Positron Ratio
I I I I 11111 I [ I I I lllI I I
0.1 1
Energy (GeV)
)---
I I I lllJ
10I I
Im
m
w
1
5O
Figure 5. A sample POEMS (MS) positron-electron ratio plot as a function of energy for
one 27-day period assuming purely secondary positrons.

B. SOLARENERGETICPARTICLES
For solarenergeticparticle(SEP)emissions,flares from the CRRES mission during1990/91 were used as examples. The ONR-604 experiment on CRRES observed, and fullycharacterized, 13 medium to large flares. (Another set of 13 small flares were studied as flareaverages.) These were used to predict "typical" effects at the nominal orbit. For example,Figure 6 shows the energy spectra for two flares, event #5 (25 March 1991) and event #6 (13May 1991), which differ in intensity by about an order of magnitude. Shown are the H, Heand Fe spectra in interplanetary space (dashed curves) and in a 600 km altitude polar orbit.Note that, as with the GCR, there is little difference between orbits at altitudes of 400-800
km. The two flares show different spectral indices with event #5 being considerably softerthan event #6.
The spectrum as well as the intensity contributes to the radiation effects that can be
produced by the flares. Figure 7 shows the Linear Energy Transfer (LET) spectra for thesame two flares for a range of shielding thicknesses from 0 to 1 g/cm 2 of Aluminum. The
dashed curves are for the interplanetary spectra while the solid are for the spectra at 600 kmaltitude. The larger flare, event #5, falls off faster in the important high-LET region, butcontributes more at low-LET. The conclusion is that material shielding is considerably more
effective than geomagnetic shielding in reducing the radiation effects from solar flares.
This is illustrated in Figure 8 which shows a calculation of the dose delivered to one
of the silicon strip detectors by SEP #5 as a function of shielding thickness. For anunprotected detector, the dose is quite large, but even for very minimal material shielding the
detector (e.g. 0.1 g/cm 2) the dose is reduced below one k-rad.
C. TRAPPED PARTICLE POPULATIONS
For the trapped particle components (protons and electrons), the calculations ofStassinopoulas and Barth (1989) were employed. These authors tabulated spectra and dosefor a variety of conditions, calculational modes and orbits. The radiation effects are due tothree sources, trapped electrons (51%), bremsstrahlung (< 1%) and trapped protons (49%).The numbers in parenthesis give the fraction of the dose contributed by each source for a 600km orbit and 1 g/cm 2 of shielding. For lesser shielding, the electrons become moreimportant and the total dose increases.
For a polar orbit under solar minimum conditions (no solar flares) and using a shield
thickness of 1 g/cm 2, the total dose expected, as a function of altitude is given in Table 1.
Table 1. Trapped Particle Dose
ALTITUDE TOTAL DOSE
(km) (krad/yr)
200 0.094300 0.142400 0.222
500 0.345600 0.532800 1.127
1200 4.060
10

lo8t106F...
104
102
i0 o
10 -2
-410
10-6
10-8
i0-i0
10-12
I ' ' I ' I ' ' 1 ' I
SEP#5 I
J I , , I , I , , I , I , i
I01 102 103 104
Kinetic Energy (MeV/nucleon)
' I I
108
I ' ' I I
SEP#6106P
a
r 104 "'''"
t
.m/ 100102_'_'''''-- """"--.. H
2 10-2
S
s i0-4
r
M 10-6
eV
io-8 F
I0-i0_
10-12
I01
, I , i I , 1 , , 1 J I , ,
102 103 104
Kinetic EnergY (MeV/nucleon)
Figure 6. Flare energy spectra for the species (from top) H, He and Fe for CRRES events#5 and #6. The dashed curves show interplanetary spectra while the solidcurves show the spectra in a 600 km polar orbit.
11

108 ,
i06_
P
a
r 10 2t
/ i0 0
m -2, i0
2 10- 4
s
S 10 -6
r
-8i0
i0-i0
10-12
0.05
i081 ,
i06 F
10 4P
a
r 10 2t
/ 10 0
m -2• i0
2 10_ 4
S
s 10 -6
r
10-8
i0-i0
10-12
0.05
I ' I I
SEP#5
0.I 0.5 i 5 I0 50 i00
Integral LET (MeV/(mg/cm**2J)
! I ' I
SEP#6
0.i 0.5 1 5 I0 50 100
Integral LET (MeV/(mg/cm**2})
Figure 7. LET spectra for the flares of Figure 6. Dashed curves use interplanetary energyspectra while solid curves use spectra in a 600 km polar orbit. The different
pairs correspond to a range of Aluminum shield thicknesses from 0 - 1 g/cm 2.
12

50.00I I I I I I I I I
i0.00
5.000
SEP#05
D0S I .000 i
E 5000.
KRa
d0.100
s
0.050
0.010
0.005
0.0010
600km Orbit
I I I I I I II00 200 300 400 500 600 700 800 900
A1 Shield Thickness (mg/cm*'2)
i000
Figure 8. Calculated dose (k-rad) to one of the silicon strip detector hodoscope layersfrom SEP event #5 as a function of the Aluminum shielding thickness
protecting the detector.
13

Thealtitudedependencecomesfrom theorbit interceptingmoreintenseregionsof theSouthAtlanticAnomalyand,moreof thehigh latitude'horns'of theVanAllen beltsasthealtitudeincreases.Thisdependenceis illustratedgraphicallyin Figure9, fromStassinpoulasandBarth(1989),where5 yeardosesareshownfor bothsolarmaximumandsolarminimumconditions.
D. ORBIT SELECTION
For the POEMS investigation, a polar orbit is required to gain access to the low
energy interplanetary particles. An approximately sun-synchronous orbit is desired for
power production and for solar viewing to meet the solar physics objectives. For the massof the POEMS spacecraft, the Pegasus launch vehicle should be able to achieve an altitudeof 800-1000 kin.
The orbital trade-off, then, is between orbital lifetime (the higher the better) and
radiation, both total dose and instrumental counting rates which will be high in the regionof the SAA and the Van Allen belt horns. Keeping the trapped particle dose below 1 k-
rad/year limits the acceptable orbits to below altitudes of 800 kin.
Operationally, it is necessary to specify the orbital constraints in terms of theviewing conditions for the prime dataset to be obtained. This prime data is electrons above-20 MeV, and it is necessary that POEMS spend sufficient time at geomagnetic cut-offvalues less than 20 MV in order to record a statistically meaningful sample of events for
analysis. The difficulty is that there is not a one-to-one correspondence betweengeomagnetic cut-off and magnetic latitude as illustrated in Figure 10 where the width of theband shows the level of ambiguity. Figure 11 shows the calculated cut-offs on a worldgrid in magnetic latitude versus longitude. Plotted are the portions of the orbit sampled inthe calculations performed. The curves correspond to cut-off rigidities of 20 MV, 200 MV,2 GV and 6 GV to illustrate the dependence. Note that for the lowest rigidity, a magnetic
latitude of 78 ° approximately covers the curve. Thus, the orbit can be specified in terms ofthe amount of time spent about 78 ° magnetic latitude. For the nominal one-year mission,
this time should be > 22 days.
This time specification, along with the decision to target 600 km as the preferredaltitude, allowed the project office to calculate the effects of various orbital inclinations andthe Pegasus "spread" in orbital insertion possibilities. A sample of such calculations isshown in Figure 12 for the nominal conditions. A full set of calculations of the time spentwithin a range of geomagnetic latitudes from the poles, for 12 °, 13 °, 14°, 15 °, and 16 °, as afunction of orbit inclination, were performed. Note that accumulation time begins at launch
plus 30 days, i.e. 12 months from launch means a science data collection period of 11months. With these specifications, the conclusion was that there would be no problemwith the Pegasus vehicle meeting the POEMS science requirements.
14

X X
i l I l
E E E E0 t..} 0 t_
• 0 m 1"3
t_
.__ _-_
L
_,..g
m N
0 0 0.-l-- + .@
W 1110 0 00 0 0
M
m
I
(s.z_.." $ ._oj "IV-spell) _so(j l_;O.L
15

lOO
8O
I
M
a
gne
i
C
La
ti
U
d
e
60
40
20
0
-20
-40
Figure I0. The dependence of the vertical cut-offrigidity on magnetic latitude.
I00
8O
60
40
20
0
-2O
Magnetic Coord for Rc=.02, .2,2,6 GV
i i [ I I I i I I I i I i I i I I
R
-40
-60 -
.._ ..-
-80 - "
I I I-1000 20 40 60
• ° o . ° ° . . . . ..,.
I I I, I I I I I I I I I I I80 100 120 140 160 180 200 220 240 260 280 300 320 340 360
Magnetic Longitude
Figure 11. World map in magnetic coordinates showing limits for cut-off rigidities of 20MV (top and bottom), 200 MV, 2 GV and 6 GV.
16

Z
z
QILl
. i l i i
|I w | I • I • I tk | • I I I • 4 I • II I _ I | I | • I I I g, , , , , , , ° 0 , , °I I I I • I p _ I • I •
X ' I I !
l I o • • 1 I • lJ• I | b • • I l I I• l I • I • l I I I o •• I i I I • | lI • • |
I I 1 i I k • | I | |i ! I • D I P • t • l i¢ _ I I _ • • i | J i '
miiDl ii_ 1.111IOi iIll_ @i m_l,_I, i,i ill w,.1_, b_ i i! _1 -p-.li ! iiwv.._i Ielm ii *_ J• I • I | • •'_ k-_l . . . t l . .' ". .' ,'
.... . , ....I • • • i • I o e i i •I I • • | • I i • • I •
I I • ii | e I i | •
..... , . . .g p • I • • • I II • g •i i • I p ii • i e I t I l i •
I • • • I • I d q
I"___L_6,.,\!\ ...... . , ,; I I ; I ' ' ' "p I i J I | •
• I • l • i_ I I • a 4 I • • !
b k I I l l . _p I P • •, I I t I I •I l I s •i
i RNN' \' ' ' i• I i i I [ I • e •I • I • I 4 I I
I • _1_ _. l_ _ _l I i I • • l I
• e I I I I • i I a, :' .: !",.'!..\,\N .... . . .i • • • p l • • • l II l • l • • • i _i I• I • I p • I I i •
! I • ! I i _ _ • •[ ! i\\N\N ...., . , , , ,, ,, , , . ,l. . , . __.,__, . , . ,
• I • I I I • q I _ •4 i I I • i i II i I i • I _ _ I I,, , ., ..i i i I • • }
e _i • I _ ' I • I IiI • I d I I •
• • l I I I
.... , . , .I 1 I • • I I l I II I • t q • • o dl I
I t I • I • •i i !\N\ ' : : "I I k I I II I I l I I II I I I I I • I I II • I I I • I I I II I I _ I I I I I Ii ! i N\
I I ; I ;. I "_ ' ' ' 'i : i = [ I l
- ' ; : ; : ; : : " \N\.% | i....• • _ I I I ! •
I I t . I I •• i I in i _ • ql• I I I I I ! •I I I I I i I II I • I I I I It • • I i • • I I
I I I l I I II I | I I 1 I
I I I I I I _ I iI I ! I I _ • I• • 4 • 41 I
' ' : : ' ' ' ' i ! N\N\ '_I • t _ | • I I
..........l I I 1 i 1 • l t I 4I I e I I I i • l • II I • I I I I I I • II _ I • dl I I I I l
I • • l I • I__ Ill
1 • I _ • 4 I 1, . II l _ l I : Nl I l II I I I I l • II I • • I I I I
• _ I I I I I I • • 4 I
• | I I I I i • I • l II _ • I • I i I I I i
I I _ I l I _ I I I I I
I I ! • I • I i I • I I
• I I i I p I b Ii e e I
I _ I _ I I I • • I I II p U i ,i I I ii_ • i 4• • i I I I I i I I | I
• • Ii_ • w e 11 e • II • i • i • i i I I • |i • • • I • i I • l I II • • . _ I I a • • I dp I I I • I • I I I I I
I i l e i I • _, • I_ i •• i l e • ! i I • • p• i • I • l l i • I l i• ip t • l e t I I i I I
a . - I I l lUll a
II FI II
D,D.I
_, !11_JJ
n I'/_ ll_,
:u,i!_->- _i_ .iC .(i
_Vlml
J
J I 1 II
J "_ l"-_ I
i.
b I I II,,J ,,,.J,.,xi
I _UUIEZ;[I
[
,, ,- (_1lq.I
[
Y_.
17

E. RADIATION SPECIFICATION
For the600km orbit weexpecta doseof about0.5k-rad/yearfrom only thetrappedparticlepopulations(assuming1g/cm2shielding).This will beaugmentedbyGCRandsolarenergeticparticleevents.This level is, however,low enoughsothatnospecialradiationhardnessspecificationneedstobeappliedto thepartsusedin thePOEMSinstrumentsor thespacecraft.Minimal shieldingwill be required for any componentssensitive at the 20 k-rad level. This level should not be exceeded, except if there is a very
large solar flare - - probability is less than 10%. For guidance, Figure 13 (fromStassinopoulas and Barth, 1989) can be used as the radiation specification focusing uponthe 800 km, solar minimum curve. For particle problems or sensitivities, special analysis
will be necessary. No planned POEMS parts appear to require such analysis.
IV. DATA RATES AND TELEMETRY
The POEMS data will be dominated by the trapped components, including return
albedo particles. Since the EES records events down to -200 keV, we expect to have toanalyze the datastream in terms of the Mcllwain coordinates, B and L. For the trappedprotons and electrons, we employ the technique of the Short Orbital Flux Integration
Program (SOFIP). The nominal orbit, along with the current IGRF magnetic field model, isused to determine B, L values. These are then input to AE6MAX (or AEI7HI) and
AP8MAC, the NSSDC trapped particle subroutines for electrons and protons respectively.
This gives an omni-directional integral flux (number/cm 2 - s) above a particle energythreshold for each step along the orbit. Figure 14 shows the spectra of the trapped electrons
and protons. The models show no electrons above -7 MeV, but this is probably an artifactof previous datasets. One of the POEMS secondary objectives is to look for high energyelectrons in the trapped population. The protons show a relatively hard spectrum, extendingwell above 100 MeV. These are observed principally in the region of the South Atlantic
Anomaly (SAA) and, for E > 100 MeV, can have a flux as large as 103/cm2-s).
The electrons are observed both in the SAA and at high latitudes in the 'horns' of
the Van Allen belts as illustrated in Figure 15 for four energy ranges > 0.1 MeV, > 0.5MeV, > 3.0 MeV and > 5.0 MeV. (The darkness of the plot is an approximate indicator of
the intensity.) For > 500 keV, the peak intensity is 105/cm2-s, while for > 5 MeV it isdown to 103/cm2-s. In the POEMS datastream, these particles will appear as spikes ofminutes duration occurring several times per orbit.
Balloon studies over the past three decades have revealed the presence of returnalbedo electrons, observed because they appear at energies below the local geomagnetic
cutoff and thus must be pseudo-trapped. This albedo component can be many times moreintense than the GCR electrons. This implies that the POEMS analysis will have to focus
on obtaining accurate geomagnetic cut-off values for each event observed.
For our evaluation of data rates, we employed balloon measurements to derive an
albedo electron energy spectrum as shown in the top part of Figure 16, compared to theGCR electron and proton spectra. It was assumed that the albedo particles exist for all
energies below the geomagnetic cut-off, as illustrated in the lower portion of Figure 16.(No return albedo protons were included.)
Putting the trapped, albedo and GCR components together, we can predict the
particle flux as a function of time around the SMEX orbit. (For this the omni-directionaltrapped flux was divided by 4x and an observational efficiency of 10% was assumed.)
18

x
,,,_ <" <_ _
O 0Q Q Q 00 _ 0 C%1
• 0 • rl
t_. l'_cIJ
r._
o
L.
e_.. r/'J r_0
N
°_
IIIIIIIIIIIIIIII
iiiiIlli
llilllllllilllllIIIIIIII
Q+
LU00
IIIIIIIIIIIIIIIIIIIIIllllillilllillillllllIIIIIIIIIIIIIIIIIIIII
_DQ+
L_C_0
IIIIIIIIIIIIIIIIIIIIIIIIIIIIIIIIIIIIIIIIIIIIIIIIIIIIIIIIIIIIIIII
L_0+
LUO0
IllllJTlI. i111IIIIP/11!/AIIIIIIIi11 III//IIIIIIIilllllJ7IHIII lllllPllll'Jfl 1111 1II!11111
_q
IIIIJ,A"IIrrlllll.!IIt 11IIIIII!i Hillirrllill--IJrllIIrI Irllllll
_ 0 I:D+ ÷ +
U.I W W
_=
._=
N
m
(s..lea_ _: .to.I "IV-Splllt) asoG IelO,L
19

10 4
p 10 3
a
r 02t 1i
c
1 101es
0I0P
e
r -ii0
cr_
* 10-2
2
-3slO
K 0- 4elV
-5I0
10 -6 , I , 1 , I , I
i0 -I i0 0 i01 10 2 10 3
Energy (MeV)
I
10 4
Figure 14. Energy Spectrum of the trapped protons and electrons as given by the models.
20

21

10 3 I I l I '
P
a
r 10 2
ti
C
1e 101
S
P
e 100r
m
2 10-1
s
r 10_2
S
Me
V 10 -3
i0 0 I01 10 2 10 3 10 4
Energy (MeV)
10 3
P 0 2a 1
r
ti 101
C
1
e 100S
10 -1
r
m 10 .2
2 10-3
S
r i0-4
S
M 10 -5
e
V
10 -6
I I
Figure 16.
I I
01_ L"['
only
10 -7 , I , I , , I , I J
10 -4 10 -3 10 -2 i0 -I I0 0 i01 10 2
Rigidity (GV)
Assumed energy spectrum of the albedo electrons compared to the GCRproton and electron spectra (top). Schematic illustration of the assumedrigidity dependence of the albedo and GCR electrons (bottom).
22

Figure 17showstheresultfor > 100keV electrons(top)and> 20MeV protons(bottom).TheGCRintensityis shownasthesolidcurvewith thetrappedparticlesastheshortdashcurve. Forprotonsthereis noalbedo,andthetrappedparticlesareclearlyobservedasthespikescorrespondingto SAA passes.Similarspikesareevidentfor theelectionsfrom boththeSAA andtheouterbelt. However,in betweenthespikestheflux is dominatedby thealbedo.TheGCRcomponentcanbeobservedonly in theshorttimeperiodsbetweenthedashedlines,i.e. nearthegeomagneticpoles. TheGCRcomponentis ata level of afewtimes10.2particles/cm2-sr-swhile thetrappedelectronspikesareat leastfive ordersofmagnitudelarger.
The situationimprovesfor higherenergiesasshownin Figure 18for > 20MeVelectronsand> 200MeV protons.Thetrappedpopulationis absentfor theelectrons,butthealbedocomponentstill dominates,exceptoverthepoles. Thetrappedprotonscanstillbeseenbut donotdominatetheoverallcountingrate.
Looking atonedaysdata,Table2 showsthetotalexpectedcountsintegratedabovethegivenenergythresholds.For thelowerenergies,thetrapped(andalbedo)componentdominates,andit will only bepossibleto identify thedifferentcomponents(andpull outtheGCRevents)by utilizing thelocationof thespacecraftatthetimeeachparticleisobserved.This is why POEMSrequiresaccurateorbit/altitudeinformation,postflight notrealtime,for thescientificanalysis.
Looking attheMS only, therewill be -105particlesperdaywhichcouldbepulseheightanalyzed.At anassumed75bytesperevent,thiscorrespondsto arawdatarateofabout11M-bytesperday. TheEESwill observeevenlargerfluxes,soit hasthepotentialto generate20+M-bytesperday. Thisposesaproblemwhich mustbesolvedby not pulseheight analyzing every event and by some on-board processing of the raw datastream.
Referring to Figures 17 and 18, if data is taken only within the regions defined as
free from albedo and trapped particles then the number of events to be extracted from theraw data stream is given in Table 3. Here the problem is extracting the electron signal fromthe much more abundant protons. Requiring that the gas Cherenkov counter show a signalcan discriminate against the protons with an efficiency of 103-104 while losing less than1% of the electrons. This will have to be the main MS coincidence mode.
For the EES, it will be impossible to pulse height analyze all of the events. Rather,histograms in energy will be accumulated every minute for different trigger conditions, andthese will be the main data. Full pulse height analysis will be performed and transmittedfor only a small sample of the events.
Overall then, including pulse height analysis, histograms, engineering andhousekeeping data, count rate data and calibration data, the POEMS experiment requires adownlink rate of 10-30 M-bytes per day. Less than this rate will require significant on-
board data compression by the spacecraft computer system.
23

]05 I I I I I I I I I
10 4
It,, ],_3In
be 10 2r
[ i01e
T
c 10 0
m
A
* 10-2
i]-2r 1
S -3I0
i0-4
10-5
Electrons > i00 keV
oI
i
iii
iii
:o!
i#!i
if
...... o
\
I I I6 36.2 16.4
J_
j"• i
0 _,I ,iI
I
\, ,/
/ ",7-V
f t I J It I iI
.6 16.8 17 17.2 17.4 17.6 17.8 18
Time in hours
u ]0.00fn
I)5.0D0e
F
pe I . 000r0.500
C
111
m
0.1002
0.050S
r
0.010
0,005
O, 001
I I I 1
Protons > 20 MeV
I I I I I
#r
/
,i
e
i
i
i
i
I I I I I I I I I9 19.2 ]9.4 ]9.6 19.8 20 20.2 20.4 20.6 20.8 21
Time in hours
Figure 17. Combined flux of all components as a function of time in a 600 km orbit forelectrons > 100 keV (top) and protons > 20 MeV (bottom). The GCR isrepresented by the solid curves; mapped particles by the short-dash curve;albedo electrons are shown as the long-dash curve.
24

105
104
03
O 2
01
0 o
i) 1
o -2
3i)
0-4
1o-5
I I I I
Electrons > 20 MeV
I I I i I
"\, ,/"" "'k "",, ,,I .,, :1
I II I
6 16.2 16.4 16.6 16.8 17 17.2 17.4 17.6 17.8 18
Time in hours
I00.0
5O. 0oi
Nu 10.00m
b 5. 000e
r
PeI . 000
r 0. 500
C
m
*0.1002
0.050
S
0.010
0.005
I I I I
Protons > 200 MeV
I I I I I
I%1%1%
I i
! L
s !t |
1j I
0.00] I I I I I I I I I19 ]9.2 19.4 19.6 19.8 20 20.2 20.4 20.6 20.8 21
Time in hours
Figure 18. Same as figure 17 except for electrons > 20 MeV (top) and protons > 200MeV (bottom).
25

TABLE 2. TOTAL ELECTRON AND PROTON COUNTS
Electron Counts
Energy Range GCR Albedo Trapped TOTAL
(MeV)
> 0.1 451 9016 5.7x10 s 5.7x10 s
293 8601 1.5xlO 5 1.6xlO 5> 5.0
> 20.0 270 7535 0 7805
> 70.0 260 5991 0 6251
> 200.0 252 4249 0 4501
> 1000.0 174 828 0 1002
Proton Counts
Energy Range GCR Albedo Trapped TOTAL
(MeV)
> 20.0 38367 0 97217 135587
> 70.0 38201 0 55752 93954
> 200.0 36912 0 14370 51283
31824 0 701 32525> 500.0
> 1000.0 23623 0 0 23623
26

TABLE 3. COUNTS DURING "PURE" GCR VIEWING CONDITIONS
Electrons
Energy Range (MeV) Live Time (Percent) GCR Counts per day
> 0.1 6.4 233
> 5.0 6.7 78
> 20.0 8.0 68
> 70.0 12.3 89
> 200.0 18.5 125
> 1000.0 33.6 131
Proton
Energy Range (MeV) Live Time (Percent)
> 20.0 91.7
> 70.0 92.9
> 200.0 94.9
> 500.0 97.6
> 1000.0 100.0
GCR Counts per day
37700
37800
36700
31700
23600
27
V. HELIOSPHERIC MODULATION
The original POEMS experiment on EOS would have been active for 10+ years,covering essentially a full 11 year solar cycle, including the reversal in polarity of the Sun'smagnetic field. It is believed that the field polarity controls the access routes of GCR into
the heliosphere, with positive particles having easier access during one polarity whilenegative particles have preferential access during the opposite polarity. This heliosphericmodulation is, however, a function of rigidity so that accurate measurements must be madeon particles of the same mass and velocity, but of opposite charge. Positrons and electronsare the only accessible particle pair that meets this requirement.
Since the SMEX mission for POEMS will be nominally of one year's duration, wehave looked at what information could be available on heliospheric modulation from thissingle (in time) sample. Assuming only secondary positrons in the interstellar flux, weunfolded the Protheroe positron to total electron ratio to produce an energy spectrum ofpositron's in local interstellar space. In addition, we prepared a total electron spectrumoutside the heliosphere.
Jokipii and co-workers in Arizona have developed a model of the heliospherictermination shock and the heliospheric modulation which contains, explicitly, the polarityof the solar magnetic field. They have used this to investigate particle access and the highsolar latitude behavior of energetic particles.
Jokipii used our local interstellar spectra as input to his model and predicted thespectra of electrons and positrons at Earth for the two signs of the solar magnetic field
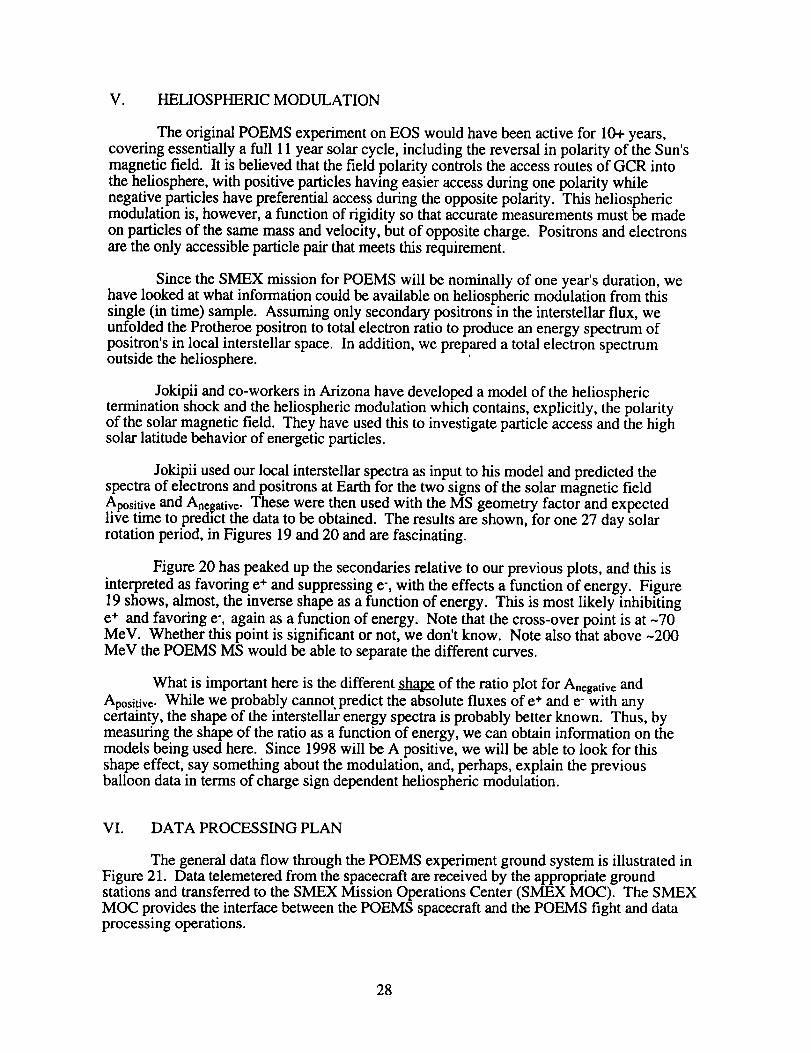
A.positive and Anegative. These were then used with the MS geometry factor and expectedhve time to predict the data to be obtained. The results are shown, for one 27 day solarrotation period, in Figures 19 and 20 and are fascinating.
Figure 20 has peaked up the secondaries relative to our previous plots, and this is
interpreted as favoring e÷ and suppressing e-, with the effects a function of energy. Figure19 shows, almost, the inverse shape as a function of energy. This is most likely inhibiting
e ÷ and favoring e-, again as a function of energy. Note that the cross-over point is at -70MeV. Whether this point is significant or not, we don't know. Note also that above -200
MeV the POEMS MS would be able to separate the different curves.
What is important here is the different _ of the ratio plot for Anegative and
Apositive. While we probably cannot predict the absolute fluxes of e ÷ and e- with anycertainty, the shape of the interstellar energy spectra is probably better known. Thus, bymeasuring the shape of the ratio as a function of energy, we can obtain information on the
models being used here. Since 1998 will be A positive, we will be able to look for thisshape effect, say something about the modulation, and, perhaps, explain the previousballoon data in terms of charge sign dependent heliospheric modulation.
VI. DATA PROCESSING PLAN
The general data flow through the POEMS experiment ground system is illustrated inFigure 21. Data telemetered from the spacecraft are received by the appropriate groundstations and transferred to the SMEX Mission Operations Center (SMEX MOC). The SMEXMOC provides the interface between the POEMS spacecraft and the POEMS fight and dataprocessing operations.
28

_- .2I
"t" 0.1
+
+
0.02
0.01
.LT
• Muellar and Tang '87
O' Golden et eL. '85
_7 Buffington et _ '75
• Daugherly eL aJ,. '750 Fanselow et e2. '6g
(_ Agrtnler el eL. '69
• Sec. Positron Ratio (Apos., 27 Day)
Energy (OeV)
50
Figure 19. Positron to total electron ratio for one 27-day solar rotation period for A positiveconditions, compared to previous balloon data.
29

.5
,-- .2I
Q_
+ o.1+
(D
_0.05
0.02
0.01
mr--r--T--rr-T__ m
• tAuellar and Tang '87
Golden et ol. '85
_7 Bufflngton et eL 75
• Daugherfy el ¢L '750 Fanselow et eJ. '69
AgHnler el eL '69
-@ Sec. Posifron Ratio (Aneg., 27 Day)
mL___LU_UJ_0.1 1 10
Energy (GeV)
r---I--l-
m
5O
Figure 20. Same as Fig. 1 except for A negative conditions.
30

POEMS Data Flow
POEMSS/C
Ground"_ Stations
I ORBITA_TI'UDE
I
_r
SMEXMOC
At
!POEMSDATA
_ri
P.OEMS Operations, Processing, Analysis
A
_D5
Payload Flight Operations (BRI)Data Processing (LSU)
EES Monitor/Analysis (KIEL)
Instrument Monitoring, Processing Updates, Science Analysis(GSFC, UA, UC, Turku, Saclay)
v
IT
J
IV
J POEMS
A
I
POEMS ScienceDatabase
IV
CollaborationData
Analysis
1"
POEMSScienceResults
_I, SPDS
Archive
Figure 21. Data flow in the POEMS/SMEX experiment ground system.
31

POEMS flight operations are centered at Bartol Research Institute (BRI) whichreceives daily quicklook data, monitors the health and operation of the experiment andforwards commands for uplink to the spacecraft. BRI is assisted in the real time monitoring
of the experiment by the University of Kiel (Kid) and the remaining POEMS collaborators, asneeded. The POEMS data processing operation is centered at Louisiana State University(LSU) which receives the daily data download, including orbit / attitude information,
processes and distributes this data, maintains an online science analysis database, andcommunicates with the SMEX MOC on issues concerning the data processing (e.g. data re-
generation requests). Processing of the POEMS Extended Energy Sensor (EES) data will beperformed in conjunction with Kiel. All POEMS collaborators will provide data processingsubroutines and calibration files and/or will be involved in the science analysis.
The raw POEMS data (Level 0) is processed to higher levels (1, 2 and 3) where ateach stage increasingly sophisticated data conversion and selection algorithms are applied. Allhigh level data are distributed to the POEMS team and analyzed to provide updates to the
processing routines and calibration files, as well as science results such as the electron andpositron energy spectra. These are combined with ancillary solar, geomagnetic andinterplanetary data in the POEMS Science Database and used during science analysis andinterpretation. Resulting data products along with the full POEMS dataset will be submitted tothe Space Physics Data System/NSSDC for archiving and public access.
B. DATA PROCESSING IMPLEMENTATION
Implementation of the POEMS ground data processing system will take placeprimarily at LSU. Elements of the processing software will draw upon routines andcalibration files developed by the POEMS collaborators for the instrument GSE. To enable
these codes and data to be easily integrated into the overall software and to provide uniformaccess to the processed data, we will adopt a set of format and documentation standards(Section 1). A multiple level processing scheme will be implemented where each level buildsupon the previous stage (Section 2). Such a scheme provides flexibility in selecting data
subsets for analysis, isolates and minimizes any necessary re-processing, and simplifies theprocessing software implementation into discrete modules. All high level processed data willbe distributed to all POEMS collaborators on a regular basis using CD/R media (Section 3).The CD/R media was chosen because it is random access, has an interoperable format, and isexpected to have a lifetime in excess of 30 years. Thus, the data distribution will double asthe POEMS internal archive. The data processing hardware is moderately sized and reflectsthe expected low data rate from the POEMS instrument (Section 4). Finally, the timeline forimplementing the ground data processing system (Section 5) provides for a phased approachwith all essential components completed by the MOR, and the system fully operational six
months prior to launch.
1. Standards
Collaborators in the POEMS experiment use a wide variety of computer platforms anddata analysis tools. Thus, instead of adopting one particular platform we intend to establish a
set of data and software standards which will enhance interoperability across thecollaboration. These standards would apply to any data or software that is to be used across
the collaboration, but internal data handling and analysis will be at the discretion of theindividual institutions.
These standards will be negotiated and established at the beginning of the Designphase and a "Standards Document" will be distributed to all institutions. These standardswill be divided into 1) Code, 2) Documentation, and 3) Data, with Data further divided into
32

3a)Flight data,3b)Detectorparameters,3c)POEMSResults,and3d)Ancillarydata. At aminimumweexpectthefollowing standardsto beadopted:
1. Sourcecodeis tobewritten in ahigh level languagesuchasFORTRANor ANSI-C.
2. Codemustbemodularizedwhereeachmoduleperformsasinglefunction.
. Code documentation must be provided which describes the routines function,
operation and interface variables.
. System specific routines must be minimized and embedded within a FORTRAN or Csubroutine.
5. Windowing operations will use standard X 11/R5 or Motif widget calls only.
. Flight data will be distributed in a standard format (TBD) such as CDF, which iswidely accepted, is fully documented and has access / manipulation software already
developed for multiple platforms.
. Detector parameters and POEMS results will be passed as formatted ASCII data frieswith associated documentation describing the file contents.
By refining, expanding and adopting such standards we expect to simplify the interfacebetween institutions and establish guidelines for developing the ground data processingsoftware.
2. Data Processing Levels
The POEMS data processing begins with generating a Level 0 dataset which is, inessence, the datastream sent by the EES and MS to the spacecraft DPU. The next stage of
processing generates Level 1 which is still "raw" data but has orbit / attitude information(obtained from the SMEX MOC) added as well as being converted to a standard format and
split into category (e.g. rate, housekeeping, events) subsets. Level 1 processing appliesthe detector calibrations, converting "channels" to "science units", and generating the Level
2 data volumes. Finally, during Level 2 processing events are selected, the particle charge,mass and energy are determined and the Level 3 data set is generated. The Level 3 data is
used in conjunction with ancillary solar, geomagnetic and interplanetary data for thePOEMS science analysis and interpretation.
The steps leading to the POEMS Level 0 data are shown in Figure 22. POEMSflight data and Attitude / Orbit information is received at LSU and logged. Auxiliaryinformation such as spacecraft / ACS housekeeping data (TBD) and spacecraft data filteringparameters are also acquired for later processing. The POEMS flight data is unpacked fromthe CCSDS encapsulation and checked for data integrity, time intervals and data gaps. Ifthese initial checks fail then a request for a re-generated data volume is sent to the SMEXMOC. The verified data is then merged with previously processed data, friling in data gaps
and assuring that the data is time ordered. This Level 0 data is archived at LSU but will bedistributed only on request.
The Level 0 data is next processed to Level 1 as shown in Figure 23. First allpackets are identified and distributed to individual data files according to category (i.e. MSevents, EES housekeeping, MS calibration, etc.). These file are read by a Data Formatter
which 1) decompresses the compact Level 0 format, 2) merges EES, MS and SIC
33

SMEX MOC
Regen.Request
&
AI
I
I
I
I.
i
i
I_ u,_p_:kccsDs, "1 I_,°_,_._o-II gen. Request I
I Time interval / Rap check, !
L Integrityc_eck J _
I
Sequence /
Merge )I
V
_| Level |_
Figure 22. Production of Level-O datal
34

T
_ Orbit [Model
Mag IField
Model
r, _r _r
Data Formatter
Calib
MSEvents
@ Decompress rates, HK, PHA, EES, etc.
Data Stream Splitter
@ Calculate & add UT, _, 2., r, B, L
@ Calculate & add pointing & velocity vector
@ Convert counts to rates (?)
_ Format Records
Figure 23. Level-0 processing of the POEMS data to form the Level- 1 datasets.
35

housekeeping information, 3) converts counts to counts per second, 4) converts the internalclock time to UT, 5) uses the attitude / orbit data along with an orbit and magnetic field model
to interpolate and add the spacecraft position, magnetic field B and L coordinates and pointingvector to each event and rate record, 6) adds auxiliary flags or data such as the spacecraft
filtering parameters, and 7) converts the data records to a standard format. In addition, theformatter will generate a log file that will track items such as instrument command changes,calibration time periods, statistics on the category and number of records processed and any
errors or problems encountered during processing. At least seven different Level 1 datasetswill be generated including MS calibration data, MS particle Events, MS gamma ray events,Rates data, EES calibration data, Housekeeping data and EES data/spectra.
To monitor the radiation environment as well as the instrument health and long term
stability, a variety of time plots will be generated from the Level 1 Rates, Housekeeping, EESand Calibration data as shown in Figure 24. In addition, the in-flight calibration data isprocessed, using routines supplied by Saclay (CEA) and Kiel, to obtain results used later in
correcting the instrument data.
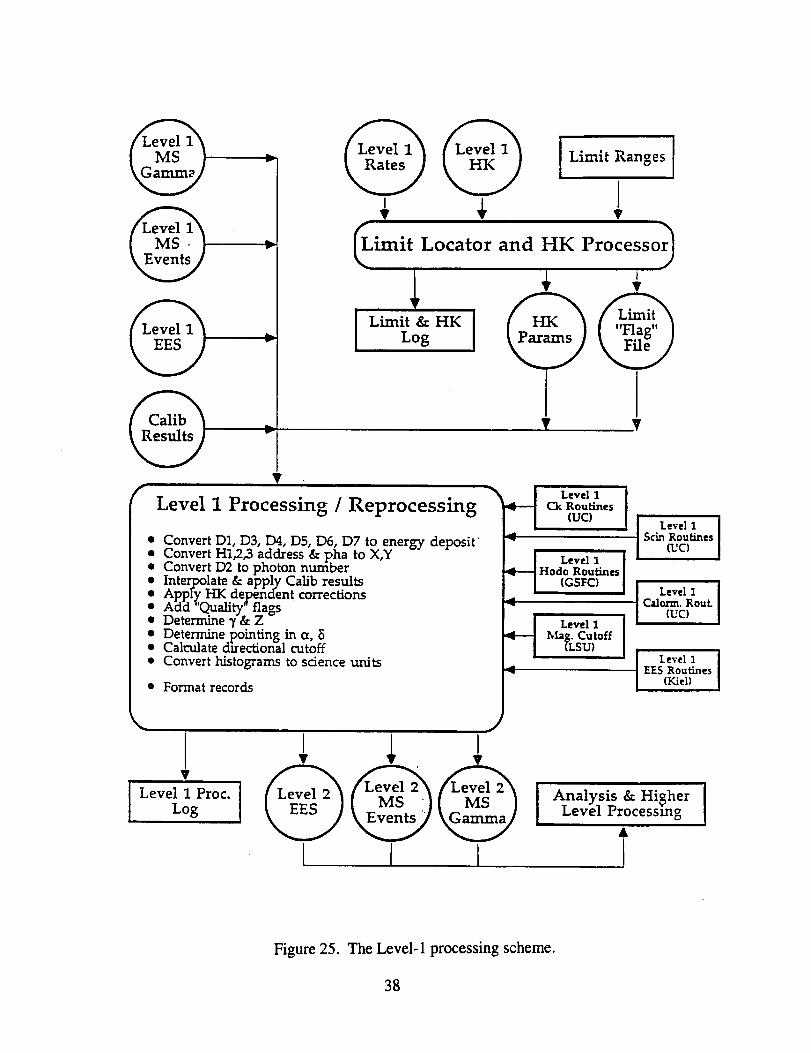
Level 1 processing, where detector calibrations are applied, is illustrated in Figure 25.As the detector calibrations may be a function of environmental conditions such as temperature
or particle intensity, the Level 1 Rate and Housekeeping data is filtered to identify time periodswhere the calibrations may not apply and to generate environment parameters to be used by theLevel 1 processing. This processing software makes use of subroutines supplied by POEMScollaborators most familiar with specific detectors. In particular, Chicago (UC) will supplyroutines to convert the Cherenkov, scintillator and calorimeter detector "channels" to "physics"
units (i.e. photon number, Lorentz factor, energy deposit, particle charge), Goddard SpaceFlight Center (GSFC) will provide a subroutine to determine X,Y positions and trajectoriesfrom the hodoscope data, and Kiel will supply routines for converting the EES data. Inaddition to these conversions, the Level 1 processing will also determine the event quality,calculate the pointing vector in terms of right ascension and declination, determine thedirectional geomagnetic cutoff for each event and output the data records in the standardformat. The resulting Level 2 datasets include all EES and MS events and gamma ray datatransmitted by the spacecraft.
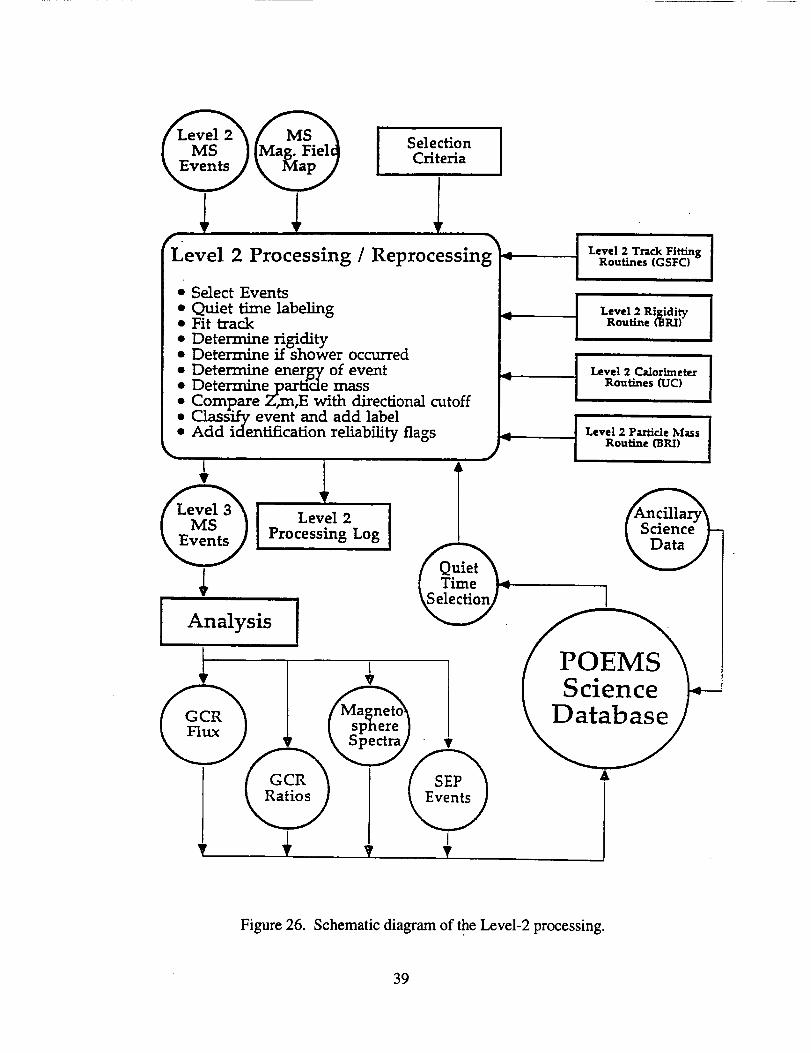
The highest processing level anticipated is shown in Figure 26. During Level 2processing MS Events are selected and, using routines supplied by collaborators, the particletrack through the magnetic field is fit, the particle rigidity is determined, events which producea shower in the calorimeter are identified and the particle mass and energy are determined.Further the event is classified and labeled with a preliminary identification (i.e. positron,
electron, proton, etc.) and a flag indicating the reliability of this identification is added.Finally, flags indicating whether the event occurred during solar and/or geomagnetic quiet time,as determine from ancillary data in the POEMS Science database, are added and the Level 3 MSEvent data volume is written in a standard format. The Level 3 data is then analyzed by thecollaboration to produce data products such as GCR electron and positron flux spectrum, GCRpositron / electron ratios, geomagnetospheric radiation spectra and characteristics of SEPevents. Such products, in conjunction with the Science Database, are used during theastrophysical interpretation.
3. Data Distribution
As the flight data is processed, the Level 1, 2 and 3 data will be made available onlinefor collaborators to download over the network. In addition, as illustrated in Figure 27 we willalso distribute these data to every collaborator on CD/R disk. CD/R, or CD-Recordable, usesthe same formats and form factor as a CD-ROM disk, but is a write once media. Thus, a CD/Rcan be loaded and read on inexpensive CD-ROM drives which are widely available for
36

_°_°_/Merge J
I
' Calib Log I
A
|
_ Process t
"_ Calib
Data
Calib AnalysisRoutines
(CEN)
V
J Parameter _
Format_erJ
_Generai°rJ v I
Plot Log
Figure 24. Proposed time-history plot generation.
37
v
v
V_r
Level 1 Processing / Reprocessing
ILimit gesl
_imit Locator and HK Processor_
T V
• Convert D1, D3, EM, D5, D6, D7 to energy deposit• Convert H1,2,3 address & pha to X,Y• Convert D2 to photon number• Interpolate & apply Calib results• Apply HK dependent con-ec_ions• Add "Quality" fla_s• Determine 7 & Z• Determine pointing in c_, 5• Calculate directional cutoff
• Convert histograms to science units
• Format records
J
Level 1Ck Routines
(UC).m
I Level 1 IScin Routines
(UC)
Hodo Routines
(GSFC) i Level 1 [Ca.lo.,'m. RouL
{UC)
EES Routines(Kiel}
V
I Level 1 Proc. ILog I Analysis & Hia_her I,e
Level Processing
Figure 25. The Level-1 processing scheme.
38
I Selection /Criteria
r
Level 2 Processing / Reprocessing
• Select Events
• Quiet time labeling• Fit track• Determine ri_clity• Determine if Shower occurred
Determine energy" of event: Determine partic.Je mass .....
• Compare Z'_m,E with direction_ cutozz• Classi/v event and add label• Add identification reliability flags
[ Level 2
[Processing Log" I
O
I I? ? ? V
I Level 2 Track Pitting
I Level 2 Rigidity 1Routine (BRD
I Level 2 Calorimeter I" Routines (UC)
II
Rou_ne _RT)
A
Figure 26. Schematic diagram of the Level-2 processing.
39

©
0
©
c_
40

essentially all platforms. In addition, CD/R media is expected to have a lifetime exceeding 30years. Finally, each CD/R disk can hold up to 660 MB of data, so with the planned POEMSdownlink data rate only two CD/R disks would be needed for each year of data. For thesereasons CD/R is well suited for distributing and archiving the POEMS data.
Following the daily processing, all Level 1, 2 and 3 data as well as associated dataaccess routines, processing log files and auxiliary information is loaded onto the CD/R stagingdisk. Once every 2 weeks the data on the staging disk is used to write 8 identical CD/R disks,one for each of the POEMS collaborating institutions, and shipped. The LSU copy will serve
not only for the local science analysis but also as a backup data archive. This process willcontinue until the staging disk is full, approximately every 2 to 3 months, when a final set ofCD/R disks are written and the staging disk is erased, preparing it for the next series of
processed data. Thus, the final disk in a series will contain all Level 1, 2 and 3 processed datacumulative since the last staging disk reset.
4. Hardware Requirements
As the POEMS daily download is not expected to be very large, the hardwarerequirements for the ground data processing system are modest. All processing will occur on acentral system capable of 40 to 50 Mflops and containing about 96 MBytes of real memory.Such a system can be obtained at today's prices for less than $30,000. To hold the operating
system, development tools, processing system, raw data, intermediate processing file, log files,calibration parameters, and processed results, the ground system will also require three largedisks (1 GB to 2 GB each). Two 4mm DAT tape drive will be used for daily system and data
backup and a laser printer will be needed for printing log files and plots. A CD/R recordersystem including controller, staging disks, CD/R drive and software will be required forgenerating the data distribution. The online POEMS Science database will be supported by twoCD-ROM 7 drive servers along with available hard drive space on the central system.
5. Implementation Timeline
The timeline for the design and development of the POEMS ground data processingsystem is shown in Figure 28. During the design phase the ground data system software anddata flow will be fully defined including: 1) establishing the code, documentation and datastandards, 2) identifying all modules and their associated function, 3) defining the interfacebetween these modules, 4) determining the format and content of all processing log files, 5)determining the form and content of the environment and diagnostic plots, 6) designingspecifications for the processing routines to be supplied by the Co-Investigators, 7)establishing the record structure and format of the Level 1, 2 and 3 data, 8) interacting with theFlight Operations Team (FOT) to establish algorithms for calculating UT, spacecraft positionand pointing from the attitude / orbit data, 9) identifying the housekeeping parameters and ratelimits for Level 1 processing, 10) determining the event selection criteria, and 11) defining theLevel 1 and Level 2 processing algorithms. A preliminary design will be available by the PDR
and a final design will be ready for the CDR.
The processing hardware will be ordered and installed during the first quarter of the
Development phase and implementation of the designed processing software will begin. Eachmajor software category (ingest and Integrity, Data Formatter, Plotting, Distribution, etc.) will
be developed in sequence and tested as it is completed. To proceed with developing the highlevel processing software, Co-investigator subroutines for calibration data processing will needto be received by the fourth quarter of the development phase, the routines for Level 1
processing by the fifth quarter and those for Level 2 processing by the first quarter ofintegration phase. All software through Level 1 processing (i.e. generating a Level 2 datavolume) will be completed and tested by the MOR. This will enable data generated during the
41

0
l-.l[-C_
©
4
<
• _ _
I.,
©
o
0
o°_
E
E°_
t..
°_
E°_
o8
°,-i
42

Integration and Test phase to be processed through the data system (providing an end-to-endtest) and distributed, as needed, for analysis. The final software components of the grounddata system -- Level 2 processing -- are expected to be operational approximately 6 months
prior to launch.
The full system will begin processing flight data shortly after launch. As these data areanalyzed, modifications and/or updates to the processing algorithms, parameter files, orsubroutine may be required. Thus, periodically during MO&DA the processing software willbe updated and all prior data will be reprocessed and distributed anew.
43

Appendix B
Final Report from the
Laboratory for Astrophysics and Space Research
of the
University of Chicago

SMEX/POEMS
Phase I Final Report(Submitted to Bartol Research Institute 12120/94)
The University of Chicago under contract with the Bartol Research Institute has completed
the following tasks:
• Design of the
completed as
attached here.
Spectrometer was completed and submitted. Engineering drawings were
required. These are summarized in the Mission Implementation (MIP)
• The GSE required for payload integration was developed in discussions withGSFC/SMEX and the other members of the POEMS team.
• A Magnet Spectrometer (MS) testing scheme was developed and the test levels aresummarized in the MIP.
• The MS design was subject to major updates approximately four times during Phase I. A
detailed description of the final MS component masses was provided By UC.
• Input was provided to the Mission Requirements Document and LSU/Data Processing
Plan and associated Science Operations Center (SOC).
• The University of Chicago Subassembly Assurance Plan (SAIP) describes the approach
developed and agreed on for performance assurance for this project.
• The Implementation Plan and the Phase III schedules have been addressed and the details
are given in the MIP.
• The UC supported the POEMS meetings held throughout Phase I to develop the payload
and interfaces to the SMEX/GSFC Project Office.
• Implementation and Mission Costs were provided to BRI based on the work breakdownstructure defined in the UC MIP.
The UC Mission Implementation Plan is attached.
MIP Table of Contents
1. Description ............................................................................................................ 2
2. UC Task Overviews .............................................................................................. 3
3. Work Breakdown Structures ................................................................................. 5
4. Implementation Plan .............................................................................................. 5
5. Quality Assurance .................................................................................................. 7
6. Testing and Analysis .............................................................................................. 7
7. Resources .............................................................................................................. 8
UChicago POEMS Mission Implementation Plan 7/27/94
1 Description
This plan describes the proposed participation of the University of Chicago (UC) in the
small explorer mission (SMEX) - Positron Electron Magnet Spectrometer (POEMS). UC
is primarily responsible for producing a major part of the Magnet Spectrometer instrument
MS and for integration and testing of the overall POEMS payload incorporating the Energy
Extension System (EES) which "will be provided by other project collaborators.
The MS instrument consists of three subassemblies and an associated electronics box.
The layout of these subassemblies on the spacecraft mounting plate are shown in Fig-
ure 1. These are (A) gas cherenkov counter, (B) magnet/hodoscope assembly, and (C)
calorimeter/gamma ray detector. The University of Chicago is responsible for the design,
fabrication, and testing of these components except for the silicon strip hodoscopes and
associated electronics which are to be supplied by the GSFC LHEA group and the mag-
net assemblies to be provided by the University of Turku (UT) in Finland. The magnet
spectrometer electronics box will be supplied by the University of Kiel (UK), Germany
group.
UC will purchase, test and package photomultiplier tubes (PMTs) associated with
the MS instrument. PMTs for the magnet bore anticoincidence shield will be sent to
collaborators at UT for incorporation into the magnet assemblies of (B).
The overall POEMS instruments mounted on the spacecraft interface plate is shown
in Figure 2. There are four subassemblies associated with the MS and two subassemblies
for the EES. UC will take delivery of these items and the Spacecraft Interface Plate (SIP)
at Chicago. The subassemblies will be integrated to the SIP and tested to electrical
and environmental specifications. The electrical tests will be performed at UC and the
environmental tests are planned to be performed in the Chicago area, at Minneapolis and
in GSFC. UC will provide the lead support for these tests.

UChicago POEMS Mission Implementation Plan 7/27/94
2 UC Task Overviews
2.1.1
2.1.2
2.1.3
2.1 Deliverable Subassemblies
Cherenkov Counter (A)
This subassembly, see Figure 3, consists of a plastic scintillation counter combined
with a sealed vessel containing 30psia of ethylene gas. The cherenkov light emitted
in this gas is reflected by a plane mirror onto a 5cm diameter PMT (Hammamatsu
type R2757). The gas vessel will have a sufficiently low leak rate to remain operable
for several years without requiring top-off. The plastic scintillator is a disc viewed by
2xl.5cm pmts (Hammamatsu type R4162), this provides one of the two master trigger
signals for the MS spectrometer events. The operation of this assembly can be verified
using naturally occurring ground level cosmic ray particles.
Hodoscope/Magnet (B)
The center section of the MS, see Figure 4, consists of a permanent magnet assembly and
a silicon strip hodoscope assembly for measuring the paths of charged particles in the
magnetic field. The magnet consists of two sections each of which is constructed from
eight blocks of high field magnet alloy. The blocks are held in place by structural plates
which also provide guide slots for the hodoscope assembly. The hodoscope consists of
three planes of silicon strip detectors, two outside the magnet and one in the center
between the two magnet sections. The alignment between the hodoscope planes is
accomplished by the strutural plate assembly. The operation of this assembly can be
verified with cosmic rays. The hodoscope electronics is mounted in a piggy back box
since the conections between the detectors and the readout circuitry must be kept as
short as possible. This electronics box is also mounted to the structural plates. Each
magnet section has an associated anti-coincidence plastic scintillation counter which is
viewed by 2xl.5cm diameter pints
Calorimeter/Gamma Ray detector (C)
The third section of the MS, shown in Figure 5, consists of nine CsI(T1) crystals which
act as an electromagnetic calorimeter for particles passing through the magnet bore
and also as a solar gamma ray detector for photons coming in through the side wall of
the assembly. The crystals are viewed by nine 2xlcm photodiodes (Hammamatsu type
$2744), the threshold energy for a single crystal detector is expected to be 1MeV. The
crystal assembly is completely surrounded by scintillation counters. One of these is
the second trigger counter, a small disc above the crystal stack - this is viewed by one
1.5cm pmt. A second scintillator on the other side of the crystal stack is a penetration
counter again viewed by one 1.5cm pint. Surrounding the sides of the crystal stack is
a third scintillator viewed by 2xl.5cm pmts. This is used as an anticoicidence counter
to veto events where charged particles penetrate the CsI counters from the sides.
2.2 Integration
2.2.1 MS Integration
The MS subassemblies (with the exception of the complete hodoscope version of (B))

UChicago POEMS Mission Implementation Plan 7/27/94
2.2.2
will be pre-integrated for a fit/alignment check of the MS mechanical components on
a simulated spacecraft interface plate provided by UC.
POEMS Integration
UC will take delivery of the 6 subassemblies of the POEMS instrument payload and
integrate them to the SIP, provided by GSFC SMEX project office. UC will perform
functional/electrical tests on the assembled payload
2.3 Testing
2.3.1 MS subassembly testing
UC will perform subassembly testing on MS components (A) and (C). The tests and
levels are shown in Table 1. PMTs delivered to UT will be Qual./Flight tested to the
levels in this table.
2.3.2 POEMS payload level testing
The integrated POEMS payload will be subjected to the tests/levels shown in Table 1.
2.4.1
2.4.2
2.4 Modelling
MS Thermal model
UC will provide a SINDA thermal model of the MS instrument subassemblies A,B,
and C. The number of nodes and complexity of this model will be determined in
consultations with the project office.
MS Mechanical model
A mechanical model of the subassemblies associated with the MS will be provided byUC. The level of detail and format of this model is TBD.

UChica_o POEMS Mission Implementation Plan 7/27/94
3 Work Breakdown Structures
The WBS for the UC tasks are represented by block diagrams as follows:
3.1 MS Subassembly A WBS Shown in Figure 6
3.2 MS Subassembly B WBS Shown in Figure 7
3.3 MS Subassembly C WBS Shown in Figure 8
3.4 MS PMT assemblies WBS Shown in Figure 9
3.5 POEMS integration and Testing Shown in Figure I0
4 Implementation Plan
4.1 Hardware and Integration/Test schedule
The UC implementation plan and schedule for these activitiesisshown in Table 2. (In
the following all item numbers are referenced to this table) Procurement and packaging
of the PMTs for the MS are addressed in items 1 and 2 of this table. The UC is the
only collaborator working on hardware for subassemblies A and C of the MS. The work
on these assemblies isshown in items 3 and 6. The processes associatedwith subassembly
B are also shown for scheduling comparisons in items 4 and 5. The bulk of the magnet
work (excepting the PMTs) shown in 4 will be performed by UT. The design work on
subassembly B structure willbe a jointeffortbetween UC and GSFC LHEA as shown in
item 5. Two flightmagnet assemblies willbe deliveredto UC by UT, one of which willgo
to GSFC LI-IEA for the hodoscope integrationaftercompleting fit/alignment checks. The
other willstay at UC for MS integrationfit/alignment checks.
The spacecraft bracket described in item 7 holds the spacecraft interface electrical
connectors. Design and location TBD.
Items 8 through 10 are associated with the integration of the MS and the POEMS
payload at UC. In this plan the SIP must arriveat UC by 9/I/96 for the schedule to
proceed.
Item 11 provides the plan for the testing of the complete POEMS payload before
delivery to the GSFC SMEX office.Two months have been allocatedfor these tasks.
4.2 Spares Plan
UC will provide spare assemblies in component form for each of MS A,B and C. All
scintillators and crystals will also have one spare. For the 5cm PMTs 5 will be purchased
(1 required for the MS) and 2 will be brought to flight specifications. For the 1.5cm PMTs,
25 will be purchased (10 required for the MS) and 15 will be selected for building to full
flight specifications. The photodiodes will be selected for low noise from 30 purchased (9
required).
4.3 Long Lead Items
5

UChicago POEMS Mission Implementation Plan 7/27/94
Several long lead items have been identified which will require a purchase order to beissued before the CDR. These are:
5cm PMTs -(6-9 months lead)
1.5cm PMTs -(6-9 months lead)
photodiodes - (6 months lead)
potting material - (6 months lead)
optical coupling pad material - (6 months lead)
magnetic shielding material - (90+ days lead)
6

UChicago POEMS Mission Implementation Plan 7/27/94
5 Quality Assurance
The UC subassembly assurance implementation plan (SAIP) is provided as an Appen-
dix I to this document.
6 Testing and Analysis
6.1 Hardware Qualification
Hardware provided by UC will be tested to the levels specified in Table 1 for subassem-
blies for qualification of design. The gas container for the cherenkov counter of subassembly
A will be tested by prototype construction and qualification testing.
6.2.1
6.2.2
6.2 Analysis
Thermal Analysis
The thermal modelling of the MS instrument will be based on a thermal control concept
developed during phase I of POEMS. This divides the subassemblies A,B and C into 3
separate thermal areas by covering the assemblies with multilayer insulation blankets
(MLI) on all sides except the attachment to the spacecraft. Subassemblies A and C are
thermally connected to the spacecraft plate, subassembly B is isolated. The ,-_bW of
power dissipated by B are radiated by a plate connected to the hodoscope electronics
box. This concept works well in the modelling performed in phase I. The report for
the model developed in the study phase is attached as Appendix 2. A vendor has been
identified (Ball Areospace) to perform this study during phase III of POEMS.
Mechanical Analysis
The mechanical modelling of the MS will be performed seperately on each of subassem-
bly A,B and C. The details of this effort are TBD.
6.3 POEMS payload environmental testing
These tests as specified in Table I will either be performed at UC or at vendors in either
Chicago (Vibration) or Minneapolis (Thermal Vac.). These vendors have been contacted
and the feasibility and cost of performing these types of tests have been discussed. Acoustic
testing, if required on the POEMS payload, will be performed at GSFC.
7

UChicago POEMS Mission Implementation Plan 7/27/94
7 Resources
7.1 Key Personnel
Key Personnel for thisprogram at UC and theirrolesare as follows:
Simon Swordy - Co-I and Scientistresponsiblefor the development and testing of the
detectors developed at UC. Also overallprogram management. Experience includes
detector design and testingfor CRNE experiment flown on Spacelab-2 in 1985, several
electronicdetector systems for high altitudeballoon payloads
Bruce McKibben - Co-I and Scientistproviding sciencerationalefor the mission and de-
tector development effort.Experience includes the COSPIN instrument on the Ulysses
spacecraft and several other small spacecraft electronicdetectors for charged particles
in the solarsystem.
Wayne (Skip) Johnson - Lead Mechanical Engineer providing the MS assemblies and
integration of the POEMS payload. Also responsible for POEMS configuration manage-
ment. Experience includes mechanical design of Spacelab-2 payload and participation
in the design effort for several space instruments and high altitude balloon experiments.
Fred Sopron - Project Assurance Manager for the POEMS effort at UC, responsible
for QA and overall assurance issues. Experience includes space instrument electrical
engineering for many payloads and environmental testing schemes.
7.2 Facilities and Equipmentt
The UC has designed and executed experiments for 33 highly succesful space missions,
including the first probes to the Moon and to Mercury, Mars, Jupiter and Saturn- as well
as over 100 experiments on high altitude balloon flights. The general scientific theme of
most of this work has been the study of energetic charged particles, plasmas and radiations
in a wide range of astrophysical settings. The success of the UC group is largely possible
through a NASA grant in the early 1960's leading to the establishment of the Labora-
tory for Astrophysics and Space Research, (LASR), within the University's Enrico Fermi
Institute. LASR was created to join in a single laboratory the academic staff, students
and technical experts involved in space science research. All faculty members hold joint
teaching appointments within the departments of physics, astronomy or chemistry at UC.
The technical services group within LASR provides engineering, design, fabrication
test and launch support for space flight instrumentation on a full time professional basis.
Excellent central shop facilities at the University, and well maintained special purpose
facilities within LASR make it possible to construct sophisticated space instrumentation
'in-house' at UC.

|
o
|
/
I
I , .
-:-i_I
IlJ
0
0
,4

-t----
d.
IiIII--
i IiIkiii_
iiII_
I
\
\\
\
M
iI
i
i
/
//
_, I I !
I°.__ =._I'_
I l'_-'i"=_ 'iI:=
: Itt-_lii=_,I I-__ .i!lk-Is ,.'_Ii:_:
o
o

- °
I l,
i Z
"l!i_I.I _
o .i..I+12.I"< ,,.+Vl .a'+ _
i
+' Kfi
II'
_<
I
G
v,--i
_3
qllN

iloo m
aw j
_ I i_z
:i II
" [ |
I i, L
-1-
cr_p..ch
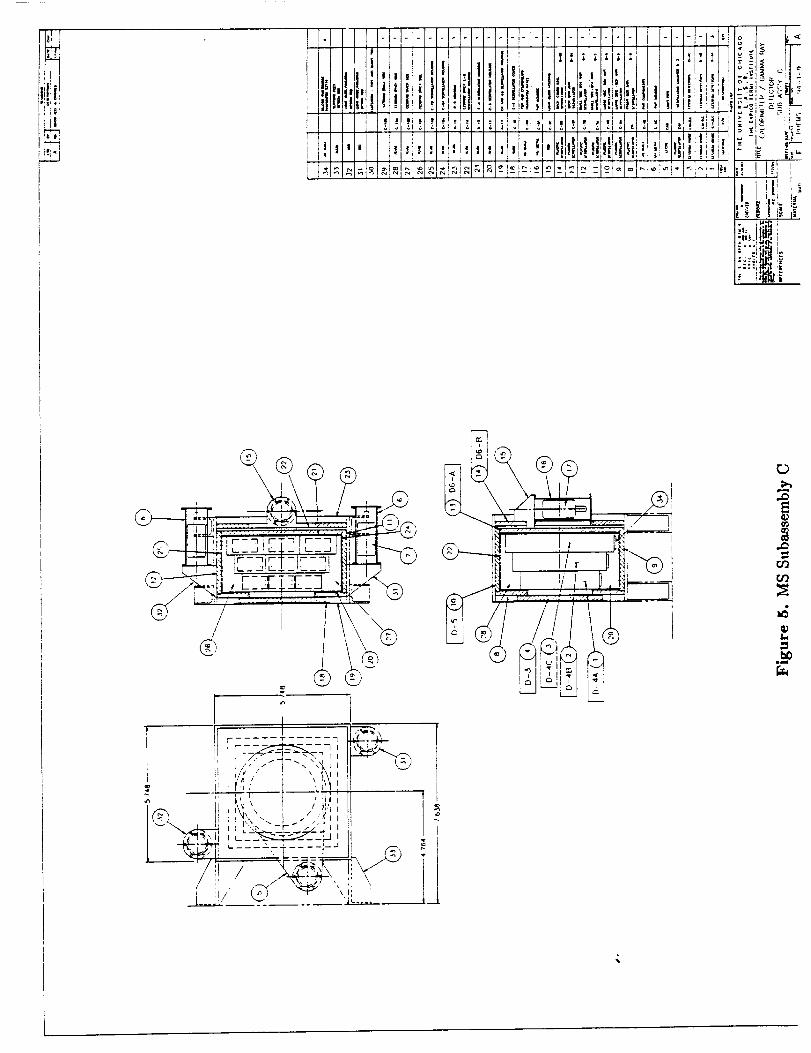
S'o!i°l
• 7¢
F---
I f:_ / J \Ill _' | 1
--_7 V-l--1 r-_-_lt_.\ /I I\! \ ' /I ,.
, ,x{x\.. I .. .'Y,
I I_____-_
l
I
I
I
I
I i
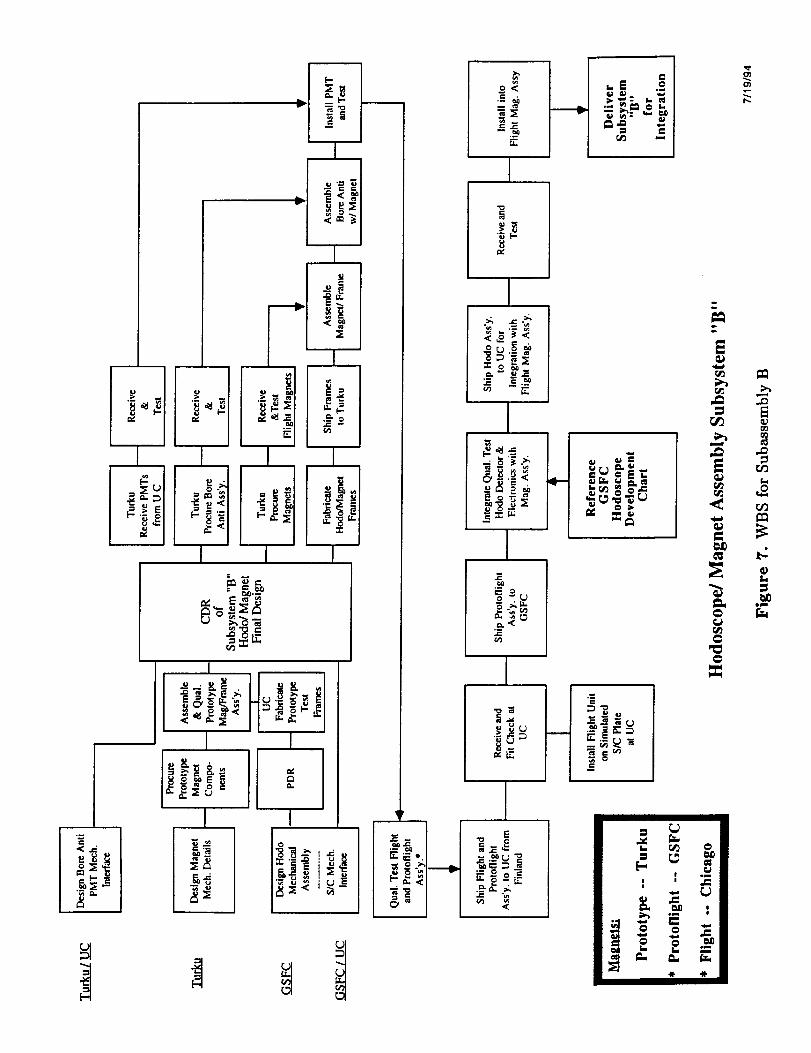
i o_oiiI'_1 _0-_
--I!
i lJ,
= ___
I
°_ _I
I_-_
i
I
•_ [,.
,._ o=.., "_;
O)
r'-
_ _,.r, o _
•_ _._
M
@
@
E
_ P
,._ .-_• - o -_
_ .
i
_°

Cerenkov Gas Container
D_ ___Head-forming
Fixtures
Gas PDR
Con_iaer 5I_ign
WeldingFixmres
2" PMT
Housing
l_ingFixture
i
- _ Hy_T._8 I I _'mods / [ F_m+._ ] I[ , [ Right
| _L_ + ,G-_o_oe,I I_p./ [=abaca= I I r-m-i== I I I _ I _ /_o_. --.----4 Weldm_ I-----I Pnxoq,V¢ t--4 X-Ray I--I Gas I--I M_.k h
Mml ..t. l Fixmre [ [ Housing j i Welds , [ Comainer, [ 7 IL_
--------4 _. 1"-4 Fabricate I---------I Pot Mock _ Check Mock I II M-_, II H°usi"+ I I Pro" I I PeT I I
Reference IPMT Flow
Cha_
I
-- Fal_ica_ PottingFixtu_ Fixture
[
I+'I._ Fabricate I Flight PMT
__ Minor Ass'y.
Assembly I
I-°lTest Flight-- PMT
I
_ssoreo_IFlight PM'r
I
°+I_I I_I++I_I.+l_l..,.,-+l_l.,,Finish Leak Test Mirror PMT DI Detector DurationVessel Vessel Assembly Assembly Assembly Leak
Test
D1 Detector wiEh Meehan£cal Intewface Collar
I
Design Mcohanical IInterface_=n _--
Dl_ovI
PDR _ Fab_te Counter andthcGas Cc_--nkov
" Mech. Interface
Design DIHousing I H-=I -_++*"PDR l- -- Fabricate Housing
i
t<-- H ol---t I--;AssemblePI: _ I" -- Fabricate n ScmCLight Pip<:
C°SllDesign Valid
Hydro Test
Prcxo & FlightGas Container Assy
w/mock PlvlT
I
I FlightG. Container
Passes Hydro Test
Deliver
Sub System"A"
for
Integration
I
Sub-Assembly
_[ Q_ Tesu:
l" Mass Prop] - Modal Survey
I:_%°.
Bench Test IDI Assembly
PMT's
tReference
PMTRow Chart
Design DIScintillator
Scintillator
--- H Iqu_q,--_ PI _ E'-- P_x.mm Inspection
SMEX/POEMS Subsystem "A"
Figure 6. WBS for Subassembly A
7/26/94

_D
Iiu a_
t
I
I

nn
I_ _
If_
°I_
4.)
nz
8
O
i i
A _
I I
©
r,,) _
mr,.)

0
N
A
c-
o ___
m
JA
io,
EJ
<
I
p.,
C
0
_.__
m
J
c¢}
cJ<
x _,_
w__m
_J0Q_
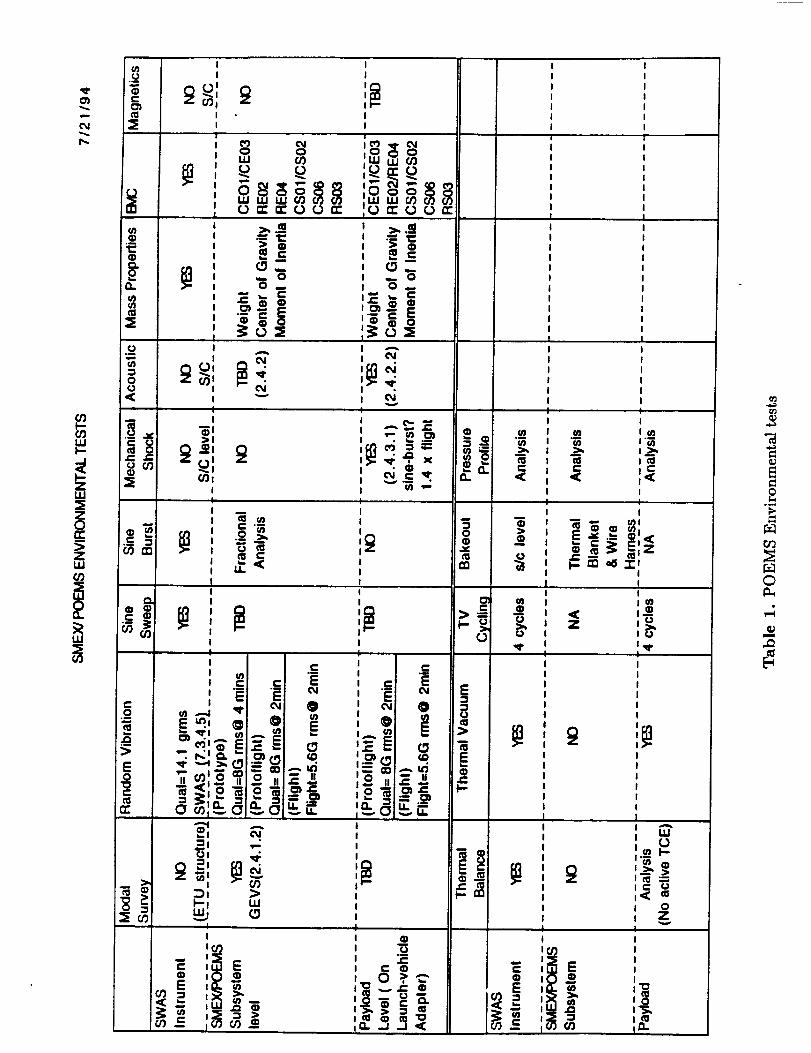
{n i i
F:g _i I,: _ _
_J iW (/3
I I
I II I
I II I
I I
I I
i !
I t
l II I
I lI II I
I lI I
I I
E i _-
i
II
03
IIIII
0
_q0

I
I
gI
I
e

o_Z
4
i •
* i• !
_ z
i_ z
G.I _J

H
Iin
II
®
@

Z
D
.?
|
IIII =
II • II @
®,i. i
D
[_>0
®

Z
;I
_ii
• n
I
!UP
OE
L.hLh
iI
|I
n
®
®
JZ
L_O
®
i
°.
Z

0
Qd
I
J
I ! = I_@
I• I.
:I
I
II
L_
I
b @
L_
@
I

(_ i i i
g
I
L,?..
®
[-,>
®
'r

z,
)
II
.. II L_
I|
!
I|
ii II III
II
o
' i!l!!__!ii!!!!!!_o,-.i_,i,,;.Z _

z
_ C
"8
®
_o
®
I
,,o ,,o ,,6 ,,_ _
_p ',0
|
._
z
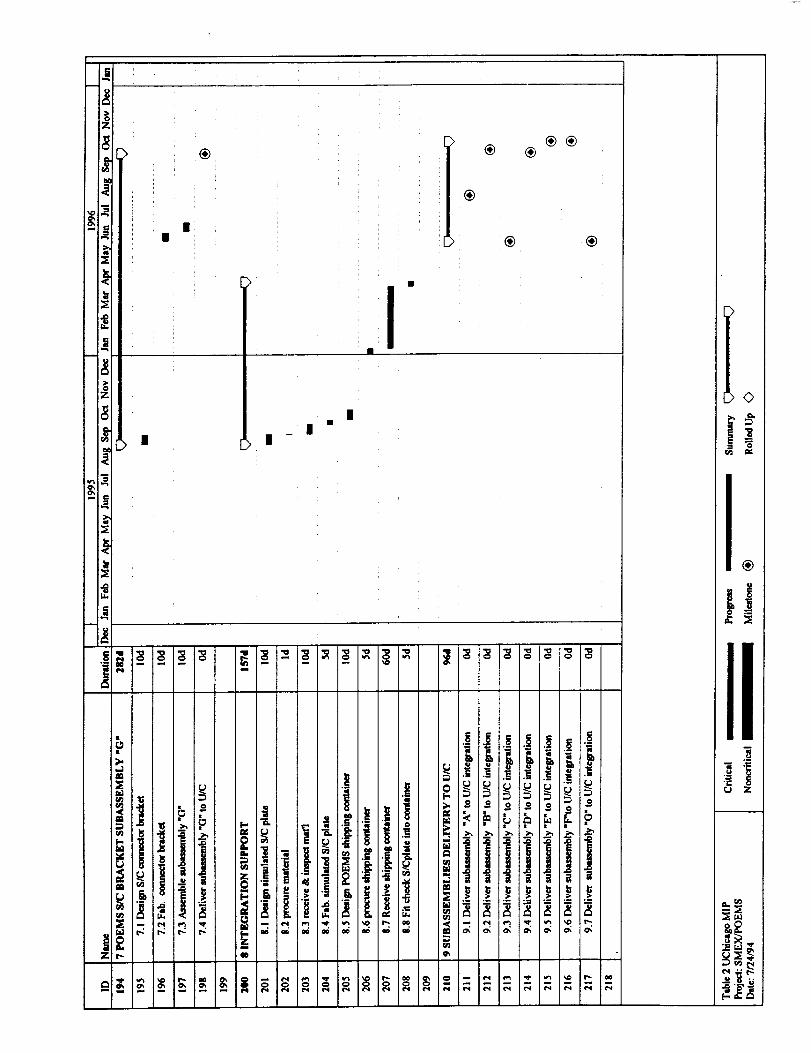
®
®®®
0=,
.,L>
" i
i
[>:
_ |
• !
I
I
®
F>
"z
®
II
!
Z r,- O0
i
-_ =
z
_._-_

Z
8
K
W
c,_
o _ _ o o _ o o ,o .-
I
Ii
i®

r
Q_
z
N
m
z_! _ _ _

UChica_;o POEMS Mission Implementation Plan 7/27/94
Appendix 1 - UC SAIP

UChicago POEMS Mission Implementation Plan 7/27/94
Appendix 2 - UC MS Thermal report for phase I

System
Engineering
Report
REPORTNO. DATE 29 June 1994
I
I PROJECT POEMS
rTITLE
Internal Instrument Thermal Model Report
PREPARED BY Leslie Buchanan 6/29/94 IAPPROVEDSY Bob Poley
SCOPE/TEXT: (ATTACH ADDITIONAL SHEETS AS REQUIRED)
This report documents the thermal model and preliminary analysis for the Positron
Electron Magnetic Spectrometer (POEMS). In the report, we have included descriptions of the
preliminary thermal design and thermal model, case descriptions, transient results, and results
from a parametric study. We concluded that the preliminary thermal design is workable, and
recommended steps for further analysis. We described the hard copy of the thermal model that
we are sending on a 3.5 inch floppy disc.
Skip Jensen-Univ. ofChicagoJacaues L'Heureux-Bartol Research Institute(Report only)Stew Glazer-GSFC
THERMAL DESIGN
In the current thermal design the Magnetic Spectrometer (MS) consists of three components
that are thermally isolated from each other. These are the Cerenkov, the hodoscope, and thecalorimeter. The Cerenkov and the calorimeter are hard mounted to the spacecraft upper deck usingfour .25 inch bolts each. The hodoscope is conductively isolated from the s/c. Its temperature is
independently controlled by a space radiator located on the anti-sun side of the hodoscopeelectronics box. All three components are covered in their own MLI blankets. In this thermal model,all of the exterior surfaces of the MS except the radiator are assumed to be adiabatic.
THERMAL MODEL
The node breakdown for the thermal model is shown in Figure 1. In all three sections, node
breakdowns were chosen to represent the presence of PMT's. Assuming good thermal conductanceat the mounting interface, PMT temperatures are represented by the temperatures of the underlyingstructure.
The Cerenkov was modelled with 14 nodes. It was broken down into quadrants to facilitate the
presence of the PMT's. There is also a node for the bottom pressure window so that the radiationheat transfer between the Cerenkov and the hodoscope can be conveniently added to the model inthe future.
Most of the modelling detail was concentrated in the hodoscope. The magnet assembly was
halved vertically along the centerline to model the gradients caused by the presence of the radiatoron the anti-sun side of the hodoscope electronics. The interface resistance between the magnet
frames, scintillators, and magnets is assumed to be negligible. The electronics were modelled to thebox level. The box is assumed to have good thermal contact with the magnet frames. For the
detector assembly, the detectors are assumed to be made of Aluminum plated Silicon, and arebonded to PC boards. The PC boards are then bolted to Aluminum racks with 7 #4 bolts. The racks
are assumed to have good thermal contact with the magnet frames along their side edges. Radiation
exchange between the detectors and the bore anti scintillators was modelled. The detectors wereassumed to have oxidized Aluminum finishes with E = .2, and the scintillators had E = .8. The
hodoscope cover plates were included in the model to facilitate the addition of radiation conductorsthrough external MLI blankets. For this preliminary model, 100 % of the area available for theradiator was used. The radiator was assumed to be painted with S13G/L© white paint.
Thirteen nodes were used to model the calorimeter. There is one node for the Cesium Iodide
array, and nodes representing each side of the scintillator and housing.A node list is included in Table 1. The list contains node numbers, descriptions, materials,
masses, and properties. Masses were obtained from the University of Chicago Weight Tabulationdated 6/13/94.
ANALYSIS CASES
The model was used to analyze a worst hot operate and a worst cold operate case. The
parameters that were varied to create these cases are listed in Table 2. The environmentaloarameters were obtained from the thermal section of the GSFC Poems System Requirements
Review presentation dated June 2, 1994. The electrical power was obtained from the University of
2

i""
\
C
o
,=_
If,
0Z
s._
C
0 _.e. _-,
!
0Z
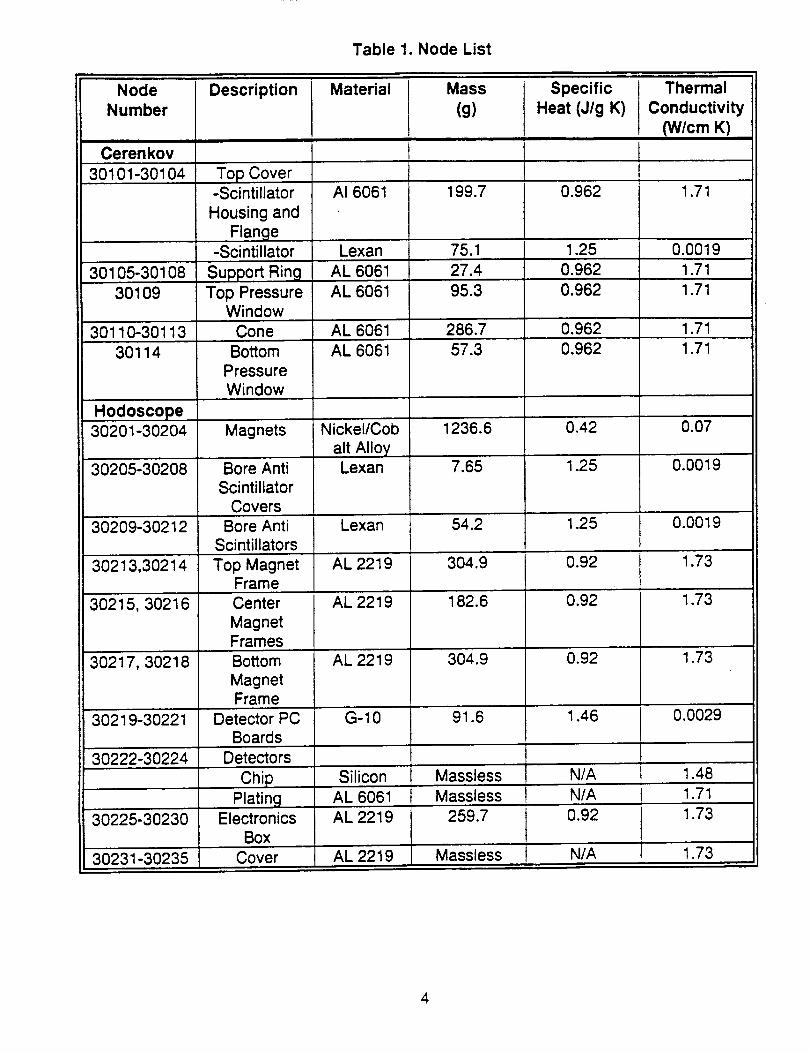
Table 1. Node List
Node
Number
Cerenkov
30101-30104
30105-30108
30109
30110-30113
30114
Hodoscope30201-30204
30205-30'208
302O9-30212
30213,30214
30215,30216
30217, 30218
30219-30221
30222-3O224
30225-30230
30231-30235
Description
Top Cover-Scintillator
Housing and
Flange-Scintillator
Material Mass
(g)Specific
Heat (J/g K)
AI 6061 199.7 0.962
Thermal
Conductivity
(W/cm K)
1.71
Detector PCBoards
Detectors
Chip
PlatingElectronics
Box
Cover
Nickel/Cob
alt AlloyLexan
Lexan
AL 2219
AL 2219
AL 2219
G-10
Silicon
AL 6061
AL 2219
AL 2219
1236.6 0.42
7.65
54.2
304.9
182.6 0.92
304.9 0.92
91.6 1.46
Massless N/A
Massless N/A 1.71
259.7 0.92 1.73
Massless N/A 1.73
1.25
1.25
0.92
0.07
0.0019
0.0019
1.73
1.73
1.73
0.0029
1.48
Bottom
MagnetFrame
Center
MagnetFrames
Top MagnetFrame
Bore AntiScintillators
Bore Anti
ScintillatorCovers
Magnets
Bottom
PressureWindow
Lexan 75.1 1.25 0.0019
Support Ring AL 6061 27.4 0.962 1.71Top Pressure AL 6061 95.3 0.962 1.71
Window
Cone AL 6061 286.7 0.962 1.71AL 6061 57.3 0.962 1.71

Table 1 (Continued). Node List
NodeNumber
Calorimeter
30301
3O3O2,3O304
30303
3O3O5
Description Material
Cesium
Iodide Array-Crystals
-AI Volume
Side Box Anti
-Scintillators-Liners
Bottom BoxAnti
-Scintillator
-Liner
CesiumIodide
AL 6061
LexanAL 6061
Lexan
AL 6061
Lexan
Mass t
(g) t
2874.0
378.2
56.7
[ 21.6
132.4
45.4
SpecificHeat (J/g K)
0.201
0.962
1.25
0.962
1.25
0.962
Top Box Anti-Scintillator 92.4 1.25
Thermal
Conductivity
0N/cm K)
0.0105
1.71
0.0019
1.71
0.00191.71
0.0019
-Liner AL 6061 41.7 0.962 1.71
30306,30307 Side Box Anti-Scintillators Lexan 52.6 1.25 0.0019
-Liner AL 6061 21.6 0.962 1.71
AL 6061
AL 6061
303O8,3O31O
30309
30311
0.962
0.962
0.962
0.962
0.962
30312
SideScintillator
HousingBottom
Scintillator
Housing
TopScintillator
HousingSide
Scintillator
HousingSide
Scintillator
Housing
30313
281.7
AL 6061
413.4
101.6
320.0
132.4
AL 6061
AL 6061
1.71
1.71
1.71
1.71
1.71
5

Table 2. Case Descriptions
Parameter
Solar Constant (W / m")
Hot Operate Case1419.0
Beta Angle (Degrees)Spacecraft Upper Deck
Temperature (°C)
Cold Operate Case1286.0
Albedo 0.35 0.25
Earth IR (W / m =) 265. 208.
50.0 90.0
Total Electrical Power (W)
23.0
5.72
0.300.88
S13G/LO White Paint
-absorptance-emittance
6.0
5.72
0.200.88
Chicago. The power dissipation is the same in both cases because the cold case power breakdownwas not yet available. Properties for the white paint are from LDEF.
RESULTS
Transient temperatures during orbit for the hot and cold cases are shown in Table 3. A marginfor uncertainty has not been added to these temperatures.The Cerenkov and the calorimeter followthe temperature of the s/c upper deck due to their low power dissipations. The hodoscope
components experience a small temperature variation in the hot case. With a beta angle of 90 ° inthe cold case, Albedo heating on the radiator is small so the components remain at steadytemperatures. With 100 % of the available area utilized, the hodoscope radiator experiences an
overall range of -18.9 to -12.5 "C. This causes the electronics box baseplate to have a range of
-7.7 to -1.9 °C. There is a maximum gradient of 0.4 oC across the magnet assembly. As shown in
Figure 2, the hot case orbital temperature variation is consistent for all three detectors, with a
maximum axial gradient of less than 0.01 oC. The slightly higher gradients that exist between the
detectors and their support structure remain consistent throughout the orbit as well, as shown in
Figure 3. The detectors have an overall range of -6.0 to -0.2 °C.
PARAMETRIC STUDY
From the analysis we determined that the hodoscope electronics and detectors may berunning on the cool side of their acceptable ranges when 100 % of the available radiator area isused. As an aid in sizing the radiator, we performed a radiator size parametric study. Results fromthe study are provided in Figures 4 and 5. The figures show the variation in the steady statetemperatures of the detector, electronics baseplate and radiator as the radiator size is increasedfrom 75 % to 100 % of the available area for the hot and cold cases.
6

Table 3. Orbital Temperature Variation (°C)
Component Hot Operate Case Cold Operate CaseMIN MAX
Cerenkov 23.0 23.0 6.0
Hodoscope-Detectors -0.3 -0.2 -6.0
-Detector PC Boards -0.3 -0.2 -6.0
-Magnet Assembly, Non- -1.0 -0.9 _ -6.7Radiator Side
-Magnet Assembly, Radiator -1.3 -1.3 -7.1Side
-Cover -1.2 -1.1 -6.9
-Electronics Box Baseplate -2.0 -1.9 -7.7-Electronics Box Walls -7.7 -7.3 -13.3
-Electronics Box Radiator -13.4 -12.5 -18.9
Calorimeter 23.0 23.0 6.0
CONCLUSIONS AND RECOMMENDATIONS
Results from the analysis show that the preliminary thermal design for the MS is workable.The gradients throughout the instrument are small, and there is plenty of radiator surface area
available for maintaining the temperature of the hodoscope. By locating the radiator on the anti-sunside of the spacecraft, the temperature variations during orbit are small.
To complete the analysis, it is recommended that this internal model be incorporated into theoverall s/c model which includes the heat transfer through the MLI on the external surfaces, the
minimum powers be incorporated into the cold operate case, and the hodoscope radiator be re-sizedto achieve optimal temperatures.
MODEL HARD COPY DESCRIPTION
We have included a hardcopy of the steady state, hot and cold operate thermal models on the
accompanying 3.5 inch floppy disc. The filenames are POEMSH.SIN and POEMSC.SIN,respectively. The models have been converted from TAKIII to SINDA85 format. They include an in-house subroutine called QFLUX to automatically interpolate and apply the flux arrays. We haveassumed that GSFC has a similar subroutine and can replace our call with one of their own. For
clarity, we have included a description of our QFLUX subroutine in Appendix A.

R = 30222 HODOSCOPE DETECTORSB = 30223 HODOSCOPE DETECTORS
-0.235
-0.240
--0.245
-0.250
u-0.255
_-0.260
_-0.2_
_-0.270
-0.275
_-0.280
-0.285
-0.290
-0,295
-0.300
C = 30224 HODOSCOPE DETECTORS
** Jl I j II I i II IJ I I II I I II ,I I j ii _llll i I II Jl I I Jl t I I, II i I li i I I, ,l- : : : : : : : : : : : -.........:..........:.........:..........:.........--.........:..........:_.C.'rj_e ..................................._ . ..... _._.." _ , _ : : .........."..........".........".........._.........- .........i...........,,--/_-- - ......_ .......!........."........-- : . . . : , P/ : , : _ ,
, : : : : :_ ! i i c. ! ! -
• : : : : ', C : : " : : -........ _.......... ; ......... _.......... ;.......... _'"'//_.... "--_ ..................... ;......... , .......... i .......-_-._._.........;: : : :......................................._./_...._. :.............................! !..................x......._,........i ! 1 i _,/ i _ _ _ _ :c-
.........i.........i...................c.........i..........i.............................i.........:i:iiiiiiii::iiiiii::::::::::::::::::::::::::::::::::::::::::::::::::::::....i...........................-..... ....i.........i.......¢ ....i.........i..........!..........;.....:::::::::::::::::::::::::::::::::::........ :.... cE', _......... :..... c"'! ......... _"......... {.......... i .......... ,_......... ','.......... _......... 4.........
-........i.......__:-...i ..........i.........i..........i..........i.........i..........i........._........:
0 500 1000 1500 2000 2500 3000 3500 4000 4500 5000 5500 6000
TIME (SEC)
Figure 2. Detector Orbital Temperature Variation - Hot Case
8

= 30215 HODOSCOPE CENTER M_GNET FRAME3 = 30216 HODOSCOPE CENTER M_GNET FRRME
C = 30223 HODOSCOPE DETECTORS
-0.2
-0.3
-0.4
-0.5
u -0._;
-0.7
-0.8
-O.SC1
-1.0
-i.1
-1.2
-1,3
-1.4
; I i I I I I I J u I I I I I 11 i n I I I I rl I I I I ( I I r i i i2 i u i j i,L u i i ( i i i j i i i i i [ i [ i: ,_L...__C..:,__.__ C- c-- : _ : c----:--_c_ -=-----_L :-...-....._.c--.- --_--c..... ,..... c.............. _.......... _.......... ........... _......... _.......... _.......... _.........
..... :- : , , : : -.........................................._.........._..........i....................-:........._..........-i..........i.........
e@
................................................... . ' "......... ...'..................... L......... "..................... " .........
- : : , : . , : : -i , , , , D ,
i...o .... _.o .o......4o o.o oo*.o.4o o...o..oo& ........o.& °...o.oo°._.o. o°..o..._.....o...°._-...o o ..o._°o °o..o °°..Po .oo° .oo.. a
. . . : : :- : : : , , , : , -......... ,..................... _.......... ; .......... ;.......... i-.......... ;-.......... :-......... -:.......... -:.......... ; .........
- : ' , : ' : -
_................................i....................i....................-.......................................i........=...................... i .......... _......... : ..................... "......... :.......... ".......... i .........
.................... , "T :,B-----'-P-@ -: --_S--u--'_--- ,.;___-- _s , .-s ! s ! -s,'+'--'--e, : : : , i
m. °.oo... 4.o.o°.... ° _°o° ..°o.4..o .... .6 °o° o°.....Q o.°o.o°o..b...o°..°.._o...o°.°._o°o....°.,i..°. ° o...._.ooo°°°.. ° d. ° o° °..° _i i J m
D q o I = i
- ,, , . . ,, : , : .' -
, o i o D ,
,, I | , , t , , i
l''°'" "°° %° °° ° °''° °'_°°'°°°'°'" _°°" °" °'°'" _ °'_ °°'°°°_ • °''-°''°'°_'°°°'-'" "°°l"-°°°-°°°° "_" "°'° "" °° "%'' °" "°'°° ° _°°°'°''' °° • "" ° o ° ° °"
......... :_......... i .......... !.......... ;....... ..:-.__..., ...... -'______ ! ' ' -------_, _ ! _---i---.' _.'-d-'--" i ! i ! i --____'.-__J _l_t _l_I_l_l]_l_ _ _ I_}_I_ I _ _,l,,,,I_,,-
0 500 1000 1500 2000 2500 3000 3500 _000 _'500 5000 5500 _000
TIME (SEC)
Figure 3. Detector/Frame Orbital Temperature Variation - Hot Case
9

0
0(.)0
w"
0
"00
I
"0
E0_D
0o,.ID
OD
0
, / /i //i i/
! / i/_Ii i f/
/I- i
, //,
-'7
,///
II
o _ o _ oI
r_ $eeJ6ea)e,_oJedt,ue.t
8
O.
o
oD
"oo
a)
.13oo
cO 0O)0
I
10

O(J
O(J
_3o,)>,"OO
!
>,I0
U
E
C_o.
b.O
Om"13_3D:
LL
A
oo
o"oD
(pw.oo(3
O
11

APPENDIX A
12

Subroutine QDUM P
1"hJs subroutine will compute and write out the thermal network map along with a heat flow map based
_pon the current nodal temperatures and conductance values. This routine is very. similar to the SLNI)A'85
subroutine QMAP.
QDI/MP (and QMAP) is extremely useful for two reasons. First, when a model is f'gst built, nine times out
of ten there is usually a n/s-connected node or nodes. It is important to weed these out as soon as possible
so it is recommended that the analyst run this routine during early model development. Second, the analyst
usually needs to understand where the heat is flowing to and from. Since this routine prints out individual
heat flows and percentage of total this job is made much easier. An lastly, QDUMP will report the node
with the maximum ener_oy imbalance.Resmctions:
Because of the volume of output, QDUMP should only be called in the OPERATIONS DATA block.
Calling Sequence:
CALT. QDUMI_( 'SMN' )
where:
S_ - any active thermal sub-model name or 'ALL' for all sub-models
The following is an example of a QDUMP output.
Subroutine QFLUX
,'l'his subroutine will apply orbital timeiined fluxes into the appropr/ate Q-soure_ location for anvial] thermal. •_ub-mode!s. With this one call. :he user c,efined flux ubies are :xu:ornaticall',' ir.*.e.--,ohte/and :.".e.-e,_:;t-.-.._

_e_.rdngratesaddedto the Q-sourcelocations.Thiseliminatestheneedfor theaD1D 1DA call for each-'lu.xtable.
_FLUX will automaticallycalculateorbitalaverageflux ratesif theuserisrunning asteadystateroutine.This eliminatesthe needto havetwo setsof heatingrates;onefor steadystateandonefor transient.
Restrictions:
Them must be a "time" array defined followed by any number of flux arrays. The number of orbital flux
positions must match the number of times in the time array. The following is the format that should be
ased.
I-IEADER ARRAY DATA, SMN
N S time array
tl, t2., t2 .... tn
EN'D
N, NODE, MULT
fl, f2, f3 ... f_END
N, NODE, MULT
fl, f2, f'3 ... fn
END
$ flux array #1
$ flux array #2
Where:
N - array numbers
t(n) - orbital times
f(n) - flux values that correspond to the orbital times
NOD- Enode wher_ flux should be applied
MUI..T- flux multiplier
QF'LLrX should normally be called in VARIABLES I data block.
Multiple sets of flux tables can be used. This is done by preceding each set with its own "ThME" array. The
user must also have a unique call to QFLUX for each set. The number of orbital positions in one set does
NOT have to match any other.
C:lling Sequence:
19

M CALL QFLUX( ' SM_ ', ITA, NUM )
where:
SMN
ITA
NUM
• °
- Any active thermal sub-model name
- Time array number ( integer )
- Number of flux arrays to follow time array ( integer )
Subroutine PLOTQ
This subroutine writes out the impressed heating rates for all active nodes to a ".$71" file. This file is the
same format that PLOT85 writes so the SINDA'85/FLUINT plotting pro=_carn XPLOT can be used to plot
the hearing rates ( Make sure you change the x-axis label from temperature to heating rate ).
This routine is useful when trying to determine why nodal temperatures are behaving unexpectantly. What
it usually unco;cers is incorrect heating rates that the analyst as inadvertently applied.
Restrictions:
PLOTQ should normally be called from OIITPUT CALLS for transient runs or the OPERATIONS block
for successive parametric steady state runs. It can be called from the other lo_c blocks.
Current Limits:
Maximum number of thermal sub-models is5
Maximum number of nodes per model is 500
Maximum number of time hacks is 200
These are lirnitauons of'DfPLOT".
Calling Sequence:
M CALL PLOTQ
Subroutine QTOT
"F,'_is subroutine sums and returns the impressed rates to all diffusion and arithmetic nodes in a given sub-
model. This routine is handy to refit3' various heating rates such as electnc'-'l dissi_"zion.
"[)

Appendix C
Final Report from the
Laboratory for High Energy Astrophysics (LHEA)
of the
Goddard Space Flight Center

POEMS - Phase B
Final Report
Goddard Space Flight CenterDec. 16, 1994

POEMS Phase B Final Report
tutmc[ugUgn
The Goddard Space Flight Center was responsible for the design and development of the hodoscopesubsystem for the POEMS Smaller Explorer Mission. This report is a summary of technicalactivities during the Phase B study, which lasted from January 1994 through August of 1994.
POEMS was designed as a magnet spectrometer instrument for separating electrons andpositrons from ,_ 20 MeV up to _ 2 GeV. The separation is accomplished by means of apermanent magnet with a central bore through which the particles pass, and appropriatetracking detectors which determine the particle trajectory through the bore in real space. Postprocessing of the trajectory determines the curvature and hence the sign of the charge. Otherdetectors are used to separate background from protons, neutrons, pions, etc. The hodoscopedesign was baselined to have a spatial resolution of 50 microns in the bending direction(perpendicular to the B field) and 2500 microns in the orthogonal direction (parallel to the Bfield).
This document summarizes the completed detector and readout electronics design. If anotherflight opportunity were to arise for an instrument of this approximate mass and power, wewould be prepared to fabricate a hodoscope system from these designs.
PrototyBe Detector
The tracking detectors for POEMS are ion implanted silicon strip detectors (SSD's). These arefairly rugged single crystal wafers sliced from n type silicon of high resistivity. SSDs havebeen used for many years at accelerators with great success. We have endeavored in the POEMSdesign to build on this work and adapt this technology for use in space.
A single sided SSD close in design to this prototype was given to us by the Univesity of Oklahoma.In the end, it was to be the only device available to us for our electronics testing.
Specifications for POEMS Prototype
This section provides most of the detailed manufacturing and testing specifications which weredeveloped for the POEMS prototype SSDs.
SCOPE
These specifications (and NASA drawing GC 1490490) will establish the requirements fora prototype spaceflight "n" type silicon, totally depleted, ion implanted, passivated two-dimensional position sensitive detector. The detector will be square, with an active area of==26 cm 2, side length of 5.12 cm) and an active thickness of ==300 microns. This detectormust be stable, i.e. have no breakdown, when operated for long durations under spaceflight(i.e. vacuum) conditions. The term prototype is understood to mean that this detector andthe materials used shall not be tested to the rigorous enviromental limits imposed onspaceflight hardware. This detector is to be designed for proof of principle, with theunderstanding that future detectors manufactured for this project will have to meet morerigorous testing standards.

BASICDESIGNANDPOSITIONSENSING TECHNOLOGY
The detector is to be made position sensitive by using standard photolithographic
techniques for defining strips on each surface of the detector. The length of the stripsshall be selected so that the strip ends define a square area of -26 cm 2. The junction sideof the detector shall be referred to as the front, side. Likewise, the ohmic side shall bereferred to as the back side. The strips on the front side will have a width of -40 microns
with an interstrip gap of -10 microns, giving a pitch of 50 microns. The rear surfaceshall have -2460 micron wide strips with an interstrip gap of 100 microns, giving apitch of 2560 microns (2.56 mm). The manufacturer is to optimize the strip width andgap width in order to maximize the interstrip capacitance, keeping in mind the requiredminimum interstrip resistence of 1 M(3. The strips on the rear shall be orthoaonal to the
strips on the front. All strips shall have evaporated aluminum over the implanted areas tofacilitate ultrasonic wire bonding.
The front side of the detector mount will be designed to accomodate 4 SVX chips in closeproximity to the strip edges. The SVX chip inputs (128 per chip) will be wire bonded toevery_ other strip on the front side of the detector. To accomplish this, the manufacturerwill pattern onto the detector a fan-in which brings every alternate strip (100 micronpitch) down to wire bond pads at 50 micron pitch along a single edge of the detector. Eachstrip connection to the SVX chip input will be accomplished using ultrasonic wire bonding.As a minimum, 99 % of the strips shall be functionally active on the front side with thecentral 5 cm fully active. The rear side will have 10 outputs from every other strip wirebonded to pads on a side orthoaonal to the side on which the SVX chips are connected, and theother 10 outputs bonded on the opposite side. These pads connect the rear strips to theinputs of hybrid preamplifiers. The rear side must have 100 % of the strips active.
The strips on the front and back side will have an oxide covering such that they will becapacitively coupled to the SVX chip inputs and hybrid inputs, respectively. This is toensure that the normal strip leakage currents will not be seen by the SVX chip inputs.Detector biasing will be supplied thru a separate connection on the mount, and the biasingresistor network for proper detector operation will be incorporated onto the detector aspart of the photolithographic and ion implanting process.
The detector will have the following connections for proper operation using four ribboncables. A single cable to the front side SVX electronics, a connector to the back side hybridpreamplifiers, a connector to the front/back sides for the biasing and for the guard ringoperation.
DETAILED SPECIFICATIONS
• Active Area (NASA drawing GC1490490): - 26 cm2 square.(The active area is defined by the outside edges of strips 1 and 1024 on the frontside and strips 1 and 20 on the back side.)• The length of a side of the active area = 5.12 cm.• Front detector channels: 1024;• Front channel width: 40 +_1 micron;• Front channel pitch: 50 ± 1 micron;• Front interchannel gap: 10 pm _+1 llm;• Rear detector channels: 20;
2

• Rear channel width: 2460 + 1 microns;• Rear channel pitch: 2560 + 1 microns;• Rear interchannel gap: 100 I_m + 1 lug;• Front and rear interchannel gap resistance: > 1M(_;• Strips on opposite sides are to be orthogonal to < 1=.• Strips parallel to the side of the mount to < 0.5 °• Front side must have 99 % good strips and the rear side must have 100%.• Front side coupling capacitor value _ 100 pF;• Rear side coupling capacitor value _ .01/JF;• A bad__ (front side) is defined for our purposes as:
(i) having a shorted coupling capacitor, defined as notable to stand off 2 * Full Depletion Voltage;
(ii) having a leakage current > 5 nA.• A bad.=_z_ (rear side) is defined for our purposes as:
(i) having a shorted coupling capacitor, defined as notable to stand off 2. * Full Depletion Voltage;
(ii) having a leakage current > 50 hA.• Active Thickness: 300 prn +151_m.• Thickness Uniformity: < +_5 I_m.
Operating Bias: The detector's normal operating bias is expected to be 1.5 - 2.0 times the fulldepletion voltage. A separate bias contact must be available on the test fixture. Bias Voltage forFull Depletion (VD): < 25 volts.
Leakage Current (Vacuum): <1 pA at @ 20°C. The detector's leakage current must be measuredwith the detector at operating bias and in a vacuum of < 5xl 0 -6 tort for at lease 16 hours withall adjacent channels shorted together. The leakage current per strip shall be < 0.5 nA, with atypical value of approximately 0.5 nA. (junction side only)
Equivalent Noise Energy (FWHM): < 25 keV with all adjacent channels shorted together fortesting only.
Normal Operating and Test Data Temperature: 20 ° C ± 2 =C.
Detector Operating Environment_ The detector is to operate and be long term stable without anytype of breakdown over the temperature range of - 40" C to + 5" C at 1 atmosphere or in avacuum of < 5x10 -6 torr.
TEST DATA
This is the information we require the manufacturer to supply with each detector:
• Active area;• Depletion depth at operating voltage;• Detector current at operating bias using specification 4.6;• Detector current at operating bias and atmospheric pressure;• Total system noise width in keV at operating bias;• Nominal resistivity of silicon wafer;• Resistance between adjacent strips on front and rear.• The percentage of functioning strips.• 241 Am alpha particle spectrum.
3

• Capacitance vs voltage curve and data for the entire detector and for threerepresentative saps.
• Leakage current vs voltage curve and data for the entire detector and for threerepresentative strips.
• Interstrip capacitance measurement for 3 strips on thejunction side of thedetector.
MATERIALS
Detectors will be manufactured from silicon wafers manufactured to the followingminimum specifications. All other materials are required to meet NASA guidelines for spaceflight qualification.
• Material: "n" type silicon wafer;• Wafer thickness: 300 microns ± 15 microns;• Flatness: + 5 microns, measured in 5 places across the wafer;• Taper: ± 2 microns;• Finish: Lapped and etched both sides with no pits, slurry marks
scratches or microcracks.
Status of MICRON Semiconductor Order
At the start of the Phase B study, in January 1994, an order for a prototype SSDmeeting the above specifications was sent to MICRON Semiconductor Ltd. of London, England.They were known to us a vendor of reliable silicon detectors. The delivery date was May 1994,which would have given us some time to fully test the device before the end of the study phase.The cost of this prototype was _ $35000.
Unfortunately, MICRON is a very small company, and was heavily overcommitted in itswork obligations during this year. As a result, they did not deliver a prototype in 1994.Conversations with them have been strained, but they were to have as a minimum finalized thelayout design by the end of 1994. This was also not completed. As a result of their inability todeliver us a detector, we decided to seek out alternate suppliers.
Alternate Venders
CSEM
CSEM (Centre Suisse d'Electronique et de Microtechnique) is a Swiss laboratory which wasknown to be making SSDs for high energy physics projects at CERN (the European Center forNuclear Research). We contacted them in July about the POEMS prototype and provided themwith the same specifications we had supplied MICRON. They indicated they were interested inour project, and three people from the Goddard Solid State Device Development Branch visitedCSEM in August. They were very impressed with the facilities of CSEM and highly recommendedwe proceed.
In this case, we were hurt by the fact that CSEM is a very large laboratory. They subsequentlyinformed us that they would only produce detectors in batches of 25. They would not do just oneprototype device. This drove the cost up well beyond our reach, to _ $150000.
Surisys Mesures
4

Surisys Mesures is a French company which was formerly a subsidiary of INTERTECHNIQUE,which was already known to us. In November we approached Surisys Mesures about the POEMSproject. They were quite interested also, and said they would certainly do small, unique devicesas we wished. In mid November, the device specifications were sent to them for study.Currently we have not received a price quotation.
Goddard Space Flight Center
We also asked the Goddard Space Flight Center solid state device development laboratory tofabricate a prototype SSD as well. Their main emphasis in the past had been on infrared and x-ray detectors, and they in fact had little experience with silicon devices. They undertook thistask and devoted quite a bit of their own resources to this project. Starting from "ground zero"they designed and fabricated several devices for us. Unfortunately, because of inexperience infabrication and poor handling procedures, many problems were encountered (some devices werecontaminated because of a lack of surface passivation, some of the etching rates proved hard tocontrol at first, and some of the early oxides were found to be leaky). As a result, none of thesefirst SSDs met our specifications for noise performance and maximum leakage current allowed.They have very recently given us a new device which they believe has solved several of thepreceeding errors. This new device is currently under test.
Electronics Development
The silicon detectors for POEMS have a large number of readout channels on the junction side ofthe detectors (1024 per SSD) which necessitates a sophisticated readout system. Going back tothe original POEMS concept developed for the NASA EOS Mission, we elected to base our designaround the LBL developed Silicon Vertex Chip (SVX).
The POEMS Magnet Spectrometer electronics consists of eight printed circuit boards - threeHodoscope planes, an interconnecting backplane, an analog Hodoscope Controller (HC) board, adigital HC board, a Back-Side Electronics (BSE) analog board, and a BSE digital board. TheAnalog to Digital and Digital to Analog Converter circuitry is conventional in design and is notdescribed here. For more details on any aspect of the electronics, one may consult the GoddardSpace Flight Center Implementation Plan, submitted to the SMEX Project office at the end ofPhase B.
JuncUon Side Readout
The boards which house the active SSDs themselves are referred to as Hodoscope boards. TheHodoscope boards are three identical 14 layer printed circuit boards. Each of these boards holdsone 2" x 2" double-sided 300p thick detector, four full-custom SVX VLSI readout ICs for thejunction side of the detector, two custom-designed hybrids for the ohmic side readout, biascircuitry, power decoupling, and four connectors to provide the system interconnects to thebackplane.
The printed circuit board (PCB) is 3.5" x 5.1" including the area of the detector. Themaximum board height of O. 18" necessitates the use of surface mount components on this board.Due to board space limitations, the charge terminating capacitors for the hybrid are built intotwo of the internal layers of the PCB. Power and ground planes are utilized for noisesuppression and EMI control. Separating power and ground planes by only 0.005" in the boardstackup enables the planes to double as low inductance decoupling capacitors. An effort has beenmade to specify all dielectric and copper thicknesses in order to make use of microstriptechniques and maximize board performance.
5

SVX Chlp
The SVX VLSI chips are full-custom mixed signal CMOS ASICs, originally developed at theLawrence Berkeley Laboratory (LBL) for use at Collider Detector Facility (CDF) at Fermilab.Each SVX is capable of providing 128 channels of charge integration, sample and hold, andmultiplexed readout. The pitch on the inputs of the SVX chip is 48/J, ideal for the POEMSdetectors which are on a 50p pitch. Four SVX chips will be required to read out the 512channels for each of the detector planes. Each detector will have 1024 strips and every otherstrip will be read out.
The charge gain on the SVX is approximately 15mv/fC, and our design provides a dynamic rangeof up to 50 fC. The expected minimum ionizing pulse (MIP) for the POEMS SSD is 4 fC,producing a signal out of the SVX of approximately 60mV. The SVX chip has an open loop gain ofapproximately 2000 and a charge integrator feedback capacitance of 0.3 pF, providing andynamic effective input capacitance of about 600 pF. For the junction side of the POEMS SSD, itis estimated that the S/N ratio will be _ 12.
The SVX has multiple modes of operation. The data bus is bi-directional. The control signalsfor switching the SVX into various operational states and the chip id are inputs; chip id andchannel address are multiplexed out.
Each SVX is controlled via fifteen digital signals. A Field Programmable Gate Array (FPGA)directly controls thirteen of these control lines. The SVX has two write modes and two readmodes. The write modes are used to set the Neighbor Enable mode on/off, the latch direction(for collecting hole or electrons), load the chip identification, enable or disable the latch allmode, and to control the seven FET switches on each SVX linear chain. The read modes are usedto read back the latch all, neighbor enable, and latch direction status bits, and the chip andchannel identification of events over threshold. The FPGA is responsible for initializing andsynchronizing all three hodoscope planes such that the timing jitter in control signals betweenany two SVX chips in the 12 chip array is less than 1O0 ns (@10 Mhz). The FPGA ensures thatall chips are in the same part of the Reset, Integration, or Readout cycle and that the LIVE timewindow for each hodoscope plane is identical. Due to thermal, board space, and component heightrestrictions, the FPGA resides on the HC analog board and all control signals will pass throughthe backplane to get to the hodoscope board.
The SVX requires about 170 mW per chip, utilizing +6V analog and +SV digital power. Thethree planes of the POEMS Hodoscope will utilize 12 SVX chips for a total power ofapproximately 2 watts. It is intended that the SVX die will be mounted on the hodoscope board byusing flip-chip technology, i.e. mounting the chip upside-down and attaching the die directly tothe detector surface via indium bumps. The detector mask has been modified such that themetallization of the detector strips is an exact match to the mirror-image of the SVX bond pads.The indium bump bonding technique is a low temperature (90°C), low inductance/impedance,high reliability method of attaching a bare die. After bump bonding, and testing the bonds forcontinuity, the array of indium bumps will be back filled with a low viscosity epoxy tomechanically stabilize the bonds. This epoxy fills the micro-fractures in the bumps andprevents outgassing. The yield is nearly 100% for this process.
FPGA Controller Design
The SVX controller is implemented as a complex state machine in a field programmable gatearray (FPGA). This logic section is responsible for initializing the SVX array with the properchip identifications and configuring each chip to the proper readout mode. Event collection ispossible once chip initialization is complete. During operation, the FPGA selects from severaldifferent SVX modes - Master Reset (MR), Threshold/Calibration (TC), Partial Analog Reset
6

(PR), Event Integration (El), and Readout (RO). Each of these modes requires several steps andbranching logic. The state machine controller incorporates multiple commandable timers insidethe FPGA to allow programmable state durations. Using a 10 MHz clock, these durations can becommanded in discrete intervals of lO0ns.
The SVX controller is designed to read in initial setup parameters from a PROM on a power upreset. Once the controller is loaded, it waits to be enabled by an initialization routine. Whenenabled, the FPGA initializes each chip in the SVX array and then is ready for operation. TheSVX controller starts with a MR of the SVX chips. This involves several steps to clear theintegration capacitor, coupling capacitor, hold capacitor, threshold capacitor, and D-latch foreach channel. After each capacitor is zeroed out, the system is put in a mode to accept acalibration/threshold pulse. Nominally, the threshold will be equivalent to about 1.5 fC. Whenthe calibration threshold has been acquired, a PR is done. At the conclusion of the PR, thesystem is configured to the event integration mode. If a trigger occurs during event integration,then the chip array is read out via the RO cycle. If no trigger occurs, the system is reset, eithervia a PR or MR cycle.
In addition to the SVX control functions, the FPGA controls bus arbitration, ADC conversion andPulse Height Amplitude (PHA) transmission, Priority In/Priority Out control, auto calibrationmode, and the =LIVE" and Trigger handlers.
In the designed operational mode, the SVX chips are daisy chained together with the Priority In(PI) and Priority Out (PO) controls. In the POEMS hodoscope, all the PI and PO signals arebrought out to the FPGA controller. In the event of a SVX chip malfunction, the HC boards allowthis chip to be removed from the logic chain. In this mode, the failure of one chip will notdisable the hodoscope.
The FPGAs to be used for flight are PROM based, i.e., they can be reprogrammed while in thecircuit board. This is accomplished either by reloading the data from the on-board PROM or byground command. It is not necessary to remove the chips from the board to accomplish thisreprogramming. Thus, no additional enviromental testing will be required if a reprogrammingoperation is performed. This reprogramming would only be done in flight if a well identifiedproblem occured in the FPGA chip.
Ohmic Side Readout
Resistor Divider Concept
When we began the Phase B study, we began with the concept of interconnecting the 20 ohmicside strips with individual resistors and having a single readout channel from each end of thedetector. We had used this successfully on past detectors for heavy particles. Early onhowever, our simulations showed that the resistors contributed much more noise than wastolerable for a Minimum Ionizing Particle(MIP) such as an electron. We then had to devise analternative scheme, in which we read out every strip separately. This complicated the designdrastically, since it meant a 1O-fold increase in the number of readout channels.
Single Strip Readout
In the current design, each ohmic strip will be connected to a charge-sensitive preamplifierwith a conversion gain of O.45V/pC. Each preamplifier will have a feedback capacitance of2.2pF and an open-loop gain of 2500, giving an effective input capacitance of 5.SnF. Thepreamplifiers will be implemented as hybrid microelectronic circuits. Each hybrid packagewill contain ten separate preamplifiers. Thus, six such packages will be required (two for each
7

detector). These packages will be mounted directly on the Hodoscope Boards adjacent to thedetectors.
The 60 preamplifier outputs will be sent to the BSE Analog Board, and each will be input to ashaping amplifier. The shaping amplifier will have a shaping time constant of l psec. It willproduce a unipolar pulse that peaks at 2psec and returns to within 1% of baseline in lOpsec.The shaping amplifier will have a pulse gain of 110. Thus, the overall conversion gain of thepreamplifier and shaping amplifier will be 0.50V/pC. A full-sGale input of 20fC will preduae 01V pulse out of the shsplng amplifier. As with the preamplifier=, the sh|plng amplifiers willalso be implemented as hybrid microelectronic circuits, with ten shaping amplifiers perpackage. Six such packages will be required.
The 60 shaping amplifier outputs will each be sent to a low-level discriminator on the BSEDigital Board and to a peak-hold circuit on the BSE Analog Board. The discriminators will beused to determine which strip on each detector received the charge from an event. The peak-holds will be used to hold the peaks of the shaped pulses in order to measure the height of thepulses and thus determine the amount of charge deposited on each detector strip. The peak-holdswill be implemented as hybrid microelectronic circuits, with ten peak-holds per package. Sixsuch packages will be required.
The discriminator outputs will be sent to rate counters on the BSE Digital Board in order todetermine the event rate. The rate counting scheme is TBD. The peak-hold outputs will bemultiplexed to a 12-bit analog-to-digital converter (ADC) on the BSE Digital Board forsequential conversion to digital. For each event, only the channels (detector strips) whichreceive charge will be converted.
Hybrid Electronics
Because of the large number of readout channels, the small weight allowance for the hodoscopeelectronics, and the desire to keep all electronics near the detector, it was decided to implementthe preamplifiers, shaping amplifiers, and discriminators in hybrid technology rather thandiscrete components. This allows us to place the preamplifiers directly by the SSD and saves asignificant amount of board space. Prototype hybrids were designed and ordered from acommercial vendor. These are expected to arrive at the end of the year.
Command and Telemetry interface
The HC Digital board consists of a command processor, a telemetry processor, differentialdrivers for telemetry, differential receivers for commands, Event SRAM, Command SRAM andPROM, interface logic for handshaking with the BSE, a commandable oscillator, testJdiagnosticlogic, and digital signal buffering.
The command processor will communicate to the Saclay digital electronics via a differentialdriver/receiver pair. The digital electronics will provide a command envelope, the commandclock, and command data at 10 KHz. Commands will be 16 bits in length with 8 bits of addressand 8 bits of data. This provides the four Hodoscope Controller boards with up to 256commands. The Saclay digital electronics will provide the command envelope which theHodoscope Controller digital board will use to latch and begin execution of the command. TheCommand processor will store the complete status of the Hodoscope in the command SRAM. Thecontents of this SRAM can be inserted in the telemetry stream by ground command to verify thestatus of the instrument. When the instrument is initially powered on, the command processorwill initialize all necessary Hodoscope parameters using the contents of the command PROM.
8
The command processor FPGA will be responsible for arbitrating both the command and eventbusses.
PHA and rate data from the BSE will pass through the Hodoscope Controller and use the 10 KHzcommand clock to shift out the data bits. The Saclay digital electronics will control the rateenvelope, which will stimulate the BSE to send rate data. The Hodoscope Controller digital boardwill provide the differential receiver/driver interface from Saclay to the BSE boards.
The telemetry processor will receive data from the SVX controller FPGA on the analog board (hitid, chip id, and analog status), the ADC (pulse height data), and diagnostic data. This data will bereceived in parallel and inserted into telemetry packets consisting of 12 bit words. Thetelemetry processor will generate a 1 HHz clock from the on-board oscillator and use it to shiftout telemetry data bits. A telemetry envelope will be generated to notify the Saclay digitalelectronics that data is available. The Saclay digital unit will use the trailing edge of this signalto latch the telemetry word. The serial clock, data, and envelope signals will be transmitted tothe Saclay box via differential drivers.
The digital board will require about 175 mW for the differential drivers and receivers, 275mW for the SRAM and PROM, 125 mW for the FPGAs, and 25 mW for signal buffering. The totalpower required for the digital board is estimated at 600 mW.
Digital signals passing between Hodoscope Controller boards will be buffered and slew ratelimited to reduce ringing and crosstalk. The connector pinouts of the four Hodoscope Controllerboards (2 junction side controller, 2 ohmic side controller) will be integrated such that thefour boards can be stacked in any order, facilitating the test and troubleshooting of the unit.
System Deslan and TQsIIno
Early on, once our designs had progressed a certain amount, we made a breadboard pc of thehodoscope controller circuitry. It was not intended as a flight prototype (it was a simplierdesign and not packaged as a flight unit), but was quicker to implement. It enabled us to test thesystem concept, the controller operation, and assess noise problems. Further, we were able tostudy the SVX "live time" by varying the controller acquisition time window and measuring therate of increase of the system noise.
We discovered fairly quickly that the SVX chip analog output is quite susceptible to digital noise,especially on the digital power supply lines. The reason for this is that the digital power inputpad is directly adjacent to the analog output pad, with no separation or shielding in betweenthem. Other problems were discovered between the optical interface link connecting to the dataacquisition PC. Excessive current flow between the FIFO's and the optical interface were leadingto noise glitches which in turn were affecting the control circuitry. This was remedied by amodification to the optical interface.
We first studied the system noise and behavior with no detector bonded to the SVX inputs. Wemeasured the channel to channel variations in the pedestals with various integration times andlevels of injected charge. For a 5 psec integration time the mean pedestal was seen to be 2.325Volts with a sigma of 0.0046 Volts - 4.6 mV. The sigma for112 of the 128 channels was lessthan 0.3%, while for the remaining 16 channels the variations ranged up to _ 1%. It was seenthat these large sigmas were coming from every other channel for channel numbers above 80.This peculiar behavior was traced to the digital section of the PCDAQ.
9

Using our AC coupled prototype detector, we next allowed the integration time to vary between500 nsec and 25 psec in order to find the operation point with the largest system live time.From 1 psec out to 25 psec, our measurements showed an almost linear rise in the FWHM of theinjected signal from roughly 15 keV up to almost 35 keV. With the signal from 1 MIP being -100 keV, even 15 keV (a -7:1 S/N ratio) is marginal. However we were faidy confident thatan improved board layout with additional filtering and an improved interface could reduce thenoise at least another 30%. Some simple improvements yielded a level around 10 keV at 5/Jsec.This is about the highest acceptable noise level so we felt comfortable accepting 5 psec as ourbaseline integration window time. We calculated this would lead to a system live time of - 80%.
Finally we made a series of test with different levels of injected charge at the front end of theSVX chip. The levels ranged from 1 fC up to 20 fC (1 MIP = 4 fC of charge). At a level of 4 fC,the charge resolution was measured to be - 5% and at 8 fC - 2 %. At the highest charge level anonlinear behavior was observed in the SVX response. This is not surprising as this chip wasnot designed for a large dynamic range. However this does show that for the POEMS experiment,the dynamic range is quite suficient.
At the time the project was cancelled, we had placed orders for the hodoscope boards and thehybrid preamplifiers. The hodoscope boards arrived about a month late, not until September,and the manufacturer did not supply all the required test documentation. Thus we were forced tosend the boards back for re-testing. The hybrid preamplifiers were supposed to arrive in earlyDecember, but have not yet in fact arrived. We have on hand currently enough parts to populatetwo full hodoscope boards. We will certainly completely assemble and test one board for a proofof principle.
Power SuDolles
Goddard also performed a study of the POEMS power supply requirements. We polled theelectronics groups for specifications which we built into a requirements table. We alsoproposed a power distribution scheme for the instrument.
Mechanical Deslan
The main mechanical structure was the Chicago responsibility for the SMEX POEMS. Thehodoscope boards however by their very nature must be in close proximity to, or mounted ontothe magnet itself. Further, the SSDs need to be in a purged, light tight enclosure. Themechanical design of the hodoscope board mounting is then intimiately tied to the assembly andmounting of the magnet. The magnet is a split dipole, with each of the halves consisting of 6segments. Once magnetized, these segments will want to repel each other with a substantialforce. Thus the structure to hold the magnet assembly together must be carefully considered. It.was also desired to be able to remove one of the hodoscope planes easily if a problem developed.
Goddard took the lead in designing endcaps into which the magnet segments could fit, and intowhich slots were machined. These slots have rails which allow the hodoscope boards, withmatching rails, to slide into position into the magnet bore. The entire assembly is drawntogether by four threaded rods that run the entire length of the magnet. A simple box is mountedon one side and into which the hodoscope electronics fits. The entire magnet-hodoscopeassembly, when assembled, is a single integrated unit which is ready to be itself integrated ontothe spacecraft deck.
10

i

°l s>
I
Z0
b-
II II III
ILl0


The SVX channel by channel mean (Pchannel) for 1O0 events with no injected charge.
BVX Output, 6.0 I_m T,._ No CRI Pulpy
i
f i
0I _ , = I i q = i i I . i t = T . I
20 40 80 dl0 100 120
1412
,o
8
4
2
0
Channel Numl_er
. I , , I _ t '2.2S 2.3 2.36 2.4 2.46
_m c¢#_rl_JF_m = umP_f.4Pi
Jll'il I } = , l T I T
14Cl,. _ 8 VX PMI_ Height (Vote)
12

The SVX channel by channel standard deviations for 1 O0 events with no injected charge.
8VX Oulput. 6.0 _J Ti, _ No Cal Pu/R.e
_ 0.012
0.01 _.
_ 0.0000.000
" . " . " . "0.004
v
o 00 ,_ .o i,o_ ,oo ,_oChannel Numl_r
88 -'- ==._ = *J=,p
M_ a. _Lw_Lr.de =: iD.f a_E,,oe
20
7E
1oE _ 1
o _,'-_'1, _ , _t ;'_N ,_,_ _ , _, _ ....
0.002 0.004 0.00° 0.0041 0.01 0.012
o o_,,,, _ 8VX Pul_ Height (VOW,)
13

The electronics noise in keY as a function of event integration time using the single sided POEMS
prototype detector.
FWHM (keY)
o o <_o X
u1
,.-I
¢D
o30
f/I
¢D
o._.
w
roo
f_C_
I l
! , | ;
ZOD.
C
3
n.
O
"Om
P,D
O
14

The SVX channel by channel mean and standard deviation as a function of injected charge for a 10psec integration time.
8VX Output, DAC,28 -cz fC. p_d;mt_ls ve In_r_d ChRrge. Tj,_--IO _o
_-- ¥ 1" o=X "t" CI |
0.3, _ X'-0.200036 J
t'
E • deg of _do.,0.3 _- a I _"0.00104711P
"/- 0.00,02676 J _
o.=s F" *z" o.o,s,s2e /-
0.2
0.18
0.1
0.08
I I I2.8 8 7.6 ,0 12.8 16 17.8 20 22.6 26
0.007O.OOe
0.002
0.002
r_
0.001LI,,,lltTr I . .T . I , i I t r = . I r = i r t
2.8 8 7,8 10 12.8
In_ol_d ChRrge (fC)
I
• * t I I I18 17.8 20
i r '22.8 28
In_obd Chsrgo (fC)
15

The SVX charge resolution as a function of injected charge for an integration time of 10 psec.
SVX Oufput, DAC128 -a fC -p_dimtal, vs Inpotod Chm_, T,=p10 pNo
_ 0.225
0.2
0.171
i 0.18
0.128
0.1 i
0.076
0.06
,I, ,I, ,
2.1 8 7.8, _ I 12 , , , , , , Ii I ,
10 12.6 16 17.6 20 22.6 26
i 0.18
0.14
0.12
0.1
0.080.0_
0.04
0.02
In_ohPd Chmrge (fC
¢¢ 0
"1 _ I ' " I I V t i I I I ' I I
2.8 8 7.8 10
? ? ot I }l ' t x I I _ I n@; ' _ I T T
12.6 16 17.6 20 22.6 26
in]oo_d Chm_g* (fC)
16
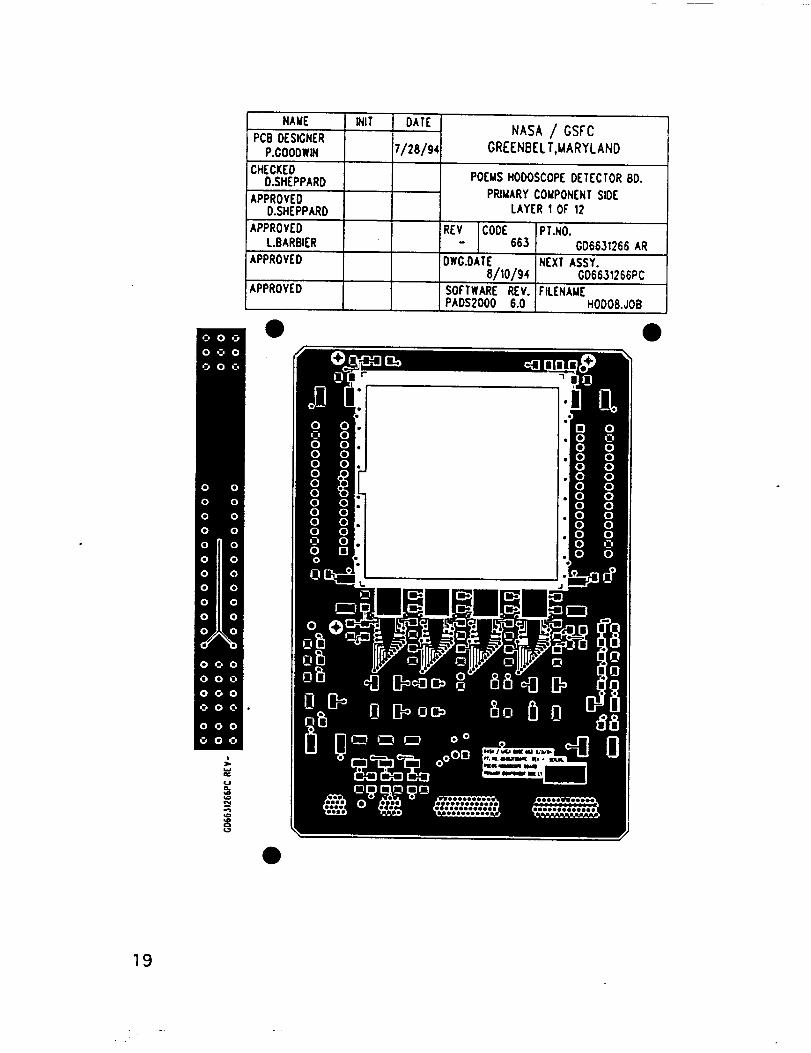
NAME
PCBDESIGNERP.GOODWIN
CHECKEDD.SHEPPARD
APPROVEDD.SHEPPARD
APPROVEDL.BARBIER
APPROVED
APPROVED
0
INtT DATE
7/zs/9_NASA / GSFC
GREENBELT.MARYLAND
POEMS HOOOSCOPE DETECTOR 80,
PRIMARY COMPONENT SIDE
LAYER I OF 12
REV ICODE PT.NO.
- ] 663 GD6631266ARDwG.DATE NEXT ASSY.
8/10/94 006631266PCSOFT'WAREREV. FILENAMEPADS2000 6.0 HODOS.JOB
0
0
19

2O
\
\
!i
0
0
0
1 |
m
! I
0

L_
e
V
|
_'"4
21

22
°
0
0 --:
0
/- //
.--I
oz
c'_
--I
0
l/o_-
m
z
o

Appendix D
Final Report from the
University of Arizona
SMEX/POEMS
Phase I Final Report(Submitted to Bartol Research Institute)
Jokipii attended two meetings of the SMEX team and developed computer modeling and
presentation materials to be used by the project.
He attended the meeting held in Greenbelt, Maryland on February 8-11, 1994. At this meeting
he contributed to the discussions regarding the strategy of the observational program and to the
various theoretical issues which arose during the discussion.
He also attended the team meeting at Kiel, Germany, on June 18-25, 1994, at which he
contributed further to the observational strategy and provided other information.
Jokipii developed computer routines which illustrated the various expected electron and
positron observational parameters, based on the most recent theoretical models. These were
used both to plan observational strategies and to make presentation materials.
Work was initiated on a publication of some of the simulations jointly with Wefel and Guzikof LSU.
University of ArizonaDecember 1994

Appendix E
Final Presentation to
the Associate Administrator for the
Office of Space Science at NASA Headquarters.
C/)
IiiC)°
0llmm
ir-
e-0km
£,I
m
l.IJ
0
0n
• mm
*i°
_ o.
x _IJJ
o.
mmm
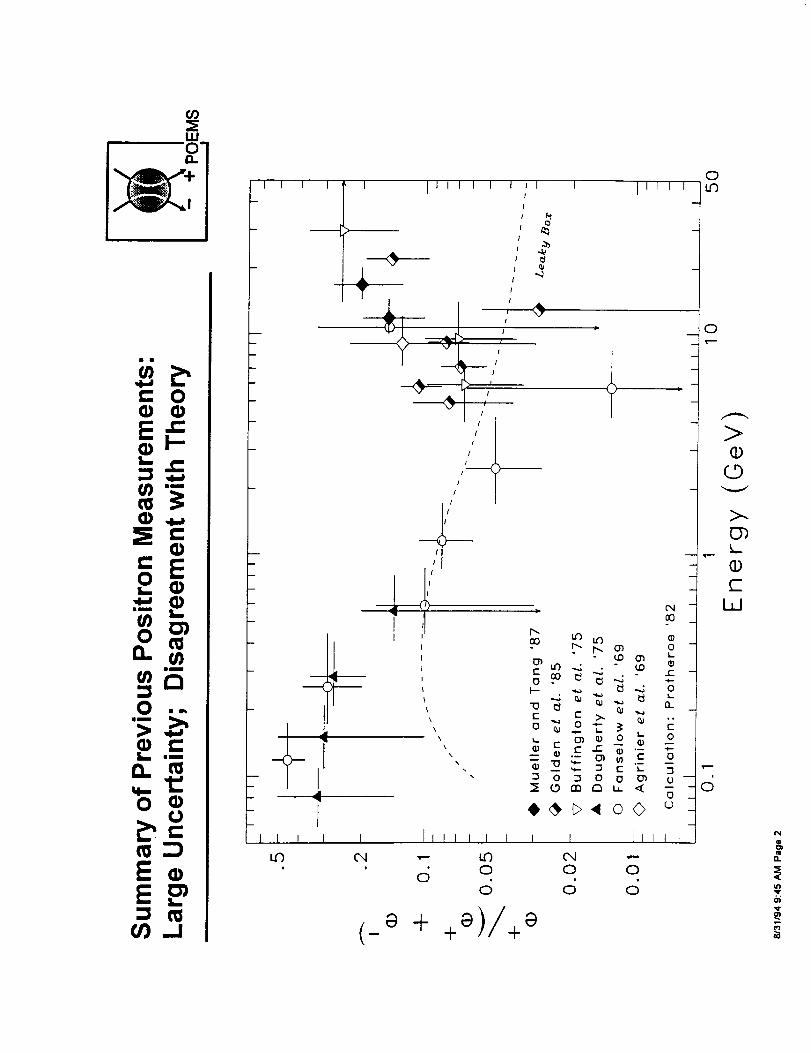
O"
I. e"
o
0
E_m
0
_._-_.-
_>4 00
{ { |{I I {!,• ' C) 0 0 0
6 o 6
( a + +a}/+a
N
O

m m
2_
WW
U
O_ mm
@

l o-re
C
o I_C1 (/).__ O
_ mLuE0"_no.
G.

I.I.I0 o
ol.IJllii
0-,I
0._,
I/)
0
,,, ,, , l,I,ll I, , ]""I'' ' "_' .-_"'
i_ ,i'_
0") _. y,.l
/If -
I,(./) ,"
m
if ,"'
,,,ll I J IiJiill.i i
i i
111 ] I I l
I
0
E
I,I
, I,,,, I , , , ©
I I
© ©
Aa -Js- s- Luo/a&

O"
mm
2O.
_o
0_:a.O
_.__._ e _-e
O.
o

U)
rl
.. C)
(11"0 U')0 (I)5_I., q"
_mo
u),__
r,) (,,)(I) .i-I
£'I 0,)r,,
U) -,-'(I) U)
am
0
I I I I I I [ I I
i T i; ' O0
_;'7 -_
,,,_ - i _
- _>-'",_,_ _ O!0 w Z o _0
C n Z _ _ o a__2 r-I I 12 o_ ,..-
I 1 I I I I I I 1t/3
(0es--_e_s-_t-u)/(N/AeF'l cj6-O/)ell1,
M:)
;0
k_
g-
00
ooo?_
I
gk_
"6(D
W
0
<
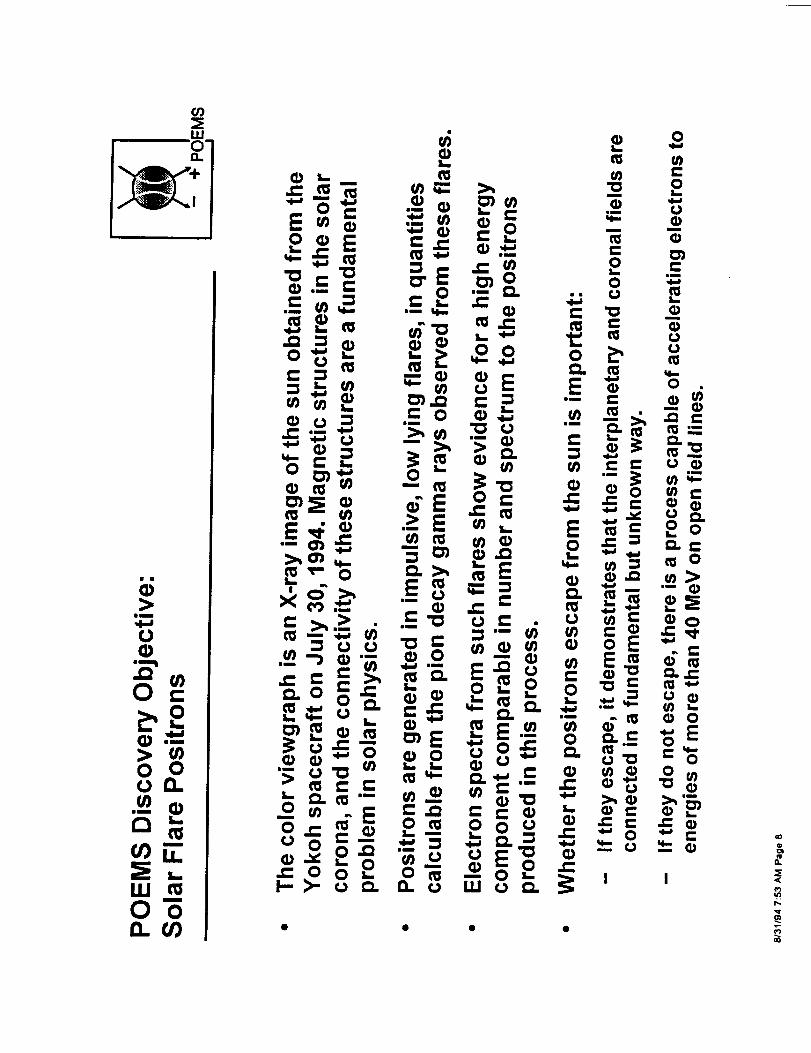
o-
i 1
•-_ •
_U,,
1
0 o
o
<

m
U._".4..4
i3: "0
t_ Q.
I. C:o
m
0
0
Q-e_
r" ,_0"-.,Cr_
•,.,.., s_
u.l_
c_L_
0
I,
I--
oC_
©C
,t , l'""" ' I"""' ' I"'"" ' I"""' ' i ''''''_ ' I"""' ' I"""' ' I"""' ' l'"'" ' I"""
I w,- "--i,i __l _-i,i DO I
--@_ 0
ii
i
/Jj_
I i
.. @.Q.I.f
/
i i I........ [........ I ........ L....... I........ _J....... [........ ]........ 1........ I......
0 0 0 0 ,-- T O io io io Io
__(AalAI s Js LUO) _!sua_ul
0,r---
0
o>q)
F
,_ (-q)
Fo
I0
c_

O3
,,=,'nO"
i
i8
LU0Q.
0
<
.°

CO
m
i8
IUO13..
.o
.__c_= _-_
_E
m o _ _o _e-
_= 0 _ e_ __._
=o _.°
0
>___.=_ oo
I.-- = ¢n o ,,_ _ E n. _
0
@

(0
LLIO"n
C0
I II I I I I I
0if)
@
0.
<

O0
1U0n
@

&
,°

i,iO"
A
o
12,0
\,
\\
\\
E0
o o
fill[Lllil]
n
\
r- _-
E E
v
o o
m 1mOl o_
o o
o oOl °l
V
a
&
r,.

CO
O"
A
E_0 •LO
0
½
II .............L.............
)00oeoo c_ooec
o
0-
ai

WO"
o_U
0
0
0
ILl
__o_
o
O.
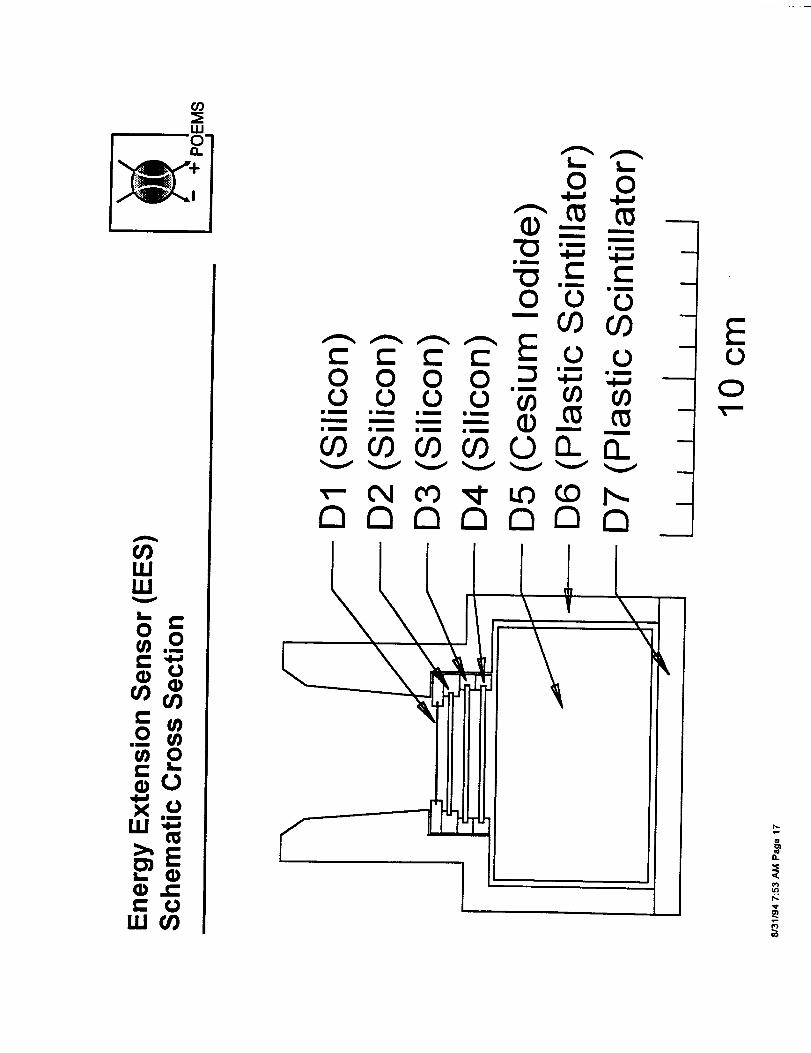
O o
A
C
C '-
X
I1) ,,C
O O OO O O
im im sm
is |m
L_ L_
O O
i
,4==a
_==a
m
m
im
_.c co o "G--0909
c- _ O OO _ _ _
O9O9OOO90O_O_V V V V V V V
v- CY cO ,_" tO _O r,,.C7 C7 r7 a r7 r7 r7
EO
O
O.
<[
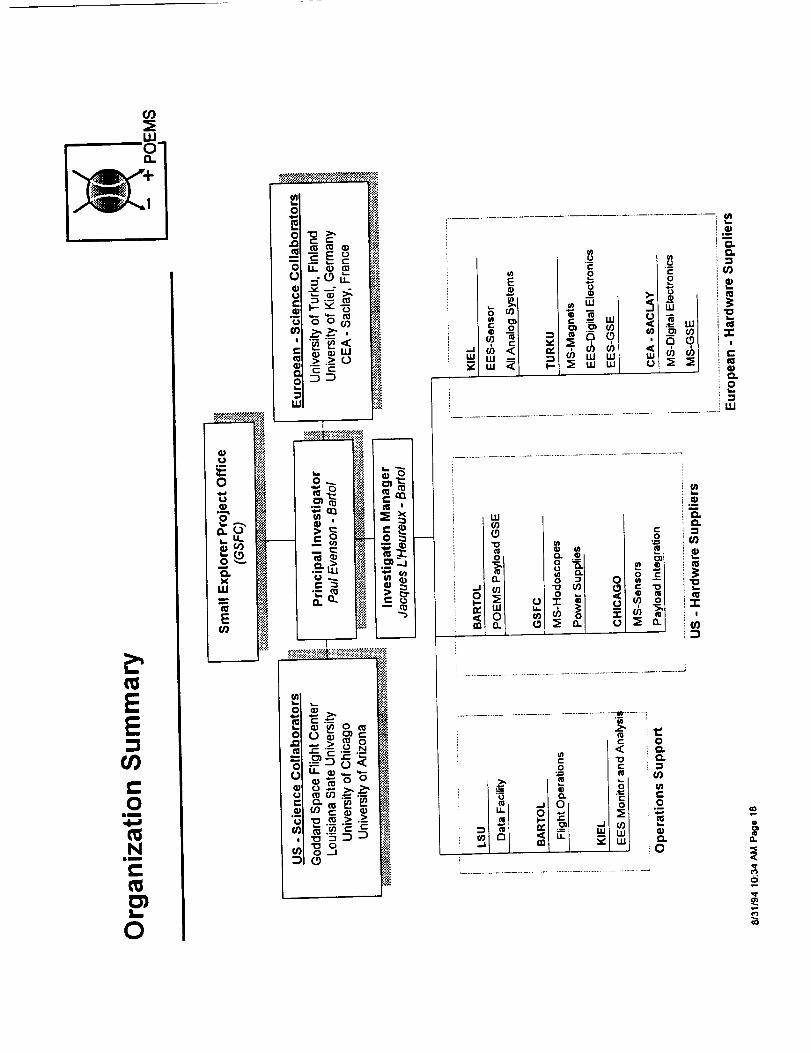
(/)
Q.
E
C0
immll
,i-a
I_
0
I "L,/ °1 Io_ _ _ i®i _I_o _ _, i_.
| _1...., w >" m,/ _1
! _1_ o_ _i _ /_ o_1 I_ _ _1 ._1_ ,,,I/ _,I_?, _I _ /_, =1 _1_ , ,I /o o/ ,/ 1 _ r_ < _
•11=._ .-->eI110 ! i 1,1.1 ILl -- ::) (/) UJ UJ ILl v_ i.I I:['- E_/ _ _ i , , , • " '
_';_""_ _.,....:._ '' __
0 il_1 _ '®
i if) i e_
_° _1- o ,=
:', ._'_ I i 0 o _. _ w m i m
_.:-:.:.
.................................................................................... --J
I/)o_g'e--__ ,
,_J
Inco
i
E<
0/!w
L_ ....................................................................
0
e-oo_
0<

uJ

(l)
1.1.1
o-
c_
C:
o_
>,_(_
Eoo_ (1)
>',o
E_
<
m_>,_
E_II<o
(/)<
,I
I "°_>,_
ILl -Q _
>, E_
E_ _
t_
<
o
O.

(0
2"
1
o,,=,._c
Ill
Ill0n
z< _ __ _
•_'_ =_ o°
S l[ S _ _ X S
l(_' I I, Z I , , , !11_1 , I , _u. _ _

CO
L_
o
0
CD
cD,m
¢D
0")
000
t-O
EE0
0
¢,0
<
o
n
.m.t'_

(r)
01
I,.i
E0
U)
(D
O'J
e-0I.-
(..1(D
iiii
ILl
C:0If.
.4--,
U)0a..
imi
ill
m
a.
.<

(/3
i
_ m
.__ c:
0_n_
<
.m.

I.I.IO"
I,=,
0")
0I
I.I=
CIi
0L_
11.
i&l
Mq
•'= _.fJJ
Wml
o_ .,.,_,._ _
... _g
0
o _
o
0
g.

O_
LU'0"n
Et_L_t_t_
C_
C:G)
EL_
C:
L___
r,_
0
r_
!
_J
0
!......... I
I...... -i
Z@
_-_.., _,
e_
(0
g.

f,O
O"
{#
8=E
m

WO oDR
nO
014m
_J"o
m
c_
W._JW
c_
o°_j
_ W
O w 0
_w_oo

o-
=!UJ
o
0
io_.
o
w_.
i = =II• I " I
• . _
0

CI)
WO"
O
m
(J
0
EImm
C2.
E
0
Q.
:E,<

0'-'
_>-oLL.
LI.I_O'-
UJ :__ro_
_o

09
kUO"
(D
.Ca.i_
O
m
00 O
O O
(J°_
_J
O
°_
°_
f-
oN"E-
O
°_
°_
m
_- L
"_ "_
O
U..
CJ L
"O"t3O(.9
(g
rn
OO
C_OO
cOe}
A
T"
.m
LU
Oo
OOO
O
@
,:[

0 o
1
1l
L.. _.
_-J m
LU_L_
oe.-
m_.1
"Ee- ,_.0 v
°--
E
¢.-o
°--
°--
1.1_
E
v
e-
°--
111121
00
liii_ 0
_,iiiiiiii_i N
8 _
uI
o 0
N o
t0
• 0
t',,-

rn
0
a.
mm
m
Q_._J
a.

WO"
O.I.__
00
E
(/)
@

Form ApprovedREPORT DOCUMENTATION PAGE oMeNo,o7o4-o188
Public reporting burden for this collection of information is estimated to average 1 hour per response, including the time for reviewing instructions, searching existing data sources, gathering
and maintaining the data needed, and completing and reviewing the collection of information. Send comments regarding this burden estimate or any other aspect of this collection of
information, including suggestions for reducing this burden, to Washington Headquarters Services, Directorate for Information Operations and Reports, 1215 Jefferson Davis Highway, Suite
1204, Arlin_lton, VA 22202-4302, and to the Office of Mana_lement and Budget, Paperwork Reduction Proiect 10704-0188/. Washin_lton, DC 20503.
1. AGENCY USE ONLY (Leave blank) 2. REPORT DATE 3. REPORT TYPE AND DATES COVEREDJanuary 1995 Contractor Report
4. TITLE AND SUBTITLE 5. FUNDING NUMBERS
Small Explorer POsitron Electron Magnet Spectrometer (POEMS)--
Phase I Final Report
6. AUTHOR(S)
Jacques L'Heureux, Instrument Manager
Paul A. Evenson, Principal Investigator
7. PERFORMING ORGANIZATION NAME(S) AND ADDRESS(ES)
Bartol Research Institute
University of Delaware
Newark, DE 19716
9. SPONSORING/MONITORING AGENCY NAME(S) AND ADDRESS(ES)
NASA Aeronautics and Space Administration
Washington, D.C. 20546-0001
Code 740.4
NAS5-38098
8. PERFORMING ORGANIZATIONREPORT NUMBER
CR-189429
10. SPONSORING/MONITORINGAGENCY REPORT NUMBER
11. SUPPLEMENTARYNOTES
Technical Monitor: R. Aleman, Code 740.4
12a. DISTRIBUTION/AVAILABILITY STATEMENT
Unclassified-Unlimited
Subject Category: 35
Report available from the NASA Center for AeroSpace Information,
800 Elkridge Landing Road, Linthicum Heights, MD 21090; (301) 621-0390.
13. ABSTRACT (Maximum200 words)
12b. DISTRIBUTION CODE
This report covers the activities of Louisiana State University (LSU) under subcontract 26053-EX between LSU and
the Bartol Research Institute (Bartol), which began January 1, 1994. The purpose of this subcontract was for LSU to
participate in and support Bartol in the work to define the SMEX/POEMS spaceflight mission under NASA Contract
NAS5-38089 between NASA and Bartol.
The conclusions of this study were that for a 1998 launch into a 600kin altitude, 98 °, approximately sun synchro-
nous orbit, (a) the total radiation dose would be typically a few k-rad per year, certainly < 20 k-rad per year for the antici-
pated shielding and potential solar flare environment, (b) detector counting rates would be dominated by the South Atlantic
Anomaly (SAA) and the horns of the Van Allen berlts, (c) the galactic electron and positron "signal" can be extracted from
the albedo background and the trapped populations by detailed evaluation of the geomagnetic transmission function (cut-off)
for each event, (d) POEMS could make significant contributions to magnetospheric science if sufficient downlink capacity
were provided and (e) a fully functioning, cost efficient, data processing and analysis facility design was developed for the
mission. Overall, POEMS was found to be a relatively simple experiment to manifest, operate and analyze and had potential
for fundamental new discoveries in cosmic, heliospheric, solar and magnetospheric science.
14. SUBJECT TERMS
POEMS, SAA, SMEX
17. SECURITY CLASSIFICATIONOF REPORT
18.SECURITY CLASSIRCATIONOF THIS PAGE
19. SECURITY CLASSIRCATIONOF ABSTRACT
Unclassified Unclassified
15. NUMBER OF PAGES
14_inel nnn_nd16. PRICE CODE
20. LIMITATION OF ABSTRACT
UnlimitedUnclassifiedNSN 7540-01-280-5500 Standard Form 298 (Rev. 2-89)
Prescribed by ANSI Std. 239-18. 298-102