SMALL CAP M&A REVIEW -...
25
SMALL CAP M&A REVIEW FINANCIAL ADVISORS First Half 2018 REUTERS / Pascal Rossignol
-
Upload
trinhxuyen -
Category
Documents
-
view
214 -
download
0
Transcript of SMALL CAP M&A REVIEW -...

SMALL CAP M&A REVIEW FINANCIAL ADVISORS First Half 2018
REUTERS / Pascal Rossignol

15
16
17
18
11
12
13
14
1
2
European Involvement Small Cap Rankings (MM3a)
19
German Involvement Small Cap Rankings (MM6a)
Italian Involvement Small Cap Rankings (MM7a)
Spanish Involvement Small Cap Rankings (MM8a)
Benelux Involvement Small Cap Rankings (MM10a)
Hochinma Involvement Small Cap Rankings (MM13a)
10
Indian Involvement Small Cap Rankings (MM21a)
Australia/New Zealand Involvement Small Cap Rankings (MM11a)
First Half 2018 | Mergers & Acquisitions | Financial Advisors
Small Cap M&A Review
Table of Contents
Worldwide Small Cap M&A Deals Intelligence
Worldwide Small Cap Rankings (MM1a)
US Target Small Cap Rankings (MM2a) 3
Canadian Involvement Small Cap Rankings (MM22a)
Hong Kong Involvement Small Cap Rankings (MM12a)
Singapore Involvement Small Cap Rankings (MM14a)
4
22
UK Involvement Small Cap Rankings (MM4a)
French Involvement Small Cap Rankings (MM5a)
Nordic Involvement Small Cap Rankings (MM9a)
Ranking Criteria Summary
Eastern Europe Involvement Small Cap Rankings (MM16a)
20
Latin America Involvement Small Cap Rankings (MM17a) 5
Japanese Involvement Small Cap Rankings (MM15a)
21
https://www.thomsonone.com
6
7
8
9
Chinese Involvement Small Cap Rankings (MM20a)
Jan 1 - Jun 30
WorldwideAmericas
United States of America
Worldwide Small-Cap M&A up to US$50m by Rank Value Range
122 -31.6 ▼
Worldwide announced Small-Cap M&A deals valued up to $50 million (including undisclosed value deals) totaled
US$82.5 billion in the first half of 2018 – a 2% decrease year-on-year.
The Asia-Pacific (ex Central Asia) region (by target domicile) led the Small-Cap market, with US$41 billion of
announced deal activity.
Americas (by target domicile) led the market in the number of deals announced, with 6,984 transactions for the first half
of 2018, representing 34.5% of the 20,326 deals announced worldwide.
The High Technology sector captured 19% of total announced Small-Cap value deals, followed by Industrials and Real
Estate, each respectively registering 11.9% and 10.6% of the overall market.
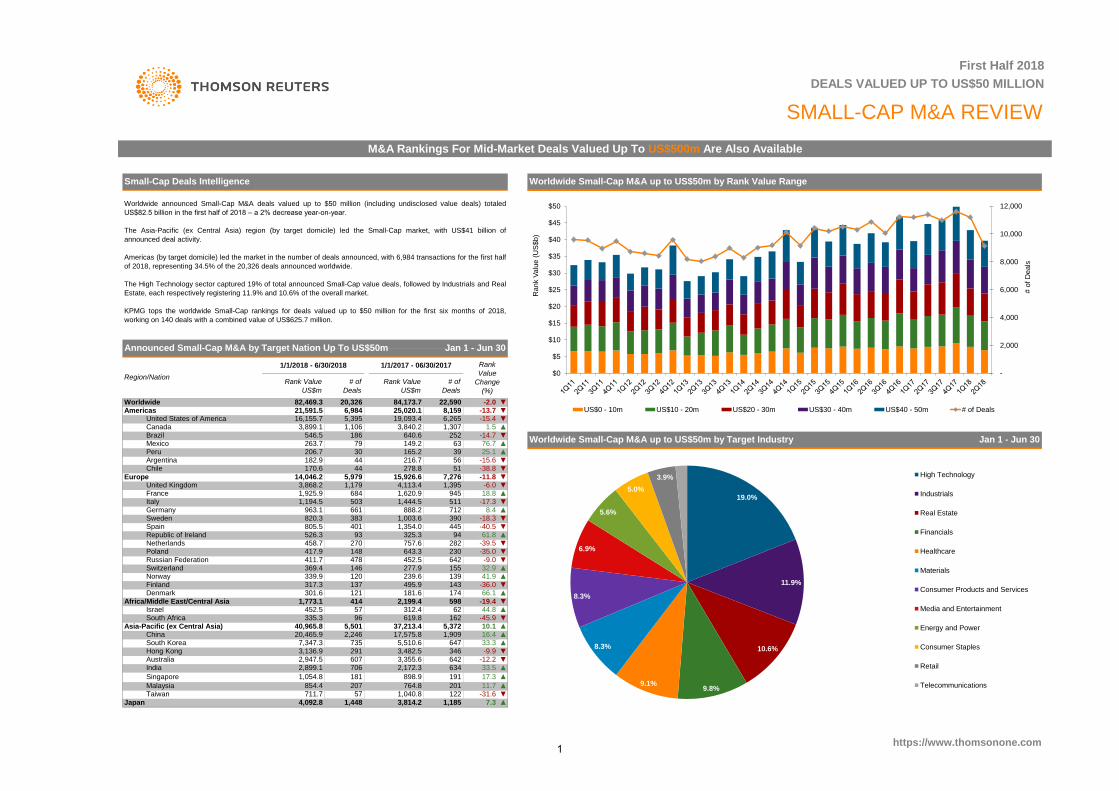
KPMG tops the worldwide Small-Cap rankings for deals valued up to $50 million for the first six months of 2018,
working on 140 deals with a combined value of US$625.7 million.
Worldwide Small-Cap M&A up to US$50m by Target Industry
▲
▲
Asia-Pacific (ex Central Asia) 10.1▼
Peru
640.6149.2
China
Africa/Middle East/Central Asia
40,965.8
335.3452.5Israel 57
Mexico
3,899.1Canada
263.7
6,984
546.5Brazil
16,155.7
▲
Denmark
Small-Cap Deals Intelligence
Argentina 182.9 44 216.7 56
25,020.1
Rank Value
US$m
South Africa
417.9
137
369.4 146
5,501
96
https://www.thomsonone.com
Germany
526.3270
Republic of Ireland
411.7
383401
Poland
Chile 170.6
Italy
30
1,17914,046.2
6841,925.9
206.7
United Kingdom 3,868.2
503
Sweden
93
Europe
478
661
148
1,194.5963.1
Spain
458.7Netherlands325.3
452.5643.3
805.5
757.6230
94
642
1,354.0 445 -40.5
32.9
▼-35.0
▼
282
2,246
2,899.1
20,465.9
277.9Norway
301.6
1,773.1 414
239.6Finland
Switzerland
121
120
598
339.9317.3
139495.9
1,1851,448
France
Russian Federation
820.3
7,347.3South Korea
854.4
607706
3,814.2
764.8
2,172.3
▲
57
▲
201207Malaysia1,040.8
181
Taiwan
1,054.8Singapore
Japan
Hong Kong
IndiaAustralia
4,092.8
291
711.7
3,136.92,947.5
First Half 2018
DEALS VALUED UP TO US$50 MILLION
SMALL-CAP M&A REVIEW
11.7
-18.3
▲
647346
278.8
61.8
▼
▼
-6.0-11.8
18.8
▲
▼▼
▼▲
-17.3
51
-14.776.725.1
252
39
1,395
888.2
1,620.9 9454,113.4
511
22,590
15,926.6
1,444.5
3,840.2 1,307
20,32682,469.3
# of
Deals
186
165.2
8,159
Rank Value
US$m
84,173.721,591.5
1,106
44
5,979
Region/Nation
1/1/2018 - 6/30/2018 1/1/2017 - 06/30/2017
5,395 6,265
79
19,093.4
63
Rank
Value
Change
(%)
1.5-15.4
-2.0
# of
Deals
▼▼
-13.7▼▲
▲▼
-38.8
712
7,276
-15.6
▼
8.4
▲
62162
1,003.6
5,372
2,199.4
390
181.6143
619.8
155
17,575.8
-12.2
312.4
6423,355.6
37,213.41,909
5,510.6
-45.9
3,482.5 ▼
▲
▲
▼
-9.9
16.4
-36.066.1
44.8
33.3
▲
▼
▼
▼-19.4
▲
-39.5
41.9▲
-9.0
174
M&A Rankings For Mid-Market Deals Valued Up To US$500m Are Also Available
▼
898.9
▲
7.3
33.5
17.3191
735
634
Jan 1 - Jun 30Announced Small-Cap M&A by Target Nation Up To US$50m
-
2,000
4,000
6,000
8,000
10,000
12,000
$0
$5
$10
$15
$20
$25
$30
$35
$40
$45
$50
# o
f D
eals
Rank V
alu
e (
US
$b)
US$0 - 10m US$10 - 20m US$20 - 30m US$30 - 40m US$40 - 50m # of Deals
19.0%
11.9%
10.6%
9.8% 9.1%
8.3%
8.3%
6.9%
5.6%
5.0%
3.9% High Technology
Industrials
Real Estate
Financials
Healthcare
Materials
Consumer Products and Services
Media and Entertainment
Energy and Power
Consumer Staples
Retail
Telecommunications
1
Source: Thomson Reuters
*tie
Source: Thomson Reuters
15.8
52*
75.90
-54
Imputed Fees (US$m) †
# of Deals per Advisor
15
Change (%)
-24
-13
2
362.4
181.3
395.3-47
2
Rank
83.4
-
123.1
▲
▲
36.4
41.7
12.2
Fees
-
41.7
-
7.0
-
60.1
71.3
97.9
100.0
25.9
100.0
7.2
81.9
262*
85.3
-
49.2
54.5
92.8
100.0
21.0
118*
-
14
198* 80.0
12
44.8
100.0
68.0
11.1
34
15
97.6
46*
-
18.6
81.5
Worldwide Estimated Small Cap Investment Banking Fees by Quarter*
-
93.5
- -
1.0
29.5
8
305*
-
8.6
100.0
22.9
-
-▼
84
7.061*
30
36.3
4.4
19.1
59.1
5.2
▲
▲
31.7
54.6
18.1
56.6
65.0
6.0
43.5
▼
64.3
▼
▼
-
▼
▲
▼
▼
▼
39
-
▲
-29.5
▼
-32.3 ▼
69.6 1.8
10
Exp (%)
71*
1
50
108.7
▼
9.1
14.5
▲
42.2
▲
57.8
52.9
▼
-34.2
▼
625.70
100 ▼10
-52.6
-22.4
▼
274.5
1
272.0
▼
1
140
-1.0▼
▲
94
96 24 330.3
4
Rothschild & Co
Deloitte
PricewaterhouseCoopers 3 2
4
12
7
4
9Houlihan Lokey
1
Sumitomo Mitsui Finl Grp Inc
2
1KPMG
6
Mizuho Financial Group 9 11 70
8 8 76IMAP
9
-
-72.6
556.4
41.9
10 68
24*
▼
6415
59 17 ▲
20
-
▲ -
16
42.9
42.2
-64.1
▼
27.2
-58.4
401.3
Morgan Stanley
14
-94.3
-
▲
115.8
18 24*
▲
-78
59Lazard
▼
▼
14.2 ▲
▲
-5
115.5
25
3
38.0
26.3
-74.9
22.2
21-
-
-
3.0
-42.7
-
13
-27.7
-49.5
-22.8
-91.4
▼
-31.1
-
-54.0
-
▲
16
▲
157.1
▲
▲
Evercore Partners
2721 67*Barclays
23*
23*
▼
44
28*
48*
28*
35
33
3541*
75*
33
UniCredit
55*
Credit Suisse
28
24*
38
27 -1 ▼
28
▼
31
▲10
▲
▼
7
-8
12 268.9
0.0 41.5
▼ -
▲
-46.284.1 2.3
-
Grant Thornton
20,326
45* 26
Mitsubishi UFJ Financial Group 47 60* 25
RSM Corporate Fin LLP 48*
26
35
45*
27
KeyBanc Capital Markets Inc
GCA Corp
41*
55*39*
China Renaissance Partners
RBC Capital Markets
Baker Tilly International
39*
-12
36
37
-16
13
28
28
Harris Williams & Co 60*
72*
14
43*
75*
39*
Macquarie Group
39*
43*
Nomura
▲Plutus Consulting Co Ltd
32
30
▲29
82,469.3
** Fee exposure indicates each firm's mid-market fees from deals valued at up to US$50m as a percentage of its overall M&A fees in the relevant region.
-2,264
† Imputed Fees shown are based on completed deal activity, whereas deal count & rank values are compiled based on announced deal activity.
▲ 12.0
-
▼
26-
2.7
4.0 122*
198*2.0
7.1
189*
133.8
-
▼
83.3
https://www.thomsonone.com
▼-
11
4,368.1
80.3
- 22.0
94*
▼ 175*
-22.9
-
43.70
44
56.6
100.0
88.5
22.1
-
75.6
6.0
-30.4
0.0
11
▲177.3
14
-53.3
42
0.0
-
▼
129.0
10.3
▼ -
162.1
20
0.00
-
13.0
19.7
-90
35
4
0
36
-5
7
36 ▼
20
280.5
0.0
-
8
22
20
-
-9Generational Equity 18
KBS Corporate Sales Ltd
19
27*
45*
▲
4141*
33*
-8
▼
▲8
-21
-25 ▼
▼
▼
-11
-91
86
77
573
6*
6*
▼
MM1a - Undisclosed Values & Values up to US$50m
11
4
33
6
Oaklins (FKA M&A Intl Inc)
94*
-23.1
7
--Raymond James Financial Inc
William Blair & Co 36*
▼
11
▼
16
53
▼
▲▼ 87.0
▼
▲
10
7
49
50
▲
4
-1
43
▼
Clairfield International
Ernst & Young LLP 5
12*
JP Morgan
Industrial & Comm Bank China
12*
Goldman Sachs & Co
20*
Lincoln International 102.7
72.7
-2
13
15*
55 137.4
5416
119
▼
10
Rank Value per Advisor (US$m)
2018
-0.2351.8 ▼
Rank
Jan 1 - Jun 30
First Half 2018 │ Small-Cap M&A Up To US$50m │ Financial Advisors
Advisor2017 ** Fee
Worldwide Small Cap M&A up to US$50m by Target Nation Region
2016
Financial Advisor
Change in
Deals
# of
55
19
17
15* 17
Rank
Moelis & Co
UBS
Citi
# of Deals
40 12
Piper Jaffray Cos
Stifel/KBW
29*
25* 30*
41
38
Kaede Group
29*
Benchmark International
29*
33*
11
25*
27*
27*
3538*
38* 38
Jefferies LLC
35
Bank of America Merrill Lynch 29* -
7
533*
Clearwater International
BDO
▼
65*
83.0
8
-41
22
▼
▲
88.0
92.2
-7 19
▲ 188.9 -45.5
286.5 7
-
▲
35.5
-67.2
▼
27
-
-
Rank Value
10.8
23.7
41.4
123.8
-
-58.9
27.8
150
- - -
2.0
-
19
-
47
40
37.0
24
- -
-
-76.6
101.4-
255.0
17.1
386.7 3
-38.4
9
5
18.8
82.1
-
Rank Value
-
2
US$m
2016
51
6
Worldwide Small-Cap Rankings (MM1a)
114.90
13
0.0
55
Rank
73.8
-
-
6 ▲
Global M&A 48* 30* 24 -15 ▼
33* 24 -12 ▼
-35.1 ▼
83.8 - 53.8 ▲
Cooperatieve Rabobank UA 48* 60* 24 5 ▲ 80.1
12.2 - -86.0 ▼ 22.3 24 100.0
10.0 - - - 14.1 42
Industry Total
$0 $10 $20 $30 $40 $50 $60 $70 $80 $90
2012
2013
2014
2015
2016
2017
2018
Rank Value (US$b)
Africa/Middle East Americas Asia-Pacific Europe Japan
0.0%
5.0%
10.0%
15.0%
20.0%
25.0%
30.0%
35.0%
40.0%
$0.0
$0.5
$1.0
$1.5
$2.0
$2.5
$3.0
$3.5
1Q 2Q 3Q 4Q 1Q 2Q 3Q 4Q 1Q 2Q 3Q 4Q 1Q 2Q 3Q 4Q 1Q 2Q 3Q 4Q 1Q 2Q 3Q 4Q 1Q 2Q 3Q 4Q 1Q 2Q
2011 2012 2013 2014 2015 2016 2017 2018
Pe
rce
nta
ge
of To
tal F
ee
s
Investm
ent B
ankin
g F
ees (
US
$b)
% of Total FeesSmall Cap I.B. Fees ($50mil or
2

*tie
40* 64* 7 3 ▲ 70 78.423.4 - -48.6 ▼
-7 6 ▲ -
2.9
-Daiwa Securities Group Inc 40* --
- -
-
-
100.0- -
1,600.9
-
0.0
7.0
▲
- -
28.5 - - -
-0.0 -
0.0 -
0.0 -
-15.4
Prairie Capital Advisors Inc 40* 31*
Industry Total
DA Davidson & Co Inc
34.3
1.8 115*
▼
72.0
89*
8.0
7.0
7
▲
0.00
-1 ▼
Macquarie Group 40*
7 -5
142*
5,400
▲
69.6
0.0
Deutsche Bank 40*
-25.2 75*
▼
▼-27.8
43
58
2.5
-
-
▼
- 31*
27.5
62*
-
-
▼
US Small-Cap M&A up to US$50m by Target Industry
0.0 -
-
-
100.0
29
▲
-
100.0
▲
▲
▼
-
3
▼
-
BMO Capital Markets
0.0
▲
▼
26*
▼
▼
Rothschild & Co
175.5
42.68.0
-
-
13.5-
-
19
3.0
-
34
6.3
5
5.8
12.0
3
4.8
24.0
15.7
42
12.0
13
11
10
24*
6
24.7
15
7
-
** Fee exposure indicates each firm's mid-market fees from deals valued at up to US$50m as a percentage of its overall M&A fees in the relevant region.
16,155.7
88.9
100.0
38.0
-
-
6.8
0.0 -
21
▲
24.6
5.2
-
15.0
▲
-
-
13.3
-
▲
Chartwell Financial Advisory
-
0.0
9.0
Jan 1 - Jun 30
The Braff Group
-15
5.0
38*
100.0
https://www.thomsonone.com
Source: Thomson Reuters
12.0
▲40* 7 3
7 0
64*
Signal Hill Capital Group LLC 40* 44* 7
Centerview Partners LLC
40* 44* 7
40* 51*
38*
- -7 4
445.530.0
▲6
58* 6 1
-2
64*
-1
8
0
10
36*
35*
Perella Weinberg Partners LP 50*
Sandler O'Neill Partners
KPMG
Hovde Group LLC 32*
89*8
-
75*
35*Capstone Headwaters LLC
† Imputed Fees shown are based on completed deal activity, whereas deal count & rank values are compiled based on announced deal activity.
-6
▼
▼
-13
9
9
Petsky Prunier LLC
51*
-8
3
810
15*
11129* ▲
Bank of America Merrill Lynch 32*
SunTrust Banks
94*
29*
10
101.3
146.7
43.7
-
-25.0
-
-
30.20
0.0
1 0.0 89*▲
Global M&A
0.0 -
35*
11
32*
AGC Partners
25*
Lazard 25*
34
29*
29*
35*
Cascadia Capital
IMAP
57.9
▼-1
1227*
▲
▲
14 ▼
0.0
▼
1521*
11
12
-123*
-2
14
2
-
-
-16.9
60
UBS 27*
0.0
0.0
37.0
842* 615
1
-
-
-
-
-
-
-
-
35*
35*
122*
5.0
1.5
38*
45*
12.0
-105* ▼
▼
19
29*
▲
1618*
5
Oaklins (FKA M&A Intl Inc)
▲
20
PJT Partners Inc
35*
-5
21*
-2 ▼
▲
48.0
15Benchmark International 0.0
15
Citi
Credit Suisse
Robert W Baird & Co Inc
31* 5
- --
17
-
-
-
89* -
-
-17.2
-
0.0
0.0
-
7.8▼
-
0.00
28.4 -
12
133.3
19.8
16
37.5
8*-
24*
20.0
-
-
17.2
-
-
16.0
▲
0.0
▲
- --
24.7
42.4
-
-
-
20
0.0
8 ▲
▲
42.0
45.5
-2
-0.011*
▲4
9
14*
Morgan Stanley
27
23* 24
15*
13
22
19
JP Morgan 14* 11
Duff & Phelps
RBC Capital Markets 17
KeyBanc Capital Markets Inc
21
18
Lincoln International 14*
Harris Williams & Co
8*
2218*
22
-
-
Evercore Partners 9*
Barclays
13*
11*
Jefferies LLC
-
9* 0.0 89* -
▲
3.0 -94.3
-
▼▲
-31.1
▼
▼
-
▲
12.0 80*
13
240.1
10*▲
85
1
50.00
9
10
13
20 30Moelis & Co
Stifel/KBW 7 7
8
5*
4
31
Goldman Sachs & Co 5* 132
6
8*
▲
William Blair & Co ▲124 36
Piper Jaffray Cos 35*
Generational Equity 3 -841
Financial Advisor
2
-12
Raymond James Financial Inc
# of Deals per Advisor
2
2017
Change (%)
Rank Value
3
60
42
▼
Rank
1
MM2a - Undisclosed Values & Values up to US$50m
Deals # of Deals
Rank Value per Advisor (US$m)
Jan 1 - Jun 30
108.30
2
2018
Rank Rank
29
32
7
▲4144.3
▼
▲
-
▲
1
29
21*
21*
21*
Houlihan Lokey
17
13*
38*
32* 10
64*
26*
15*
▼
-866
▲
-1
27
▼
▲
2018
▼
2
-
7
# of Change in
-73.4
5 ▼
Rank
First Half 2018 │ Small-Cap M&A Up To US$50m │ Financial Advisors
-
Rank Value
US Small-Cap M&A up to US$50m by Rank Value Range
US Target Small-Cap Rankings (MM2a)
US$m
-39.9
-
2018
▼
55.7
Fees
69.5
-30.8
Imputed Fees (US$m) †
Exp (%)
-
13.4
42.2 23
67.3
78.6
93.9
58.024*
▼
24*
-
14
37
8.6
22.9
22.6
7.0
22 11.9
35.6
100.0
11.7
66.7
24.7
-
4 68.0
31.6
-
44.18*
-
100.0
-88.3
.8
28.9
1
Advisor
182.9
-17.8
36.3
19.7
36.1
0.0
59.7
** Fee
50.0
-
9.0 100.0
3.6
27.0
235*
65.8
5.3 4.8-
12
36* 8*
-
3
100.03.3
-
-
-
31*
-
100.0
44
-
-
Stephens Inc 40* 44* 7 -1
21*
5
3.1 61 19.5
68.4
16.9
100.0
100.0
11.3
-
3.5 59 22.9
Clairfield International 50* 94* 6 4 0.00 - - - - -
Quarton International 50* 58* 6 1 ▲ 0.0 - - - 6.0 40*
26.9%
12.3%
11.0% 9.4%
9.4%
7.9%
7.1%
4.4%
4.3%
3.3% 2.7% High Technology
Real Estate
Healthcare
Media and Entertainment
Consumer Products and Services
Financials
Industrials
Retail
Energy and Power
Materials
Consumer Staples
Telecommunications
-
500
1,000
1,500
2,000
2,500
3,000
3,500
$0
$2
$4
$6
$8
$10
$12
# o
f D
eals
Rank V
alu
e (
US
$b)
US$0 - 10m US$10 - 20m US$20 - 30m US$30 - 40m US$40 - 50m # of Deals
3

*tie
- - -
- -
2.0 12* 18.9
1.1 34* 100.0
1.2 31* 100.0
2.0 12* 100.0
2.0 12* 100.0
1.0 38* 100.0
- - -
- - -
- - -
25 6.9
2.0 12* 74.1
1.0 38* 58.8
9.3 - -77.3 ▼
31.7 17 - -
0.0 - - -
22.2 24 - -
0.0 - - -
0.0 - - -
50.5 8 - -
0.00 - - -
0.0 42* - -
0.0 - - -
JP Morgan 24* 21* 2 -1 ▼
National Bank of Canada Fin'l 24* 10* 2 -3 ▼
Eight Capital 24* - 2 2 ▲
KBS Corporate Sales Ltd 24* 48* 2 1 ▲
INFOR Financial 24* 29* 2 0 -
RSM Corporate Fin LLP 24* 48* 2 1 ▲
CFI 24* 29* 2 0 -
Reznick Group PC 24* - 2 2 ▲
Bank of America Merrill Lynch 24* 48* 2 1 ▲
Sprott Inc 24* 48* 2 1 ▲
Spencer House Partners LLP 24* - 2 2 ▲
Macquarie Group 24* 29* 2 0 -
-
Moelis & Co 24* - 2 2 ▲
Citi 24* 29* 2 0 0.0 - - -
0.0 - - -
2.0
- -
1.8
-
† Imputed Fees shown are based on completed deal activity, whereas deal count & rank values are compiled based on announced deal activity.
https://www.thomsonone.com
-
-4.2 ▼ 263.9 33.9
52.9 7 -
0.0 42* - -
-169 ▼ 5,830.0
Source: Thomson Reuters
** Fee exposure indicates each firm's mid-market fees from deals valued at up to US$50m as a percentage of its overall M&A fees in the relevant region.
-10.0 - - - - -PI Financial Corp 24* 48* 2 1 ▲
-▲ 0.0 - - 12* 100.0Centerview Partners LLC 24* - 2 2
12* 100.0
- --
2.0Lincoln International 24* 29* 2 0 -
0.0
0.0 -
- - -UniCredit 24* - 2 2 ▲
- - - -Piper Jaffray Cos 24* 10* 2 -3 ▼ 33.00 16 -
- - .3 83* 100.0Lightyear Capital Inc 24* - 2 2 ▲ 6.9 -
AGC Partners 24* 48* 2 1 0.0 - -
- 2.0 12* 100.0 Canadian Small-Cap M&A up to US$50m by Target Industry Jan 1 - Jun 30- .7 75* 100.0
Cascadia Capital 24* - 2 2 ▲ 0.0 - -
- - - - -UBS 24* - 2 2 ▲ 0.0 -
4 - - 1.2 31* 3.0
100.0
RBC Capital Markets 24* 4* 2 -5 ▼ 75.6
55.6 6 - - .5 79*Roth Capital Partners Inc 24* - 2 2 ▲
- - - -Greenhill & Co, LLC 24* 48* 2 1 ▲ 0.0 42* -
- - 3.0 9 100.0Benchmark International 16* 29* 3 1 ▲ 0.0 -
- - - 4.0 6* 38.1
100.0
Jefferies LLC 16* 29* 3 1 ▲ 0.0
0.00 - - - .1 87*Deloitte 16* 48* 3 2 ▲
- 1.6 27* 43.2Canaccord Genuity 16* 21* 3 0 - 16.2 25 -
- - 2.1 11 100.0Generational Equity 16* 15* 3 -1 ▼ 1.5 -
- - - 2.0 12* 10.3
100.0
Morgan Stanley 16* 29* 3 1 ▲ 0.0
0.0 42* - - 4.0 6*Rothschild & Co 16* 21* 3 0 -
- 1.6 27* 10.5Scotiabank 16* 29* 3 1 ▲ 11.3 30* -
-71.7 ▼ - - -FMI Capital Advisors Inc 13* - 4 4 ▲ 11.5 -
28* - - - - -
91.7
GMP Capital Corp 13* 10* 4 -1 ▼ 11.5
104.4 2 - - 1.1 34*Haywood Securities Ltd. 13* 4* 4 -3 ▼
- 5.0 4 100.0Oaklins (FKA M&A Intl Inc) 8* 21* 5 2 ▲ 0.0 - -
- - 1.9 24 70.4Duff & Phelps 8* 4* 5 -2 ▼ 0.00 42*
42* - - 8.0 2 71.4
12.5
Lazard 8* 15* 5 1 ▲ 0.0
48.9 10 - - 1.1 34*CIBC World Markets Inc 8* 9 5 -1 ▼
- 6.0 3 49.2Barclays 8* 48* 5 4 ▲ 0.0 - -
- - 3.1 8 81.6IMAP 6* 15* 6 2 ▲ 23.9 22
1 310.6 ▲ - - -6* 4* 6 -1 ▼ 143.7
- 1.0 38* 100.0
5 59.7
7 -6 ▼ 36.1 13 -
▲ 48.3 11 - - 4.3
- - 8.3 1 16.6
Houlihan Lokey 4* 10* 7 2
75* 46.7
BMO Capital Markets 1* 2* 8 -1 ▼
27* 5.9
PricewaterhouseCoopers 1* 15* 8 4 0.0
2018 ** Fee
Fees Exp (%)
2* 8 -1 ▼ 102.20 3 49.4
▲ - -
US$m Rank Change (%)
First Half 2018 │ Small-Cap M&A Up To US$50m │ Financial Advisors
Canadian Involvement Small-Cap Rankings (MM22a)
58.1 5
Advisor
▲ 1.6
- .7
TD Securities Inc 1*
4* 1
Financial Advisor
Raymond James Financial Inc
Industry Total 1,591
Rank Deals # of Deals
▲
20182017 Rank Value
Rank
Jan 1 - Jun 30
2018
MM22a - Undisclosed Values & Values up to US$50m
Change in
Canadian Small-Cap M&A up to US$50m by Rank Value Range
# of Deals per Advisor Rank Value per Advisor (US$m) Imputed Fees (US$m) †
# of Rank Value
KPMG
Rank
17.9%
17.3%
16.6% 11.3%
8.7%
7.1%
6.8%
4.7%
4.6%
2.6% Materials
High Technology
Healthcare
Real Estate
Financials
Consumer Products and Services
Energy and Power
Media and Entertainment
Industrials
Consumer Staples
Telecommunications
Retail
-
200
400
600
800
1,000
1,200
$0
$1
$1
$2
$2
$3
$3
$4
$4
# o
f D
eals
Rank V
alu
e (
US
$b)
US$0 - 10m US$10 - 20m US$20 - 30m US$30 - 40m US$40 - 50m Total # of Deals
4

*tie
-0.0 11* - - - -
- 1.0 17* 100.0
Riza Capital Consultoria de 28* - 1 1 ▲
100.0
Capitalmind 28* - 1 1 ▲ 0.0 11* -
0.0 11* - - 1.0 17*
- - - -
The Food Partners LLC 28* - 1 1 ▲
-
Translink Corporate Finance 28* - 1 1 ▲ 0.0 11* -
0.0 11* - - - -
100.033*
17*
17*
0.0 11*
▼ 0.0 11* -
-
1.0
11*
-5
34*
Scotiabank 28* 21* 1 -1
Banco Fator SA 28*
KPMG 28* 4* 1
0 -
-
-
-
-
--
- -
0.1
--
Clairfield International 21*
0.0
▲
7
139.0
-
3.2
-
25.6
-
34.9
Latin American Small-Cap M&A up to US$50m by Rank Value Range
--
2018
US$m Change (%)
** FeeAdvisor
11*
2018Rank Value
MM17a - Undisclosed Values & Values up to US$50m
0.0
1
3
1
7
2
- 1
100.01.0
0.0
▼
-
▼
-
-
RGS Partners
1
Itau Unibanco 9
21*
Banco BTG Pactual SA 3
5*
34*
1 17
-4
5
4
4
1
2
34*
-1
6
4
5
28.0
5
▲
▲
▼
Rank Rank
Jan 1 - Jun 30
0.4
36.8
-
-
34.0
-
0.0
▲
48.2 -
▲
2.0
5*
11*
-62.4
3
-
-
Rank Value per Advisor (US$m)
Jan 1 - Jun 30
First Half 2018 │ Small-Cap M&A Up To US$50m │ Financial Advisors
11*
-
2.0-
-
Change in
7*
7
9*
Rank
10
11*
-
-
11*
Goodbody Corporate Finance
Davy Corp plc
Arab Banking Corporation
34*
14*
-
2.0
▲
-
100.02*
1
11*
0.1
PricewaterhouseCoopers
Goldman Sachs & Co
Imputed Fees (US$m) †
21*
Credit Suisse 14*
34* 3
-98
0.0
48.2
4
4
3
3
12*
0
4
▼
2.4
▲
▲
1.6
▲
▲
0.0
-
▲
▲
Rank Value
0.0
11*
# of Deals per Advisor
6
0.0
Morgan Stanley
Oaklins (FKA M&A Intl Inc)
7*
1*
11*0.0
Deloitte
4
▲
0.07*
11
12* 17*
7* 1
-24*
# of 2018
▼
16.0
1
4
Latin America Involvement Small-Cap Rankings (MM17a)
Financial Advisor
2017
100.0
9*
30
2*
69.0
9*
-
Citi
INFUPA SA
-
Rothschild & Co
26.8
100.0
-
9*4
5*
12*
Lazard
12*
5
14*
Rank
7*
3Ernst & Young LLP
# of Deals
Artica Participacoes e Assesso
14*
4
12*
7*
15
Deals
14*
-
▲
▲
▲
21* 1
2
3
3
3
21*
-
2 2
2 1
3 3
34*
3
1
14*
Industry Total
JP Morgan 14* -
Bank of America Merrill Lynch 21*
HSBC Holdings PLC
https://www.thomsonone.com
-
Source: Thomson Reuters
▼
-
83.3
-
▲
488
34*21*
21*
-
2 0 0.0
11*
11*
▲
2*
-
-
2
11*
-
0.0
Latin American Small-Cap M&A up to US$50m by Target Industry
100.0
-
-
** Fee exposure indicates each firm's mid-market fees from deals valued at up to US$50m as a percentage of its overall M&A fees in the relevant region.
▲
-
33*
-54.7 26*
-
100.0
-
-
100.0
-14.1
11*
† Imputed Fees shown are based on completed deal activity, whereas deal count & rank values are compiled based on announced deal activity.
1
0.0
--
▼
- -
-
-
-
0.0
2.0
9 0.6
11*
11*
11* - -
- 4.0
-
-
91.1
-
-
4.0
2.0
-
2.0
▼
-
-
-
-
-
1*
-92.4 ▼
Fees
-
100.0
- -
-
--
11*
11*
- -
2.0
-
-
-
-
11*
9* 100.0
4.0
3.0
- -
8.0
9*
44.4
-
4.1
-
-
100.09*
11*
0.0
0.0
0.0
0.0
0.0
-7
▲
1,750.0
-
12* 2 -1 ▼
100.0
100.0
Exp (%)
26.0
0.0Banco Bradesco SA 21*
-
2 2
▲
▼
Evercore Partners 28* 1 ▲ 0.0
Greenhill & Co, LLC 21*
▲Cypress Associates 21* - 2 2
Alantra Partners SA
Alpax Inc 21*
11* - -
BBVA 28* 8* 1 -4 ▼ 42.3 3 96.7 ▲ 0.6 26* 100.0
Mizuho Financial Group 28* - 1 1 ▲ 0.0 11* - - - - -
BNP Paribas SA 28* 4* 1 -5 ▼ 0.0 11* - - - - -
RBC Capital Markets 28* - 1 1 ▲ 0.0 11* - - 2.0 9* 100.0
Nomura 28* - 1 1 ▲ 0.0 11* - - - - -
IMAP 28* 8* 1 -4 ▼ 0.0 11* - - 1.0 17* 100.0
Lincoln International 28* 21* 1 -1 ▼ 0.0 11* - - 1.0 17* 100.0
IGC Partners 28* 34* 1 0 - 0.0 11* - - 1.0 17* 100.0
Eurohold SL 28* - 1 1 ▲ 0.0 11* - - 1.0 17* 100.0
Valence Group 28* - 1 1 ▲ 8.3 8 - - 0.2 32 100.0
BR Partners 28* 8* 1 -4 ▼ 0.0 11* - - - - -
LionTree Advisors LLC 28* - 1 1 ▲
24.3%
13.3%
11.0% 10.9%
8.6%
8.1%
8.1%
7.5%
4.4% 3.8% Materials
Industrials
Financials
Real Estate
High Technology
Energy and Power
Consumer Staples
Retail
Media and Entertainment
Telecommunications
-
50
100
150
200
250
300
350
400
450
500
$0.0
$0.5
$1.0
$1.5
$2.0
$2.5
# o
f D
eals
Ra
nk V
alu
e (
US
$b
)
US$0 - 10m US$10 - 20m US$20 - 30m US$30 - 40m US$40 - 50m # of Deals
5
*tie
ACXIT Capital Partners 51* 50* 10 -1 ▼ 0.0 0.0 - - - 9.0 30 100.0
▲ - - -
CFI 47* 20* 11 -15 ▼
▼ 3.0 79* 13.5
87.2- 4.1 62
Credit Agricole CIB 51* 40 10 -6 ▼ 0.2 0.2 -
10.2 - -
-98.8
Equita SIM SpA 51* 167* 10 8 ▲
- - -
78 100.0
▼
87.6 71.610 3 0.2 ▲
95* 100.0-19.543.6 35
45*
William Blair & Co 40*
9.6
Liberum Capital 51* 47* 52.4
- 125.1 ▲ 3.3
41*
55*
Canaccord Genuity 51* 13
Deutsche Bank
56.998.2
Rank Value per Advisor
75*
Jan 1 - Jun 30
-16.0
1
-47
-14.2
European Small-Cap M&A up to US$50m by Target Industry
Rank
58.7
211.2
2018 2017
10
Numis
-3
4
2 ▲
▲
55* 12
13
17
15
30*
30*
19
21
330*
5
23*
23
13 ▼
-5
8
28
24
36*
25
10
RSM Corporate Fin LLP
PricewaterhouseCoopers
213*
25
Grant Thornton
UniCredit
50
11* 14
Kon SpA 19*
▼
▼
Goldman Sachs & Co
Financial Advisor Rank
Lincoln International 33
4
12
7
9
54
5
Ernst & Young LLP
Clairfield International
2
IMAP
KBS Corporate Sales Ltd
76
3
Clearwater International
Oaklins (FKA M&A Intl Inc)
Lazard
8
9
10
10
Deloitte
74
109
▼
1
-17
▼
6
5
Rank
4
1KPMG
Rothschild & Co
3
13*
11 -1110
28
-34
11*
39
33
15*
# of Deals
-57
70
103
-24
▲
62.1
▼
▲
121.0
European Small-Cap M&A up to US$50m by Rank Value Range
Deals
▼
# of Deals per Advisor
MM3a - Undisclosed Values & Values up to US$50m
Rank Value
57
# of Change in
59
-24
17
▼
▼
47
115.5
▲
50.8
115.3
Euro mil
European Involvement Small-Cap Rankings (MM3a)
Jan 1 - Jun 30
244.5
0.0
▼
0.0
8.3
0.0
▲
▲
0.0
▲
10.0
7.2
-
6.0
-
2.0
1.0
15.4
-89.8 ▼ 11.3
30.0
0.0
-90.0
-
36.6
-
▲
- -64.8▲
0.0 0.0
12.0
-
Citi
Arma Partners LLP
19
138*
13
13
Global M&A
Credit Suisse 36* 14
13
33
83.8
-10
-
-
▲
▲
▲
▲
▼
▼
45.4
9.1
17,400.5
Source: Thomson Reuters
15*
22
20
4
▼
▼
151.6
23.7
69.0
-
184.3
3
81.7
-4
-8
137.4
63.1
205.3
19.5
171.8
323.8
▼
▲
▼ ▼
7 ▲
76.3 -16.220
5
87.7
93.2134.7
40.2
5.0113.6
13.0
0.0
100.0-80 9
162.1
17
-6
1273.0▼
23*
55*
19*
17*
17*
▼17*
▲24
1
23
-10
23
36*
27
22
3
33*
16
23
111*30*
-
88*
28*
26* 20*
26*
17*
2
3
19
19
18
17
-2
-3
10
61*
-
0
2.0
51*
† Imputed Fees shown are based on completed deal activity, whereas deal count & rank values are compiled based on announced deal activity.
23* 11
Livingstone Partners
47* 75*
41*
11
69* 10 68.5
▼6,920
▼
61.0 49.3
12.3
Industry Total
47*
47*
0.075*
23*40*
45*
15 58.9
57.9 47.2
-
-
1145.9
-
8.0
9.5
--
64.9
▼
▲
▲
2.0▲1470.9
-
▼
9.8
4.4
20.0
-3
-1
▲
9.6
48.3
24.6
▼
▼
43*
36*
-4
16
11
15
17
17
▼
24.1
9.7
-7
11
▼
▼
-16
▼
▲19
15
-14
13
Cambon Partners 36*
96*
40*
36* 15
-4
40*
Mediobanca
30*
40*
35
30*
39
Banca IMI (Intesa Sanpaolo)
30*
Natixis 30*
Morgan Stanley
Cooperatieve Rabobank UA
26*
Globalscope
Alantra Partners SA
29
UBS
25
BNP Paribas SA
Evercore Partners
JP Morgan
GCA Corp
INFUPA SA
HSBC Holdings PLC
Macquarie Group
Bank of America Merrill Lynch
8*
19*
-
▲
38.1
19*
Capitalmind
ING
▼-64.3
54
4.0
39.2
22.3
269.7
307.9
33.7
-
13
-
▼
-85.9
▼76
1.3
-7
BDO
5
Barclays
Benchmark International
Baker Tilly International
Houlihan Lokey
Translink Corporate Finance
23
24
17
-8
11.0
11.4
▲
16
83.4
▼12
224.2
-12
▲
83.0
9
▼
11
73.6
-
9.9
-14
▼ -
0.0
▼
▲
106
111*
53.2
13.9 100
47.6
1
1010
7
67.8
-
134.5
▼
-
-
-
-
27
152*
-
54.6
-48.4
-
-63.1
-
-80.0
▼
3.9
-
24.2
▼
24.5
-75.5
-
▲
▲
-
49.2
Rank
1
2
2018
First Half 2018 │ Small-Cap M&A Up To US$50m │ Financial Advisors
141.7 6
-59.2
▲
▲
Rank Value
US$m
392.5
-44.2
Change (%) Fees
0.0
▲
** Fee
Exp (%)
Imputed Fees (US$m) †
2018Advisor
4
▼
▼
▲
▲
42.9
▲
-
▲
0.0
-
** Fee exposure indicates each firm's mid-market fees from deals valued at up to US$50m as a percentage of its overall M&A fees in the relevant region.
39.4
46.1
▼
12.0
12.2
-62.5
-
0.0
23.0
2.3
23.0
15.3
31.7
131.8
-90.8
-61.6 ▼
▲
▼
▼
10.0
6.2
-77.7
-
-
57.1
1.0
4.0▼
2.0
13
-
6.9
20
4.0
44*
21*
39
59
15*
42
19.3
102*
15.2
4.3
63*
13.3
9.6
-18.6
7
79.6
63*
2.6
94.1
100.02.1
31*
100.0
15.0
21*
1,693.3
10.0
2.4
89.629
20.6
73.514
49 27.5
9.7
83.9
40.0
80.0
92.4
100.0
164*
60*
68.2
28.4
10.1
100.0
28.2
4.7
23
102* 12.8
34
26*
-1,494
-
-
101
11.3
- -
0.0
-
10.8
155.1
-65.0
-
-
0.0
39.1
103.1
0.0
38.8
0.0 0.0
-11.414,405.4
8
-
-
-
▼
368.2
-
-
▲
▼
-
▼
102*
1.9
17
10
164*
4.6
88.5
100.0
79.2
8*
100.0
5.5
12.0
1.0 164*
102*
22.8
19
93
12
70.2
41.8
3.9
41.7
26*
-
63*
100.0
56
41
20.0
52.9
-
100.0
100.0
8.0
0.0
24
-
0.0
39.0
0.0
11.3
37.7
-
-
-
85.1
0.0
25.7
https://www.thomsonone.com
100.0
100.0
100.0
93.5
76*
93*
97*
100.0
40*
10.5
2
46.0
25
26* 52.4
100.0
10.0
6.3
98.8
97.8
-
8.0
4
51*
56.5
5
3
150*
120
-50.3
12.6
12.0
106.0128.2
Cenkos Securities PLC 51* 69* 10 2 ▲
16.2%
14.5%
13.1%
10.2%
8.6%
8.1%
8.0%
5.9%
5.6%
4.4%
3.2% 2.2% High Technology
Industrials
Real Estate
Financials
Healthcare
Media and Entertainment
Consumer Products and Services
Materials
Energy and Power
Consumer Staples
Retail
Telecommunications
-
500
1,000
1,500
2,000
2,500
3,000
3,500
4,000
4,500
5,000
$0
$2
$4
$6
$8
$10
$12
# o
f D
ea
ls
Ra
nk V
alu
e (
US
$b
)
US$0 - 10m US$10 - 20m US$20 - 30m US$30 - 40m US$40 - 50m # of Deals
6

*tie
Source: Thomson Reuters ** Fee exposure indicates each firm's mid-market fees from deals valued at up to US$50m as a percentage of its overall M&A fees in the relevant region.
209* -
1.4 68* 100.0
41* 33.3
0.0 45* - -
0.0 0.0 45* - -
9.5 6.9 45* -37.9 ▼
0.0 45* -
DC Advisory 45* 72* 4 2 ▲
Duff & Phelps 45* 25* 4 -6 ▼
SPARK Advisory Partners Ltd 45* 53* 4 1 ▲
-HSBC Holdings PLC 45* 106* 4 3 ▲ 100.0
0.0
UniCredit 45* 106* 0.0 0.0 45*4 3 ▲
0.0
-- -
10.4
45* -
45* -72.0
20.3
- -
23*
-
▲
RBC Capital Markets 45* 53* 4 1 ▲
4 1 ▲
Beaumont Cornish 45* 106* 4 3 - -
4.0
Hoodless Brennan & Partners
0.0
0.0
† Imputed Fees shown are based on completed deal activity, whereas deal count & rank values are compiled based on announced deal activity.
53*
22.0
-
▼
US$m
0.0
61.0
▲
▲
-
15.7 45*
0.0
-1
7.5
▲3
0.0
▼
UK Small-Cap M&A up to US$50m by Target Industry Jan 1 - Jun 30
-
1.6
41*
3
21 50.6
▼
▼
4
▼
3
3
▲6
▲
5
10.0
27*
▲
▲
6
▲
-
6
9.3
29*
27.2
8
▼
29*33.1
29*
34*
5
▼
6 38.8
0.0
46.1
6
0.0-9
12.08 16.9
45.5
0.0
15.4
495.2
27*
29*0.0
11.1
29*
19*
19*
▲
19*
19*
5.0
52.4 38.4
7.0
19*
19*
0.0
13
▼
-6
19*
19*
72* 10
▼
3
11
11
10
8
12
-22
2
10
14
-17
1 ▲
0.0
23.6
0.0
0.05
43.2 19*
60.0
16.7
74.8
125.1
-
-
19*
14
15*
15*
▼
▲
15*
15*
72.8
▼
0.00.0
▲ 11*
52.5
▼
21.5
▲
6
7
9101.0
10
48.3
11*
7.1
72.9
8
40.4
-11
-12
▼
-10
38.1▼
29.0
-8
34.4
-2 28.9
9
3
-1
▼
17
# of Deals Fees
46.7
0.0
11*
13.0 ▲
117.3
27.8
0.0
0.0
-
-75.5
-
83.4
Rank Value per Advisor
▼
149.8
23.7
4.5
23 ▼
11
2
12.0
1.8
-
0.3
5
2.6
1.3
-
4.6
9.0
1.3
-15
Change in # of
# of Deals per Advisor
1
▼
8
▲
▲
6
61*
Goldman Sachs & Co 15* 33*
BDO
Houlihan Lokey 11
GCA Corp
Bank of America Merrill Lynch
15*
39*
53*Macquarie Group
15*
7
25*
15*
-11
14
11
1
7
13
1320*
11*
11*
8
10 3
Deloitte
10
9
Ernst & Young LLP 11*
Baker Tilly International
PricewaterhouseCoopers
20
8
Financial Advisor
9
24
44
59
16
Clearwater International
Rothschild & Co ▲ 93.3
MM4a - Undisclosed Values & Values up to US$50m
2
Rank Value
Jan 1 - Jun 30
2018
Rank
4
13
KPMG
5
KBS Corporate Sales Ltd
▼
4*
15
23
6
Deals
2017
Rank
8.5
▼
7
4*
Grant Thornton
RSM Corporate Fin LLP 11.9
Benchmark International
18
▲ 115.5
-86.2
4*
3
▲ 0.0
Change (%)
▲3
GBP m
Barclays
Oaklins (FKA M&A Intl Inc)
126.7 2
▲ 54.6
-
2018
45*
4*
205.0
0.0
-
-
▼
-
-82.6
-
-71.4
-
▼
▲
-43.9
106*
41*
-
34
71*
-
159.0
-22.0
4.0
6*
-
-
1.4
176*
54.2
** Fee
Numis 19*
12
1
47.1
▼
79*
Imputed Fees (US$m) †
2
Cenkos Securities PLC
Arma Partners LLP 72*
28*
Liberum Capital 19*
19*
IMAP
20*
▼
8
44*
19*
9
-8
-2
8
19
-1
Lincoln International 19*
19*JP Morgan
29*
34*
Canaccord Genuity
29*
Livingstone Partners
BCMS Corporate Ltd
29*
Clairfield International
53*
Sentio Partners LLP
-
34*
38*
34*
39*
Morgan Stanley
Alantra Partners SA
29*
https://www.thomsonone.com
34*
3 ▲William Blair & Co
Viel & Cie Finances
53*
14
Evercore Partners
28*
27*
17
Credit Suisse
-
38*
Industry Total
Dow Schofield Watts LLP
Peel Hunt LLP
Akur Ltd
-
Global M&A
72*
1,829
-
-
1.0
2.4
2.8
8.0
9.0
3.3
-
-
22.3
▼
2.0
-
▼
0.0
▼
▲
-
83.9
100.0
8*
100.0
100.0
34.6
35*
68*
23.0
8.7
First Half 2018 │ Small-Cap M&A Up To US$50m │ Financial Advisors
Rank Value
UK Involvement Small-Cap Rankings (MM4a)
-35.2
4
2.0
Advisor
1
2018
167*
65
20
100.0
-
-
-
0.4
14*
7.8
8.2
30
2.3
5.0 17*
39*
0.0
71*
-
209*
-
100.0
87.6
8
-1
Rank
▲
0.0
34*
34*4
27*
0.0
10.8
0.0
▼
10
10
10
10
8
▲
0
9
-3
22*
15* 10
31*
Rank
-41.4
62.5
-
-72.4
-
-
▼
-
-
-
-
▼
▲
2.0
-
1.0
▼
28*
11
▲
38
10
-
23*
-
89.9
21.6
83.3
100.0
93.9
12
100.0
30.8
-
100.0
-
1.0
16
-
5.5
79*
4.0
6*
100.0
23*
17*
21.0
56.5
79*
100.0
96.0
UK Small-Cap M&A up to US$50m by Rank Value Range
49.1
Exp (%)
89.7
100.0
-
-24.6
-19.5
16.8
169.7
-
-
131.5
162*
-38*
975.9
▼
2.0
5.2
100.0
94.7
-
41*
20.0
12.9
2.1
100.0
100.0
100.0
-
107.8
38*
0.0
-
▲
▼
0.0
▼
-
▲
0.8
▼
5.0
0.0
-64.0
-
38*
-
38*
▲
27.7
5
38.5
7.0
0.0
0.0
38*
0.0
0.0
8.0
62.9
▲
6.0
5.0
52.6
37.2
14.0
34*
0.0
1.1
6,254.9
433*
5
5
29* 27
33*
39*
5
538*
33*
5
31*
38*
5
-1
2
-2
4
▲
▲ 38*
▲ 62.4
-2 5.7
-
4.7 19
38*
14.5
91.3
-
39.4
100.0
-
-89.2
25.0
46.2 38*
7.8
35.2
45*
-401 4,558.6
3.1
0.6 100.0▲
45*
▼-7.8 39.7
Citi
Moelis & Co
Equita SIM SpA
33*
38*
38*
▼
WH Ireland Ltd 100.0
631.4
1.4 68*
100.0
20.8%
15.0%
11.8%
9.7%
9.6%
8.1%
8.1%
6.1%
4.0%
3.1% 2.2%
Real Estate
High Technology
Financials
Industrials
Media and Entertainment
Healthcare
Consumer Products and Services
Energy and Power
Materials
Retail
Telecommunications
Consumer Staples
-
200
400
600
800
1,000
1,200
1,400
$0
$1
$1
$2
$2
$3
$3
$4
$4
$5
# o
f D
ea
ls
Ra
nk V
alu
e (
US
$b
)
US$0 - 10m US$10 - 20m US$20 - 30m US$30 - 40m US$40 - 50m # of Deals
7

*tie
Source: Thomson Reuters
CM-CIC Conseil SAS 26* 55* 3 1 ▲ 20.8 17.0 16 - - 1.5 33* 100.0
21*
▼
0.0
RBC Capital Markets
Deutsche Bank
3Houlihan Lokey
329*
3
34.2
3
13.9
-324
26*
3
26*
26*
26*
2
0.0
26*
88.9
3*
19
Grant Thornton
11.3
0.5
11.0
0.0
10
-
-
-
-
-
--
Rank Value per Advisor
-
0.0
0.0
-
-
0.0
108*
-90.0
-
-29.0
-
-
▲9
23*
3
82*
▼
-
-
-
20.0
-
1
▲
DC Advisory 0.0 61.2
-
3
100.0
2.0
▼
† Imputed Fees shown are based on completed deal activity, whereas deal count & rank values are compiled based on announced deal activity.
2,191.8
▼
0.0
343.5
-3 -
0.0
-
-
27.6
-
French Small-Cap M&A up to US$50m by Target Industry
JP Morgan
3
Industry Total
24.6
HSBC Holdings PLC - -
Jan 1 - Jun 30
https://www.thomsonone.com
0.6
17*-
108*
96
- -
3.0
17*
21* 100.0
100.0
105*
-
2,651.5
0.0
-
-
-
131.8
-25.2
8
2
-
▲
74.5
128.2
30.0
7.3
10*
1.0
5.0
33*
-
3.0
0.3
-
12
-
-
- -37*
0.8
39*
99
-
39*
-
▼
-
-
- -
37.8
-
-0.0
-
-
-
-
37*
-6
-
-
-85.7
9 -
-
-
-
▲
▼
-
▲
▼
20
11
6.07.3
0.2
-
▼
-63.7
-
23
50.2
21.1
-
106.0
69.0 3790.5
34.8
Rank Value
3
French Involvement Small-Cap Rankings (MM5a)
Change (%)
25.2
Imputed Fees (US$m) †
Exp (%)
1
Rank
Rank Value
0.4
6.3
-
5.0
1.0
1.0
▲
▲
47.5
0.2
7.2
0.2
1.2
-
4
5
11 ▼
-
-98.8
▼
-48.3
41.6
--
4
4
1
** Fee exposure indicates each firm's mid-market fees from deals valued at up to US$50m as a percentage of its overall M&A fees in the relevant region.
9
37.3
▲
7
6
3.0
▲
▼
11 4
-6
5
82*19*
15*
26*
55*
IMAP
BDO
Banque Degroof Petercam SA
Capitalmind
10*
1,055
▲
4
▼
Lincoln International
2018
1
3*
KPMG
6
7*
3*
Clairfield International
Lazard 81.7
▼
Advisor
US$m
-7
2 192
6
1
4
29*
▼-5
Change in
-3
-2
15
15
5
12*
3
4
10
15
5
6
Rank
▼
Deals
36.8
▼
42
▲
100.0
3
0.0
▼
0.0
0.0
-1
▲
82*
0.0
4
▲
▲
5
0
-
40.0
0.0
-0.0
-16
5 0.0
-
▼
▼
▲
-9
▲
-
0
2
0.0
▼
Arma Partners LLP 19*
Deloitte
-
82*
Oaklins (FKA M&A Intl Inc)
Mediobanca
Baker Tilly International
19*
1
19*
-
34
19*
19*
41*
19*
4
4
French Small-Cap M&A up to US$50m by Rank Value Range
15* 10*
9
15*
Natixis
Rothschild & Co
Financial Advisor
MM5a - Undisclosed Values & Values up to US$50m
19*
# of
19*
# of Deals per Advisor
-6
Rank
2017
7*
PricewaterhouseCoopers
Cambon Partners
13*Societe Generale 7*
13*
12
10*
15*
15*
23*
7
Credit Agricole CIB
Invest Corporate Finance SAS
BNP Paribas SA 7*
UBS
10*
6
Clearwater International
6
19*
15*
Ernst & Young LLP
15*
6.0
8
-
100.0
97*
100*
35*
2018
100.0
68.2
124*
12
11.4
76.9
Rank
100.0
100.0
17.9
25.2
6.6
87.8
100.0
100.0
4.2
100.0
10*
100.0
Jan 1 - Jun 30
13.5
** Fee
67.4
100.0
41.7
-
4
17*
9
39*
100.0
45.0
29.1
100.0
0.0
41.6
19*
2.0
▲
14
-8
-6
9
-3
4
2
0.0
100.0
37*
2
▼
5
Fees
2.0
2018
1.5
First Half 2018 │ Small-Cap M&A Up To US$50m │ Financial Advisors
-
0.0
45.2
0.0
0.2
Oloryn Partners 26*
2.3
▲
-7
-6
8.0
Euro mil
1
# of Deals
1
0.0
0.0
0.0
0.0
7
14.0
9.8
49.5
0.0
17.1
30.0
0.0
-0.7
▼
0.0
0.0
▼
24.7%
14.8%
10.0% 9.2%
8.5%
7.8%
7.3%
5.4%
4.7%
3.9% High Technology
Healthcare
Industrials
Media and Entertainment
Real Estate
Consumer Products and Services
Financials
Consumer Staples
Materials
Energy and Power
Retail
-
100
200
300
400
500
600
700
800
900
1,000
$0.0
$0.2
$0.4
$0.6
$0.8
$1.0
$1.2
$1.4
$1.6
$1.8
$2.0
# o
f D
eals
Ra
nk V
alu
e (
US
$b
)
US$0 - 10m US$10 - 20m US$20 - 30m US$30 - 40m US$40 - 50m # of Deals
8

*tie
Source: Thomson Reuters ** Fee exposure indicates each firm's mid-market fees from deals valued at up to US$50m as a percentage of its overall M&A fees in the relevant region.† Imputed Fees shown are based on completed deal activity, whereas deal count & rank values are compiled based on announced deal activity.
Clearwater International 27* 9* 3 -6 ▼ 44.8 38.0 1* - - 1.0 41* 100.0
Proventis Partners 27* 61* 3 2 ▲ 0.0 0.0 25* - - 2.0 24* 100.0
Drake Star Partners 27* 61* 3 2 ▲ 24.0 20.1 16 - - 1.4 39 100.0
JLL Capital Markets 27* 61* 3 2 ▲ 0.0 0.0 25* - - 3.0 13* 73.2
Sonntag Corporate Finance GmbH 27* - 3 3 ▲ 0.0 0.0 25*
5
- - 2.0 24* 100.0
25*
100.0
0.0 0.0
- -
13*25*
0.0
- 3.0
30.4 25.4
24* 100.0
13*
13*
100.0
100.0
0.0
--
-
- 2.0
-
- 3.0
25*
- -
-
25*
12 - -
-
-
-
0.0 -
25*
0.0
-
-25*
4
Saxenhammer & Co Corporate
20*
61*
25*
13*
-10
▲ 0.0
0.0
Fees
8.0
25*
Commerzbank AG
10*
Citi
20*
361*
9*
-
0.0
4
0.0 0.0
25*
0.0
▲ 0.0
▲
0.0
0.0
0.0
0.0
0.0
30.0
▲
0
▼
Change in
11.6
▼
0.0
0.0
4 0
-
-
24*
4.0
▲
100.0-
4
100.0
-
100.0
0.0
0.0 25*▼
20.0
2.0
1.1
-59.5
2018
41*
41*
Jan 1 - Jun 30
42.3
1.2
2.2
2.2
41*
** Fee
2
Jan 1 - Jun 30
3*
90*
3.0
100.0
4.0
▼
0.0
- 0.0
0.0
4
25*
Rank Value per Advisor
17
Rank
-
-
-
German Small-Cap M&A up to US$50m by Target Industry
2.0
8.0
Exp (%)
21*
1
- -
Rank Value
44.0
Euro mil
-
-
-
10*
-
-
-
25*
25*
-18.1
21*
-
10*
-
-
100.0
-16.5
25*
11
25* -
-
-
25*
25*
0.0
-
34.0
18
-
13*
▼
https://www.thomsonone.com
Oaklins (FKA M&A Intl Inc)
Quarton International
-3
13*
13*
William Blair & Co 13*
16*
Clairfield International
Deutsche Bank
10.8
-▲
0.0
0.0
Globalscope
16*
6
5 2
-
-
-
0.0
0.0 -
-
-
-25*
-
-
-
▼
25*
-
--
-97.2
-
-
-
25*
25* -
-
-25*
13
5.0
4.0
8*
7*
▲
30.0
27.3
▼
10.0
▼
0.0 0.0
0.0
0.0
0.0
0.0
0.9
0.0
-
-
▼
8*
0.0
0.0
25*
-
8*
19
-
23.3
9.1
23
-
-
25*
0.0
8.0
15.0
1.3
36.1
7
8
6
6
0
3
-10
17
7*
Rank
13*
21*
25*
UniCredit 4*
2* 6
Financial Advisor
1
Lincoln International
Rank
2*
16*
ACXIT Capital Partners
Deloitte
PricewaterhouseCoopers
KPMG
Ernst & Young LLP
MM6a - Undisclosed Values & Values up to US$50m
Rothschild & Co
▼
▼
-3
-8
US$m
# of
# of Deals per Advisor
2017
16*
11
12
2
27.8
10*
15
Deals
16*
0.0
37.0
8
4
37*
GCA Corp
First Half 2018 │ Small-Cap M&A Up To US$50m │ Financial Advisors
Alantra Partners SA
10*
Falkensteg GmbH
-
47*
Cooperatieve Rabobank UA
37*
9*
25*
Concentro Management AG
5
-
0.0
4*
10
12
0
1
48
0.0
6
7*
16*
16* 5
7
5
4
21* ▼
▲
▲
▲
▲
0.1
1.0
0.0
98*
3.0
2.5 20
1.0
1.0
41*
2
Centuros GmbH
-1Global M&A
goetzpartners Corp Finance
27*
100.0
▼
2018
20*
20*
2
27*
-7
3
27.8
85*
67.5
100.0
100.0
-
- --
245.8
24*
21*
100.0
0.4
-
2.2
45.1
87 100.0
100.0
100.0
100.0
100.0
100.0
3*
100.0
10*
3* 100.0
100.0
2018Advisor
40
German Involvement Small-Cap Rankings (MM6a)
Rank
3*
100.0
German Small-Cap M&A up to US$50m by Rank Value Range
52.4
1.0
▼
Change (%)
Imputed Fees (US$m) †
100.0
100.025*
47*
20*
85.712.0
1,350.4
20*
-5
# of Deals
-3
2
2
▼
4
2
5
7
8
▲
0.0
-5
-3
6
2
1
24.6
4
-
▲
3
4
▲
-13
Capitalmind
▲
Macquarie Group
Arma Partners LLP 27*
▼
37.0
25* -
-
0.0 -
8.5
0.0
Houlihan Lokey
20*
Baker Tilly International
16*
11
-2
61*
3
1,640.0
▲
1
-
Rank Value
-
8.0
25*
9.0
0.8
Raymond James Financial Inc
Industry Total 1,000
27*
3
25* 3
Morgan Stanley 27* 61*
▼
3
27* 61*
-153
Livingstone Partners
27* 5IMAP 3
3
▼
Ebner Stolz
27*
27* 13*
3
21*
▲
-1
0.0
▼ 15
28.5%
23.6%
11.3%
8.2%
7.0%
5.9%
5.0%
3.1%
2.7% 2.7% High Technology
Industrials
Real Estate
Healthcare
Financials
Materials
Energy and Power
Retail
Consumer Staples
Media and Entertainment
Consumer Products and Services
-
100
200
300
400
500
600
700
$0.0
$0.2
$0.4
$0.6
$0.8
$1.0
$1.2
$1.4
# o
f D
ea
ls
Rank V
alu
e (
US
$b)
US$0 - 10m US$10 - 20m US$20 - 30m US$30 - 40m US$40 - 50m # of Deals
9
*tie
Source: Thomson Reuters
-0.0 20* - - - -
- - -
JP Morgan 28* 30* 1 -1 ▼ 0.0
▼ 0.0 0.0 20* - -
- - - - -
GCA Corp 28* 20* 1 -2
-
Cooperatieve Rabobank UA 28* - 1 1 ▲ 0.0 0.0 20*
0.0 20* - - - -
1.0 21* 100.0
Societe Generale 28* 20* 1 -2 ▼ 0.0
▲ 0.0 0.0 20* - -
- - - - -
Finint Corporate Advisors Srl 28* - 1 1
100.0
Goldman Sachs & Co 28* 30* 1 -1 ▼ 0.0 0.0 20*
14.7 12 - - 0.3 47*
- - -
Lucciola & Partners Srl 28* - 1 1 ▲ 18.1
▲ 0.0 0.0 20* - -
- - 1.0 21* 100.0
Mit Fin Spa 28* - 1 1
100.0
Krall & Co Inc 28* - 1 1 ▲ 0.0 0.0 20*
0.0 20* - - 1.0 21*
1.0 21* 100.0
Brera Advisory Spa 28* 17* 1 -3 ▼ 0.0
▲ 0.0 0.0 20* - -
- - - - -
CVM Capital Value Mgmt GmbH 28* - 1 1
100.0
Alantra Partners SA 28* 20* 1 -2 ▼ 0.0 0.0 20*
27.2 8* - - 0.4 44*
1.0 21* 100.0
London Bridge Capital 28* - 1 1 ▲ 33.6
▼ 0.0 0.0 20* - -
- - - - -
Spada Partners 28* 14* 1 -4
100.0
Long Term Partners SpA 28* - 1 1 ▲ 0.0 0.0 20*
0.0 20* - - 1.0 21*
1.0 21* 52.6
Arma Partners LLP 28* - 1 1 ▲ 0.0
▼ 0.0 0.0 20* - -
- - 0.4 44* 100.0
Ethica Corporate Finance SpA 28* 30* 1 -1
-
finnCap Ltd 28* - 1 1 ▲ 33.6 27.2 8*
0.0 20* - - - -
- - -
Credit Agricole CIB 28* - 1 1 ▲ 0.0
▲ 14.8 12.5 13 - -
- - - - -
CoveView Advisors 28* - 1 1
-
Bank of America Merrill Lynch 28* 41* 1 0 - 0.0 0.0 20*
0.0 20* - - - -
1.0 21* 100.0
AT Kearney Corporate Finance 28* - 1 1 ▲ 0.0
▲ 0.0 0.0 20* - -
- - - - -
Petsky Prunier LLC 28* - 1 1
Credit Suisse 28* 11* 1 -5 ▼ 0.0 0.0 20* - - 1.0 21* 100.0
MANGOLD FONDKOMISSION AB 28* - 1 1 ▲ 8.6 7.0 17 - - 0.2 51* 100.0
Cambon Partners 28* - 1 1 ▲ 0.0 0.0 20* - - 1.0 21* 100.0
Natixis 28* 41* 1 0 - 0.0
10.7 9.01- -ICCREA 28*
1 0 -
▼
-
1,443.2 1,196.1
2
Fees
39.0
0.0
0.0
22.8
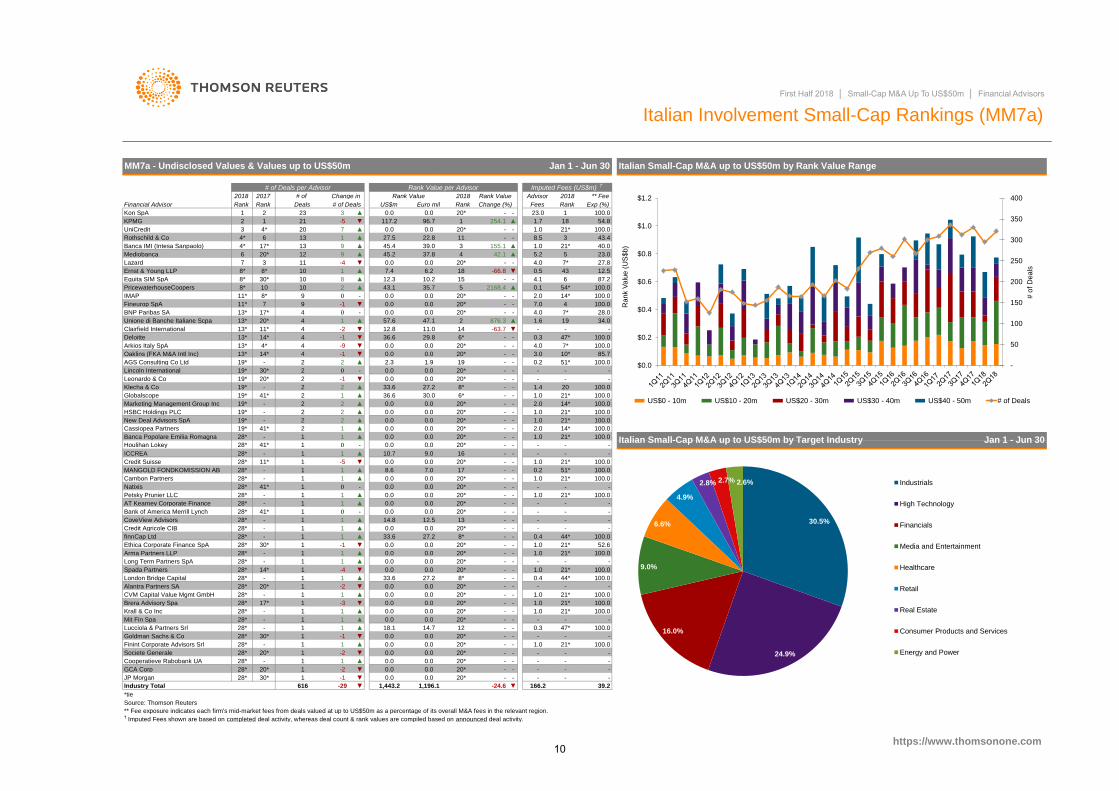
MM7a - Undisclosed Values & Values up to US$50m
US$m
Jan 1 - Jun 30
1
20*
27.5
45.4
Rank Value
1.6
▼
7.0
0.5
155.1
-
3
Euro mil Change (%)
Rank Value
96.7
First Half 2018 │ Small-Cap M&A Up To US$50m │ Financial Advisors
0.0 -
Advisor ** Fee
254.1
Rank
Italian Small-Cap M&A up to US$50m by Rank Value Range
Italian Involvement Small-Cap Rankings (MM7a)
-
▲
2
0.0
0.0
▼
-
0.0
0.0
42.1
-
6.2 -66.818
10.2 15
-
-
-
-
-
▲ 19
▲
-
7*
8.5
▲ 21*
1
▲
1.0
23.0
18
-
-
1.9
-
0.0
-
-
-
14
20*
20*
20*
35.7 2168.4
-
11.0
-▲
0.2
-
2.0
1.0
100.0
- --
-
21*
166.2
HSBC Holdings PLC
19*
28*
-29
Houlihan Lokey 28* 41*
1
12
-
▲
20*
-
▲
-
- -
0.0
6*
19*
-
20*
-
20*
19
-
4*
2
0.0
▲
▼
2
-Banca Popolare Emilia Romagna
2
0.01 ▲ 20*0.0
16
1.0
- -
-24.6
-
1.0
14*
Italian Small-Cap M&A up to US$50m by Target Industry
100.0
https://www.thomsonone.com
1.0
-
21*
▼
1
14*-
Jan 1 - Jun 30
8*
Equita SIM SpA
Ernst & Young LLP
2
2018
3
Mediobanca
4*
KPMG
4*
10
Lazard
Kon SpA
Financial Advisor
10
Rank Value per Advisor
▲
▲
8* 1
7
1
2
8
-4
36.6
-
▼
0.0
▲
0.0
▼ 12.8
20*
7.4
20*
Rank
1.0
▲ 4
11
# of Deals
2.3
-
-
-
20*
0.0
12.3
0.0
2.0
2
5▲
3
▲
Banca IMI (Intesa Sanpaolo)
7
6
Rothschild & Co
UniCredit
4.1
-
-
▼
0.3
3.0
4.0
▲
23.0
2
20*
20
6
17*
4*
23
13
0.0
57.6
--
-
-
-63.7
20*
100.0
-
876.3
2.0
20*
† Imputed Fees shown are based on completed deal activity, whereas deal count & rank values are compiled based on announced deal activity.
4.0
4.0
47*
-
7*
-
4
6
7*
43
14*
54*
-
0.1
100.0
100.0
43.4
27.8
40.0
28.0
100.0
54.8
Exp (%)
12.5
87.2
100.0
100.0
34.0
85.7
51*
10*
-
** Fee exposure indicates each firm's mid-market fees from deals valued at up to US$50m as a percentage of its overall M&A fees in the relevant region.
39.2
-
100.021*
Imputed Fees (US$m) †
2018
1.7
Deals
13*
8*
12
13
10
41*
9
2
2
10
4
30*
-
14*
-
30*
13*
2017
Rank
Clairfield International
Fineurop SpA
11*
4
13*
4
7
20*
17*
19*
Cassiopea Partners
13*
Marketing Management Group Inc
11*
IMAP
19*
11*
BNP Paribas SA 13*
4
19*Klecha & Co
Oaklins (FKA M&A Intl Inc)
Leonardo & Co
Deloitte
AGS Consulting Co Ltd 19*
New Deal Advisors SpA 19*
13*
Arkios Italy SpA
Globalscope
19*
0.0
0.0
▲ 0.0
▲
0.0
0.0
0.0
▼
117.2
# of Deals per Advisor
# of
0.0
4
11
▼
-1
▲
-1
▲
-2
1
9
1 -
▲
21
14*
9
1
5.2
Change in
0
-9
3
-5
2
-1
616
8*
2
2
-
20*
0
-
0
▼
Lincoln International
2
2 1
37.845.2
29.8
27.2
-
0.0
4
-1
-
100.0
-6*
20* -
0.0
8*
5
0.0
0.0
20*
33.6
43.1
0.0
47.1
100.0
100.0
100.019* ▲
2
36.641*
0.0
Industry Total
-
100.0
21*
20
-
-
-
100.0
30.0
20*
1.4
0.0
21*
0.0 20*
2018
0.0
9
Unione di Banche Italiane Scpa
-
▼
Rank
PricewaterhouseCoopers
8*
3
30.5%
24.9%
16.0%
9.0%
6.6%
4.9%
2.8% 2.7% 2.6% Industrials
High Technology
Financials
Media and Entertainment
Healthcare
Retail
Real Estate
Consumer Products and Services
Energy and Power
-
50
100
150
200
250
300
350
400
$0.0
$0.2
$0.4
$0.6
$0.8
$1.0
$1.2
# o
f D
eals
Rank V
alu
e (
US
$b)
US$0 - 10m US$10 - 20m US$20 - 30m US$30 - 40m US$40 - 50m # of Deals
10

*tie
Source: Thomson Reuters
- - -- 0.0 0.0 9* - -
- - - - -
Bank of America Merrill Lynch 23* 32* 1 0
100.0
Societe Generale 23* 18* 1 -2 ▼ 0.0 0.0 9*
0.0 9* - - 1.0 18*
1.0 18* 100.0
Fidentiis Equities SV SA 23* - 1 1 ▲ 0.0
▲ 0.0 0.0 9* - -
- - 1.0 18* 100.0
Translink Corporate Finance 23* - 1 1
100.0
Quarton International 23* - 1 1 ▲ 0.0 0.0 9*
0.0 9* - - 1.0 18*
1.0 18* 100.0
Retail Partners Europe Ltd 23* - 1 1 ▲ 0.0
▲ 0.0 0.0 9* - -
- - - - -
KBS Corporate Sales Ltd 23* - 1 1
69.0
HSBC Holdings PLC 23* - 1 1 ▲ 0.0 0.0 9*
0.0 9* - - 2.0 8*
1.0 18* 100.0
Lazard 23* 24* 1 -1 ▼ 0.0
▲ 0.0 0.0 9* - -
- - - - -
IMAP Lynx 23* - 1 1
100.0
Globalscope 23* - 1 1 ▲ 0.0 0.0 9*
0.0 9* - - 1.0 18*
- - -
Ferber & Co GmbH 23* - 1 1 ▲ 0.0
▼ 0.0 0.0 9* - -
- - - - -
Citi 23* 10* 1 -4
-
Global M&A 23* 32* 1 0 - 0.0 0.0 9*
0.0 9* - - - -
- - -
UniCredit 23* - 1 1 ▲ 0.0
▼ 0.0 0.0 9* - -
- - - - -
Norgestion 23* 10* 1 -4
BBVA 23* 6 1 -8 ▼ 0.0 0.0 9*
1.8
- -
1.0 18* 100.0
- - --
0.0 0.0 9* - -
-
0.0 0.0 9* - -
0.0
1 -2
BNP Paribas SA
0.0 9* -
9* -0.0
GBS Finanzas SA 118*
2
Houlihan Lokey 23* 24* 1
16*
23* 10* 1 -4
▼
0.0
2
Morgan Stanley 23*
** Fee exposure indicates each firm's mid-market fees from deals valued at up to US$50m as a percentage of its overall M&A fees in the relevant region.
7
0.0▲ -
▲
0.6▲
▲
18*
-
-
-
- 8*
1.0
Jan 1 - Jun 30
16*
1 0.0
1
23* 1-
-
23*
1
Spanish Small-Cap M&A up to US$50m by Target Industry-2
▼
▼
68.5
▼
2 ▲
--
0
▼
-
-1
https://www.thomsonone.com
24*
Nomura
Danske Bank
IMAP
RSM Corporate Fin LLP
23*
Barclays
† Imputed Fees shown are based on completed deal activity, whereas deal count & rank values are compiled based on announced deal activity.
INFUPA SA
23*
Evercore Partners
Greenhill & Co, LLC
2
2 -1
16* 32*
DNB ASA
16* -
Deutsche Bank
16*
2
Banco de Sabadell 23*
16*
16* -
-
24* 1
Goldman Sachs & Co 9*
2
3
1
Alantra Partners SA 9*
24*
Deloitte
24
# of
Ernst & Young LLP
Rank # of Deals
8*
2
16
4
22
3
▼
7
# of Deals per Advisor
9*
6
2017Rank Value
Exp (%)US$m Euro mil
Spanish Small-Cap M&A up to US$50m by Rank Value Range
34.0
3.0 42.9
** Fee
Change (%)
4
▲
4.2
Fees
54.4
84.2
42.0
2018
-
3
▼
3
3
10*
8*
4
1
3
15*
18*
32*
20.5
0.7
0.0
5
3
0
2 ▲
▲
4
0.0
0.0
0.0
1
-
-2
▼-1
0.0
▼
7*
5
Oaklins (FKA M&A Intl Inc)
9*Clearwater International
9*
Clairfield International
UBS
9*
9*
Lincoln International
Rothschild & Co
KPMG
CFI
4
7*
9*
Santander Global Corporate Bnk
-5
0.0
0.03
51.1
Spanish Involvement Small-Cap Rankings (MM8a)
Advisor
2
Rank
391.4 ▲
17-67.1
38▲
1.2▼
2
-
-
-
-
-
16.5
1
Rank
27.0
2
-
-
9*
5
36.73
-
-
-
9* -
-
-42.7
-
1
41.4
3*
-
100.0
85.7
Imputed Fees (US$m) †
-
100.0
-
100.0
3*
13* 23.7
100.0
8*
100.0
0.0
100.03.0
100.0
100.0
43.5
-
- -
-
0.0
9*
- -
100.018*
0.0 13*
15
-
100.0
-
1.0
92.3
1.8
9*
-
9*
- -
2.0
-
--
1.0
-
-
-
18*
-
0.0
3.0
-
-
9*
1.5
9*
-
2.4
0.0
1 30
2017
Rank Value per Advisor
Eurohold SL
Rank
PricewaterhouseCoopers
3
Financial Advisor
62.9
Change in
▼
24.1
-
-
2.0
0.0
6.1
2.0
-
0.0
-181
100.0
69.08*
-10
Deals
▼
▼
3
MM8a - Undisclosed Values & Values up to US$50m
6
Rank Value
-13
8
1
-
0.0
0.0
-
-
-
0.0
▲
0.0
0.0
0.2
-
24*
0.0
▲
▲
▼
9*0.0
-
7
-0.0
-
-
2.0
-
-
-
-
-
-
18*
-
37.1
0.0
0.0
▲
▲
0.0
0.0 9*
9*
9*
0.0
44.6
7
▲ 0.0
2018
28.0
First Half 2018 │ Small-Cap M&A Up To US$50m │ Financial Advisors
10
0.0
0.3
▲
18*
2
0.0
9* -
9*
-
Industry Total 509
0.0
0.0
9* -
0.0
873.8
-9*0.0
-
32* 1
2
32* 1 0
0.7
8*
3*
31.0
-
9*
Jan 1 - Jun 30
-
-
-96.1
9*
-
0 -
2
▼
2
0
32*
-61 1,054.8
17.4%
14.1%
11.9%
11.4%
9.1%
8.8%
7.6%
5.9%
4.9%
3.7% 2.9% 2.3%
Healthcare
Real Estate
Financials
Industrials
Materials
High Technology
Consumer Products and Services
Energy and Power
Retail
Telecommunications
Consumer Staples
Media and Entertainment
-
50
100
150
200
250
300
350
$0.0
$0.2
$0.4
$0.6
$0.8
$1.0
$1.2
# o
f D
eals
Rank V
alu
e (
US
$b)
US$0 - 10m US$10 - 20m US$20 - 30m US$30 - 40m US$40 - 50m # of Deals
11

*tie
Source: Thomson Reuters
- -0.0 0.0 24* - - -Goldman Sachs & Co 21* 25* 3 0 -
1 204.5 ▲ 0.8 59* 30.8
9* 100.0
Handelsbanken Capital Markets 21* 11* 3 -5 ▼ 74.3 61.3
0.0 0.0 24* - - 3.0UB Capital Oy 21* - 3 3 ▲
Credit Suisse 21* 22* 3 -1 ▼ 33.9 27.5 10 121.6 ▲ - - -
Grant Thornton 21* 25* 3 0 - 0.0 0.0 24* - - 0.3 62* 100.0
KBS Corporate Sales Ltd 21* - 3 3 ▲ 6.1 5.2 20 - - 2.2 12 100.0
Valentum Partners AB 21* 34* 3 1 ▲ 0.0 0.0 24* - - 3.0 9* 100.0
-24*
▼-1051,021
34*
34*
10
8
-
Change (%)
-
-
-
24*
24*
-
-
** Fee
Rank
-
Nordic Small-Cap M&A up to US$50m by Target Industry
https://www.thomsonone.com
25*
13*
JP Morgan
Advium Corporate Finance
13*
Clearwater International
21*
13*
Lazard
13*
Global M&A 3
Citi
4
Morgan Stanley
13* 48*
25*
48*13*
7*
10* 5
5
DNB ASA
ABG Sundal Collier 13* 15* 4
MM9a - Undisclosed Values & Values up to US$50m
202*
Deloitte 10* 17*
Rothschild & Co 69
5
Nordic Small-Cap M&A up to US$50m by Rank Value Range
Oaklins (FKA M&A Intl Inc)
Carnegie 8 13*
SEB 13*
Danske Bank 10* 5
22*
4
4
24*
Nordic Involvement Small-Cap Rankings (MM9a)
100.0
1.3
2.0
0.3
-
28*
-
8.0
8
-
4
-
2
30.0
0.0
▼
0.0
-
13*
-
Jan 1 - Jun 30
13*
-
100.0
51.6
189.8
50.0
-
100.0
2*
-
6.0
1.0
180.2
54.7
▼ 100.0
66.7
▲
33.6
8.0
0.0
38.5
0.0
0.0
44.92,500.2 -12.1
1
0.0
40.1
0.0
0.0
0.0
▲
-5
0.0
-12
1
-2
▲
▼
0.0
0.0
0.0
24*
24*
24*
24*
0.0
13.4
0.0
0.0
▲
7
66.0
16.4
0.0
97 11*
▼
0.0
2
▲
-0.0 24*
US$m
▼
16
31.5
▼
1
** Fee exposure indicates each firm's mid-market fees from deals valued at up to US$50m as a percentage of its overall M&A fees in the relevant region.
Industry Total 2,068.3 ▼
-
▲14
2017
0
3
4
4
4
13*
-0
-3
3
▲
IMAP
KPMG
7*
▲
2 ▲
▼
-2
▲1
6
Rank Deals
4* 4
Rank
100.0
1.3
Euro mil
2018
35.3
# of Deals
Rank Value
1
▼ 9 ▼-54.8
2018
100.0
1
23
1.2
# of
18 1.4
Rank
2▲
-4
0.0
Exp (%)
Change in Advisor
100.0
17.0
28.7
Clairfield International
PricewaterhouseCoopers
12
-3
4*
3 1725*
14
414
▼
80.8
-
36.1
4.0
24*
162.1
14
2018
27
First Half 2018 │ Small-Cap M&A Up To US$50m │ Financial Advisors
Fees
24.9
Rank Value
Jan 1 - Jun 30
Rank Value per Advisor
Financial Advisor
24*
-
Translink Corporate Finance
Ernst & Young LLP
-1
-
2.0
-
-
-
8
-
4
▲
6.3
57.4
62*
-
-
- -
-
▼
64.6
-
158.4
2*
-
-
-
-
3.0
-
-
6
-
▲
24*
-54.9
3
5
-
-
▲
-
-
-
-
5
7.0
100.0
-
36.1
Imputed Fees (US$m) †
9*
-
-
-
24*
4
57.7 49.1
66.6
0.0
54.0
# of Deals per Advisor
0.0
20.3
-4
2*
† Imputed Fees shown are based on completed deal activity, whereas deal count & rank values are compiled based on announced deal activity.
6
70.6
35.8
16.4%
13.7%
13.3%
12.1%
9.3%
9.1%
7.2%
5.7%
5.7%
3.8% 3.7% Industrials
Consumer Products and Services
High Technology
Real Estate
Healthcare
Media and Entertainment
Telecommunications
Energy and Power
Materials
Retail
Consumer Staples
-
100
200
300
400
500
600
700
800
$0.0
$0.2
$0.4
$0.6
$0.8
$1.0
$1.2
$1.4
$1.6
$1.8
# o
f D
eals
Ra
nk V
alu
e (
US
$b
)
US$0 - 10m US$10 - 20m US$20 - 30m US$30 - 40m US$40 - 50m # of Deals
12

*tie
25* - - 1.0 38* 100.0
19* 100.0
GCA Corp 30* 30* 3 1 ▲ 0.0 0.0
0.0 0.0 25* - - 2.0Banque Degroof Petercam SA 30* 30* 3 1 ▲
25* - - - - -
- -
Jefferies LLC 30* - 3 3 ▲ 0.0 0.0
0.0 0.0 25* - - -Bank of America Merrill Lynch 30* - 3 3 ▲
25* - - 2.0 19* 100.0Livingstone Partners 30* - 3 3 ▲ 0.0 0.0
0.0
33.9
0.0
- - -
-
- 1.0
-
38* 100.0
35
25*
- -
-
- -
- - 3.0
25* -
0.0
0.0
0.0
25*
0.0 0.0 25*
8*
1.0-0.0
-
0.0
0.0
- 1.8
6.0
38* 100.0
25* -
19* 6.1
0.2 85* 1.1
61.9
2.2
6.0 8*
- -
72.3
5.518
--
0.0 0.0 - -
5.2 4.2 22
BNP Paribas SA 30* 55* 3 2 ▲
BBVA 30* - 3 3 ▲
Deutsche Bank 30* 55* 3 2 ▲
Goldman Sachs & Co 21* 18* 4 -1 ▼
William Blair & Co 21* 30* 4 2 ▲
Alantra Partners SA 21* 23* 4 1 ▲
Macquarie Group 21* 30* 4 2 ▲
Credit Suisse 21* 30* 4 2 ▲
Citi 21* 23* 4 1
Morgan Stanley 21* 55* 3
4
7
2 7
8
23*
Deals
30* 4
10*
7*
9*
-
10
- -
Benelux Small-Cap M&A up to US$50m by Rank Value Range
100.0
25*
Jan 1 - Jun 30
-
18
3.0
- -
25*
25* -
-
-77.2 ▼
-
16*
12.0
-
100.0
-
UBS 20
† Imputed Fees shown are based on completed deal activity, whereas deal count & rank values are compiled based on announced deal activity.
4
Jan 1 - Jun 30
▲
0.0
Benelux Small-Cap M&A up to US$50m by Target Industry
100.0
https://www.thomsonone.com
47.6
5
1
▼
-4
10
7
9
7*
9*
9
12
# of Deals
4
17
20
-2
13
8
10
9
-
25*
-
97.7
▼
527.5
Rank Value
6
▲
▲
▼
▼
2
# of Deals per Advisor
Rank
10
6
# of
-15
-2
10 6*
100.0
18.2
3
20.5
Change in
-9
▼
25.7
100.0
100.0
** Fee
100.0
52.4
Imputed Fees (US$m) †
28.8
Rank
3 60.6
Rank Value per Advisor
Benelux Involvement Small-Cap Rankings (MM10a)
--
11
-
86.4
0.8
6*25*0.0
-
-
▲
-
-
-
0.0
-0.0
4.8
2018
Euro mil
21*
7
0.0
5.7
1*
▼
-16
4
8
5
0.0
0.0
25*
-
0.0
11
15*
Source: Thomson Reuters
-4
1
-1
2017
** Fee exposure indicates each firm's mid-market fees from deals valued at up to US$50m as a percentage of its overall M&A fees in the relevant region.
21.9
14.0
▲
▲
▼
▲
25*
20
0.0
13.7
6 4
201*
Oaklins (FKA M&A Intl Inc) 3
Cooperatieve Rabobank UA
MM10a - Undisclosed Values & Values up to US$50m
US$m
3 ▼
▼
PricewaterhouseCoopers 10*
ING
Financial Advisor
4*
4*
4*
Lazard
8*
8*
4*
Lincoln International 14*
14*
JP Morgan
RBS
Baker Tilly International 10*
Globalscope
IMAP 14*
14*
18*
Clairfield International
55*
21*
-
▲
▲
6
30*
Houlihan Lokey 21* 55*
Barclays
5
0.0
-4
0.0
▲
3
▼
8
▲
0.0
24.7
10*
0.0
24.7
11.3
Deloitte
Kon SpA
Ernst & Young LLP
BDO
KPMG
Rothschild & Co
20.0
-73.3
16
0.0
Change (%)
0.0
11.2
-
-
-76.0
▲
▼
▼
4
0.0
0.0
11.4
0.0
9.3
▲
▲
0.0
25*
25*
0.0
25*
8
25*
0.0 -
8.0
10.0
0.0
0.0
15
25*
0.0
16.5
17.6
0.0
2
25*
25*0.0 -
-
0.1
17.0
Fees
▼
7.0
-
2018
25*
6
First Half 2018 │ Small-Cap M&A Up To US$50m │ Financial Advisors
13.00.0
2018
-
-68.2
-
▼
▼
-
-54.4
-
1.5 36
1.1
-
- -
Rank
-
100.0
Exp (%)
100.0
100.0
40.3
100.0
37
75*
1
740.9
0.8
Advisor
-
8*
4
90*
-
6.0
7.0
5
-
100.0
75*
-
5.4
-
-
-13.4
Rank Value
Industry Total 851
-11
Rank
-99
-
▼
100.0
0.0 0.0 25*
0.0
- 2.0
252.7
- 2.0
1* -
19* 15.5
38.8
Capitalmind
1,642.82,000.5
18* 11 6 -5 ▼
16*
18.5%
14.4%
14.1%
10.2%
8.0%
7.8%
7.0%
6.8%
5.0%
4.6% 2.5% Industrials
Real Estate
High Technology
Consumer Products and Services
Financials
Media and Entertainment
Materials
Retail
Healthcare
Consumer Staples
Energy and Power
Telecommunications
-
100
200
300
400
500
600
$0.0
$0.2
$0.4
$0.6
$0.8
$1.0
$1.2
$1.4
$1.6
$1.8
# o
f D
eals
Ra
nk V
alu
e (
US
$b
)
US$0 - 10m US$10 - 20m US$20 - 30m US$30 - 40m US$40 - 50m # of Deals
13

*tie
Source: Thomson Reuters
- - -- 0.0 0.0 17* - -
- - - - -
JP Morgan 11* 14* 2 0
- -
Lazard 11* 19* 2 1 ▲ 0.0 0.0
0.0 0.0 17* - - -Goldman Sachs & Co 11* - 2 2 ▲
1,040 -508
▲
97.9
21* 100.0
2.0 5*2 ▲
54.9
LionTree Advisors LLC 11* - 2
2
Industry Total
2
HSBC Holdings PLC 11* - 2
Eastern European Small-Cap M&A up to US$50m by Rank Value Range
9.0
-
-
17*
-
17*
-
1
** Fee
▼
11.0
7
▲
0.0
47.2
-
0.0
-
17*
-
▼
CMT Advisory Sp zoo 11* -
- -
** Fee exposure indicates each firm's mid-market fees from deals valued at up to US$50m as a percentage of its overall M&A fees in the relevant region.
0.0
MM16a - Undisclosed Values & Values up to US$50m
10*
Deals
23*
Euro mil
-
# of Deals
-
-2
Eastern European Small-Cap M&A up to US$50m by Target Industry Jan 1 - Jun 30
-
-
8.7
7*
-
2
47.2
2
0.0
0.0
Eastern Europe Involvement Small-Cap Rankings (MM16a)
Fees
Clairfield International 11*
-
Rank
21.5
-24.5
-
-
-
-
2*
17*
17*
17*
0.0
Rank Value
11
11*
▲
2
0.0
57.9
▲Citi
Advisor
▼
▼
1.0
- -
0.7
-
1,470.4
-
-
17*
-
-
-
-
-
-
0.7
1,784.6
100.0
100.0-
17*
-
https://www.thomsonone.com
-15
-4
6
1
3
9
3
5
7*
3
3
14*
-
# of Deals per Advisor
RankFinancial Advisor Rank
IMAP
▼
2018 2017
4
-152
▼
▼
# of
-9
0.0
4
▼
▲
-1
0
57.9
10
3
6
42.4
57.9
41.349.5
25.5
49.5
0.0
▲
▲
47.2
52.2
2
▲
Akis Bagimsiz Denetim ve
Morgan Stanley
-
UBS
-
2
2
2
-
11*
-
1*
Globalscope
10*
19*
1
3
7*
Blackwood Capital Pty Ltd
Rothschild & Co
Credit Suisse
11*
5*
5*
Barclays
7*CFI
11*
7*
11*
Equity Advisors Sp zoo sk
Mediobanca
7*
1*
KPMG
4
11*
Oaklins (FKA M&A Intl Inc)
Deloitte
3
0.0
2018
7.0
8.7
0.0
33.9
13.3
Rank Value per Advisor
10.4
10
14 -
-64.5
15
17*
0.0
60.9
5
2*
17*
0.0
2*
0.0
0.0
1
-
-
100.0
100.0
0.3
33.2
1.0
-
-
▲
0.5
-
First Half 2018 │ Small-Cap M&A Up To US$50m │ Financial Advisors
-
-
21*
-
-
100.0
100.0
-
100.0
-
100.0
-
-
-
-
100.0
2018
-
7*
-
Rank
25
-
-
Change (%)
-
0.0
0.0
27.5
Rank Value
US$m
Jan 1 - Jun 30
Exp (%)
4- 3.0
† Imputed Fees shown are based on completed deal activity, whereas deal count & rank values are compiled based on announced deal activity.
-
-
-
-
40.3 ▲ -
▼
-
0.0
2
2
2
-5
3
3
4
2
Change in
▲
▲
▼
▲
-
-
2075.0
-
-
-
-
10 -
Imputed Fees (US$m) †
2
2
17.7%
17.1%
15.7% 11.2%
9.2%
7.2%
7.0%
4.3%
4.0%
3.1%
Financials
Materials
Industrials
Media and Entertainment
Energy and Power
Real Estate
Consumer Staples
Consumer Products and Services
High Technology
Healthcare
Retail
Telecommunications
-
200
400
600
800
1,000
1,200
1,400
1,600
$0.0
$0.5
$1.0
$1.5
$2.0
$2.5
# o
f D
eals
Ra
nk V
alu
e (
US
$b
)
US$0 - 10m US$10 - 20m US$20 - 30m US$30 - 40m US$40 - 50m # of Deals
14

*tie
Source: Thomson Reuters
- 2.6 8* 27.1
-
Lazard 26* 14* 5 -3 ▼ 32.5 - -
38.2 - -5.7 ▼ - -
▼ 2.0 12* 100.0
Citi 26* 14* 5 -3 ▼
-
Avendus Capital Pvt Ltd 26* 37* 5 1 ▲ 12.0 - -65.7
79.1 11 -50.3 ▼ - -
▼ - - -
RHB 26* 14* 5 -3 ▼
-
Minsheng Securities Co Ltd 26* 72* 5 3 ▲ 12.1 - -51.2
- 17.6 96 -81.0 ▼ -
- - 4.0 4* 9.0
Guotai Junan Securities 26* 28* 5 0
Morgan Stanley 26* 12* 5 -4 ▼ 0.0
30.0▲ 488.3Industry Total 2533,913
130*
-
Haitong Securities Co Ltd
MM13a - Undisclosed Values & Values up to US$50m
Goldman Sachs & Co
-
12*
32.1
Daton Securities Co Ltd
16*
26*
26*
7
7
5
6
0.0▲ -
CITIC
40.1▲
-
-5.6
-
-
11.3
-
Hochinma Small-Cap M&A up to US$50m by Rank Value Range
83.3
-
100.0
-
-
268.9
2.0
0.2
1.0
--
82.9
265.9
1.0
0.1
Hochinma Small-Cap M&A up to US$50m by Target Industry
20.8
-
-
-
5
▼
▲
https://www.thomsonone.com
Jan 1 - Jun 30
9
31.5
▲
▼
106*21*
21*
21* 6
100.35
4
72* 4
6
Ballas Capital Ltd
72*
9* -4
6
6GF Securities 21*
21* 5Guangzhou Securities Co Ltd 106*
0.0
-
-
-▲
▲
▲
7
7
7
16* - 7
16* 56* 4
7
62.0
7 0
3 ▲
0.0
0.0
▲
-
2
Tianfeng Securities Co Ltd 130*
22*
▲
43
8
6140.0▼
912*
14* 106*
37*UBS
16* 72*
Huaxi Securities Co Ltd
8
14
▲ 4
9 0.0
9.48
9 ▲
▲
10
1010
-8
-2
-
6*Veda Capital Ltd
KPMG 9
106*
4
14*
12*
Kingston Corporate Finance Ltd
6
-4 ▼
25
▲917
14
20*
15
27
▲
13
21
Rank
2018
Change (%)
▼
4 ▲
▼
-20
5
130*
1
China Renaissance Partners
3
6*
Huatai Securities Co Ltd
1
2 5
Bank of America Merrill Lynch
16*
14*
3
5
Euto Capital Partners Ltd
JP Morgan
Deutsche Bank
106*
-
Great Wall Securities Co Ltd
Industrial & Comm Bank China
20*
Ernst & Young LLP
12*
4
0.0 -
-
61
-24.8
-
31.5
0.0
11
Imputed Fees (US$m) †
Advisor
Gram Capital
46.9
1
133.2
46.2
** Fee exposure indicates each firm's mid-market fees from deals valued at up to US$50m as a percentage of its overall M&A fees in the relevant region.
22*
First Half 2018 │ Small-Cap M&A Up To US$50m │ Financial Advisors
52.3
33
-
-
22.0
▲
▼
-
148.4
▲
155.8
-
6.8
-
30.5 ▲
-
-
-80.2
▼
-
† Imputed Fees shown are based on completed deal activity, whereas deal count & rank values are compiled based on announced deal activity.
▲
10*
Deloitte
2017
23*
▲
China International Capital Co
10*
Sinolink Securities Co Ltd
Financial Advisor
8
5
Deals
Rothschild & Co -1
13
▲
-77
▲
7
▼
# of Deals per Advisor
-58.4386.7
-
▼
-50.2 ▼
133.8 ▲
-49.4
-19.0
-
-
▼
-
-79.9
▼-47.4
-
▼
▼
-
57
# of Deals Rank
Hochinma Involvement Small-Cap Rankings (MM13a)
Rank
82*
-
1.0
-
-
-
▼
Jan 1 - Jun 30
-
2018
282.0
-
325.6
6.0
82*
-
11
-
2.1
-
0.2
3
-
30*
-
-
33.3
-
▲
-36.8
3
7
2868.0
▼
▲
10
5
16.5
Change in
▲
2
2018
12
Fees
21.0
4*4.0
Exp (%)
10
-
63.1
-
2.5
1
18.1
10.0
-
- -
-
16.1
-
12*
30*
100.0
-
30,350.3
62.0
Rank Value
-
-
33.3
0.0
30*
2
** Fee
- -
100.0
# of
71.3
-
-
66.7
-
91.2
-
26.3
3.0
96*
2.0
-
US$mRank
500.6 ▲
-
-
Rank Value per Advisor (US$m)
Rank Value
16.6%
13.4%
11.2%
10.7% 9.3%
9.0%
8.2%
7.2%
5.7%
4.4%
2.6% High Technology
Industrials
Financials
Materials
Healthcare
Real Estate
Consumer Products and Services
Energy and Power
Consumer Staples
Media and Entertainment
Retail
Telecommunications
-
500
1,000
1,500
2,000
2,500
$0
$5
$10
$15
$20
$25
# o
f D
ea
ls
Ra
nk V
alu
e (
US
$b
)
US$0 - 10m US$10 - 20m US$20 - 30m US$30 - 40m US$40 - 50m # of Deals
15

Industry Total
*tie
Source: Thomson Reuters
▼ 0.2 41* 100.0
-
Messis Capital Ltd 19* 17* 2 -1 ▼ 4.4 64 -93.3
17.1 - - - - -
- - - -
China Af Corporate Fin Ltd 19* - 2 2 ▲
-
Oceanwide Capital Ltd 19* - 2 2 ▲ 36.4 - -
62.3 11 - - - -
▲ 0.7 19* 100.0
Frontier Financial Group Ltd 19* - 2 2 ▲
-
Grand Harbour Corporate Fin 19* 55* 2 1 ▲ 35.4 29 61.6
67.2 9 - - - -
▲ 0.4 28* 100.0
Zhongtai Securities Co Ltd 19* - 2 2 ▲
47.6
Grand Moore Capital Ltd 19* 30* 2 0 - 72.3 6* 402.1
17.5 56* -63.3 ▼ 1.0 11*
- - - -
Somerley 19* 2* 2 -6 ▼
100.0
Tianfeng Securities Co Ltd 19* 55* 2 1 ▲ 0.0 - -
0.0 - - - 1.0 11*
- - - -
Moelis & Co 19* - 2 2 ▲
-
Bank of America Merrill Lynch 19* - 2 2 ▲ 0.0 - -
35.0 - - - - -
▼ - - -
Goldin Equities Ltd 19* - 2 2 ▲
100.0
Citi 19* 30* 2 0 - 38.2 - -5.7
28.7 37 -59.5 ▼ 0.2 41*
▲ - - -
Nuada Ltd 19* 10* 2 -2 ▼
72.0
Crescendo Capital 19* 10* 2 -2 ▼ 72.5 5 571.3
0.0 - - - 1.8 9*
- 0.4 28* 44.4
Houlihan Lokey 19* - 2 2 ▲
-
Ernst & Young LLP 19* 30* 2 0 - 0.0 - -
67.7 8 168.7 ▲ - -CIBC World Markets Inc 19* 55* 2 1 ▲
-
12
4*
500.6
-72.3
4*
17*
10*
699
-
14*
Industry Total -55
4*
-
8*
17*
17*
55*
2
4
4
4
3
19*
-
14*
6*
8*
19*
8*
14*
Kingston Securities Limited ▲
Red Sun Capital Ltd
-
First Shanghai Investments
3
30*
-
2
▼
10
2
2018
30.5
100.0
141.6
28*
100.0
▲
Advisor
282.0
-
Hong Kong Small-Cap M&A up to US$50m by Rank Value Range
Jan 1 - Jun 30Hong Kong Small-Cap M&A up to US$50m by Target Industry
-
https://www.thomsonone.com
72.3
0.0
▲ -
42.1
3
6*
0.0 -
▲
-
14
0.0
121.0
-
--
--
-
-
-
- -
▲
3
3
▲
-
3 7.6
-3
-
▲
-4
▼
49.9
61.6
▲
0.0
▼
2018
-
2
-3
4
5
3
UBS
China Construction Bank
Morgan Stanley
Ballas Capital Ltd
Gram Capital
Euto Capital Partners Ltd
2017
3
4
Jan 1 - Jun 30
Deloitte
Veda Capital Ltd
▼
Change (%)
Rank Value
▼
-
8*
8*
China Great Wall Asset Mgmt
China International Capital Co 14*
Shinco Capital Ltd
JP Morgan
-
† Imputed Fees shown are based on completed deal activity, whereas deal count & rank values are compiled based on announced deal activity.
▲
Optima Capital Ltd 14*
59.3
Daton Securities Co Ltd
21
16
13
65.6
Amasse Capital Ltd 8*
2*
▲
4
4
1
▼
62.0
22.0
▲
3
33.0
2
7
100.3
-
-80.6
▲
▲
▲
2
50
-
1
▲
5
5 5
10
6
5
5
-14
2
1 14
2*
Industrial & Comm Bank China
Financial Advisor
Kingston Corporate Finance Ltd
30*
Rank
MM12a - Undisclosed Values & Values up to US$50m
Hong Kong Involvement Small-Cap Rankings (MM12a)
Fees
2018
RankRank
-
▼
-
Rank Value per Advisor (US$m)
8.3 -
First Half 2018 │ Small-Cap M&A Up To US$50m │ Financial Advisors
-
Rank Value
1
# of Deals per Advisor
▲
Deals
# of
-56.7
4
# of Deals
1946.2
320
265.9
2
142.9
▲
4
1
▼
55*
4*
-
1
-67.6
▲
▼
▲4
0.0
91.2
Exp (%)Rank
-
41.7
2
1.0
0.2
-
2.0
100.0
-
** Fee
11*
Imputed Fees (US$m) †
-
-
100.0
100.0
0.2 41*
0.4
-
0.7
-
-60.4
- -
3.1
0.1 47*
2.1
-
-
0.3
-
** Fee exposure indicates each firm's mid-market fees from deals valued at up to US$50m as a percentage of its overall M&A fees in the relevant region.
114.8
0.7
4.0
-
▲
Change in
US$m
-2.7 96.0
-
4*
36*
-
100.0
-
100.0
▼
-
▲ -
-
34.1
-
100.0
19* 21.2
100.0
-
-
19*
1
41*
3
▲
6,983.2
3
16.0%
15.0%
10.9%
9.0% 8.2%
8.0%
7.5%
7.3%
7.1%
6.1% 2.4%
Financials
Real Estate
High Technology
Industrials
Materials
Energy and Power
Healthcare
Consumer Staples
Consumer Products and Services
Media and Entertainment
Retail
Telecommunications
-
50
100
150
200
250
300
350
400
450
500
$0.0
$0.5
$1.0
$1.5
$2.0
$2.5
$3.0
$3.5
$4.0
$4.5
$5.0
# o
f D
ea
ls
Ra
nk V
alu
e (
US
$b
)
US$0 - 10m US$10 - 20m US$20 - 30m US$30 - 40m US$40 - 50m # of Deals
16

*tie
Source: Thomson Reuters
- - - -
-
CIT Group Inc 20* - 1 1 ▲ 0.0 - -
0.7 - - - - -
- 0.7 25 100.0
Crowe Horwath International 20* - 1 1 ▲
-
Ocean Reach Advisory 20* - 1 1 ▲ 48.1 7 -
0.0 - - - - -
- - - -
MVP Capital LLC 20* - 1 1 ▲
100.0
Luminis Partners Pty Ltd 20* - 1 1 ▲ 47.6 9 -
0.0 - - - 1.0 14*
- 1.0 14* 100.0
KBS Corporate Sales Ltd 20* - 1 1 ▲
-
Novo Capital 20* - 1 1 ▲ 0.0 - -
0.0 - - - - -
- 0.4 31* 100.0
Hovde Group LLC 20* - 1 1 ▲
100.0
Canterbury Partners Pty Ltd 20* - 1 1 ▲ 23.1 18 -
21.7 19 - - 0.4 31*
- 0.2 34* 100.0
TMT Partners Pty Ltd 20* - 1 1 ▲
-
Cairn Financial Advisers Ltd 20* - 1 1 ▲ 14.0 23 -
47.9 8 - - - -
- - - -
Amidas Partners Inc 20* - 1 1 ▲
100.0
HSBC Holdings PLC 20* - 1 1 ▲ 0.0 - -
4.0 - - - 0.1 39*
- - - -
Arlington Group Management Ltd 20* - 1 1 ▲
100.0
BDO 20* 8* 1 -4 ▼ 0.0 29* -
0.0 - - - 1.0 14*
- - - -
Record Point 20* - 1 1 ▲
100.0
Miles Advisory Partners 20* 17* 1 -1 ▼ 32.5 14* -
18.9 21 - - 0.5 27*Atlas Technology Group LLC 20* - 1 1 ▲
- - - 1.0 14* 100.0
- - -
ICECAPITAL Securities Ltd 20* - 1 1 ▲ 0.0
- -
Murray & Co 20* - 1 1 ▲ 0.0 -
▼ 0.0 29* - - -
Nordea 20* - 1 1 ▲ 0.0 - - - 1.0 14* 100.0
Greenstone Partners 20* 26* 1 0 - 0.0 - - - - - -
Grant Samuel 20* 17* 1 -1 ▼ 0.0 - - - - - -
Citi 20* 10* 1 -3
Houlihan Lokey 20* 5* 1 -5 ▼ 0.0
▲
876
1 1
-Evercore Partners -
-17.3
-
-
29*
- -
- -
- -
0.0
20* 26* 1 0 - -
1 ▲China International Capital Co 20* - 1
-
0.0 -
Jan 1 - Jun 30
3,917.3
20* - 1 1
26*
▲
1 0
- 1 ▲
-
-
--
1EC Hambro Rabben 20*
11*
6
Huatai Securities Co Ltd 20* -
20*
Beaumont Cornish
Industry Total
4
-
3
9*
2018
17*
11*
2017
# of Deals per Advisor
7*
4
5
9*
7*
-7
3*
5
Deals
# of
# of Deals
Change in
Goldman Sachs & Co
-11
0.0
40.8
US$m
0.0
▲
▲
▲
-62
29*
Rank Value
▼
1
135.2
100.0
100.0
Jan 1 - Jun 30Australia/New Zealand Small-Cap M&A up to US$50m by Target Industry
https://www.thomsonone.com
13
7*
Rank
60.8
66.7
100.01.2
4*
Change (%)
88.0 ▲
3
4.0
-
83.7
0.0
Financial Advisor
▼
Imputed Fees (US$m) †
Advisor
▲
4.3
▲
FeesRank
2
Australia/New Zealand Small-Cap M&A up to US$50m by Rank Value Range
Exp (%)
2.0
21.1
Rank Value ** Fee
--
Rank Value per Advisor (US$m)
Rank
4 -39.0
8
0.5
Greenhill & Co, LLC
Rothschild & Co
4
17*
5*
▼
- 3
3 3
3
3-
▼
3
3
▲
5
0.0▲
▲
-1
2447.4
0.0▲
1 32.5
648.4▼
3
17
2
▲
▲
▼
0.0
12
23.2
29*
-
2018
Australia/New Zealand Involvement Small-Cap Rankings (MM11a)
MM11a - Undisclosed Values & Values up to US$50m
-
▲
74.1
66.2
Macquarie Group
PricewaterhouseCoopers
Rank
92
1 ▲15 7
▲83*
0.2
0.2
▲
-
† Imputed Fees shown are based on completed deal activity, whereas deal count & rank values are compiled based on announced deal activity.
-
-
- -
-
33
25.0
35.5
34*
-
-
43.5
-
100.0
-
34*
23*
16
1.0
-
2.0
-
▼
6
4.3
-
1.8
-
-
5
0.8
0.3
-
Hartleys Ltd
- 3.0
-
--
14*
69.7
10
-
- -
-
▼-29.9
Deloitte
52.5
-
10
65.6
-
3
26*
CIBC World Markets Inc
Lazard
26*
Allier Capital
13*
5*
26*
Bank of America Merrill Lynch
KPMG
Investec 17*
-
2
UBS
Argonaut Ltd
11*
11*
3
** Fee exposure indicates each firm's mid-market fees from deals valued at up to US$50m as a percentage of its overall M&A fees in the relevant region.
2
Oaktower Partnership Pty Ltd
-711*
Barclays
Ernst & Young LLP
5*
6
1
5*
-
3
▼
▲
2 2
Euroz Securities Ltd
2
11*
4.9
33.9
23*
11
2 39.7
1.6
-
20.5
-
4.6
4*4.0
-
47.1
0.8
22.7
First Half 2018 │ Small-Cap M&A Up To US$50m │ Financial Advisors
51.83
- ▲
2
-1
1
7
13
11
45.3
▲
27*
0.6
30.5
50.4
14.8-1
0 -
- - -
17*
2
1
Taylor Collison Ltd
22
-
0.0 -
-
0.0 -
-
-
-
25.6
14.1
39.0
-
-
20
-
0.0
9.3
-
0.0 -
▲
2.1 - -
-
10*
Nomura 20*
-
0.0 -
0.0 - - -
25
0.1
-
24 - -
26.7
-
- -
2018
26
- -RBC Capital Markets 20* 26* 1
5.5
3 41.4
21.4
▼
17*
100.0
-
-
16.5
-
100.0
100.0
-
-Azure Capital 20* 26* 1 0 -
First NZ Capital 20* 26* 1 0 -
Morgan Stanley 20* 13* 1 -2 ▼
Deutsche Bank 20* - 1 1 ▲
Credit Suisse 20* 26* 1 0 -
Cameron Partners Ltd 20* 26* 1 0 -
-
0.0 - - -
14*
- -
0.2 34*
7*
39*
-
1.0 14* 34.5
- -
- -
- -
- - -
- - -
14.7%
13.0%
10.4%
9.4%
9.1%
8.9%
7.9%
7.4%
7.2%
7.1%
5.2% Materials
Real Estate
Industrials
Consumer Products and Services
Healthcare
Energy and Power
Financials
Media and Entertainment
High Technology
Consumer Staples
Retail
Telecommunications
-
100
200
300
400
500
600
700
$0.0
$0.5
$1.0
$1.5
$2.0
$2.5
$3.0
$3.5
# o
f D
ea
ls
Ra
nk V
alu
e (
US
$b
)
US$0 - 10m US$10 - 20m US$20 - 30m US$30 - 40m US$40 - 50m # of Deals
17

*tie
Source: Thomson Reuters
- - - -
100.0
JP Morgan 15* 6* 1 -2 ▼ 0.0 17* -
3.0 14 900.0 ▲ 0.1 21*
- - - -
Plutus Consulting Co Ltd 15* 21* 1 0 -
-
Zico Holdings Inc 15* 6* 1 -2 ▼ 12.7 9 -
0.0 17* - - - -
- - - -
BDA Partners 15* 21* 1 0 -
-
Crowe Horwath Advisory Sdn Bhd 15* - 1 1 ▲ 28.3 7* -
47.6 1* - - - -
- 1.0 6* 100.0
Tata Capital Ltd 15* - 1 1 ▲
-
The Raine Group LLC 15* - 1 1 ▲ 0.0 17* -
0.0 17* - - - -
- - - -
Daiwa Securities Group Inc 15* - 1 1 ▲
100.0
Lazard 15* - 1 1 ▲ 0.0 17* -
3.3 12 - - 0.1 21*
- - - -
Xandar Capital Pte Ltd 15* - 1 1 ▲
100.0
Kaede Group 15* - 1 1 ▲ 1.4 16 -
0.0 17* - - 0.1 21*
- 1.0 6* 100.0
Maxus Corporate Advisory Inc 15* - 1 1 ▲
-
Equiteq LLP 15* - 1 1 ▲ 0.0 17* -
0.0 17* - - - -
- 1.0 6* 100.0
Deloitte 15* 6* 1 -2 ▼
-
Woodside Capital Partners LLC 15* - 1 1 ▲ 0.0 17* -
47.6 1* -31.6 ▼ - -
- - - -
RHB 15* 2* 1 -4 ▼
-
Asia Plus Securities PCL 15* - 1 1 ▲ 43.6 3* -
43.6 3* - - - -
- 1.0 6* 100.0
Far East Asset Corp Co Ltd 15* - 1 1 ▲
100.0
Growin Partners Inc 15* 21* 1 0 - 0.0 17* -
0.0 17* - - 1.0 6*
- - - -
o3 Capital Advisors Pvt Ltd 15* - 1 1 ▲
-
Goldstate Securities Co Ltd 15* - 1 1 ▲ 0.0 17* -
0.0 17* - - - -
- - - -
Avendus Capital Pvt Ltd 15* 21* 1 0 -
-
Greenstone Partners 15* - 1 1 ▲ 0.0 17* -
0.0 17* - - - -Sumitomo Mitsui Finl Grp Inc 15* - 1 1 ▲
- 1 1 ▲ 0.0Frontier Management Inc 17* 100.0
-
41.0
17*
-
2
0.0
1
▲
8*
21*
4*
-
15*
15*
▲
https://www.thomsonone.com
MM14a - Undisclosed Values & Values up to US$50m
-
2
# of Deals
4
Ernst & Young LLP
1
15*
411
15*
Industry Total
-
-17 ▼
▲
21*
4
2
Morgan Stanley
-
Deutsche Bank
17*
17*
Rank
0.0
-
-
0.0
▲
1
5
-
-
Fees
-
US$m
3
6
0
0.0
0.0
Change (%)
-
--
Financial Advisor
100.0
-
50.0
100.0
100.0
--
17*
-
17*
Singapore Small-Cap M&A up to US$50m by Target Industry
32.8
100.0
-
-
100.0
6*
6*
5
-
29*
-
-
100.0
-
0.1
Jan 1 - Jun 30
-
6*
3
3
▲
-
21*
-
-
-
-
-
-
17*
- -
** Fee exposure indicates each firm's mid-market fees from deals valued at up to US$50m as a percentage of its overall M&A fees in the relevant region.
-
100.0
** Fee
0.0
-
0.1
-
Exp (%)
-
1.0
-
0.4
0.4
-
1
-32.2
1.0
-
▼
-
Rank Value
2.0
-
-
-
Advisor
17*
1.4
-
-17*
5 -
17*
-
1*
Rank
-
11
10
0.0
Rank
21*
21*
6*
5
6*
3*
1*
Bank of America Merrill Lynch
-
-
1*
-
81.0
- 1.0 6*
-
21*
2.0
17*
2,344.5
-
-
100.0
4*
-
Deals
6
4
-
▲
Rank Value
-17*
--
-
1*
▲
# of Deals per Advisor
Change in 2017
-
-
Jan 1 - Jun 30
2.0
2
29.5
2018
▲
-
0.0
1
17*
▼
2
ING 15*
▲
-
15*
0.0
Rothschild & Co
2018
Singapore Involvement Small-Cap Rankings (MM14a)
Singapore Small-Cap M&A up to US$50m by Rank Value Range
0.0
40.43
China International Capital Co 6
5
▲-
3*
3*
5
Rank
1*
2018 # of
▲Tianfeng Securities Co Ltd
10*
3
KPMG
4
1 ▲
▲
-
Huatai Securities Co Ltd
Signal Hill Capital Group LLC
15*
▲
Goldman Sachs & Co
-8
2
1
-2
-
Rank Value per Advisor (US$m)
4.3
Kingston Securities Limited
Industrial & Comm Bank China
8*
10*
6*
WH Ireland Ltd
15*
DBS Group Holdings
Veda Capital Ltd
Kingston Corporate Finance Ltd
15*
Development Bk of Philippines
10*
10*
10*Mizuho Financial Group
Mercury Securities
Evercore Partners
SAC Capital Private Ltd 15*
▼
▲
1
13*
-
1
1
1
-1
0
0
1
2
1 -1
21* 1 0
21* -
2.0
0 -
0.0
17*
17*0.0
6.5
3.7
0.0
First Half 2018 │ Small-Cap M&A Up To US$50m │ Financial Advisors
-85.0
-
0.0
3.2
▼
-
17*
17*
-
0.0
-
▲
-
13
† Imputed Fees shown are based on completed deal activity, whereas deal count & rank values are compiled based on announced deal activity.
2
▼
0.0
-
-
15
17*
-
-
▲
117.7
- -
28.3
-
0.0
17* - -
-
7*
-
-
Imputed Fees (US$m) †
6
-
-
-
-
20.6%
17.1%
15.6%
11.6%
8.0%
6.3%
6.1%
5.3%
3.9%
3.3% High Technology
Financials
Real Estate
Industrials
Consumer Products and Services
Media and Entertainment
Healthcare
Energy and Power
Consumer Staples
Materials
Retail
Telecommunications
-
50
100
150
200
250
300
$0.0
$0.2
$0.4
$0.6
$0.8
$1.0
$1.2
$1.4
$1.6
$1.8
# o
f D
eals
Ra
nk V
alu
e (
US
$b
)
US$0 - 10m US$10 - 20m US$20 - 30m US$30 - 40m US$40 - 50m # of Deals
18

*tie
Source: Thomson Reuters
-7
0.020*
Japanese Small-Cap M&A up to US$50m by Target Industry Jan 1 - Jun 30
-
22*
15
24*
24*
-11
3
2
-1
▲
-112
5
3
0
-2
3
† Imputed Fees shown are based on completed deal activity, whereas deal count & rank values are compiled based on announced deal activity.
2
▲
2
2
33.5
-2
2 2
2
▼
-
0.0
47.9
▲
38.2
-
-
12
18
▲
-
1.0
19.3
-
0.0 -
16.7
20
▲
2.0
185.2
1.5
6.0
▼
-17.0
▼
9.2
3.1
-79.6
-27.9
23
17
▼
▼
▼
13*
-
▼
39.5
▲
-28.4
2257.1
1 51.7
0.6
-
31*
-
13*
50*
6.0
-
21*
-
49
19
13*
-
1.1
-
100.0
-
2
0.5
-
-
-
6
▼-53.815
-
Daiwa Securities Group Inc -14
-24.1
10 -14
Frontier Management Inc
92.9 8
51.5
Mitsubishi UFJ Morgan Stanley
GCA Corp 15*
5
0
9
-
-
-
-0.0
-
▼-47.8
-87.3
-
▼
48* 2
Sumitomo Mitsui Trust Holdings
-0.0
▲
-
Lazard
1
▼
20*
-1
1
▼
20*
16*
20* 34* 3
▼
-
6
-8
IMAP 20* 29*
Ernst & Young LLP
es Networks Co Ltd 19
1511* 16*
Professional Partners 18
17
PricewaterhouseCoopers
48*
15*
9
11*
11* 4
12*13
9
6
5
188.9
73.8
▼
▲7
11
70
31
25
9* 11*
8
Mizuho Financial Group
7
Maxus Corporate Advisory Inc
1
13
95
24
20*
3
2017
21
RankFinancial Advisor
# of Deals per Advisor
2
Corporate Advisers
6Nomura
40
10
58.3
7
2
53*▲
▼
-
97.6
100.0
56.6
100.0
▲
▲ 12.0
0.3
-
100.0
14.1
100.0
-
https://www.thomsonone.com
-
-
330.3 ▲
Rank
Jan 1 - Jun 30
Advisor
Imputed Fees (US$m) †
2018
Japanese Involvement Small-Cap Rankings (MM15a)
7
-
** Fee2018
-
-
--
16
-▼
2018
10.7
-
# of
100.0
100.0
▲
84.4
▲
▼
322.8165.3
35*
96.2
-
MM15a - Undisclosed Values & Values up to US$50m
93.8
9.7
-
Japanese Small-Cap M&A up to US$50m by Rank Value Range
Exp (%)
0.0
5
109.5
3
CLARIS CAPITAL 24*
Bank of America Merrill Lynch
Plutus Consulting Co Ltd
Citi
Kaede Group
4
Amidas Partners Inc
KPMG
AGS Consulting Co Ltd
9*
Yamada Consulting Group Co Ltd
Mitsubishi UFJ Financial Group 5
Deloitte
Asahi Zeirishi Hojin 24*
22*
24* -
1
6
Rank Value
Rank Value per Advisor (US$m)
127*
-8
First Half 2018 │ Small-Cap M&A Up To US$50m │ Financial Advisors
-0
7
▲
27.2
43.9▼-9
16
46.0
7*
30
4.7
▼
▼ 9
1.8
-35.1
20
Change in
Rank
▲23
9
▲
▲
351.8
25
3
9
1
39.9
# of Deals
286.5
▲
15
-0.2
18.8
16
▲ 10
0.0
-44.5
134.5
-
16.5
6.3
24
-
4
▼
▲
-
47.2
-
21*
16
-
2.0
369.2
-
21*
-4
-
-
- - 0.2 58*
-
-
-
100.0
100.0
2.0 21*
-
-
-
23.8
-
-
-
-
34
1.0▼
Rank
-
496.4
Sumitomo Mitsui Finl Grp Inc
US$m FeesChange (%)
Rank Value
Deals
Godo Kaisha MDM 2
-12
▲
▼
▲
Benedi Consulting
29*24*
83.32.0Oaklins (FKA M&A Intl Inc) 24* 48* 2 1
47.65.5
24*
-
-
100.0
-
▲
** Fee exposure indicates each firm's mid-market fees from deals valued at up to US$50m as a percentage of its overall M&A fees in the relevant region.
Industry Total 1,848 249 ▲ 5,415.1
-
▲
-2 ▲ 2.6
8
-
-
-
Goldman Sachs & Co 24* - 2 2
-
3.1 - - - 0.1 61*
-
0.2
-
26.8%
10.8%
9.9%
9.1%
8.6%
7.9%
6.9%
6.1%
6.0%
4.2% 3.7% High Technology
Consumer Products and Services
Retail
Real Estate
Industrials
Media and Entertainment
Financials
Materials
Consumer Staples
Energy and Power
Healthcare
-
200
400
600
800
1,000
1,200
$0.0
$0.5
$1.0
$1.5
$2.0
$2.5
$3.0
$3.5
# o
f D
ea
ls
Ra
nk V
alu
e (
US
$b
)
US$0 - 10m US$10 - 20m US$20 - 30m US$30 - 40m US$40 - 50m # of Deals
19

*tie
Source: Thomson Reuters
† Imputed Fees shown are based on completed deal activity, whereas deal count & rank values are compiled based on announced deal activity.
-
6
-
55.1
31.5
-
36.2
38*
38*
-
▼
0.2
5
-
-
-24.8 ▼
Chinese Involvement Small-Cap Rankings (MM20a)
Guotai Junan Securities
Ernst & Young LLP
-
21* -
-
China Construction Bank 21*
China International Capital Co 4
0.0
-
21*Shenwan Hongyuan Securities Co
Great Wall Securities Co Ltd 8
7*
62.0
40.4
9.4
8* 14*
0.0
Deloitte
https://www.thomsonone.com
-4
1
62*
7
Huaxi Securities Co Ltd 7
917
▼
-
-
▼
30
9 8
119.8
32.1
-
▲ -
46.9
▲
14.22.0
-25.44 0.2
-
4 4Goldstate Securities Co Ltd
-
▼ 33.3
-
- 0.5
-
12.1
▲
-
-51.2
-14.6
6.8
0.0
-
-
Chinese Small-Cap M&A up to US$50m by Target Industry
69
--
-
-
50.0
-
-
-24
▲
74*
▲ 0.0
-93.3
▼
-
-
- -
-
-
--
-
-
4
4 4 ▲
-
0.0
▲
-1 ▼ -
-
-
▲
-
22*-
014* 4
Deutsche Bank 21* 62* 4 3
21* 11*
- - -
---▼China Merchants Securities Co 21* 5* 4 -7 70.0
▼
- -
-
▲
0.0 74*
-
4*
-30* 5 3
▲Goldman Sachs & Co 18*
Daton Securities Co Ltd 18* - 5 5
114* 5
Minsheng Securities Co Ltd 18*
-
▼ 2.0 100.0
▼
4*
-
12* 3 6 -15 ▼
-49.922.4
139.1
4 -
-75.1 ▼ - - -
Gram Capital
Haitong Securities Co Ltd 12* 7* 6 -2
Euto Capital Partners Ltd 12* 30* 6
Veda Capital Ltd 12* 5* 6 -5
-
19
0.0▲
-82.4 ▼ 2.0 4* 100.0
- - -
30* 6 4 ▲
Guangzhou Securities Co Ltd 12* 62* 6 5
Bank of America Merrill Lynch
-
-- -
-GF Securities 12*
Tianfeng Securities Co Ltd 10* 30* 7 5 ▲
- 7 7 ▲
74*0.0
0.0 -
- -
-
33.3
- --
-
-
6.8
-
▲
- -
-
▲8* 62*
8 4
22.0
▲ --
10 - -3155.8▲ -Sinolink Securities Co Ltd -
52.362* 15 14 -
6 - 10
▲
2.5
-
-
Huatai Securities Co Ltd 5
▲
-
3
CITIC
268.9 133.82
-50.2 ▼
15 -5.6
▲
-
-
83.3
8
▼ 10.0
3 2 21
4 27China Renaissance Partners 2
-58.4
2017
US$m
2018
Deals # of DealsRankRank
MM20a - Undisclosed Values & Values up to US$50m
386.7Industrial & Comm Bank China 1
Rank Value per Advisor
Change in
Rank
57 18.1▼
Advisor
Jan 1 - Jun 30
Change (%) Exp (%)
2
Rank
Chinese Small-Cap M&A up to US$50m by Rank Value Range
2018
75.7
Rank Value
▲
** Fee exposure indicates each firm's mid-market fees from deals valued at up to US$50m as a percentage of its overall M&A fees in the relevant region.
21*
4 3
16.5
11.9
2018
-
-0.0
1
21.0
-19.0
1
-
229.9 -
4 4
10▲
▲
First Half 2018 │ Small-Cap M&A Up To US$50m │ Financial Advisors
** Fee
-
-
Jan 1 - Jun 30Ballas Capital Ltd 21* 62*
12
▲
Fees
Imputed Fees (US$m) †
Industry Total 2,559 269
# of Deals per Advisor
Financial Advisor
10*
▲
JP Morgan 21* -
Rank Value
4 4
-76
# of
▼
12
▼
27.6297.523,223.5 ▲
18.5%
14.6%
10.1%
9.9%
9.6%
9.0%
8.2%
7.9%
5.4%
3.5% 2.6%
High Technology
Industrials
Healthcare
Materials
Financials
Real Estate
Consumer Products and Services
Energy and Power
Consumer Staples
Media and Entertainment
Retail
Telecommunications
-
200
400
600
800
1,000
1,200
1,400
1,600
1,800
$0
$2
$4
$6
$8
$10
$12
$14
$16
$18
# o
f D
ea
ls
Ra
nk V
alu
e (
US
$b
)
US$0 - 10m US$10 - 20m US$20 - 30m US$30 - 40m US$40 - 50m # of Deals
20

*tie
Source: Thomson Reuters
Goldman Sachs & Co 12* 8* 1 -2 ▼ 0.0 16* - - 2.0 3* 29.9
GCA Corp 12* 19* 1 0 - 0.0 16* - - 1.0 10* 100.0
Proventis Partners 12* - 1 1 ▲ 0.0 16* - - 1.0 10* 100.0
# of Change in
Rank Value per Advisor
MM21a - Undisclosed Values & Values up to US$50m Jan 1 - Jun 30
Singhi Advisors Ltd 4*
2018 2017
20 100.00.3▲ 6.0 12* - -
15
Metta Capital Advisors LLP 12* - 1 1
-71.4 ▼ - -0.2
5.0
Mark Corp Advisors Pvt Ltd 12* 19* 1 0 - -
6.0 12* - - 0.1 22*Arpwood Capital 12* - 1 1 ▲
8 - - - -
5* -
Baker Tilly International 12* 19* 1 0 - 24.5 -
32.5 - - - -Miles Advisory Partners 12* - 1 1 ▲
- -- -0.0 16* -Equirus Capital Pvt Ltd 12* 14* 1 -1 ▼
Rank Value 2018 Rank Value Advisor
Imputed Fees (US$m) †
2018 ** Fee
Fees Rank Exp (%)Financial Advisor Rank Rank Deals # of Deals US$m
2 18 8 ▲
Rank Change (%)
KPMG 2 1 9 -3 ▼ ▼
84.6 1 170.3
82.9 66.7
26.12.9
Avendus Capital Pvt Ltd 3 5* 5 1 ▲ 12.0 10 -65.7 ▼ 2.0
1.02 -31.8
5* 4 0 - 16.3 9 2.6
▲ -134.4 --
2-11.9
- -4DBS Group Holdings 6* - 2 2 ▲ - -
Globalscope 4* 5* 4 0 - 60.7 3
-
100.0
- 3* 100.0
-
2.0
Deutsche Bank 6* - 2 2 1.0▲ 16* -
o3 Capital Advisors Pvt Ltd 6* 19* 2 1 ▲
5*
Axis Bank Ltd 6* 19* 2 1 7▲
37.5
▼
31.1 -
-
-
Mizuho Financial Group 12* - 1 1
Evercore Partners 12* - 1 1
▲ 0.0 -
-▲ -16*
-
--
--
-
-
-
100.0
-
-
100.0
-
-
Jan 1 - Jun 30
† Imputed Fees shown are based on completed deal activity, whereas deal count & rank values are compiled based on announced deal activity.
https://www.thomsonone.com
** Fee exposure indicates each firm's mid-market fees from deals valued at up to US$50m as a percentage of its overall M&A fees in the relevant region.
10*
10*
-
-
-Deloitte 6*
100.0
8* 2
5.5
6* -1 18▼
3* 2 -3
40.4
0.0
10.014
-
-16.4
0.0
Ernst & Young LLP 1
First Half 2018 │ Small-Cap M&A Up To US$50m │ Financial Advisors
Lazard
▲
▼
100.0
3*
-
▼
1
0.0
32.5
0.2
-
16*
-
-
-
-
0.6
-
-
-
0.0
-
-
16*
-0.0
-
12* - 1
▲
1
- 1 1
0.0▲
Barclays
Intellecap Pvt Ltd -
0.0
8.7 111
Bank of America Merrill Lynch 12* - 1 1
1
1.0
Indian Small-Cap M&A up to US$50m by Target Industry
Indian Small-Cap M&A up to US$50m by Rank Value Range
-
▲
# of Deals per Advisor
▲12*
16*
16*
12*
16* -
Credit Suisse 12* - 1 1
28.9 ▲
16*
21
-
10*
Indian Involvement Small-Cap Rankings (MM21a)
Industry Total 796 3,226.0
▲Global M&A
▲
405.360 ▲ 3,226.0
16.4%
15.3%
12.9%
9.7%
9.1%
9.0%
7.9%
7.7%
5.4%
3.7% 2.9%
Financials
Materials
Industrials
High Technology
Healthcare
Consumer Products and Services
Media and Entertainment
Retail
Consumer Staples
Energy and Power
Real Estate
-
50
100
150
200
250
300
350
400
450
0.0
0.2
0.4
0.6
0.8
1.0
1.2
1.4
1.6
1.8
2.0
Rank V
alu
e (
US
$b)
US$0 - 10m US$10 - 20m US$20 - 30m US$30 - 40m US$40 - 50m # of Deals
# o
f D
ea
ls
21

-
-
-
-
-
Asia-PacificGold VelasquezTel: +632 459 1525E-mail: [email protected]
Japan -
Kaori Motohashi Tel: +813 6441 1142
-
Tel: +1 646 223 5682
https://www.thomsonone.com
While Thomson Reuters has used reasonable endeavors to ensure that the information provided in this document is accurate and up to date as at the time of issue, neither Thomson Reuters nor its
third party content providers shall be liable for any errors, inaccuracies or delays in the information, nor for any actions taken in reliance thereon, nor does it endorse any views or opinions of any third
party content provider. Thomson Reuters disclaims all warranties, express or implied, as to the accuracy or completeness of any of the content provided, or as to the fitness of the content for any
purpose to the extent permitted by law. The content herein is not appropriate for the purposes of making a decision to carry out a transaction or trade and does not provide any form of advice
(investment, tax, legal) amounting to investment advice, nor make any recommendations or solicitations regarding particular financial instruments, investments or products, including the buying or
selling of securities. Thomson Reuters has not undertaken any liability or obligation relating to the purchase or sale of securities for or by any person in connection with this document.
© 2018 Thomson Reuters. All rights reserved.
Thomson Reuters and the Thomson Reuters logo are registered trademarks and trademarks of Thomson Reuters and its affiliated companies. Any third party name or mark herein belongs to the relevant third party.
E-mail: [email protected]
Any Involvement league tables include deals where the target, acquiror, or either ultimate parent are domiciled (nation of headquarters) in the specified region or nation.
Financial and legal advisors receive full credit for each deal on which they provide financial or legal advisory services, unless they represent minority sellers or advise on only a portion of the
transaction or Thomson Reuters has not been made aware of their participation in that transaction. For pending transactions, advisors to targets of multiple bids receive credit for the transaction
agreed to or, in the absence of an agreement, the value of the highest offer.
League tables, commentary, and charts citing announced activity are based on Rank Date and include intended, pending, partially complete, completed, pending regulatory, and unconditional
transactions. Rank Date is defined as the earliest public announcement of when a value can be applied to a transaction.
E-mail: [email protected]
Ranking Criteria Summary
Deals with undisclosed dollar values are rank eligible but with no corresponding Rank Value. Non-US dollar denominated transactions are converted to the US dollar equivalent at the time of
announcement of terms.
E-mail: [email protected]
Announced league tables include all deals that were announced between January 1, 2018 and Jne 30, 2018 and of which Thomson Reuters was made aware. All current data and previous year's
data is as of 6:00 pm EST on July 6, 2018.
Ewelina JareckaTel: +44 (0) 207 542 2246
If you would like to participate in the submission
process, receive quarterly press releases, or have
questions about league table criteria please
contact:
A tender/merger transaction is considered to be effective at the time of consummation of the merger or the date on which it is declared wholly unconditional.
Europe, Middle East & Africa
Robert Levine
Americas
League tables include rank eligible mergers, acquisitions, repurchases, spin-offs, self-tenders, minority stake purchases and debt restructurings.
First Half 2018 │ Small-Cap M&A Up To US$50m │ Financial Advisors
22

Thomson Reuters Solutions for the Deal Making Community
FOR INFORMATION PROFESSIONALS
SDC Platinum is the world’s foremost financial
transactions database, covering new issues, M&A,
syndicated loans, private equity, project finance,
poison pills, and more.
Solution for:
• Market Analysis & Trends (Geography, Sector,
Asset Class, Deal Type, Deal Size, etc.)
• Deal Origination (Debt Maturity Analysis,
Company Lifecycle including Private Equity)
• Pitch Creation (Firm Credentials, Representative
Acquirors)
• M&A Targeting (Active Strategic/Sponsor
Acquirors, Target Company Screener)
• Negotiation (T&C Benchmarking)
FOR STRATEGY AND PLANNING TEAMS
Thomson Reuters Deals Business Intelligence
enables you to slice and dice our renowned Deals
and Fees data to create ad hoc reports, analyze
market trends, benchmark your performance and
identify opportunities – all within a tool built into
your workflow in Excel®, saving you valuable time
and giving you a competitive edge.
Solution for:
• Conducting market analysis and identifying trends
• Benchmarking your performance and monitoring
competitors
• Targeting clients by wallet size and banking
relationship
• Allocating resources more effectively by
evaluating and analyzing lost deals
FOR INVESTMENT BANKERS
Thomson Reuters Eikon is the most intuitive
and comprehensive way of staying informed.
With natural-language search, you can quickly
find global information,
news, charts and analytics. Company and
industry views provide top-level summaries,
and then detailed information is just a click
away. Identify new opportunities and gain
deep understanding of markets, industries,
companies and events.
Thomson Reuters Eikon also includes an Add-
In for Microsoft® Office to help you increase
your efficiency. From screening and targeting
to comparables analysis, building league
tables, valuing a company
and developing a client pitch book, you
can do all this without leaving Microsoft
Office. Search and autosuggest features
in Excel make model-building easier.
Solution for:
• Managing Client Relationships
• Deal Origination
• New Issues Pre-Marketing/Roadshows
• Financial Modeling
• Customized League Tables
• Simple Deals screening
• Valuation analysis and comparable
deal screening
• On-brand pitch book creation
©2018 Thomson Reuters
Thomson Reuters and the Kinesis logo are trademarks of Thomson Reuters.
Go to: dmi.thomsonreuters.com/dealsintelligence Email: [email protected]
Send us a sales enquiry at: financial.thomsonreuters.com/sales
Read more about our products at: financial.thomsonreuters.com/products
To purchase individual Thomson reuters Deals or Access unique analysis for free anytime using
League Table reports, please contact our Thomson Thomson Reuters Deals Intelligence website and
Reuters On Demand group: receive regular updates, delivered direct to your inbox.
23