Small Business Tax Index 2014 - sbecouncil.org · Oregon 9.900 24 Oklahoma 5.250 ...
28
Small Business Tax Index 2014: Best to Worst State Tax Systems for Entrepreneurship and Small Business by Raymond J. Keating Chief Economist Small Business & Entrepreneurship Council April 2014 Protecting small business, promoting entrepreneurship www.sbecouncil.org • @SBECouncil • Facebook.com/sbecouncil
Transcript of Small Business Tax Index 2014 - sbecouncil.org · Oregon 9.900 24 Oklahoma 5.250 ...
Small Business Tax Index 2014:
Best to Worst State Tax Systems for Entrepreneurship and Small Business
by Raymond J. Keating Chief Economist
Small Business & Entrepreneurship Council
April 2014
Protecting small business, promoting entrepreneurship www.sbecouncil.org • @SBECouncil • Facebook.com/sbecouncil

2
Small Business Tax Index 2014: Best to Worst State Tax Systems for Entrepreneurship and Small Business
In recent years, the tax story at the federal level has been uniformly negative for entrepreneurs, investors, workers, and the economy in general. Consider that during the Obama years, most major taxes have been increased, including the personal income tax (which most businesses pay rather than the corporate income tax), the capital gains tax, the dividend tax, the death tax, and payroll taxes. With respect to corporate tax rates, they are now the highest in the world. In addition, stability is sorely lacking when it comes to our tax system. Small business owners and entrepreneurs face great uncertainty as to expiring provisions. Many measures remain temporary, or are renewed on an annual basis. Businesses cannot function efficiently or make sound investment decisions when the federal tax system is forever in flux. For good measure, high levels of federal government spending as a share of GDP; unheard of and mounting levels of federal government debt; and runaway programs such as ObamaCare, Medicare, Medicaid and Social Security threaten further tax increases in the future, that is, absent a reining in and reform of federal spending. However, as always noted in SBE Council’s “Small Business Tax Index,” the tax story for entrepreneurs, businesses, investors and the economy does not end at the federal level. In the end, all taxes matter, whether imposed at the federal, state or local level of government. In the states, some are situated well from a competitive tax standpoint, with others moving in the right direction. For example, states like North Carolina, North Dakota, Kansas, Arizona, New Mexico and Indiana have improved their tax climates and/or are in the midst of doing so. The leaders in these states understand that a competitive and business-friendly tax system is important to attracting investment, startups and company relocation. Consider some key examples: • North Carolina. On the 2013 Index, the state ranked 38th, or thirteenth worst. But on the 2014 “Small Business Tax Index,” North Carolina ranks 22nd. Why the improvement? Under a major tax reform effort, first, the top personal income, capital gains, and dividend/interest tax rate dropped from 7.75 percent to 5.8 percent. Second, the corporate income and capital gains tax rate declined from 6.9 percent to 6.0 percent. Third, the state’s death tax was fully repealed. That’s a dramatic, positive shift in tax policy in North Carolina, and there is more to come, as the personal income, capital gains, and dividend/interest tax rate is scheduled to drop to 5.75 percent next year, with the corporate income and capital gains tax rate also declining to 5 percent. For good measure, if revenue targets are hit, the corporate tax rate would then decline to 4 percent in 2016 and to 3 percent in 2017. • Kansas. The state is in the midst of a phase down in its personal income, capital gains and dividend/interest tax rates, with the top rate falling from its 2012 rate of 6.45 percent to 4.8 percent in 2014, and eventually to 3.9 percent in 2018.
3
• Arizona. The state’s corporate income and capital gains tax rate declined form 6.968 percent in 2012 to 6.5 percent in 2014, and will be phased down to 4.9 by 2016. • Indiana. The state’s corporate income and capital gains tax rate fell from 8.0 percent in the first half of 2013 to 7.5 percent in the second half of last year, and is scheduled to fall to 7.0 percent in mid-2014, and to 6.5 percent in mid-2015. • New Mexico. The state’s corporate income and capital gains tax rate declined from 7.6 percent in 2013 to 7.3 percent in 2014, and is scheduled to be phased down to 5.9 percent in 2018. When it comes to state and local taxes – as well as levies at the federal level – the direction that policy should be pointed is clear. Keep the overall tax burden low. Preferably, do no tax income at all. If a state ranks poorly on the “Small Business Tax Index,” then tiny changes will make little difference. While small steps are better than doing nothing and can stoke momentum for additional reform, substantial reforms and reductions will help poor-ranking states make huge leaps in their competitive standing. In the end, if the tax burden is light on economic risk taking, then that will be good news for entrepreneurship, businesses, investment, economic growth and job creation in each state. The Small Business & Entrepreneurship Council’s “Small Business Tax Index 2014” ranks the states from best to worst in terms of the costs of their tax systems on entrepreneurship and small business. This year’s edition of the Index pulls together 21 different tax measures, and combines those into one tax score that allows the 50 states to be compared and ranked. The 21 measures are: 1) state’s top personal income tax rate, 2) state’s top individual capital gains tax rate, 3) state’s top tax rate on dividends and interest, 4) state’s top corporate income tax rate, 5) state’s top corporate capital gains tax rate, 6) any added income tax on S-Corporations, 7) whether or not the state imposes an alternative minimum tax on individuals, 8) whether or not the state imposes an alternative minimum tax on corporations, 9) whether or not the state’s personal income tax brackets are indexed for inflation, 10) the progressivity of the state’s personal income tax brackets, 11), the progressivity of the state’s corporate income tax brackets, 12) property taxes, 13) consumption-based taxes (i.e., sales, gross receipts and excise taxes), 14) whether or not the state imposes a death tax, 15) unemployment taxes, 16) whether or not the state has a tax limitation mechanism, 17) whether or not the state imposes an Internet access tax, 18) remote seller taxes, 19) gas tax, 20) diesel tax, and 21) wireless taxes. The 15 best state tax systems are: 1) Nevada, 2) South Dakota, 3) Texas, 4) Wyoming, 5) Washington, 6) Florida, 7) Alabama, 8) Ohio, 9) Colorado, 10) Alaska, 11) Indiana, 12) Michigan, 13) Arizona, 14) North Dakota, and 15) Utah. The 15 worst state tax systems are: 36) Delaware, 37) Wisconsin, 38) Idaho, 39) Rhode Island, 40) Nebraska, 41) Connecticut, 42) Oregon, 43) Vermont, 44) Maine, 45) New York, 46) Iowa, 47) Hawaii, 48) New Jersey, 49) Minnesota, and 50) California. Following are the full “Small Business Tax Index 2014” rankings, followed by brief descriptions of why each factor is included in the Index, and how it is measured.

4
Small Business Tax Index 2014: State Rankings Rank State BTI Rank State BTI 1 Nevada 9.677 26 Kansas 44.7642 South Dakota 11.983 27 Georgia 45.7643 Texas 12.482 28 New Mexico 45.8024 Wyoming 15.981 29 West Virginia 46.9395 Washington 19.645 30 Montana 49.1456 Florida 22.195 31 Massachusetts 49.5347 Alabama 29.682 32 Kentucky 51.1318 Ohio 32.354 33 Maryland 51.9289 Colorado 33.365 34 Illinois 51.93010 Alaska 35.044 35 Arkansas 53.21411 Indiana 35.306 36 Delaware 53.94012 Michigan 35.900 37 Wisconsin 54.17613 Arizona 37.438 38 Idaho 56.11614 North Dakota 37.720 39 Rhode Island 58.60815 Utah 38.124 40 Nebraska 60.67016 Mississippi 39.297 41 Connecticut 60.69317 Tennessee 40.633 42 Oregon 65.80918 New Hampshire 40.804 43 Vermont 66.53119 South Carolina 41.459 44 Maine 68.48820 Virginia 41.536 45 New York 68.85821 Louisiana 41.569 46 Iowa 69.81022 North Carolina 42.199 47 Hawaii 74.18523 Missouri 42.768 48 New Jersey 76.25824 Oklahoma 42.997 49 Minnesota 76.38225 Pennsylvania 44.282 50 California 82.695
5
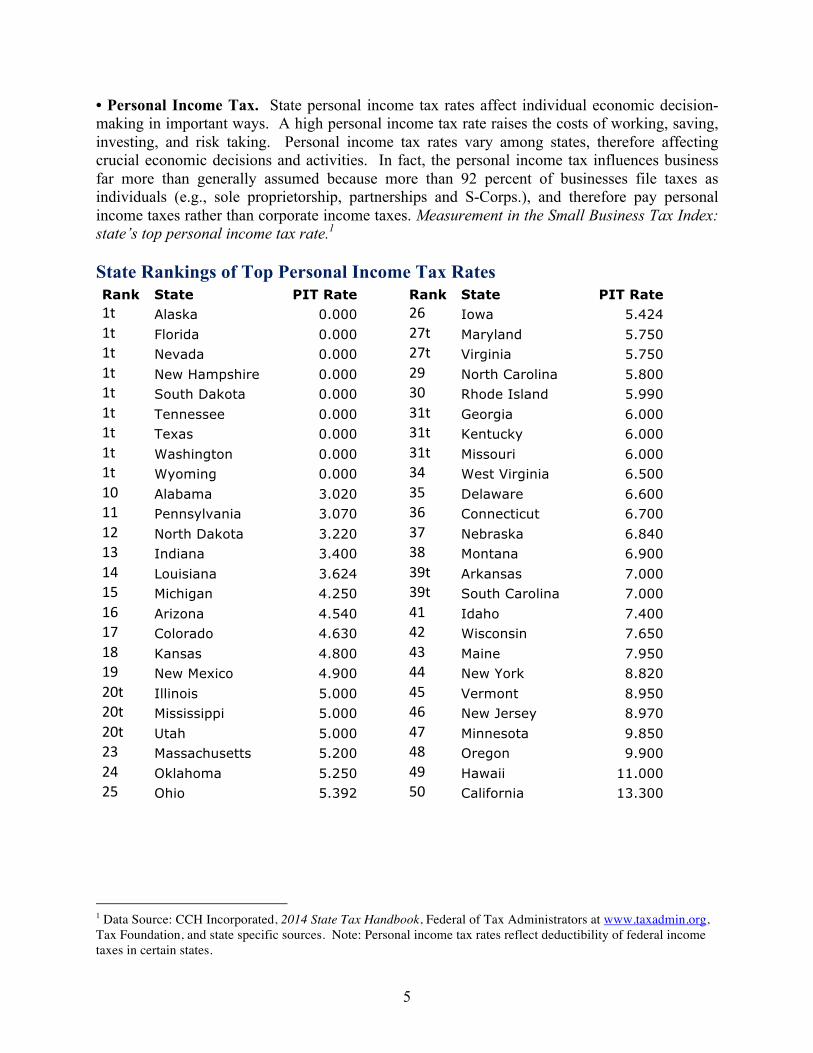
• Personal Income Tax. State personal income tax rates affect individual economic decision-making in important ways. A high personal income tax rate raises the costs of working, saving, investing, and risk taking. Personal income tax rates vary among states, therefore affecting crucial economic decisions and activities. In fact, the personal income tax influences business far more than generally assumed because more than 92 percent of businesses file taxes as individuals (e.g., sole proprietorship, partnerships and S-Corps.), and therefore pay personal income taxes rather than corporate income taxes. Measurement in the Small Business Tax Index: state’s top personal income tax rate.1 State Rankings of Top Personal Income Tax Rates Rank State PIT Rate Rank State PIT Rate 1t Alaska 0.000 26 Iowa 5.424 1t Florida 0.000 27t Maryland 5.750 1t Nevada 0.000 27t Virginia 5.750 1t New Hampshire 0.000 29 North Carolina 5.800 1t South Dakota 0.000 30 Rhode Island 5.990 1t Tennessee 0.000 31t Georgia 6.000 1t Texas 0.000 31t Kentucky 6.000 1t Washington 0.000 31t Missouri 6.000 1t Wyoming 0.000 34 West Virginia 6.500 10 Alabama 3.020 35 Delaware 6.600 11 Pennsylvania 3.070 36 Connecticut 6.700 12 North Dakota 3.220 37 Nebraska 6.840 13 Indiana 3.400 38 Montana 6.900 14 Louisiana 3.624 39t Arkansas 7.000 15 Michigan 4.250 39t South Carolina 7.000 16 Arizona 4.540 41 Idaho 7.400 17 Colorado 4.630 42 Wisconsin 7.650 18 Kansas 4.800 43 Maine 7.950 19 New Mexico 4.900 44 New York 8.820 20t Illinois 5.000 45 Vermont 8.950 20t Mississippi 5.000 46 New Jersey 8.970 20t Utah 5.000 47 Minnesota 9.850 23 Massachusetts 5.200 48 Oregon 9.900 24 Oklahoma 5.250 49 Hawaii 11.000 25 Ohio 5.392 50 California 13.300
1 Data Source: CCH Incorporated, 2014 State Tax Handbook, Federal of Tax Administrators at www.taxadmin.org, Tax Foundation, and state specific sources. Note: Personal income tax rates reflect deductibility of federal income taxes in certain states.
6
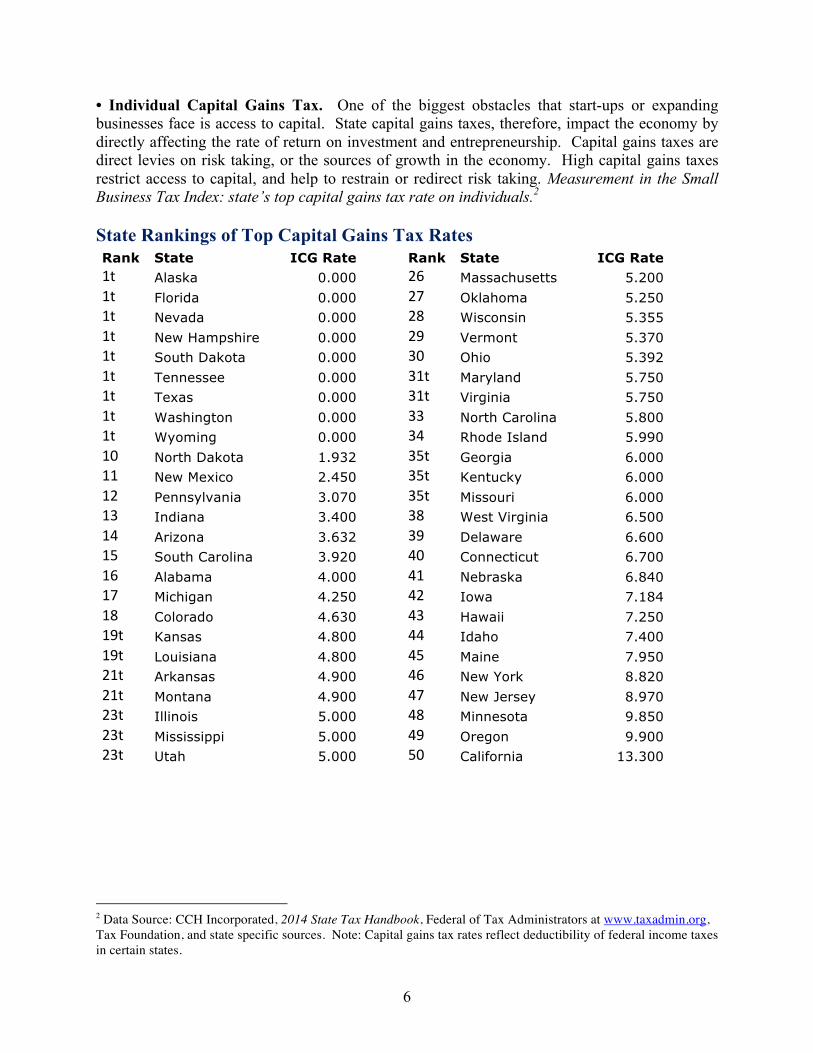
• Individual Capital Gains Tax. One of the biggest obstacles that start-ups or expanding businesses face is access to capital. State capital gains taxes, therefore, impact the economy by directly affecting the rate of return on investment and entrepreneurship. Capital gains taxes are direct levies on risk taking, or the sources of growth in the economy. High capital gains taxes restrict access to capital, and help to restrain or redirect risk taking. Measurement in the Small Business Tax Index: state’s top capital gains tax rate on individuals.2 State Rankings of Top Capital Gains Tax Rates Rank State ICG Rate Rank State ICG Rate 1t Alaska 0.000 26 Massachusetts 5.200 1t Florida 0.000 27 Oklahoma 5.250 1t Nevada 0.000 28 Wisconsin 5.355 1t New Hampshire 0.000 29 Vermont 5.370 1t South Dakota 0.000 30 Ohio 5.392 1t Tennessee 0.000 31t Maryland 5.750 1t Texas 0.000 31t Virginia 5.750 1t Washington 0.000 33 North Carolina 5.800 1t Wyoming 0.000 34 Rhode Island 5.990 10 North Dakota 1.932 35t Georgia 6.000 11 New Mexico 2.450 35t Kentucky 6.000 12 Pennsylvania 3.070 35t Missouri 6.000 13 Indiana 3.400 38 West Virginia 6.500 14 Arizona 3.632 39 Delaware 6.600 15 South Carolina 3.920 40 Connecticut 6.700 16 Alabama 4.000 41 Nebraska 6.840 17 Michigan 4.250 42 Iowa 7.184 18 Colorado 4.630 43 Hawaii 7.250 19t Kansas 4.800 44 Idaho 7.400 19t Louisiana 4.800 45 Maine 7.950 21t Arkansas 4.900 46 New York 8.820 21t Montana 4.900 47 New Jersey 8.970 23t Illinois 5.000 48 Minnesota 9.850 23t Mississippi 5.000 49 Oregon 9.900 23t Utah 5.000 50 California 13.300
2 Data Source: CCH Incorporated, 2014 State Tax Handbook, Federal of Tax Administrators at www.taxadmin.org, Tax Foundation, and state specific sources. Note: Capital gains tax rates reflect deductibility of federal income taxes in certain states.
7
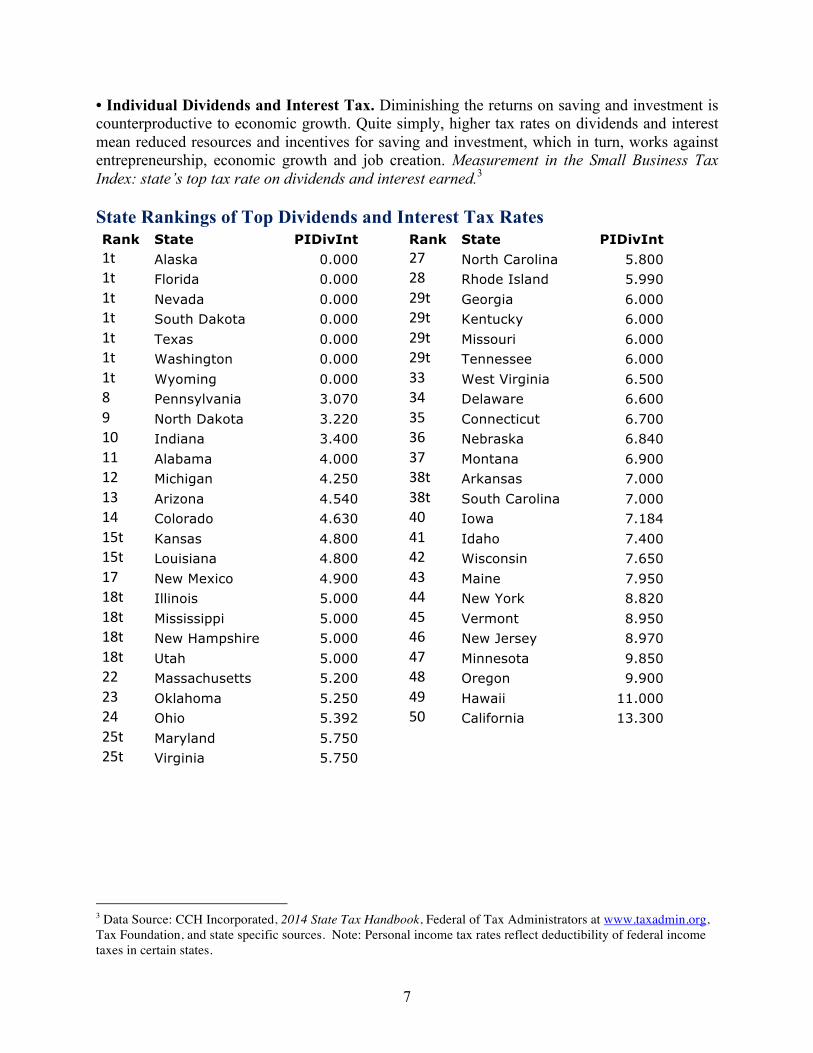
• Individual Dividends and Interest Tax. Diminishing the returns on saving and investment is counterproductive to economic growth. Quite simply, higher tax rates on dividends and interest mean reduced resources and incentives for saving and investment, which in turn, works against entrepreneurship, economic growth and job creation. Measurement in the Small Business Tax Index: state’s top tax rate on dividends and interest earned.3 State Rankings of Top Dividends and Interest Tax Rates Rank State PIDivInt Rank State PIDivInt 1t Alaska 0.000 27 North Carolina 5.800 1t Florida 0.000 28 Rhode Island 5.990 1t Nevada 0.000 29t Georgia 6.000 1t South Dakota 0.000 29t Kentucky 6.000 1t Texas 0.000 29t Missouri 6.000 1t Washington 0.000 29t Tennessee 6.000 1t Wyoming 0.000 33 West Virginia 6.500 8 Pennsylvania 3.070 34 Delaware 6.600 9 North Dakota 3.220 35 Connecticut 6.700 10 Indiana 3.400 36 Nebraska 6.840 11 Alabama 4.000 37 Montana 6.900 12 Michigan 4.250 38t Arkansas 7.000 13 Arizona 4.540 38t South Carolina 7.000 14 Colorado 4.630 40 Iowa 7.184 15t Kansas 4.800 41 Idaho 7.400 15t Louisiana 4.800 42 Wisconsin 7.650 17 New Mexico 4.900 43 Maine 7.950 18t Illinois 5.000 44 New York 8.820 18t Mississippi 5.000 45 Vermont 8.950 18t New Hampshire 5.000 46 New Jersey 8.970 18t Utah 5.000 47 Minnesota 9.850 22 Massachusetts 5.200 48 Oregon 9.900 23 Oklahoma 5.250 49 Hawaii 11.000 24 Ohio 5.392 50 California 13.300 25t Maryland 5.750 25t Virginia 5.750
3 Data Source: CCH Incorporated, 2014 State Tax Handbook, Federal of Tax Administrators at www.taxadmin.org, Tax Foundation, and state specific sources. Note: Personal income tax rates reflect deductibility of federal income taxes in certain states.
8
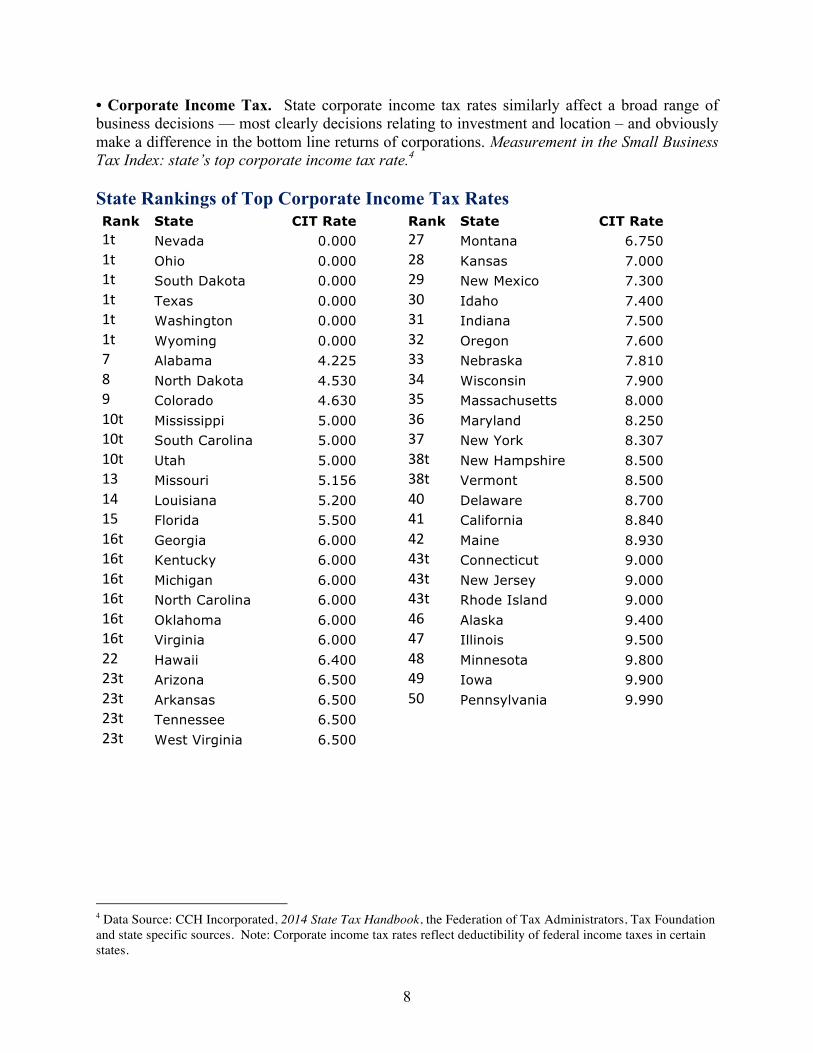
• Corporate Income Tax. State corporate income tax rates similarly affect a broad range of business decisions — most clearly decisions relating to investment and location – and obviously make a difference in the bottom line returns of corporations. Measurement in the Small Business Tax Index: state’s top corporate income tax rate.4 State Rankings of Top Corporate Income Tax Rates Rank State CIT Rate Rank State CIT Rate 1t Nevada 0.000 27 Montana 6.750 1t Ohio 0.000 28 Kansas 7.000 1t South Dakota 0.000 29 New Mexico 7.300 1t Texas 0.000 30 Idaho 7.400 1t Washington 0.000 31 Indiana 7.500 1t Wyoming 0.000 32 Oregon 7.600 7 Alabama 4.225 33 Nebraska 7.810 8 North Dakota 4.530 34 Wisconsin 7.900 9 Colorado 4.630 35 Massachusetts 8.000 10t Mississippi 5.000 36 Maryland 8.250 10t South Carolina 5.000 37 New York 8.307 10t Utah 5.000 38t New Hampshire 8.500 13 Missouri 5.156 38t Vermont 8.500 14 Louisiana 5.200 40 Delaware 8.700 15 Florida 5.500 41 California 8.840 16t Georgia 6.000 42 Maine 8.930 16t Kentucky 6.000 43t Connecticut 9.000 16t Michigan 6.000 43t New Jersey 9.000 16t North Carolina 6.000 43t Rhode Island 9.000 16t Oklahoma 6.000 46 Alaska 9.400 16t Virginia 6.000 47 Illinois 9.500 22 Hawaii 6.400 48 Minnesota 9.800 23t Arizona 6.500 49 Iowa 9.900 23t Arkansas 6.500 50 Pennsylvania 9.990 23t Tennessee 6.500 23t West Virginia 6.500
4 Data Source: CCH Incorporated, 2014 State Tax Handbook, the Federation of Tax Administrators, Tax Foundation and state specific sources. Note: Corporate income tax rates reflect deductibility of federal income taxes in certain states.
9
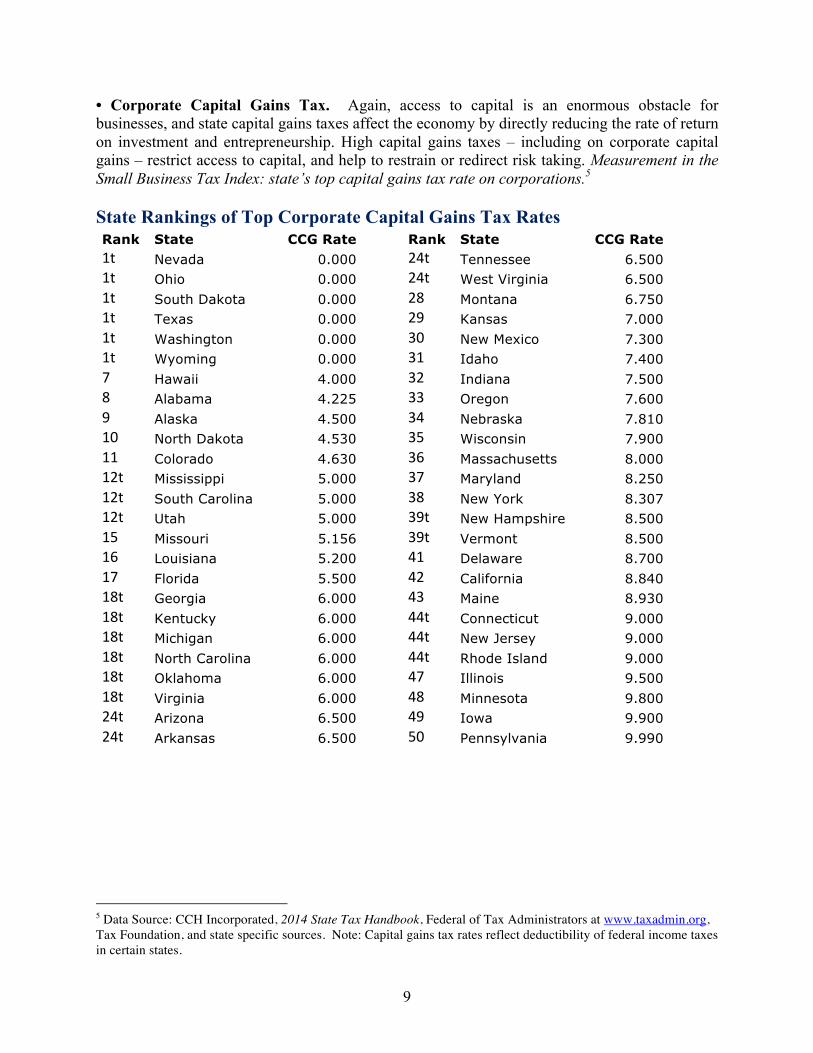
• Corporate Capital Gains Tax. Again, access to capital is an enormous obstacle for businesses, and state capital gains taxes affect the economy by directly reducing the rate of return on investment and entrepreneurship. High capital gains taxes – including on corporate capital gains – restrict access to capital, and help to restrain or redirect risk taking. Measurement in the Small Business Tax Index: state’s top capital gains tax rate on corporations.5 State Rankings of Top Corporate Capital Gains Tax Rates Rank State CCG Rate Rank State CCG Rate 1t Nevada 0.000 24t Tennessee 6.500 1t Ohio 0.000 24t West Virginia 6.500 1t South Dakota 0.000 28 Montana 6.750 1t Texas 0.000 29 Kansas 7.000 1t Washington 0.000 30 New Mexico 7.300 1t Wyoming 0.000 31 Idaho 7.400 7 Hawaii 4.000 32 Indiana 7.500 8 Alabama 4.225 33 Oregon 7.600 9 Alaska 4.500 34 Nebraska 7.810 10 North Dakota 4.530 35 Wisconsin 7.900 11 Colorado 4.630 36 Massachusetts 8.000 12t Mississippi 5.000 37 Maryland 8.250 12t South Carolina 5.000 38 New York 8.307 12t Utah 5.000 39t New Hampshire 8.500 15 Missouri 5.156 39t Vermont 8.500 16 Louisiana 5.200 41 Delaware 8.700 17 Florida 5.500 42 California 8.840 18t Georgia 6.000 43 Maine 8.930 18t Kentucky 6.000 44t Connecticut 9.000 18t Michigan 6.000 44t New Jersey 9.000 18t North Carolina 6.000 44t Rhode Island 9.000 18t Oklahoma 6.000 47 Illinois 9.500 18t Virginia 6.000 48 Minnesota 9.800 24t Arizona 6.500 49 Iowa 9.900 24t Arkansas 6.500 50 Pennsylvania 9.990
5 Data Source: CCH Incorporated, 2014 State Tax Handbook, Federal of Tax Administrators at www.taxadmin.org, Tax Foundation, and state specific sources. Note: Capital gains tax rates reflect deductibility of federal income taxes in certain states.
10
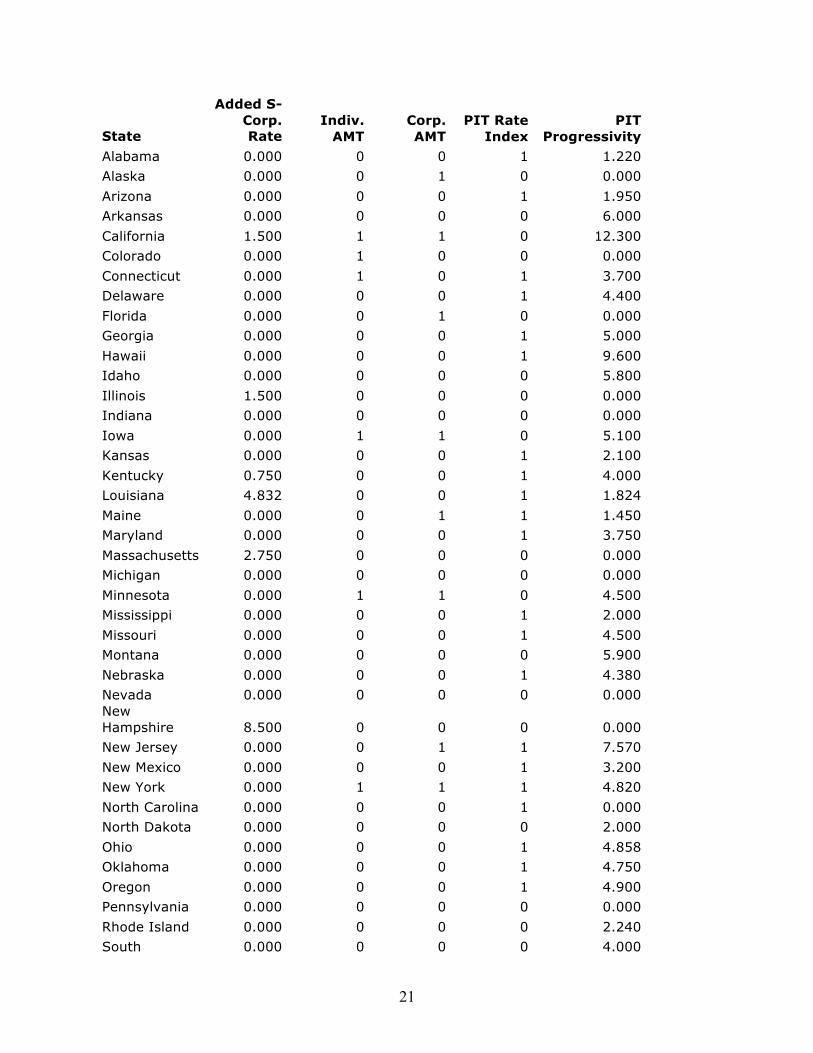
• Additional Income Tax on S-Corporations. Subchapter S-Corporations allow income to pass through to be taxed at the individual level. Most states recognize S Corporations, but a few either tax such businesses like other corporations or impose an added tax. Such a tax raises costs, restrains investment, and hurts state competitiveness. Measurement in the Small Business Tax Index: additional income tax imposed on S-Corps beyond the top personal income tax rate.6 • Individual Alternative Minimum Tax. The individual alternative minimum tax (AMT) imposes a minimum tax rate that must be paid by individuals, regardless the tax credits or deductions taken. The AMT diminishes the effectiveness of potentially positive, pro-growth tax relief measures, while also raising the costs of tax compliance. Measurement in the Small Business Tax Index: state individual alternative minimum tax (states imposing an individual AMT receive a score of “1” and states that do not receive a score of “0”).7 • Corporate Alternative Minimum Tax. The corporate alternative minimum tax (AMT) imposes a minimum tax rate that must be paid by corporations, regardless of the available tax credits or deductions taken. Again, the AMT diminishes the effectiveness of potentially positive, pro-growth tax relief measures, and hikes compliance costs, in particular by forcing firms to effectively calculate their taxes under two tax codes. Measurement in the Small Business Tax Index: state corporate alternative minimum tax (states imposing an individual AMT receive a score of “1” and states that do not receive a score of “0”).8 • Indexing Personal Income Tax Brackets. Indexing income tax brackets ensures that inflation does not push individuals into higher tax brackets. Without such indexation, one can be pushed into a higher tax bracket without any increases in real income. Measurement in the Small Business Tax Index: state indexing of personal income tax rates (states indexing their personal income tax rates receive a score of “0” and states that do not receive a score of “1”).9 • Personal Income Tax Progressivity. Progressive taxation means that as one’s income rises, so does the marginal tax rate paid on additional earnings. Progressivity effectively punishes economic success, and therefore, also punishes and discourages the important and risky endeavors that create economic growth and jobs. Measurement in the Small Business Tax Index: progressivity of personal income tax rates measured by the difference between the top tax rate and the bottom tax rate.10 • Corporate Income Tax Progressivity. As noted previously, progressive taxation means that as income rises, so does the marginal tax rate paid on additional earnings. Progressivity effectively punishes economic success, and therefore, also punishes and discourages the important and risky endeavors that create economic growth and jobs. Measurement in the Small Business Tax Index: progressivity of corporate income tax rates measured by the difference between the top tax rate and the bottom tax rate.11
6 Data Source: CCH Incorporated, 2014 State Tax Handbook, and state specific sources. 7 Data Source: CCH Incorporated, 2014 State Tax Handbook, and state specific sources. 8 Data Source: CCH Incorporated, 2014 State Tax Handbook, and state specific sources. 9 Data Source: The Federation of Tax Administrators website at www.taxadmin.org. 10 Data Source: The Federation of Tax Administrators website at www.taxadmin.org, with some rates updated. 11 Data Source: The Federation of Tax Administrators website at www.taxadmin.org, with some rates updated.
11
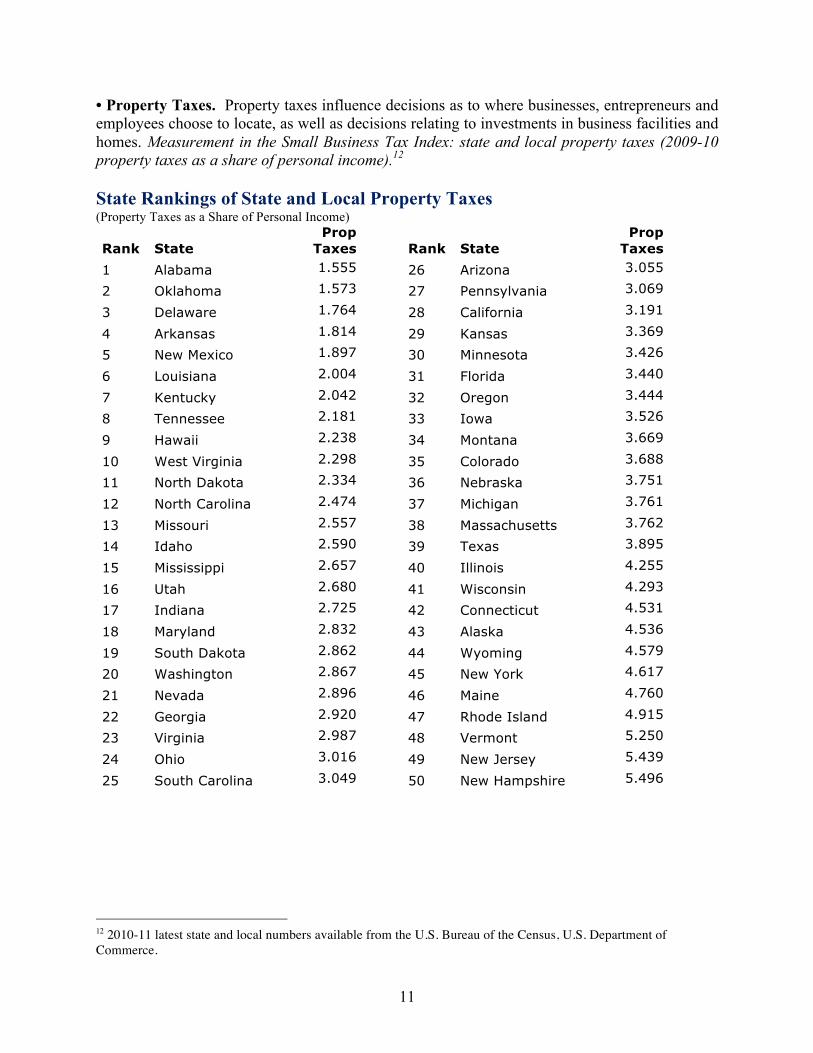
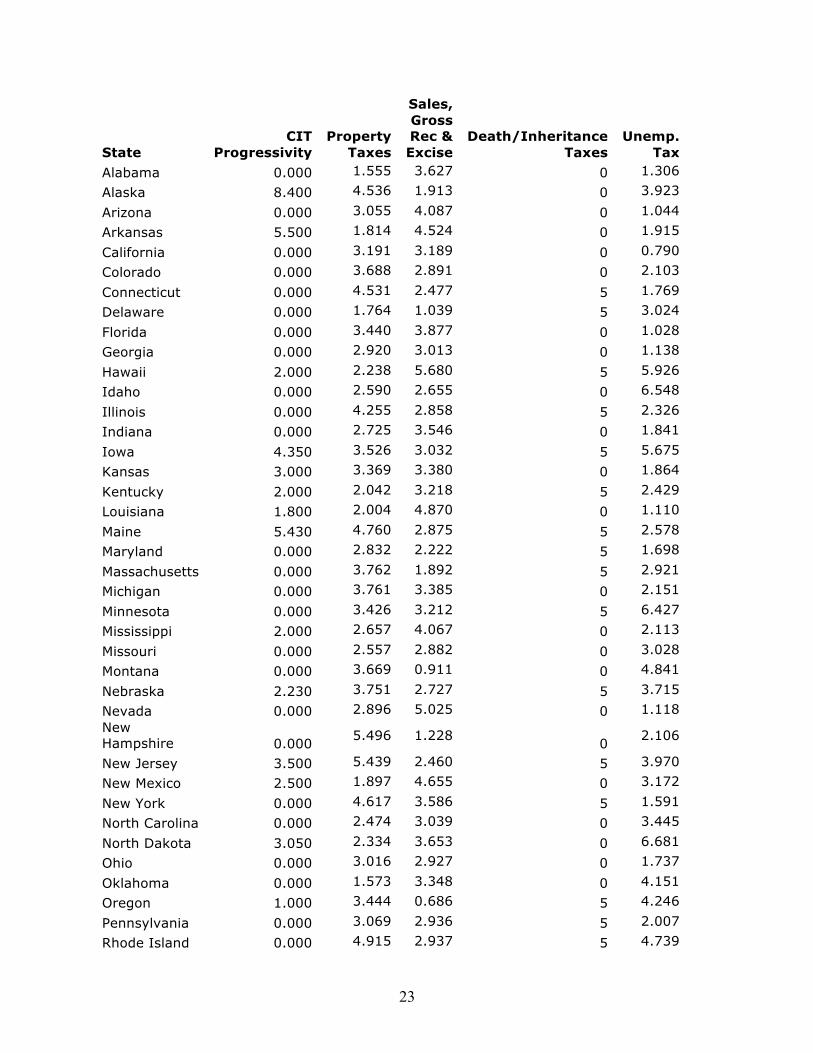
• Property Taxes. Property taxes influence decisions as to where businesses, entrepreneurs and employees choose to locate, as well as decisions relating to investments in business facilities and homes. Measurement in the Small Business Tax Index: state and local property taxes (2009-10 property taxes as a share of personal income).12 State Rankings of State and Local Property Taxes (Property Taxes as a Share of Personal Income)
Rank State Prop
Taxes Rank State Prop
Taxes 1 Alabama 1.555 26 Arizona 3.055
2 Oklahoma 1.573 27 Pennsylvania 3.069
3 Delaware 1.764 28 California 3.191
4 Arkansas 1.814 29 Kansas 3.369
5 New Mexico 1.897 30 Minnesota 3.426
6 Louisiana 2.004 31 Florida 3.440
7 Kentucky 2.042 32 Oregon 3.444
8 Tennessee 2.181 33 Iowa 3.526
9 Hawaii 2.238 34 Montana 3.669
10 West Virginia 2.298 35 Colorado 3.688
11 North Dakota 2.334 36 Nebraska 3.751
12 North Carolina 2.474 37 Michigan 3.761
13 Missouri 2.557 38 Massachusetts 3.762
14 Idaho 2.590 39 Texas 3.895
15 Mississippi 2.657 40 Illinois 4.255
16 Utah 2.680 41 Wisconsin 4.293
17 Indiana 2.725 42 Connecticut 4.531
18 Maryland 2.832 43 Alaska 4.536
19 South Dakota 2.862 44 Wyoming 4.579
20 Washington 2.867 45 New York 4.617
21 Nevada 2.896 46 Maine 4.760
22 Georgia 2.920 47 Rhode Island 4.915
23 Virginia 2.987 48 Vermont 5.250
24 Ohio 3.016 49 New Jersey 5.439
25 South Carolina 3.049 50 New Hampshire 5.496
12 2010-11 latest state and local numbers available from the U.S. Bureau of the Census, U.S. Department of Commerce.
12
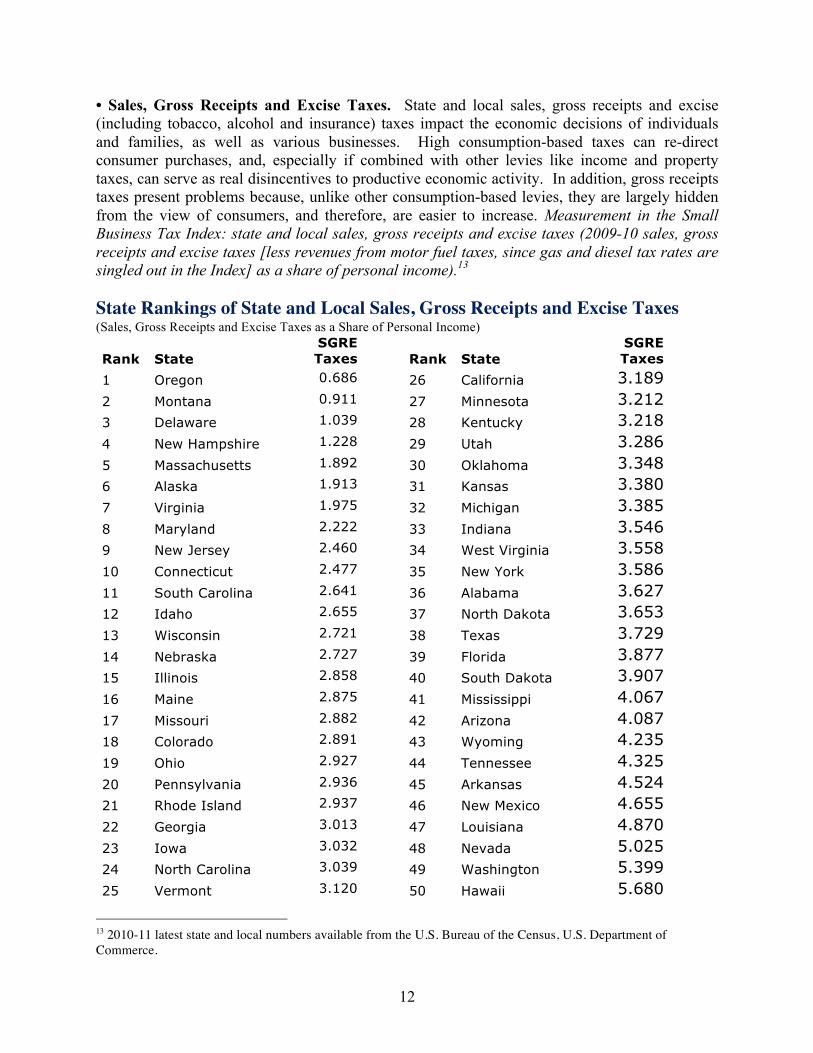
• Sales, Gross Receipts and Excise Taxes. State and local sales, gross receipts and excise (including tobacco, alcohol and insurance) taxes impact the economic decisions of individuals and families, as well as various businesses. High consumption-based taxes can re-direct consumer purchases, and, especially if combined with other levies like income and property taxes, can serve as real disincentives to productive economic activity. In addition, gross receipts taxes present problems because, unlike other consumption-based levies, they are largely hidden from the view of consumers, and therefore, are easier to increase. Measurement in the Small Business Tax Index: state and local sales, gross receipts and excise taxes (2009-10 sales, gross receipts and excise taxes [less revenues from motor fuel taxes, since gas and diesel tax rates are singled out in the Index] as a share of personal income).13 State Rankings of State and Local Sales, Gross Receipts and Excise Taxes (Sales, Gross Receipts and Excise Taxes as a Share of Personal Income)
Rank State SGRE Taxes Rank State
SGRE Taxes
1 Oregon 0.686 26 California 3.189 2 Montana 0.911 27 Minnesota 3.212 3 Delaware 1.039 28 Kentucky 3.218 4 New Hampshire 1.228 29 Utah 3.286 5 Massachusetts 1.892 30 Oklahoma 3.348 6 Alaska 1.913 31 Kansas 3.380 7 Virginia 1.975 32 Michigan 3.385 8 Maryland 2.222 33 Indiana 3.546 9 New Jersey 2.460 34 West Virginia 3.558 10 Connecticut 2.477 35 New York 3.586 11 South Carolina 2.641 36 Alabama 3.627 12 Idaho 2.655 37 North Dakota 3.653 13 Wisconsin 2.721 38 Texas 3.729 14 Nebraska 2.727 39 Florida 3.877 15 Illinois 2.858 40 South Dakota 3.907 16 Maine 2.875 41 Mississippi 4.067 17 Missouri 2.882 42 Arizona 4.087 18 Colorado 2.891 43 Wyoming 4.235 19 Ohio 2.927 44 Tennessee 4.325 20 Pennsylvania 2.936 45 Arkansas 4.524 21 Rhode Island 2.937 46 New Mexico 4.655 22 Georgia 3.013 47 Louisiana 4.870 23 Iowa 3.032 48 Nevada 5.025 24 North Carolina 3.039 49 Washington 5.399 25 Vermont 3.120 50 Hawaii 5.680
13 2010-11 latest state and local numbers available from the U.S. Bureau of the Census, U.S. Department of Commerce.
13
• Death Taxes. The federal government levies a death tax, but so do various states. Death taxes have several problems. In terms of fairness, individuals pay a staggering array of taxes, including on business earnings, over a lifetime, but then are socked with another tax on the total assets at death. High state death taxes offer incentives to move investment and business ventures to less taxing climates; foster wasteful expenditures on tax avoidance, estate planning and insurance; and force many businesses to be sold, borrowed against or closed down. Measurement in the Small Business Tax Index: state death taxes (states levying estate or inheritance taxes receive a score of “5” and states that do not receive a score of “0”).14 14 Data Source: “2014 State Death Tax Chart,” McGuireWoods LLP, March 23, 2014.
14
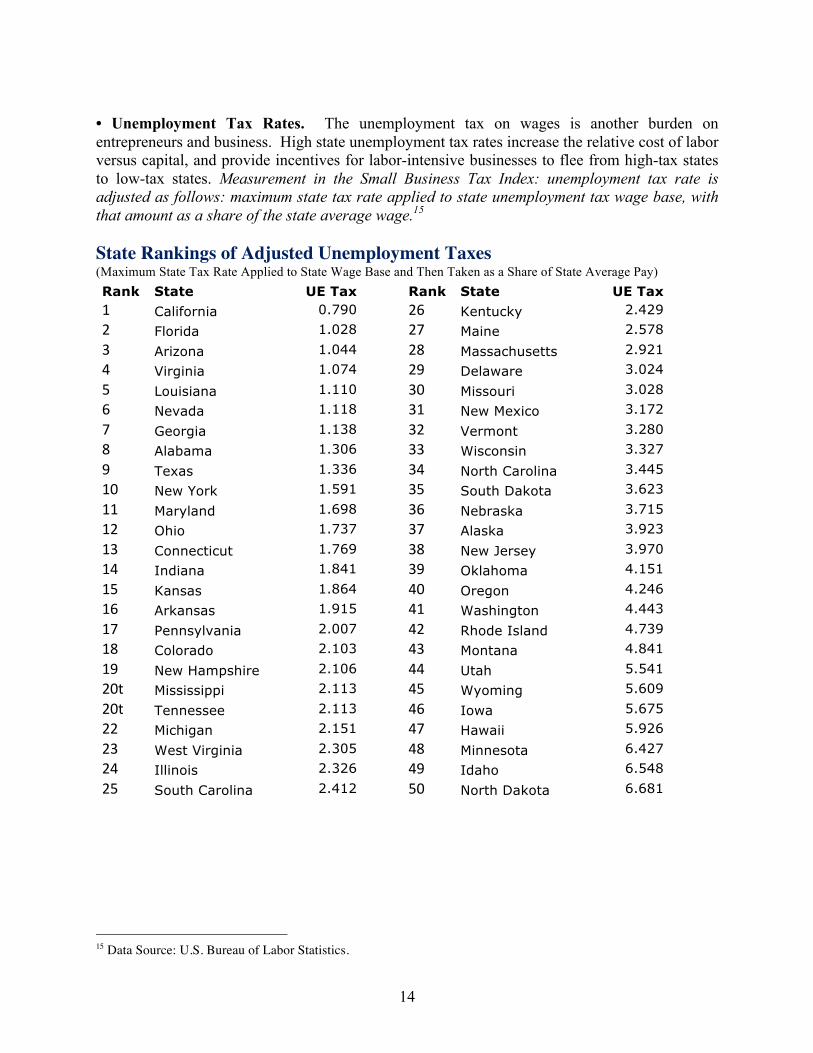
• Unemployment Tax Rates. The unemployment tax on wages is another burden on entrepreneurs and business. High state unemployment tax rates increase the relative cost of labor versus capital, and provide incentives for labor-intensive businesses to flee from high-tax states to low-tax states. Measurement in the Small Business Tax Index: unemployment tax rate is adjusted as follows: maximum state tax rate applied to state unemployment tax wage base, with that amount as a share of the state average wage.15 State Rankings of Adjusted Unemployment Taxes (Maximum State Tax Rate Applied to State Wage Base and Then Taken as a Share of State Average Pay) Rank State UE Tax Rank State UE Tax 1 California 0.790 26 Kentucky 2.429
2 Florida 1.028 27 Maine 2.578
3 Arizona 1.044 28 Massachusetts 2.921
4 Virginia 1.074 29 Delaware 3.024
5 Louisiana 1.110 30 Missouri 3.028
6 Nevada 1.118 31 New Mexico 3.172
7 Georgia 1.138 32 Vermont 3.280
8 Alabama 1.306 33 Wisconsin 3.327
9 Texas 1.336 34 North Carolina 3.445
10 New York 1.591 35 South Dakota 3.623
11 Maryland 1.698 36 Nebraska 3.715
12 Ohio 1.737 37 Alaska 3.923
13 Connecticut 1.769 38 New Jersey 3.970
14 Indiana 1.841 39 Oklahoma 4.151
15 Kansas 1.864 40 Oregon 4.246
16 Arkansas 1.915 41 Washington 4.443
17 Pennsylvania 2.007 42 Rhode Island 4.739
18 Colorado 2.103 43 Montana 4.841
19 New Hampshire 2.106 44 Utah 5.541
20t Mississippi 2.113 45 Wyoming 5.609
20t Tennessee 2.113 46 Iowa 5.675
22 Michigan 2.151 47 Hawaii 5.926
23 West Virginia 2.305 48 Minnesota 6.427
24 Illinois 2.326 49 Idaho 6.548
25 South Carolina 2.412 50 North Dakota 6.681
15 Data Source: U.S. Bureau of Labor Statistics.
15
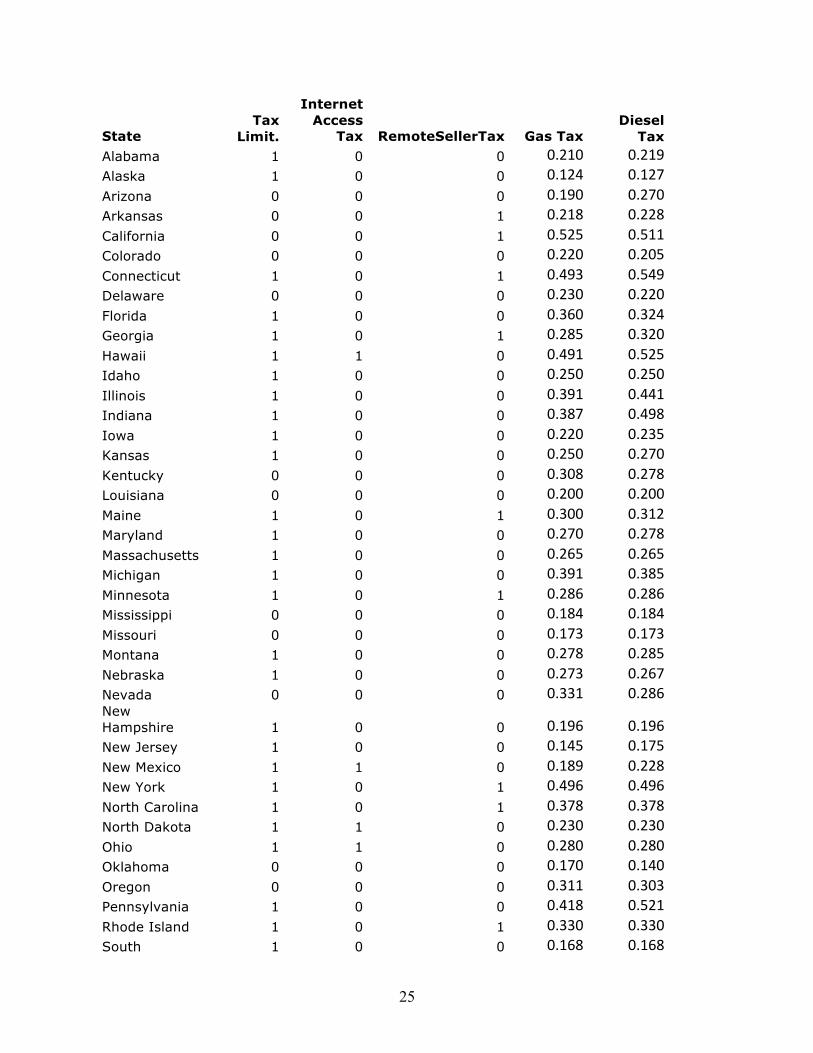
• Tax Limitation States. Requiring supermajority votes from elected officials and/or approval from voters in order to increase or impose taxes, serve as checks on the growth of taxes and government in general. According to Americans for Tax Reform, both taxes and spending do in fact grow more slowly in tax limitation states, and economies expand faster in such states as well. Measurement in the Small Business Tax Index: tax limitation status (states without some form of tax limitation check receive a score of “1,” and states with some kind of substantive tax limitation check receive a score of “0”).16 • Internet Taxes. The Internet serves as a tremendous boost to economic growth and a great expansion of economic opportunity. For small businesses, the Internet allows for greater access to information and markets. Indeed, the Internet gives smaller enterprises access to global markets that they might not have had in the past. Unfortunately, some states have chosen to impose sales taxes on Internet access. Measurement in the Small Business Tax Index: Internet access tax (states without such a sales access tax score “0,” and states with such taxes score “1”).17 • Remote Seller Taxes. A remote seller tax (called “Amazon taxes” in previous reports) requires that out-of-state businesses collect sales taxes imposed by in-state governmental entities. This is an added cost and tax on a host of entrepreneurs and small businesses operating online. Measurement in the Small Business Tax Index: Remote seller tax (states without such a sales tax score “0,” and states with such a tax score “1”).18 16 Source: National Conference of State Legislatures at www.ncsl.org. 17 Steven Maguire and Nonna Noto, “Internet Taxation: Issues and Legislation in the 109th Congress,” CRS Report for Congress, February 2, 2006, and Daniel Castro, “The Case for Tax-Free Internet Access: A Primer on the Internet Tax Freedom Act,” The Information Technology & Innovation Foundation, June 2007. 18 Data Sources: Joseph Henchman, “‘Amazon Tax’ Laws Signal Business Unfriendliness And Will Worsen Short-Term Budget Problems,” The Tax Foundation, March 2010; Stu Wood, “Amazon Battles States Over Sales Tax,” The Wall Street Journal, August 3, 2011; and The Tax Foundation and National Taxpayers Union brief filed with the U.S. Supreme Court on September 23, 2013, in Overstock.com, Inc., and Amazon.com LLC and Amazon Services LLC, v. New York State Division of Taxation and Finance, et al.
16
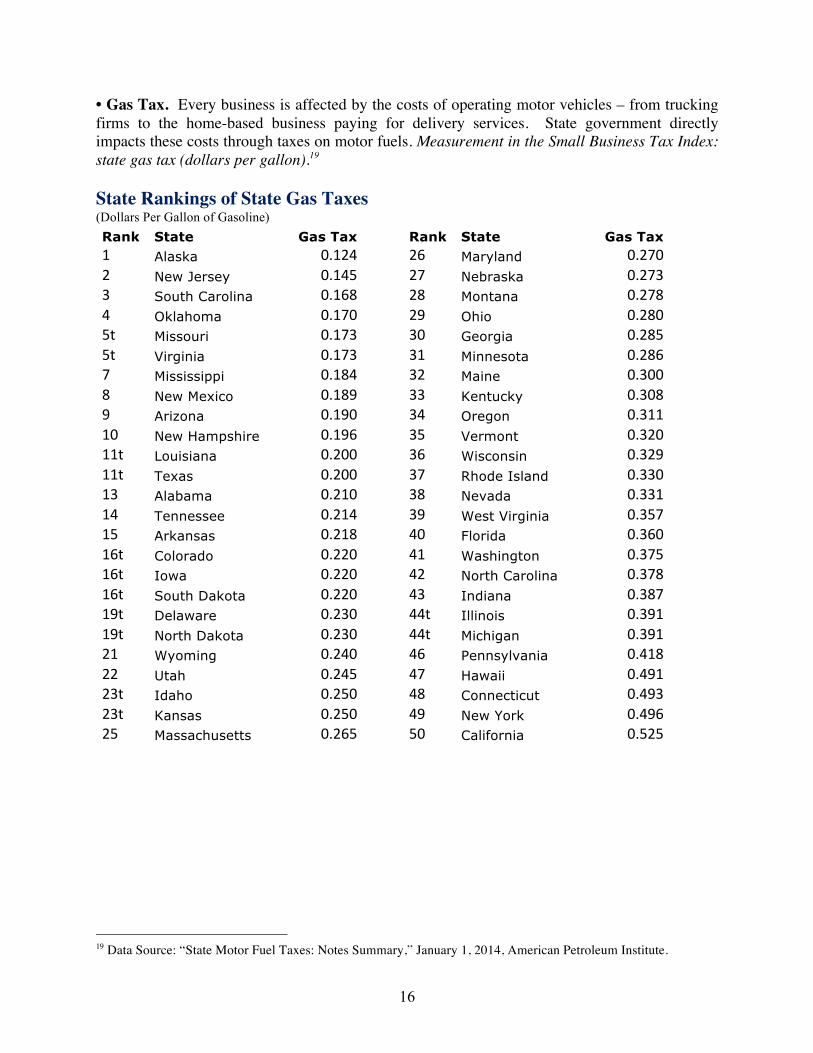
• Gas Tax. Every business is affected by the costs of operating motor vehicles – from trucking firms to the home-based business paying for delivery services. State government directly impacts these costs through taxes on motor fuels. Measurement in the Small Business Tax Index: state gas tax (dollars per gallon).19 State Rankings of State Gas Taxes (Dollars Per Gallon of Gasoline) Rank State Gas Tax Rank State Gas Tax 1 Alaska 0.124 26 Maryland 0.2702 New Jersey 0.145 27 Nebraska 0.2733 South Carolina 0.168 28 Montana 0.2784 Oklahoma 0.170 29 Ohio 0.2805t Missouri 0.173 30 Georgia 0.2855t Virginia 0.173 31 Minnesota 0.2867 Mississippi 0.184 32 Maine 0.3008 New Mexico 0.189 33 Kentucky 0.3089 Arizona 0.190 34 Oregon 0.31110 New Hampshire 0.196 35 Vermont 0.32011t Louisiana 0.200 36 Wisconsin 0.32911t Texas 0.200 37 Rhode Island 0.33013 Alabama 0.210 38 Nevada 0.33114 Tennessee 0.214 39 West Virginia 0.35715 Arkansas 0.218 40 Florida 0.36016t Colorado 0.220 41 Washington 0.37516t Iowa 0.220 42 North Carolina 0.37816t South Dakota 0.220 43 Indiana 0.38719t Delaware 0.230 44t Illinois 0.39119t North Dakota 0.230 44t Michigan 0.39121 Wyoming 0.240 46 Pennsylvania 0.41822 Utah 0.245 47 Hawaii 0.49123t Idaho 0.250 48 Connecticut 0.49323t Kansas 0.250 49 New York 0.49625 Massachusetts 0.265 50 California 0.525
19 Data Source: “State Motor Fuel Taxes: Notes Summary,” January 1, 2014, American Petroleum Institute.
17
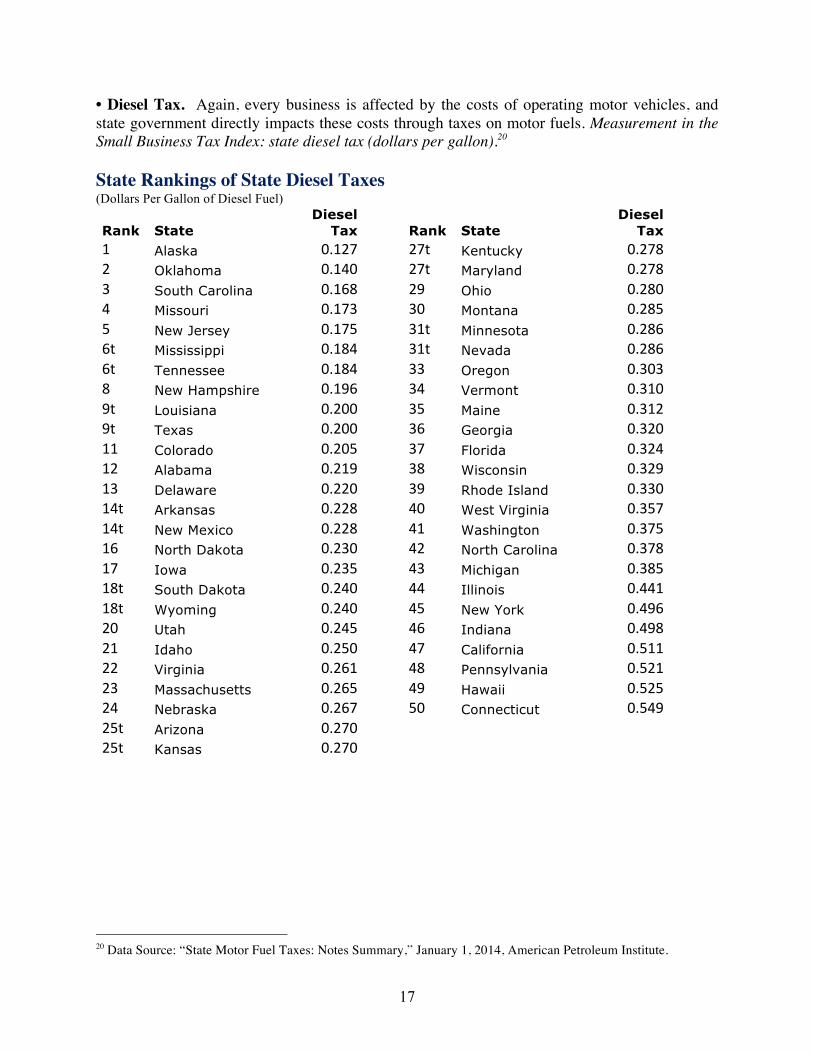
• Diesel Tax. Again, every business is affected by the costs of operating motor vehicles, and state government directly impacts these costs through taxes on motor fuels. Measurement in the Small Business Tax Index: state diesel tax (dollars per gallon).20 State Rankings of State Diesel Taxes (Dollars Per Gallon of Diesel Fuel)
Rank State Diesel
Tax Rank State Diesel
Tax 1 Alaska 0.127 27t Kentucky 0.2782 Oklahoma 0.140 27t Maryland 0.2783 South Carolina 0.168 29 Ohio 0.2804 Missouri 0.173 30 Montana 0.2855 New Jersey 0.175 31t Minnesota 0.2866t Mississippi 0.184 31t Nevada 0.2866t Tennessee 0.184 33 Oregon 0.3038 New Hampshire 0.196 34 Vermont 0.3109t Louisiana 0.200 35 Maine 0.3129t Texas 0.200 36 Georgia 0.32011 Colorado 0.205 37 Florida 0.32412 Alabama 0.219 38 Wisconsin 0.32913 Delaware 0.220 39 Rhode Island 0.33014t Arkansas 0.228 40 West Virginia 0.35714t New Mexico 0.228 41 Washington 0.37516 North Dakota 0.230 42 North Carolina 0.37817 Iowa 0.235 43 Michigan 0.38518t South Dakota 0.240 44 Illinois 0.44118t Wyoming 0.240 45 New York 0.49620 Utah 0.245 46 Indiana 0.49821 Idaho 0.250 47 California 0.51122 Virginia 0.261 48 Pennsylvania 0.52123 Massachusetts 0.265 49 Hawaii 0.52524 Nebraska 0.267 50 Connecticut 0.54925t Arizona 0.270 25t Kansas 0.270
20 Data Source: “State Motor Fuel Taxes: Notes Summary,” January 1, 2014, American Petroleum Institute.

18
• Wireless Tax. Wireless users – entrepreneurs, small businesses, families and individuals – face high and discriminatory taxes across much of the nation. Such taxes impede investment in wireless infrastructure, hit low and middle-income earners hard, discourage deployment and adoption of broadband services, and are an additional cost on entrepreneurs. Measurement in the Small Business Tax Index: wireless sales taxes (an index of wireless sales taxes, which is then adjusted to 10 percent of the index value).21
21 Source: Scott Mackey, “Wireless Taxes and Fees Continue Growth Trend,” State Tax Notes, October 29, 2012.

19
Small Business Tax Index 2014: Details
State Top PIT
Rate
Top Ind CapGains
Rate PIDivInt Top CIT
Rate
Top Corp CapGains
Rate Alabama 3.020 4.000 4.000 4.225 4.225
Alaska 0.000 0.000 0.000 9.400 4.500
Arizona 4.540 3.632 4.540 6.500 6.500
Arkansas 7.000 4.900 7.000 6.500 6.500
California 13.300 13.300 13.300 8.840 8.840
Colorado 4.630 4.630 4.630 4.630 4.630
Connecticut 6.700 6.700 6.700 9.000 9.000
Delaware 6.600 6.600 6.600 8.700 8.700
Florida 0.000 0.000 0.000 5.500 5.500
Georgia 6.000 6.000 6.000 6.000 6.000
Hawaii 11.000 7.250 11.000 6.400 4.000
Idaho 7.400 7.400 7.400 7.400 7.400
Illinois 5.000 5.000 5.000 9.500 9.500
Indiana 3.400 3.400 3.400 7.500 7.500
Iowa 5.424 7.184 7.184 9.900 9.900
Kansas 4.800 4.800 4.800 7.000 7.000
Kentucky 6.000 6.000 6.000 6.000 6.000
Louisiana 3.624 4.800 4.800 5.200 5.200
Maine 7.950 7.950 7.950 8.930 8.930
Maryland 5.750 5.750 5.750 8.250 8.250
Massachusetts 5.200 5.200 5.200 8.000 8.000
Michigan 4.250 4.250 4.250 6.000 6.000
Minnesota 9.850 9.850 9.850 9.800 9.800
Mississippi 5.000 5.000 5.000 5.000 5.000
Missouri 6.000 6.000 6.000 5.156 5.156
Montana 6.900 4.900 6.900 6.750 6.750
Nebraska 6.840 6.840 6.840 7.810 7.810
Nevada 0.000 0.000 0.000 0.000 0.000 New Hampshire 0.000 0.000 5.000 8.500 8.500
New Jersey 8.970 8.970 8.970 9.000 9.000
New Mexico 4.900 2.450 4.900 7.300 7.300
New York 8.820 8.820 8.820 8.307 8.307
North Carolina 5.800 5.800 5.800 6.000 6.000
North Dakota 3.220 1.932 3.220 4.530 4.530
Ohio 5.392 5.392 5.392 0.000 0.000
Oklahoma 5.250 5.250 5.250 6.000 6.000
Oregon 9.900 9.900 9.900 7.600 7.600
Pennsylvania 3.070 3.070 3.070 9.990 9.990
Rhode Island 5.990 5.990 5.990 9.000 9.000

20
South Carolina 7.000 3.920 7.000 5.000 5.000
South Dakota 0.000 0.000 0.000 0.000 0.000
Tennessee 0.000 0.000 6.000 6.500 6.500
Texas 0.000 0.000 0.000 0.000 0.000
Utah 5.000 5.000 5.000 5.000 5.000
Vermont 8.950 5.370 8.950 8.500 8.500
Virginia 5.750 5.750 5.750 6.000 6.000
Washington 0.000 0.000 0.000 0.000 0.000
West Virginia 6.500 6.500 6.500 6.500 6.500
Wisconsin 7.650 5.355 7.650 7.900 7.900
Wyoming 0.000 0.000 0.000 0.000 0.000
21
State
Added S-Corp. Rate
Indiv. AMT
Corp. AMT
PIT Rate Index
PIT Progressivity
Alabama 0.000 0 0 1 1.220
Alaska 0.000 0 1 0 0.000
Arizona 0.000 0 0 1 1.950
Arkansas 0.000 0 0 0 6.000
California 1.500 1 1 0 12.300
Colorado 0.000 1 0 0 0.000
Connecticut 0.000 1 0 1 3.700
Delaware 0.000 0 0 1 4.400
Florida 0.000 0 1 0 0.000
Georgia 0.000 0 0 1 5.000
Hawaii 0.000 0 0 1 9.600
Idaho 0.000 0 0 0 5.800
Illinois 1.500 0 0 0 0.000
Indiana 0.000 0 0 0 0.000
Iowa 0.000 1 1 0 5.100
Kansas 0.000 0 0 1 2.100
Kentucky 0.750 0 0 1 4.000
Louisiana 4.832 0 0 1 1.824
Maine 0.000 0 1 1 1.450
Maryland 0.000 0 0 1 3.750
Massachusetts 2.750 0 0 0 0.000
Michigan 0.000 0 0 0 0.000
Minnesota 0.000 1 1 0 4.500
Mississippi 0.000 0 0 1 2.000
Missouri 0.000 0 0 1 4.500
Montana 0.000 0 0 0 5.900
Nebraska 0.000 0 0 1 4.380
Nevada 0.000 0 0 0 0.000 New Hampshire 8.500 0 0 0 0.000
New Jersey 0.000 0 1 1 7.570
New Mexico 0.000 0 0 1 3.200
New York 0.000 1 1 1 4.820
North Carolina 0.000 0 0 1 0.000
North Dakota 0.000 0 0 0 2.000
Ohio 0.000 0 0 1 4.858
Oklahoma 0.000 0 0 1 4.750
Oregon 0.000 0 0 1 4.900
Pennsylvania 0.000 0 0 0 0.000
Rhode Island 0.000 0 0 0 2.240
South 0.000 0 0 0 4.000

22
Carolina
South Dakota 0.000 0 0 0 0.000
Tennessee 6.500 0 0 0 0.000
Texas 0.000 0 0 0 0.000
Utah 0.000 0 0 0 0.000
Vermont 0.000 0 0 0 5.400
Virginia 0.000 0 0 1 3.750
Washington 0.000 0 0 0 0.000
West Virginia 0.000 0 0 1 3.500
Wisconsin 0.000 1 0 0 3.650
Wyoming 0.000 0 0 0 0.000
23
State CIT
Progressivity Property
Taxes
Sales, Gross Rec & Excise
Death/Inheritance Taxes
Unemp. Tax
Alabama 0.000 1.555 3.627 0 1.306
Alaska 8.400 4.536 1.913 0 3.923
Arizona 0.000 3.055 4.087 0 1.044
Arkansas 5.500 1.814 4.524 0 1.915
California 0.000 3.191 3.189 0 0.790
Colorado 0.000 3.688 2.891 0 2.103
Connecticut 0.000 4.531 2.477 5 1.769
Delaware 0.000 1.764 1.039 5 3.024
Florida 0.000 3.440 3.877 0 1.028
Georgia 0.000 2.920 3.013 0 1.138
Hawaii 2.000 2.238 5.680 5 5.926
Idaho 0.000 2.590 2.655 0 6.548
Illinois 0.000 4.255 2.858 5 2.326
Indiana 0.000 2.725 3.546 0 1.841
Iowa 4.350 3.526 3.032 5 5.675
Kansas 3.000 3.369 3.380 0 1.864
Kentucky 2.000 2.042 3.218 5 2.429
Louisiana 1.800 2.004 4.870 0 1.110
Maine 5.430 4.760 2.875 5 2.578
Maryland 0.000 2.832 2.222 5 1.698
Massachusetts 0.000 3.762 1.892 5 2.921
Michigan 0.000 3.761 3.385 0 2.151
Minnesota 0.000 3.426 3.212 5 6.427
Mississippi 2.000 2.657 4.067 0 2.113
Missouri 0.000 2.557 2.882 0 3.028
Montana 0.000 3.669 0.911 0 4.841
Nebraska 2.230 3.751 2.727 5 3.715
Nevada 0.000 2.896 5.025 0 1.118 New Hampshire 0.000
5.496 1.228 0
2.106
New Jersey 3.500 5.439 2.460 5 3.970
New Mexico 2.500 1.897 4.655 0 3.172
New York 0.000 4.617 3.586 5 1.591
North Carolina 0.000 2.474 3.039 0 3.445
North Dakota 3.050 2.334 3.653 0 6.681
Ohio 0.000 3.016 2.927 0 1.737
Oklahoma 0.000 1.573 3.348 0 4.151
Oregon 1.000 3.444 0.686 5 4.246
Pennsylvania 0.000 3.069 2.936 5 2.007
Rhode Island 0.000 4.915 2.937 5 4.739

24
South Carolina 0.000
3.049 2.641 0
2.412
South Dakota 0.000 2.862 3.907 0 3.623
Tennessee 0.000 2.181 4.325 5 2.113
Texas 0.000 3.895 3.729 0 1.336
Utah 0.000 2.680 3.286 0 5.541
Vermont 2.500 5.250 3.120 5 3.280
Virginia 0.000 2.987 1.975 0 1.074
Washington 0.000 2.867 5.399 5 4.443
West Virginia 0.000 2.298 3.558 0 2.305
Wisconsin 0.000 4.293 2.721 0 3.327
Wyoming 0.000 4.579 4.235 0 5.609
25
State Tax
Limit.
Internet Access
Tax RemoteSellerTax Gas Tax Diesel
Tax Alabama 1 0 0 0.210 0.219Alaska 1 0 0 0.124 0.127Arizona 0 0 0 0.190 0.270Arkansas 0 0 1 0.218 0.228California 0 0 1 0.525 0.511Colorado 0 0 0 0.220 0.205Connecticut 1 0 1 0.493 0.549Delaware 0 0 0 0.230 0.220Florida 1 0 0 0.360 0.324Georgia 1 0 1 0.285 0.320Hawaii 1 1 0 0.491 0.525Idaho 1 0 0 0.250 0.250Illinois 1 0 0 0.391 0.441Indiana 1 0 0 0.387 0.498Iowa 1 0 0 0.220 0.235Kansas 1 0 0 0.250 0.270Kentucky 0 0 0 0.308 0.278Louisiana 0 0 0 0.200 0.200Maine 1 0 1 0.300 0.312Maryland 1 0 0 0.270 0.278Massachusetts 1 0 0 0.265 0.265Michigan 1 0 0 0.391 0.385Minnesota 1 0 1 0.286 0.286Mississippi 0 0 0 0.184 0.184Missouri 0 0 0 0.173 0.173Montana 1 0 0 0.278 0.285Nebraska 1 0 0 0.273 0.267Nevada 0 0 0 0.331 0.286New Hampshire 1 0 0 0.196 0.196New Jersey 1 0 0 0.145 0.175New Mexico 1 1 0 0.189 0.228New York 1 0 1 0.496 0.496North Carolina 1 0 1 0.378 0.378North Dakota 1 1 0 0.230 0.230Ohio 1 1 0 0.280 0.280Oklahoma 0 0 0 0.170 0.140Oregon 0 0 0 0.311 0.303Pennsylvania 1 0 0 0.418 0.521Rhode Island 1 0 1 0.330 0.330South 1 0 0 0.168 0.168

26
Carolina
South Dakota 0 1 0 0.220 0.240Tennessee 1 0 0 0.214 0.184Texas 1 1 1 0.200 0.200Utah 1 0 0 0.245 0.245Vermont 1 0 0 0.320 0.310Virginia 1 0 0 0.173 0.261Washington 0 1 0 0.375 0.375West Virginia 1 0 0 0.357 0.357Wisconsin 1 1 0 0.329 0.329Wyoming 1 0 0 0.240 0.240
27
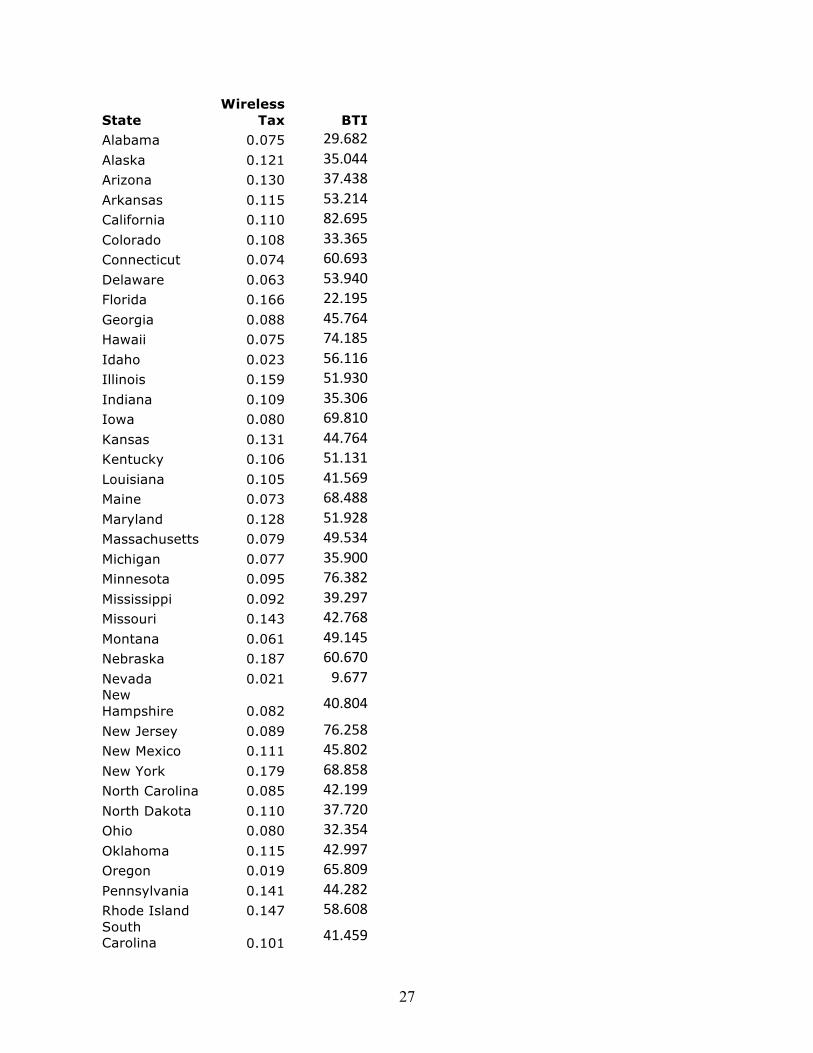
State Wireless
Tax BTI Alabama 0.075 29.682Alaska 0.121 35.044Arizona 0.130 37.438Arkansas 0.115 53.214California 0.110 82.695Colorado 0.108 33.365Connecticut 0.074 60.693Delaware 0.063 53.940Florida 0.166 22.195Georgia 0.088 45.764Hawaii 0.075 74.185Idaho 0.023 56.116Illinois 0.159 51.930Indiana 0.109 35.306Iowa 0.080 69.810Kansas 0.131 44.764Kentucky 0.106 51.131Louisiana 0.105 41.569Maine 0.073 68.488Maryland 0.128 51.928Massachusetts 0.079 49.534Michigan 0.077 35.900Minnesota 0.095 76.382Mississippi 0.092 39.297Missouri 0.143 42.768Montana 0.061 49.145Nebraska 0.187 60.670Nevada 0.021 9.677New Hampshire 0.082 40.804
New Jersey 0.089 76.258New Mexico 0.111 45.802New York 0.179 68.858North Carolina 0.085 42.199North Dakota 0.110 37.720Ohio 0.080 32.354Oklahoma 0.115 42.997Oregon 0.019 65.809Pennsylvania 0.141 44.282Rhode Island 0.147 58.608South Carolina 0.101 41.459
28
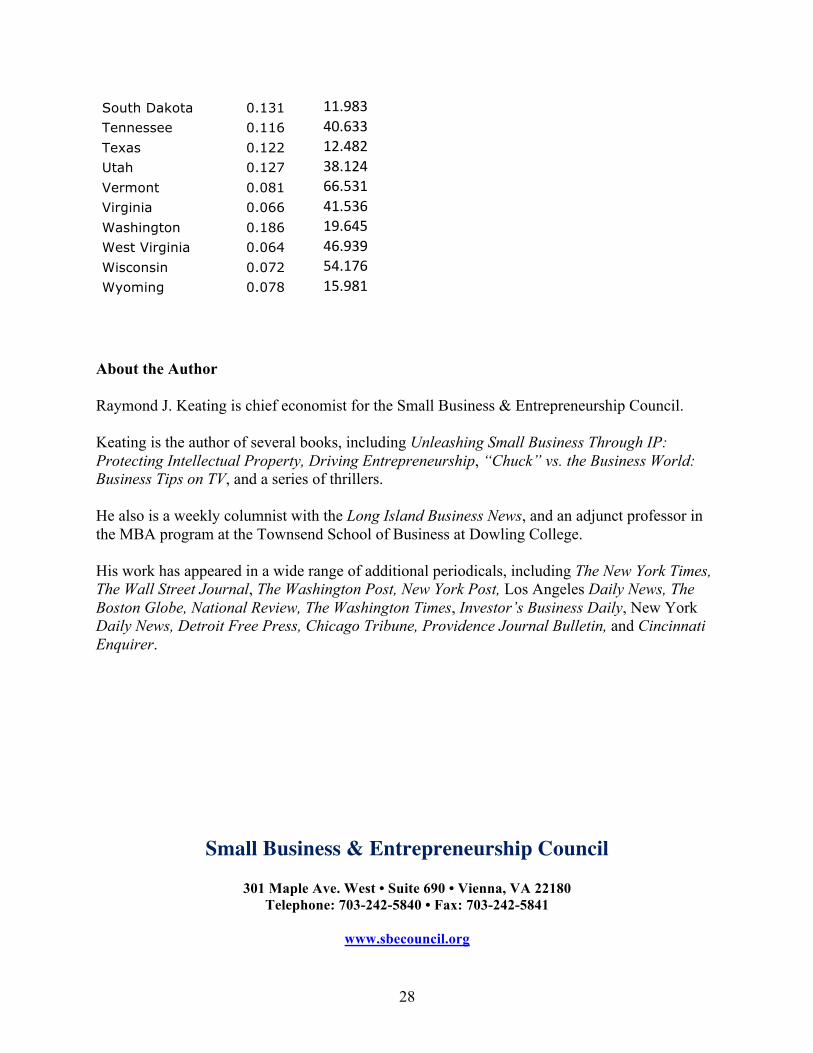
South Dakota 0.131 11.983Tennessee 0.116 40.633Texas 0.122 12.482Utah 0.127 38.124Vermont 0.081 66.531Virginia 0.066 41.536Washington 0.186 19.645West Virginia 0.064 46.939Wisconsin 0.072 54.176Wyoming 0.078 15.981
About the Author Raymond J. Keating is chief economist for the Small Business & Entrepreneurship Council. Keating is the author of several books, including Unleashing Small Business Through IP: Protecting Intellectual Property, Driving Entrepreneurship, “Chuck” vs. the Business World: Business Tips on TV, and a series of thrillers. He also is a weekly columnist with the Long Island Business News, and an adjunct professor in the MBA program at the Townsend School of Business at Dowling College. His work has appeared in a wide range of additional periodicals, including The New York Times, The Wall Street Journal, The Washington Post, New York Post, Los Angeles Daily News, The Boston Globe, National Review, The Washington Times, Investor’s Business Daily, New York Daily News, Detroit Free Press, Chicago Tribune, Providence Journal Bulletin, and Cincinnati Enquirer.
Small Business & Entrepreneurship Council
301 Maple Ave. West • Suite 690 • Vienna, VA 22180 Telephone: 703-242-5840 • Fax: 703-242-5841
www.sbecouncil.org