Small Business Optimism Index July 2011
24
NFIB SMALL BUSINESS ECONOMIC TRENDS NFIB SMALL BUSINESS ECONOMIC TRENDS William C. Dunkelberg Holly Wade July 2011 SMALL BUSINESS OPTIMISM INDEX COMPONENTS Seasonally Change From Contribution Index Component Adjusted Level Last Month Index Change Plans to Increase Employment 3% 4 * Plans to Make Capital Outlays 21% 1 * Plans to Increase Inventories -3% 0 * Expect Economy to Improve -11 % -6 * Expect Real Sales Higher 0% -3 * Current Inventory -1% 0 * Current Job Openings 15% 3 * xpected Credit Conditions -1 0% 1 * Now a Good Time to Expand 4% -1 * Earnings Trend -24% 0 * Total Change -1 * Based on a Survey of Small and Independent Business Owners
-
Upload
nathan-martin -
Category
Documents
-
view
218 -
download
0
Transcript of Small Business Optimism Index July 2011

8/6/2019 Small Business Optimism Index July 2011
http://slidepdf.com/reader/full/small-business-optimism-index-july-2011 1/23
NFIB SMALL BUSINESS
ECONOMIC TRENDS
NFIB SMALL BUSINESS
ECONOMIC TRENDS
William C. DunkelbergHolly Wade
July 2011
S M A L L B U S I N E S S O P T I M I S M I N D E X C O M P O N E N T S
Seasonally Change From Contribution
Index Component Adjusted Level Last Month Index Change
Plans to Increase Employment 3% 4 *
Plans to Make Capital Outlays 21% 1 *
Plans to Increase Inventories -3% 0 *
Expect Economy to Improve -11% -6 *
Expect Real Sales Higher 0% -3 *Current Inventory -1% 0 * Current Job Openings 15% 3 *
xpected Credit Conditions -10% 1 *
Now a Good Time to Expand 4% -1 *
Earnings Trend -24% 0 *
Total Change -1 *
Based on a Survey of Small and Independent Business Owners
Column 1 is the current reading; column 2 is the change from the prior month; column 3 the percent of the total changeaccounted for by each component; * is under 1 percent and not a meaningful calculation.

8/6/2019 Small Business Optimism Index July 2011
http://slidepdf.com/reader/full/small-business-optimism-index-july-2011 2/23
The NFIB Research Foundation has collected
Small Business Economic Trends Data with Quar-terly surveys since 1973 and monthly surveys since
1986. The sample is drawn from the membership
files of the National Federation of Independent
Business (NFIB). Each was mailed a question-
naire and one reminder. Subscriptions for twelve
monthly SBET issues are $250. Historical and
unadjusted data are available, along with a copy
of the questionnaire, from the NFIB Research
Foundation. You may reproduce Small Business
Economic Trends items if you cite the publica-tion name and date and note it is a copyright of
the NFIB Research Foundation. © NFIB Research
Foundation. ISBS #0940791-24-2. Chief Econo-
mist William C. Dunkelberg and Policy Analyst
Holly Wade are responsible for the report.
NFIB SMALL BUSINESS
ECONOMIC TRENDS
IN THIS ISSUE
Summary . . . . . . . . . . . . . . . . . . . . . . . . . . . . . . 1
Commentary. . . . . . . . . . . . . . . . . . . . . . . . . . . . 3
Optimism . . . . . . . . . . . . . . . . . . . . . . . . . . . . . . 4
Outlook . . . . . . . . . . . . . . . . . . . . . . . . . . . . . . . 4
Earnings . . . . . . . . . . . . . . . . . . . . . . . . . . . . . . . 6
Sales . . . . . . . . . . . . . . . . . . . . . . . . . . . . . . . . . . 7
Prices . . . . . . . . . . . . . . . . . . . . . . . . . . . . . . . . . 8
Employment. . . . . . . . . . . . . . . . . . . . . . . . . . . . 9
Compensation . . . . . . . . . . . . . . . . . . . . . . . . . 10
Credit Conditions . . . . . . . . . . . . . . . . . . . . . . . 12
Inventories . . . . . . . . . . . . . . . . . . . . . . . . . . . . 14
Capital Outlays. . . . . . . . . . . . . . . . . . . . . . . . . 16
Most Important Problem . . . . . . . . . . . . . . . . . 18
Survey Profile . . . . . . . . . . . . . . . . . . . . . . . . . 19
Economic Survey. . . . . . . . . . . . . . . . . . . . . . . 20

8/6/2019 Small Business Optimism Index July 2011
http://slidepdf.com/reader/full/small-business-optimism-index-july-2011 3/23
1
| N F I B S m a l l B u s i n e s s E c o n o
m i c T r e n d s
M o n t h l y R e p o r t
SUMMARY
OPTIMISM INDEX
NFIB’s monthly Small-Business Optimism Index dropped one tenth of a
point (0.1) in June, settling at 90.8, basically unchanged from the previous
month. While some indicators rose slightly, including expected capital
outlays, pessimism about future business conditions and expected real sales
gains pulled the Index down, causing a small but disappointing drop for the
fourth consecutive month. Although June marked the second year
anniversary of the recovery, it appeared there was little happening to make
small business owners more optimistic.
LABOR MARKETS
Although June’s employment growth was weak, 15 percent (seasonally
adjusted) of small firms reported unfilled job openings, a 3 point increase
and an indication that the unemployment rate will ease back below 9percent in the coming months. Over the next three months, 11 percent plan
to increase employment (down 2 points), and 7 percent plan to reduce their
workforce (down 1 point), yielding a seasonally adjusted 3 percent of
owners planning to create new jobs, and a 4 point improvement. However,
these statistics are still at recession levels and any real employment gains
are still to be realized.
CAPITAL SPENDING
Over the past six months, 50 percent of all firms reported making capitalexpenditures, an historically low average. Of those making expenditures in
June, 32 percent reported spending on new equipment (down 4 points), 19
percent acquired vehicles (up 3 points), and 11 percent improved or
expanded facilities (up 2 points). Five percent acquired new buildings or
land for expansion (up 1 point) and 10 percent spent money for new
fixtures and furniture (down 2 points). There was a slight increase in firms
planning capital outlays in the next three to six months; this indicator rose
1 point to 21 percent, although still a recession level reading. Money is
available, but most owners are not interested in a loan to finance thepurchase of equipment they don’t need.
INVENTORIES AND SALES
The net percent of all owners (seasonally adjusted) reporting higher
nominal sales over the past three months improved 2 percentage points,
rising to a net negative 7 percent, more firms with sales trending down
than up, but still the second best reading in 41 months. The net percent of
owners expecting higher real sales fell 3 points to a net 0 percent of all
owners (seasonally adjusted), 13 points below January’s reading. This isbad news for hiring and inventory investment. Small business owners
continued to liquidate inventories and at a faster pace than April which was
one of the lowest rates of reduction in nearly three years. A net negative
14 percent of all owners reported growth in inventories (seasonally
adjusted), a 1 point deterioration.
This survey was conducted in June 2011. A sample of 3,938 small-business owners/members was drawn.
Seven hundred sixty-six (766) usable responses were received – a response rate of 20 percent.

8/6/2019 Small Business Optimism Index July 2011
http://slidepdf.com/reader/full/small-business-optimism-index-july-2011 4/23
2
| N F I B S m a l l B u s i n e s s E c o n o m i c T r e n d s
M o n t h l y R e p o r t
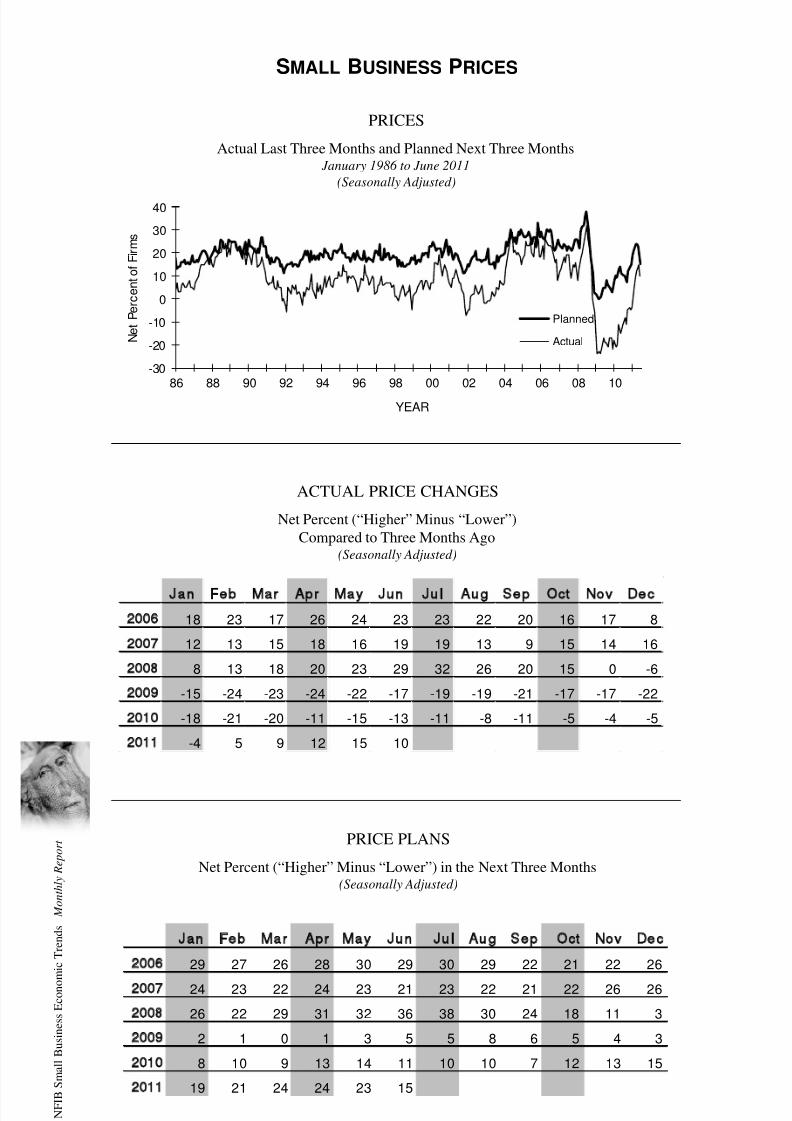
INFLATION
Twenty-five (25) percent of the NFIB owners reported raising their average
selling prices in the past three months, compared to 16 percent who
reported price reductions, still high, but fading. Seasonally adjusted, the
net percent raising selling prices was 10 percent, down 5 points from May,
but the third double digit month in a row and 23 points higher than a year
ago. Prices are rising again on Main Street and this will feed the
Consumer Prince Index measures of inflation (headline and core, there are
only a few gas stations and groceries in the membership). Seasonally
adjusted, a net 15 percent plan price hikes, 8 points lower than in May.
PROFITS AND WAGES
Reports of positive earnings trends were unchanged from last month, a netnegative 24 percent of all owners, not a pretty picture, but the best reading
in 42 months. The recent rise in the percent of owners successfully raising
prices is contributing to some improvement in the bottom line, but sales
growth is not helping. Corporate profits are at a record high level as a share
of GDP, but the story is very different on Main Street. For those reporting
lower earnings compared to the previous three months, 54 percent cited
weaker sales (up 4 points), 2 percent blamed rising labor costs, 15 percent
higher materials costs, 2 percent higher insurance costs, and 5 percent
blamed lower selling prices. Five percent blamed higher taxes andregulatory costs.
Six percent reported reduced worker compensation and 15 percent reported
gains yielding a seasonally adjusted net 8 percent reporting higher worker
compensation, one point lower than May which was the second strongest
reading since the fourth quarter of 2008. A seasonally adjusted a net 7
percent plan to raise compensation in the coming months, unchanged from
May figures.
CREDIT MARKETS
Three percent reported financing as their #1 business problem. For the
overwhelming majority, “credit supply” is not a problem. Ninety-one
percent reported that all their credit needs were met or that they were not
interested in borrowing. Nine percent reported that not all of their credit
needs were satisfied, and 53 percent said they did not want a loan (13
percent did not answer the question and might be presumed to be
uninterested in borrowing as well). Twenty-four percent of the owners
reported that weak sales continued to be their top business problem.
Twenty-nine (29) percent of all owners reported borrowing on a regular
basis, unchanged from May and only 1 point above the record low. A net 9
percent reported loans “harder to get” compared to their last attempt (asked
of regular borrowers only), a 1 point improvement but still suggesting that
the lending environment is still a bit less “friendly” than during the
expansion, most often because the recession compromised the financial
strength and prospects of applicants.

8/6/2019 Small Business Optimism Index July 2011
http://slidepdf.com/reader/full/small-business-optimism-index-july-2011 5/23
3
| N F I B S m a l l B u s i n e s s E c o n o
m i c T r e n d s
M o n t h l y R e p o r t
COMMENTARY
It is hard to think of anything that happened in June that would make small
business owners more optimistic. The Federal Reserve Bank stayed
course, making the big bankers and traders happy; the large manufacturers
are doing well exporting and paying no taxes (well, GE anyway); all that
liquidity is chasing stocks (new technology stocks are hot); and all is well
on Wall Street and K Street. Virtually all of the employer firms in the U.S.
are not publically traded. If they were, the stock market picture would be
grim, with only 18 percent reporting earnings improvements quarter on
quarter compared to 41 percent reporting declines. The Administration
invokes the “helping small business” (recently found to be the second most
respected profession in a Gallup poll) mantra, but they don’t have a clue.
Small business is invisible to them beyond the press conferences. Indeed,
Treasury Secretary of the Treasury Geitner told small business owners in
his Congressional testimony that the Administration needs more of theirmoney to support government spending, remember the “1099 health care
requirement” that was supposed to catch all sorts of tax cheats? Arguing
that only 3 percent of the owners would be impacted, he suggested that if
owners don’t pay up, education will get less money - not that Washington
spends money on anything effectively, including education; they always
cut something that hurts, not the political pork and patronage that cost
billions. The “3 percent” figure is highly misleading, since the
denominator in that calculation is based on 30 million Schedule C claims.
But there are only six million employer firms in the U.S. that employpeople other than the owner(s) so if the numerator is correct, the figure for
those impacted firms that employ someone would be five times larger than
the Treasury Secretary intimates. That’s the Administration’s “job creation”
policy.
Also, the Administration seems to enjoy the leadership vacuum it has
created. Nobody is in charge except the regulators who relentlessly pursue
the “big government” agenda by issuing truckloads of edicts. The President
brushes off criticism of the NLRB/Boeing controversy by saying hedoesn’t involve himself with the NLRB (other than making recess
appointments of SEIU cronies!). Does he think people really believe this?
Did anyone notice that the TSA is now unionized, even though the original
legislation prohibited this? About 8,000 of 40,000 employees voted for the
union, that was all it took to put all employees under the union
management which is now meeting with TSA. Stay tuned.
The Administration and its Wall Street affiliates don’t seem to understand
the nature of the problems on Main Street, which is no surprise becausefew of them have ever had a real private sector job. But this produces bad
policy, at best benign but often detrimental to the recovery they claim they
want and that is underway. June was the two year anniversary of the
recovery, in case you didn’t notice.

8/6/2019 Small Business Optimism Index July 2011
http://slidepdf.com/reader/full/small-business-optimism-index-july-2011 6/23
4
| N F I B S m a l l B u s i n e s s E c o n o m i c T r e n d s
M o n t h l y R e p o r t
OVERVIEW - SMALL BUSINESS OPTIMISM
OPTIMISM INDEX
Based on Ten Survey Indicators(Seasonally Adjusted 1986=100)
Jan Feb Mar Apr May Jun Jul Aug Sep Oct Nov Dec
2006 101.1 101.5 98.0 100.1 98.5 96.7 98.1 95.9 99.4 100.7 99.7 96.5
2007 98.9 98.2 97.3 96.8 97.2 96.0 97.6 96.3 97.3 96.2 94.4 94.6
2008 91.8 92.9 89.6 91.5 89.3 89.2 88.2 91.1 92.9 87.5 87.8 85.2
2009 84.1 82.6 81.0 86.8 88.9 87.9 86.5 88.6 88.8 89.1 88.3 88.0
2010 89.3 88.0 86.8 90.6 92.2 89.0 88.1 88.8 89.0 91.7 93.2 92.6
2011 94.1 94.5 91.9 91.2 90.9 90.8
OPTIMISM INDEX
Based on Ten Survey Indicators(Seasonally Adjusted 1986=100)
OUTLOOK
Good Time to Expand and Expected General Business Conditions January 1986 to June 2011
(Seasonally Adjusted)
SMALL BUSINESS OUTLOOK
80
90
100
110
86 88
I n d e x
V a
l u e
( 1 9 8 6 =
1 0 0 )
YEAR
-40
-20
0
20
40
60
80
0
10
20
30
86 88 90 92 94 96 98 00 02 04 06 08 10 P e r c e n
t " G o o
d T i m e
t o E x p a n
d "
( t h i c k l i n e
)
P e r c e n
t " B e
t t e r "
M i n u s "
W o r s e
"
E x p e c
t e d G e n e r a
l
B u s
i n e s s
C o n
d i t i o n s
( t h
i n l i n e
)
YEAR
8/6/2019 Small Business Optimism Index July 2011
http://slidepdf.com/reader/full/small-business-optimism-index-july-2011 7/23
5
| N F I B S m a l l B u s i n e s s E c o n o
m i c T r e n d s
M o n t h l y R e p o r t
SMALL BUSINESS OUTLOOK (CONTINUED)
Jan Feb Mar Apr May Jun Jul Aug Sep Oct Nov Dec
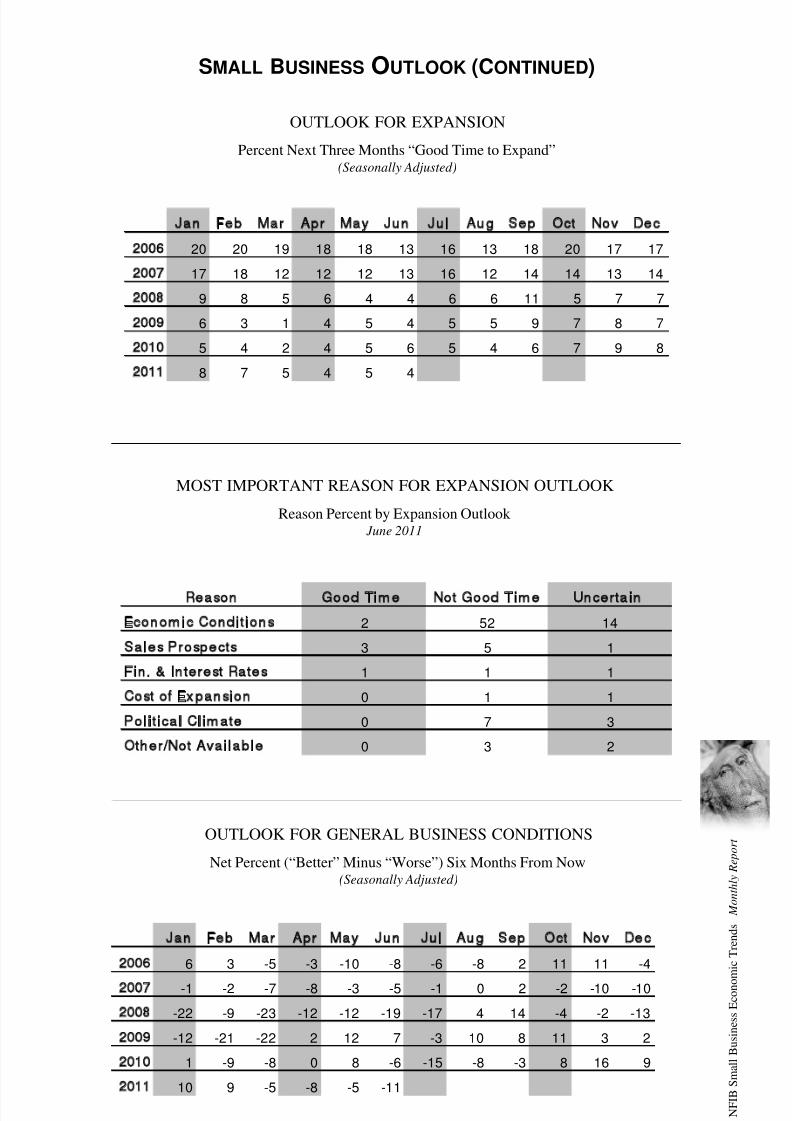
2006 20 20 19 18 18 13 16 13 18 20 17 17
2007 17 18 12 12 12 13 16 12 14 14 13 14
2008 9 8 5 6 4 4 6 6 11 5 7 7
2009 6 3 1 4 5 4 5 5 9 7 8 7
2010 5 4 2 4 5 6 5 4 6 7 9 8
2011 8 7 5 4 5 4
OUTLOOK FOR EXPANSION
Percent Next Three Months “Good Time to Expand”(Seasonally Adjusted)
MOST IMPORTANT REASON FOR EXPANSION OUTLOOK
Reason Percent by Expansion Outlook June 2011
Reason Good Time Not Good Time Uncertain
Economi c Conditi ons 2 52 14
Sales Prospects 3 5 1
Fin. & Inte rest Rates 1 1 1
Cost of Expansion 0 1 1
Political Climate 0 7 3
Other/Not Avail able 0 3 2
OUTLOOK FOR GENERAL BUSINESS CONDITIONS
Net Percent (“Better” Minus “Worse”) Six Months From Now(Seasonally Adjusted)
Jan Feb Mar Apr May Jun Jul Aug Sep Oct Nov Dec
2006 6 3 -5 -3 -10 -8 -6 -8 2 11 11 -4
2007 -1 -2 -7 -8 -3 -5 -1 0 2 -2 -10 -10
2008 -22 -9 -23 -12 -12 -19 -17 4 14 -4 -2 -13
2009 -12 -21 -22 2 12 7 -3 10 8 11 3 2
2010 1 -9 -8 0 8 -6 -15 -8 -3 8 16 9
2011 10 9 -5 -8 -5 -11
8/6/2019 Small Business Optimism Index July 2011
http://slidepdf.com/reader/full/small-business-optimism-index-july-2011 8/23
6
| N F I B S m a l l B u s i n e s s E c o n o m i c T r e n d s
M o n t h l y R e p o r t
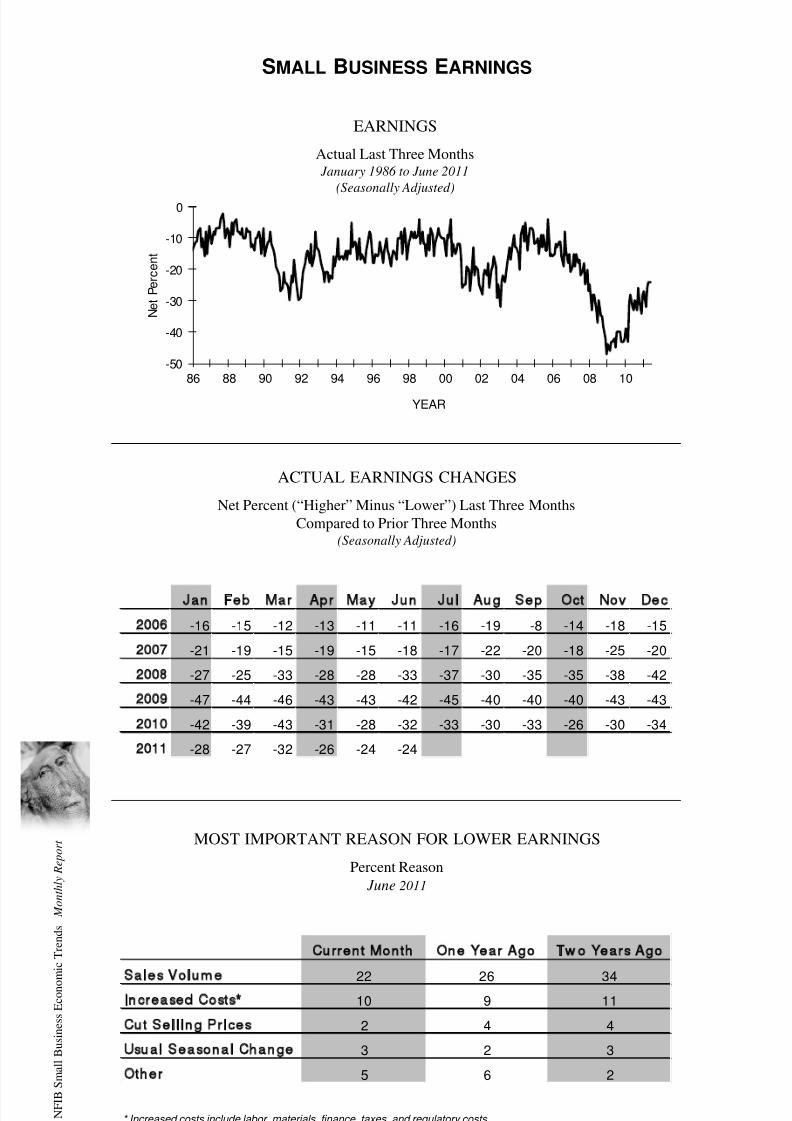
SMALL BUSINESS EARNINGS
EARNINGS
Actual Last Three Months January 1986 to June 2011
(Seasonally Adjusted)
ACTUAL EARNINGS CHANGES
Net Percent (“Higher” Minus “Lower”) Last Three Months
Compared to Prior Three Months(Seasonally Adjusted)
MOST IMPORTANT REASON FOR LOWER EARNINGS
Percent Reason
June 2011
Current Month One Year Ago Two Years Ago
Sales Volume 22 26 34Increased Costs* 10 9 11
Cut Selling Prices 2 4 4
Usual Seasonal Change 3 2 3
Other 5 6 2
Jan Feb Mar Apr May Jun Jul Aug Sep Oct Nov Dec
2006 -16 -15 -12 -13 -11 -11 -16 -19 -8 -14 -18 -15
2007 -21 -19 -15 -19 -15 -18 -17 -22 -20 -18 -25 -20
2008 -27 -25 -33 -28 -28 -33 -37 -30 -35 -35 -38 -42
2009 -47 -44 -46 -43 -43 -42 -45 -40 -40 -40 -43 -43
2010 -42 -39 -43 -31 -28 -32 -33 -30 -33 -26 -30 -34
2011 -28 -27 -32 -26 -24 -24
* Increased costs include labor, materials, finance, taxes, and regulatory costs.
-50
-40
-30
-20
-10
0
86 88 90 92 94 96 98 00 02 04 06 08 10
N e
t P e r c e n
t
YEAR

8/6/2019 Small Business Optimism Index July 2011
http://slidepdf.com/reader/full/small-business-optimism-index-july-2011 9/23
7
| N F I B S m a l l B u s i n e s s E c o n o
m i c T r e n d s
M o n t h l y R e p o r t
SMALL BUSINESS SALES
SALES EXPECTATIONS
Net Percent (“Higher” Minus “Lower”) During Next Three Months(Seasonally Adjusted)
ACTUAL SALES CHANGES
Net Percent (“Higher” Minus “Lower”) Last Three Months
Compared to Prior Three Months(Seasonally Adjusted)
SALES
Actual (Prior Three Months) and Expected (Next Three Months) January 1986 to June 2011
(Seasonally Adjusted)
Jan Feb Mar Apr May Jun Jul Aug Sep Oct Nov Dec
2006 2 6 5 6 11 6 3 2 5 2 0 3
2007 -3 -1 0 4 1 -4 -1 -4 -4 -4 -3 1
2008 -7 -8 -11 -9 -11 -12 -15 -10 -11 -21 -25 -29
2009 -31 -28 -34 -28 -33 -34 -34 -27 -26 -31 -31 -25
2010 -26 -26 -25 -15 -11 -15 -16 -16 -17 -13 -15 -16
2011 -11 -11 -12 -5 -9 -7
Jan Feb Mar Apr May Jun Jul Aug Sep Oct Nov Dec
2006 24 28 12 21 20 13 18 10 17 17 21 182007 22 17 14 14 16 11 14 13 14 13 8 6
2008 4 0 -3 -3 -11 -11 -9 -6 -2 -16 -14 -18
2009 -20 -29 -31 -11 -5 -10 -11 -5 -6 -4 -2 -1
2010 3 0 -3 6 5 -5 -4 0 -3 1 6 8
2011 13 14 6 5 3 0
-40
-30
-20
-10
0
10
20
30
40
50
86 88 90 92 94 96 98 00 02 04 06 08 10
Expected
Actual
N e
t P e r c e n
t
YEAR
8/6/2019 Small Business Optimism Index July 2011
http://slidepdf.com/reader/full/small-business-optimism-index-july-2011 10/23
8
| N F I B S m a l l B u s i n e s s E c o n o m i c T r e n d s
M o n t h l y R e p o r t
SMALL BUSINESS PRICES
PRICE PLANS
Net Percent (“Higher” Minus “Lower”) in the Next Three Months(Seasonally Adjusted)
ACTUAL PRICE CHANGES
Net Percent (“Higher” Minus “Lower”)
Compared to Three Months Ago(Seasonally Adjusted)
PRICES
Actual Last Three Months and Planned Next Three Months January 1986 to June 2011
(Seasonally Adjusted)
Jan Feb Mar Apr May Jun Jul Aug Sep Oct Nov Dec
2006 18 23 17 26 24 23 23 22 20 16 17 8
2007 12 13 15 18 16 19 19 13 9 15 14 16
2008 8 13 18 20 23 29 32 26 20 15 0 -6
2009 -15 -24 -23 -24 -22 -17 -19 -19 -21 -17 -17 -22
2010 -18 -21 -20 -11 -15 -13 -11 -8 -11 -5 -4 -5
2011 -4 5 9 12 15 10
Jan Feb Mar Apr May Jun Jul Aug Sep Oct Nov Dec
2006 29 27 26 28 30 29 30 29 22 21 22 26
2007 24 23 22 24 23 21 23 22 21 22 26 26
2008 26 22 29 31 32 36 38 30 24 18 11 3
2009 2 1 0 1 3 5 5 8 6 5 4 3
2010 8 10 9 13 14 11 10 10 7 12 13 15
2011 19 21 24 24 23 15
-30
-20
-10
0
10
20
30
40
86 88 90 92 94 96 98 00 02 04 06 08 10
Planned
Actual N e
t P e r c e n
t o f F i r m s
YEAR

8/6/2019 Small Business Optimism Index July 2011
http://slidepdf.com/reader/full/small-business-optimism-index-july-2011 11/23
9
| N F I B S m a l l B u s i n e s s E c o n o
m i c T r e n d s
M o n t h l y R e p o r t
SMALL BUSINESS EMPLOYMENT
Jan Feb Mar Apr May Jun Jul Aug Sep Oct Nov Dec
2006 1 4 -1 -3 -3 -2 2 5 -3 5 0 3
2007 2 4 -6 -5 -2 0 1 4 -1 3 0 2
2008 0 -3 -7 -9 -10 -12 -5 -4 -10 -9 -10 -18
2009 -15 -15 -22 -25 -24 -23 -17 -16 -16 -12 -12 -12
2010 -10 -9 -11 -12 -12 -10 -5 -2 -3 -6 -2 -1
2011 -4 -2 -4 -6 -3 -7
ACTUAL EMPLOYMENT CHANGES
Net Percent (“Increase” Minus “Decrease”) in the Last Three Months(Seasonally Adjusted)
Jan Feb Mar Apr May Jun Jul Aug Sep Oct Nov Dec
2006 40 40 39 41 46 45 42 46 44 46 44 40
2007 41 41 43 43 42 45 43 44 48 46 40 37
2008 37 36 36 37 33 39 36 35 38 35 31 30
2009 * * 24 24 25 27 26 23 25 25 28 21
2010 24 26 23 26 26 25 28 32 30 28 27 28
2011 28 30 29 32 30 33
QUALIFIED APPLICANTS FOR JOB OPENINGS
Percent Few or No Qualified Applicants(Seasonally Adjusted)
EMPLOYMENT
Planned Next Three Months and Current Job Openings January 1986 to June 2011
(Seasonally Adjusted)
-10
0
10
20
30
40
86 88 90 92 94 96 98 00 02 04 06 08 10
Planned
Job Openings
YEAR
P e r c e n
t

8/6/2019 Small Business Optimism Index July 2011
http://slidepdf.com/reader/full/small-business-optimism-index-july-2011 12/23
1 0
| N F I B S m a l l B u s i n e s s E c o n o m i c T r e n d s
M o n t h l y R e p o r t
SMALL BUSINESS EMPLOYMENT (CONTINUED)
Jan Feb Mar Apr May Jun Jul Aug Sep Oct Nov Dec
2006 26 26 23 31 25 25 24 25 25 27 22 19
2007 26 25 26 26 24 26 23 25 25 22 19 21
2008 24 20 19 21 15 21 17 15 18 14 14 14
2009 11 11 10 9 9 11 9 8 8 8 8 10
2010 10 11 9 11 9 9 10 11 11 10 9 13
2011 13 15 15 14 12 15
JOB OPENINGS
Percent With Positions Not Able to Fill Right Now(Seasonally Adjusted)
HIRING PLANS
Net Percent (“Increase” Minus “Decrease”) in the Next Three Months(Seasonally Adjusted)
Jan Feb Mar Apr May Jun Jul Aug Sep Oct Nov Dec
2006 17 16 9 16 14 9 15 17 17 16 19 10
2007 17 13 12 13 13 12 13 15 14 11 11 11
2008 9 11 3 5 2 5 5 9 7 0 -4 -6
2009 -6 -3 -10 -5 -5 -1 -3 0 -4 -1 -3 -2
2010 -1 -1 -2 -1 1 1 2 1 -3 1 4 6
2011 3 5 2 2 -1 3
SMALL BUSINESS COMPENSATION
COMPENSATION
Actual Last Three Months and Planned Next Three Months January 1986 to June 2011 (Seasonally Adjusted)
-5
0
5
10
15
20
25
30
35
40
86 88 90 92 94 96 98 00 02 04 06 08 10
N e
t P e r c e n t
YEAR
Planned Higher
Actual Higher

8/6/2019 Small Business Optimism Index July 2011
http://slidepdf.com/reader/full/small-business-optimism-index-july-2011 13/23
1 1
| N F I B S m a l l B u s i n e s s E c o n
o m i c T r e n d s
M o n t h l y R e p o r t
SMALL BUSINESS COMPENSATION (CONTINUED)
ACTUAL COMPENSATION CHANGES
Net Percent (“Increase” Minus “Decrease”) During Last Three Months(Seasonally Adjusted)
Jan Feb Mar Apr May Jun Jul Aug Sep Oct Nov Dec
2006 25 24 22 27 24 22 24 25 28 23 25 21
2007 26 30 28 26 29 26 27 24 27 26 21 24
2008 25 23 24 20 15 20 18 18 17 15 13 9
2009 7 1 0 0 0 -2 1 1 3 0 0 3
2010 1 -2 0 3 2 4 3 3 3 4 8 8
2011 10 8 7 9 9 8
Jan Feb Mar Apr May Jun Jul Aug Sep Oct Nov Dec
2006 16 20 16 19 15 14 17 16 16 18 20 17
2007 16 19 19 18 16 15 16 14 19 16 15 14
2008 12 12 15 14 8 12 12 11 10 9 10 4
2009 3 3 0 2 1 3 4 3 3 5 1 1
2010 1 6 3 5 4 3 5 6 3 5 5 3
2011 5 7 9 7 7 7
COMPENSATION PLANS
Net Percent (“Increase” Minus “Decrease”) in the Next Three Months(Seasonally Adjusted)
PRICES AND LABOR COMPENSATION
Net Percent Increase and Net Percent Compensation(Seasonally Adjusted)
-30
-20
-10
0
10
20
30
40
86 88 90 92 94 96 98 00 02 04 06 08 10
Actual Prices
Actual Compensation
YEAR

8/6/2019 Small Business Optimism Index July 2011
http://slidepdf.com/reader/full/small-business-optimism-index-july-2011 14/23
1 2
| N F I B S m a l l B u s i n e s s E c o n o m i c T r e n d s
M o n t h l y R e p o r t
SMALL BUSINESS CREDIT CONDITIONS
CREDIT CONDITIONS
Loan Availability Compared to Three Months Ago* January 1986 to June 2011
* For the population borrowing at least once every three months.
REGULAR BORROWERS
Percent Borrowing at Least Once Every Three Months(Seasonally Adjusted)
Jan Feb Mar Apr May Jun Jul Aug Sep Oct Nov Dec
2006 37 38 36 40 38 41 38 46 35 37 38 35
2007 37 39 35 37 38 35 36 35 36 36 32 34
2008 36 34 33 36 35 35 34 34 32 33 31 33
2009 35 36 33 33 34 30 33 32 33 33 33 33
2010 32 34 35 31 32 29 32 31 33 31 28 30
2011 31 31 29 32 29 29
AVAILABILITY OF LOANS
Net Percent (“Easier” Minus “Harder”)
Compared to Three Months Ago(Regular Borrowers)
Jan Feb Mar Apr May Jun Jul Aug Sep Oct Nov Dec
2006 -5 -5 -6 -4 -5 -5 -6 -8 -3 -6 -6 -62007 -5 -5 -7 -5 -6 -5 -5 -7 -9 -6 -7 -7
2008 -7 -5 -7 -9 -8 -7 -9 -10 -11 -9 -11 -12
2009 -13 -13 -12 -14 -16 -14 -15 -14 -14 -14 -15 -15
2010 -14 -12 -15 -14 -13 -13 -13 -12 -14 -11 -11 -12
2011 -10 -11 -8 -9 -10 -9
-18
-16
-14
-12
-10
-8
-6
-4
-2
02
86 88 90 92 94 96 98 00 02 04 06 08 10
N e
t P e r c e n
t o f F i r m s
YEAR

8/6/2019 Small Business Optimism Index July 2011
http://slidepdf.com/reader/full/small-business-optimism-index-july-2011 15/23
1 3
| N F I B S m a l l B u s i n e s s E c o n
o m i c T r e n d s
M o n t h l y R e p o r t
SMALL BUSINESS CREDIT CONDITIONS (CONTINUED)
Jan Feb Mar Apr May Jun Jul Aug Sep Oct Nov Dec
2006 36/4 37/6 36/6 38/5 38/5 39/5 38/4 44/4 34/4 36/7 34/4 36/5
2007 36/5 40/5 35/5 38/4 39/6 36/4 37/5 35/4 37/5 36/6 32/4 32/7
2008 34/5 35/4 32/6 34/5 34/7 35/5 32/7 35/6 33/6 31/6 31/7 32/6
2009 33/8 32/8 29/10 30/8 28/9 30/10 28/10 30/7 30/10 29/9 29/10 28/8
2010 27/11 29/9 29/11 28/9 28/8 25/10 27/9 27/9 27/9 26/9 25/9 28/9
2011 28/8 29/8 28/7 28/8 28/8 25/9
BORROWING NEEDS SATISFIED
Percent of All Businesses Last Three Months Satisfied/
Percent of All Businesses Last Three Months Not Satisfied
(All Borrowers)
Jan Feb Mar Apr May Jun Jul Aug Sep Oct Nov Dec
2006 -6 -7 -7 -8 -8 -8 -7 -9 -5 -6 -5 -7
2007 -7 -8 -8 -7 -6 -6 -6 -9 -10 -8 -8 -10
2008 -9 -8 -9 -11 -10 -10 -12 -11 -13 -16 -13 -15
2009 -14 -16 -14 -12 -15 -13 -14 -13 -15 -16 -15 -15
2010 -13 -14 -16 -15 -12 -13 -14 -14 -14 -12 -10 -11
2011 -10 -10 -9 -13 -11 -10
EXPECTED CREDIT CONDITIONS
Net Percent (“Easier” Minus “Harder”) During Next Three Months(Regular Borrowers)
INTEREST RATES
Relative Rates and Actual Rates Last Three Months January 1986 to June 2011
-40
-20
0
20
40
5
7
9
11
13
86 88 90 92 94 96 98 00 02 04 06 08 10
YEAR
A v g . S
h o r t - t e r m
R a
t e ( t h i c k
l i n e
)
R a
t e R e
l a t i v e
( t h
i n l i n e
)

8/6/2019 Small Business Optimism Index July 2011
http://slidepdf.com/reader/full/small-business-optimism-index-july-2011 16/23
1 4
| N F I B S m a l l B u s i n e s s E c o n o m i c T r e n d s
M o n t h l y R e p o r t
SMALL BUSINESS CREDIT CONDITIONS (CONTINUED)
Jan Feb Mar Apr May Jun Jul Aug Sep Oct Nov Dec
2006 26 32 29 32 28 30 30 34 22 20 23 16
2007 17 21 19 16 15 12 12 14 15 4 3 1
2008 0 -9 -5 -12 -15 -11 -4 -2 -3 -2 -6 -8
2009 -12 -9 -1 -2 0 0 3 3 5 3 8 3
2010 6 6 9 5 4 0 2 3 1 1 0 1
2011 3 6 5 5 3 0
RELATIVE INTEREST RATE PAID BY
REGULAR BORROWERS
Net Percent (“Higher” Minus “Lower”) Compared to Three Months Ago
Borrowing at Least Once Every Three Months.
ACTUAL INTEREST RATE PAID ON
SHORT-TERM LOANS BY BORROWERS
Average Interest Rate Paid
Jan Feb Mar Apr May Jun Jul Aug Sep Oct Nov Dec
2006 8.1 8.3 8.0 8.7 8.1 8.7 9.1 9.0 8.8 8.8 8.3 9.8
2007 9.1 9.3 9.3 9.2 9.5 9.3 9.2 8.7 9.0 9.1 8.5 8.5
2008 8.3 8.1 8.3 7.7 6.9 7.1 7.0 6.9 7.1 6.6 7.0 6.6
2009 6.4 6.2 6.2 6.1 6.3 6.5 6.5 6.1 6.1 6.0 5.9 6.3
2010 6.3 6.0 6.8 6.4 6.5 6.0 6.3 6.3 6.2 6.0 5.7 6.2
2011 6.0 6.0 5.9 6.5 6.0 6.0
SMALL BUSINESS INVENTORIES
INVENTORIES
Actual (Last Three Months) and Planned (Next Three Months) January 1986 to June 2011
(Seasonally Adjusted)
-30
-25
-20
-15
-10
-5
0
5
10
15
86 88 90 92 94 96 98 00 02 04 06 08 10
Actual
Planned
N e
t P e r c e n
t
YEAR

8/6/2019 Small Business Optimism Index July 2011
http://slidepdf.com/reader/full/small-business-optimism-index-july-2011 17/23
1 5
| N F I B S m a l l B u s i n e s s E c o n
o m i c T r e n d s
M o n t h l y R e p o r t
SMALL BUSINESS INVENTORIES (CONTINUED)
ACTUAL INVENTORY CHANGES
Net Percent (“Increase” Minus “Decrease”) During Last Three Months(Seasonally Adjusted)
Jan Feb Mar Apr May Jun Jul Aug Sep Oct Nov Dec
2006 3 1 6 0 -2 0 0 3 1 0 0 -3
2007 1 5 2 -2 2 -5 -2 -3 -2 -1 -6 -3
2008 -4 -2 -7 -10 -12 -11 -14 -13 -12 -13 -17 -21
2009 -18 -19 -23 -27 -27 -27 -27 -24 -24 -26 -25 -28
2010 -21 -18 -18 -18 -20 -21 -19 -15 -14 -16 -15 -13
2011 -10 -8 -7 -9 -13 -14
INVENTORY SATISFACTION
Net Percent (“Too Low” Minus “Too Large”) at Present Time(Seasonally Adjusted)
Jan Feb Mar Apr May Jun Jul Aug Sep Oct Nov Dec
2006 -1 -2 0 -1 -1 -1 -2 -6 -6 -3 -6 -7
2007 -2 -2 -5 -3 -6 -7 -2 -2 -3 -7 -3 -3
2008 -4 -4 -1 -1 -3 -1 -4 -3 -1 -4 -4 -7
2009 -6 -5 -4 -5 -2 -5 -4 -4 0 -3 -2 -4
2010 -1 -1 -1 1 0 -1 0 -1 -2 1 -3 -3
2011 0 2 -1 1 -1 -1
INVENTORY PLANS
Net Percent (“Increase” Minus “Decrease”) in the Next Three to Six Months(Seasonally Adjusted)
Jan Feb Mar Apr May Jun Jul Aug Sep Oct Nov Dec
2006 5 7 3 2 3 0 1 -1 -1 4 0 0
2007 2 3 3 3 0 -3 2 -4 0 1 2 -3
2008 -4 -2 -2 -1 -4 -5 -4 -9 -3 -5 -6 -4
2009 -10 -10 -13 -7 -3 -6 -5 -7 -6 -3 -3 -8
2010 -4 -7 -7 -2 2 -3 -4 -7 -3 -4 0 -3
2011 -1 -2 1 -1 -3 -3

8/6/2019 Small Business Optimism Index July 2011
http://slidepdf.com/reader/full/small-business-optimism-index-july-2011 18/23
1 6
| N F I B S m a l l B u s i n e s s E c o n o m i c T r e n d s
M o n t h l y R e p o r t
SMALL BUSINESS CAPITAL OUTLAYS
CAPITAL EXPENDITURES
Actual Last Six Months and Planned Next Three Months January 1986 to June 2011
(Seasonally Adjusted)
ACTUAL CAPITAL EXPENDITURES
Percent Making a Capital Expenditure During the Last Six Months
Jan Feb Mar Apr May Jun Jul Aug Sep Oct Nov Dec
2006 62 63 62 62 62 60 61 62 63 62 63 61
2007 62 61 61 60 60 55 58 58 60 61 56 62
2008 58 58 57 56 54 52 52 54 52 54 56 51
2009 51 52 50 46 46 46 46 45 44 45 44 44
2010 47 47 45 46 46 46 45 44 45 47 51 47
2011 51 49 51 50 50 50
INVENTORY SATISFACTION AND INVENTORY PLANS
Net Percent (“Too Low” Minus “Too Large”) at Present Time
Net Percent Planning to Add Inventories in the Next Three to Six Months
(Seasonally Adjusted)
-15
-10
-5
0
5
10
15
86 88 90 92 94 96 98 00 02 04 06 08 10
Inventory Plans
Inventory Satisfaction
P e r c e n
t
YEAR
15
25
35
45
55
65
75
86 88 90 92 94 96 98 00 02 04 06 08 10
P e r c e n
t
YEAR
Actual
Planned

8/6/2019 Small Business Optimism Index July 2011
http://slidepdf.com/reader/full/small-business-optimism-index-july-2011 19/23
1 7
| N F I B S m a l l B u s i n e s s E c o n
o m i c T r e n d s
M o n t h l y R e p o r t
SMALL BUSINESS CAPITAL OUTLAYS (CONTINUED)
AMOUNT OF CAPITAL EXPENDITURES MADE
Percent Distribution of Per Firm Expenditures
During the Last Six Months
Amount Current One Year Ago Two Years Ago
$1 to $999 4 4 4
$1,000 to $4,999 9 10 9
$5,000 to $9,999 5 6 3
$10,000 to $49,999 16 14 15
$50,000 to $99,999 7 5 7
$100,000 + 7 6 7
No Answer 2 1 1
CAPITAL EXPENDITURE PLANS
Percent Planning a Capital Expenditure During Next Three to Six Months(Seasonally Adjusted)
Jan Feb Mar Apr May Jun Jul Aug Sep Oct Nov Dec
2006 32 35 31 33 28 27 31 28 30 31 31 26
2007 30 30 33 29 29 28 27 27 29 27 27 30
2008 25 26 25 26 25 26 21 23 21 19 21 17
2009 19 18 16 19 20 17 18 16 18 17 16 18
2010 20 20 19 19 20 19 18 16 19 18 20 21
2011 22 22 24 21 20 21
TYPE OF CAPITAL EXPENDITURES MADE
Percent Purchasing or Leasing During Last Six Months
Type Current One Year Ago Two Years Ago
Vehicles 19 15 16
Equipment 32 30 31
Furniture or Fixtures 10 9 11
Add. Bldgs. or Land 5 4 4
Improved Bldgs. or Land 11 11 13
8/6/2019 Small Business Optimism Index July 2011
http://slidepdf.com/reader/full/small-business-optimism-index-july-2011 20/23
1 8
| N F I B S m a l l B u s i n e s s E c o n o m i c T r e n d s
M o n t h l y R e p o r t
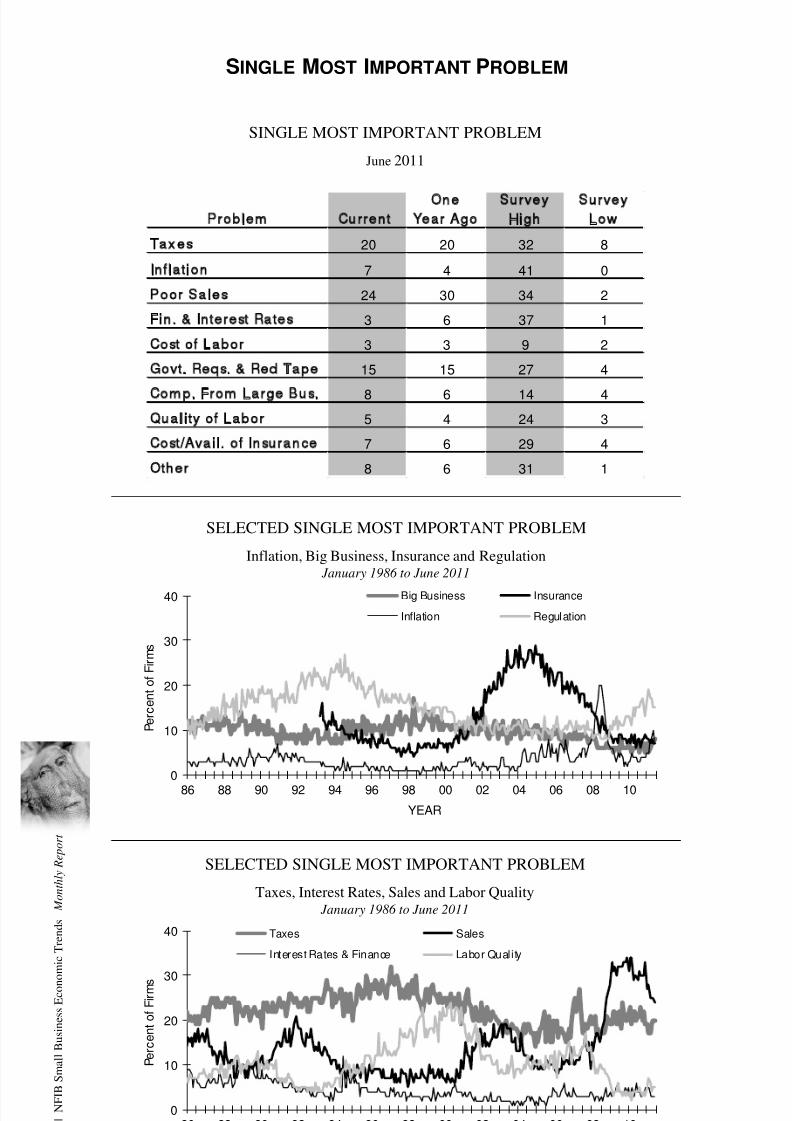
SINGLE MOST IMPORTANT PROBLEM
SINGLE MOST IMPORTANT PROBLEM
June 2011
Problem Current
One
Year Ago
Survey
High
Survey
Low
Taxes 20 20 32 8
Inflation 7 4 41 0
Poor Sales 24 30 34 2
Fin. & Interest Rates 3 6 37 1
Cost of Labor 3 3 9 2
Govt. Reqs. & Red Tape 15 15 27 4
Comp. From Large Bus. 8 6 14 4
Quality of Labor 5 4 24 3
Cost/Avail. of Insurance 7 6 29 4
Other 8 6 31 1
SELECTED SINGLE MOST IMPORTANT PROBLEM
Inflation, Big Business, Insurance and Regulation January 1986 to June 2011
0
10
20
30
40
86 88 90 92 94 96 98 00 02 04 06 08 10
Big Business Insurance
Inflation Regulation
P e r c e n
t o
f F i r m s
YEAR
SELECTED SINGLE MOST IMPORTANT PROBLEM
Taxes, Interest Rates, Sales and Labor Quality January 1986 to June 2011
0
10
20
30
40
86 88 90 92 94 96 98 00 02 04 06 08 10
Taxes Sales
Interest Rates & Finance Labor Quality
P e r c e n
t o
f F i r m s
YEAR
8/6/2019 Small Business Optimism Index July 2011
http://slidepdf.com/reader/full/small-business-optimism-index-july-2011 21/23
1 9
| N F I B S m a l l B u s i n e s s E c o n
o m i c T r e n d s
M o n t h l y R e p o r t
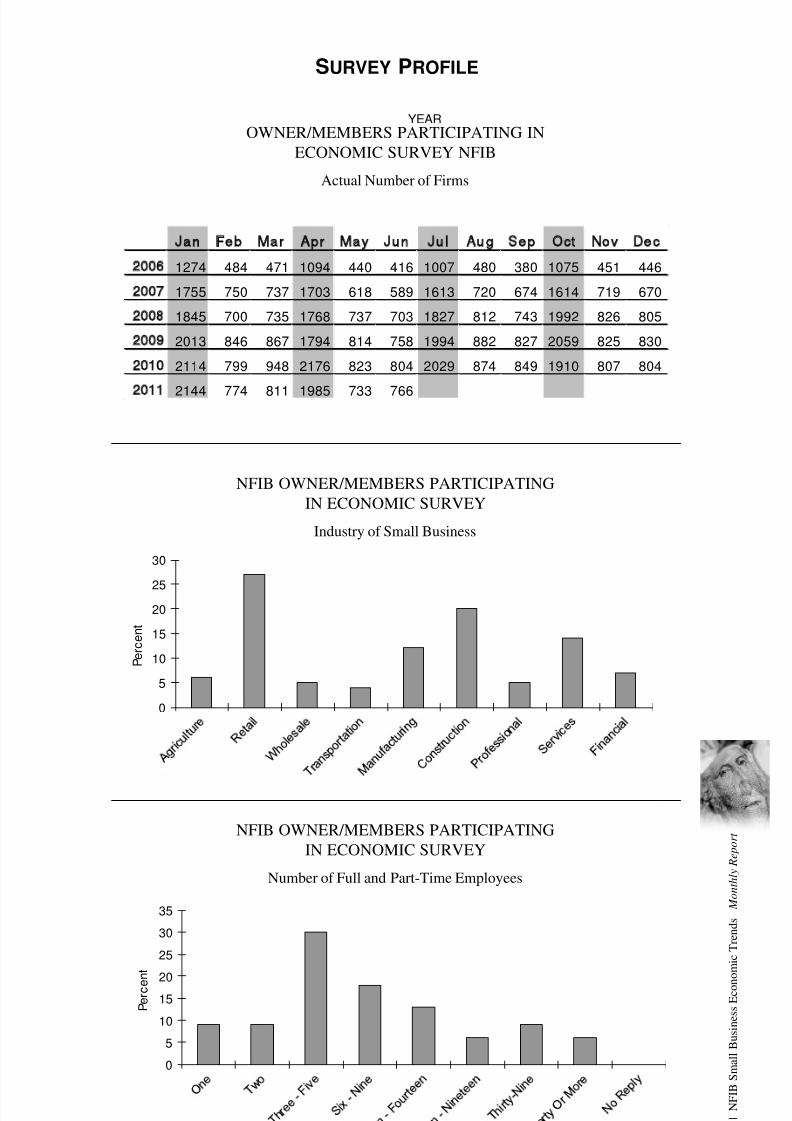
SURVEY PROFILE
OWNER/MEMBERS PARTICIPATING IN
ECONOMIC SURVEY NFIB
Actual Number of Firms
NFIB OWNER/MEMBERS PARTICIPATING
IN ECONOMIC SURVEY
Industry of Small Business
Jan Feb Mar Apr May Jun Jul Aug Sep Oct Nov Dec
2006 1274 484 471 1094 440 416 1007 480 380 1075 451 446
2007 1755 750 737 1703 618 589 1613 720 674 1614 719 670
2008 1845 700 735 1768 737 703 1827 812 743 1992 826 805
2009 2013 846 867 1794 814 758 1994 882 827 2059 825 830
2010 2114 799 948 2176 823 804 2029 874 849 1910 807 804
2011 2144 774 811 1985 733 766
NFIB OWNER/MEMBERS PARTICIPATING
IN ECONOMIC SURVEY
Number of Full and Part-Time Employees
0
5
10
15
20
25
30
P e r c e n
t
0
5
10
1520
25
30
35
P e r c e n
t

8/6/2019 Small Business Optimism Index July 2011
http://slidepdf.com/reader/full/small-business-optimism-index-july-2011 22/23
2 0
| N F I B S m a l l B u s i n e s s E c o n o m i c T r e n d s
Q u a r t e r l y R e p o r t
NFIB RESEARCH FOUNDATION SMALL
BUSINESS ECONOMIC SURVEY
SMALL BUSINESS SURVEY QUESTIONS PAGE IN REPORT
Do you think the next three months will be a good time
for small business to expand substantially? Why? . . . . . . . . . . . . . . . 4
About the economy in general, do you think that six
months from now general business conditions will be
better than they are now, about the same, or worse? . . . . . . . . . . . . 5
Were your net earnings or “income” (after taxes) from your
business during the last calendar quarter higher, lower, or
about the same as they were for the quarter before?. . . . . . . . . . . . . 6
If higher or lower, what is the most important reason?. . . . . . . . . . . . 6
During the last calendar quarter, was your dollar sales
volume higher, lower, or about the same as it was for
the quarter before?. . . . . . . . . . . . . . . . . . . . . . . . . . . . . . . . . . . . 7
Overall, what do you expect to happen to real volume
(number of units) of goods and/or services that you will
sell during the next three months?. . . . . . . . . . . . . . . . . . . . . . . . . 7
How are your average selling prices compared to
three months ago?. . . . . . . . . . . . . . . . . . . . . . . . . . . . . . . . . . . . 8
In the next three months, do you plan to change the
average selling prices of your goods and/or services? . . . . . . . . . . . . 8
During the last three months, did the total number of employees
in your firm increase, decrease, or stay about the same?. . . . . . . . . . 9
If you have filled or attempted to fill any job openings
in the past three months, how many qualified applicants
were there for the position(s)?. . . . . . . . . . . . . . . . . . . . . . . . . . . . 9
Do you have any job openings that you are not able
to fill right now?. . . . . . . . . . . . . . . . . . . . . . . . . . . . . . . . . . . . . 10
In the next three months, do you expect to increase or
decrease the total number of people working for you? . . . . . . . . . . . 10
Over the past three months, did you change the average
employee compensation?. . . . . . . . . . . . . . . . . . . . . . . . . . . . . . . 11
Do you plan to change average employee compensation
during the next three months?. . . . . . . . . . . . . . . . . . . . . . . . . . . 11

8/6/2019 Small Business Optimism Index July 2011
http://slidepdf.com/reader/full/small-business-optimism-index-july-2011 23/23
SMALL BUSINESS SURVEY QUESTIONS P AGE INR EPORT
Are…loans easier or harder to get than they were
three months ago? . . . . . . . . . . . . . . . . . . . . . . . . . . . . . . . . . . . . . .. . . . . . . . .12
During the last three months, was your firm able to
satisfy its borrowing needs?. . . . . . . . . . . . . . . . . . . . . . . . . . . . . . . . . . . . . . .13
Do you expect to find it easier or harder to obtain your
required financing during the next three months?. . . . . .. . . . . . . . . . . . . . . . .13
If you borrow money regularly (at least once every three
months) as part of your business activity, how does the
rate of interest payable on your most recent loan compare
with that paid three months ago?. . . . . . . . . . . . . . . . . . . . . . . . . . . . . . . . . . . .14
If you borrowed within the last three months for business
purposes, and the loan maturity (pay back period) was 1
year or less, what interest rate did you pay? . . . . . . . . . . .. . . . . . . . . . .. . . . .14
During the last three months, did you increase or decrease
your inventories?. . . . . . . . . . . . . . . . . . . . . . . . . . . . . . . .. . . . . . . . . . . . . . . . . .15
At the present time, do you feel your inventories are too
large, about right, or inadequate?. . . . . . . . . . . . . . . . . . . . . . . . . . . . . . . . . . . .15
Looking ahead to the next three months to six months,
do you expect, on balance, to add to your inventories,
keep them about the same, or decrease them? . . . . . . . . . . . . . . . . . . . . . . . .15
During the last six months, has your firm made any capital
expenditures to improve or purchase equipment, buildings,
or land? . . . . . . . . . . . . . . . . . . . . . . . . . . .. . . . . . . . . . . . . . . . . . . . . . . . . . . . . .16
If [your firm made any capital expenditures], what was
the total cost of all these projects? . . . . . . . . . . . . . . . . . . . . . . . . . . . . . . . . . .17
Looking ahead to the next three to six months, do you
expect to make any capital expenditures for plant
and/or physical equipment? . . . . . . . . . . . . . . .. . . . . . . . . . . . . . . . . . . . . . . . .17
What is the single most important problem facing your
business today? . . . . . . . . . . . . . . . . . . . . . . . . . . . . . . . . . . . . . . . . . . . . . . . . .18
Please classify your major business activity, using one
of the categories of example below.. . . . . . . . . . . . . . . . . . . . . . . . . . . . . . . . . .19
How many employees do you have full and part-time,
including yourself? . . . . . . . . . . . . . . . . . . . . . . . . . . . . . . . . . . . . . . . . . . . . . . .19N F I B S m a l l B u s i n e s s E c o n o
m i c T r e n d s
M o n t h l y R e p o r t