SMALL BUSINESS CREDIT SURVEY - clevelandfed.org
19
SMALL BUSINESS CREDIT SURVEY REPORT ON MICROBUSINESSES: NONEMPLOYER AND SMALL EMPLOYER FIRMS 2016 Published November 2017 Richmond Baltimore Charlotte FEDERAL RESERVE BANK OF RICHMOND
Transcript of SMALL BUSINESS CREDIT SURVEY - clevelandfed.org

SMALL BUSINESS CREDIT SURVEY
REPORT ON MICROBUSINESSES: NONEMPLOYER AND SMALL EMPLOYER FIRMS
2016
Published November 2017
Richmond � Baltimore � Charlotte
FEDERAL RESERVE BANKOF RICHMOND

2016 SMALL BUSINESS CREDIT SURVEY | REPORT ON MICROBUSINESSES
TABLE OF CONTENTS
i ACKNOWLEDGMENTS
ii EXECUTIVE SUMMARY
1 FIRM DEMOGRAPHICS
3 PERFORMANCE
4 FINANCIAL CHALLENGES
5 RELIANCE ON PERSONAL FINANCES
6 DEMAND FOR FINANCING
7 DEMAND FOR FINANCING PRODUCTS
8 FINANCING RECEIVED
9 LOAN/LINE OF CREDIT APPROVAL RATES
10 CREDIT SOURCES
11 LENDER SATISFACTION
12 FINANCING SHORTFALLS
13 NONAPPLICANTS
14 METHODOLOGY

i2016 SMALL BUSINESS CREDIT SURVEY | REPORT ON MICROBUSINESSES
ACKNOWLEDGMENTS
The Small Business Credit Survey is made possible through collaboration with more than 400 business organizations in communities across the United States. The Federal Reserve Banks thank the national, regional, and community partners who share valuable insights about small business financing needs and collaborate with us to promote and distribute the survey.1 We also thank the National Opinion Research Center (NORC) at the University of Chicago for assistance with weighting the survey data to be statistically representative of the nation’s small business population.2
Special thanks to colleagues within the Federal Reserve System, particularly the Community Affairs Officers,3 and representatives from the US Department of the Treasury, US Small Business Administration, the Association for Enterprise Opportunity (AEO), and the Aspen Institute for their support of the Small Business Credit Survey.
This report is the result of the collaborative effort, input, and analysis of the following teams:
REPORT TEAM Emily Wavering Corcoran, Federal Reserve Bank of Richmond
Ann Marie Wiersch, Federal Reserve Bank of Cleveland
ADVISORSClaire Kramer Mills, Federal Reserve Bank of New York
Shannon McKay, Federal Reserve Bank of Richmond
SURVEY DATA AND METHODOLOGY MANAGER Ellyn Terry, Federal Reserve Bank of Atlanta
SURVEY DATA AND METHODOLOGY TEAM Brett Barkley, Federal Reserve Bank of Cleveland
Jessica Battisto, Federal Reserve Bank of New York
Scott Lieberman, Federal Reserve Bank of New York
Emily Wavering Corcoran, Federal Reserve Bank of Richmond
PARTNERSHIPS MANAGER Emily Mitchell, Federal Reserve Bank of Atlanta
The views expressed in the following pages are those of the authors and do not necessarily represent the views of the Federal Reserve System.
1 For a full list of community partners, please see the 2016 Small Business Credit Survey Report on Employer Firms. 2 For complete information about the survey methodology, please see pg. 14.3 Joseph Firschein, Board of Governors of the Federal Reserve System; Todd Greene, Federal Reserve Bank of Atlanta; Prabal Chakrabarti, Federal Reserve Bank of Boston; Alicia Williams,
Federal Reserve of Chicago; Emily Garr Pacetti, Federal Reserve Bank of Cleveland; Roy Lopez, Federal Reserve Bank of Dallas; Tammy Edwards, Federal Reserve Bank of Kansas City; Michael Grover, Federal Reserve Bank of Minneapolis; Claire Kramer Mills, Federal Reserve Bank of New York; Theresa Singleton, Federal Reserve Bank of Philadelphia; Sandra Tormoen, Federal Reserve Bank of Richmond; Yvonne Sparks, Federal Reserve Bank of St. Louis; and David Erickson, Federal Reserve Bank of San Francisco.

ii2016 SMALL BUSINESS CREDIT SURVEY | REPORT ON MICROBUSINESSES
EXECUTIVE SUMMARY
This report is one in a series based on the findings of the 2016 Small Business Credit Survey (SBCS), a national collaboration of the Community Development Offices of the 12 Federal Reserve Banks. As a supplement to the Report on Employer Firms1 released in April 2017, this Report on Microbusinesses details findings on the financing experiences and outcomes of the smallest firms in the United States, including the self-employed.
Microbusinesses account for about 9 in 10 firms and about 34.9 million jobs in the United States.2 These firms, therefore, play a vital role in the nation’s economy. Furthermore, microbusinesses provide important economic opportunities for both women and minority business owners.3 Still, relatively little is known about the performance and financing needs of these small businesses.
The SBCS gathers timely insight to help address gaps in researchers’ and policymakers’ understanding of the experiences of this important segment of businesses.
This report compares the survey findings for three groups of small firms represented in the SBCS sample:
� Nonemployers – firms with no employees other than the business owner(s)
� Small employers – firms with one to four employees
� Larger employers – firms with 5 to 499 employees
For purposes of this report, nonemployers and small employers are collectively referred to as microbusinesses.
KEY FINDINGS
Microbusinesses are less profitable than larger employers and face more financial challenges.
� Nonemployers in particular report challenges with profitability and are just as likely to be operating at a loss as at a profit. Similarly, microbusinesses are less likely to report revenue growth in the prior 12 months. While 54 percent of larger employers reported facing financial challenges, the same was true of 61 percent of nonemployers. Some of their financial challenges may be attributed to the age of these small firms, as they are considerably younger and less established, on average, than the larger employers.
Microbusinesses are less likely than larger employers to apply for financing.
� Just 30 percent of microbusinesses applied for financing in the prior 12 months compared to 50 percent of larger employer firms. Like larger firms, those microbusinesses that sought funding did so to expand their businesses or pursue new opportunities. Among applicants, 72 percent applied for less than $100k in financing, and just over a third applied for less than $25k. Though microbusinesses seek smaller amounts of financing, they are more likely to be discouraged about their prospects for approval.
Microbusinesses are less likely than larger employers to be approved for financing.
� Nonemployers were more likely to report a funding shortfall, with 73 percent indicating they had been approved for less than the amount of financing needed or for no financing at all. Of small employers, 65 percent had a funding shortfall versus 52 percent of larger employer firms, a variance that may be partially explained by differences in credit scores. However, even among firms with similar credit scores, a smaller share of microbusinesses reported they received all the funding they sought, compared to the share of larger employers reporting the same thing.
ADDITIONAL FINDINGS
Microbusinesses are reliant on the personal finances of their owners.
� Of all firms, nonemployers are most reliant on the personal finances of their owners to secure funding for their business. Sixty-five percent use only the personal credit score of their owner(s) when applying for financing. Furthermore, these firms are least likely to provide business assets as collateral to secure debt and instead rely on personal guarantees and personal assets.
� In order to fund their business operations, 45 percent of nonemployers and 26 percent of small employers rely primarily on their owners’ personal funds, compared to 15 percent of larger employer firms.
� Roughly four in five microbusinesses that reported financial challenges addressed the challenges using personal funds.
1 2016 Small Business Credit Survey Report on Employer Firms, Federal Reserve Banks. 2 “Microbusiness Statistics in the United States 2014,” Association for Enterprise Opportunity (2014); “Microbusiness Employment State-Level Analysis,” Association for Enterprise
Opportunity (2014).3 “Microbusiness Statistics in the United States 2014” (2014); “Microbusiness Employment State-Level Analysis” (2014).

iii2016 SMALL BUSINESS CREDIT SURVEY | REPORT ON MICROBUSINESSES
EXECUTIVE SUMMARY (CONTINUED)
Microbusinesses that sought financing most often applied for loans, credit lines, and credit cards. Large banks were the source to which microbusinesses most frequently applied.
� Among microbusinesses that applied for financing, loans, lines of credit, and credit cards were the most common products. Microbusinesses were more likely than larger employers to apply for a credit card.
� Twenty-four percent of nonemployers that applied for a loan or line of credit sought personal loans to fund their businesses, compared to 10 percent of employer firms.
� For firms of all employment sizes, banks were the most common source applicants turned to for financing. Nonemployers were considerably less likely than employer firms to apply at a small bank. In addition, microbusinesses were more likely than larger employers to apply at credit unions and online lenders.
Microbusinesses are less likely to report that their funding needs are fully met, and they are less satisfied with their lenders.
� Fewer microbusinesses received all the funding they sought, relative to larger firms. While 48 percent of larger employers reported their funding needs were fully met, just 27 percent of nonemployers and 35 percent of small employers reported the same.
� Similarly, microbusinesses reported lower approval rates for all types of loan/line of credit products and at all sources. Microbusinesses that were not approved for financing most often cited low credit scores and insufficient credit history as the primary reasons.
� Like larger employers, microbusinesses that were approved for at least some financing reported greatest satisfaction with small banks. However, compared to larger firms, microbusinesses reported lower satisfaction with large banks, small banks, and online lenders.
Microbusinesses that did not apply for financing most often reported they had sufficient funding; their most-used credit products are credit cards, loans, credit lines, and cash advances.
� Among the 70 percent of microbusinesses that did not apply for financing in the prior 12 months, these firms most often reported that they had sufficient financing already or they were debt averse as the primary reasons they did not seek funding. Thirty-two percent of nonemployers and 29% of small employers were debt averse, compared to 23 percent of larger employers.
� In addition, among nonapplicants, 23 percent of nonemployers and 19 percent of small employers were discouraged—they did not apply because they did not expect they would be approved for financing. This was the case for only 12 percent of larger employers.
� Nonapplicant microbusinesses that did not apply for financing in the prior 12 months were less likely than larger employers to use external financing on a regular basis. Thirty-six percent of microbusinesses use no external financing compared to 21 percent of larger employers. Among microbusinesses that do use financing, these firms most commonly use credit cards, loans and lines of credit, and cash advances.
ABOUT THE SURVEYThe Small Business Credit Survey (SBCS) is an annual survey of small firms with fewer than 500 employees. The survey gathers information on business performance, financing needs and choices, and borrowing experiences. Reponses to the SBCS provide insight into the dynamics behind lending trends and shed light on noteworthy segments of small businesses. The SBCS is not a random-sample survey, though the results are weighted to reflect the full population of small businesses in the United States. Results should be analyzed with awareness of potential biases that are associated with convenience samples. For detailed information about the survey design and weighting methodology, please see the Methodology section of this report.

12016 SMALL BUSINESS CREDIT SURVEY | REPORT ON MICROBUSINESSES Source: Small Business Credit Survey, Federal Reserve Banks
FIRM DEMOGRAPHICS
EMPLOYMENT SIZE OF FIRM1 (% of all firms)N=15,991
Largeremployer
firms12%
89% of small businesses are microbusinesses.2
What are microbusinesses?This report defines microbusinesses as all nonemployer firms and small employer firms with fewer than 5 employees.
35%
26%
11% 11%
54%
63%
AGE OF FIRM (% of microbusinesses)
0–2 years 3–4 years 5+ years
gNonemployer firms (N=4,585)
gSmall employer firms (N=3,146)
gLarger employer firms (N=7,158)
CHARACTERISTICS OF FIRM OWNERS (% of microbusinesses)
Microbusiness firms
Median age of firm’s primary
decision maker3 (N=8,338)
46–55 years old
Percent of firms that are
minority owned4 (N=7,054)
30%
1 "Largeremployerfirms"aredefinedasfirmswith5to499employees;"Smallemployerfirms"aredefinedasfirmswith1to4employees;"Nonemployerfirms"aredefinedasfirmswithnoemployeesbeyondtheowner(s).
2 Percentages may not sum to 100 because of rounding. 3 Themedianageofafirm’sprimarydecisionmakerforlargerfirmsis56–65yearsold.4 Thepercentoflargeremployerfirmsthatareminorityownedis16%.
Nonemployer firms75%
Small employer
firms14%
13%7%
80%
gNonemployer firms (no employees other than the business owner)
gSmall employer firms (1 to 4 employees)
gLarger employer firms (5 to 499 employees)

22016 SMALL BUSINESS CREDIT SURVEY | REPORT ON MICROBUSINESSES Source: Small Business Credit Survey, Federal Reserve Banks
REVENUE SIZE OF FIRM1 (% of microbusinesses)
FIRM DEMOGRAPHICS (CONTINUED)
CREDIT RISK OF FIRM1,2 (% of microbusinesses)
gNonemployer firms (N=5,205)
gSmall employer firms (N=3,028)
gLarger employer firms (N=6,937)
73%
<$100K $100K–$1M $1M–$10M >$10M
53%
gNonemployer firms (N=3,689)
gSmall employer firms (N=2,099)
gLarger employer firms (N=4,484)
Low credit risk Medium credit risk High credit risk
INDUSTRY1,3 (% of microbusinesses)
Professional services
Nonmanufacturing goods/services
Business support and customer service
Retail
Healthcare and education
Leisure and hospitality
Finance and insurance
Manufacturing
26%20%
18%17%
24%16%
8%16%
11%12%
7%9%
3%8%
1%3%
gNonemployer firms (N=4,585) gSmall employer firms (N=3,146)
1 Percentages may not sum to 100 because of rounding.2 Self-reportedbusinesscreditscoreorpersonalcreditscore,dependingonwhichisusedtoobtainfinancingforthebusiness.Ifthefirmusesboth,thehighestriskratingisused."Lowcreditrisk"is
an80–100businesscreditscoreora720+personalscore."Mediumcreditrisk"isa50–79businesscreditscoreora620–719personalcreditscore."Highcreditrisk"isa1–49businesscreditscoreor a <620 personal credit score.
3 Firmindustryisclassifiedbasedonthedescriptionofwhatthebusinessdoes,asprovidedbythesurveyparticipant.See Appendix fordefinitionsofeachindustry.
31%
8%
24%
59%
37%
2%9%
46%
8%0% 1% 6%
9%15%
24%28%
32%
71%
62%
32016 SMALL BUSINESS CREDIT SURVEY | REPORT ON MICROBUSINESSES Source: Small Business Credit Survey, Federal Reserve Banks
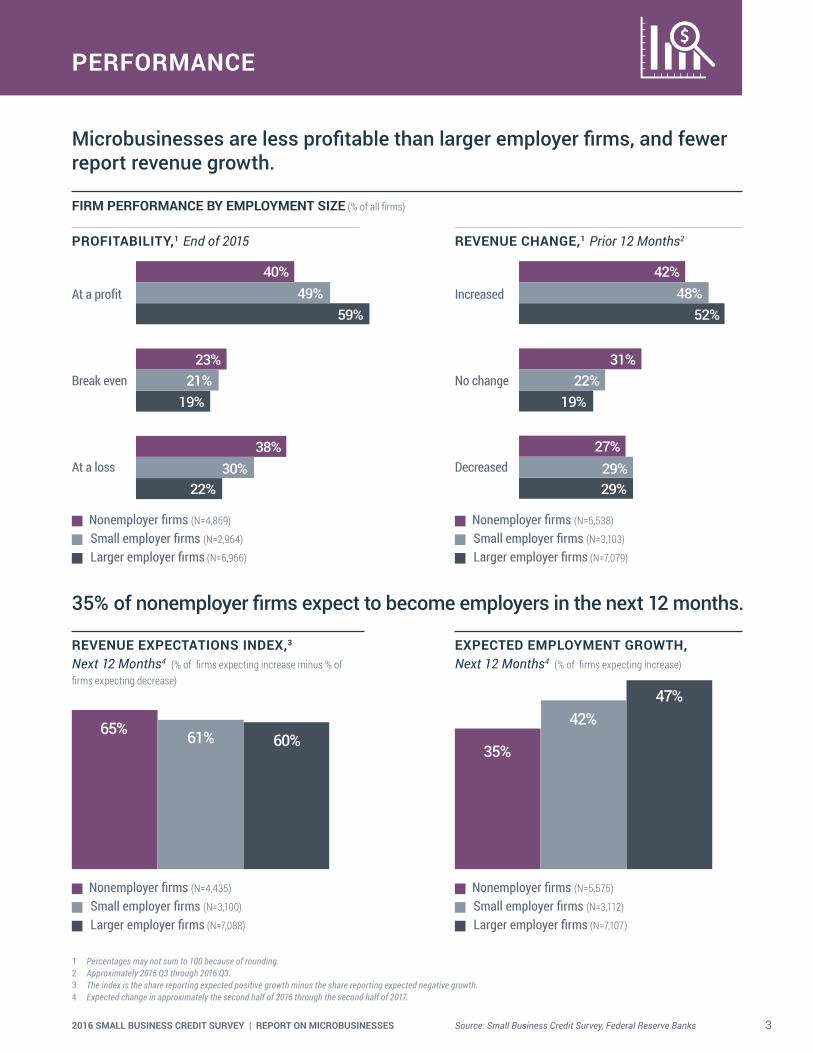
PERFORMANCE
1 Percentages may not sum to 100 because of rounding. 2 Approximately2015:Q3through2016:Q3.3 The index is the share reporting expected positive growth minus the share reporting expected negative growth.4 Expectedchangeinapproximatelythesecondhalfof2016throughthesecondhalfof2017.
Microbusinesses are less profitable than larger employer firms, and fewer report revenue growth.
FIRM PERFORMANCE BY EMPLOYMENT SIZE (% of all firms)
PROFITABILITY,1 End of 2015
40%49%
59%
23%21%
19%
38%30%
22%
At a profit
Break even
At a loss
REVENUE CHANGE,1 Prior 12 Months2
42%48%
52%
31%22%
19%
27%29%29%
Increased
No change
Decreased
gNonemployer firms (N=4,869)
gSmall employer firms (N=2,964)
gLarger employer firms (N=6,966)
35% of nonemployer firms expect to become employers in the next 12 months.
REVENUE EXPECTATIONS INDEX,3 Next 12 Months4 (% of firms expecting increase minus % of firms expecting decrease)
EXPECTED EMPLOYMENT GROWTH, Next 12 Months4 (% of firms expecting increase)
65% 61% 60%35%
42%47%
gNonemployer firms (N=5,538)
gSmall employer firms (N=3,103)
gLarger employer firms (N=7,079)
gNonemployer firms (N=5,575)
gSmall employer firms (N=3,112)
gLarger employer firms (N=7,107)
gNonemployer firms (N=4,435)
gSmall employer firms (N=3,100)
gLarger employer firms (N=7,088)

42016 SMALL BUSINESS CREDIT SURVEY | REPORT ON MICROBUSINESSES Source: Small Business Credit Survey, Federal Reserve Banks
1 Approximatelythesecondhalfof2015throughthesecondhalfof2016.2 Financial challenges are listed in “Types of Financial Challenges” chart. 3 Respondents could select multiple options. 4 Response options "unsure" and "other" not shown in chart. See Appendix for more detail.
FINANCIAL CHALLENGES
SHARE OF FIRMS WITH FINANCIAL CHALLENGES BY EMPLOYMENT SIZE OF FIRM, Prior 12 Months1 (% of all firms)
Microbusinesses are more likely to report financial challenges.2
61% 63%54%
gNonemployer firms (N=5,602) gSmall employer firms (N=3,094)
gLarger employer firms (N=7,036)
ACTIONS3,4 TAKEN IN RESPONSE TO FINANCIAL CHALLENGES, Prior 12 Months1
(% of microbusinesses reporting financial challenges)
Used personal funds
Made a late payment
Took out additional debt
Cut staff, hours, and/or downsized operations
Negotiated terms with lender
Did not pay/debt went to collections
gNonemployer firms (N=2,603)
gSmall employer firms (N=1,498)
TYPES OF FINANCIAL CHALLENGES, Prior 12 Months1 (% of microbusinesses)
Credit availability or securing funds for expansion
Paying operating expenses
Making payments on debt
Purchasing inventory or supplies to fulfill contract
Experienced none of these challenges
gNonemployer firms (N=5,602)
gSmall employer firms (N=3,094)
45%45%
32%37%
25%27%
20%19%
39%37%
83%79%
36%42%
28%41%
25%42%
16%18%
10%9%

52016 SMALL BUSINESS CREDIT SURVEY | REPORT ON MICROBUSINESSES Source: Small Business Credit Survey, Federal Reserve Banks
RELIANCE ON PERSONAL FINANCES
93% of microbusinesses rely on the owners’ personal credit scores to obtain financing.
PRIMARY FUNDING SOURCE BY EMPLOYMENT SIZE OF FIRM1 (% of all firms)
1 Percentages may not sum to 100 because of rounding. 2 Respondents could select multiple options. Response options "unsure" and "other" not shown in chart. See Appendix for more detail.
gRetained business earnings gPersonal funds gExternal financing
Nonemployer firms (N=5,563)
Small employer firms (N=3,084)
Larger employer firms (N=7,068)
48% 45% 7%
62% 26% 12%
66% 15% 19%
CREDIT SCORE USED TO OBTAIN FINANCING1 (% of all firms)
gBusiness score gOwner's personal score gBoth
Nonemployer firms (N=4,043)
Small employer firms (N=2,326)
Larger employer firms (N=5,198)
6% 65% 29%
10% 48% 43%
19% 33% 49%
COLLATERAL USED TO SECURE DEBT1,2 (% of all firms with debt)
42%32%
24%
26%8%
14%8%
42%37%
53%
9%9%
60%38%
63%
gPersonal guaranteegPersonal assetsgBusiness assetsgPortion of future salesgNone
Nonemployer firms (N=2,709)
Small employer firms (N=2,040)
Larger employer firms (N=5,317)

62016 SMALL BUSINESS CREDIT SURVEY | REPORT ON MICROBUSINESSES Source: Small Business Credit Survey, Federal Reserve Banks
DEMAND FOR FINANCING
SHARE OF FIRMS THAT SOUGHT FINANCING BY EMPLOYMENT SIZE OF FIRM, Prior 12 Months1 (% of firms)
1 Approximatelythesecondhalfof2015throughthesecondhalfof2016.2 Respondents could select multiple options.3 Respondents who selected "other" were asked to explain their reasons for applying. They most often indicated that they were looking to start a business or to obtain a credit line in case they needed it.
69%56%
72%
Nonemployer firms (N=5,687) Small employer firms (N=3,145) Larger employer firms (N=7,159)
28%
50%
39%
REASONS FOR APPLYING FOR FINANCING BY EMPLOYMENT SIZE OF FIRM,2,3 (% of applicants)
Nonemployer firms (N=1,567)
Small employer firms (N=1,220)
Larger employer firms (N=3,576)
68% 43% 21% 9%
63% 46% 23% 7%
62% 43% 25% 9%
gExpand business/pursue new opportunity gMeet operating expenses gRefinance or pay down debt gOther
72% of microbusiness applicants sought less than $100K in financing.
TOTAL AMOUNT OF FINANCING SOUGHT (% of microbusiness applicants)
$25K or less $25K–$100K $100K–$250K $250K–$1M More than $1M
39%
3%4%11%10%
17%14%
39%
33%30%
gNonemployer firms (N=1,541) gSmall employer firms (N=1,193)

72016 SMALL BUSINESS CREDIT SURVEY | REPORT ON MICROBUSINESSES Source: Small Business Credit Survey, Federal Reserve Banks
Microbusiness applicants most often sought loans and lines of credit; compared to larger employer firms, microbusinesses more frequently sought personal loans to fund the firms' operations.
TOP TWO FINANCING AND CREDIT PRODUCTS SOUGHT,1 Select Products (% of applicants)
DEMAND FOR FINANCING PRODUCTS
Loan/line of credit
Credit card
81%84%
25%33%
38%
88%
gNonemployer firms (N=1,569) gSmall employer firms (N=1,219) gLarger employer firms (N=3,581)
LOAN AND LINE OF CREDIT PRODUCTS SOUGHT,2 (% of loan/line of credit applicants)
Business loan
Line of credit
SBA loan/line of credit
Personal loan
Auto or equipment loan
Cash advance
Mortgage
53%
8%6%
10%
8%9%10%
18%13%
12%
10%18%
24%
20%23%
25%
45%37%
32%
48%53%
gNonemployer firms (N=1,197) gSmall employer firms (N=957) gLarger employer firms (N=2,911)
1 Respondents could select multiple options. Response options "equity investment," "leasing," "trade," "factoring" and "other" not shown in chart. See Appendix for more detail. 2 Respondents could select multiple options. Response option "other" not shown in chart. See Appendix for more detail.

82016 SMALL BUSINESS CREDIT SURVEY | REPORT ON MICROBUSINESSES Source: Small Business Credit Survey, Federal Reserve Banks
Microbusinesses across all risk categories were less likely to receive financing.
27% of nonemployer firms and 35% of small employer firms received the full amount of funding for which they applied.
FINANCING RECEIVED
TOTAL FINANCING RECEIVED BY EMPLOYMENT SIZE OF FIRM1,2 (% of applicants)
Nonemployer firms (N=1,533)
Small employer firms (N=1,204)
Larger employer firms (N=3,535)
27% 28% 45%
35% 37% 28%
48% 34% 18%
gAll gSome gNone
SHARE RECEIVING AT LEAST SOME FINANCING BY CREDIT RISK AND EMPLOYMENT SIZE OF FIRM3 (% of applicants)
74%
59%
45%
30%
70%66%
51%
88%81%
Low credit risk Medium credit risk High credit risk
gNonemployer firms (N=1,533) gSmall employer firms (N=1,204) gLarger employer firms (N=3,535)
1 Shareoffinancingreceivedacrossalltypesoffinancing.Responseoption"unsure"excludedfromthechart.2 Percentages may not sum to 100 because of rounding.3 Self-reportedbusinesscreditscoreorpersonalcreditscore,dependingonwhichisusedtoobtainfinancingforthebusiness.Ifthefirmusesboth,thehighestriskratingisused."Lowcreditrisk"
isan80–100businesscreditscoreora720+personalscore."Mediumcreditrisk"isa50–79businesscreditscoreora620–719personalcreditscore."Highcreditrisk"isa1–49businesscreditscore or a <620 personal credit score.

92016 SMALL BUSINESS CREDIT SURVEY | REPORT ON MICROBUSINESSES Source: Small Business Credit Survey, Federal Reserve Banks
LOAN/LINE OF CREDIT APPROVAL RATES
Microbusinesses that applied for loan or line of credit products report lower approval rates for all products.
LOAN/LINE OF CREDIT FINANCING RECEIVED BY EMPLOYMENT SIZE OF FIRM1 (% of loan/line of credit applicants)
APPROVAL RATES FOR LOAN/LINE OF CREDIT PRODUCTS2,3 (% of loan/line of credit applicants)
Nonemployer firms (N=1,151)
Small employer firms (N=923)
Larger employer firms (N=2,842)
25% 16% 60%
29% 23% 48%
47% 21% 32%
gAll gSome gNone
Auto/equipment loan
Cash advance
Line of credit
Mortgage
Personal loan
Business loan
64%
69%50%
38%
63%55%
41%
75%65%
42%
76%62%
49%
80%66%
57%
87%72%
gNonemployer firms (N=600) gSmall employer firms (N=472) gLarger employer firms (N=1,272)
1 Percentages may not sum to 100 because of rounding.2 Approval rate is the share of applications approved for at least some credit. 3 Select answer responses shown. See Appendix for more detail. Respondents could select multiple options.
102016 SMALL BUSINESS CREDIT SURVEY | REPORT ON MICROBUSINESSES Source: Small Business Credit Survey, Federal Reserve Banks
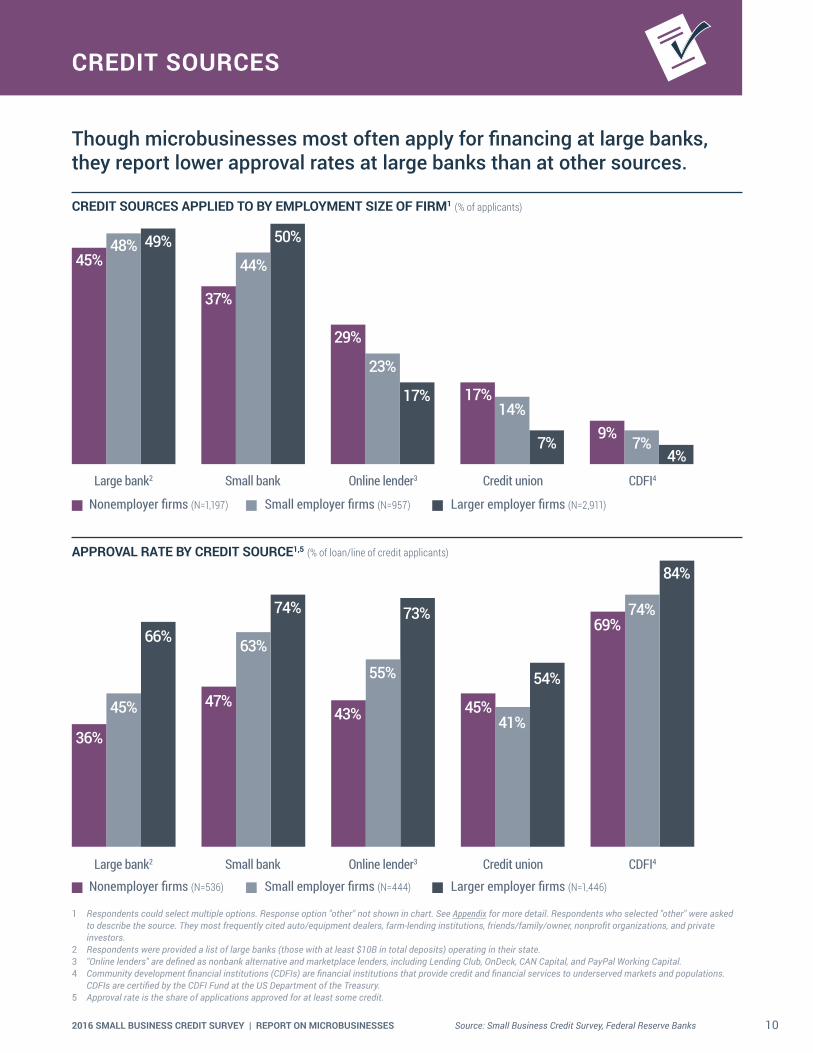
CREDIT SOURCES
Though microbusinesses most often apply for financing at large banks, they report lower approval rates at large banks than at other sources.
CREDIT SOURCES APPLIED TO BY EMPLOYMENT SIZE OF FIRM1 (% of applicants)
1 Respondents could select multiple options. Response option "other" not shown in chart. See Appendix for more detail. Respondents who selected "other" were asked to describe the source. They most frequently cited auto/equipment dealers, farm-lending institutions, friends/family/owner, nonprofit organizations, and private investors.
2 Respondents were provided a list of large banks (those with at least $10B in total deposits) operating in their state. 3 "Online lenders" are defined as nonbank alternative and marketplace lenders, including Lending Club, OnDeck, CAN Capital, and PayPal Working Capital. 4 Community development financial institutions (CDFIs) are financial institutions that provide credit and financial services to underserved markets and populations.
CDFIs are certified by the CDFI Fund at the US Department of the Treasury.5 Approval rate is the share of applications approved for at least some credit.
Large bank2 Small bank Online lender3 Credit union CDFI4
gNonemployer firms (N=1,197) gSmall employer firms (N=957) gLarger employer firms (N=2,911)
45%48% 49%
37%
4%7%9%7%
14%17%17%
23%
29%
50%
44%
APPROVAL RATE BY CREDIT SOURCE1,5 (% of loan/line of credit applicants)
36%
45%
66%
47%
84%
74%69%
54%
41%45%
73%
55%
43%
74%
63%
Large bank2 Small bank Online lender3 Credit union CDFI4
gNonemployer firms (N=536) gSmall employer firms (N=444) gLarger employer firms (N=1,446)

112016 SMALL BUSINESS CREDIT SURVEY | REPORT ON MICROBUSINESSES Source: Small Business Credit Survey, Federal Reserve Banks
32% 32% 37%
37% 29% 34%
53% 23% 24%
29% 35% 36%
32% 41% 27%
33% 37% 29%
Microbusinesses are less satisfied than larger employer firms with the sources at which they applied for financing.
LENDER SATISFACTION
LENDER1,2 SATISFACTION BY EMPLOYMENT SIZE OF FIRM (% of applicants approved for at least some financing)
1 Response options "credit union," "CDFI" and "other" not shown. See Appendix for more detail.2 Percentages may not sum to 100 because of rounding. 3 Respondents were provided a list of large banks (those with at least $10B in total deposits) operating in their state. 4 "Online lenders" are defined as nonbank alternative and marketplace lenders, including Lending Club, OnDeck, CAN Capital, and PayPal Working Capital.
SATISFACTION WITH LARGE BANKS3
SATISFACTION WITH ONLINE LENDERS4
Nonemployer firms (N=727)
Small employer firms (N=682)
Larger employer firms (N=2,036)
51% 24% 25%
62% 22% 15%
72% 15% 13%
SATISFACTION WITH SMALL BANKS
Nonemployer firms (N=492)
Small employer firms (N=537)
Larger employer firms (N=1,998)
Nonemployer firms (N=299)
Small employer firms (N=198)
Larger employer firms (N=348)
gSatisfied gNeutral gDissatisfied

122016 SMALL BUSINESS CREDIT SURVEY | REPORT ON MICROBUSINESSES Source: Small Business Credit Survey, Federal Reserve Banks
FINANCING SHORTFALLS
73% of microbusinesses had a financing shortfall, meaning they obtained less financing than the amount for which they applied.
1 Respondents could select multiple options. Response options "unfair lending practices," "unsure," and "other" not shown in chart. See Appendix for more detail.
SHARE WITH A FINANCING SHORTFALL BY EMPLOYMENT SIZE OF FIRM (% of applicants)
Nonemployer firms (N=1,573)
Small employer firms (N=1,220)
Larger employer firms (N=3,535)
73%
65%
52%
REASONS FOR CREDIT DENIAL BY EMPLOYMENT SIZE OF FIRM1(% of applicants with a financing shortfall)
Low credit score
Insufficient credit history
Weak business performance
Insufficient collateral
Too much debt already
44%33%
24%
41%33%
21%
37%31%31%
34%31%
30%
28%26%
29%
gNonemployer firms (N=791) gSmall employer firms (N=584) gLarger employer firms (N=1,246)

132016 SMALL BUSINESS CREDIT SURVEY | REPORT ON MICROBUSINESSES Source: Small Business Credit Survey, Federal Reserve Banks
NONAPPLICANTS
SHARE OF FIRMS THAT DID NOT APPLY FOR FINANCING BY EMPLOYMENT SIZE OF FIRM, Prior 12 months1 (% of firms)
1 Approximately the second half of 2015 through the second half of 2016. Share represents firms that did not apply for new or additional financing.2 Response options "credit cost high/search too difficult" and "other" not shown. See Appendix for detail.3 Respondents could select multiple options. Response options "equity," "factoring," and "unsure" not shown in chart. See Appendix for more detail.
Nonemployer firms (N=5,687) Small employer firms (N=3,145) Larger employer firms (N=7,159)
72%61%
50%
TOP THREE REASONS FOR NOT APPLYING2 (% of nonapplicant microbusinesses)
Nonemployer firms (N=3,920)
Small employer firms (N=1,826)
36% 32%
19%29%43%
23%
gSufficient financing gDebt averse gDiscouraged
NONAPPLICANT USE OF FINANCING AND CREDIT3, Products Used on a Regular Basis (% of nonapplicants)
Credit card
Loan/line of credit/cash advance
Trade credit
Leasing
Business does not use external financing
54%
21%24%
36%
14%9%
3%
14%10%
5%
15%
42%29%
58%60%
gNonemployer firms (N=3,982) gSmall employer firms (N=1,871) gLarger employer firms (N=3,356)

142016 SMALL BUSINESS CREDIT SURVEY | REPORT ON MICROBUSINESSES
METHODOLOGY
DATA COLLECTION The Small Business Credit Survey (SBCS) uses a convenience sample of establishments. Businesses are contacted by email through a diverse set of organizations that serve the small business community.1 Prior SBCS participants and small businesses on publicly available email lists2 are also contacted directly by one of the Federal Reserve Banks. The survey instrument is an online questionnaire that typically takes 6 to 12 minutes to complete, depending upon the intensity of a firm’s search for financing. The questionnaire uses question branching and flows based on responses to survey questions. For example, financing applicants receive a different line of questioning than nonapplicants. Therefore, the number of observations for each question varies according to how many firms receive and complete a particular question.
WEIGHTING A sample for the SBCS is not selected randomly; thus, the SBCS may be subject to biases not present with surveys that do select firms randomly. For example, our contact lists likely do not include the full population of small employer firms; this may lead to a noncoverage bias.
We control for potential biases by weighting the sample data so that the weighted distribution of firms in the SBCS matches the distribution of the small (1 to 499 employees) firm population in the United States by number of employees, firm age, industry, and geographic location (census region). We collaborate with the National Opinion Research Center (NORC) in order to calculate these weights. The data used for weighting
come from data collected by the US Census Bureau.3 While weighting the data makes the sample considerably more representative of the small firm population, the SBCS is still potentially affected by nonresponse bias, something that should be taken into consideration when interpreting the results.
COMPARISONS TO PAST REPORTS Because previous SBCS reports have varied in terms of the population scope, geographic coverage, and weighting methodology, the survey reports are not directly comparable across time.
For example, both employer and nonemployer firm results from the 2014 survey are combined into one report (published in 2015), while employers and nonemployers are divided into separate reports for the 2015 and 2016 surveys (published in 2016 and 2017, respectively).
Moreover, geographic coverage and weighting strategies varied from year to year. In the employer/nonemployer combined report using 2014 survey data, geographic coverage includes only 10 states, and data are weighted by firm age, nonemployer or employer designation, number of employees (if employer firm), state, and industry. The employer report using 2015 survey data covers 26 states, and data are weighted by firm age, number of employees, and industry. The employer report using 2016 survey data includes respondents from all 50 states and the District of Columbia. The data are weighted by firm age, number of employees, industry, and geographic location (census division and urban or rural location). In addition to being weighted by different firm characteristics over time, the categories used
within each characteristic have also differed across survey years (three employee size categories in 2015 and five employee size categories in 2016). Further, respondents are weighted according to the composition of firms in the geographic area of coverage.
In addition to population scope, geographic coverage, and weighting differences, some of the survey questions have also changed slightly from year to year, making some question comparisons impossible even when using a time-consistent weighting approach.
As this report presents findings on both employer and nonemployer firms, it uses a different weighting scheme than that used in the 2016 SBCS Report on Employer Firms.4 As such, employer firm figures reported here may differ slightly from those reported in the Report on Employer Firms and should not be directly compared.
1 For a full list of community partners, please see the 2016 Small Business Credit Survey Report on Employer Firms. 2 These lists include the System for Award Management (SAM) Entity Management Extracts Public Data Package, the Small Business Association (SBA) Dynamic Small Business
Search(DSBS),state-maintainedlistsofcertifieddisadvantagedbusinessenterprises(DBEs),stateandlocalgovernmentProcurementVendorLists,stateandlocalgovernment-maintainedlistsofsmallordisadvantagedsmallbusinesses,andalistofveteran-ownedsmallbusinessesthatismaintainedbytheDepartmentofVeteransAffairs.
3 Age-of-firmdatacomefromthe2014BusinessDynamicsStatistics.Industry,employeesize,andgeographiclocationdataarefromthe2014CountyBusinessPatterns.Weusedatafrom the 2012 Survey of Business Owners to compare businesses by the race of the owner.
4 2016 Small Business Credit Survey Report on Employer Firms, Federal Reserve Banks.