Small Area Estimates: an Illustration for Family Planning ... · Small Area Estimates: an...
16
Small Area Estimates: an Illustration for Family Planning using Nepal as a Case Study WORLD DATA FORUM Cape Town, South Africa, 15-18 January 2016 Sainan Zhang Ph.D. Technical Specialist United Nations Population Fund Session (TA3.05) Integrating data from different sources to count the most vulnerable
Transcript of Small Area Estimates: an Illustration for Family Planning ... · Small Area Estimates: an...

Small Area Estimates:
an Illustration for Family Planning
using Nepal as a Case Study
WORLD DATA FORUM Cape Town, South Africa, 15-18 January 2016
Sainan Zhang Ph.D.
Technical Specialist
United Nations Population Fund
Session (TA3.05) Integrating data from different
sources to count the most vulnerable
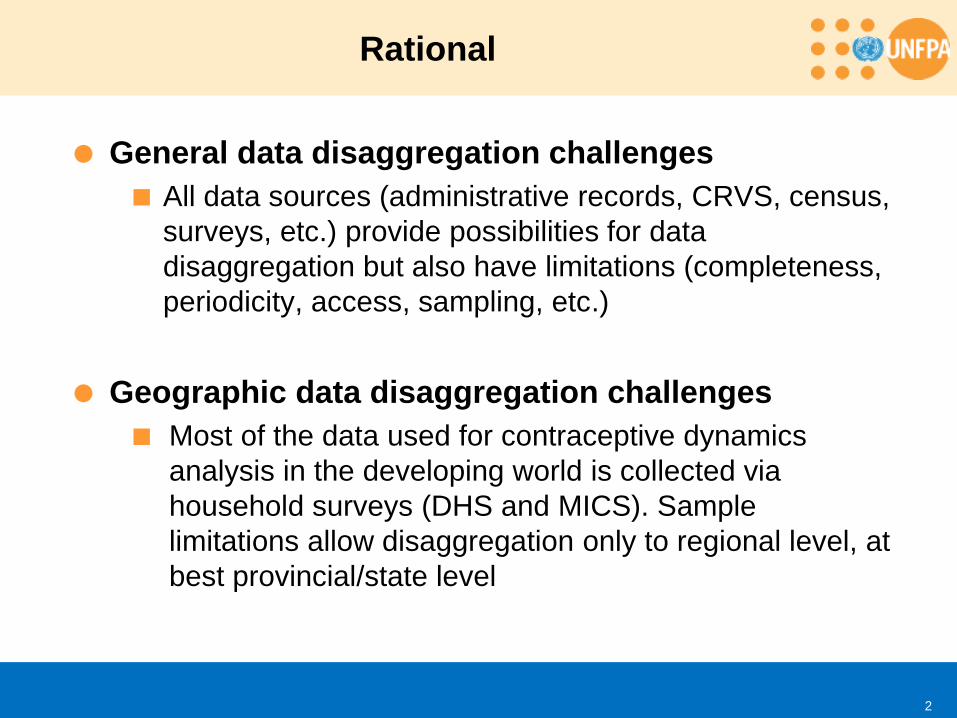
General data disaggregation challenges
All data sources (administrative records, CRVS, census,
surveys, etc.) provide possibilities for data
disaggregation but also have limitations (completeness,
periodicity, access, sampling, etc.)
Geographic data disaggregation challenges
Most of the data used for contraceptive dynamics
analysis in the developing world is collected via
household surveys (DHS and MICS). Sample
limitations allow disaggregation only to regional level, at
best provincial/state level
Rational
2

SDG Indicator 3.7.1: Percentage of women of reproductive age
(15-49 Years) who have their need for family planning satisfied
with modern methods
Family Planning Indicator (SDG3.7.1)
3
Contraceptive prevalence rate (CPR) is the percentage of women who are
currently using, or whose sexual partner is currently using, at least one method of
contraception, regardless of the method used
mCPR is the contraceptive prevalence rate using modern methods
Unmet need is defined as the percentage of women of reproductive age, either
married or in union, who want to stop or delay childbearing but are not using any
method of contraception.
mCPR
CPR + Unmet need X100 SDG3.7.1 =

Family Planning Status in Nepal
4
By year:
1990-2015
By Age Groups

5 Regions; 15 Sub-regions; 75 Districts
2011 Nepal Demographic and Health Survey (DHS) represent for
13 sub-regions
Nepal
5
(these 3 sub-region in DHS are aggregated as
“western mountain”)

Sub-regional direct estimates of contraceptive
prevalence rate using DHS 2011
6

Geographic disaggregation problems
7
Kathmandu
Number Min
Individual MAX
Individual MEAN
Individual Total
Individual
Clusters 289 3 153 42 12,023
(1)DHS: Data disaggregation below the sub-regional or provincial level
involves substantial level of uncertainty and thus not recommended
(2)Census: Do not have family planning indicators

Using SAE to produce estimates of Family Planning (FP)
indicators for each one of the 75 districts in Nepal
The SAE technique takes advantage of the existing
correlation between FP indicators and a set of common
variables in the 2011DHS and the 2011 Population
Census Public Use Microdata Sample (PUMS) data
(age, number of children, urban/rural residence,
education, water and sanitation, etc.) to predict values
for contraceptive dynamics indicators at the district level
using regression models.
Small Area Estimates (SAE) as an Alternative
8

Small Area Estimation (SAE)
1. Data Analysis and Assessment
2. Regression model coefficients for predicting
probability of using contraception for an
individual woman are obtained from the
2011 NDHS data
3. The national coefficients from DHS are
applied to the 2011 Census Data to predict
the probability of using contraception for
individual women
4. The individual contraceptive use
probabilities from census data are
aggregated (using average) to district level
Application of SAE
1. Estimate the number of women aged 15-49
(married or in union) in need of
contraception
2. Identify the priority districts
Key Steps of SAE and Application
9
Major Steps:
1. Identify common variables
associated with contraceptive
indicators in DHS and census data
DH
S
CE
NS
US
2. Develop a model for
predicting the probability of
individual contraceptive use
using DHS data
3. Apply the model to census
and estimate the probability of
individual contraceptive use
4. Aggregate the estimation of
individual contraceptive use to
small area administrative level
and map results
Variable 1
Variable 2
Variable 3
……
DHS
CENSUS

10
15 Variables Selected for SAE of CPR
Variable category Variable List
Age
Age 15-24
Age 25-34
Age 35-49
Education
Level of education is No Education
Level of education is Primary
Level of education is Some secondary
Level of education is SLC above
Number of children
Number of living children is 0
Number of living children is 1-2
Number of living children is 3 and more
Place of residence
Place of residence is urban
Place of residence is rural
Household amenities
Household has radio
Household has TV
Household has motorcycle/scooter
Household has bicycle
Household has refrigerator

11
Variable category Variable List
House floor Type of foundation of the house is cement bonded bricks/stone
House wall Type of outer wall of the house is cement bonded bricks/stone
House roof Type of roof of the house is galvanized sheet/metal
Drinking water Main source of drinking water is tap/piped drinking water
Electricity Usual source of lighting is electricity (including solar)
Toilet Type of toilet is flush toilet (septic tank)
Religion
Religion is Hindu
Religion is Bouddha
Religion is Islam
Religion is other than the above four
Mother tongue Mother tongue is Nepali
Sex of the head of household Sex of head of household is Male
Sex of head of household is Female
Relation to the head of
household
Relation to the household head is Head
Relation to the household head is Head’s wife
Relation to the household head is Head’s daughter
Relation to the household head is other than Head’s wife or daughter
15 Variables Selected for SAE of CPR

Results Assessment: Model Results
12
Classification Table
Observed
Predicted data
Using Contraceptive
Method Percentage
Correct
No Yes (any
method)
Using
Contraceptive
Method
No 2931 1513 66%
Yes (any
method) 1243 3381 73%
Overall Percentage 70%

Results Assessment: Regional level Direct & SAE comparison
13
DHS (2011) Census SAE
Value Confidence Intervals
Value (2011) R R-2SE R+2SE
CPR Any method
National Total 49.7 47.6 51.8 48.7
1 Eastern 46.4 42.4 50.3 49.51
2 Central 54.7 50.3 59.1 50.65
3 Western 46.1 41.2 51.0 46.75
4 Mid-Western 46.9 42.1 51.6 45.66
5 Far-Western 51.9 46.8 57.0 48.92
CPR Modern method
National Total 43.2 41.0 45.3 42.3
1 Eastern 36.2 31.8 40.6 43.1
2 Central 49.9 45.9 54.0 43.9
3 Western 38.7 33.7 43.7 40.0
4 Mid-Western 42.8 38.4 47.2 39.3
5 Far-Western 47.1 41.7 52.6 43.8
Unmet need for family
planning rate
National Total 27.0 -- -- 25.3
1 Eastern 30.0 -- -- 24.1
2 Central 21.6 -- -- 23.0
3 Western 34.0 -- -- 29.5
4 Mid-Western 26.1 -- -- 27.5
5 Far-Western 24.1 -- -- 24.4

SAE Results: mPDS at District Level
14

Identification of Priority Districts: Total Number of Women with Unmet Need and Proportion of
Demand Satisfied with modern methods
15
Taking both relative
numbers (%) and absolute
numbers (total number) into
consideration
25 districts with the lowest
% of demand satisfied
and 25 districts with the
highest number of women
with unmet need for FP
are highlighted using the
darkest color

SAE methodology is an alternative to obtain estimates of key
population indicators at lower geographic levels.
The application of SAE is helpful to policy and programming, and
contributes to SDG monitoring and other agendas.
Further combine geographic data disaggregation using SAE with age
or other disaggregation, e.g. women aged 15-24, to targeting the
locations of the most vulnerable groups.
Apply the SAE methodology into other SRH issues such as maternal
mortality, antenatal care, skilled birth attendance, etc.
Carry out capacity development activities on SAE to enhance the
capacity of National Statistical Systems.
Summary and The Way Forward
16