Small Acreage Landholder Outreach Program 2018 Annual Report
31
Small Acreage Landholder Outreach Program 2018 Annual Report Submitted to Clark County Public Works, Clean Water Program Submitted by WSU Clark County Extension Douglas M. Stienbarger, Project Director Department of Public Works Clean Water Program WSU Clark County Extension
Transcript of Small Acreage Landholder Outreach Program 2018 Annual Report

Small Acreage Landholder Outreach Program 2018 Annual Report
Submitted to Clark County Public Works, Clean Water Program
Submitted by WSU Clark County Extension
Douglas M. Stienbarger, Project Director
Department of Public Works Clean Water Program
WSU Clark County Extension

Small Acreage Program – 2018 Annual Report
Page | 2 of 31
Executive Summary The Program served 936 people (Table 1). The 222 participants who did not attend the Expo or the Harvest Celebration owned 1,068 acres. Almost all respondents agreed they would use what they learned to change their land management practices.
Task 1 - Best Management Practices (BMPs) Guidelines
Task 1a – Information Resources Throughout the year, the Coordinator adds announcements for all events and relevant materials where appropriate to the WSU Extension calendar (http://extension.wsu.edu/clark/calendar/); Small Acreage webpage (http://extension.wsu.edu/clark/naturalresources/smallacreageprogram/) and to the program Facebook page (http://www.facebook.com/smallacreageprogram). The program also tracks public use of the many resources available on our website to determine demand and ascertain use. This includes factsheets, video clips, announcements, and general program information (Table 2). For example, users visit the main page most often, where the program posts new classes and links to the different program areas. Traffic to the main program webpages remain about the same as in 2017, but while visits to the main page increased, those to the Living on the Land page were only half of 2017. The most downloaded factsheet continues to be Reduce Mud and Keep Water Clean: Sacrifice Areas while users also continue to view the Manure Management video clip the most often. Issues and Recommendations. Traffic to the program factsheets remains low, and it may not be possible to track the factsheet views. The Program will check with WSU IT to see why the analytics stopped tracking factsheets. Task 1b – Publications The Coordinator wrote an article for The Reflector to promote the Living on the Land (LOL) class series and the land stewardship principles it promotes. Published August 8, the article covers the major topic areas in the LOL classes: property inventory, soil, water, waste, grazing, and weeds. Secondarily and beyond the scope of work, The Reflector also published an article on the streamside planting workshop (Appendix A). Rainwater Harvesting Factsheet. Due to the departure of the Coordinator going half-time in mid-August and then leaving in late September, this factsheet is the main deliverable not met. The Director will write this in the first quarter of 2019.
Participants Acreage Owned
% Learning Something
Intend to Make Changes N (NR)
BMP Workshops 40 291 46%-96% 22 (18)Tours 28 117 66%-96% 20 (8)LOL 28 135 81%-98% 15 (7) averageSeptic/Well WS 126 525 94% 89 (37)Expo 109Harvest Celebration 605
936 1,068
Table 1: Summary Statistics for Events

Small Acreage Program – 2018 Annual Report
Page | 3 of 31
Issues and Recommendations. There are none at this time. One factsheet remains to be written.
Task 2 - Public Education & Outreach Task 2a – Establishing a Wider Mailing List The program sent 425 postcards (example in Appendix A) to small acreage homeowners within the Whipple Creek Watershed in early April to advertise several upcoming events including the Small Acreage Expo, a horse property tour, a Well & Septic Inspection class, and the Manure Composting & Management class. The program sent an additional 765 postcards in late summer to promote the Living on the Land series, a pasture management class, the last Well & Septic Inspection class, and a Riparian Restoration class. The response has been modest so far, but this remains one way to target watersheds. Issues and Recommendations. There are none at this time. Task 2b – Living on the Land: Stewardship for Small Acreages The Living on the Land class series ran 12 Wednesdays, from August 29 to November 14. The Coordinator promoted the LOL series at all events. While the 30 participants from 24 households enrolled, two spouses did not come to many classes. The LOL class series graduated 28 people in 24 households. The syllabus remains similar to past years with the exception of a couple of different speakers and a half evening class on agroforestry.
Table 2: Small Acreage Webpage Activity Highlights Factsheets Qtr 1 Qtr 2 Qtr 3 Qtr 4 YTD
Reduce Mud and Keep Water Clean: Sacrifice Areas 62 25 87 Save Time and Money - Properly Landscape Your Septic System 4 2 6 Don’t Let Your Dollar$ Go Down the Drain! Septic Tank Additives 20 11 31 How Green is Your Grass? Five Steps to Better Pasture & Grazing Mgmt. 3 22 25 Do You Qualify For Reduced Property Taxes? Current Use Taxation 2 2
Total 53 39 Video Clips
Manure Management 1036 1106 982 391 3515 Five Quick Steps to Reduce Mud 275 165 101 18 559 Reducing Mud on Small Acreages 37 18 0 2 57 Five Ways to Protect Riparian Areas 57 114 23 43 237 Livestock Exclusion and Off Channel Watering 12 6 13 95 126 Managing Manure 7 15 4 0 26 Doing Our Part for Clean Water 3 5 0 3 11
Total Views 1424 1424 1123 552 4531 Website Visitors
Small Acreage Web Page 726 783 1403 2912 BMP Video Web Page / Publications and Videos Page 22 34 7 63 Living On the Land Web Page 71 90 85 246
Total Visitors 219 907 1495 0 3221

Small Acreage Program – 2018 Annual Report
Page | 4 of 31
While a quarter of graduates (28%) heard about the LOL class through email, almost the same number heard through online promotion, primarily Facebook. Sixteen percent heard through events as they did through other organizations, word of mouth, or directories (Table 3). This data can be somewhat misleading since some participants heard about the course in multiple ways.
Table 3: How Participants Learned About the LOL Class Source Responses* (NR)
Small Acreage Events 4 E-mails (office listservs, local partner newsletters) 7 Media (Small Acreage Facebook / Extension Website) 6 Flyers (feed stores, veterinarians, and libraries) Newspaper PR / Ads (The Reflector, Post-Record, The Columbian, and FYI) 1
Word of mouth 2 Small Acreage Postcard Other 4
Total 24 (5) * = includes multiple responses
Of the 28 graduates, 21 (75%) attended at least three-quarters of the 12 class sessions, while three attended every session (Table 4). Except for two classes held at CASEE, all classes were held at the 78th Street Heritage Farm. Of the 24 households in the class, 22 came from Clark County and two from Oregon (Table 5). Compared to previous years, few came from central Clark County, while the most in any previous class came from south Clark County, with a little fewer coming from northern parts of the county.
Table 4: LOL Attendance
Classes Attended
# Graduates
As % of Graduate
s 12 3 11% 11 6 21% 10 8 29% 9 4 14% 8 1 4% 7 4 14% 6 2 7% Total 28 100%
Table 5: Geographic Distribution of Graduates
Location 2003-2017 2018 City
Totals
North
Amboy 30 30 La Center 82 1 83 Ridgefield 103 8 111 Yacolt 76 1 77 Woodland (Clark Co.) 40 40
Subtotal 331 10 341
Cent
ral Battle Ground 270 2 272
Brush Prairie 127 127 Subtotal 397 2 399
Sout
h
Camas 144 144 Vancouver 89 12 101 Washougal 94 2 96
Subtotal 327 14 341 Out of County 34 2 36
Totals 1089 28 1117

Small Acreage Program – 2018 Annual Report
Page | 5 of 31
Participants owned at least 135 acres, with the average 7.1 acres well below the overall average of 10.5 since 2003 (Table 6). As usual, most parcels clustered in the 5 acres or less range. Eight keep livestock, primarily poultry, horses, sheep and goats in descending order (Table 7). Compared to past classes, fewer graduates own livestock, and those who do, own fewer livestock.
Knowledge Increases. Participants were also asked to rate their knowledge on each topic before and after the workshop using a scale of one to five: a response of one equals poor, two fair, three average, four good and five excellent. Across all class topics, at least 81% (81%-98%) learned some knowledge (Table 8). At least 53% (53%-78%) of respondents learned a moderate amount to a lot about 10 of the 14 major topic areas. When asked what management practice they might implement with a year, participants indicated they would improve pasture management, better weed control, manage riparian area, get soil tested, and better manager soils. Overall, respondents rated the entire class very well (4.6 on 5 point scale) and thought it very likely they would use the information they learned to change practices on their properties.
Table 7: Number of Livestock Owned*
Livestock 2003 - 2017 2018 Total
Poultry 2631 31 2662 Alpacas 305 305 Cattle 307 3 310 Horse / Donkey 285 8 293
Goats/ Sheep 493 9 502 Swine 135 135 Llama 58 58 Rabbits 461 461 Ostrich/ Emu 6 6
Total 4681 51 4732 * Understates total since not all participants listed livestock.
Table 6: Graduate Property Characteristics **
2003 - 2017 2018 Total
# Graduates 470 28 498 # Properties 342 24 366
Ac Owned
Total Acreage 3685 135 3820
Avg Ac/ Property 10.5 7.1 10.3
Smallest 0.1 0 0 Largest 80.2 40 82 < = 5 ac 154 12 166 >5 - 10 94 4 98 >10 - 20 43 2 45 > 20 ac 41 1 42
Yrs On Land
Average 7 NA 7 Least 0 NA Most 66 NA
Land with:
Septic System 304 16 320
Well 257 13 270 ** Not all graduates completed survey or provided all information. Excludes acreage outside Clark County.

Small Acreage Program – 2018 Annual Report
Page | 6 of 31
Issues and Recommendations. There are no issues for 2018, although with the retirement of our pasture speaker from OSU, the Program will need to arrange a replacement in 2019. Task 2c – Well and Septic Maintenance Workshops During the four Well & Septic workshops, the Coordinator (or Director) opened the workshop with a summary of best practices impacting water quality, followed by Sean Hawes, Clark County Public Health, discussing septic system inspection and maintenance. Lastly, another member of Public Health presents on maintaining the potable wells. Participants paid $15 to attend the workshops. Of the 126 participants who attended the workshop, not quite half of respondents learned about the program through Public Health’s inspection notification, followed by newspapers ads and press
Table 8: LOL Participant Change in Knowledge Levels
LOL Class Knowledge Area Before and After Class Knowledge Change
(As percent of respondents averaged) Same 1 2 3 4 N (NR)*
Inventory 1 Four topic areas: Goal setting, neighbors, identifying property assets and problems, holistic framework 18% 51% 25% 6% 0% 21 (5)
Inventory 2 Four topic areas: photo documentation, identifying limitations on property goals, Clark County Codes, permits
16% 24% 38% 19% 4% 20 (4)
Soils II Four topic areas: major nutrients for plant/soil health, soil chemistry, understanding soil tests, soil surveys 5% 24% 24% 35% 12% 22 (5)
Well & Septic See section on well and septic, not separated out
Soils I Four topic areas: soil structure, type & texture, erosion, amendments, properly testing soil 11% 21% 33% 28% 7% 17 (5)
Pasture Four topic areas: renovating/reseeding pasture, grass/legume species, grass life cycle, Grazing management
8% 16% 28% 30% 18% 19 (3)
Watershed Pollution & C.C. Codes
Four topic areas: the Clean Water Program, best practices to control SW, SW permit application process 9% 13% 24% 49% 4% 15 (5)
Weeds Four topic areas: weed management plan, life cycles of weeds, identifying and controlling weeds 5% 48% 30% 16% 2% 11 (13)
Managing Animals
Four topic areas: BMPs for managing mud and manure, managing runoff, animal impacts 10% 36% 43% 12% 0% 14 (6)
Three topic areas: Feed and forage needs, evaluating hay quality, , body condition scoring 11% 15% 26% 33% 15% 9 (7)
Wildlife & Streams
Three topic areas: creating wildlife habitat, discourage unwanted wildlife, healthy/unhealthy streams 17% 25% 29% 29% 0% 8 (8)
Place on a Stream
Four topic areas: riparian, healthy/unhealthy streams, improving stream health 6% 27% 42% 15% 10% 12 (8)
Agroforestry Four topic areas: definition, species interaction, common systems, forest health for traditional forest management
2% 26% 22% 43% 6% 12 (9)
Business Seven topic areas: starting a business, business planning, resources, direct marketing, assessing markets, value added
16% 31% 40% 10% 3% 11 (10)
Stewardship Four topic areas: stewardship and sustainability, holistic goals, Developing actions, assessing progress 19% 46% 29% 0% 6% 13 (10)

Small Acreage Program – 2018 Annual Report
Page | 7 of 31
releases, Facebook and the Extension website, and the postcard mailed out by the program (Table 9). When Public Health mails out notifications, there is an increase in sign-ups from this sources.
When asked about their intent to use the information they learned, 100% of respondents indicated they would. Participants own 525 acres (Table 10).
Participants evaluate their knowledge about selected topics before and after attending the workshop. Evaluation results show that at least 87% (87%-97%) of respondents increased their knowledge on well and septic system maintenance and health (Table 11). On average, 68% of respondents from the four classes learned a moderate amount to a lot about the three topics under well and septic maintenance, and septic inspection. Fully 75% on average Learned something about how management practices impacted clean water.
Table 9: Responses to Promotion How Participants Heard of Events Responses (NR)
Program workshops \ events 3 E-mails (office listservs, local partner newsletters) 3 Media (Small Acreage Facebook / Extension Website), 9 Flyers (feed stores, veterinarians, and libraries) Newspaper PR / Ads (The Reflector, Post-Record, The Columbian, and FYI) 13 Word of mouth 9 Small Acreage Postcard 6 Septic Inspection Notification 36 Other 4
Total 83 (19)
Table 10: Well & Septic Workshops Date Participants Intend to Use Information
%Yes N (NR) Acreage Owned
Workshop Location
February 22 28 100% 19 (9) 161 CASEE, Brush Prairie May 9 29 100% 22 (7) 173 CASEE, Brush Prairie July 31 33 100% 22 (11) 106 CASEE, Brush Prairie October 3 36 100% 26 (10) 85 * Luke Jensen Room
Totals 126 525 * = Does not include acreage of LOL class participants.

Small Acreage Program – 2018 Annual Report
Page | 8 of 31
Issues and Recommendations. Public Health requested separating out the workshop in the fall for the LOL class and holding an extra class for the public. After talking with Public Works, this was added to the 2019 scope of work. Task 2d – Best Management Practices Workshops The Program held three workshops: Manure Composting and Management, Pasture Management, and Streamside Planting with Native Plants. Forty people signed up for the three workshops. Sixty-three percent heard about the workshops through emails and online (website and Facebook) (Table 12).
The manure workshop attracted 16 participants, the majority of which own horses. The Director presented and covered how to compost manure and the impacts of poor manure management on water quality. Participants ranked all three workshops above 4.3 out of 5 (Table 13).
Table 11: Well and Septic Workshop Knowledge Level Change
Workshop Knowledge Area Before and After Workshop Knowledge Level
Change (as percent of responses) Same 1 2 3 4 N (NR)*
Feb 22 Knowledge of three topic areas ** 6% 27% 45% 9% 13% 18 (10) How my management practices impact clean water 33% 33% 22% 0% 11% 18 (10)
May 9 Knowledge of three topic areas ** 5% 24% 41% 19% 13% 20 (9) How my management practices impact clean water 23% 27% 23% 23% 5% 22 (7)
July 31 Knowledge of three topic areas ** 13% 36% 24% 17% 10% 18 (12) How my management practices impact clean water 26% 42% 21% 11% 0% 19 (14)
October 3 Knowledge of three topic areas ** 3% 18% 37% 27% 14% 23 (13) How my management practices impact clean water 18% 23% 36% 18% 5% 22 (14)
All Classes Knowledge of three topic areas ** 6% 26% 37% 19% 12% 77 (49) How my management practices impact clean water ** 25% 32% 25% 14% 5% 81 (45)
*N = number of responses; NR = no response; ** = Averaged
Table 12: Responses to Promotion How Participants Heard of Events Responses (NR)
Program workshops 7 E-mails (office listservs, local partner newsletters) 15 Media (Small Acreage Facebook / Extension Website), 10 Flyers (feed stores, veterinarians, and libraries) Newspaper PR / Ads (The Reflector, Post-Record, The Columbian, and FYI) 4 Word of mouth Small Acreage Postcard Other 3
Total 39 (1)

Small Acreage Program – 2018 Annual Report
Page | 9 of 31
When asked about what they learned, at least 67% (67%-96%) of respondents showed various increases in understanding the topic in all three workshops (Table 14), while 44%-87% gained a moderate to a lot of knowledge. At least 46% (46%-67%) learned how their practices can affect clean water.
The Program promoted workshops through press releases to local newspapers, Facebook posts and advertisements, website content, and listserv emails, among other means. The Program continues to revise a speaker’s list for events and rank speakers. Issues and Recommendations. There are none at this time. Task 2e – Outreach Events and Promotional Activities Small Acreage Exposition. The thirteenth annual Small Acreage Expo took place on Saturday, April 14th at the 78th Street Heritage Farm. Speakers presented on eleven session topics (Table 15). Two sessions, Equine Health Related to Best Practices and Transforming Irrigation Efficiency, were cancelled due to low registration. Participants selected from several concurrent classes during each session. The program charged $15 for pre-registration (includes lunch) and $25 for walk-ins. Pre-registration included lunch
Table 13: BMP Workshops
Date Topic Participants
Intend to Use
Information %Yes N (NR)
Acreage Owned
Overall Rating Workshop Location
May 17 Manure 16 100% 13 (3) 91 4.4 Public Safety Complex - Ridgefield
September 20 Pasture 11 100% 6 (5) 161* 4.7 Luke Jensen
October 13 Riparian Planting 13 100% 3 (10) 39 4.3 La Center Middle
School Totals 40 291
* = Does not include acreage of LOL class participants.
Table 14: Manure Knowledge Level Change
Workshop Knowledge Area Before and After Workshop Knowledge Level
Change (as percent of responses) Same 1 2 3 4 N (NR)*
May 17
Three topic areas covering Manure management and composting 33% 23% 41% 3% 0% 13 (3)
How my management practices impact clean water 54% 15% 8% 15% 8% 13 (3)
September 20
Four topic areas covering pasture and grazing management 4% 8% 54% 33% 0% 6 (5)
How my management practices impact clean water NA
October 13
Three topic areas covering use of native plants for streamside planting 25% 17% 33% 25% 0% 3 (10)
How my management practices impact clean water 33% 0% 67% 0% 0% 3 (10)

Small Acreage Program – 2018 Annual Report
Page | 10 of 31
from a local caterer. The Coordinator arranged an open house for eight organizations to set up booths to provide informational materials.
Table 15: Small Acreage Expo Topics
Session A 9:00-10:15
Managing Grazing for Sustainable Pastures Gary Fredricks Native Plants Landscaping Brad Meade Weed' Em and Reap Kara Hauge
Session B 10:30-11:45
Septic Inspection Sean Hawes Woodland Management Matt Provencher Gearing Up for Goats Amy Gustin Lunch 11:45-12:45 - Lunch, Vendors, Open House
Session C 12:45-2:00
Composting Pete Dubois Pond Care 101 Fenwick, Doug Maintaining a Healthy Well Brigette Bashaw
Session D 2:15-3:30
Sustainable Living for Small Farms Eric Lambert Drainage Solutions Q&A Seth Kenworthy
One hundred and six people attended the Expo, a similar level of attendance as last year’s event which attracted 109 attendees. Fifty-eight participants submitted evaluations for the event as a whole, a return rate of 55%. Door prize tickets were offered in exchange for completing evaluations, an effort to encourage a higher return rate. Donations for door prizes were made by Columbia River Carbonates, Wilco, Backyard Bird Shop and the Master Gardener Foundation, a value of $520. The Coordinator promoted the Expo widely, through Facebook and newspaper advertisements (Appendix A), listserv emails, a promotional postcard (developed under Task 2e), at Small Acreage events and other means (Table 16). Facebook was the most successful means for promoting the Expo, attracting 20 participants. Word of mouth and email are the second and third most effective means, attracting 16 and 14 participants, respectively.
Table 16: Responses to Expo Promotion
How Participants Heard of Events Responses %
Responses (NR)
Program workshops 0% 0 E-mails (office listservs, local partner newsletters) 20% 14 Media (Small Acreage Facebook / Extension Website), 29% 20 Flyers (feed stores, veterinarians, and libraries) 0% 0 Newspaper PR / Ads (The Reflector, Post-Record, The Columbian, and FYI) 12% 8 Word of mouth 23% 16 Small Acreage Postcard 16% 11 Other
Total 100% 69 (37) Respondents rated the overall event 4.5 on a scale of one to five, five being highest. Nearly all respondents (98%) indicated they learned something new and intend to use the information learned to change what they do at home (Table 17).

Small Acreage Program – 2018 Annual Report
Page | 11 of 31
Individual Expo Sessions Participants assessed their learning for all of the individual sessions and indicated whether the information they learned would be used to change their practices at home. At least 84% of respondents increased their knowledge somewhat across all topics (Table 18).
Table 17: Overall Event Program Evaluation
Average N (NR)* What overall score would you give this event? 4.5 55 (51) Do you intend to use this information to change what you do? 98% Yes 55 (51) *N = number of responses; NR = no response
Table 18: Small Acreage Expo Participant Change in Knowledge Levels
Expo Session Knowledge Area
Before and After Class Knowledge Change (As percent of respondents)
Same 1 2 3 4 N (NR)
Managing Grazing/
Sustainable Pastures
Practices to improve pasture health 12% 21% 43% 15% 9% 29 (7)
Will use information to change practices at home? 90% Yes 10% No 28 (8)
Native Plant Landscaping
Native plants benefits and uses in the landscape 16% 26% 25% 28% 5% 30 (3) Will use information to change practices at home? 100% Yes 0% No 33 (0)
Weed ID and Control
Weed ID and eradication 7% 11% 55% 16% 11% 11 (5) Will use information to change practices at home? 93% Yes 7% No 21 (4)
Sustainable Timber Harvest
Best practices for timber harvest and water health 10% 35% 13% 24% 17% 10 (7)
Will use information to change practices at home? 40% Yes 60% No 10 (7)
Gearing Up for Goats
Selecting goats and managing their impacts 5% 17% 30% 37% 11% 28 (5) Will use information to change practices at home? 85% Yes 15% No 26 (7)
Septic Inspection
Certification
Properly inspecting your septic system 11% 21% 25% 20% 25% 31 (3)
Will use information to change practices at home? 88% Yes 12% No 32 (2)
Composting How to set up and maintain a compost system 9% 20% 21% 26% 24% 28 (4) Will use information to change practices at home? 97% Yes 4% No 30 (2)
Pond Care 101
Best practices for proper pond maintenance 3% 18% 39% 18% 18% 11 (5) Will use information to change practices at home? 70% Yes 30% No 10 (6)
Keeping Your Well Water
Healthy
Properly testing and maintaining your well 11% 18% 38% 20% 13% 15 (5) Will use information to change practices at home? 87% Yes 14% No 30 (2)
Drainage Solutions
Q&A
Managing runoff, water harvesting, and drainage solutions 9% 18% 36% 22% 15% 25 (5) Will use information to change practices at home? 77% Yes 23% No 22 (8)
Sustainable Living for
Small Farms
BMPs, social considerations and resources for land management 11% 17% 42% 26% 4% 27 (12) Will use information to change practices at home? 88% Yes 12% No 24 (15)
N = number of respondents; NR = estimate of non-respondents, based on registration for each session. Due to the open nature of the event, participants attend classes other than what they registered for.
Small Acreage Program – 2018 Annual Report
Page | 12 of 31
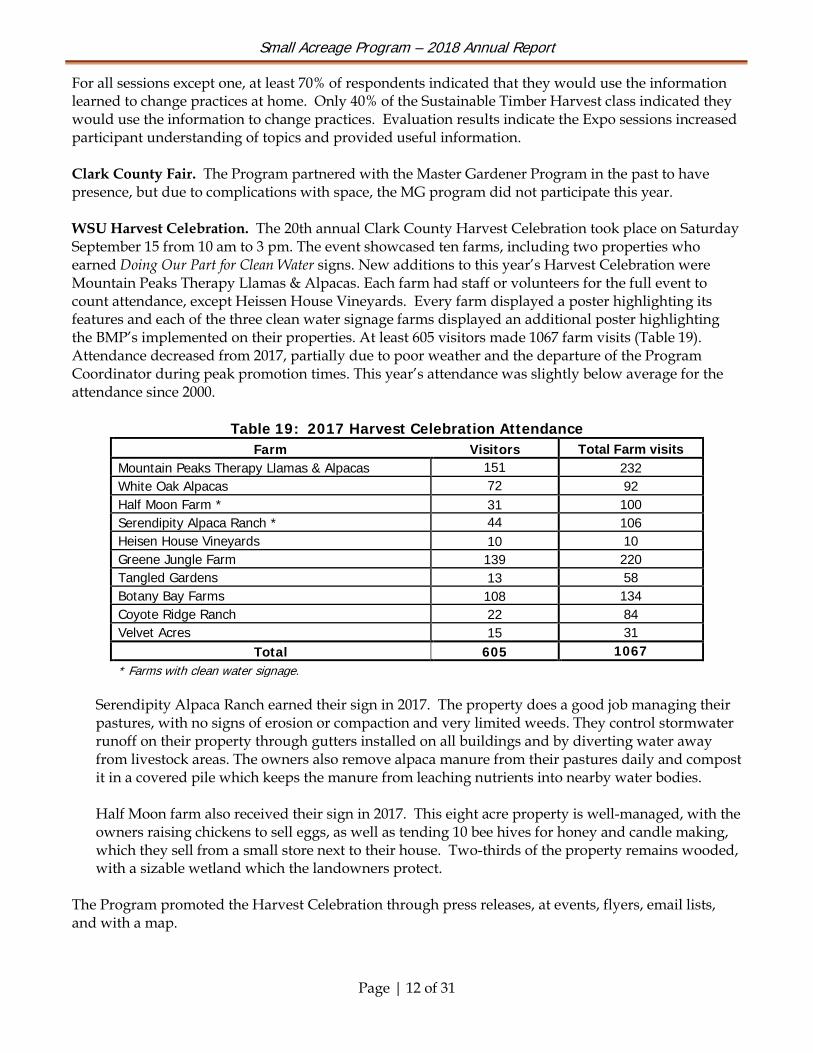
For all sessions except one, at least 70% of respondents indicated that they would use the information learned to change practices at home. Only 40% of the Sustainable Timber Harvest class indicated they would use the information to change practices. Evaluation results indicate the Expo sessions increased participant understanding of topics and provided useful information. Clark County Fair. The Program partnered with the Master Gardener Program in the past to have presence, but due to complications with space, the MG program did not participate this year. WSU Harvest Celebration. The 20th annual Clark County Harvest Celebration took place on Saturday September 15 from 10 am to 3 pm. The event showcased ten farms, including two properties who earned Doing Our Part for Clean Water signs. New additions to this year’s Harvest Celebration were Mountain Peaks Therapy Llamas & Alpacas. Each farm had staff or volunteers for the full event to count attendance, except Heissen House Vineyards. Every farm displayed a poster highlighting its features and each of the three clean water signage farms displayed an additional poster highlighting the BMP’s implemented on their properties. At least 605 visitors made 1067 farm visits (Table 19). Attendance decreased from 2017, partially due to poor weather and the departure of the Program Coordinator during peak promotion times. This year’s attendance was slightly below average for the attendance since 2000.
Table 19: 2017 Harvest Celebration Attendance Farm Visitors Total Farm visits
Mountain Peaks Therapy Llamas & Alpacas 151 232 White Oak Alpacas 72 92 Half Moon Farm * 31 100 Serendipity Alpaca Ranch * 44 106 Heisen House Vineyards 10 10 Greene Jungle Farm 139 220 Tangled Gardens 13 58 Botany Bay Farms 108 134 Coyote Ridge Ranch 22 84 Velvet Acres 15 31
Total 605 1067 * Farms with clean water signage.
Serendipity Alpaca Ranch earned their sign in 2017. The property does a good job managing their pastures, with no signs of erosion or compaction and very limited weeds. They control stormwater runoff on their property through gutters installed on all buildings and by diverting water away from livestock areas. The owners also remove alpaca manure from their pastures daily and compost it in a covered pile which keeps the manure from leaching nutrients into nearby water bodies.
Half Moon farm also received their sign in 2017. This eight acre property is well-managed, with the owners raising chickens to sell eggs, as well as tending 10 bee hives for honey and candle making, which they sell from a small store next to their house. Two-thirds of the property remains wooded, with a sizable wetland which the landowners protect.
The Program promoted the Harvest Celebration through press releases, at events, flyers, email lists, and with a map.

Small Acreage Program – 2018 Annual Report
Page | 13 of 31
Veterinarian outreach. The program sends flyers to local veterinarians about animal related events. Low impact development. There were no specifically LID events, although the Program does promote materials on LID practices. Equine Community. The Program did two promotional talks to equine organizations: the first in early June to the Clark County Executive Horse Council (CCEHC) and the second November 12th to the Back Country Horsemen (BCH). These short promotions talked about events during the year that might interest horse groups. Since the Director belongs to two local groups, WTRA and BCH, more of the Program’s email promotions have been forwarded to membership. Issues and Recommendations. There are none at this time.
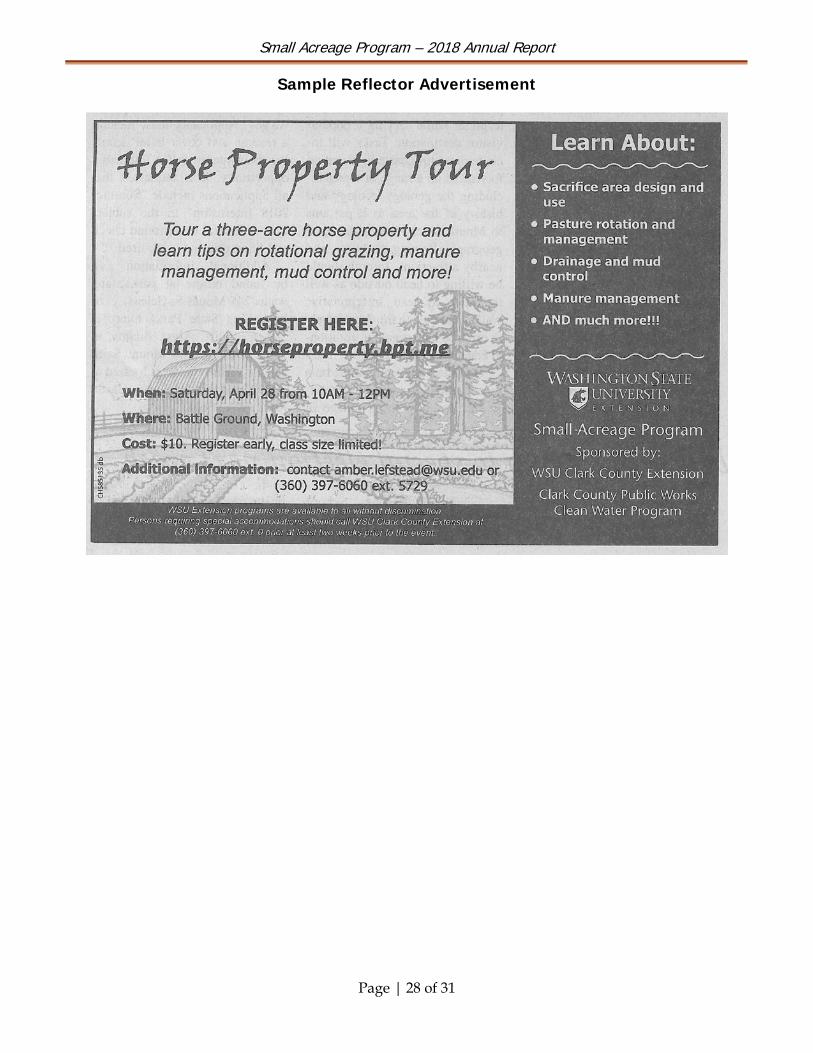
Task 3 - Model Small Acreage Properties Task 3a – Property Tours The first property tour occurred in April 28 at a 3-acre horse property in Battle Ground. The tour demonstrated rotational grazing, use of a sacrifice area, sustainable manure management and onsite stormwater management, among other topics. Sixteen participants attended the Vossenberg tour of a commercial stable and training center. Most people heard about the tours through program workshops, followed by email promotions (Table 20).
All respondents indicated they intended to use the information to change their practices (Table 21) and ranked the workshops at least 4.4 on a five-point scale. Collectively, the 28 participants owned 117 acres.
When assessing knowledge gained, 90%-96% of respondents learned at least something on all topics in the two tours, while 90% gained a moderate to a lot of knowledge on topics during the Vossenberg
Table 20: Responses to Tour Promotion How Participants Heard of Events Responses (NR)
Program workshops 11 E-mails (office listservs, local partner newsletters) 7 Media (Small Acreage Facebook, Extension Website), 1 Flyers (feed stores, veterinarians, and libraries) Newspaper PR / Ads (The Reflector, Post-Record, The Columbian, and FYI) 2 Word of mouth Small Acreage Postcard Other 3
Total 24 (4)
Table 21: Property Tours
Date Participants Intend to Use Information %Yes N (NR)
Acreage Owned
Overall Rating
Workshop Location
April 28 12 100% 8 (4) 62 4.4 BG Horse Farm November 10 16 100% 12 (4) 55 4.8 Vossenberg Farm
Totals 28 117

Small Acreage Program – 2018 Annual Report
Page | 14 of 31
farm tour (Table 22). Over 67% of respondents from the two tours increased their understanding of how their practices impact water quality.
Issues and Recommendations. There are none at this time. Task 3b – Landowner Recognition Six property assessments took place: two in Lacamas Cr. watershed, two in the East Fork Lewis River watershed, and one each in Whipple Creek and Salmon Creek watersheds. Two Clean Water signs were awarded, one for a property in the East Fork Lewis (5 acres) and another in the eastern part of Salmon Creek (5 acres). One property in Whipple Creek only needs a downspout to qualify. Issues and Recommendations. There are none at this time.
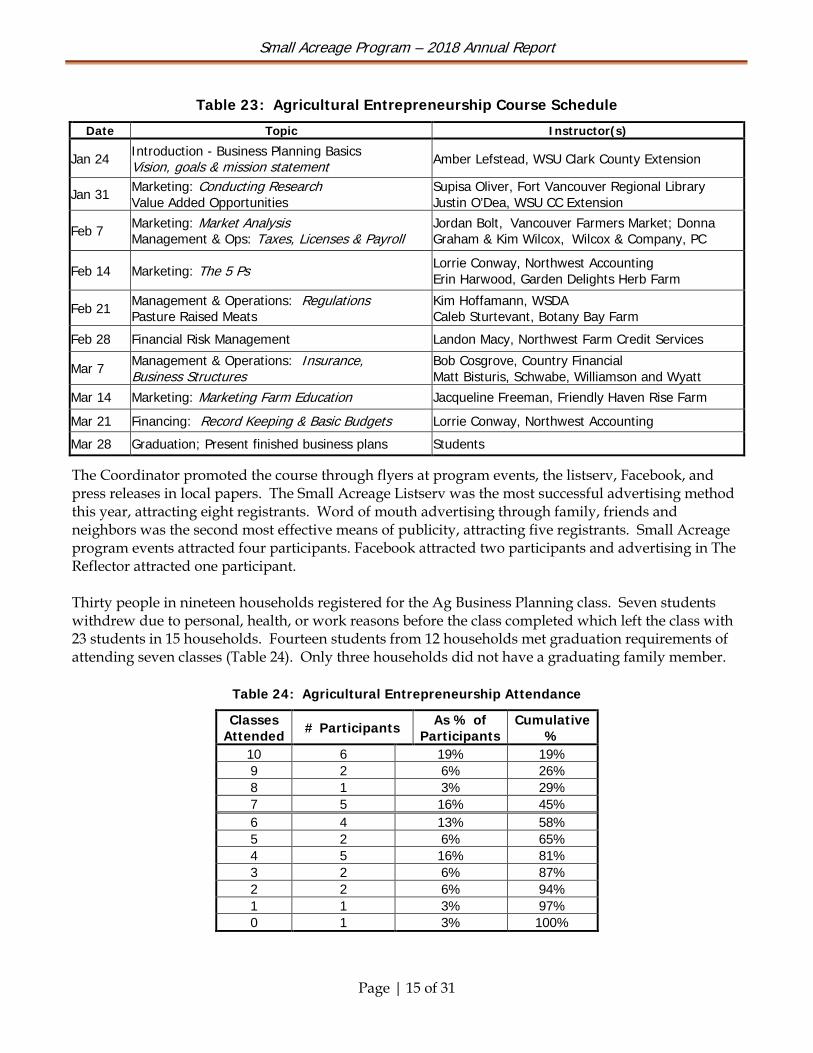
Task 4 - Small Farms Task 4a – Agricultural Entrepreneurship and Business Planning The Program organized its eleventh Agricultural Entrepreneurship and Business Planning class series where participants learn about business planning, marketing methods and opportunities, and how to develop or expand a small farm business. They produce a completed business plan by the last class and present their business plan to the class on the final evening. Farmers and various small business specialists serve as guest speakers, bringing valuable practical experience to the class. The ten-week class series ran from January 24 through March 28. The schedule included some new topics including a session on Value Added Opportunities given by WSU Extension’s new agricultural faculty, Justin O’Dea; and a financial assessment class taught by Landon Macy from Northwest Farm Credit Services (Table 23). The program charged $100 per farm or family, which included a class notebook with syllabus, schedule, and activity worksheets. Before registering, the Coordinator spoke with participants about their intentions and what they hope to get out of the class in an effort to make sure the course and candidates were suitable and understood class expectations. Once accepted, candidates filled out a pre-survey using Qualtrics and then received a link to register on Brown Paper Tickets.
Table 22: Tours Knowledge Level Change
Tour Knowledge Area Before and After Tour Knowledge Level Change
(as percent of responses) Same 1 2 3 4 N (NR)*
Horse Farm
Three topic areas covering pasture mgmt., manure mgmt., managing runoff
4% 63% 21% 13% 0% 8 (4)
How my management practices impact clean water 25% 75% 0% 0% 0% 8 (4)
Vossenberg Stables
Three topic areas covering use of native plants for streamside planting 10% 43% 33% 13% 0% 10 (6)
How my management practices impact clean water 33% 0% 33% 22% 11% 9 (7)
Small Acreage Program – 2018 Annual Report
Page | 15 of 31
The Coordinator promoted the course through flyers at program events, the listserv, Facebook, and press releases in local papers. The Small Acreage Listserv was the most successful advertising method this year, attracting eight registrants. Word of mouth advertising through family, friends and neighbors was the second most effective means of publicity, attracting five registrants. Small Acreage program events attracted four participants. Facebook attracted two participants and advertising in The Reflector attracted one participant. Thirty people in nineteen households registered for the Ag Business Planning class. Seven students withdrew due to personal, health, or work reasons before the class completed which left the class with 23 students in 15 households. Fourteen students from 12 households met graduation requirements of attending seven classes (Table 24). Only three households did not have a graduating family member.
Table 23: Agricultural Entrepreneurship Course Schedule Date Topic Instructor(s)
Jan 24 Introduction - Business Planning Basics Vision, goals & mission statement Amber Lefstead, WSU Clark County Extension
Jan 31 Marketing: Conducting Research Value Added Opportunities
Supisa Oliver, Fort Vancouver Regional Library Justin O’Dea, WSU CC Extension
Feb 7 Marketing: Market Analysis Management & Ops: Taxes, Licenses & Payroll
Jordan Bolt, Vancouver Farmers Market; Donna Graham & Kim Wilcox, Wilcox & Company, PC
Feb 14 Marketing: The 5 Ps Lorrie Conway, Northwest Accounting Erin Harwood, Garden Delights Herb Farm
Feb 21 Management & Operations: Regulations Pasture Raised Meats
Kim Hoffamann, WSDA Caleb Sturtevant, Botany Bay Farm
Feb 28 Financial Risk Management Landon Macy, Northwest Farm Credit Services
Mar 7 Management & Operations: Insurance, Business Structures
Bob Cosgrove, Country Financial Matt Bisturis, Schwabe, Williamson and Wyatt
Mar 14 Marketing: Marketing Farm Education Jacqueline Freeman, Friendly Haven Rise Farm Mar 21 Financing: Record Keeping & Basic Budgets Lorrie Conway, Northwest Accounting Mar 28 Graduation; Present finished business plans Students
Table 24: Agricultural Entrepreneurship Attendance
Classes Attended # Participants As % of
Participants Cumulative
% 10 6 19% 19% 9 2 6% 26% 8 1 3% 29% 7 5 16% 45% 6 4 13% 58% 5 2 6% 65% 4 5 16% 81% 3 2 6% 87% 2 2 6% 94% 1 1 3% 97% 0 1 3% 100%
Small Acreage Program – 2018 Annual Report
Page | 16 of 31
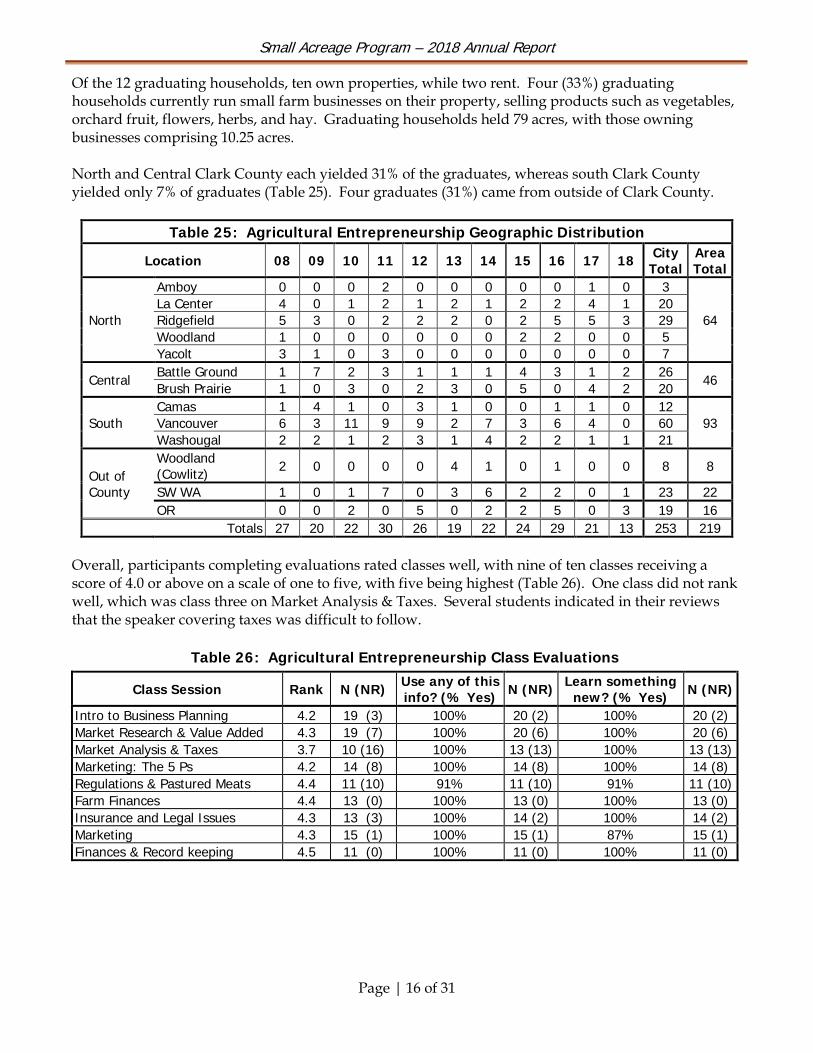
Of the 12 graduating households, ten own properties, while two rent. Four (33%) graduating households currently run small farm businesses on their property, selling products such as vegetables, orchard fruit, flowers, herbs, and hay. Graduating households held 79 acres, with those owning businesses comprising 10.25 acres. North and Central Clark County each yielded 31% of the graduates, whereas south Clark County yielded only 7% of graduates (Table 25). Four graduates (31%) came from outside of Clark County.
Table 25: Agricultural Entrepreneurship Geographic Distribution
Location 08 09 10 11 12 13 14 15 16 17 18 City Total
Area Total
North
Amboy 0 0 0 2 0 0 0 0 0 1 0 3
64 La Center 4 0 1 2 1 2 1 2 2 4 1 20 Ridgefield 5 3 0 2 2 2 0 2 5 5 3 29 Woodland 1 0 0 0 0 0 0 2 2 0 0 5 Yacolt 3 1 0 3 0 0 0 0 0 0 0 7
Central Battle Ground 1 7 2 3 1 1 1 4 3 1 2 26 46 Brush Prairie 1 0 3 0 2 3 0 5 0 4 2 20
South Camas 1 4 1 0 3 1 0 0 1 1 0 12
93 Vancouver 6 3 11 9 9 2 7 3 6 4 0 60 Washougal 2 2 1 2 3 1 4 2 2 1 1 21
Out of County
Woodland (Cowlitz) 2 0 0 0 0 4 1 0 1 0 0 8 8
SW WA 1 0 1 7 0 3 6 2 2 0 1 23 22 OR 0 0 2 0 5 0 2 2 5 0 3 19 16
Totals 27 20 22 30 26 19 22 24 29 21 13 253 219 Overall, participants completing evaluations rated classes well, with nine of ten classes receiving a score of 4.0 or above on a scale of one to five, with five being highest (Table 26). One class did not rank well, which was class three on Market Analysis & Taxes. Several students indicated in their reviews that the speaker covering taxes was difficult to follow.
Table 26: Agricultural Entrepreneurship Class Evaluations
Class Session Rank N (NR) Use any of this info? (% Yes) N (NR) Learn something
new? (% Yes) N (NR)
Intro to Business Planning 4.2 19 (3) 100% 20 (2) 100% 20 (2) Market Research & Value Added 4.3 19 (7) 100% 20 (6) 100% 20 (6) Market Analysis & Taxes 3.7 10 (16) 100% 13 (13) 100% 13 (13) Marketing: The 5 Ps 4.2 14 (8) 100% 14 (8) 100% 14 (8) Regulations & Pastured Meats 4.4 11 (10) 91% 11 (10) 91% 11 (10) Farm Finances 4.4 13 (0) 100% 13 (0) 100% 13 (0) Insurance and Legal Issues 4.3 13 (3) 100% 14 (2) 100% 14 (2) Marketing 4.3 15 (1) 100% 15 (1) 87% 15 (1) Finances & Record keeping 4.5 11 (0) 100% 11 (0) 100% 11 (0)

Small Acreage Program – 2018 Annual Report
Page | 17 of 31
Participant comments indicate they learned valuable information for planning their business: “I learned so much & feel so much more empowered.” “This course was very well done & helpful.” “The information that I learned from class presentations and materials was valuable and the info I learned from other farmers in class was fantastic.”
Participants assessed their knowledge before and after each class. The number of evaluations fluctuates each week due to some participants being in a hurry when classes ran late. The Coordinator encourages students to submit their evaluations immediately after the class session, but also accepts any evaluation throughout the course, and provides reminders at the end of each class to submit any evaluations. Sixty-four to 100% of respondents increased their knowledge by at least one level on all topics during the course (Table 27). Respondents gained the most knowledge about market research, with 90% of respondents increasing their knowledge two or more levels. One-hundred percent of respondents increased their knowledge on all topics pertaining to farm insurance and legal issues. These large increases in knowledge for market research, insurance and legal issues indicate these areas as ones where attendees had limited knowledge to begin with or were especially information-rich presentations.
Table 27: Agricultural Entrepreneurship Knowledge Change Evaluation Summary
Class Session Knowledge Area
Before and After Knowledge Change (As percent of respondents+)
Same 1 2 3 4 N (NR)
Intro to Business Planning
Components of a business plan 10% 48% 19% 24% 0% 21 (1) How to develop your business' mission statement 5% 19% 43% 29% 5% 21 (1) How to develop goals and objectives 14% 43% 33% 10% 0% 21 (1) Taking a farm resource inventory 10% 24% 38% 24% 5% 21 (1)
Market Research &
Value Added
Pertinent resources to find industry information 5% 40% 5% 40% 10% 20 (7) How to research consumers, target markets and competition 10% 0% 35% 45% 10% 20 (7)
What "value-added" is 5% 45% 30% 15% 5% 20 (7) Benefits of value-added approaches 15% 30% 35% 15% 5% 20 (7)
Market Analysis &
Taxes
Identifying your customer preferences, values, and demographics 8% 31% 46% 15% 0% 13 (13)
Evaluating your potential market 23% 23% 46% 8% 0% 13 (13) Tax considerations for business owners 15% 23% 46% 8% 8% 13 (13) Getting appropriate licenses for your farm business 25% 33% 17% 17% 8% 12 (14)
Marketing: The 5 Ps
How to reach customers with marketing tools 21% 29% 29% 21% 0% 14 (8) Direct marketing ideas (e.g. where you will sell) 29% 36% 36% 0% 0% 14 (8) Creating a pricing strategy for your products 36% 36% 29% 0% 0% 14 (8) Approaches to branding 21% 43% 29% 7% 0% 14 (8)
Regulations & Pastured
Meats
Where to find regulations that apply to your farm business 9% 18% 27% 27% 18% 11 (10)
Licensing requirements 9% 27% 27% 27% 9% 11 (10) Labeling requirements 27% 27% 18% 18% 9% 11 (10) Starting a small farm with pasture raised animals 0% 18% 36% 45% 0% 11 (10)

Small Acreage Program – 2018 Annual Report
Page | 18 of 31
Class Session Knowledge Area
Before and After Knowledge Change (As percent of respondents+)
Same 1 2 3 4 N (NR)
Farm Finances
Lending programs for beginning farmers 15% 8% 38% 31% 8% 13 (0) The 5 C's of credit-how lending decisions are made 23% 15% 23% 38% 0% 13 (0) How to create a balance sheet 0% 15% 38% 23% 23% 13 (0) How to create a cash flow budget 0% 15% 46% 23% 15% 13 (0)
Marketing Farm
Education
Marketing your farm 'know-how' and other assets 7% 27% 40% 27% 0% 15 (1) Developing multiple marketing channels 7% 27% 47% 20% 0% 15 (1) Ways to improve farm profitability 7% 40% 33% 13% 7% 15 (1)
Insurance and Legal
Issues
How insurance can help a small farm 0% 21% 50% 29% 0% 14 (2) Insurance options to manage risk for small farm and value added businesses 0% 29% 21% 50% 0% 14 (2)
Legal issues to consider when staring a business 0% 21% 64% 14% 0% 14 (2) Determining the structure appropriate for your farm business 0% 21% 71% 7% 0% 14 (2)
Finances & Record keeping
Different accounting system options & advantages & disadvantages of each 0% 27% 45% 27% 0% 11 (0)
Creating a basic budget 9% 45% 36% 9% 0% 11 (0) How to do effective record keeping 18% 27% 45% 9% 0% 11 (0) How to get info together for your accountant 27% 27% 27% 9% 9% 11 (0)
* N = number of respondents; NR = non-respondents. + May not equal 100% due to rounding Participants rated the entire class series very well, rating the series a 4.7 on a scale of one to five, five being highest (Table 28). All respondents thought the course series answered most of their questions and felt it provided information useful for their farm business. While most respondents felt the series length was just about right, some thought it too long.
Issues and Recommendations. The Agricultural Entrepreneurship & Business Planning course graduated 14 people, a lower number than the target of 20 graduates. Seven students withdrew; two for health reasons; three because they got too busy; and two because of work schedule changes. Of the 24 students remaining in the class, nine did not graduate. Of those nine, four were members of households with a partner who did graduate the class. Of the five students who remained in the class but did not graduate, all were new farmers who had yet to begin a business. The Coordinator believes that farmers who have yet to start their business are less invested in the class than farmers with businesses. In the future, the program may want to focus on letting in farmers with businesses over farmers without businesses if there is high demand for the class. Task 4b – Small Farms Workshops Women in Agriculture Conference – The WIA day-long conference webinar based conference had 31 locations in 4 western states (WA, OR, MT, AK). Nineteen women farmers participated in the
Table 28: Overall Agricultural Entrepreneurship Evaluation Summary Average N(NR) What overall score would you give this series? 4.7 10 (2) How much will you use this information to help shape your agricultural business? 4.9 10 (2) % Yes Did this course answer most of your questions? 100% 10 (2) Did you learn useful/helpful information? 100% 10 (2)

Small Acreage Program – 2018 Annual Report
Page | 19 of 31
Vancouver location. They learned about strengthening their farm operations through healthy cash flows. Featured speakers included a farm economist and farm analyst from Kansas State University Extension, and Sarah Aubrey, author and farmer, and Principal in Aubrey Coaching & Training. Participants also listened and asked questions of two successful, local women farmers. Seventeen of 18 respondents agreed they would change practices in the business based on what they learned, and all 18 agree they would tell other women the benefits of working in agriculture. Small Farm Workshop – The Coordinator’s resignation did not allow time to schedule a small farm workshop. Issues and Recommendations. None at this time.
Task 5: Impact Evaluation & Reporting Task 5a – Evaluations Workshop Evaluations. The program conducts post-event evaluations for each workshop, tour, and class where appropriate. Spouses and partners are encouraged to fill out separate evaluations. Registration and attendance is tracked and recorded, along with evaluation results and comments. Participant suggestions and comments are incorporated as appropriate in planning for future events. Impact Reporting (follow-up surveys on workshops and tours). The Coordinator and Director sent follow-up surveys for the 2015, 2016, and 2017 Living on the Land classes. The results of the surveys have only begun to be input. The Coordinator and Director prepared follow-up surveys for all BMP workshop, well and septic workshop, and small acreage tours from 2016 to 2017. The surveys were sent out in May and June 2018 and the results will be listed in the first quarter report in 2019. Information Requests. The program responded to about 175 requests for information on upcoming events, agricultural business ventures, septic systems, drainage, animal husbandry, and stormwater management. All individuals who contact the program receive relevant factsheets and flyers for upcoming events, as well as applicable links and verbal and written guidance applicable to their concerns. LOL Impact Evaluation. Overview. Beginning in 2004, the Director developed a survey to assess behavior changes by former participants in the Living on the Land series based on the knowledge participants gained while taking the course. Methodology. The close-ended survey measures self-reported changes from Living on the Land from participants. Graduates through 2017 have been surveyed after they had at least one summer to implement BMPs on their properties; those in 2017 will be resurveyed due to the poor response rate. After initial mailings, staff followed-up with non-responders by email and/or telephone. Response. The LOL 12 week class series (graduated 470 people through 2017 owning at least 3,966 acres). LOL graduated an additional 28 people (20 households) owning at least 135 additional acres in 2018.

Small Acreage Program – 2018 Annual Report
Page | 20 of 31
No. % of Class
As % of All Grads
House-hold
Partner/ Spouse Total As% of
ClassAs % of All Grads
Fall 03 0 4 17% 1% 16 3 19 83% 4% 23 5%Spring 04 0 8 19% 2% 26 9 35 81% 7% 43 9%Fall 04 0 4 12% 1% 25 5 30 88% 6% 34 7%Spring 05 1 4 15% 1% 19 3 22 81% 5% 27 6%Fall 05 1 2 7% 0% 20 4 24 89% 5% 27 6%Fall 06 0 3 9% 1% 25 5 30 91% 6% 33 7%Fall 07 0 5 16% 1% 21 6 27 84% 6% 32 7%Fall 08 1 7 23% 1% 18 5 23 74% 5% 31 7%fall 09 0 10 43% 2% 12 1 13 57% 3% 23 5%Fall 10 1 7 28% 1% 15 2 17 68% 4% 25 5%Fall 11 0 6 32% 1% 12 1 13 68% 3% 19 4%Fall 12 1 7 25% 1% 15 5 20 71% 4% 28 6%Fall 13 0 6 22% 1% 16 5 21 78% 4% 27 6%Fall 14 1 9 35% 2% 13 3 16 62% 3% 26 6%Fall 15 3 7 23% 1% 13 7 20 67% 4% 30 6%Fall 16 0 7 39% 1% 9 2 11 61% 2% 18 4%Fall 17 2 18 75% 4% 3 1 4 17% 1% 24 5%Total 11 114 24% 278 67 345 73% 470 100%
Table 29: Survey Response Rate
Class MovedNo Response Returned Evaluations Total
GradsAs % of All Grads
As outlined in Table 29, 345 LOL participants returned the survey for an overall response rate of 73%. The class of Fall 2017 returned the least (17%) while the class of 2006 returned the most (91%). Analysis. Through 2017, with a 70% response from 345 graduates, 278 graduate households (of 345 HH) implemented 726 BMPs on at least 2,388 acres affecting at least 1,795 livestock (excluding poultry). Graduates shared what they learned with over 3,518 other people. Over 45% of responding households tested their soil, 61% of respondent households with septic systems inspected their system, and 55% of households with wells tested them, all as a result of what
they learned. Over 85% thought the class was a good use of their Clean Water fee. When asked at what level their knowledge was at before and after the course in eight general topic areas, 57% to 80% learned something to a lot about all eight topics (Table 30). The fewest respondents learned something about managing manure, but over 57% still learned at least something. Over 73% of responding graduates learned how their management impacts clean water, a heartening level since water quality is a major theme underlying much of the LOL curriculum.

Small Acreage Program – 2018 Annual Report
Page | 21 of 31
Impact Reporting (follow-up surveys on small farm workshops and tours). There are none to-date. Task 5b – Reporting Reporting. This report constitutes the third quarter and annual report for 2018. Issues and Recommendations. There are none at this time. Promotions. The Program uses a number of means to advertise program offerings. Looking across all quarter two events, the most successful promotions are through digital media (including Facebook, the Small Acreage Program website and email) which accounted for almost half of respondents (Table 31).
Table 30: Knowledge Change Before and After Course
General Topic No Change
As % of Respondents (N)
Some to A Lot As % of
Respondents (N) Managing weeds 17% (335) 80% (335) Keeping my pasture/hay field healthy 25% (325) 71% (325) Managing rainwater (stormwater runoff) so that it stays clean 25% (328) 70% (328) Soil and how it relates to managing my land 16% (331) 80% (331) Setting realistic goals for my land 24% (333) 72% (333) Managing animal manure 38% (328) 57% (328) Managing / controlling mud 29% (331) 66% (331) How my management practices impact clean water: 23% (332) 73% (332)
Table 31: Responses to Event Promotions How Participants Heard of Events Responses (#)
Small Acreage events 25 E-mails (office listservs, local partner newsletters) 46 Digital Media (Small Acreage Facebook / Extension Website), 46 Flyers (feed stores, veterinarians, and libraries) 0 Newspaper PR / Ads (The Reflector, Post-Record, The Columbian, and FYI) 28 Word of mouth 27 Small Acreage Postcard 17 Other 14 Septic Inspection notice 36
Total 239

Small Acreage Program – 2018 Annual Report
Page | 22 of 31
2018 Goals Qtr 1 Qtr 2 Qtr 3 Qtr 4 YTD % 2018
GoalsMaterials added to reference files ongoing 1 1 1 1 4Post links and resources to website ongoing 1 1 1 1 4Track web site hits ongoing 1 1 1 1 4Track web site document downloads ongoing 1 1 1 1 4Article 1 1 1 100%Video clip, factsheet, or PowerPoint 1 0 0%LOL series 1 1 1 100%
Graduation 20 28 28 140%Well & septic workshops 4 1 1 1 1 4 100%
Attendance 80 28 29 33 36 126 158%BMP Workshops 3 1 1 1 3 100%
Attendance 30 16 11 13 40 133%Revise & maintain speaker's list ongoing 1 1 1 1 4Small Acreage Exposition 1 1 1 100%
Attendance 75 106 106 141%Clark County Fair 1 0 0%WSU Harvest Celebration 1 1 1 100%
Attendance 600 605 605 101%Additional Events as identified 0
Mass Mailing Postcard mailing 1000 425 765 1190 119%Conduct tours 2 1 1 2 100%
Attendance 30 12 16 28 93%Sign Recognition Assess properties for signage program 6 2 1 2 1 6 100%
Summary of Attendance 28 163 649 93 933Attendee Evaluations Returned 328 19 120 28 58 225 69%Requests for assistance 73 66 25 11 175Quarterly Reports 3 1 1 2 67%Annual Report 1 1 1 100%
BMP Workshops
Program Elements
Information Resources
Well & Septic Workshops
Publications
Best Management
Practices (Task 1)
LOL Class Series
Property ToursModel Properties
(Task 3)
Reporting
Public Outreach and
Education (Task 2)
Outreach Events & Promotional
Activities
Impact Evaluation and
Reporting (Task 4)
Evaluation
Table 32: Progress Summary

Small Acreage Program – 2018 Annual Report
Page | 23 of 31
Appendix A:
Example Promotional Materials
FLYER
PRESS RELEASE
REFLECTOR ADVERTISEMENT
FACEBOOK POSTS
FACEBOOK ADVERTISEMENTS
POSTCARDS

Small Acreage Program – 2018 Annual Report
Page | 24 of 31
LOL Reflector Article

Small Acreage Program – 2018 Annual Report
Page | 25 of 31
Riparian Planting Reflector Article

Small Acreage Program – 2018 Annual Report
Page | 26 of 31
Sample Promotional Flyer

Small Acreage Program – 2018 Annual Report
Page | 27 of 31
Sample Press Release
Contact: Amber Lefstead
WSU Extension Clark County Tel: 360-397-6060 ext. 5729 Fax: 360-759-6524 E-mail: [email protected]
Learn How to Manage Your Mountain of Manure
Vancouver, WA – Have more manure than you know what to do with? Join the Small Acreage Program for a workshop that teaches manure composting, storage, options for using or getting rid of your manure, and how to use manure as a fertilizer. “Participants will learn how to reduce manure pile size, create a valuable soil amendment, improve animal health, reduce pests, and keep our water clean,” says Doug Stienbarger, WSU Clark County Extension Director and natural resources specialist. As speaker, Stienbarger will teach the class and provide participants with excellent resources. “Large livestock produce 50-60 lbs of manure each day which requires effective management strategies,” adds Stienbarger. This is a great workshop that will teach strategies for turning waste into a valuable resource. The Small Acreage Program, co-sponsored by Washington State University Clark County Extension and Clark County Public Works Clean Water Program, will provide information, handouts, and answer landowners’ questions at the workshop.
“Manure Composting and Management”
Thursday, May 17, 2018 6:00 to 8:00 PM Ridgefield, WA
Registration is $10 per person and class size is limited. To register and find more details visit https://managingmanure.brownpapertickets.com/ or call 360-397-6060 ext. 5729 or email [email protected] WSU Extension programs and employment are available to all without discrimination. Persons requiring special accommodations should call WSU Clark County Extension at (360) 397-6060 ext. 0 at least two weeks prior to
the event. ###
Small Acreage Program – 2018 Annual Report
Page | 28 of 31
Sample Reflector Advertisement

Small Acreage Program – 2018 Annual Report
Page | 29 of 31
Sample Facebook Posts

Small Acreage Program – 2018 Annual Report
Page | 30 of 31
Facebook Advertisements

Small Acreage Program – 2018 Annual Report
Page | 31 of 31
Postcard Mailers