SLOCAN VALLEY
94
Regional District of Central Kootenay Housing Needs Report: SLOCAN VALLEY SUB-REGIONAL REPORT SEPTEMBER 2020
Transcript of SLOCAN VALLEY

Regional District of Central Kootenay Housing Needs Report:
SLOCAN VALLEYSUB-REGIONAL REPORTSEPTEMBER 2020

2
Contents EXECUTIVE SUMMARY ........................................................................................................... 9
PREFACE .................................................................................................................................13
DEMOGRAPHY ........................................................................................................................15
SECTION SUMMARY ...........................................................................................................15
1. POPULATION CHANGE ................................................................................................16
2. POPULATION STRUCTURE .........................................................................................17
Age Distribution..................................................................................................................17
Median Age ........................................................................................................................18
3. INDIGENOUS IDENTITY ...............................................................................................18
4. HISTORICAL & ANTICIPATED HOUSEHOLDS ............................................................19
5. HOUSEHOLD CHARACTERISTICS ..............................................................................20
Household Tenure .............................................................................................................20
Subsidized Households ......................................................................................................21
Household Size ..................................................................................................................21
Household Type .................................................................................................................22
Household Maintainers ......................................................................................................23
Household Mobility (1-Year) ...............................................................................................23
ECONOMY ...............................................................................................................................25
SECTION SUMMARY ...........................................................................................................25
6. INCOME .........................................................................................................................26
Median Before-Tax Household Income ..............................................................................26
Median Before-Tax Household Income by Family Type .....................................................28
7. LOW-INCOME MEASURE .............................................................................................28
8. EMPLOYMENT ..............................................................................................................29
Labour Force Statistics ......................................................................................................29
Industry ..............................................................................................................................30
Commuting ........................................................................................................................31
HOUSING .................................................................................................................................33
SECTION SUMMARY ...........................................................................................................33
9. DWELLING CHARACTERISTICS ..................................................................................34
Dwelling Type ....................................................................................................................34
Dwelling Age ......................................................................................................................34
Dwelling Size .....................................................................................................................35
10. CONSTRUCTION ACTIVITY (STARTS) .....................................................................35

3
11. RENTAL MARKET ......................................................................................................35
Prices .................................................................................................................................35
Vacancy .............................................................................................................................37
12. REAL ESTATE MARKET ............................................................................................37
Sales Activity .....................................................................................................................38
Prices .................................................................................................................................38
13. SHORT-TERM RENTALS ...........................................................................................39
HOUSING NEED & AFFORDABILITY ANALYSIS ....................................................................41
SECTION SUMMARY ...........................................................................................................41
14. NON-MARKET HOUSING SUPPLY & PROGRAMS ..................................................42
Facilities & Programs .........................................................................................................42
Non-Market Housing Waitlist ..............................................................................................42
15. MARKET HOUSING DEMAND & SUPPLY .................................................................43
Demand .............................................................................................................................43
Supply ................................................................................................................................43
16. MARKET HOUSING CONDITION ..............................................................................44
Unsuitable Housing ............................................................................................................44
Inadequate Housing ...........................................................................................................45
Unaffordable Housing ........................................................................................................45
17. CORE HOUSING NEED .............................................................................................46
Overall Core Housing Need ...............................................................................................46
Extreme Core Housing Need .............................................................................................47
18. AFFORDABILITY ........................................................................................................47
Rental Market Affordability .................................................................................................48
Owner Market Affordability .................................................................................................49
Energy Poverty ..................................................................................................................49
GLOSSARY ..............................................................................................................................52
APPENDIX A – New Denver Data Tables .................................................................................56
Historical & Anticipated Population & Households ..............................................................56
Indigenous Identity .............................................................................................................56
Mobility ..............................................................................................................................56
Post-Secondary Enrollment................................................................................................56
Homelessness ...................................................................................................................56
Private Household Size ......................................................................................................57
Household Maintainers ......................................................................................................57

4
Owners w/ Mortgages & Renters in Subsidized Housing ....................................................57
Household Income .............................................................................................................57
Labour Force .....................................................................................................................58
NAICS Industry Employment..............................................................................................58
Commuting ........................................................................................................................58
Housing – Structural Types ................................................................................................58
Housing – Unit Size ...........................................................................................................59
Housing – Date Built ..........................................................................................................59
Housing – Subsidized ........................................................................................................59
Housing – Rental Vacancy .................................................................................................59
Housing – Primary Rental Universe ...................................................................................59
Housing – Secondary Rental Universe ...............................................................................60
Housing – Short Term Rentals ...........................................................................................60
Housing – Cooperatives .....................................................................................................60
Housing – Post-Secondary Beds .......................................................................................60
Housing – Shelter Beds .....................................................................................................60
Housing – Non-Market Housing .........................................................................................61
Housing – Demolitions .......................................................................................................61
Housing – Starts ................................................................................................................61
Housing – Registered New Homes ....................................................................................61
Real Estate – Assessment .................................................................................................61
Real Estate – Sales Price ..................................................................................................62
Real Estate – Rents ...........................................................................................................63
Core Housing Need – Affordability .....................................................................................63
Core Housing Need – Adequacy ........................................................................................63
Core Housing Need – Suitability ........................................................................................64
Core Housing Need ...........................................................................................................64
Extreme Core Housing Need .............................................................................................64
Income Category v. Price ...................................................................................................64
Family Income v. Price .......................................................................................................65
Housing Units Demanded ..................................................................................................66
APPENDIX B – Silverton Data Tables .......................................................................................67
Historical & Anticipated Population & Households ..............................................................67
Indigenous Identity .............................................................................................................67
Mobility ..............................................................................................................................67

5
Post-Secondary Enrollment................................................................................................67
Homelessness ...................................................................................................................67
Private Household Size ......................................................................................................68
Household Maintainers ......................................................................................................68
Owners w/ Mortgages & Renters in Subsidized Housing ....................................................68
Household Income .............................................................................................................68
Labour Force .....................................................................................................................68
NAICS Industry Employment..............................................................................................69
Commuting ........................................................................................................................69
Housing – Structural Types ................................................................................................69
Housing – Unit Size ...........................................................................................................69
Housing – Date Built ..........................................................................................................70
Housing – Subsidized ........................................................................................................70
Housing – Rental Vacancy .................................................................................................70
Housing – Primary Rental Universe ...................................................................................70
Housing – Secondary Rental Universe ...............................................................................70
Housing – Short Term Rentals ...........................................................................................70
Housing – Cooperatives .....................................................................................................71
Housing – Post-Secondary Beds .......................................................................................71
Housing – Shelter Beds .....................................................................................................71
Housing – Non-Market Housing .........................................................................................71
Housing – Demolitions .......................................................................................................71
Housing – Starts ................................................................................................................71
Housing – Registered New Homes ....................................................................................72
Real Estate – Assessment .................................................................................................72
Real Estate – Sales Price ..................................................................................................72
Real Estate – Rents ...........................................................................................................73
Core Housing Need – Affordability .....................................................................................73
Core Housing Need – Adequacy ........................................................................................73
Core Housing Need – Suitability ........................................................................................74
Core Housing Need ...........................................................................................................74
Extreme Core Housing Need .............................................................................................74
Income Category v. Price ...................................................................................................74
Family Income v. Price .......................................................................................................74
Housing Units Demanded ..................................................................................................75

6
APPENDIX C – Slocan Data Tables .........................................................................................76
Historical & Anticipated Population & Households ..............................................................76
Indigenous Identity .............................................................................................................76
Mobility ..............................................................................................................................76
Post-Secondary Enrollment................................................................................................76
Homelessness ...................................................................................................................76
Private Household Size ......................................................................................................77
Household Maintainers ......................................................................................................77
Owners w/ Mortgages & Renters in Subsidized Housing ....................................................77
Household Income .............................................................................................................77
Labour Force .....................................................................................................................78
NAICS Industry Employment..............................................................................................78
Commuting ........................................................................................................................78
Housing – Structural Types ................................................................................................79
Housing – Unit Size ...........................................................................................................79
Housing – Date Built ..........................................................................................................79
Housing – Subsidized ........................................................................................................79
Housing – Rental Vacancy .................................................................................................79
Housing – Primary Rental Universe ...................................................................................80
Housing – Secondary Rental Universe ...............................................................................80
Housing – Short Term Rentals ...........................................................................................80
Housing – Cooperatives .....................................................................................................80
Housing – Post-Secondary Beds .......................................................................................80
Housing – Shelter Beds .....................................................................................................80
Housing – Non-Market Housing .........................................................................................81
Housing – Demolitions .......................................................................................................81
Housing – Starts ................................................................................................................81
Housing – Registered New Homes ....................................................................................81
Real Estate – Assessment .................................................................................................81
Real Estate – Sales Price ..................................................................................................82
Real Estate – Rents ...........................................................................................................82
Core Housing Need – Affordability .....................................................................................83
Core Housing Need – Adequacy ........................................................................................83
Core Housing Need – Suitability ........................................................................................83
Core Housing Need ...........................................................................................................84

7
Extreme Core Housing Need .............................................................................................84
Income Category v. Price ...................................................................................................84
Family Income v. Price .......................................................................................................84
Housing Units Demanded ..................................................................................................84
APPENDIX D – Electoral Area H Data Tables ..........................................................................85
Historical & Anticipated Population & Households ..............................................................85
Indigenous Identity .............................................................................................................85
Mobility ..............................................................................................................................85
Post-Secondary Enrollment................................................................................................85
Homelessness ...................................................................................................................85
Private Household Size ......................................................................................................86
Household Maintainers ......................................................................................................86
Owners w/ Mortgages & Renters in Subsidized Housing ....................................................86
Household Income .............................................................................................................86
Labour Force .....................................................................................................................87
NAICS Industry Employment..............................................................................................87
Commuting ........................................................................................................................87
Housing – Structural Types ................................................................................................87
Housing – Unit Size ...........................................................................................................88
Housing – Date Built ..........................................................................................................88
Housing – Subsidized ........................................................................................................88
Housing – Rental Vacancy .................................................................................................88
Housing – Primary Rental Universe ...................................................................................88
Housing – Secondary Rental Universe ...............................................................................88
Housing – Short Term Rentals ...........................................................................................89
Housing – Cooperatives .....................................................................................................89
Housing – Post-Secondary Beds .......................................................................................89
Housing – Shelter Beds .....................................................................................................89
Housing – Non-Market Housing .........................................................................................89
Housing – Demolitions .......................................................................................................90
Housing – Starts ................................................................................................................90
Housing – Registered New Homes ....................................................................................90
Real Estate – Assessment .................................................................................................90
Real Estate – Sales Price ..................................................................................................90
Real Estate – Rents ...........................................................................................................91

8
Core Housing Need – Affordability .....................................................................................92
Core Housing Need – Adequacy ........................................................................................92
Core Housing Need – Suitability ........................................................................................92
Core Housing Need ...........................................................................................................92
Extreme Core Housing Need .............................................................................................93
Income Category v. Price ...................................................................................................93
Family Income v. Price .......................................................................................................93
Housing Units Demanded ..................................................................................................94
9
EXECUTIVE SUMMARY Safe, affordable, and inclusive housing is vital to societal, economic, and individual health and well-being of communities and residents within the Regional District of Central Kootenay (RDCK). Unfortunately, safe, affordable, and inclusive housing is increasingly difficult to find.
Funded by the Union of British Columbia Municipalities (UBCM) Housing Needs Report program, this sub-regional report serves as descriptive analysis of the current housing characteristics, conditions, and needs within the Slocan Valley Sub-Region.
The sub-regional report contains housing data and market analysis that describe that specific area. Although it can be used as a standalone document, it is meant to function alongside the RDCK’s Regional Housing Needs Report which illustrates how Slocan Valley compares to and fits within the regional context.
KEY FINDINGS The following key themes were found throughout the data and community engagement portions of this project.
Slocan Valley’s population grew modestly, and will likely quicken its pace in the short-term, but not evenly across age categories.
Slocan Valley’s population grew 4% between 2006 and 2016, while projections anticipate greater gains (5%) until 2025. Growth is led by senior cohorts (65+), which grew 48% over the ten years leading to 2016.
Having more seniors typically impacts the availability of sub-regional and regional services and amenities for seniors, while also affecting local labour markets. However, between 2006 and 2016, labour force (people working or actively seeking work) participation growth equated growth in non-labour force participation (e.g. retirees), indicating local employment growth has kept up with demographic changes.
With a growing population and smaller household sizes, Slocan Valley will likely demand more market housing units over the short-term. By 2025, residents may demand 2,980 total market units, about 200 more than 2016 (or 22 annually). Based on historical construction rates, Slocan Valley may build just enough to satisfy local resident demand.
Renting is becoming more popular.
The percentage of people renting jumped 21% between 2006 and 2016; particularly, total families with children who rent increased while those who own decreased, suggesting an increased preference to rent or a response to housing availability and affordability in the local and broader market.

10
There is a general lack of available, affordable housing in the Slocan Valley subregion. Access to appropriate housing is very difficult for families, people on income assistance, and anyone with a specialized need.
Interviews with residents and responses from surveys universally pointed to a lack of available and affordable housing as the main challenge impacting the communities in Slocan Valley. This was especially apparent for older residents who lived on a fixed-income or who wished to downsize to a smaller unit that was easier to maintain. Younger residents also struggle to find appropriate housing, especially those individuals or families who may be relying on only one income. Detached home ownership is generally out of reach for most singles or single-income households, and renting (when units are available) is similarly challenging.
“My situation has been great but now that I am ready to expand my family, I do not have enough space. I do have money to pay higher rent but there is nothing available to rent. Once in awhile a viable rental will pop up but so
many people want it that I am not able to get in.”
“I have been looking for an upgrade that has more closed bedrooms and more square footage for 2 years. When rentals do come up, they have been
snatched up quickly before I can access them. There just aren't many rentals available.”
“It is nearly impossible to find affordable housing in the slocan valley that is reasonably maintained, includes standard amenities, and the person renting
has reasonable boundary/communication skills.”
Renters and homeowners report significantly different experiences of housing affordability and suitability in the Slocan Valley.
Almost half of all owners (48%) who responded to the community survey no longer pay a mortgage, which significantly decreases their monthly housing costs. In comparison, a majority of renters (58%) pay between $500 - $999 per month for housing costs. When asked if their current housing situation meets their needs, 50% of renter respondents said no while 97% of owner respondents said their current housing situation meets their needs.
Incomes are rising and housing prices appear to be decreasing after inflation is accounted for, which should translate to less financial burden for residents to meet the basic needs of themselves and their families, but not always.
The median Slocan Valley household earned more in 2015 than it did in 2005, even with inflation removed from the comparison. Also without inflation, single family home prices decreased about

11
10%, suggesting that higher earnings should be making living costs more affordable. However, a reason for the income increase was the distributional shift towards more households earning $100,000 or greater; this segment grew 50%. Both owner and renter household incomes did grow over the decade, with the latter increasing enough to reduce the income disparity between both tenures.
Statistics Canada reports that about 31% of households are “low income,” illustrating that a noticeable portion of the population is truly experiencing financial hardship. When broken down by segments, it is shown that about 39% of households with children younger than 6 are likely struggling financially. Income metrics may be showing improvements, but there remain those in need that can be overlooked by positive trends.
The size and quality of housing is improving, allowing residents to live more comfortably and securely. Statistics Canada also reported greater affordability.
New construction is often larger and of higher quality than the past, pushed by changes in building regulations and consumer preference; however, their prices tend be higher than the existing stock. Those who cannot afford newer homes seek older, smaller, and less up to date alternatives to fit their budgets. Nevertheless, housing prices (after inflation) have declined while incomes have risen, partially contributing to a decrease in the total and percentage of households living in unaffordable housing between 2006 and 2016.
Even with affordability improvements, lone parent and low income earning households can barely afford a bachelor apartment and cannot afford more than a movable dwelling, emphasizing the importance of non-market support.
Energy poverty is a significant issue within the Slocan Valley subregion, with almost a third of respondents saying that their energy bills are unaffordable.
When accounting for fuel cost, the average household in the Slocan Valley subregion cannot reasonably afford their energy expenses. Generally, no households can reasonably afford their energy expenses, not even couples with children who are often the most financially capable to meet their needs. Single or very low-income households may potentially pay almost 3 times more than they can actually afford.
Twenty-eight percent (28.3%) of survey respondents indicated their energy bills, without transportation fuel, were unaffordable. When respondents had issues paying their monthly energy bills, 64.7% recorded that they kept their homes at a temperature too cold to be comfortable to offset costs. Fifty-three percent (52.9%) recorded that they didn’t have enough money for food as a result of energy costs. Seventy-six percent (76.5%) held off on paying other bills like credit cards, mortgages or rent.
“age of the house, quality of equipment ex. appliances old, furnace not efficient, insulation for electricity leaking, heating loss, windows heat loss,

12
utility costs by FORTIS ridiculous, live on Pass Creek road rural, no bus service”
Key Resident Quotes:
“Not one but many experiences of discrimination based on age, gender income, ability. Very common in a housing crisis for landlords to pick and
choose based on their particular preferences, and even have bidding wars for tenants which significantly raises rent. Most people I know who rent expect
this and often have to move away because of landlord discrimination, unaffordable housing, lack of housing options, lack of safe or structurally
sound housing”
“I hope to own a home sometime in the next 10 years but there are few houses available here, and the prices are lower in other areas.”
“Build small scale mutli-unit housing in a few select areas with good transport and amenities, like Playmor Junction and Slocan Park. If this possibility was
opened up, community organizations could mobilize to create solutions.”
“We need more affordable, not-for-profit, seniors' housing and housing for young families. More access to government supported in-home services such as grocery shopping and delivery, expansion or restoration of work previously
done by home care workers.”

13
PREFACE
This report investigates regional report topics at a smaller, sub-regional scale in an effort to distinguish what is occurring in those communities perceived to be most tightly connected (e.g. by distance or economically). The regional report defines seven sub-regions, each corresponding to a relationship between one or multiple municipalities and one or multiple electoral areas.
Figure E – 0a: RDCK & Slocan Valley Sub-Region

14
Readers may notice some discrepancy between the type of detail or number of sections available in the regional report and this one; some data cannot be appropriately conveyed locally since the trends reflect the combination of many communities. One major exception is rental data, which is only available for the City of Nelson through CMHC but still serves as an illustration of what may be occurring in nearby markets that do not benefit from federal data collection practices.
Lastly, this report presents data graphically for ease of reading. Tables with detailed data relating to each section are available in the appendix attached at the end.

15
DEMOGRAPHY SECTION SUMMARY
Slocan Valley’s population grew modestly and may continue this pace in the short-term
Slocan Valley grew 4% overall between 2006 and 2016. Projections anticipate a slightly higher growth of 5% from 2016 to 2025.
Household growth has and will continue to outpace population growth
Population growth and declining household sizes mean more people are contributing to the demand for housing.
There are more families with children than a decade ago, yet youth totals continue to fall
Families with children grew 3% between 2006 and 2016, but sub-regional youth totals fell 2% over the same time, highlighting the impact of declining birth rates and the subsequent smaller household sizes.
Rapid senior growth is the new normal
Most Slocan Valley communities had at least 35% senior growth from 2006 to 2016 (only Slocan declined at 10%). Projections anticipate growth in all areas from 2016 to 2025.
Families with children are renting more often than previously
The number of families with children living in rental tenured housing grew significantly faster than those in owner occupied housing. This likely represents both an increase in preferences for renting, as well as a compromise driven by housing unaffordability.

16
1. POPULATION CHANGE Slocan Valley grew from 5,570 residents to 5,790 between 2006 and 2016, marking 4% growth over the decade. Growth occurred in Silverton and Electoral Area H, rising 11% and 7%, respectively.
Population projections anticipate a positive trajectory for each member community, except for New Denver which may retain the same population total. Slocan may experience the greatest change, decreasing 23% from 2006 to 2016 but growing 8% from 2016 to 2025.
Projections anticipate 6,105 people will live in the Sub-Region by 225, meaning there will be at least 315 new residents over 9 years (a 5% increase).
Please note that population totals discussed above and seen below may not equate to what is provided by traditional Statistics Canada datasets. Populations are adjusted to recognize Census undercounting.
Figure E – 1a: 2016 Historical Population & Percent Change ’06-’16
Figure E – 1b: 2025 Anticipated Population & Percent Change ’16-’25
Source: Statistics Canada Source: Statistics Canada, BC Stats
Figure E – 1c: Population Change ’06-’25 & Percent Change ’16-‘25
Source: Statistics Canada, BC Stats

17
2. POPULATION STRUCTURE Age Distribution Across the RDCK, British Columbia, and Canada, residents are aging. The Baby Boomers (those born between 1946 to 1964) are a large generation now entering retirement and declining birth rates mean younger people will not balance this trend.
Figure E – 2a illustrates the distribution of age among six main cohorts (as defined by Housing Needs legislation) in 2016: children below 15, 15 to 19, 20 to 24, 25 to 64, 65 to 84, and 85 years or older. Figure E – 2b and 2c illustrate how each main age cohort has changed since 2006 and may change to 2025.
Figure E – 2a: Major Population Age Cohorts, 2016
Source: Statistics Canada
In 2016, the Sub-Region had 1,120 youth, (below 20 years old) 3,520 working age persons (20 to 64), and 1,150 seniors (65+), representing 19%, 61%, and 20% of the total sub-regional population, respectively. These totals are the result of a 2% loss, 2% loss, and 48% gain in each cohort since 2006.
Slocan Valley had a modest increase in children below 15, followed by declines or no change in 15 to 19 and 20 to 24 year cohorts. All communities but Electoral Area H lost people 25 to 64. All communities had substantial gains in residents 65 to 84.
Figure E – 2b: Population Change (%) by Age Cohort ’06-‘16
Source: Statistics Canada
18
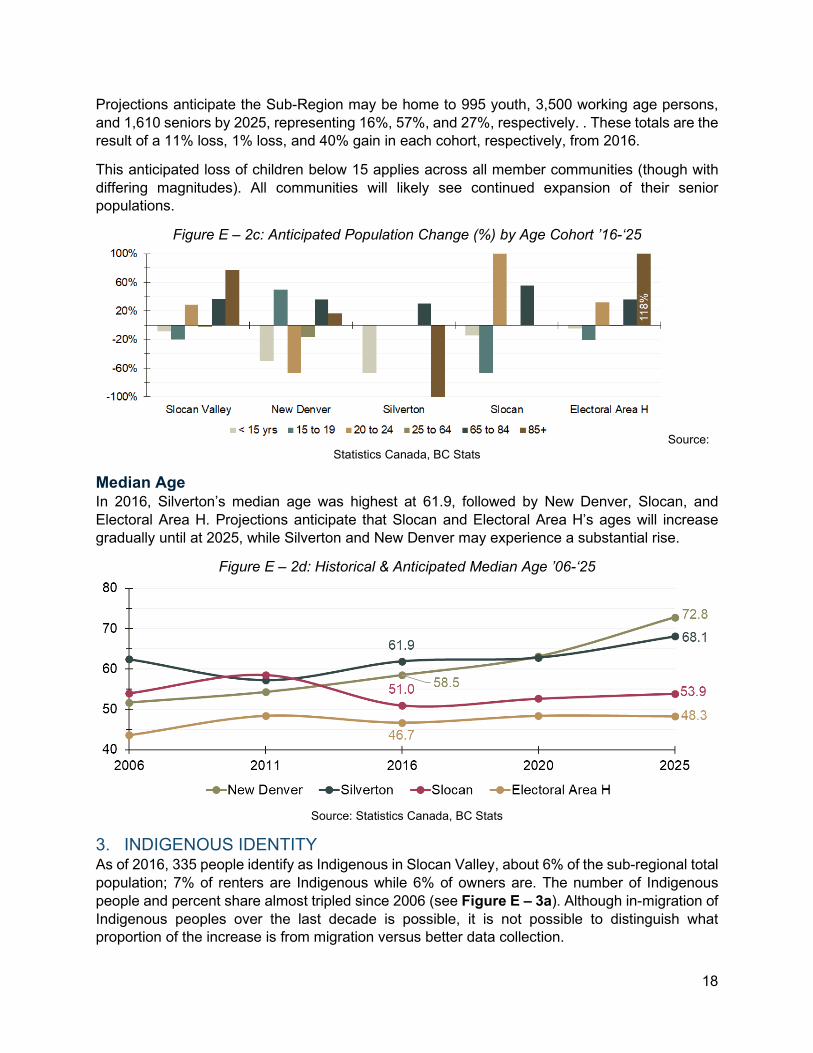
Projections anticipate the Sub-Region may be home to 995 youth, 3,500 working age persons, and 1,610 seniors by 2025, representing 16%, 57%, and 27%, respectively. . These totals are the result of a 11% loss, 1% loss, and 40% gain in each cohort, respectively, from 2016.
This anticipated loss of children below 15 applies across all member communities (though with differing magnitudes). All communities will likely see continued expansion of their senior populations.
Figure E – 2c: Anticipated Population Change (%) by Age Cohort ’16-‘25
Source: Statistics Canada, BC Stats
Median Age In 2016, Silverton’s median age was highest at 61.9, followed by New Denver, Slocan, and Electoral Area H. Projections anticipate that Slocan and Electoral Area H’s ages will increase gradually until at 2025, while Silverton and New Denver may experience a substantial rise.
Figure E – 2d: Historical & Anticipated Median Age ’06-‘25
Source: Statistics Canada, BC Stats
3. INDIGENOUS IDENTITY As of 2016, 335 people identify as Indigenous in Slocan Valley, about 6% of the sub-regional total population; 7% of renters are Indigenous while 6% of owners are. The number of Indigenous people and percent share almost tripled since 2006 (see Figure E – 3a). Although in-migration of Indigenous peoples over the last decade is possible, it is not possible to distinguish what proportion of the increase is from migration versus better data collection.

19
Figure E – 3a: Historical Indigenous Identity & Percent Change ’06-‘16
Source: Statistics Canada
4. HISTORICAL & ANTICIPATED HOUSEHOLDS Slocan Valley grew from 2,530 households to 2,780 between 2006 and 2016, 10% growth over the decade. Only the Village of Slocan lost households, dropping about 15%.
Household projections anticipate continued growth, rising 8% from 2016 to 2025 for Slocan Valley. The overall area may reach 3,000 households by 2025, 220 more than 9 years prior. Two factors largely contribute to household growth: (1) increased population means more demand from residents and their households and (2) smaller household sizes attributed to smaller families, empty-nesters, and seniors mean that there is greater housing demand per capita. Projections do not anticipate household losses in any of Slocan Valley’s communities.
Household growth is an important fundamental component of housing demand: by definition a household requires an available dwelling to occupy. Household projections are therefore synonymous with the increase in housing stock required to accommodate expected population changes (note overall housing demand is also influenced by economic and fiscal factors). Projecting future growth in the number of households requires two related data inputs: (1) population projections (see Section 1: Population Change) and (2) the historical proportion of maintainers (see Glossary) by age cohort, divided by the total people in that cohort. Total demand is calculated by applying the proportions of (2) to the change in how many people there are at a given age determined by (1).
Figure E – 4a: 2016 Historical Households & Percent Change ’06-’16
Figure E – 4b: 2025 Anticipated Households & Percent Change ’16-’25

20
Source: Statistics Canada Source: Statistics Canada, BC Stats
Figure E – 4c: Household Change ’06-’25 & Percent Change ’16-‘25
Source: Statistics Canada, BC Stats
Please note that, like population, household totals are estimates based on adjustments made to reflect Census undercounting. Furthermore, households in this section refer to total private dwellings (inclusive of both permanent and non-permanent households). Proceeding sections speak only to those that are permanent (who live in the area the majority of the year, also known as usual residents) because Statistics Canada’s data level of detail is only for said households.
5. HOUSEHOLD CHARACTERISTICS Statistics Canada defines a household as a person or group of persons who occupy the same dwelling and do not have a usual place of residence elsewhere in Canada or abroad. One household could be a couple with children, multiple families residing in the same dwelling, a single person, or roommates. In essence, a household is the highest-level descriptor of many unique living situations. The following subsections aim to illustrate the key highlights of Slocan Valley and its member communities.
Household Tenure Statistics Canada data divides “tenure” into three categories: (1) owner, (2) renter, and (3) band housing. Band housing is often not reported or is supressed for confidentiality. This report illustrates only the relationship between owner and renter households.
Overall, the Sub-Region is made up of 80% owners and 20% renters, or 2,100 and 520 households respectively. Figure E - 5a describes the owner to renter relationships across the Slocan Valley and its communities.
New Denver had the highest proportion of renter households (35%), followed by Silverton (24%). Electoral Area H had the lowest rate of renters (18%).
Between 2006 and 2016, renter households grew by of 21%, higher than owner households at 4%. Renter growth was particularly strong in Electoral Area H (31%); owner growth was highest in Silverton (7%).

21
Figure E – 5a: Household Tenure, 2016
Source: Statistics Canada
Subsidized Households Statistics Canada reports on the number and percentage of renter households that rely on a subsidy or subsidies to acquire and maintain full-time accommodation, such as rent supplements, rent geared to income, or housing allowances (see Subsidized Housing in Glossary).
Figure E – 5b: Subsidized Renter Households, 2016
Source: Statistics Canada
On average, 8% of renter households use a subsidy to afford their accommodation. The only municipal centre to report rental households with subsidies was New Denver (11%). Electoral Area H had about 8% of its renter households using a subsidy.
Household Size The average household size was 2.1 in 2016, below 2006. Owner household sizes shrank (2.2 to 2.1) while renter households remained the same at 1.9.

22
Figure E – 5c: Household Size, 2016
Source: Statistics Canada
Electoral Area H has the highest average household size with 2.2. Given it is also the largest population in Slocan Valley, it has significant influence on sub-regional averages. All municipalities have an average size below 2. The lowest is Silverton (1.6), which has no households bigger than 2 people.
Household Type Household type refers to the type of “census-family” that occupies a dwelling (see Glossary). Figure E - 15d depicts the most common types, being: (1) families without children, (2) families with children, (3) multiple families, or (4) non-census families (herein known as single people or roommates).
As of 2016, about 29% of households were families with children, 30% were families without children, and 41% were other. Families with children declined 1% for owners and jumped 20% for renters. An increase for in the latter highlights that the area can be seen in part as being attractive for local young couples looking to have children or others moving from elsewhere in British Columbia or farther. Owner families without children grew 3% and fell 7% for renters.
Figure E – 5d: Household Family Type, 2016
Source: Statistics Canada

23
Mirroring its greater average household size, Electoral Area H has the highest rate of families, supported mostly by a noticeably larger share of families with children (32%). New Denver has the highest rate of single person or roommate households (51%).
Silverton shows a small percentage of families with children, which would suggest there do exist households that have more than 2 people in them (assuming not all children families or lone parents). This is opposite of what Figure E - 5c shows (no 3+ person households). Silverton’s population size may be magnifying the impact of Statistics Canada’s data rounding.
Household Maintainers Household maintainers describes the number of people in a community that are financially responsible for the upkeep of their dwelling. In their younger years, maintainers mostly occupy rental units as they progress through school, new jobs, and saving money. As they age, the prevalence of ownership increases, typically reaching its proportional peak between 75 and 84 years old. However, the Sub-Region peaks between 55 to 64 (which also has the highest total maintainers), after which it falls slightly in the next cohort and increase gradually until the 75 to 84 cohort. Those 85+ are 100% owners but represent a minute portion of the total maintainer population.
Household maintainer patterns across the Sub-Region communities do differ, particularly the municipalities. For more detail, please refer to their individual data appendices or the tables attached to this report.
Figure E – 5e: Household Maintainers by Age Total & Tenure, 2016
Source: Statistics Canada
Household Mobility (1-Year) One-year mobility refers to whether a person changed their location of residence within the prior twelve months. Overall, about 21% of residents who moved over the previous year did so within their own community, 61% moved from within the Province (inclusive of within the RDCK), 17% moved from within Canada, and 2% moved from outside Canada. Please note Sub-Region percentages reflect the weighted average of the communities within it.
Figure E - 5f illustrates how proportions of movers differs across communities. Notably, Silverton and Slocan had no movers from outside the province and Electoral Area H was the only community to receive a household internationally.

24
Figure E – 5f: Household Mobility, 2016
Source: Statistics Canada

25
ECONOMY SECTION SUMMARY
Median incomes are rising
Slocan Valley households generally earn more money than they used to. Overall, median before-tax incomes increased by 13%, though the data is not sufficient to tell how much of this overall change is due to increases in the same household’s income over time, versus changes in the overall pool of households, e.g. outmigration of lower-income households and in-migration of those with higher incomes. The share of those earning $100,000 or more jumped from 10% to 15%.
Renter incomes are growing faster than owner incomes
The median renter is younger than the median owner, meaning that more renters receive working incomes while aging owners rely more and more on retirement incomes. Renter household income growth was substantial enough to reduce the income disparity between both tenures by about $2,000.
Households with children are the most likely to be considered in low income
About 31% of households fall below the Low-Income Measure, indicating substantially increased potential to experience financial hardship. The most prevalent family type to experience this difficulty are those with children younger than 6 years old. Of these, 39% are classified as substantially worse off than the average. In part, this can be attributed to the fact that young families who are at the beginning of their careers tend to earn lower incomes, yet have higher expenses due to the presence of dependents.
Fewer people are participating in the economy
Although the labour force grew since 2006, there was even greater growth in those not in the labour force (people not working or actively seeking work), a consequence of aging/retiring population.
More people are unemployed
While the labour force increased, so did the total people unemployed at a greater pace than those employed. The result was a higher unemployment rate in 2016 than a decade prior.

26
6. INCOME Unless otherwise indicated, all incomes within this report are adjusted for inflation to represent 2015 constant dollars. Please note that 2005 and 2015 comparison years differ from the normal 2006 and 2016 used by Statistics Canada. The reason is that census incomes come from the previously reported tax year. In addition, because incomes are reported in constant 2015 dollars, any changes between the two years are already adjusted for the impacts of inflation.
Median Before-Tax Household Income Overall, Slocan Valley’s median before-tax household income grew about 13% to $42,105. The median owner household earned $47,957 and the median renter household earned $26,822, representing 13% and 41% growth since 2005, respectively. Renter income growth over the decade was rapid enough to reduce the gap between owner and renter incomes by about $2,000, contracting the purchasing power disparity between the tenures.
Please note that data is unavailable for Silverton and Slocan, meaning the sub-regional data does not include them in the calculations.
Total permanent households grew 7% between 2006 and 2016, while households earning more than $100,000 grew 50%. Those earning between $80,000 and $100,000 grew 21%. It is possible that inflows of new, high-earning people has had a larger impact on median incomes than the progression of existing households into higher income brackets. However, the data is not available to verify these types of dynamics.
Figure E – 6a: Median Before-Tax Household Income by Tenure, 2015 (2015 dollars)
Source: Statistics Canada
Figure E – 6b: Historical Distribution of Households by Median Income, 2015
Source: Statistics Canada

27
Figure E – 6c illustrates the distribution of how many households fall within each income category based on their tenure. Renters are more likely to earn less than $40,000 (68%) compared to owners (45%). The share of owner household earning below $40,000 is higher than most other sub-regions. Alternatively, 17% of owners earn above $100,000 versus 7% of renters.
Figure E – 6c: Proportion of Households per Income Range by Tenure, 2015
Source: Statistics Canada
Many sections of this report rely on data sourced from the Census, which was last conducted in 2016. For many topics, such as demographic trends, the changes since the last Census may be minor; for others, like income, changes can occur more rapidly. To help bridge the gap, this report uses some estimates produced by private third party data firms, inclusive of 2019 median household income estimates.
Estimates suggest that New Denver and Electoral Area H incomes grew 4% and 10% from 2015 to 2019. Estimates suggest that median household incomes for Silverton and Slocan are $42,632 and $36,667, respectively. Figure E - 6d does not allocate a percentage change to Silverton or Slocan since the change originates from data that is unavailable and defaults to $0.
Figure E – 6d: Before-tax Household Income ’05-’19 (2015 dollars) & Percent Change ’15-‘19
Source: Environics Analytics, Statistics Canada

28
Median Before-Tax Household Income by Family Type Statistics Canada provides income statistics for different family structures, categorizing them by their “economic family” types (see Glossary). Briefly, the family types are as follows: couples without children, couples with children, lone parents, and non-economic families (also known as singles / roommates).
Figure E – 6e: Median Before-Tax Household Income by Family Type, 2015
Source: Statistics Canada
Statistics Canada data from 2015 reports that Electoral Area H families with children. Although New Denver demonstrates higher incomes in each other family type compared to Electoral Area H, its overall median income is lower because of its higher proportion of non-family households (singles or roommates).
Families with children incomes are often higher than those without because the latter includes young couples who typically earn less, or retired couples who live off investments and savings.
7. LOW-INCOME MEASURE The Low-Income Measure (LIM) is a threshold calculated by Statistics Canada that identifies Canadians belonging to a household whose overall incomes are below 50% of median adjusted household income. “Adjusted” refers to the idea that household needs increase as the number of household members increase. In other words, if a person belongs to a household that earns 50% than that community’s median income (after adjustments), then Statistics Canada considers them to be in low-income. Statistics Canada emphasizes that the LIM is not a measure of poverty, but that it identifies those who are substantially worse off than the average.
To reiterate, the LIM refers to people in households, not the households themselves. By doing so, Statistics Canada can identify what percentage of individual children (defined as either 5 or younger, or 17 or younger) live in a family or household that earns below 50% of the median income. Similar results are available for people 18 to 64 and 65 or older.
About 31% of Slocan Valley residents fall below the after-tax LIM. Children 5 or younger are most likely to be in a household below the measure (39%); 35% of children younger than 18 are in a household below the LIM.
Slocan has remarkably higher rates than the sub-regional average. New Denver had more than half of its children 5 or younger under the LIM.

29
Figure E – 7a: Low Income Measure After-Tax (LIM-AT) Prevalence by Cohort, 2015
Source: Statistics Canada
8. EMPLOYMENT Economic development, and the resulting employment opportunities, is a key contributor to the overall demand and supply of housing within a community. However, it is often easy to assume when a labour force statistic (i.e. participation, employment, or unemployment) changes, it automatically suggests a positive or negative trend. The following sections hope to briefly clarify what trends have occurred in the sub-regional labour market.
Labour Force Statistics The Glossary defines participation, employment, and unemployment in regards to summarizing labour force activity. Figure E – 8a summarizes the corresponding 2016 labour force rates for each Slocan Valley community.
In 2016, the labour force totaled 2,845 people (those working or actively seeking work), equating to a 61.8% participation rate. In other words, more people are engaged in the local or broader economy via employment than otherwise. The Sub-Region is one of the only areas in the RDCK to report a slightly higher participation rate than 2006 (61.7%). Most common is that participation declines over time as more residents retire. For instance, Slocan’s rate fell from 66% to 58.1% over the decade.
Within the labour force increase was a proportionally larger rise in unemployed versus employed people resulting in an unemployment rate (10.7%) that is higher than 2006. There was a jump in unemployment after the great recession; 2016 data suggests that labour markets had gradually been returning to pre-recession form. No data existed at the time of this report regarding the local economy pre- and post-COVID-19.

30
Figure E – 8a: Labour Force Statistics, 2016
Source: Statistics Canada
Industry The North American Industry Classification System (NAICS) categorizes employment in the broad industries described in Figure E – 8b. Percentages reflect the proportion of workers in each industry that are renters.
Figure E – 8b: Industry of Employment (NAICS Categories) by Tenure, 2016
Source: Statistics Canada
The three largest Slocan Valley industries based on employment (2016):
(1) Construction – 420 (15.1%); (2) Retail Trade – 345 (12.4%); and (3) Health Care & Social Assistance – 245 (8.8%).
The three greatest increases in employment (2006 to 2016):

31
(1) Mining, Quarrying, and Oil & Gas Extraction – 117% (30 to 65); (2) Wholesale Trade – 88% (40 to 75); and (3) Arts, Entertainment, & Recreation – 45% (90 to 130).
The three greatest decreases in employment (2006 to 2016):
(1) Real Estate and Rental & Leasing – 60% (25 to 10); (2) Manufacturing – 34% (340 to 225); and (3) Accommodation & Food Services – 26% (175 to 130).
Commuting Statistics Canada reported that Slocan Valley had 1,490 usual workers (see Glossary) in 2016, making up about 59% of total employed persons in the same year. Of those workers, their average commuting patterns were as follows:
(1) 30% commuted within their municipality or electoral area; (2) 62% commuted elsewhere within the Regional District or Sub-Region; and (3) 8% travelled outside of the RDCK, whether within or out of province.
Figure E – 8c: Commuting Patterns for Usual Workers, 2016
Source: Statistics Canada
Generally, workers commute within the Regional District. The exception is New Denver that has almost 70% of workers commuting within its own boundaries. Only Electoral Area H has people commuting outside of the RDCK. How people/households commute or travel within their community and others demonstrates an important fact about housing issues; markets are integrated across regions. Households make choices about their living situation that is the result of a compromise between multiple competing preferences: cost, style and size, and proximity to important locations such as school, work, extended family or other social supports, and other services they need to frequent. As a result, housing conditions, availability, prices, and construction in one community can and does impact others.
Given that housing is a choice about shelter as well as location, housing costs are intertwined with transportation costs, and these combined typically represent the two largest components of a households cost of living. All else being equal, housing prices are lower in locations where transportation costs are higher. For households of limited financial capacity, housing options that are accessible to them frequently come hand-in-hand with transportation costs that impose

32
hardship. This is particularly true when it comes to the use of private automobiles; the practical need to own one or more vehicles, and the distance they are driven, can largely negate the savings realised on the housing cost side of the family budget (refer to the discussion under Section 18: Affordability – Energy Poverty).
Where the ultimate goal of improvements to housing affordability is lowering a household’s cost of living, efforts to improving transportation options locally and regionally can be a significant contributor to success. Policies which support a household’s ability to use other modes of transportation, such as active transportation, public transportation, or car-sharing in place of a private vehicle – especially if it allows a them to reduce the number of vehicles they own – can be an important supplement or replacement for direct housing affordability initiatives.

33
HOUSING SECTION SUMMARY
The housing supply is growing
Statistics Canada reports that total number of sub-regional dwellings which serve as a primary residence (“occupied by usual residents” in technical terms) grew about 7% between 2006 and 2016, or 16 units annually. Local government housing starts data since 2016 shows on average slightly higher annual starts than prior.
Rents are increasing
Overall rents grew 12% from 2013 to 2019 after adjustments for inflation, outpacing the estimated growth in incomes during that time.
When adjusted for inflation, single family homes cost 10% less than a decade ago
Single family homes depreciated 9% between 2010 and 2019 in constant dollars, indicating that the real estate appreciation experienced by homeowners over the last decade has been, on average, entirely from inflation.
Commercial short-term rental properties are becoming more popular
About 30 commercial short-term rental units existed as of April 2020, accounting for less than 1% of the total estimated housing demand for the same year.

34
9. DWELLING CHARACTERISTICS Dwelling Type Slocan Valley’s 2016 total dwellings occupied by a usual resident was 2,605, up 7% since 2006. Overall, single-detached homes made up 87% of all dwelling types. Movable dwellings are the dominant form of alternative housing (8%). Total movable dwellings rose 19% since 2006.
New Denver provides the most alternatives to single-detached homes (like semi-detached or row houses). Overall, the diversity of housing types increased slightly in Slocan Valley; the proportion of single-family homes to total dwellings dropped from 90% to 87% between 2006 and 2016.
Figure E – 9a: Proportion of Dwellings by Type, 2016
Source: Statistics Canada
Dwelling Age Most of the Sub-Region’s homes (52%) were built before 1980 – 23% were built before 1960. About 50% of New Denver and Silverton homes are built before 1960. Only Electoral Area H has more dwellings built after 1980.
Figure E – 9b: Proportion of Dwellings by Age, 2016
Source: Statistics Canada
35
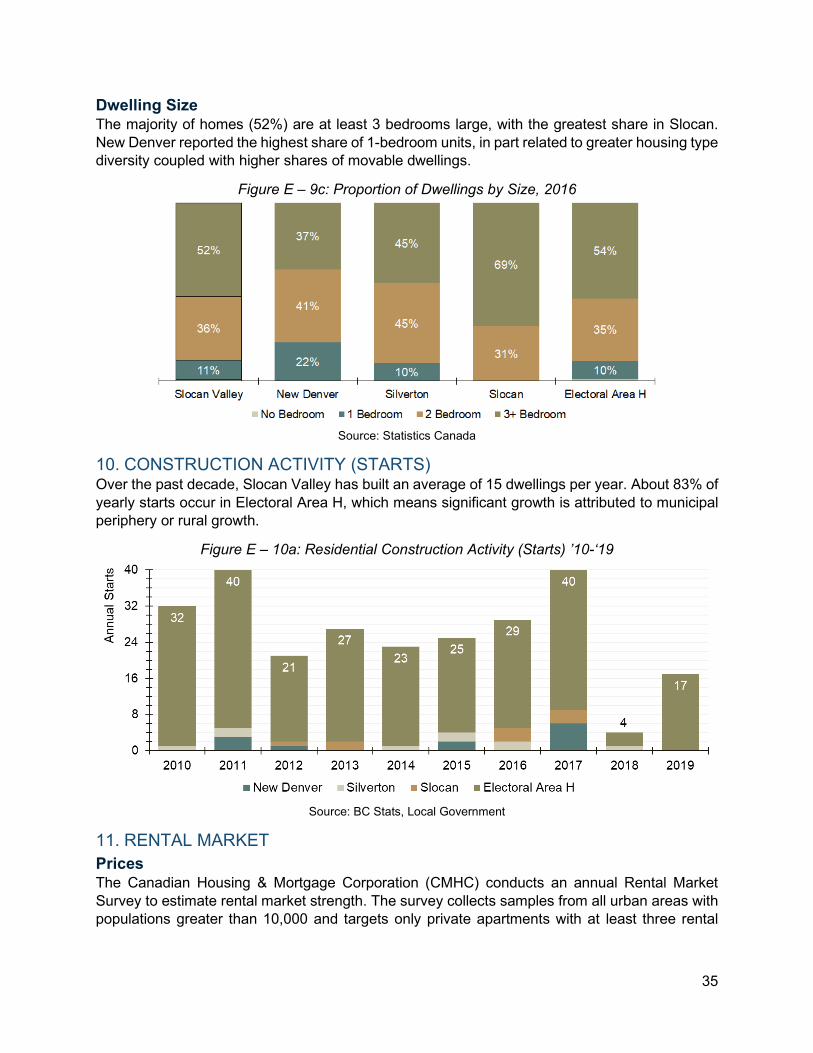
Dwelling Size The majority of homes (52%) are at least 3 bedrooms large, with the greatest share in Slocan. New Denver reported the highest share of 1-bedroom units, in part related to greater housing type diversity coupled with higher shares of movable dwellings.
Figure E – 9c: Proportion of Dwellings by Size, 2016
Source: Statistics Canada
10. CONSTRUCTION ACTIVITY (STARTS) Over the past decade, Slocan Valley has built an average of 15 dwellings per year. About 83% of yearly starts occur in Electoral Area H, which means significant growth is attributed to municipal periphery or rural growth.
Figure E – 10a: Residential Construction Activity (Starts) ’10-‘19
Source: BC Stats, Local Government
11. RENTAL MARKET Prices The Canadian Housing & Mortgage Corporation (CMHC) conducts an annual Rental Market Survey to estimate rental market strength. The survey collects samples from all urban areas with populations greater than 10,000 and targets only private apartments with at least three rental

36
units. Among the information provided are median rental prices for units within the primary rental market (see Glossary).
The City of Nelson is the only geography in the RDCK to qualify for the survey, so any substantial data collection about rents in the RDCK reflects predominantly Nelson trends. Nonetheless, reviewing Nelson rental data is not without merit since the RDCK rental market is interconnected. For instance, changes in rent and the magnitude of these changes can be an indicator of what to expect elsewhere in the region. In addition, changes in vacancy can put pressure on other communities or the secondary market to fulfill demand (discussed in the next section). Therefore, while the specific numbers for Nelson may not directly apply to other locations, it is reasonable to expect trends in those numbers over time may be similar.
Figure E – 11a illustrates Nelson’s historical median rents, adjusted to 2019 dollars, with the percent change from 2013 to 2019 provided for each unit type. It is important to note that the CMHC survey covers all rental units, whether currently occupied or vacant and available. As a result, rent prices reported in this survey are typically lower than the asking rents of currently available units; the inclusion of long-term tenancies whose rents are comparatively low and relatively stable tends to drive down averages. Therefore, this data reflects the overall cost of rental housing, but likely understates the current asking rent for a unit that has recently become available, representing the true cost to people entering or moving within the rental market. CMHC does differentiate between rental prices in larger survey areas and this can help give an impression of local differences. Across all Census Metropolitan Areas in British Columbia, CMHC reports vacant rents are higher than occupied by, on average, 15% for bachelors, 20% for 1-bedrooms, 25% for 2-bedrooms, 31% for 3-bedrooms, and 23% overall. Costs for available units in Nelson may be off by similar margins compared to the average rents reported below.
Figure E – 11a: Median Rent, RDCK (2019 dollars)
Source: CMHC
In 2019, the median unit rented for $863, a 12% increase since 2013 (adjusted for inflation). Two-bedroom unit rents grew 23% over the same period, reaching $975. Three-bedrooms grew slowest at 4% to $1,110.
In September 2020, the Nelson Committee on Homelessness (NCOH) produced their 12th Annual Report Card on Homeless for the City of Nelson, which included a survey of local advertised rental rates across the RDCK. A total of 306 rentals were costed in their research, a significant undertaking. We consider that, at the time of this report, it is the best review of local rental trends available. Results for Slocan Valley are as follows:

37
• Bedroom: $600 • Studio: $900 • 2-Bedroom: $1,433 • 3-Bedroom: $1,100
Comparing NCOH prices to CMHC’s demonstrates a clear gap in what residents are truly experiencing. For instance, NCOH’s 2-bedroom unit cost for the Slocan Valley area is 16% higher than that reported by CMHC, demonstrating a greater higher financial burden imposed on RDCK rental populations. Because of the significant difference, this report uses the NCOH numbers to illustrate gaps in housing affordability, found in Section 18: Affordability. Numbers are rounded for cleaner results. Where some unit rents are not available in the 2020 NCOH report, 2019 figures are used to supplement.
Vacancy The RDCK’s overall vacancy rate (based on Nelson) has been remarkably low. In 2019, it was about 0.5%, with the highest rate (based on available data) occurring in 2013 at 2%. For context, the generally accepted healthy vacancy falls between 3% and 5%; the RDCK’s overall vacancy has not been within this range since CMHC began collecting its data.
Figure E – 11b: Primary Market Vacancy Rate, RDCK
Source: CMHC
Although CMHC data is specific to Nelson, its trend does impact those of the secondary market, both in Nelson and around the RDCK. For example, with a growing rental population and declining vacancy, housing demand will be on the rise (inclusive of apartments). As renters find little to no stock available in the City, they will begin to find alternatives, moving to secondary market units. In other words, declining urban vacancy rates induce demand for substitutes, thereby decreasing secondary market vacancy rates. Unfortunately, the specific rate and how it may change cannot be determined.
12. REAL ESTATE MARKET The real estate market refers to the buying and selling of land and buildings, mostly by individuals or companies who seek stable, permanent tenancy or investment opportunities. Many factors play into the health of the market. Unfortunately, data availability is often only obtainable at provincial or national levels, making it difficult to summarize or predict local trends. Fortunately, sales activity and dwelling prices are available from BC Assessment for municipalities to consider in their housing needs reports.

38
Sales Activity Slocan Valley residential sales have been stable over the last decade, if not improving – greater 2019 sales may be more indicative of more stock to sell or purchase rather than the market “heating up.”
In each year between 2010 and 2019, about 74% of total sub-regional sales occurred in Electoral Area H (due mostly to its size). New Denver, Silverton, and Slocan had 15%, 4%, and 15%, respectively.
Figure E – 12a: Total Residential Sales
Source: BC Assessment
Prices BC Assessment reports sale prices for multiple dwelling types; however, the type of dwellings within each community varies, particularly when comparing urban versus rural. In an effort to relate similar variables, the report uses single-detached housing (the dominant dwelling form across the RDCK) as the measuring stick, illustrated by Figure E – 12b. Prices are in 2019 dollars. For detail about the cost per dwelling type, please see individual community datasheets.
Slocan Valley’s single-family home prices fell 9% since 2010. Silverton and Slocan grew 11% and 15%, respectively, while New Denver and Electoral Area H fell 21% and 8%.
Adjusting prices for inflation (e.g. 2019 dollars) allows the reader to understand the actual overall appreciation or depreciation in housing in real terms. For instance, Silverton’s unadjusted prices grew 35% since 2010, however inflation accounted for over half of this appreciation.
Figure E – 12b: Single-Detached Dwelling Price (2019 dollars) & Percent Change ’10-‘19
Source: BC Assessment

39
13. SHORT-TERM RENTALS Short-term rentals (STRs) have grown as a more fluid and flexible use of residential dwelling space for temporary accommodations that blurs the line between rental housing and commercial hospitality.
Alongside this market growth is concern about the impact of STR units on traditional residential market sector; specifically, whether STRs are removing housing stock from the traditional market, reducing supply and increasing the difficulty for resident households to find suitable places to live.
The following discussion reports on the overall change in STR units and aims to estimate the maximum units potentially removed from the market. To do so required the use of third-party data provided by the company AirDNA, which compiles monthly data on STR markets, scraped from the public-facing websites of several STR platforms, including AirBnB. This report’s analysis combed said data and applied the following definitions to the exercise:
Total market: all short-term rental units that were active (meaning, reserved or available at least one day in a month) within a given time period.
Commercial market: all short-term rental units that were active within a given time period, but are available and/or reserved more than 50 percent of the days that they have been active. The 50 percent cut off is meant to separate residents using the service to generate supplemental income from units operating primarily as STRs in an income/investment business. The commercial market only considers entire homes or apartments, not listings that are hotels, private rooms, or other.
Shown in Figure E – 13a, the Sub-Region’s STR market hit a maximum 82 available units in July 2019. In April 2020, the last available reported month for this study, 48 STR units were active (booked or available at least one day of the month) on their respective platforms. In that same month, estimates indicate a maximum 30 units may be commercial properties, or 63% of listings. Contextualized, 30 units is less than 1% of the estimated 2020 sub-regional housing demand.
Figure E – 13a: Total Market STR Units & Estimated Commercial Units
Source: AirDNA

40
Figure E – 13b: Historical Unit Occupancy of Short-Term Rentals
Source: AirDNA
Figure E - 13b illustrates monthly occupancy of active short-term rentals. Occupancy refers to the total days reserved divided by the total days the listing was available in that month. Occupancy peaks around July of each year (with some variation), corresponding with summer vacation. Occupancy normally rebounds as after April; the impacts of COVID-19 are not yet visible. Generally speaking, COVID-19 has created a short-term decrease in STR activity across the globe, however as the pandemic becomes increasing under control it appears STR markets are returning to their previous state.

41
HOUSING NEED & AFFORDABILITY ANALYSIS SECTION SUMMARY
There is no primary provider of non-market housing facilities and programs
New Denver, Slocan, and Electoral Area H each contribute to non-market housing and programs. Neither of them has emergency/homeless shelters or transitional/supported living housing affiliated with BC Housing.
Historical annual construction starts may not be enough to meet future annual demand
Housing projections to 2025 anticipate average annual deficit of 1 unit annually, suggesting that demand and supply may remain fairly close of the short-term. Nevertheless, this only accounts for permanent households; data is unavailable to project the possible demand of non-permanent households.
Proportionally, housing is less overcrowded and requires fewer major repairs
New homes are larger and do not yet require substantial repairs, though this does often increase the cost of housing. Nevertheless, rates of unaffordability have fallen. Declining average household sizes are contributing to the reduction of need for bedrooms and thus reducing overcrowding.
Lone parent and low income households are struggling to reasonably afford market housing
Calculated using Statistics Canada’s 30% affordability threshold, lone parent and low income households can barely afford a bachelor apartment and cannot afford more than a movable dwelling, emphasizing the importance of non-market support.
Vehicle fuel costs are putting significant financial pressure on Slocan Valley households
The average sub-regional household can reasonably afford their utility bill; however, when gas expenses are considered, annual energy costs triple. The average household is in energy poverty due to the costs of transportation.

42
14. NON-MARKET HOUSING SUPPLY & PROGRAMS BC Housing provides annual reports regarding the provision of non-market housing across communities like Central Kootenay. The report, made available in March 2020, details the total persons or households using forms of emergency shelters, transitional and assisted living, independent social housing units, or private market rental assistance programs. The proceeding subsections summarize the current stock of these facilities and program offerings and number of waitlists corresponding to population need.
Facilities & Programs As of March 31, 2020, Slocan Valley does not provide any emergency shelter or homeless housing; these are located entirely within the City of Nelson. New Denver, Slocan, and Electoral Area H each contribute to non-market housing, specifically for independent social housing and private market rental assistance.
Figure E – 14a: Non-Market Housing Facilities & Programs, March 31 2020
Source: BC Housing
Non-Market Housing Waitlist As of January 2020, the BC Housing wait list for subsidised units in Slocan Valley had 8 applications, including: 2 families, 1 resident with a disability or disabilities, 3 seniors, and 2 units that are wheelchair modified. The Sub-Region accounts for 7% of total wait list applicants.
The totals provided only reflect active applications and do not represent the true total number of people who can or should be accessing services but are not, either due to stigmatization of accessing services or feeling disheartened by long wait list numbers or times.
Figure E – 14b: Non-Market Housing Waitlist by Need, January 31 2020
Source: BC Housing

43
15. MARKET HOUSING DEMAND & SUPPLY Demand Household growth, presented in Section 4: Historical & Anticipated Households, is an important fundamental component of housing demand: by definition a household requires an available dwelling to occupy. Household projections are therefore synonymous with the increase in housing stock required to accommodate expected population changes (note overall housing demand is also influenced by economic and fiscal factors).
This section expands on the household projections of Section 4 to provide an expectation of the unit sizes these future households are likely to require. Figure E – 15a illustrates this demand for Slocan Valley and its communities. Please note that demand calculations by unit sizes are based on the assumption that future growth will reflect historical trends in terms of the sizes of units that households have occupied. These expectations may therefore be inaccurate if other demographic, cultural, economic, or social factors deviate from the past.
Figure E – 15a: Housing Demand by 2025 & Change from 2016-2025
Source: Statistics Canada
Overall, Slocan Valley may demand 70 no bedroom (bachelors), 385 1-bedroom, 1,005 2-bedroom, and 1,520 3-bedroom units by 2025, or 200 more units total (2,980) than 9 years prior.
For clarity, these projections are not commentary on the form of housing, only its size. A 3-bedroom unit does not necessarily mean a single-detached home; other housing formats can provide the necessary unit sizes. Furthermore, demand projections only speak to market housing. Non-market housing preferences differ; smaller unit sizes are in greater demand due to greater affordability constraints by those seeking non-market housing.
Supply Projections of future housing supply are generated based on past trends in building permit activity. It is important to note that this report’s projection of housing supply is a simplification of historical trends; supply is the result of several local, provincial, and national trends which cannot be quantified within the scope of this report. Briefly, supply calculations apply 10-year moving averages of year-to-year construction totals from the most recent census period onwards and uses Statistics Canada’s historical distribution of unit sizes to determine how the total unit count is divided in each projection year.
By subtracting demand from supply, the possible gap in housing can be estimated, as shown in Figure E – 15b below. Please note that the gap represents variation from the base year of 2016.

44
For example, a gap of zero suggests that market conditions have not changed (for better or for worse); more demand than supply may suggest increasing prices and lower vacancy.
Figure E – 15b: Housing Supply Surplus (+) or Deficit (-) by 2025
Source: Statistics Canada, Local Government, BC Stats
By 2025, Slocan Valley may have a deficit of about 10 (about 0.3% of housing demand). The local population may demand about 22 units annually while projections anticipate yearly unit growth of about 21 dwellings.
16. MARKET HOUSING CONDITION A dwelling’s condition is normally described using Statistics Canada’s components of “Core Housing Need:” suitability, adequacy, and affordability. The Glossary provides definitions for each of these; however, a quick guide is that unsuitable means overcrowded, inadequate means a need for major repair, and unaffordable is when shelter costs exceed 30% of before tax household earnings.
Please note that data is unavailable for Silverton and Slocan.
Unsuitable Housing About 3.5% of households (85) were living in an overcrowded accommodation in 2016. Electoral Area H has the highest need of reporting communities. With a household size at 2.2 and the greatest percentage of families with children, Area H is likely to have greater total bedroom needs. New Denver reports the highest rate of overcrowding for owner households.
Overcrowding is the result of multiple factors, including a community’s average household size; as the number of people in a household decreases, so does the demand for more bedrooms. Mirroring its reduced average size, Slocan Valley’s total unsuitable homes and its rate of unsuitability decreased by about half since 2006.

45
Figure E – 16a: Unsuitable Housing by Tenure, 2016
Source: Statistics Canada
Inadequate Housing About 11% of households (275) lived a dwelling requiring major repair in 2016, a decrease since 2006.
The distribution of dwelling age is often the best indicator of the need for repair (the older the home, the more likely it requires repair). That said, Electoral Area H has the newest housing stock (built post 1980) within the Sub-Region yet reports higher total and renter inadequacy rates.
New Denver has the highest inadequacy for owner households, but no structural issues for renters.
Figure E – 16b: Inadequate Housing by Tenure, 2016
Source: Statistics Canada
Unaffordable Housing In 2016, 490 households reported living in an accommodation that pushes them outside their financial means (using more than 30% of their before-tax household income on shelter costs), equating to 20% of households. Renters, who as a whole earn less than owners, are much more likely to allocate unreasonable amounts to shelter (34%); New Denver’s renter unaffordability rate was 50%.
Greatest owner challenges are in Electoral Area H. Again, Silverton and Slocan do not have available data and are not included in sub-regional calculations.

46
Overall, total unaffordable housing and the rate of unaffordability decreased since 2006, suggesting that the Sub-Region has generally more attainable housing than previously.
Figure E – 16c: Unaffordable Housing by Tenure, 2016
Source: Statistics Canada
17. CORE HOUSING NEED Overall Core Housing Need If a household is in core housing need, it means that they experience at least one of the above hardships with one major difference: affordability is not only whether expenses surpass the 30% threshold, but also takes into account whether an affordable alternative option exists in the market (given a household’s needs). Simply, core housing need filters out those who voluntarily spend more money on housing because their means (generally) allow them to. For instance, a household earning $300,000 would likely be able to spend a significant proportion of their income on housing without seriously impacting their ability to afford other necessities. Unfortunately, Core Housing Need does still undercount total households experiencing financial hardship due to housing, particularly owner households who may pay more than they can afford to get their foot in the market, receive higher quality, or simply meet their nuanced family needs.
In 2016, 29% of households (at least 625) were in core housing need, a decrease from 2006’s 34%, indicating an overall decade improvement. Like sections prior, renter households experience greater difficulty, largely due to lower disposable incomes. Renter households had slightly higher rates of core housing need than 2006.
What is common for communities is that core housing need rates fall below that of unaffordability, demonstrating that there are many households choosing to purchase or rent accommodation that surpasses their ideal budget. In the case of Slocan Valley, core housing need is greater, suggesting that many households do not have alternatives and possibly live in circumstances that have more than one core housing issue (suitability, adequacy, or affordability).

47
Figure E – 17a: Households in Core Housing Need by Tenure, 2016
Source: Statistics Canada
Extreme Core Housing Need Extreme core housing need adjusts the original definition by amending the 30% threshold to 50% in an effort to determine how many households are facing substantial financial hardship. In 2016, extreme need was at about 10% (215 households), about the same as 2006. Renters continue to be most impacted relative to their totals but seem to be have improving circumstances (dropping from 27% to 17%).
Figure E – 17b: Households in Extreme Core Housing Need by Tenure, 2016
Source: Statistics Canada
18. AFFORDABILITY Since it is impossible to express every household’s experience, this report developed specific income categories based on the sub-regional median before-tax household income. The categories are defined as follows:
• Very low income – making less than 50% of median income • Low income – making between 50 and 80% of median income • Moderate income – making between 80 and 120% of median income • Above moderate income – making between 120 and 150% of median income • High income – those making above 150% of median income
The report applies the following steps to calculate affordable house and rental prices:

48
(1) determine the maximum achievable income in a particular income category range; (2) calculate an affordable monthly rent or dwelling price for said category using Statistics
Canada’s 30% affordability; and (3) compare these calculations to median market rents and median house prices.
The proceeding tables and figures are the combination of multiple data sources (BC Assessment, CMHC, Statistics Canada, and custom tabulations from Environics Analytics). Each source uses different ways to collect, organize, or define its data. Efforts have been taken to make the data as compatible as possible, results should not be taken as absolute fact; rather, they are estimates intended to illustrate a high-level trend. The following rules and assumptions were used for this exercise:
• values are rounded for readability; • rental rates are based a scan of current asking rates in the entire RDCK (determining
specific unit prices per community was not feasible); • estimated dwelling values are derived from an affordable mortgage payment with a 10%
down payment, a 3% interest rate, and a 25-year amortization period; • median income will grow by the historical growth rate until 2019; and • households will spend 6% of their income on utilities.
Calculations do not consider the added cost of property taxes or insurance, which can quickly change an accommodation from affordable to unaffordable.
Rental Market Affordability Figures A - 18a and 18b illustrate how the affordable rents for each median family type and income category defined above compare to the actual costs of renting.
Generally, couples and above moderate income households earn enough to comfortably rent all unit sizes. Higher earning moderate income earners can reasonably afford all other units.
Lone parents and low income households cannot afford the average RDCK rent of any unit size. If they stretch their budgets it is possible. This is far from an option for singles, roommates, or very low income people.
Figure E – 18a: 2019 Unit Rents v. Affordable Rent Price by Family Type
Figure E – 18b: 2019 Unit Rents v. Affordable Rent Price by Income Category
Source: CMHC, Local Listings, Statistics Canada Source: CMHC, Local Listings, Statistics Canada
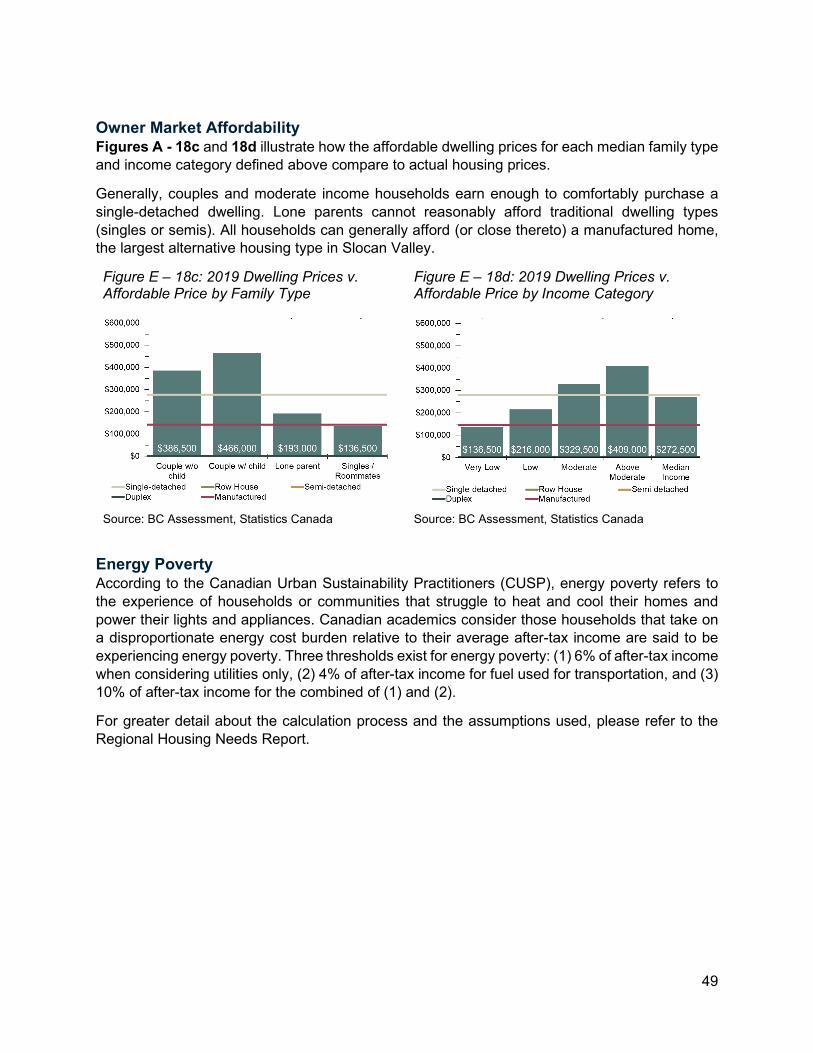
49
Owner Market Affordability Figures A - 18c and 18d illustrate how the affordable dwelling prices for each median family type and income category defined above compare to actual housing prices.
Generally, couples and moderate income households earn enough to comfortably purchase a single-detached dwelling. Lone parents cannot reasonably afford traditional dwelling types (singles or semis). All households can generally afford (or close thereto) a manufactured home, the largest alternative housing type in Slocan Valley.
Figure E – 18c: 2019 Dwelling Prices v. Affordable Price by Family Type
Figure E – 18d: 2019 Dwelling Prices v. Affordable Price by Income Category
Source: BC Assessment, Statistics Canada Source: BC Assessment, Statistics Canada
Energy Poverty According to the Canadian Urban Sustainability Practitioners (CUSP), energy poverty refers to the experience of households or communities that struggle to heat and cool their homes and power their lights and appliances. Canadian academics consider those households that take on a disproportionate energy cost burden relative to their average after-tax income are said to be experiencing energy poverty. Three thresholds exist for energy poverty: (1) 6% of after-tax income when considering utilities only, (2) 4% of after-tax income for fuel used for transportation, and (3) 10% of after-tax income for the combined of (1) and (2).
For greater detail about the calculation process and the assumptions used, please refer to the Regional Housing Needs Report.

50
Figure E – 18e: Energy Poverty by Utility Type, 2019 dollars
(red: in energy poverty, green: not in energy poverty)
Source: Statistics Canada, Environics Analytics
Based on their respective median after-tax household incomes, utilities are “affordable” for both available communities. When considering fuel, the communities spend above their means. When the two are combined, this pushes the communities into energy poverty. On average, New Denver and Electoral Area H households use 11% of their after-tax income for energy expenses.
Figure E – 18f and 18g illustrate how the average annual energy cost (utilities and vehicle fuel combined) compares to the maximum amount of an affordable budget for a household’s energy expenses, based on the type of family or income category within said household. It is important to note that the value compared is an average. In many cases households will spend less either by ability to upgrade their homes to be more efficient or by necessity (for example, a low-income home may have to decide what utilities to sacrifice when budgets are tight). Conversely, some may pay more as energy expenses are often an afterthought of living costs (rent and mortgages are primary concerns) or they have larger household sizes that draw more energy. As such, please consider the following a high-level review.
Generally, no households can reasonably afford their energy expenses, not even couples with children who are often the most financially capable to meet their needs. Single or very low-income households may potentially pay almost 3 times more than they can actually afford if their expenses matched the average.
Figure E – 18f: 2019 Avg Total Energy Cost v. Affordable Budget by Family Type
Figure E – 18g: 2019 Avg Total Energy Cost v. Affordable Budget by Income Group
Source: Environics Analytics, Statistics Canada Source: Environics Analytics, Statistics Canada

51
Fuel costs are the most significant contributor to overpaying on energy expenses. In the RDCK, transportation by car is often the only way to access services, work, and social events. When comparing only utility costs (no fuel) to affordable budgets for utility expenses, we see a vastly different picture. Figure E – 18h and 18i demonstrate that couples or moderate income households can afford their utilities. The median household is just shy of meeting their budget. Unfortunately, single and very low-income households are still far from meeting their budget (6% of average after-tax income).
Figure E – 18h: 2019 Avg Utility Cost v. Affordable Budget by Family Type
Figure E – 18i: 2019 Avg Utility Cost v. Affordable Budget by Income Group
Source: Environics Analytics, Statistics Canada Source: Environics Analytics, Statistics Canada

52
GLOSSARY “activity limitation” refers to difficulties that people have in carrying out daily activities such as hearing, seeing, communicating, or walking. Difficulties could arise from physical or mental conditions or health problems.
“bedrooms” refer to rooms in a private dwelling that are designed mainly for sleeping purposes even if they are now used for other purposes, such as guest rooms and television rooms. Also included are rooms used as bedrooms now, even if they were not originally built as bedrooms, such as bedrooms in a finished basement. Bedrooms exclude rooms designed for another use during the day such as dining rooms and living rooms even if they may be used for sleeping purposes at night. By definition, one-room private dwellings such as bachelor or studio apartments have zero bedrooms;
“census” means a census of population undertaken under the Statistics Act (Canada);
“census division (CD)” means the grouping of neighbouring municipalities, joined together for the purposes of regional planning and managing common services – Regional District of Central Kootenay is a census division;
“census family” is defined as a married couple and the children, if any, of either and/or both spouses; a couple living common law and the children, if any, of either and/or both partners; or a lone parent of any marital status with at least one child living in the same dwelling and that child or those children. All members of a particular census family live in the same dwelling. A couple may be of opposite or same sex;
“census subdivision (CSD)” is the general term for municipalities (as determined by provincial/territorial legislation) or areas treated as municipal equivalents for statistical purposes (i.e. electoral areas);
“child” refers to any unmarried (never married or divorced) individual, regardless of age, who lives with his or her parent(s) and has no children in the same household.
“commuting destination” refers to whether or not a person commutes to another municipality (i.e., census subdivision), another census division or another province or territory. Commuting refers to the travel of a person between his or her place of residence and his or her usual place of work;
“core housing need” is when housing falls below at least one of the adequacy, affordability or suitability standards and it would have to spend 30% or more of its total before-tax income to pay the median rent of alternative local housing that meets all three housing standards;
“adequate housing” means that, according to the residents within the dwelling, no major repairs are required for proper use and enjoyment of said dwelling;
“affordable housing” means that household shelter costs equate to less than 30% of total before-tax household income;
“suitable housing” means that a dwelling has enough bedrooms for the size and composition of resident households according to National Occupancy Standard (NOS) requirements;
53
“dissemination area (DA)” refers to a small, relatively stable geographic unit composed of one or more adjacent dissemination blocks with an average population of 400 to 700 persons based on data from the previous Census of Population Program. It is the smallest standard geographic area for which all census data are disseminated. DAs cover all the territory of Canada;
“dwelling” is defined as a set of living quarters;
“dwelling type” means the structural characteristics or dwelling configuration of a housing unit, such as, but not limited to, the housing unit being a single-detached house, a semi-detached house, a row house, an apartment in a duplex or in a building that has a certain number of storeys, or a mobile home;
“economic family” refers to a group of two or more persons who live in the same dwelling and are related to each other by blood, marriage, common-law union, adoption or a foster relationship. A couple may be of opposite or same sex. By definition, all persons who are members of a census family are also members of an economic family;
“employment rate” means, for a particular group (age, sex, marital status, geographic area, etc.), the number of employed persons in that group, expressed as a percentage of the total population in that group;
“equity seeking groups” are communities that face significant collective challenges in participating in society. This marginalization could be created by attitudinal, historic, social and environmental barriers based on age, ethnicity, disability, economic status, gender, nationality, race, sexual orientation and transgender status, etc. Equity-seeking groups are those that identify barriers to equal access, opportunities and resources due to disadvantage and discrimination and actively seek social justice and reparation;
“extreme core housing need” has the same meaning as core housing need except that the household has shelter costs for housing that are more than 50% of total before-tax household income;
“family size” refers to the number of persons in the family;
“full-time equivalent (FTE) student” represents all full-time and part-time enrolments, converted to represent the number of students carrying a full-time course load. One student whose course load is equal to the normal full-time number of credits or hours required in an academic year would generate 1.0 Student FTE. A student taking one-half of a normal course load in one year would be a 0.5 Student FTE;
“household” refers to a person or group of persons who occupy the same dwelling and do not have a usual place of residence elsewhere in Canada or abroad;
“household maintainer” refers to whether or not a person residing in the household is responsible for paying the rent, or the mortgage, or the taxes, or the electricity or other services or utilities. Where a number of people may contribute to the payments, more than one person in the household may be identified as a household maintainer;
“household size” refers to the number of persons in a private household;

54
“household type” refers to the differentiation of households on the basis of whether they are census family households or non-census-family households. Census family households are those that contain at least one census family;
“immigrant” refers to a person who is, or who has ever been, a landed immigrant or permanent resident. Such a person has been granted the right to live in Canada permanently by immigration authorities;
“Indigenous identity” refers to whether the person identified with the Aboriginal peoples of Canada. This includes those who are First Nations (North American Indian), Métis or Inuk (Inuit) and/or those who are Registered or Treaty Indians (that is, registered under the Indian Act of Canada), and/or those who have membership in a First Nation or Indian band;
“labour force” refers to persons who, during the week of Sunday, May 1 to Saturday, May 7, 2016, were either employed or unemployed;
“living wage” means the hourly amount that each of two working parents with two young children must earn to meet their basic expenses (including rent, childcare, food, and transportation) once government taxes, credits, deductions, and subsidies have been taken into account;
“low-income measure, after tax,” refers to a fixed percentage (50%) of median adjusted after-tax income of private households. The household after-tax income is adjusted by an equivalence scale to take economies of scale into account. This adjustment for different household sizes reflects the fact that a household's needs increase, but at a decreasing rate, as the number of members increases;
“migrant” refers to a person who has moved from their place of residence, of which the origin is different than the destination community they reported in. Conversely, a non-migrant is a person who has moved within the same community;
“mobility status, one year” refers to the status of a person with regard to the place of residence on the reference day in relation to the place of residence on the same date one year earlier;
“NAICS” means the North American Industry Classification System (NAICS) Canada 2012, published by Statistics Canada;
“NAICS industry” means an industry established by the NAICS;
“participation rate” means the total labour force in a geographic area, expressed as a percentage of the total population of the geographic area;
“primary rental market” means a market for rental housing units in apartment structures containing at least 3 rental housing units that were purpose-built as rental housing;
“precarious housing” means housing that is not affordable, is overcrowded, is unfit for habitation, or is occupied through unstable tenancy;
“secondary rental market” means a market for rental housing units that were not purpose-built as rental housing;
“shelter cost” refers to the average or median monthly total of all shelter expenses paid by households that own or rent their dwelling. Shelter costs for owner households include, where applicable, mortgage payments, property taxes and condominium fees, along with the costs of

55
electricity, heat, water and other municipal services. For renter households, shelter costs include, where applicable, the rent and the costs of electricity, heat, water and other municipal services.
“short-term rental” means the rental of a housing unit, or any part of it, for a period of less than 30 days;
“subsidized housing” refers to whether a renter household lives in a dwelling that is subsidized. Subsidized housing includes rent geared to income, social housing, public housing, government-assisted housing, non-profit housing, rent supplements and housing allowances;
“tenure” refers to whether the household owns or rents their private dwelling. The private dwelling may be situated on rented or leased land or be part of a condominium. A household is considered to own their dwelling if some member of the household owns the dwelling even if it is not fully paid for, for example if there is a mortgage or some other claim on it. A household is considered to rent their dwelling if no member of the household owns the dwelling;
“unemployment rate” means, for a particular group (age, sex, marital status, geographic area, etc.), the unemployed in that group, expressed as a percentage of the labour force in that group;
“visible minority” refers to whether a person belongs to a visible minority group as defined by the Employment Equity Act and, if so, the visible minority group to which the person belongs. The Employment Equity Act defines visible minorities as "persons, other than Aboriginal peoples, who are non-Caucasian in race or non-white in colour.”

56
APPENDIX A – New Denver Data Tables Historical & Anticipated Population & Households Housing Needs Report Regulation (HNRR) Section 3 (1)(a)(i – iv), (1)(b), & (2)(a –g)* Source: Statistics Canada, BC Stats
* distributions graphically represented in report Indigenous Identity Source: Statistics Canada
Mobility HNRR Section 3 (1)(a)(x) – Source: Statistics Canada
Post-Secondary Enrollment HNRR Section 3(1)(c) – Source: AEST [not applicable] No enrollment data available for the community Homelessness HNRR Section 3(1)(d) – Source: BC Housing [not applicable] Homelessness counts only available for the City of Nelson
2006 2011 2016 2017 2018 2019 2020 2021 2022 2023 2024 2025Total 530 505 485 495 505 515 525 505 500 495 490 485 -8.5% 0.0%
< 14 yrs 60 50 50 55 60 65 70 45 40 35 30 25 -16.7% -50.0%15 to 19 yrs 15 20 10 10 10 10 10 15 15 15 15 15 -33.3% 50.0%20 to 24 yrs 15 15 15 15 15 15 15 5 5 5 5 5 0.0% -66.7%25 to 64 yrs 295 270 215 210 205 200 195 200 195 190 185 180 -27.1% -16.3%65 to 84 yrs 125 125 165 175 185 195 205 205 210 215 220 225 32.0% 36.4%85+ yrs 20 25 30 30 30 30 30 35 35 35 35 35 50.0% 16.7%
Median Age 51.7 54.3 58.5 59.7 60.8 62.0 63.1 64.3 66.4 68.5 70.7 72.8 13.2% 24.5%Average Age 50.0 51.6 53.6 53.5 53.4 53.4 53.3 55.6 56.4 57.2 58.0 58.8 7.2% 9.7%Households (HHs) 290 245 275 280 285 290 295 305 300 295 290 285 -5.2% 3.6%Average HH Size 1.8 2.1 1.8 1.8 1.8 1.8 1.8 1.7 1.7 1.7 1.7 1.7 -3.5% -3.5%
%∆ '16-'25
%∆ '06-'16
Total Total Total Owners Oweners Owners Renters Renters Renters2006 2011 2016 2006 2011 2016 2006 2011 2016
Total Population 455 460 430 290 430 265 170 25 170Indigenous Identity 0 0 10 0 0 0 0 0 10Non-Indigenous Identity 460 460 425 285 430 265 170 25 160
Total Total Total Owners Oweners Owners Renters Renters Renters2006 2011 2016 2006 2011 2016 2006 2011 2016
Total Population 100% 100% 100% 100% 100% 100% 100% 100% 100%Indigenous Identity 0.0% 0.0% 2.3% 0.0% 0.0% 0.0% 0.0% 0.0% 5.9%Non-Indigenous Identity 101.1% 100.0% 98.8% 98.3% 100.0% 100.0% 100.0% 100.0% 94.1%
Total Total Total Owners Oweners Owners Renters Renters Renters2006 2011 2016 2006 2011 2016 2006 2011 2016
Total Population 450 455 425 290 430 265 160 30 160Non-Mover 395 445 350 285 420 230 110 30 125Mover 50 10 75 0 10 35 50 0 40
Non-Migrant 20 0 20 0 0 15 20 0 0Migrants 25 10 55 0 10 20 30 0 35
Internal Migrants 25 0 55 0 0 20 25 0 35Intraprovincial Migrant 25 0 40 0 0 15 30 0 25Interprovincial Migrant 0 0 15 0 0 10 0 0 0
External Migrant 0 0 0 10 0 0 0 0 0
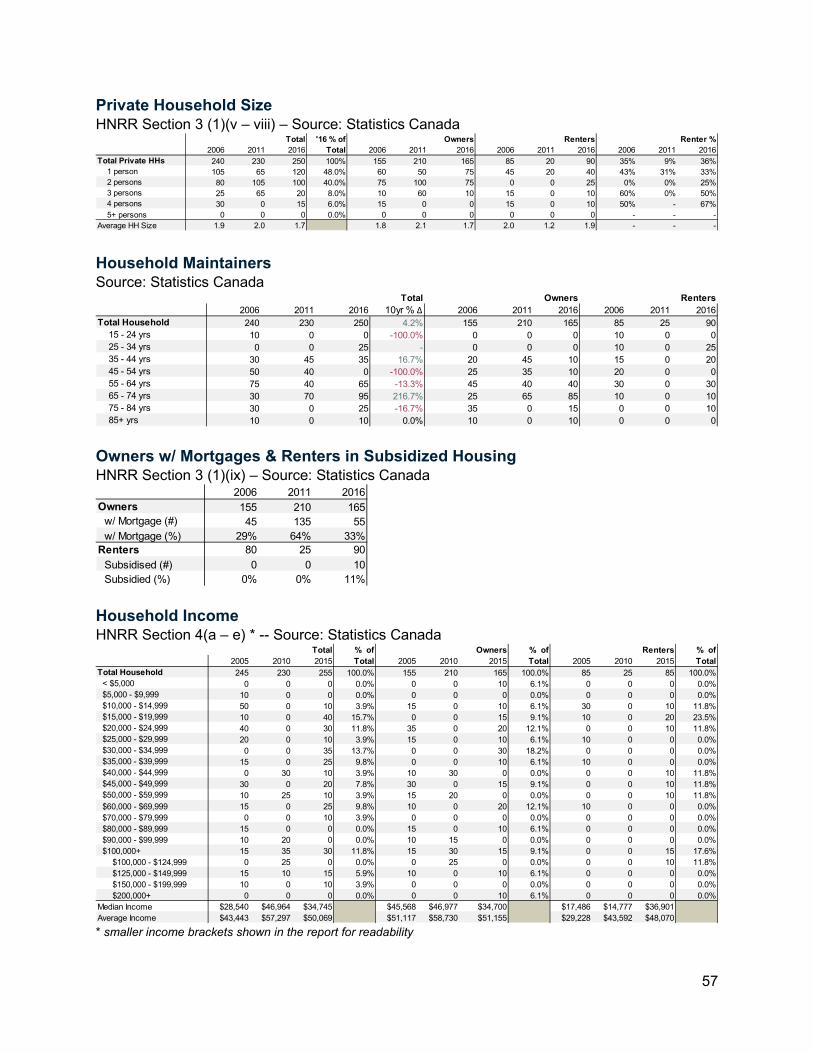
57
Private Household Size HNRR Section 3 (1)(v – viii) – Source: Statistics Canada
Household Maintainers Source: Statistics Canada
Owners w/ Mortgages & Renters in Subsidized Housing HNRR Section 3 (1)(ix) – Source: Statistics Canada
Household Income HNRR Section 4(a – e) * -- Source: Statistics Canada
* smaller income brackets shown in the report for readability
Total Total Total Owners Oweners Owners Renters Renters Renters Renters Renters Renter %2006 2011 2016 2006 2011 2016 2006 2011 2016 2006 2011 2016
Total Private HHs 240 230 250 100% 155 210 165 85 20 90 35% 9% 36%1 person 105 65 120 48.0% 60 50 75 45 20 40 43% 31% 33%2 persons 80 105 100 40.0% 75 100 75 0 0 25 0% 0% 25%3 persons 25 65 20 8.0% 10 60 10 15 0 10 60% 0% 50%4 persons 30 0 15 6.0% 15 0 0 15 0 10 50% - 67%5+ persons 0 0 0 0.0% 0 0 0 0 0 0 - - -
Average HH Size 1.9 2.0 1.7 1.8 2.1 1.7 2.0 1.2 1.9 - - -
'16 % of Total
Total Total Total Total Owners Oweners Owners Renters Renters Renters2006 2011 2016 10yr % ∆ 2006 2011 2016 2006 2011 2016
Total Household 240 230 250 4.2% 155 210 165 85 25 9015 - 24 yrs 10 0 0 -100.0% 0 0 0 10 0 025 - 34 yrs 0 0 25 - 0 0 0 10 0 2535 - 44 yrs 30 45 35 16.7% 20 45 10 15 0 2045 - 54 yrs 50 40 0 -100.0% 25 35 10 20 0 055 - 64 yrs 75 40 65 -13.3% 45 40 40 30 0 3065 - 74 yrs 30 70 95 216.7% 25 65 85 10 0 1075 - 84 yrs 30 0 25 -16.7% 35 0 15 0 0 1085+ yrs 10 0 10 0.0% 10 0 10 0 0 0
2006 2011 2016Owners 155 210 165
w/ Mortgage (#) 45 135 55w/ Mortgage (%) 29% 64% 33%
Renters 80 25 90Subsidised (#) 0 0 10Subsidied (%) 0% 0% 11%
Total Total Total Owners Oweners Owners Renters Renters Renters2005 2010 2015 2005 2010 2015 2005 2010 2015
Total Household 245 230 255 100.0% 155 210 165 100.0% 85 25 85 100.0%< $5,000 0 0 0 0.0% 0 0 10 6.1% 0 0 0 0.0%$5,000 - $9,999 10 0 0 0.0% 0 0 0 0.0% 0 0 0 0.0%$10,000 - $14,999 50 0 10 3.9% 15 0 10 6.1% 30 0 10 11.8%$15,000 - $19,999 10 0 40 15.7% 0 0 15 9.1% 10 0 20 23.5%$20,000 - $24,999 40 0 30 11.8% 35 0 20 12.1% 0 0 10 11.8%$25,000 - $29,999 20 0 10 3.9% 15 0 10 6.1% 10 0 0 0.0%$30,000 - $34,999 0 0 35 13.7% 0 0 30 18.2% 0 0 0 0.0%$35,000 - $39,999 15 0 25 9.8% 0 0 10 6.1% 10 0 0 0.0%$40,000 - $44,999 0 30 10 3.9% 10 30 0 0.0% 0 0 10 11.8%$45,000 - $49,999 30 0 20 7.8% 30 0 15 9.1% 0 0 10 11.8%$50,000 - $59,999 10 25 10 3.9% 15 20 0 0.0% 0 0 10 11.8%$60,000 - $69,999 15 0 25 9.8% 10 0 20 12.1% 10 0 0 0.0%$70,000 - $79,999 0 0 10 3.9% 0 0 0 0.0% 0 0 0 0.0%$80,000 - $89,999 15 0 0 0.0% 15 0 10 6.1% 0 0 0 0.0%$90,000 - $99,999 10 20 0 0.0% 10 15 0 0.0% 0 0 0 0.0%$100,000+ 15 35 30 11.8% 15 30 15 9.1% 0 0 15 17.6%
$100,000 - $124,999 0 25 0 0.0% 0 25 0 0.0% 0 0 10 11.8%$125,000 - $149,999 15 10 15 5.9% 10 0 10 6.1% 0 0 0 0.0%$150,000 - $199,999 10 0 10 3.9% 0 0 0 0.0% 0 0 0 0.0%$200,000+ 0 0 0 0.0% 0 0 10 6.1% 0 0 0 0.0%
Median Income $28,540 $46,964 $34,745 $45,568 $46,977 $34,700 $17,486 $14,777 $36,901Average Income $43,443 $57,297 $50,069 $51,117 $58,730 $51,155 $29,228 $43,592 $48,070
% of Total
% of Total
% of Total

58
Labour Force HNRR Section 5(a) & Section 7(b – c) – Source: Statistics Canada
NAICS Industry Employment HNRR Section 5(b) – Source: Statistics Canada
Commuting HNRR Section 7(d – g) – Source: Statistics Canada
Housing – Structural Types HNRR Section 6 (1)(a – b) – Source: Statistics Canada
Total Total Total Owners Oweners Owners Renters Renters Renters2006 2011 2016 2006 2011 2016 2006 2011 2016
Total Population (15+ yrs) 385 420 385 265 390 260 120 25 130In Labour Force 175 195 195 105 190 100 70 0 95
Employed 160 175 185 90 175 95 70 0 90Unemployed 20 0 15 20 0 10 10 0 10
Not In Labour Force 210 225 185 160 200 155 50 25 35Participation Rate (%) 46.8 46.4 50.6 39.6 48.7 39.2 60.0 0.0 73.1Employment Rate (%) 41.6 41.7 46.8 32.1 43.6 37.3 56.0 0.0 69.2Unemployment Rate (%) 11.1 0.0 5.1 14.3 0.0 10.0 0.0 0.0 0.0
Total Total Total Owners Oweners Owners Renters Renters Renters2006 2011 2016 2006 2011 2016 2006 2011 2016
Labour Force 175 180 195 100.0% 105 180 100 75 0 95Agriculture, Forestry, Fishing, & Hunting 10 0 0 0.0% 0 0 0 10 0 0Mining, Quarrying, and Oil & Gas Extraction 20 0 15 7.7% 10 0 10 10 0 10Utilities 10 0 0 0.0% 10 0 0 0 0 0Construction 20 15 20 10.3% 15 15 15 10 0 0Manufacturing 15 20 10 5.1% 0 20 0 10 0 0Wholesale trade 0 0 10 5.1% 0 0 10 0 0 0Retail trade 25 0 35 17.9% 20 0 20 0 0 15Transportation & Warehousing 0 0 0 0.0% 10 0 0 0 0 0Information & Cultural Industries 0 0 0 0.0% 0 0 0 0 0 0Finance & Insurance 0 0 0 0.0% 0 0 0 0 0 0Real Estate and Rental & Leasing 0 0 0 0.0% 0 0 0 0 0 0Professional, Scientific, & Technical Services 10 0 15 7.7% 10 0 10 0 0 10Management of Companies & Enterprises 0 0 0 0.0% 0 0 0 0 0 0Administrative & Support, Waste Management, a 0 0 25 12.8% 0 0 15 0 0 10Educational Services 20 30 0 0.0% 15 35 0 10 0 10Health Care & Social Assistance 20 0 25 12.8% 10 0 10 10 0 20Arts, Entertainment, & Recreation 0 0 10 5.1% 0 0 0 0 0 10Accommodation & Food Services 15 0 10 5.1% 0 0 0 10 0 10Other Services (excl. Public Administration) 0 0 0 0.0% 0 0 10 0 0 0Public Administration 15 40 10 5.1% 10 35 0 10 0 10
'16 % of Total
2006 2011 2016 2006 2011 2016 2006 2011 2016Total Usual Workers 135 120 120 100% 75 110 55 65 0 65
Commute within Community 90 65 75 62.5% 40 65 30 50 0 45Commute within RDCK 35 50 35 29.2% 20 50 10 10 0 25Commute within Province 10 0 0 0.0% 0 0 10 0 0 0Commute outside of Province 10 0 0 0.0% 0 0 10 0 0 0
Total '16 % of Total
Owners Renters
Total Total Total Owners Oweners Owners Renters Renters Renters2006 2011 2016 2006 2011 2016 2006 2011 2016
Total Occupied Dwellings 245 230 250 100% 155 210 165 85 25 90Single-Detached 230 215 190 76.0% 150 200 140 75 0 55Apartment (5+) 0 0 0 0.0% 0 0 0 0 0 0Other 10 0 30 12.0% 10 0 0 0 0 30
Semi-Detached 0 0 10 4.0% 0 0 0 0 0 0Row House 0 0 10 4.0% 0 0 0 0 0 10Duplex 0 0 15 6.0% 10 0 0 0 0 10Apartment 0 0 0 0.0% 0 0 0 10 0 0Other single-attached 0 0 0 0.0% 0 0 0 0 0 0
Movable 0 0 25 10.0% 0 0 20 0 0 10
'16 % of Total

59
Housing – Unit Size HNRR Section 6 (1)(c) – Source: Statistics Canada
Housing – Date Built HNRR Section 6 (1)(c) – Source: Statistics Canada
Housing – Subsidized HNRR Section 6 (1)(e) – Source: BC Housing Housing Registry Subsidized Unit Stock = 0 Housing – Rental Vacancy HNRR Section 6 (1)(i – j) * – Source: CMHC
* vacancy reflects the City of Nelson and its surrounding areas Housing – Primary Rental Universe HNRR Section 6 (1)(k)(i) – Source: CMHC
* reflects the City of Nelson and its surrounding areas
Total Total Total Owners Oweners Owners Renters Renters Renters2006 2011 2016 2006 2011 2016 2006 2011 2016
Total Dwellings 240 230 250 100% 160 210 165 85 25 85No bedroom 0 0 0 0.0% 0 0 0 0 0 01 bedroom 45 0 55 22.0% 15 0 25 30 0 302 bedroom 85 120 105 42.0% 70 95 70 15 25 253+ bedroom 115 95 95 38.0% 70 95 60 35 0 30
'16 % of Total
Total Total Total Owners Oweners Owners Renters Renters Renters2006 2011 2016 2006 2011 2016 2006 2011 2016
Total Dwellings 240 230 255 100% 155 210 165 100% 85 20 90 100%< 1960 150 95 130 51.0% 95 85 90 54.5% 55 0 40 44.4%1961 to 1980 75 80 65 25.5% 45 70 50 30.3% 30 0 20 22.2%1981 to 1990 15 0 15 5.9% 15 0 0 0.0% 0 0 15 16.7%1991 to 2000 10 35 25 9.8% 0 35 15 9.1% 10 0 10 11.1%2001 to 2010 0 0 10 3.9% 0 0 10 6.1% 0 0 0 0.0%2011 to 2016 0 0 10 3.9% 0 0 10 6.1% 0 0 0 0.0%
'16 % of Total
'16 % of Total
'16 % of Total
2013 2014 2015 2016 2017 2018 2019Bachelor 5.7 0.0 3.3 ** 0.0 0.0 0.01 Bedroom 0.5 0.6 0.0 0.0 0.0 0.0 0.02 Bedroom 2.0 0.8 0.0 0.8 0.0 0.0 0.03 Bedroom + ** ** ** ** ** ** **Total 1.9 0.6 0.4 0.7 0.0 0.0 0.4
UNIT TYPE 2013 2014 2015 2016 2017 2018 2019Bachelor 74 73 65 59 58 58 521 Bedroom 179 174 176 170 174 170 1772 Bedroom 253 253 255 255 255 271 2623 Bedroom + 15 15 14 16 16 16 18Total 521 515 510 500 503 515 509

60
Housing – Secondary Rental Universe HNRR Section 6 (1)(k)(ii) – Source: Statistics Canada, CMHC
* assumes no primary rental market in areas that are not the City of Nelson (expressed in 2016 numbers) Housing – Short Term Rentals HNRR Section 6 (1)(k)(iii) – Source: AirDNA
* assumes no primary rental market in areas not City of Nelson (expressed in 2016 numbers) Housing – Cooperatives HNRR Section 6 (1)(l) – Source: BC Housing [not applicable] No cooperatives listed by the Coop Housing Federation of BC Housing – Post-Secondary Beds HNRR Section 6 (1)(o) – Source: AEST [not applicable] AEST data does not list any beds exist in the community. Housing – Shelter Beds HNRR Section 6 (1)(p) – Source: BC Housing [not applicable] No BC Housing affiliated shelters (emergency shelters or homeless housing) are only available in the City of Nelson
Rental % of TotalTotal 240 85 0 - 85 100%
No Bedroom 0 0 0 - 0 0%1 Bedroom 55 30 0 - 30 35%2 Bedroom 95 25 0 - 25 29%3+ Bedroom 90 30 0 - 30 35%
Secondary Market % of TotalTotal
Primary Market
2014 2015 2016 2017 2018 2019 2020Total Properties 0 0 6 8 15 19 15
Monthly Revenue / Listing - - $509 $7,191 $7,539 $11,092 $5,115Annual Available Days / Listing - - 77 181 132 153 42Annual Reserved Days / Listing - - 4 54 57 78 36Average Occupancy - - 5% 23% 30% 34% 46%
Commercial Properties 0 0 4 6 13 16 13

61
Housing – Non-Market Housing Source: BC Housing
Housing – Demolitions HNRR Section 6 (1)(m)(i – iv) – Source: Local Government [not applicable] Demolition data unavailable at local government level. Housing – Starts HNRR Section 6 (1)(m)(i – iv)* -- Source: Local Government, BC Stats
* housing starts available in lieu of substantial completions Housing – Registered New Homes HNRR Section 6 (1)(m)(i – iv) – Source: BC Stats
Real Estate – Assessment HNRR Section 6 (1)(m)(i – iv) – Source: BC Assessment
New DenverEmergency Shelter / Homeless Housing
Homeless Housed 0Homeless Rent Supplements 0Homeless Shelters 0
Emergency Subtotal 0Transitional Supported / Assisted Living
Frail Seniors 0Special Needs 0Women and Children Fleeing Violence 0
Transitional Subtotal 0Independent Social Housing
Low Income Families 0Low Income Seniors 10
Social Housing Subtotal 10Rent Assistance in Private Market
Rent Assist Families -Rent Assist Seniors -
Rent Assistance Subtotal 6Community Total 16
2010 2011 2012 2013 2014 2015 2016 2017 2018 2019New Denver 0 3 1 0 0 2 0 6 0 0
Single-Detached 0 0 0 0 0 0 0 0 0 0Manufactured 0 0 0 0 0 0 0 0 0 0Multi Family 0 0 0 0 0 0 0 0 0 0
2016 2017 2018Single Detached * 7 *Multi Unit * * *Purpose Built Rental * * *
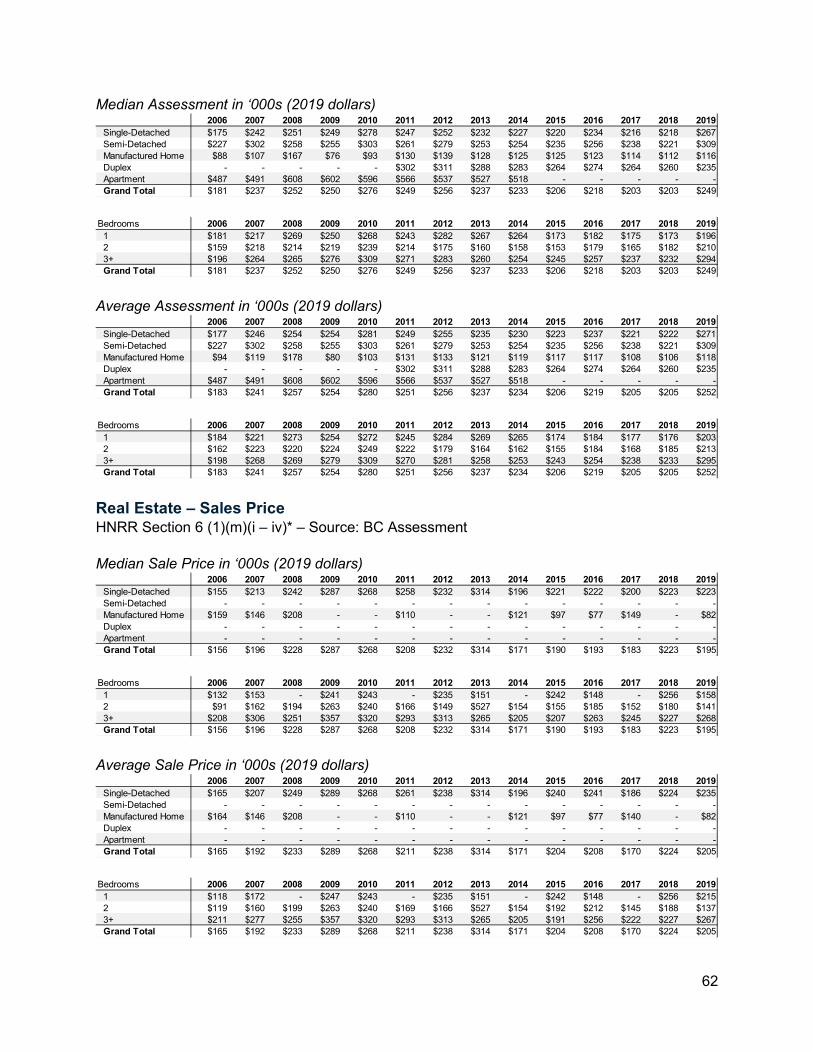
62
Median Assessment in ‘000s (2019 dollars)
Average Assessment in ‘000s (2019 dollars)
Real Estate – Sales Price HNRR Section 6 (1)(m)(i – iv)* – Source: BC Assessment Median Sale Price in ‘000s (2019 dollars)
Average Sale Price in ‘000s (2019 dollars)
2006 2007 2008 2009 2010 2011 2012 2013 2014 2015 2016 2017 2018 2019Single-Detached $175 $242 $251 $249 $278 $247 $252 $232 $227 $220 $234 $216 $218 $267Semi-Detached $227 $302 $258 $255 $303 $261 $279 $253 $254 $235 $256 $238 $221 $309Manufactured Home $88 $107 $167 $76 $93 $130 $139 $128 $125 $125 $123 $114 $112 $116Duplex - - - - - $302 $311 $288 $283 $264 $274 $264 $260 $235Apartment $487 $491 $608 $602 $596 $566 $537 $527 $518 - - - - -Grand Total $181 $237 $252 $250 $276 $249 $256 $237 $233 $206 $218 $203 $203 $249
Bedrooms 2006 2007 2008 2009 2010 2011 2012 2013 2014 2015 2016 2017 2018 20191 $181 $217 $269 $250 $268 $243 $282 $267 $264 $173 $182 $175 $173 $1962 $159 $218 $214 $219 $239 $214 $175 $160 $158 $153 $179 $165 $182 $2103+ $196 $264 $265 $276 $309 $271 $283 $260 $254 $245 $257 $237 $232 $294Grand Total $181 $237 $252 $250 $276 $249 $256 $237 $233 $206 $218 $203 $203 $249
2006 2007 2008 2009 2010 2011 2012 2013 2014 2015 2016 2017 2018 2019Single-Detached $177 $246 $254 $254 $281 $249 $255 $235 $230 $223 $237 $221 $222 $271Semi-Detached $227 $302 $258 $255 $303 $261 $279 $253 $254 $235 $256 $238 $221 $309Manufactured Home $94 $119 $178 $80 $103 $131 $133 $121 $119 $117 $117 $108 $106 $118Duplex - - - - - $302 $311 $288 $283 $264 $274 $264 $260 $235Apartment $487 $491 $608 $602 $596 $566 $537 $527 $518 - - - - -Grand Total $183 $241 $257 $254 $280 $251 $256 $237 $234 $206 $219 $205 $205 $252
Bedrooms 2006 2007 2008 2009 2010 2011 2012 2013 2014 2015 2016 2017 2018 20191 $184 $221 $273 $254 $272 $245 $284 $269 $265 $174 $184 $177 $176 $2032 $162 $223 $220 $224 $249 $222 $179 $164 $162 $155 $184 $168 $185 $2133+ $198 $268 $269 $279 $309 $270 $281 $258 $253 $243 $254 $238 $233 $295Grand Total $183 $241 $257 $254 $280 $251 $256 $237 $234 $206 $219 $205 $205 $252
2006 2007 2008 2009 2010 2011 2012 2013 2014 2015 2016 2017 2018 2019Single-Detached $155 $213 $242 $287 $268 $258 $232 $314 $196 $221 $222 $200 $223 $223Semi-Detached - - - - - - - - - - - - - -Manufactured Home $159 $146 $208 - - $110 - - $121 $97 $77 $149 - $82Duplex - - - - - - - - - - - - - -Apartment - - - - - - - - - - - - - -Grand Total $156 $196 $228 $287 $268 $208 $232 $314 $171 $190 $193 $183 $223 $195
Bedrooms 2006 2007 2008 2009 2010 2011 2012 2013 2014 2015 2016 2017 2018 20191 $132 $153 - $241 $243 - $235 $151 - $242 $148 - $256 $1582 $91 $162 $194 $263 $240 $166 $149 $527 $154 $155 $185 $152 $180 $1413+ $208 $306 $251 $357 $320 $293 $313 $265 $205 $207 $263 $245 $227 $268Grand Total $156 $196 $228 $287 $268 $208 $232 $314 $171 $190 $193 $183 $223 $195
2006 2007 2008 2009 2010 2011 2012 2013 2014 2015 2016 2017 2018 2019Single-Detached $165 $207 $249 $289 $268 $261 $238 $314 $196 $240 $241 $186 $224 $235Semi-Detached - - - - - - - - - - - - - -Manufactured Home $164 $146 $208 - - $110 - - $121 $97 $77 $140 - $82Duplex - - - - - - - - - - - - - -Apartment - - - - - - - - - - - - - -Grand Total $165 $192 $233 $289 $268 $211 $238 $314 $171 $204 $208 $170 $224 $205
Bedrooms 2006 2007 2008 2009 2010 2011 2012 2013 2014 2015 2016 2017 2018 20191 $118 $172 - $247 $243 - $235 $151 - $242 $148 - $256 $2152 $119 $160 $199 $263 $240 $169 $166 $527 $154 $192 $212 $145 $188 $1373+ $211 $277 $255 $357 $320 $293 $313 $265 $205 $191 $256 $222 $227 $267Grand Total $165 $192 $233 $289 $268 $211 $238 $314 $171 $204 $208 $170 $224 $205

63
Real Estate – Rents HNRR Section 6 (1)(h)(i – ii)* -- Source: CMHC Median rents (2019 dollars)
Average rents (2019 dollars)
* Available only for City of Nelson; rents not available before 2013 Core Housing Need – Affordability HNRR Section 7 (a)(i – ii) – Source: Statistics Canada
Core Housing Need – Adequacy HNRR Section 7 (a)(iii – iv) – Source: Statistics Canada
2013 2014 2015 2016 2017 2018 2019Bachelor $604 $647 $645 $636 $624 $685 $6501 Bedroom $713 $718 $725 $763 $708 $750 $8002 Bedroom $796 $782 $801 $795 $890 $913 $9753 Bedroom + $1,070 $1,079 $1,075 $1,100 $1,119 $1,120 $1,110Total $768 $755 $774 $790 $801 $811 $863
2013 2014 2015 2016 2017 2018 2019Bachelor $578 $593 $615 $641 $615 $643 $6501 Bedroom $721 $740 $735 $757 $733 $768 $8032 Bedroom $869 $894 $869 $880 $954 $949 $1,0373 Bedroom + $1,235 $1,199 $1,188 $1,159 $1,241Total $779 $802 $796 $818 $849 $865 $913
Total Total Total Owners Oweners Owners Renters Renters Renters2006 2011 2016 2006 2011 2016 2006 2011 2016
Total Households 235 235 255 155 210 160 80 25 90Above Affordable Threshold 60 55 70 20 45 25 45 0 45
1 person household 40 25 50 10 0 10 35 0 402 persons household 10 0 15 10 0 0 0 0 103 persons household 10 0 10 0 0 10 10 0 04 persons household 10 0 0 0 0 0 10 0 05+ persons household 0 0 0 0 0 0 0 0 0
Unaffordable Housing (%) 25.5% 23.4% 27.5% 12.9% 21.4% 15.6% 56.3% 0.0% 50.0%
Total Total Total Owners Oweners Owners Renters Renters Renters2006 2011 2016 2006 2011 2016 2006 2011 2016
Total Households 235 235 255 155 210 160 80 25 90Below Adequacy Standard 45 25 25 25 0 25 20 0 0
1 person household 25 0 10 10 0 0 15 0 02 persons household 10 0 10 10 0 10 0 0 03 persons household 0 0 0 0 0 10 0 0 04 persons household 15 0 0 10 0 0 0 0 05+ persons household 0 0 0 0 0 0 0 0 0
Inadequate Housing (%) 19.1% 10.6% 9.8% 16.1% 0.0% 15.6% 25.0% 0.0% 0.0%

64
Core Housing Need – Suitability HNRR Section 7 (a)(v – vi) – Source: Statistics Canada
Core Housing Need HNRR Section 8 (1)(a)(i – ii) – Source: Statistics Canada
Extreme Core Housing Need HNRR Section 8 (1)(a)(iii – iv) – Source: Statistics Canada
Income Category v. Price Source: Statistics Canada, Local Listings, BC Assessment, Environics Analytics
Total Total Total Owners Oweners Owners Renters Renters Renters2006 2011 2016 2006 2011 2016 2006 2011 2016
Total Households 235 235 255 155 210 160 80 25 90Below Suitability Standard 0 0 10 0 0 10 0 0 0
1 Person 0 0 0 0 0 0 0 0 02 Persons 0 0 0 0 0 0 0 0 03 Persons 0 0 10 0 0 0 0 0 04 Persons 10 0 0 0 0 0 10 0 05+ Persons 0 0 0 0 0 0 0 0 0
Unsuitable Housing (%) 0.0% 0.0% 3.9% 0.0% 0.0% 6.3% 0.0% 0.0% 0.0%
Total Total Total Owners Oweners Owners Renters Renters Renters2006 2011 2016 2006 2011 2016 2006 2011 2016
Total Households 235 235 250 155 210 165 75 25 85Household not in CHN 165 165 165 130 165 125 35 0 40Household in CHN 75 60 90 25 45 40 50 20 50
1 person household 45 20 60 10 0 20 35 0 402 persons household 10 0 30 10 0 15 0 0 103 persons household 0 0 0 0 0 10 0 0 04 persons household 10 0 0 0 0 0 0 0 05+ persons household 0 0 0 0 0 0 0 0 0
Household in CHN (%) 31.9% 25.5% 36.0% 16.1% 21.4% 24.2% 66.7% 80.0% 58.8%
Total Total Total Owners Oweners Owners Renters Renters Renters2006 2011 2016 2006 2011 2016 2006 2011 2016
Total Households 235 235 250 155 210 165 75 25 85Household not in ECHN 205 190 225 155 175 150 50 25 75Household in ECHN 30 45 25 0 35 15 25 0 10
1 person household 20 25 10 0 0 10 20 0 102 persons household 0 0 10 0 0 10 0 0 03 persons household 0 0 10 0 0 10 0 0 04 persons household 10 0 0 0 0 0 0 0 05+ persons household 0 0 0 0 0 0 0 0 0
Household in ECHN (%) 12.8% 19.1% 10.0% 0.0% 16.7% 9.1% 33.3% 0.0% 11.8%

65
Family Income v. Price Source: Statistics Canada, Local Listings, BC Assessment, Environics Analytics
Single Semi Row MobileIncome Category Detached Detached House Duplex Home
Very Low $20,700 $113,500 -$109,000 - - - $13,500Low $33,000 $193,000 -$29,500 - - - $93,000Moderate $49,600 $284,000 $61,500 - - - $184,000Above Moderate $62,000 $352,500 $130,000 - - - $252,500
Median Income $41,312 $238,500 $16,000 - - - $138,500
Budget v. Real Estate Prices
Household Income Purchase PriceMaximum Maximum Possible
Income CategoryVery Low $17,800 $1,100 -$1,270 $1,800 -$3,870Low $26,500 $1,600 -$770 $2,700 -$2,970Moderate $38,300 $2,300 -$70 $3,800 -$1,870Above Moderate $46,500 $2,800 $430 $4,700 -$970
Median Income $32,400 $1,900 -$470 $3,200 -$2,470
Est. Maximum AT Afford. EnergyHousehold Income Budget, Utilities only
Budget v. Average Utility Expense
Afford. EnergyBudget, w/ Fuel
Budget v. AverageTotal Expense
Utilities Only Utilities + Fuel
Single Semi Row MobileFamily Types Detached Detached House Duplex Home
Singles / Roommates $26,862 $147,500 -$75,000 - - - $47,500Lone parent $41,397 $238,500 $16,000 - - - $138,500Couple w/ child $84,315 $477,500 $255,000 - - - $377,500Couple w/o child $71,988 $409,000 $186,500 - - - $309,000
Median Income $41,312 $238,500 $16,000 - - - $138,500
Budget v. Real Estate PricesMaximum Maximum Possible
Household Income Purchase Price
Income CategorySingles / Roommates $22,219 $1,300 -$1,070 $2,200 -$3,470Lone parent $32,462 $1,900 -$470 $3,200 -$2,470Couple w/ child $61,129 $3,700 $1,330 $6,100 $430Couple w/o child $53,075 $3,200 $830 $5,300 -$370
Median Income $32,400 $1,900 -$470 $3,200 -$2,470
Utilities Only Utilities + FuelEst. Maximum AT Afford. Energy Budget v. Average Afford. Energy Budget v. Average
Household Income Budget, Utilities only Utility Expense Budget, w/ Fuel Total Expense

66
Housing Units Demanded Local Government Act: 585.3 (c)(i – ii); VC: 574.3(c)(i – ii) Source: Statistics Canada, BC Stats
2016 2017 2018 2019 2020 2021 2022 2023 2024 2025Total Population 485 495 505 515 525 505 500 495 490 485Total Households 270 275 280 285 290 305 305 305 305 305
No Bedroom 0 0 0 0 0 0 0 0 0 01 Bedroom 65 65 65 65 65 65 65 65 65 652 Bedroom 110 110 110 110 110 115 115 115 115 1153+ Bedroom 95 100 105 110 115 125 125 125 125 125
Household Size 1.76 1.77 1.77 1.78 1.78 1.66 1.67 1.68 1.69 1.70Renter Demand 35.2% 36.4% 37.5% 38.6% 39.7% 34.4% 34.4% 34.4% 34.4% 34.4%

67
APPENDIX B – Silverton Data Tables Historical & Anticipated Population & Households Housing Needs Report Regulation (HNRR) Section 3 (1)(a)(i – iv), (1)(b), & (2)(a –g)* Source: Statistics Canada, BC Stats
* distributions graphically represented in report Indigenous Identity Source: Statistics Canada
Mobility HNRR Section 3 (1)(a)(x) – Source: Statistics Canada
Post-Secondary Enrollment HNRR Section 3(1)(c) – Source: AEST [not applicable] No enrollment data available for the community. Homelessness HNRR Section 3(1)(d) – Source: BC Housing [not applicable] Homelessness counts only available for the City of Nelson.
2006 2011 2016 2017 2018 2019 2020 2021 2022 2023 2024 2025Total 175 195 195 205 215 225 235 205 205 205 205 205 11.4% 5.1%
< 14 yrs 10 20 15 15 15 15 15 5 5 5 5 5 50.0% -66.7%15 to 19 yrs 5 5 5 5 5 5 5 5 5 5 5 5 0.0% 0.0%20 to 24 yrs 0 5 0 0 0 0 0 5 5 5 5 5 #DIV/0! #DIV/0!25 to 64 yrs 115 120 105 110 115 120 125 105 105 105 105 105 -8.7% 0.0%65 to 84 yrs 40 40 65 70 75 80 85 85 85 85 85 85 62.5% 30.8%85+ yrs 5 5 5 5 5 5 5 0 0 0 0 0 0.0% -100.0%
Median Age 62.4 57.2 61.9 62.1 62.4 62.6 62.8 63.0 64.3 65.6 66.8 68.1 -0.8% 10.0%Average Age 53.3 51.1 54.9 55.5 56.1 56.6 57.0 58.8 58.7 58.6 58.5 58.3 3.1% 6.2%Households (HHs) 135 90 110 110 110 110 110 120 120 120 120 120 -18.5% 9.1%Average HH Size 1.3 2.2 1.8 1.9 2.0 2.0 2.1 1.7 1.7 1.7 1.7 1.7 36.8% -3.6%
%∆ '16-'25
%∆ '06-'16
Total Total Total Owners Oweners Owners Renters Renters Renters2006 2011 2016 2006 2011 2016 2006 2011 2016
Total Population 180 200 160 135 200 120 40 0 40Indigenous Identity 15 0 0 10 0 0 0 0 0Non-Indigenous Identity 165 200 160 130 200 120 40 0 40
Total Total Total Owners Oweners Owners Renters Renters Renters2006 2011 2016 2006 2011 2016 2006 2011 2016
Total Population 100% 100% 100% 100% 100% 100% 100% - 100%Indigenous Identity 8.3% 0.0% 0.0% 7.4% 0.0% 0.0% 0.0% - 0.0%Non-Indigenous Identity 91.7% 100.0% 100.0% 96.3% 100.0% 100.0% 100.0% - 100.0%
Total Total Total Owners Oweners Owners Renters Renters Renters2006 2011 2016 2006 2011 2016 2006 2011 2016
Total Population 180 205 160 135 205 125 40 0 35Non-Mover 150 200 130 140 205 115 15 0 15Mover 30 0 25 0 0 10 30 0 15
Non-Migrant 0 0 0 0 0 0 0 0 0Migrants 30 0 25 0 0 10 30 0 20
Internal Migrants 25 0 25 0 0 0 25 0 20Intraprovincial Migrant 20 0 25 0 0 10 20 0 15Interprovincial Migrant 10 0 0 0 0 0 10 0 0
External Migrant 0 0 0 0 0 0 0 0 0

68
Private Household Size HNRR Section 3 (1)(v – viii) – Source: Statistics Canada
Household Maintainers Source: Statistics Canada
Owners w/ Mortgages & Renters in Subsidized Housing HNRR Section 3 (1)(ix) – Source: Statistics Canada
Household Income HNRR Section 4(a – e)* – Source: Statistics Canada [not applicable] Income data is unavailable for the community due to suppression and/or rounding. Labour Force HNRR Section 5(a) & Section 7(b – c) – Source: Statistics Canada
Total Total Total Owners Oweners Owners Renters Renters Renters Renters Renters Renter %2006 2011 2016 2006 2011 2016 2006 2011 2016 2006 2011 2016
Total Private HHs 100 110 100 95% 75 115 80 30 0 20 30% 0% 20%1 person 40 65 45 42.9% 10 60 40 20 0 10 50% 0% 22%2 persons 60 25 50 47.6% 60 25 45 0 0 10 0% 0% 20%3 persons 10 0 0 0.0% 0 0 0 10 0 0 100% - -4 persons 0 0 0 0.0% 0 0 0 0 0 0 - - -5+ persons 0 0 0 0.0% 0 0 0 0 0 0 - - -
Average HH Size 1.8 1.7 1.6 1.8 1.9 1.6 1.8 0.0 2.0 - - -
'16 % of Total
Total Total Total Total Owners Oweners Owners Renters Renters Renters2006 2011 2016 10yr % ∆ 2006 2011 2016 2006 2011 2016
Total Household 105 110 100 -4.8% 75 115 80 30 0 2015 - 24 yrs 0 0 0 #DIV/0! 0 0 0 0 0 025 - 34 yrs 0 0 10 #DIV/0! 0 0 0 0 0 1035 - 44 yrs 10 0 0 -100.0% 0 0 0 10 0 1045 - 54 yrs 20 0 0 -100.0% 20 0 0 0 0 055 - 64 yrs 35 30 30 -14.3% 20 30 35 10 0 065 - 74 yrs 25 25 45 80.0% 25 25 35 0 0 1075 - 84 yrs 10 0 15 50.0% 15 0 10 0 0 085+ yrs 10 0 0 -100.0% 0 0 0 10 0 0
2006 2011 2016Owners 75 115 80
w/ Mortgage (#) 20 65 30w/ Mortgage (%) 27% 57% 38%
Renters 25 0 25Subsidised (#) 0 0 0Subsidied (%) 0% - 0%
Total Total Total Owners Oweners Owners Renters Renters Renters2006 2011 2016 2006 2011 2016 2006 2011 2016
Total Population (15+ yrs) 165 195 145 140 195 120 30 0 25In Labour Force 60 70 65 55 70 55 10 0 10
Employed 60 20 60 50 20 50 10 0 10Unemployed 0 0 10 0 0 0 0 0 0
Not In Labour Force 100 120 80 80 125 65 20 0 15Participation Rate (%) 36.4 36.8 44.8 37.0 36.8 41.7 33.3 0.0 40.0Employment Rate (%) 39.4 10.5 41.4 40.7 10.5 41.7 33.3 0.0 40.0Unemployment Rate (%) 0.0 0.0 15.4 0.0 0.0 0.0 0.0 0.0 0.0

69
NAICS Industry Employment HNRR Section 5(b) – Source: Statistics Canada
Commuting HNRR Section 7(d – g) – Source: Statistics Canada
Housing – Structural Types HNRR Section 6 (1)(a – b) – Source: Statistics Canada
Housing – Unit Size HNRR Section 6 (1)(c) – Source: Statistics Canada
Total Total Total Owners Oweners Owners Renters Renters Renters2006 2011 2016 2006 2011 2016 2006 2011 2016
Labour Force 65 70 65 100.0% 50 70 50 10 0 10Agriculture, Forestry, Fishing, & Hunting 0 0 0 0.0% 0 0 0 0 0 0Mining, Quarrying, and Oil & Gas Extraction 0 0 0 0.0% 10 0 10 0 0 0Utilities 0 0 0 0.0% 10 0 0 0 0 0Construction 0 0 10 15.4% 0 0 10 10 0 0Manufacturing 0 0 0 0.0% 10 0 0 0 0 0Wholesale trade 0 0 0 0.0% 0 0 0 0 0 0Retail trade 0 0 10 15.4% 10 0 10 0 0 0Transportation & Warehousing 0 0 0 0.0% 0 0 0 0 0 0Information & Cultural Industries 0 0 0 0.0% 0 0 0 0 0 0Finance & Insurance 0 0 0 0.0% 0 0 0 0 0 0Real Estate and Rental & Leasing 0 0 0 0.0% 0 0 0 0 0 0Professional, Scientific, & Technical Services 0 0 10 15.4% 0 0 0 0 0 10Management of Companies & Enterprises 0 0 0 0.0% 0 0 0 0 0 0Administrative & Support, Waste Management, an 0 0 10 15.4% 0 0 10 0 0 0Educational Services 0 0 10 15.4% 0 0 0 0 0 0Health Care & Social Assistance 0 0 10 15.4% 10 0 10 0 0 0Arts, Entertainment, & Recreation 0 0 0 0.0% 0 0 0 0 0 0Accommodation & Food Services 15 0 0 0.0% 15 0 0 0 0 0Other Services (excl. Public Administration) 0 0 0 0.0% 10 0 0 0 0 0Public Administration 0 0 0 0.0% 0 0 0 0 0 0
'16 % of Total
2006 2011 2016 2006 2011 2016 2006 2011 2016Total Usual Workers 45 20 35 100% 40 20 30 10 0 0
Commute within Community 0 0 10 28.6% 0 0 10 0 0 0Commute within RDCK 45 0 30 85.7% 40 0 25 0 0 10Commute within Province 0 0 0 0.0% 0 0 0 0 0 0Commute outside of Province 0 0 0 0.0% 0 0 0 0 0 0
Total '16 % of Total
Owners Renters
Total Total Total Owners Oweners Owners Renters Renters Renters2006 2011 2016 2006 2011 2016 2006 2011 2016
Total Occupied Dwellings 105 115 105 100% 75 115 80 25 0 20Single-Detached 105 105 95 90.5% 75 110 80 30 0 15Apartment (5+) 0 0 0 0.0% 0 0 0 0 0 0Other 0 0 0 0.0% 0 0 0 0 0 0
Semi-Detached 0 0 0 0.0% 0 0 0 0 0 0Row House 0 0 0 0.0% 0 0 0 0 0 0Duplex 0 0 0 0.0% 0 0 0 0 0 0Apartment 0 0 0 0.0% 0 0 0 0 0 10Other single-attached 0 0 0 0.0% 0 0 0 0 0 0
Movable 0 0 0 0.0% 0 0 0 0 0 0
'16 % of Total
Total Total Total Owners Oweners Owners Renters Renters Renters2006 2011 2016 2006 2011 2016 2006 2011 2016
Total Dwellings 105 115 100 100% 75 115 80 30 0 20No bedroom 0 0 0 0.0% 0 0 0 0 0 01 bedroom 15 0 10 10.0% 0 0 0 10 0 02 bedroom 35 70 45 45.0% 15 70 40 15 0 103+ bedroom 55 35 45 45.0% 50 40 30 0 0 15
'16 % of Total

70
Housing – Date Built HNRR Section 6 (1)(c) – Source: Statistics Canada
Housing – Subsidized HNRR Section 6 (1)(e) Housing Registry Subsidized Unit Stock = 0 Housing – Rental Vacancy HNRR Section 6 (1)(i – j) * -- Source: CMHC
* vacancy reflects the City of Nelson and its surrounding areas Housing – Primary Rental Universe HNRR Section 6 (1)(k)(i) – Source: CMHC
* reflects the City of Nelson and its surrounding areas Housing – Secondary Rental Universe HNRR Section 6 (1)(k)(ii) – Source: Statistics Canada, CMHC
* assumes no primary rental market in areas that are not the City of Nelson (expressed in 2016 numbers) Housing – Short Term Rentals HNRR Section 6 (1)(k)(iii) – Source: AirDNA
* assumes no primary rental market in areas not City of Nelson (expressed in 2016 numbers)
Total Total Total Owners Oweners Owners Renters Renters Renters2006 2011 2016 2006 2011 2016 2006 2011 2016
Total Dwellings 100 115 100 100% 75 115 80 100% 25 0 20 100%< 1960 55 60 45 45.0% 30 60 35 43.8% 25 0 10 50.0%1961 to 1980 20 0 15 15.0% 15 0 10 12.5% 0 0 0 0.0%1981 to 1990 15 0 10 10.0% 15 0 10 12.5% 0 0 0 0.0%1991 to 2000 10 10 10 10.0% 10 10 10 12.5% 0 0 0 0.0%2001 to 2010 0 0 10 10.0% 0 0 20 25.0% 0 0 0 0.0%2011 to 2016 0 0 0 0.0% 0 0 10 12.5% 0 0 0 0.0%
'16 % of Total
'16 % of Total
'16 % of Total
2013 2014 2015 2016 2017 2018 2019Bachelor 5.7 0.0 3.3 ** 0.0 0.0 0.01 Bedroom 0.5 0.6 0.0 0.0 0.0 0.0 0.02 Bedroom 2.0 0.8 0.0 0.8 0.0 0.0 0.03 Bedroom + ** ** ** ** ** ** **Total 1.9 0.6 0.4 0.7 0.0 0.0 0.4
UNIT TYPE 2013 2014 2015 2016 2017 2018 2019Bachelor 74 73 65 59 58 58 521 Bedroom 179 174 176 170 174 170 1772 Bedroom 253 253 255 255 255 271 2623 Bedroom + 15 15 14 16 16 16 18Total 521 515 510 500 503 515 509
Rental % of TotalTotal 95 25 0 - 25 100%
No Bedroom 0 0 0 - 0 0%1 Bedroom 0 0 0 - 0 0%2 Bedroom 50 10 0 - 10 40%3+ Bedroom 45 15 0 - 15 60%
Secondary Market % of TotalTotal
Primary Market
2014 2015 2016 2017 2018 2019 2020Total Properties 0 0 2 7 6 8 4
Monthly Revenue / Listing - - $188 $2,441 $7,943 $7,902 $1,476Annual Available Days / Listing - - 53 72 124 125 62Annual Reserved Days / Listing - - 2 23 58 60 10Average Occupancy - - 3% 24% 32% 32% 14%
Commercial Properties 0 0 1 6 6 7 3

71
Housing – Cooperatives HNRR Section 6 (1)(l) – Source: BC Housing [not applicable] No cooperatives listed by the Coop Housing Federation of BC Housing – Post-Secondary Beds HNRR Section 6 (1)(o) – Source: AEST [not applicable] AEST data does not list any beds exist in the community. Housing – Shelter Beds HNRR Section 6 (1)(p) – Source: BC Housing [not applicable] No BC Housing affiliated shelters (emergency shelters or homeless housing) are only available in the City of Nelson Housing – Non-Market Housing Source: BC Housing
Housing – Demolitions HNRR Section 6 (1)(m)(i – iv) – Source: Local Government [not applicable] Demolition data unavailable at local government level. Housing – Starts HNRR Section 6 (1)(m)(i – iv)* -- Source: Local Government, BC Stats
* housing starts available in lieu of substantial completions; aggregate and unit totals differ due to different sources
SilvertonEmergency Shelter / Homeless Housing
Homeless Housed 0Homeless Rent Supplements 0Homeless Shelters 0
Emergency Subtotal 0Transitional Supported / Assisted Living
Frail Seniors 0Special Needs 0Women and Children Fleeing Violence 0
Transitional Subtotal 0Independent Social Housing
Low Income Families 0Low Income Seniors 0
Social Housing Subtotal 0Rent Assistance in Private Market
Rent Assist Families 0Rent Assist Seniors 0
Rent Assistance Subtotal 0Community Total 0
2010 2011 2012 2013 2014 2015 2016 2017 2018 2019Single-Detached 0 0 0 0 0 0 0 0 0 0Row 0 0 0 0 0 0 0 0 0 0Apartment 0 0 0 0 0 0 0 0 0 0
Total 1 2 0 0 1 2 2 0 1 0

72
Housing – Registered New Homes HNRR Section 6 (1)(m)(i – iv) – Source: BC Stats [not applicable] No registered new homes data available for the community. Real Estate – Assessment HNRR Section 6 (1)(m)(i – iv) – Source: BC Assessment Median Assessment in ‘000s (2019 dollars)
Average Assessment in ‘000s (2019 dollars)
Real Estate – Sales Price HNRR Section 6 (1)(m)(i – iv)* – Source: BC Assessment Median Sale Price in ‘000s (2019 dollars)
Average Sale Price in ‘000s (2019 dollars)
2006 2007 2008 2009 2010 2011 2012 2013 2014 2015 2016 2017 2018 2019Single-Detached $254 $304 $327 $319 $348 $308 $315 $287 $295 $282 $308 $283 $276 $330Manufactured Home $121 $141 $170 $148 $171 $146 $140 $128 $193 $187 $187 $174 $169 $157Grand Total $221 $263 $287 $281 $304 $272 $276 $252 $275 $263 $284 $261 $254 $296
Bedrooms 2006 2007 2008 2009 2010 2011 2012 2013 2014 2015 2016 2017 2018 20191 $98 $115 $130 $127 $165 $144 $143 $137 $149 $149 $175 $157 $161 $1862 $132 $159 $190 $218 $224 $212 $209 $191 $195 $191 $205 $188 $182 $1963+ $281 $334 $358 $350 $363 $334 $343 $312 $336 $318 $342 $315 $306 $363Grand Total $221 $263 $287 $281 $304 $272 $276 $252 $275 $263 $284 $261 $254 $296
2006 2007 2008 2009 2010 2011 2012 2013 2014 2015 2016 2017 2018 2019Single-Detached $275 $331 $372 $356 $393 $338 $340 $311 $314 $301 $326 $302 $292 $353Manufactured Home $121 $143 $171 $151 $189 $152 $146 $133 $200 $192 $192 $181 $177 $169Grand Total $236 $284 $322 $311 $342 $296 $297 $271 $291 $279 $299 $278 $269 $316
Bedrooms 2006 2007 2008 2009 2010 2011 2012 2013 2014 2015 2016 2017 2018 20191 $108 $128 $147 $144 $178 $159 $161 $152 $159 $157 $183 $168 $168 $1932 $144 $178 $205 $230 $259 $225 $226 $207 $211 $203 $217 $201 $195 $2193+ $299 $357 $403 $392 $408 $367 $366 $334 $354 $337 $360 $334 $323 $386Grand Total $236 $284 $322 $311 $342 $296 $297 $271 $291 $279 $299 $278 $269 $316
2006 2007 2008 2009 2010 2011 2012 2013 2014 2015 2016 2017 2018 2019Single-Detached $171 $200 $213 $601 $293 $306 $167 $357 $230 $198 $181 $253 $196 $301Manufactured Home - $190 $291 - - - - - - - - - - -Grand Total $171 $198 $232 $601 $293 $306 $167 $357 $230 $198 $181 $253 $196 $301
Bedrooms 2006 2007 2008 2009 2010 2011 2012 2013 2014 2015 2016 2017 2018 20191 - - - - $243 - $165 - - - - - $105 -2 $149 $211 $234 - $225 $242 $168 - $218 $97 $138 - $259 $2033+ $194 $185 $231 $601 $353 $433 - $357 $241 $249 $203 $253 $210 $333Grand Total $171 $198 $232 $601 $293 $306 $167 $357 $230 $198 $181 $253 $196 $301
2006 2007 2008 2009 2010 2011 2012 2013 2014 2015 2016 2017 2018 2019Single-Detached $174 $215 $213 $601 $302 $306 $167 $357 $230 $198 $181 $301 $196 $301Manufactured Home - $190 $291 - - - - - - - - - - -Grand Total $174 $209 $232 $601 $302 $306 $167 $357 $230 $198 $181 $301 $196 $301
Bedrooms 2006 2007 2008 2009 2010 2011 2012 2013 2014 2015 2016 2017 2018 20191 - - - - $243 - $165 - - - - - $105 -2 $149 $234 $234 - $260 $242 $168 - $218 $97 $138 - $259 $2033+ $199 $185 $231 $601 $353 $433 - $357 $241 $249 $203 $301 $210 $333Grand Total $174 $209 $232 $601 $302 $306 $167 $357 $230 $198 $181 $301 $196 $301

73
Real Estate – Rents HNRR Section 6 (1)(h)(i – ii)* -- Source: CMHC Median rents (2019 dollars)
Average rents (2019 dollars)
* Available only for City of Nelson; rents not available before 2013 Core Housing Need – Affordability HNRR Section 7 (a)(i – ii) – Source: Statistics Canada
Core Housing Need – Adequacy HNRR Section 7 (a)(iii – iv) – Source: Statistics Canada
2013 2014 2015 2016 2017 2018 2019Bachelor $604 $647 $645 $636 $624 $685 $6501 Bedroom $713 $718 $725 $763 $708 $750 $8002 Bedroom $796 $782 $801 $795 $890 $913 $9753 Bedroom + $1,070 $1,079 $1,075 $1,100 $1,119 $1,120 $1,110Total $768 $755 $774 $790 $801 $811 $863
2013 2014 2015 2016 2017 2018 2019Bachelor $578 $593 $615 $641 $615 $643 $6501 Bedroom $721 $740 $735 $757 $733 $768 $8032 Bedroom $869 $894 $869 $880 $954 $949 $1,0373 Bedroom + $1,235 $1,199 $1,188 $1,159 $1,241Total $779 $802 $796 $818 $849 $865 $913
Total Total Total Owners Oweners Owners Renters Renters Renters2006 2011 2016 2006 2011 2016 2006 2011 2016
Total Households 95 110 95 65 110 75 30 0 25Above Affordable Threshold 0 0 0 0 0 0 0 0 0
1 person household 0 0 0 0 0 0 0 0 02 persons household 0 0 0 0 0 0 0 0 03 persons household 0 0 0 0 0 0 0 0 04 persons household 0 0 0 0 0 0 0 0 05+ persons household 0 0 0 0 0 0 0 0 0
Unaffordable Housing (%) 0.0% 0.0% 0.0% 0.0% 0.0% 0.0% 0.0% - 0.0%
Total Total Total Owners Oweners Owners Renters Renters Renters2006 2011 2016 2006 2011 2016 2006 2011 2016
Total Households 95 110 95 65 110 75 30 0 25Below Adequacy Standard 0 0 0 0 0 0 0 0 0
1 person household 0 0 0 0 0 0 0 0 02 persons household 0 0 0 0 0 0 0 0 03 persons household 0 0 0 0 0 0 0 0 04 persons household 0 0 0 0 0 0 0 0 05+ persons household 0 0 0 0 0 0 0 0 0
Inadequate Housing (%) 0.0% 0.0% 0.0% 0.0% 0.0% 0.0% 0.0% - 0.0%
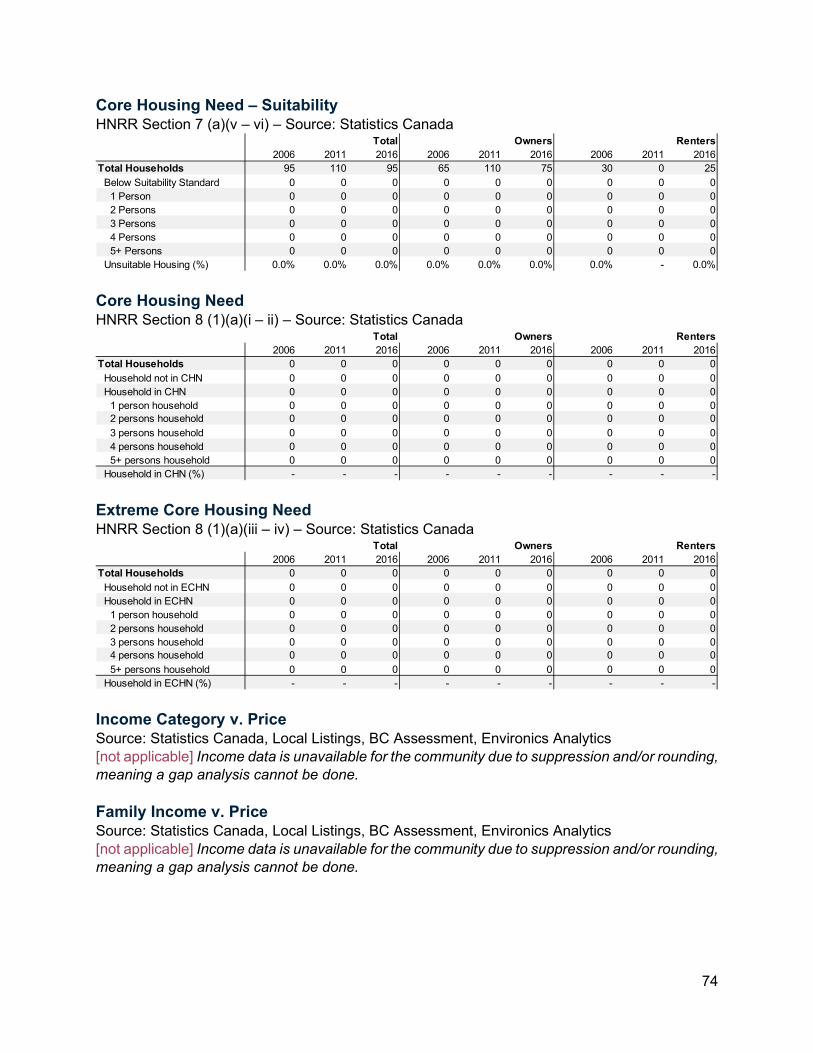
74
Core Housing Need – Suitability HNRR Section 7 (a)(v – vi) – Source: Statistics Canada
Core Housing Need HNRR Section 8 (1)(a)(i – ii) – Source: Statistics Canada
Extreme Core Housing Need HNRR Section 8 (1)(a)(iii – iv) – Source: Statistics Canada
Income Category v. Price Source: Statistics Canada, Local Listings, BC Assessment, Environics Analytics [not applicable] Income data is unavailable for the community due to suppression and/or rounding, meaning a gap analysis cannot be done. Family Income v. Price Source: Statistics Canada, Local Listings, BC Assessment, Environics Analytics [not applicable] Income data is unavailable for the community due to suppression and/or rounding, meaning a gap analysis cannot be done.
Total Total Total Owners Oweners Owners Renters Renters Renters2006 2011 2016 2006 2011 2016 2006 2011 2016
Total Households 95 110 95 65 110 75 30 0 25Below Suitability Standard 0 0 0 0 0 0 0 0 0
1 Person 0 0 0 0 0 0 0 0 02 Persons 0 0 0 0 0 0 0 0 03 Persons 0 0 0 0 0 0 0 0 04 Persons 0 0 0 0 0 0 0 0 05+ Persons 0 0 0 0 0 0 0 0 0
Unsuitable Housing (%) 0.0% 0.0% 0.0% 0.0% 0.0% 0.0% 0.0% - 0.0%
Total Total Total Owners Oweners Owners Renters Renters Renters2006 2011 2016 2006 2011 2016 2006 2011 2016
Total Households 0 0 0 0 0 0 0 0 0Household not in CHN 0 0 0 0 0 0 0 0 0Household in CHN 0 0 0 0 0 0 0 0 0
1 person household 0 0 0 0 0 0 0 0 02 persons household 0 0 0 0 0 0 0 0 03 persons household 0 0 0 0 0 0 0 0 04 persons household 0 0 0 0 0 0 0 0 05+ persons household 0 0 0 0 0 0 0 0 0
Household in CHN (%) - - - - - - - - -
Total Total Total Owners Oweners Owners Renters Renters Renters2006 2011 2016 2006 2011 2016 2006 2011 2016
Total Households 0 0 0 0 0 0 0 0 0Household not in ECHN 0 0 0 0 0 0 0 0 0Household in ECHN 0 0 0 0 0 0 0 0 0
1 person household 0 0 0 0 0 0 0 0 02 persons household 0 0 0 0 0 0 0 0 03 persons household 0 0 0 0 0 0 0 0 04 persons household 0 0 0 0 0 0 0 0 05+ persons household 0 0 0 0 0 0 0 0 0
Household in ECHN (%) - - - - - - - - -

75
Housing Units Demanded Local Government Act: 585.3 (c)(i – ii); VC: 574.3(c)(i – ii) Source: Statistics Canada, BC Stats
2016 2017 2018 2019 2020 2021 2022 2023 2024 2025Total Population 195 205 215 225 235 205 205 205 205 205Total Households 105 110 115 120 125 115 115 115 115 115
No Bedroom 0 0 0 0 0 0 0 0 0 01 Bedroom 0 0 0 0 0 5 5 5 5 52 Bedroom 55 55 55 55 55 50 50 50 50 503+ Bedroom 50 55 60 65 70 60 60 60 60 60
Household Size 1.77 1.86 1.95 2.05 2.14 1.71 1.71 1.71 1.71 1.71Renter Demand 23.8% 22.7% 21.7% 20.8% 20.0% 26.1% 26.1% 26.1% 26.1% 26.1%

76
APPENDIX C – Slocan Data Tables Historical & Anticipated Population & Households Housing Needs Report Regulation (HNRR) Section 3 (1)(a)(i – iv), (1)(b), & (2)(a –g)* Source: Statistics Canada, BC Stats
* distributions graphically represented in report Indigenous Identity Source: Statistics Canada
Mobility HNRR Section 3 (1)(a)(x) – Source: Statistics Canada
Post-Secondary Enrollment HNRR Section 3(1)(c) – Source: AEST [not applicable] No enrollment data available for the community. Homelessness HNRR Section 3(1)(d) – Source: BC Housing [not applicable] Homelessness counts only available for the City of Nelson.
2006 2011 2016 2017 2018 2019 2020 2021 2022 2023 2024 2025Total 330 300 255 245 235 225 215 275 275 275 275 275 -22.7% 7.8%
< 14 yrs 55 45 35 30 25 20 15 30 30 30 30 30 -36.4% -14.3%15 to 19 yrs 20 20 15 15 15 15 15 5 5 5 5 5 -25.0% -66.7%20 to 24 yrs 5 5 5 5 5 5 5 10 10 10 10 10 0.0% 100.0%25 to 64 yrs 200 180 155 150 145 140 135 155 155 155 155 155 -22.5% 0.0%65 to 84 yrs 50 45 45 45 45 45 45 70 70 70 70 70 -10.0% 55.6%85+ yrs 0 5 0 0 0 0 0 5 5 5 5 5 - -
Median Age 54.0 58.5 51.0 51.4 51.8 52.3 52.7 53.1 53.3 53.5 53.7 53.9 -5.6% 5.7%Average Age 43.1 43.3 44.8 45.5 46.1 46.9 47.7 48.6 48.5 48.3 48.1 47.9 4.1% 6.8%Households (HHs) 150 185 165 165 165 165 165 165 165 165 165 165 10.0% 0.0%Average HH Size 2.2 1.6 1.5 1.5 1.4 1.4 1.3 1.7 1.7 1.7 1.7 1.7 -29.8% 7.8%
%∆ '16-'25
%∆ '06-'16
Total Total Total Owners Oweners Owners Renters Renters Renters2006 2011 2016 2006 2011 2016 2006 2011 2016
Total Population 315 180 245 235 175 170 80 0 70Indigenous Identity 10 0 10 0 0 10 10 0 0Non-Indigenous Identity 305 180 230 235 175 165 75 0 70
Total Total Total Owners Oweners Owners Renters Renters Renters2006 2011 2016 2006 2011 2016 2006 2011 2016
Total Population 100% 100% 100% 100% 100% 100% 100% - 100%Indigenous Identity 3.2% 0.0% 4.1% 0.0% 0.0% 5.9% 12.5% - 0.0%Non-Indigenous Identity 96.8% 100.0% 93.9% 100.0% 100.0% 97.1% 93.8% - 100.0%
Total Total Total Owners Oweners Owners Renters Renters Renters2006 2011 2016 2006 2011 2016 2006 2011 2016
Total Population 315 180 245 235 175 175 75 0 70Non-Mover 275 125 205 195 120 170 80 0 35Mover 35 50 40 35 50 0 0 0 35
Non-Migrant 20 35 15 20 35 0 0 0 15Migrants 20 0 25 20 0 0 0 0 20
Internal Migrants 20 0 25 15 0 10 0 0 20Intraprovincial Migrant 10 0 25 10 0 0 0 0 20Interprovincial Migrant 10 0 0 10 0 0 0 0 0
External Migrant 0 0 0 0 0 0 0 0 0

77
Private Household Size HNRR Section 3 (1)(v – viii) – Source: Statistics Canada
Household Maintainers Source: Statistics Canada
Owners w/ Mortgages & Renters in Subsidized Housing HNRR Section 3 (1)(ix) – Source: Statistics Canada
Household Income HNRR Section 4(a – e)* – Source: Statistics Canada
*Income data is unavailable for the community in 2011 and 2016 due to suppression and/or rounding.
Total Total Total Owners Oweners Owners Renters Renters Renters Renters Renters Renter %2006 2011 2016 2006 2011 2016 2006 2011 2016 2006 2011 2016
Total Private HHs 145 65 135 96% 115 65 105 30 0 30 21% 0% 22%1 person 50 15 60 42.9% 55 0 55 0 0 10 0% 0% 17%2 persons 65 10 60 42.9% 50 10 40 20 0 20 31% 0% 33%3 persons 0 0 10 7.1% 0 0 0 10 0 0 - - 0%4 persons 10 0 10 7.1% 0 0 0 0 0 10 0% - 100%5+ persons 15 0 0 0.0% 15 0 0 0 0 0 0% - -
Average HH Size 2.2 2.6 1.8 2.0 2.7 1.6 2.7 0.0 2.3 - - -
'16 % of Total
Total Total Total Total Owners Oweners Owners Renters Renters Renters2006 2011 2016 10yr % ∆ 2006 2011 2016 2006 2011 2016
Total Household 145 65 140 -3.4% 115 60 105 35 0 3515 - 24 yrs 0 0 10 - 0 0 0 0 0 1025 - 34 yrs 10 0 10 0.0% 10 0 0 0 0 035 - 44 yrs 10 0 25 150.0% 0 0 15 0 0 1045 - 54 yrs 50 0 20 -60.0% 40 0 10 10 0 1055 - 64 yrs 40 40 40 0.0% 25 40 30 15 0 1065 - 74 yrs 15 0 30 100.0% 15 0 30 0 0 075 - 84 yrs 15 0 15 0.0% 15 0 20 0 0 085+ yrs 15 0 0 -100.0% 15 0 0 0 0 0
2006 2011 2016Owners 115 60 105
w/ Mortgage (#) 75 25 55w/ Mortgage (%) 65% 42% 52%
Renters 30 0 30Subsidised (#) 0 0 0Subsidied (%) 0% - 0%
Total Total Total Owners Oweners Owners Renters Renters Renters2005 2010 2015 2005 2010 2015 2005 2010 2015
Total Household 145 0 0 - 115 0 0 - 30 0 0 -< $5,000 0 0 0 - 0 0 0 - 0 0 0 -$5,000 - $9,999 0 0 0 - 0 0 0 - 0 0 0 -$10,000 - $14,999 10 0 0 - 0 0 0 - 0 0 0 -$15,000 - $19,999 20 0 0 - 15 0 0 - 10 0 0 -$20,000 - $24,999 0 0 0 - 10 0 0 - 0 0 0 -$25,000 - $29,999 0 0 0 - 0 0 0 - 0 0 0 -$30,000 - $34,999 20 0 0 - 20 0 0 - 0 0 0 -$35,000 - $39,999 10 0 0 - 10 0 0 - 0 0 0 -$40,000 - $44,999 0 0 0 - 0 0 0 - 10 0 0 -$45,000 - $49,999 0 0 0 - 0 0 0 - 0 0 0 -$50,000 - $59,999 15 0 0 - 15 0 0 - 0 0 0 -$60,000 - $69,999 25 0 0 - 20 0 0 - 0 0 0 -$70,000 - $79,999 10 0 0 - 0 0 0 - 0 0 0 -$80,000 - $89,999 10 0 0 - 10 0 0 - 0 0 0 -$90,000 - $99,999 10 0 0 - 15 0 0 - 0 0 0 -$100,000+ 20 0 0 - 10 0 0 - 15 0 0 -
$100,000 - $124,999 0 0 0 - 0 0 0 - 0 0 0 -$125,000 - $149,999 15 0 0 - 0 0 0 - 10 0 0 -$150,000 - $199,999 0 0 0 - 0 0 0 - 0 0 0 -$200,000+ 10 0 0 - 0 0 0 - 0 0 0 -
Median Income $52,138 $0 $0 $52,178 $0 $0 $42,711 $0 $0Average Income $63,336 $0 $0 $59,843 $0 $0 $76,289 $0 $0
% of Total
% of Total
% of Total

78
Labour Force HNRR Section 5(a) & Section 7(b – c) – Source: Statistics Canada
NAICS Industry Employment HNRR Section 5(b) – Source: Statistics Canada
Commuting HNRR Section 7(d – g) – Source: Statistics Canada
Total Total Total Owners Oweners Owners Renters Renters Renters2006 2011 2016 2006 2011 2016 2006 2011 2016
Total Population (15+ yrs) 270 165 215 200 160 155 65 0 55In Labour Force 175 70 125 115 75 85 60 0 40
Employed 130 75 100 85 75 60 45 0 40Unemployed 40 0 20 25 0 20 15 0 0
Not In Labour Force 90 90 85 80 85 75 10 0 15Participation Rate (%) 66.0 45.5 58.1 57.5 46.9 54.8 92.3 0.0 66.7Employment Rate (%) 49.1 45.5 46.5 45.0 46.9 38.7 69.2 0.0 75.0Unemployment Rate (%) 25.7 0.0 20.0 21.7 0.0 29.4 25.0 0.0 0.0
Total Total Total Owners Oweners Owners Renters Renters Renters2006 2011 2016 2006 2011 2016 2006 2011 2016
Labour Force 170 70 120 100.0% 115 75 80 60 0 40Agriculture, Forestry, Fishing, & Hunting 15 0 0 0.0% 10 0 0 0 0 0Mining, Quarrying, and Oil & Gas Extraction 0 0 0 0.0% 0 0 0 0 0 0Utilities 0 0 0 0.0% 0 0 0 0 0 0Construction 35 0 20 16.7% 20 0 20 15 0 0Manufacturing 25 0 10 8.3% 25 0 10 0 0 0Wholesale trade 0 0 0 0.0% 0 0 0 0 0 0Retail trade 30 0 20 16.7% 25 0 0 10 0 10Transportation & Warehousing 10 0 0 0.0% 0 0 0 0 0 0Information & Cultural Industries 0 0 0 0.0% 0 0 0 0 0 0Finance & Insurance 0 0 0 0.0% 0 0 0 0 0 0Real Estate and Rental & Leasing 0 0 0 0.0% 0 0 0 0 0 0Professional, Scientific, & Technical Services 10 0 10 8.3% 10 0 0 0 0 15Management of Companies & Enterprises 0 0 0 0.0% 0 0 0 0 0 0Administrative & Support, Waste Management, and 15 0 15 12.5% 0 0 15 15 0 0Educational Services 15 0 10 8.3% 0 0 10 15 0 0Health Care & Social Assistance 10 0 15 12.5% 10 0 10 0 0 10Arts, Entertainment, & Recreation 0 0 10 8.3% 0 0 10 0 0 0Accommodation & Food Services 10 0 0 0.0% 10 0 0 0 0 0Other Services (excl. Public Administration) 0 0 0 0.0% 0 0 0 0 0 10Public Administration 10 0 10 8.3% 0 0 10 10 0 10
'16 % of Total
2006 2011 2016 2006 2011 2016 2006 2011 2016Total Usual Workers 70 15 80 100% 55 15 45 15 0 30
Commute within Community 55 0 25 31.3% 45 0 10 10 0 15Commute within RDCK 15 0 55 68.8% 10 0 35 10 0 20Commute within Province 0 0 0 0.0% 0 0 0 0 0 0Commute outside of Province 0 0 0 0.0% 0 0 0 0 0 0
Total '16 % of Total
Owners Renters

79
Housing – Structural Types HNRR Section 6 (1)(a – b) – Source: Statistics Canada
Housing – Unit Size HNRR Section 6 (1)(c) – Source: Statistics Canada
Housing – Date Built HNRR Section 6 (1)(c) – Source: Statistics Canada
Housing – Subsidized HNRR Section 6 (1)(e) Housing Registry Subsidized Unit Stock = 0 Housing – Rental Vacancy HNRR Section 6 (1)(i – j) * -- Source: CMHC
* vacancy reflects the City of Nelson and its surrounding areas
Total Total Total Owners Oweners Owners Renters Renters Renters2006 2011 2016 2006 2011 2016 2006 2011 2016
Total Occupied Dwellings 150 70 140 100% 120 60 105 30 0 30Single-Detached 115 65 115 82.1% 95 65 95 20 0 20Apartment (5+) 0 0 0 0.0% 0 0 0 0 0 0Other 0 0 20 14.3% 0 0 10 0 0 10
Semi-Detached 0 0 0 0.0% 0 0 0 0 0 0Row House 0 0 0 0.0% 0 0 0 0 0 0Duplex 0 0 0 0.0% 0 0 10 0 0 0Apartment 0 0 15 10.7% 0 0 10 0 0 10Other single-attached 0 0 0 0.0% 0 0 0 0 0 0
Movable 30 0 0 0.0% 15 0 0 15 0 0
'16 % of Total
Total Total Total Owners Oweners Owners Renters Renters Renters2006 2011 2016 2006 2011 2016 2006 2011 2016
Total Dwellings 145 65 140 100% 115 65 105 30 0 30No bedroom 0 0 0 0.0% 0 0 0 0 0 01 bedroom 20 0 0 0.0% 10 0 0 15 0 02 bedroom 40 0 40 28.6% 30 0 25 15 0 153+ bedroom 80 10 90 64.3% 75 15 80 10 0 15
'16 % of Total
Total Total Total Owners Oweners Owners Renters Renters Renters2006 2011 2016 2006 2011 2016 2006 2011 2016
Total Dwellings 145 65 135 100% 115 65 105 100% 30 0 30 100%< 1960 45 0 45 33.3% 25 0 30 28.6% 20 0 10 33.3%1961 to 1980 75 0 30 22.2% 60 0 30 28.6% 15 0 0 0.0%1981 to 1990 20 0 20 14.8% 20 0 15 14.3% 0 0 0 0.0%1991 to 2000 10 0 20 14.8% 0 0 15 14.3% 0 0 0 0.0%2001 to 2010 0 0 15 11.1% 0 0 10 9.5% 0 0 10 33.3%2011 to 2016 0 0 10 7.4% 0 0 10 9.5% 0 0 10 33.3%
'16 % of Total
'16 % of Total
'16 % of Total
2013 2014 2015 2016 2017 2018 2019Bachelor 5.7 0.0 3.3 ** 0.0 0.0 0.01 Bedroom 0.5 0.6 0.0 0.0 0.0 0.0 0.02 Bedroom 2.0 0.8 0.0 0.8 0.0 0.0 0.03 Bedroom + ** ** ** ** ** ** **Total 1.9 0.6 0.4 0.7 0.0 0.0 0.4

80
Housing – Primary Rental Universe HNRR Section 6 (1)(k)(i) – Source: CMHC
* reflects the City of Nelson and its surrounding areas Housing – Secondary Rental Universe HNRR Section 6 (1)(k)(ii) – Source: Statistics Canada, CMHC
* assumes no primary rental market in areas that are not the City of Nelson (expressed in 2016 numbers) Housing – Short Term Rentals HNRR Section 6 (1)(k)(iii) – Source: AirDNA
* assumes no primary rental market in areas not City of Nelson (expressed in 2016 numbers) Housing – Cooperatives HNRR Section 6 (1)(l) – Source: BC Housing [not applicable] No cooperatives listed by the Coop Housing Federation of BC Housing – Post-Secondary Beds HNRR Section 6 (1)(o) – Source: AEST [not applicable] AEST data does not list any beds exist in the community. Housing – Shelter Beds HNRR Section 6 (1)(p) – Source: BC Housing [not applicable] No BC Housing affiliated shelters (emergency shelters or homeless housing) are only available in the City of Nelson
UNIT TYPE 2013 2014 2015 2016 2017 2018 2019Bachelor 74 73 65 59 58 58 521 Bedroom 179 174 176 170 174 170 1772 Bedroom 253 253 255 255 255 271 2623 Bedroom + 15 15 14 16 16 16 18Total 521 515 510 500 503 515 509
Rental % of TotalTotal 135 30 0 - 30 100%
No Bedroom 0 0 0 - 0 0%1 Bedroom 0 0 0 - 0 0%2 Bedroom 40 15 0 - 15 50%3+ Bedroom 95 15 0 - 15 50%
Secondary Market % of TotalTotal
Primary Market
2014 2015 2016 2017 2018 2019 2020Total Properties 0 0 5 7 3 11 5
Monthly Revenue / Listing - - $1,141 $4,678 $11,324 $4,380 $2,510Annual Available Days / Listing - - 108 184 189 130 80Annual Reserved Days / Listing - - 8 30 52 32 12Average Occupancy - - 7% 14% 22% 20% 13%
Commercial Properties 0 0 1 3 3 4 4

81
Housing – Non-Market Housing Source: BC Housing
Housing – Demolitions HNRR Section 6 (1)(m)(i – iv) – Source: Local Government [not applicable] Demolition data unavailable at local government level. Housing – Starts HNRR Section 6 (1)(m)(i – iv)* -- Source: Local Government, BC Stats
* housing starts available in lieu of substantial completions; aggregate and unit totals differ due to different sources Housing – Registered New Homes HNRR Section 6 (1)(m)(i – iv) – Source: BC Stats
Real Estate – Assessment HNRR Section 6 (1)(m)(i – iv) – Source: BC Assessment Median Assessment in ‘000s (2019 dollars)
SlocanEmergency Shelter / Homeless Housing
Homeless Housed 0Homeless Rent Supplements 0Homeless Shelters 0
Emergency Subtotal 0Transitional Supported / Assisted Living
Frail Seniors 0Special Needs 0Women and Children Fleeing Violence 0
Transitional Subtotal 0Independent Social Housing
Low Income Families 0Low Income Seniors 12
Social Housing Subtotal 12Rent Assistance in Private Market
Rent Assist Families -Rent Assist Seniors -
Rent Assistance Subtotal 10Community Total 22
2010 2011 2012 2013 2014 2015 2016 2017 2018 2019Slocan 0 0 1 2 0 0 3 3 0 0
Single-Detached 0 0 0 0 0 0 0 0 0 0Manufactured 0 0 0 0 0 0 0 0 0 0Multi Family 0 0 0 0 0 0 0 0 0 0
2016 2017 2018Single Detached * * *Multi Unit * * *Purpose Built Rental * 8 *
2006 2007 2008 2009 2010 2011 2012 2013 2014 2015 2016 2017 2018 2019Single-Detached $89 $134 $155 $156 $189 $176 $184 $160 $155 $154 $161 $172 $176 $183Row House - - - - - - - - - - $217 $198 $201 $158Manufactured Home $57 $75 $88 $50 $64 $58 $89 $79 $107 $103 $102 $103 $148 $163Apartment - - - - - - - - - - - $239 $233 $229Grand Total $77 $112 $130 $125 $153 $142 $148 $129 $147 $145 $160 $175 $179 $179

82
Average Assessment in ‘000s (2019 dollars)
Real Estate – Sales Price HNRR Section 6 (1)(m)(i – iv)* – Source: BC Assessment Median Sale Price in ‘000s (2019 dollars)
Average Sale Price in ‘000s (2019 dollars)
Real Estate – Rents HNRR Section 6 (1)(h)(i – ii)* -- Source: CMHC
Bedrooms 2006 2007 2008 2009 2010 2011 2012 2013 2014 2015 2016 2017 2018 20191 $42 $63 $85 $95 $98 $96 $115 $106 $103 $102 $107 $171 $161 $1692 $51 $71 $84 $82 $102 $93 $96 $83 $122 $120 $155 $153 $154 $1353+ $106 $155 $175 $179 $224 $207 $196 $170 $178 $176 $184 $199 $207 $209Grand Total $77 $112 $130 $125 $153 $142 $148 $129 $147 $145 $160 $175 $179 $179
2006 2007 2008 2009 2010 2011 2012 2013 2014 2015 2016 2017 2018 2019Single-Detached $98 $148 $169 $170 $203 $193 $194 $170 $166 $168 $168 $180 $181 $192Row House - - - - - - - - - - $210 $190 $193 $156Manufactured Home $58 $76 $88 $50 $61 $56 $88 $79 $105 $103 $103 $109 $149 $168Apartment - - - - - - - - - - - $239 $233 $229Grand Total $83 $121 $138 $136 $163 $154 $154 $136 $156 $157 $165 $180 $181 $184
Bedrooms 2006 2007 2008 2009 2010 2011 2012 2013 2014 2015 2016 2017 2018 20191 $58 $87 $106 $121 $130 $126 $134 $125 $120 $120 $117 $180 $167 $1792 $51 $72 $84 $82 $101 $94 $97 $89 $128 $127 $155 $154 $152 $1373+ $113 $166 $187 $194 $236 $223 $202 $175 $186 $190 $191 $206 $209 $214Grand Total $83 $121 $138 $136 $163 $154 $154 $136 $156 $157 $165 $180 $181 $184
2006 2007 2008 2009 2010 2011 2012 2013 2014 2015 2016 2017 2018 2019Single-Detached $129 $149 $226 $235 $239 $228 $179 $103 $158 $244 $162 $186 $218 $250Row House - - - - - - - - - - - $186 $163 $166Manufactured Home $76 $66 $114 $172 $117 $75 - - $80 $199 $117 - $178 -Apartment - - - - - - - - - - - - - -Grand Total $108 $135 $198 $224 $215 $177 $179 $103 $132 $229 $150 $186 $196 $216
Bedrooms 2006 2007 2008 2009 2010 2011 2012 2013 2014 2015 2016 2017 2018 20191 - $48 - $288 $315 - - $74 - - - - - -2 $69 $94 $164 $176 $169 $150 $106 - $107 $199 $130 $201 $172 $1653+ $134 $192 $232 $235 $210 $231 $251 $132 $181 $244 $171 $172 $219 $250Grand Total $108 $135 $198 $224 $215 $177 $179 $103 $132 $229 $150 $186 $196 $216
2006 2007 2008 2009 2010 2011 2012 2013 2014 2015 2016 2017 2018 2019Single-Detached $131 $158 $222 $229 $237 $218 $179 $103 $158 $244 $162 $195 $216 $245Row House - - - - - - - - - - - $186 $163 $165Manufactured Home $81 $73 $114 $172 $117 $75 - - $80 $199 $107 - $178 -Apartment - - - - - - - - - - - - - -Grand Total $111 $144 $195 $219 $213 $170 $179 $103 $132 $229 $148 $193 $194 $213
Bedrooms 2006 2007 2008 2009 2010 2011 2012 2013 2014 2015 2016 2017 2018 20191 - $48 - $245 $315 - - $74 - - - - - -2 $78 $92 $168 $183 $169 $151 $106 - $107 $199 $125 $209 $176 $1653+ $134 $211 $222 $235 $206 $209 $251 $132 $181 $244 $171 $177 $213 $244Grand Total $111 $144 $195 $219 $213 $170 $179 $103 $132 $229 $148 $193 $194 $213

83
Median rents (2019 dollars)
Average rents (2019 dollars)
* Available only for City of Nelson; rents not available before 2013 Core Housing Need – Affordability HNRR Section 7 (a)(i – ii) – Source: Statistics Canada
Core Housing Need – Adequacy HNRR Section 7 (a)(iii – iv) – Source: Statistics Canada
Core Housing Need – Suitability HNRR Section 7 (a)(v – vi) – Source: Statistics Canada
2013 2014 2015 2016 2017 2018 2019Bachelor $604 $647 $645 $636 $624 $685 $6501 Bedroom $713 $718 $725 $763 $708 $750 $8002 Bedroom $796 $782 $801 $795 $890 $913 $9753 Bedroom + $1,070 $1,079 $1,075 $1,100 $1,119 $1,120 $1,110Total $768 $755 $774 $790 $801 $811 $863
2013 2014 2015 2016 2017 2018 2019Bachelor $578 $593 $615 $641 $615 $643 $6501 Bedroom $721 $740 $735 $757 $733 $768 $8032 Bedroom $869 $894 $869 $880 $954 $949 $1,0373 Bedroom + $1,235 $1,199 $1,188 $1,159 $1,241Total $779 $802 $796 $818 $849 $865 $913
Total Total Total Owners Oweners Owners Renters Renters Renters2006 2011 2016 2006 2011 2016 2006 2011 2016
Total Households 150 65 130 115 60 105 35 0 25Above Affordable Threshold 30 0 0 20 0 0 15 0 0
1 person household 15 0 0 15 0 0 0 0 02 persons household 10 0 0 0 0 0 0 0 03 persons household 10 0 0 0 0 0 10 0 04 persons household 10 0 0 0 0 0 0 0 05+ persons household 0 0 0 0 0 0 0 0 0
Unaffordable Housing (%) 20.0% 0.0% 0.0% 17.4% 0.0% 0.0% 42.9% - 0.0%
Total Total Total Owners Oweners Owners Renters Renters Renters2006 2011 2016 2006 2011 2016 2006 2011 2016
Total Households 150 65 130 115 60 105 35 0 25Below Adequacy Standard 25 0 0 25 0 0 0 0 0
1 person household 0 0 0 0 0 0 0 0 02 persons household 15 0 0 15 0 0 0 0 03 persons household 0 0 0 0 0 0 0 0 04 persons household 0 0 0 0 0 0 0 0 05+ persons household 10 0 0 0 0 0 0 0 0
Inadequate Housing (%) 16.7% 0.0% 0.0% 21.7% 0.0% 0.0% 0.0% - 0.0%
Total Total Total Owners Oweners Owners Renters Renters Renters2006 2011 2016 2006 2011 2016 2006 2011 2016
Total Households 150 65 130 115 60 105 35 0 25Below Suitability Standard 10 0 0 0 0 0 10 0 0
1 Person 0 0 0 0 0 0 0 0 02 Persons 0 0 0 0 0 0 0 0 03 Persons 0 0 0 0 0 0 0 0 04 Persons 0 0 0 0 0 0 0 0 05+ Persons 0 0 0 0 0 0 0 0 0
Unsuitable Housing (%) 6.7% 0.0% 0.0% 0.0% 0.0% 0.0% 28.6% - 0.0%

84
Core Housing Need HNRR Section 8 (1)(a)(i – ii) – Source: Statistics Canada
Extreme Core Housing Need HNRR Section 8 (1)(a)(iii – iv) – Source: Statistics Canada
Income Category v. Price Source: Statistics Canada, Local Listings, BC Assessment, Environics Analytics [not applicable] Income data is unavailable for the community due to suppression and/or rounding, meaning a gap analysis cannot be done. Family Income v. Price Source: Statistics Canada, Local Listings, BC Assessment, Environics Analytics [not applicable] Income data is unavailable for the community due to suppression and/or rounding, meaning a gap analysis cannot be done. Housing Units Demanded Local Government Act: 585.3 (c)(i – ii); VC: 574.3(c)(i – ii) Source: Statistics Canada, BC Stats
Total Total Total Owners Oweners Owners Renters Renters Renters2006 2011 2016 2006 2011 2016 2006 2011 2016
Total Households 145 0 0 115 0 0 30 0 0Household not in CHN 105 0 0 85 0 0 20 0 0Household in CHN 40 0 0 30 0 0 10 0 0
1 person household 20 0 0 20 0 0 0 0 02 persons household 10 0 0 10 0 0 0 0 03 persons household 10 0 0 0 0 0 0 0 04 persons household 0 0 0 0 0 0 0 0 05+ persons household 10 0 0 0 0 0 0 0 0
Household in CHN (%) 27.6% - - 26.1% - - 33.3% - -
Total Total Total Owners Oweners Owners Renters Renters Renters2006 2011 2016 2006 2011 2016 2006 2011 2016
Total Households 145 0 0 115 0 0 30 0 0Household not in ECHN 125 0 0 105 0 0 20 0 0Household in ECHN 20 0 0 10 0 0 10 0 0
1 person household 10 0 0 0 0 0 0 0 02 persons household 0 0 0 0 0 0 0 0 03 persons household 10 0 0 0 0 0 10 0 04 persons household 10 0 0 0 0 0 10 0 05+ persons household 0 0 0 0 0 0 0 0 0
Household in ECHN (%) 13.8% - - 8.7% - - 33.3% - -
2016 2017 2018 2019 2020 2021 2022 2023 2024 2025Total Population 255 245 235 225 215 275 275 275 275 275Total Households 170 170 170 170 170 165 165 165 165 165
No Bedroom 0 0 0 0 0 0 0 0 0 01 Bedroom 0 0 0 0 0 15 15 15 15 152 Bedroom 50 50 50 50 50 45 45 45 45 453+ Bedroom 120 120 120 120 120 105 105 105 105 105
Household Size 1.55 1.48 1.42 1.36 1.30 1.67 1.67 1.67 1.67 1.67Renter Demand 23.5% 23.5% 23.5% 23.5% 23.5% 24.2% 24.2% 24.2% 24.2% 24.2%

85
APPENDIX D – Electoral Area H Data Tables Historical & Anticipated Population & Households Housing Needs Report Regulation (HNRR) Section 3 (1)(a)(i – iv), (1)(b), & (2)(a –g)* Source: Statistics Canada, BC Stats
* distributions graphically represented in report Indigenous Identity Source: Statistics Canada
Mobility HNRR Section 3 (1)(a)(x) – Source: Statistics Canada
Post-Secondary Enrollment HNRR Section 3(1)(c) – Source: AEST [not applicable] No enrollment data available for the community Homelessness HNRR Section 3(1)(d) – Source: BC Housing [not applicable] Homelessness counts only available for the City of Nelson
2006 2011 2016 2017 2018 2019 2020 2021 2022 2023 2024 2025Total 4,535 4,470 4,855 4,875 4,895 4,915 4,935 4,980 5,020 5,060 5,100 5,140 7.1% 5.9%
< 14 yrs 715 670 770 765 760 755 750 755 750 745 740 735 7.7% -4.5%15 to 19 yrs 275 225 220 205 190 175 160 155 160 165 170 175 -20.0% -20.5%20 to 24 yrs 165 175 155 175 195 215 235 265 250 235 220 205 -6.1% 32.3%25 to 64 yrs 2,830 2,770 2,870 2,845 2,820 2,795 2,770 2,735 2,760 2,785 2,810 2,835 1.4% -1.2%65 to 84 yrs 495 590 785 825 865 905 945 990 1,010 1,030 1,050 1,070 58.6% 36.3%85+ yrs 55 40 55 60 65 70 75 80 90 100 110 120 0.0% 118.2%
Median Age 43.6 48.4 46.7 47.1 47.5 48.0 48.4 48.8 48.7 48.5 48.4 48.3 7.1% 3.3%Average Age 40.4 41.8 42.5 42.8 43.1 43.4 43.7 43.8 43.9 44.1 44.3 44.5 5.3% 4.6%Households (HHs) 2,095 2,040 2,230 2,250 2,270 2,290 2,310 2,330 2,355 2,380 2,405 2,430 6.4% 9.0%Average HH Size 2.2 2.2 2.2 2.2 2.2 2.1 2.1 2.1 2.1 2.1 2.1 2.1 0.6% -2.8%
%∆ '16-'25
%∆ '06-'16
Total Total Total Owners Oweners Owners Renters Renters Renters2006 2011 2016 2006 2011 2016 2006 2011 2016
Total Population 4,295 4,190 4,610 3,750 3,625 3,895 545 565 715Indigenous Identity 110 100 315 65 80 250 50 0 60Non-Indigenous Identity 4,185 4,095 4,290 3,685 3,545 3,640 500 550 655
Total Total Total Owners Oweners Owners Renters Renters Renters2006 2011 2016 2006 2011 2016 2006 2011 2016
Total Population 100% 100% 100% 100% 100% 100% 100% 100% 100%Indigenous Identity 2.6% 2.4% 6.8% 1.7% 2.2% 6.4% 9.2% 0.0% 8.4%Non-Indigenous Identity 97.4% 97.7% 93.1% 98.3% 97.8% 93.5% 91.7% 97.3% 91.6%
Total Total Total Owners Oweners Owners Renters Renters Renters2006 2011 2016 2006 2011 2016 2006 2011 2016
Total Population 4,255 4,180 4,540 3,715 3,615 3,835 540 565 710Non-Mover 3,760 3,750 4,055 3,455 3,375 3,510 305 375 545Mover 495 435 485 260 240 325 235 190 155
Non-Migrant 145 130 95 30 75 60 105 55 30Migrants 350 300 395 225 165 265 125 140 125
Internal Migrants 290 295 380 165 155 255 125 135 130Intraprovincial Migrant 265 185 295 150 140 185 115 50 105Interprovincial Migrant 25 110 90 15 0 65 10 0 25
External Migrant 60 0 15 60 0 10 0 0 0

86
Private Household Size HNRR Section 3 (1)(v – viii) – Source: Statistics Canada
Household Maintainers Source: Statistics Canada
Owners w/ Mortgages & Renters in Subsidized Housing HNRR Section 3 (1)(ix) – Source: Statistics Canada
Household Income HNRR Section 4(a – e)* – Source: Statistics Canada
* smaller income brackets shown in the report for readability
Total Total Total Owners Oweners Owners Renters Renters Renters Renters Renters Renter %2006 2011 2016 2006 2011 2016 2006 2011 2016 2006 2011 2016
Total Private HHs 1,960 2,010 2,130 100% 1,670 1,720 1,750 290 285 380 15% 14% 18%1 person 630 650 730 34.4% 505 520 550 125 130 185 20% 20% 25%2 persons 755 910 770 36.2% 660 820 675 100 95 95 13% 10% 12%3 persons 270 190 305 14.4% 225 160 235 45 30 70 17% 16% 23%4 persons 200 190 230 10.8% 175 175 205 20 10 20 10% 5% 9%5+ persons 110 65 90 4.2% 110 45 85 0 0 10 0% 0% 11%
Average HH Size 2.2 2.1 2.2 2.3 2.1 2.2 1.8 1.9 1.9 - - -
'16 % of Total
Total Total Total Total Owners Oweners Owners Renters Renters Renters2006 2011 2016 10yr % ∆ 2006 2011 2016 2006 2011 2016
Total Household 1,960 2,010 2,125 8.4% 1,665 1,725 1,745 295 290 37515 - 24 yrs 45 0 15 -66.7% 15 0 10 30 0 1025 - 34 yrs 260 220 210 -19.2% 180 135 105 80 85 11035 - 44 yrs 385 360 380 -1.3% 305 315 285 80 45 9045 - 54 yrs 525 390 450 -14.3% 480 385 380 45 0 6555 - 64 yrs 385 580 525 36.4% 345 485 490 35 95 3565 - 74 yrs 225 265 370 64.4% 205 250 305 15 20 6075 - 84 yrs 115 155 140 21.7% 110 115 125 0 0 1585+ yrs 25 40 40 60.0% 25 40 45 0 0 0
2006 2011 2016Owners 1,650 1,685 1,700
w/ Mortgage (#) 810 860 870w/ Mortgage (%) 49% 51% 51%
Renters 290 290 375Subsidised (#) 0 15 30Subsidied (%) 0% 5% 8%
Total Total Total Owners Oweners Owners Renters Renters Renters2005 2010 2015 2005 2010 2015 2005 2010 2015
Total Household 1960 2015 2130 100.0% 1670 1725 1750 100.0% 290 290 380 100.0%< $5,000 120 95 80 3.8% 95 95 50 2.9% 25 0 30 7.9%$5,000 - $9,999 85 140 70 3.3% 50 100 45 2.6% 40 0 25 6.6%$10,000 - $14,999 140 95 120 5.6% 85 70 85 4.9% 60 25 35 9.2%$15,000 - $19,999 130 195 155 7.3% 100 145 110 6.3% 30 50 45 11.8%$20,000 - $24,999 135 85 205 9.6% 125 65 145 8.3% 0 20 55 14.5%$25,000 - $29,999 160 60 105 4.9% 135 45 85 4.9% 25 15 20 5.3%$30,000 - $34,999 175 105 165 7.7% 160 80 125 7.1% 20 0 40 10.5%$35,000 - $39,999 45 105 120 5.6% 50 75 100 5.7% 0 0 20 5.3%$40,000 - $44,999 135 130 75 3.5% 125 130 75 4.3% 0 0 0 0.0%$45,000 - $49,999 115 80 75 3.5% 115 75 70 4.0% 0 0 0 0.0%$50,000 - $59,999 130 160 180 8.5% 115 150 140 8.0% 15 0 40 10.5%$60,000 - $69,999 155 150 135 6.3% 130 90 135 7.7% 25 55 0 0.0%$70,000 - $79,999 110 125 100 4.7% 95 125 85 4.9% 15 0 15 3.9%$80,000 - $89,999 60 170 110 5.2% 50 165 95 5.4% 10 0 15 3.9%$90,000 - $99,999 65 85 95 4.5% 65 90 90 5.1% 0 0 10 2.6%$100,000+ 205 225 330 15.5% 190 225 305 17.4% 20 0 20 5.3%
$100,000 - $124,999 100 140 165 7.7% 85 130 145 8.3% 20 0 15 3.9%$125,000 - $149,999 50 55 75 3.5% 50 60 75 4.3% 0 0 0 0.0%$150,000 - $199,999 10 35 70 3.3% 10 30 60 3.4% 0 0 10 2.6%$200,000+ 45 0 20 0.9% 45 0 20 1.1% 0 0 0 0.0%
Median Income $37,306 $45,004 $42,986 $41,423 $47,831 $49,207 $16,956 $28,702 $24,567Average Income $49,541 $52,023 $56,146 $52,597 $55,057 $60,625 $32,015 $33,964 $35,427
% of Total
% of Total
% of Total

87
Labour Force HNRR Section 5(a) & Section 7(b – c) – Source: Statistics Canada
NAICS Industry Employment HNRR Section 5(b) – Source: Statistics Canada
Commuting HNRR Section 7(d – g) – Source: Statistics Canada
Housing – Structural Types HNRR Section 6 (1)(a – b) – Source: Statistics Canada
Total Total Total Owners Oweners Owners Renters Renters Renters2006 2011 2016 2006 2011 2016 2006 2011 2016
Total Population (15+ yrs) 3,595 3,665 3,855 3,165 3,230 3,270 430 440 590In Labour Force 2,315 2,355 2,460 2,055 2,100 2,090 265 260 375
Employed 2,140 2,025 2,200 1,910 1,875 1,900 230 145 300Unemployed 175 330 260 145 220 195 30 115 70
Not In Labour Force 1,280 1,310 1,400 1,110 1,130 1,180 165 175 220Participation Rate (%) 64.5 64.3 63.8 64.8 65.0 64.0 61.6 59.1 63.6Employment Rate (%) 59.6 55.3 57.1 60.4 58.0 58.0 54.6 33.0 51.7Unemployment Rate (%) 7.6 14.2 10.6 7.1 10.5 9.3 11.3 44.2 18.7
Total Total Total Owners Oweners Owners Renters Renters Renters2006 2011 2016 2006 2011 2016 2006 2011 2016
Labour Force 2,265 2,330 2,405 100.0% 2,005 2,075 2,045 265 255 355Agriculture, Forestry, Fishing, & Hunting 150 75 170 7.1% 150 70 125 0 0 45Mining, Quarrying, and Oil & Gas Extraction 10 85 50 2.1% 10 75 25 0 0 25Utilities 30 0 35 1.5% 30 0 35 0 0 0Construction 330 415 370 15.4% 285 345 335 50 75 30Manufacturing 300 80 205 8.5% 255 80 170 40 0 35Wholesale trade 40 45 65 2.7% 45 35 55 0 0 15Retail trade 185 220 280 11.6% 170 200 230 15 15 50Transportation & Warehousing 110 65 95 4.0% 105 55 85 0 0 10Information & Cultural Industries 35 75 40 1.7% 35 75 35 0 0 10Finance & Insurance 25 0 30 1.2% 25 0 20 0 0 0Real Estate and Rental & Leasing 25 75 10 0.4% 30 35 15 0 0 0Professional, Scientific, & Technical Services 140 95 165 6.9% 130 85 145 10 0 20Management of Companies & Enterprises 0 0 0 0.0% 0 0 0 0 0 0Administrative & Support, Waste Management, an 105 20 80 3.3% 80 20 65 25 0 15Educational Services 115 195 150 6.2% 85 185 145 30 0 10Health Care & Social Assistance 225 325 195 8.1% 205 310 160 15 0 30Arts, Entertainment, & Recreation 90 45 110 4.6% 85 35 95 10 0 20Accommodation & Food Services 135 150 120 5.0% 105 150 100 30 0 20Other Services (excl. Public Administration) 130 175 165 6.9% 95 170 145 35 0 20Public Administration 85 160 80 3.3% 85 110 70 0 0 10
'16 % of Total
2006 2011 2016 2006 2011 2016 2006 2011 2016Total Usual Workers 1,170 1,200 1,255 100% 1,050 1,125 1,105 120 75 145
Commute within Community 205 195 335 26.7% 180 185 290 25 15 40Commute within RDCK 915 880 805 64.1% 825 825 705 95 50 100Commute within Province 30 130 95 7.6% 25 115 90 0 0 0Commute outside of Province 20 0 25 2.0% 20 0 20 0 0 10
Total '16 % of Total
Owners Renters
Total Total Total Owners Oweners Owners Renters Renters Renters2006 2011 2016 2006 2011 2016 2006 2011 2016
Total Occupied Dwellings 1,960 2,010 2,125 100% 1,665 1,720 1,750 290 290 380Single-Detached 1,765 1,795 1,890 88.9% 1,510 1,595 1,575 260 200 315Apartment (5+) 0 0 0 0.0% 0 0 0 0 0 0Other 40 15 45 2.1% 10 0 20 30 0 25
Semi-Detached 0 0 0 0.0% 10 0 0 0 0 0Row House 30 0 0 0.0% 10 0 0 25 0 0Duplex 0 0 15 0.7% 0 0 15 0 0 0Apartment 0 0 30 1.4% 0 0 0 10 0 30Other single-attached 0 0 10 0.5% 0 0 10 0 0 0
Movable 155 200 195 9.2% 150 120 155 0 75 35
'16 % of Total

88
Housing – Unit Size HNRR Section 6 (1)(c) – Source: Statistics Canada
Housing – Date Built HNRR Section 6 (1)(c) – Source: Statistics Canada
Housing – Subsidized HNRR Section 6 (1)(e) Housing Registry Subsidized Unit Stock = 0 Housing – Rental Vacancy Section 6 (1)(i – j) * -- Source: CMHC
* vacancy reflects the City of Nelson and its surrounding areas Housing – Primary Rental Universe HNRR Section 6 (1)(k)(i) – Source: CMHC
* reflects the City of Nelson and its surrounding areas Housing – Secondary Rental Universe HNRR Section 6 (1)(k)(ii) – Source: Statistics Canada, CMHC
* assumes no primary rental market in areas that are not the City of Nelson (expressed in 2016 numbers)
Total Total Total Owners Oweners Owners Renters Renters Renters2006 2011 2016 2006 2011 2016 2006 2011 2016
Total Dwellings 1,960 2,015 2,125 100% 1,670 1,725 1,750 290 290 380No bedroom 100 80 20 0.9% 75 0 10 25 0 101 bedroom 300 210 220 10.4% 220 115 160 80 100 602 bedroom 610 615 745 35.1% 500 500 570 115 115 1753+ bedroom 950 1,110 1,140 53.6% 880 1,040 1,005 75 60 135
'16 % of Total
Total Total Total Owners Oweners Owners Renters Renters Renters2006 2011 2016 2006 2011 2016 2006 2011 2016
Total Dwellings 1,955 2,015 2,130 100% 1,665 1,725 1,750 100% 290 290 380 100%< 1960 440 275 375 17.6% 350 230 275 15.7% 90 45 100 26.3%1961 to 1980 615 655 660 31.0% 500 555 545 31.1% 115 100 115 30.3%1981 to 1990 370 190 355 16.7% 340 175 280 16.0% 30 10 75 19.7%1991 to 2000 400 320 390 18.3% 370 245 355 20.3% 30 75 40 10.5%2001 to 2010 130 570 215 10.1% 105 515 190 10.9% 25 45 25 6.6%2011 to 2016 0 0 135 6.3% 0 0 115 6.6% 0 0 25 6.6%
'16 % of Total
'16 % of Total
'16 % of Total
2013 2014 2015 2016 2017 2018 2019Bachelor 5.7 0.0 3.3 ** 0.0 0.0 0.01 Bedroom 0.5 0.6 0.0 0.0 0.0 0.0 0.02 Bedroom 2.0 0.8 0.0 0.8 0.0 0.0 0.03 Bedroom + ** ** ** ** ** ** **Total 1.9 0.6 0.4 0.7 0.0 0.0 0.4
UNIT TYPE 2013 2014 2015 2016 2017 2018 2019Bachelor 74 73 65 59 58 58 521 Bedroom 179 174 176 170 174 170 1772 Bedroom 253 253 255 255 255 271 2623 Bedroom + 15 15 14 16 16 16 18Total 521 515 510 500 503 515 509
Rental % of TotalTotal 2,125 380 0 - 380 100%
No Bedroom 20 10 0 - 10 3%1 Bedroom 220 60 0 - 60 16%2 Bedroom 745 175 0 - 175 46%3+ Bedroom 1,140 135 0 - 135 36%
Secondary Market % of TotalTotal
Primary Market

89
Housing – Short Term Rentals HNRR Section 6 (1)(k)(iii) – Source: AirDNA
* assumes no primary rental market in areas not City of Nelson (expressed in 2016 numbers) Housing – Cooperatives HNRR Section 6 (1)(l) – Source: BC Housing [not applicable] No cooperatives listed by the Coop Housing Federation of BC Housing – Post-Secondary Beds HNRR Section 6 (1)(o) – Source: AEST [not applicable] AEST data does not list any beds exist in the community. Housing – Shelter Beds HNRR Section 6 (1)(p) – Source: BC Housing [not applicable] No BC Housing affiliated shelters (emergency shelters or homeless housing) are only available in the City of Nelson Housing – Non-Market Housing Source: BC Housing
2014 2015 2016 2017 2018 2019 2020Total Properties 0 1 16 51 69 78 41
Monthly Revenue / Listing - $1,850 $4,147 $5,246 $6,242 $5,782 $3,920Annual Available Days / Listing - 82 95 121 116 94 28Annual Reserved Days / Listing - 16 25 41 52 57 39Average Occupancy - 16% 21% 25% 31% 38% 58%
Commercial Properties 0 1 13 37 49 54 30
Electoral Area HEmergency Shelter / Homeless Housing
Homeless Housed 0Homeless Rent Supplements 0Homeless Shelters 0
Emergency Subtotal 0Transitional Supported / Assisted Living
Frail Seniors 0Special Needs 0Women and Children Fleeing Violence 0
Transitional Subtotal 0Independent Social Housing
Low Income Families 0Low Income Seniors 10
Social Housing Subtotal 10Rent Assistance in Private Market
Rent Assist Families 14Rent Assist Seniors 13
Rent Assistance Subtotal 27Community Total 37

90
Housing – Demolitions HNRR Section 6 (1)(m)(i – iv) – Source: Local Government [not applicable] Demolition data unavailable at local government level. Housing – Starts HNRR Section 6 (1)(m)(i – iv)* -- Source: Local Government, BC Stats
* housing starts available in lieu of substantial completions; aggregate and unit totals differ due to different sources Housing – Registered New Homes HNRR Section 6 (1)(m)(i – iv) – Source: BC Stats [not applicable] No registered new homes data available for the community. Real Estate – Assessment HNRR Section 6 (1)(m)(i – iv) – Source: BC Assessment Median Assessment in ‘000s (2019 dollars)
Average Assessment in ‘000s (2019 dollars)
Real Estate – Sales Price HNRR Section 6 (1)(m)(i – iv)* – Source: BC Assessment
2010 2011 2012 2013 2014 2015 2016 2017 2018 2019Electoral Area H 31 35 19 25 22 21 24 31 3 17
Single-Detached 10 14 16 15 12 0 0 0 0 0Manufactured 6 12 4 6 3 5 3 10 6 3Multi Family 0 0 0 0 0 0 0 0 0 0
2006 2007 2008 2009 2010 2011 2012 2013 2014 2015 2016 2017 2018 2019Single-Detached $272 $352 $435 $429 $440 $426 $443 $402 $401 $379 $373 $370 $392 $444Semi-Detached $328 $456 $452 $448 - - - - - $280 $300 $284 $280 $498Row House - - - - - - - - - - $426 $424 $435 $388Manufactured Home $132 $177 $209 $206 $234 $208 $212 $197 $193 $205 $199 $196 $207 $225Apartment $340 $478 $531 $526 $526 $526 $544 $563 $542 $554 $547 $588 $594 $710Grand Total $241 $314 $383 $378 $389 $375 $394 $361 $360 $344 $340 $336 $354 $399
Bedrooms 2006 2007 2008 2009 2010 2011 2012 2013 2014 2015 2016 2017 2018 20190 - $332 $387 $380 $427 $380 $500 $456 $448 $410 $372 $356 $419 $4301 $231 $309 $351 $352 $372 $345 $342 $303 $297 $283 $274 $286 $310 $3562 $223 $301 $375 $364 $373 $353 $387 $359 $360 $335 $327 $320 $341 $3903+ $254 $329 $405 $402 $410 $409 $422 $388 $387 $380 $382 $375 $386 $430Total $237 $314 $383 $377 $389 $375 $393 $361 $359 $344 $340 $337 $355 $400
2006 2007 2008 2009 2010 2011 2012 2013 2014 2015 2016 2017 2018 2019Single-Detached $276 $360 $444 $441 $449 $434 $448 $407 $407 $385 $382 $377 $399 $451Semi-Detached $328 $456 $452 $448 - - - - - $280 $300 $284 $280 $498Row House - - - - - - - - - - $423 $422 $432 $403Manufactured Home $135 $181 $218 $210 $239 $213 $218 $200 $196 $211 $206 $206 $221 $245Apartment $340 $478 $531 $526 $526 $526 $544 $563 $542 $554 $547 $588 $594 $710Grand Total $245 $322 $392 $387 $397 $382 $399 $366 $364 $349 $348 $343 $363 $409
Bedrooms 2006 2007 2008 2009 2010 2011 2012 2013 2014 2015 2016 2017 2018 20190 - $332 $387 $380 $427 $380 $500 $456 $448 $410 $372 $356 $419 $4301 $232 $313 $362 $366 $376 $351 $353 $309 $304 $287 $278 $292 $317 $3682 $228 $313 $383 $376 $382 $363 $391 $361 $363 $340 $334 $328 $350 $3973+ $258 $333 $412 $408 $419 $415 $424 $395 $393 $387 $391 $381 $395 $443Total $241 $321 $391 $387 $397 $382 $398 $365 $364 $349 $348 $344 $363 $410

91
Median Sale Price in ‘000s (2019 dollars)
Average Sale Price in ‘000s (2019 dollars)
Real Estate – Rents HNRR Section 6 (1)(h)(i – ii)* -- Source: CMHC Median rents (2019 dollars)
Average rents (2019 dollars)
* Available only for City of Nelson; rents not available before 2013
2006 2007 2008 2009 2010 2011 2012 2013 2014 2015 2016 2017 2018 2019Single-Detached $245 $295 $386 $393 $336 $349 $377 $273 $314 $332 $287 $306 $375 $322Semi-Detached - - - - - - - - - - - - - -Row House - - - - - - - - - - - $338 $456 -Manufactured Home $111 $182 $218 $143 $207 $148 $136 $134 $197 $209 $149 $181 $83 $106Apartment - - - - - - - $490 - - - - - -Grand Total $200 $260 $337 $338 $302 $285 $300 $261 $280 $289 $270 $276 $331 $286
Bedrooms 2006 2007 2008 2009 2010 2011 2012 2013 2014 2015 2016 2017 2018 20190 - - - - - - - - - - - - - -1 $219 $316 $568 $349 $220 $318 $322 $198 $292 $356 $231 $245 $277 $2202 $158 $228 $248 $315 $284 $221 $243 $237 $223 $238 $199 $255 $317 $2413+ $234 $282 $366 $360 $361 $338 $338 $327 $317 $340 $343 $299 $369 $336Total $200 $265 $337 $338 $302 $285 $300 $261 $280 $289 $270 $276 $331 $286
2006 2007 2008 2009 2010 2011 2012 2013 2014 2015 2016 2017 2018 2019Single-Detached $255 $301 $394 $397 $339 $354 $378 $275 $318 $336 $287 $316 $375 $328Semi-Detached - - - - - - - - - - - - - -Row House - - - - - - - - - - - $338 $456 -Manufactured Home $115 $181 $224 $178 $206 $148 $138 $142 $195 $212 $149 $174 $97 $113Apartment - - - - - - - $490 - - - - - -Grand Total $208 $265 $344 $349 $304 $288 $302 $263 $282 $292 $270 $282 $333 $292
Bedrooms 2006 2007 2008 2009 2010 2011 2012 2013 2014 2015 2016 2017 2018 20190 - - - - - - - - - - - - - -1 $233 $332 $568 $349 $220 $318 $322 $198 $292 $365 $231 $267 $277 $2452 $168 $231 $257 $334 $288 $230 $240 $242 $227 $244 $198 $250 $320 $2493+ $239 $282 $373 $366 $361 $338 $344 $327 $320 $335 $344 $311 $370 $337Total $208 $269 $344 $349 $304 $288 $302 $263 $282 $292 $270 $282 $333 $292
2013 2014 2015 2016 2017 2018 2019Bachelor $604 $647 $645 $636 $624 $685 $6501 Bedroom $713 $718 $725 $763 $708 $750 $8002 Bedroom $796 $782 $801 $795 $890 $913 $9753 Bedroom + $1,070 $1,079 $1,075 $1,100 $1,119 $1,120 $1,110Total $768 $755 $774 $790 $801 $811 $863
2013 2014 2015 2016 2017 2018 2019Bachelor $578 $593 $615 $641 $615 $643 $6501 Bedroom $721 $740 $735 $757 $733 $768 $8032 Bedroom $869 $894 $869 $880 $954 $949 $1,0373 Bedroom + $1,235 $1,199 $1,188 $1,159 $1,241Total $779 $802 $796 $818 $849 $865 $913

92
Core Housing Need – Affordability HNRR Section 7 (a)(i – ii) – Source: Statistics Canada
Core Housing Need – Adequacy HNRR Section 7 (a)(iii – iv) – Source: Statistics Canada
Core Housing Need – Suitability HNRR Section 7 (a)(v – vi) – Source: Statistics Canada
Core Housing Need HNRR Section 8 (1)(a)(i – ii) – Source: Statistics Canada
Total Total Total Owners Oweners Owners Renters Renters Renters2006 2011 2016 2006 2011 2016 2006 2011 2016
Total Households 1,780 1,780 1,935 1,515 1,540 1,610 265 240 325Above Affordable Threshold 440 435 420 305 345 300 130 90 115
1 person household 185 160 185 115 105 115 65 60 702 persons household 140 175 125 95 155 100 45 0 253 persons household 45 25 65 30 20 55 15 0 104 persons household 65 70 45 55 70 35 10 0 155+ persons household 10 0 0 10 0 0 0 0 0
Unaffordable Housing (%) 24.7% 24.4% 21.7% 20.1% 22.4% 18.6% 49.1% 37.5% 35.4%
Total Total Total Owners Oweners Owners Renters Renters Renters2006 2011 2016 2006 2011 2016 2006 2011 2016
Total Households 1,780 1,780 1,935 1,515 1,540 1,610 265 240 325Below Adequacy Standard 265 250 250 215 150 200 50 100 45
1 person household 100 45 75 80 35 60 25 0 102 persons household 105 170 90 95 105 70 10 65 253 persons household 20 0 40 15 0 40 0 0 104 persons household 25 0 20 15 0 10 0 0 105+ persons household 10 0 20 15 0 20 0 0 0
Inadequate Housing (%) 14.9% 14.0% 12.9% 14.2% 9.7% 12.4% 18.9% 41.7% 13.8%
Total Total Total Owners Oweners Owners Renters Renters Renters2006 2011 2016 2006 2011 2016 2006 2011 2016
Total Households 1,780 1,780 1,935 1,515 1,540 1,610 265 240 325Below Suitability Standard 165 95 75 115 70 55 50 0 20
1 Person 0 0 0 0 0 0 0 0 02 Persons 45 0 20 25 0 15 15 0 03 Persons 30 0 10 20 0 10 10 0 04 Persons 65 0 15 40 0 10 20 0 105+ Persons 25 0 35 25 0 30 0 0 10
Unsuitable Housing (%) 9.3% 5.3% 3.9% 7.6% 4.5% 3.4% 18.9% 0.0% 6.2%
Total Total Total Owners Oweners Owners Renters Renters Renters2006 2011 2016 2006 2011 2016 2006 2011 2016
Total Households 1,780 1,785 1,940 1,515 1,540 1,610 265 240 320Household not in CHN 1,155 1,250 1,405 1,045 1,135 1,230 105 115 175Household in CHN 620 535 535 460 410 385 160 125 145
1 person household 200 175 215 130 105 150 70 65 652 persons household 210 230 155 155 200 115 55 25 353 persons household 80 25 75 60 20 50 20 0 204 persons household 100 75 55 85 70 40 10 0 155+ persons household 35 35 30 35 0 30 0 0 10
Household in CHN (%) 34.8% 30.0% 27.6% 30.4% 26.6% 23.9% 60.4% 52.1% 45.3%

93
Extreme Core Housing Need HNRR Section 8 (1)(a)(iii – iv) – Source: Statistics Canada
Income Category v. Price Source: Statistics Canada, Local Listings, BC Assessment, Environics Analytics
Family Income v. Price Source: Statistics Canada, Local Listings, BC Assessment, Environics Analytics
Total Total Total Owners Oweners Owners Renters Renters Renters2006 2011 2016 2006 2011 2016 2006 2011 2016
Total Households 1,780 1,785 1,940 1,515 1,540 1,610 265 240 320Household not in ECHN 1,620 1,670 1,750 1,420 1,450 1,480 200 215 260Household in ECHN 160 115 190 95 90 130 65 25 60
1 person household 110 90 95 60 65 60 50 25 352 persons household 35 0 45 15 0 35 20 0 03 persons household 0 0 20 10 0 10 0 0 04 persons household 15 0 30 10 0 20 0 0 105+ persons household 0 0 0 0 0 0 0 0 0
Household in ECHN (%) 9.0% 6.4% 9.8% 6.3% 5.8% 8.1% 24.5% 10.4% 18.8%
Single Semi Row MobileIncome Category Detached Detached House Duplex Home
Very Low $25,000 $147,500 -$175,000 - - - $42,500Low $40,000 $227,500 -$95,000 - - - $122,500Moderate $60,000 $341,000 $18,500 - - - $236,000Above Moderate $75,000 $432,000 $109,500 - - - $327,000
Median Income $49,999 $284,000 -$38,500 - - - $179,000
Budget v. Real Estate Prices
Household Income Purchase PriceMaximum Maximum Possible
Income CategoryVery Low $20,900 $1,300 -$1,250 $2,100 -$4,410Low $31,400 $1,900 -$650 $3,100 -$3,410Moderate $45,200 $2,700 $150 $4,500 -$2,010Above Moderate $55,000 $3,300 $750 $5,500 -$1,010
Median Income $38,600 $2,300 -$250 $3,900 -$2,610
Est. Maximum AT Afford. EnergyHousehold Income Budget, Utilities only
Budget v. Average Utility Expense
Afford. EnergyBudget, w/ Fuel
Budget v. AverageTotal Expense
Utilities Only Utilities + Fuel

94
Housing Units Demanded Local Government Act: 585.3 (c)(i – ii); VC: 574.3(c)(i – ii) Source: Statistics Canada, BC Stats
Single Semi Row MobileFamily Types Detached Detached House Duplex Home
Singles / Roommates $23,840 $136,500 -$186,000 - - - $31,500Lone parent $36,848 $204,500 -$118,000 - - - $99,500Couple w/ child $86,277 $488,500 $166,000 - - - $383,500Couple w/o child $68,089 $386,500 $64,000 - - - $281,500
Median Income $49,999 $284,000 -$38,500 - - - $179,000
Budget v. Real Estate PricesMaximum Maximum Possible
Household Income Purchase Price
Income CategorySingles / Roommates $20,119 $1,200 -$1,350 $2,000 -$4,510Lone parent $29,159 $1,700 -$850 $2,900 -$3,610Couple w/ child $62,410 $3,700 $1,150 $6,200 -$310Couple w/o child $50,528 $3,000 $450 $5,100 -$1,410
Median Income $38,600 $2,300 -$250 $3,900 -$2,610
Utilities Only Utilities + FuelEst. Maximum AT Afford. Energy Budget v. Average Afford. Energy Budget v. Average
Household Income Budget, Utilities only Utility Expense Budget, w/ Fuel Total Expense
2016 2017 2018 2019 2020 2021 2022 2023 2024 2025Total Population 4,855 4,875 4,895 4,915 4,935 4,980 5,020 5,060 5,100 5,140Total Households 2,235 2,260 2,285 2,310 2,335 2,335 2,350 2,365 2,380 2,395
No Bedroom 20 30 40 50 60 70 70 70 70 701 Bedroom 235 250 265 280 295 300 300 300 300 3002 Bedroom 785 780 775 770 765 775 780 785 790 7953+ Bedroom 1,195 1,200 1,205 1,210 1,215 1,190 1,200 1,210 1,220 1,230
Household Size 2.18 2.17 2.16 2.15 2.14 2.14 2.13 2.13 2.12 2.12Renter Demand 17.9% 17.7% 17.5% 17.3% 17.1% 16.5% 16.4% 16.3% 16.2% 16.1%