Slide9 -Keynote Address_mr Nabuo Tanaka (1)
35
© OECD/IEA 2011 Energy Security & Sustainability for Asia in the 21 st Century 2012/2/28 Kuala Lumpur Nobuo TANAKA Former Executive Director of the IEA Global Associate of Energy Security and Sustainability, IEEJ
-
Upload
juzaili-js -
Category
Documents
-
view
220 -
download
0
Transcript of Slide9 -Keynote Address_mr Nabuo Tanaka (1)
© OECD/IEA 2011
Energy Security & Sustainability for Asia in the 21st Century
2012/2/28 Kuala LumpurNobuo TANAKAFormer Executive Director of the IEAGlobal Associate of Energy Security and Sustainability, IEEJ
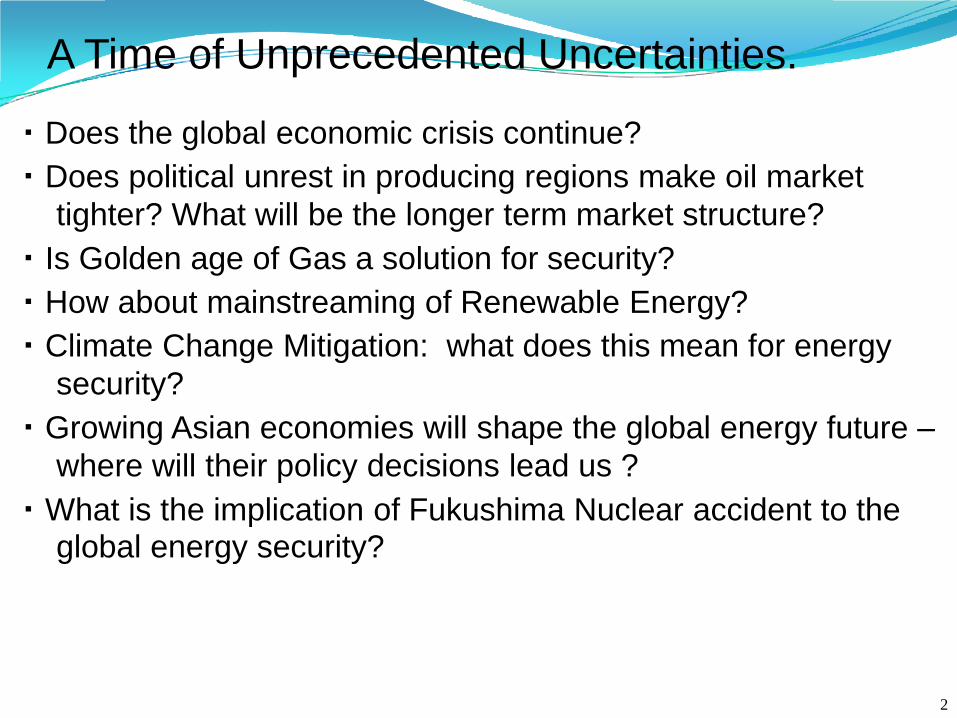
・ Does the global economic crisis continue?
・ Does political unrest in producing regions make oil market
tighter? What will be the longer term market structure?
・ Is Golden age of Gas a solution for security?
・ How about mainstreaming of Renewable Energy?
・ Climate Change Mitigation: what does this mean for energy
security?
・ Growing Asian economies will shape the global energy future –
where will their policy decisions lead us ?
・ What is the implication of Fukushima Nuclear accident to the global energy security?
A Time of Unprecedented Uncertainties.
2
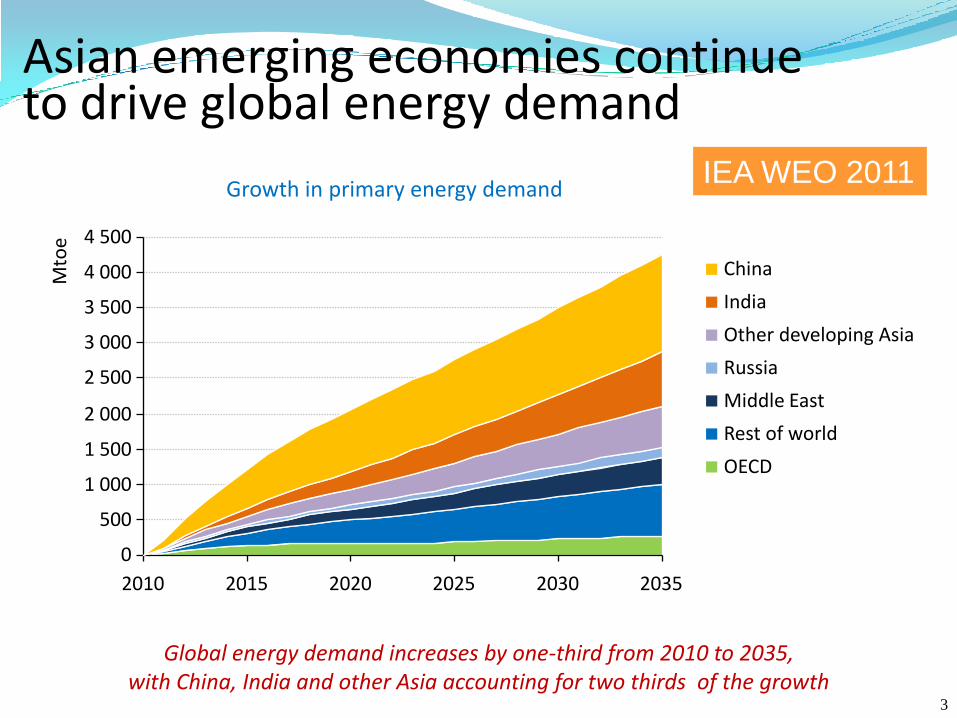
Asian emerging economies continue to drive global energy demand
Growth in primary energy demand
Global energy demand increases by one-third from 2010 to 2035, with China, India and other Asia accounting for two thirds of the growth
0
500
1 000
1 500
2 000
2 500
3 000
3 500
4 000
4 500
2010 2015 2020 2025 2030 2035
Mto
e
China
India
Other developing Asia
Russia
Middle East
Rest of world
OECD
IEA WEO 2011
3
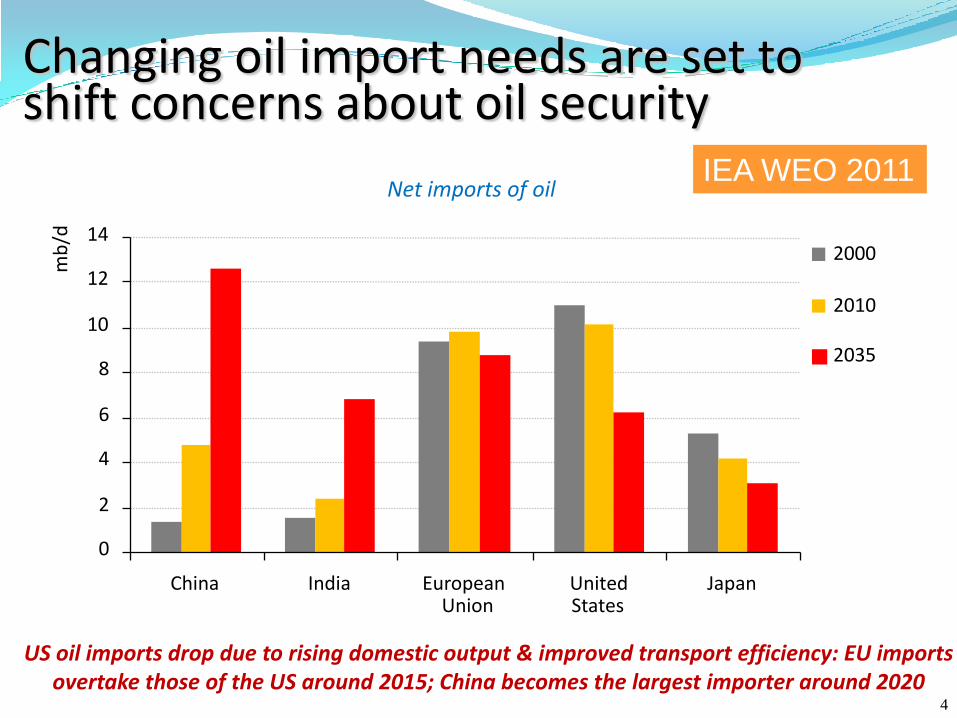
Changing oil import needs are set toshift concerns about oil security
Net imports of oil
US oil imports drop due to rising domestic output & improved transport efficiency: EU imports overtake those of the US around 2015; China becomes the largest importer around 2020
0
2
4
6
8
10
12
14
China India EuropeanUnion
UnitedStates
Japan
mb
/d
2000
2010
2035
IEA WEO 2011
4
1 4 0 World EnergyOutlook 2011 -GLOBAL ENERGYTRENDS
of developing the giant heavy Wafra oilfield in the Partitioned Neutral Zone, with capacitydue to reach 600 kb/d, is expected to be similar; the field, which is being developed byChevron, requires thermal stimulation with steam injection. Capital costs for developmentof deepwater oil are much higher, ranging from $40 000/b/d to $80 000/b/d.
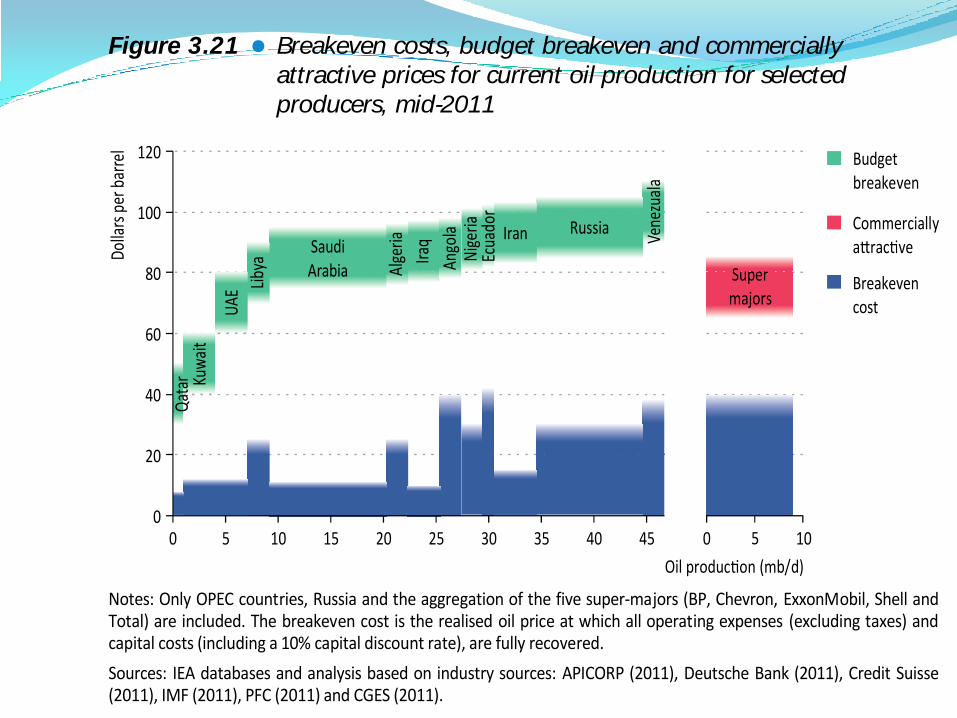
The total cost of producing oil, including the amortisation of development costs butexcluding taxes and profit margins, is well below the current market price of oil, generatingsignificant economic rent that is captured by governments in taxes and royalties and by oilcompanies in profits (Figure 3.21). The OPEC Middle East countries have by far the lowestcosts, followed by the main North African producers. However, to generate sufficientrevenue to balance government budgets in OPEC countries (the budget breakeven) requiresa much higher oil price and this figure has been rising in recent years. This is particularly thecase in the Middle East, where large, youthful populations are putting pressure on educationsystems, housing and job creation schemes. In many of these countries, which rely heavilyon oil export revenues to fund government budgets, the budget breakeven oil price is nowabove $80/barrel. This will become an increasingly important consideration in the formationof future oil prices.
Figure 3.21 Breakeven costs, budget breakeven and commercially
attractive prices for current oil production for selected
producers, mid-2011
0
20
40
60
80
100
120
0 05 510 1015 20 25 30 35 40 45
Oil produc on (mb/d)
Dolla
rspe
rbar
rel
Budgetbreakeven
Commerciallya rac ve
Qat
ar Kuw
ait
SaudiArabia
UAE
Liby
a
Russia
Vene
zual
a
Ango
la
Alge
ria
Iraq
Nig
eria
Ecua
dor
Iran
Supermajors
Breakevencost
Notes: Only OPEC countries, Russia and the aggregation of the five super-majors (BP, Chevron, ExxonMobil, Shell andTotal) are included. The breakeven cost is the realised oil price at which all operating expenses (excluding taxes) andcapital costs (including a 10% capital discount rate), are fully recovered.
Sources: IEA databases and analysis based on industry sources: APICORP (2011), Deutsche Bank (2011), Credit Suisse(2011), IMF (2011), PFC (2011) and CGES (2011).
For countries and companies where development and production is driven primarilyby commercial rather than fiscal motives, the key criterion for sustainable long-terminvestment is for income from production to cover capital cost recovery, operating costsand fiscal payments, together with a competitive commercial return. For developments in
© O
EC
D/I
EA
, 20
11
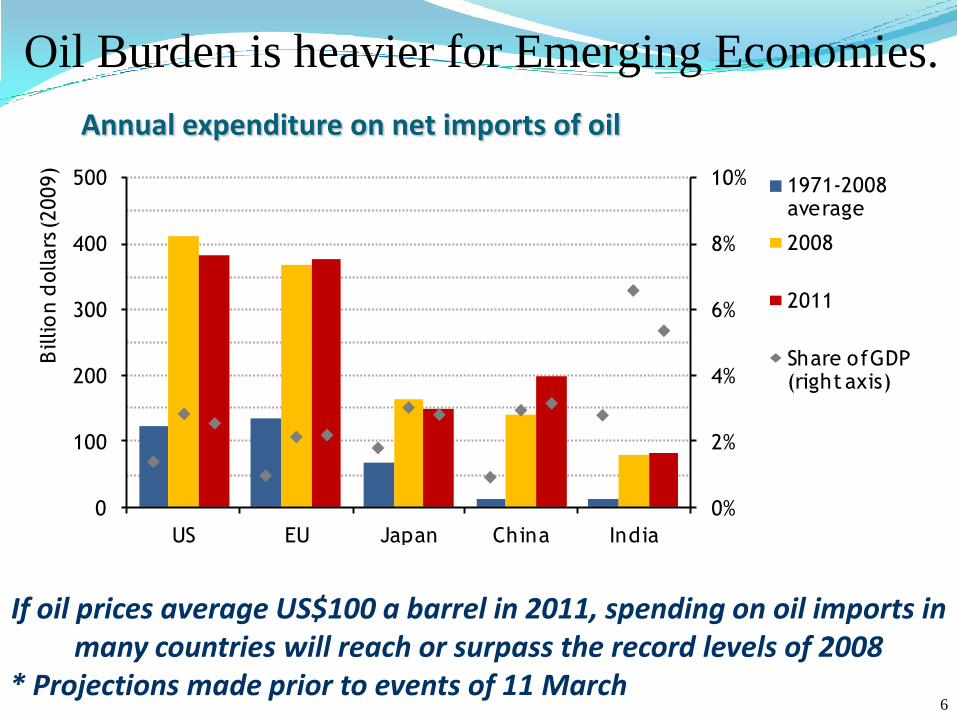
Annual expenditure on net imports of oil
If oil prices average US$100 a barrel in 2011, spending on oil imports in many countries will reach or surpass the record levels of 2008
* Projections made prior to events of 11 March
0%
2%
4%
6%
8%
10%
0
100
200
300
400
500
US EU Japan China India
Billio
n d
ollars
(2009)
1971-2008 average
2008
2011
Share of GDP (right axis)
Oil Burden is heavier for Emerging Economies.
6
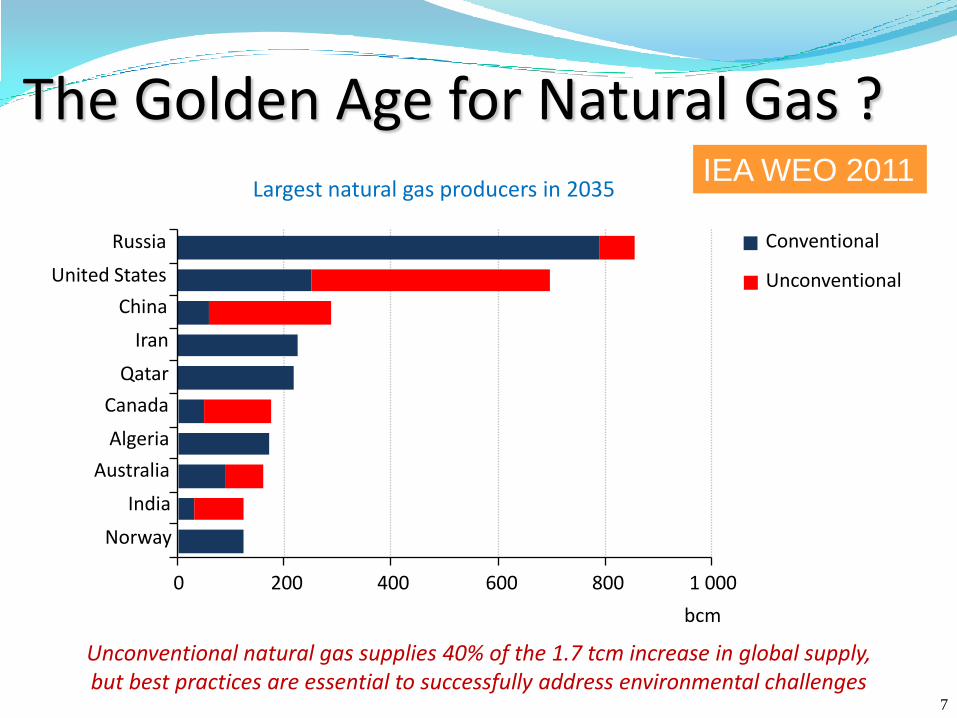
The Golden Age for Natural Gas ?Largest natural gas producers in 2035
Unconventional natural gas supplies 40% of the 1.7 tcm increase in global supply,but best practices are essential to successfully address environmental challenges
0 200 400 600 800 1 000
Norway
India
Australia
Algeria
Canada
Qatar
Iran
China
United States
Russia
bcm
Conventional
Unconventional
IEA WEO 2011
7
Chapter 2 -Energyprojectionsto 2035 9 3
2
stabilising thereafter, to settle around 1 000 Mtce in 2035 �around 18% of world hard coalproduction. The pattern of trade will continue to shift towards Asia and away from AtlanticBasin markets. The OECD as a whole ceases to be an importer of hard coal, becoming a netexporter around 2030. Japan, the largest coal importer in 2009, sees its import requirementpeak early in the Outlook period and then decline gradually, to reach 115 Mtce in 2035.A coal exporter until recently, China sees its import requirement exceed that of Japanaround 2015, peak at nearly 200 Mtce shortly after 2015 and then decline to around80 Mtce in 2035. However, the scale of China�s coal appetite is so huge, relative to others,that even quite a small shift in its domestic demand-supply balance can have majorimplications for the global picture (Spotlight on the role of China in traded coal markets).India�s hard coal imports increase by more than 6% per year over the Outlook period,becoming the world�s largest importer soon after 2020 and importing nearly 300 Mtce in2035, nearly five-times the level of 2009. India is expected to look first to Indonesia, Australiaand South Africa to satisfy its import needs. Australia sees its hard coal exports peak before2020 and then gradually decline to around 300 Mtce in 2035, still 18% higher than 2009.Indonesia sees its hard coal exports increase from 190 Mtce in 2009 to around 280 Mtce in2035, but are on a declining path later in the Outlook period.
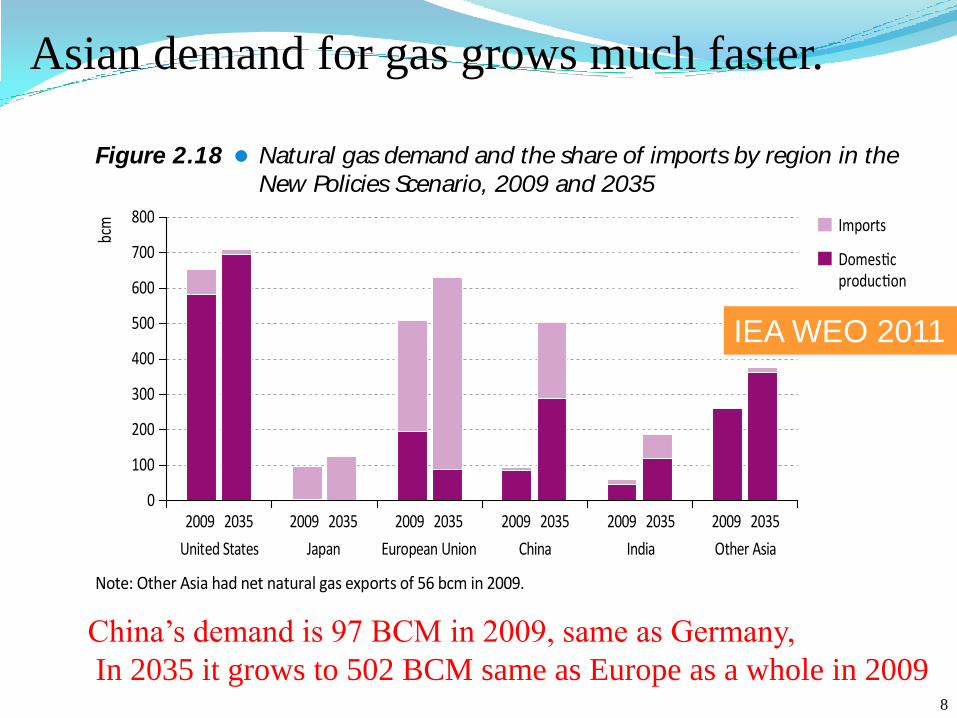
Inter-regional trade in natural gas nearly doubles over the Outlook period, increasing from590 bcm in 2009 to around 1 150 bcm in 2035. The expansion occurs in both pipeline gas andliquefied natural gas (LNG). The proportion of gas that is traded across regions increases from19% in 2009 to 25% in 2035. The market for natural gas becomes more globalised over theOutlook period, but only gradually. The need for natural gas imports into the European Uniongrows from 310 bcm in 2009 to 540 bcm in 2035 and its dependence on imports increasesfrom 61% to 86% (Figure 2.18). Reflecting the growing availability of domestic unconventionalgas, natural gas imports into the United States decline from early in the Outlook period andremain relatively small throughout. Developing Asia moves from being a marginal exporter ofnatural gas in 2009 to importing nearly 300 bcm in 2035. China accounts for around 210 bcmof these imports in 2035 and its share of imports increases from 8% to 42%.
Figure 2.18 Natural gas demand and the share of imports by region in the
New Policies Scenario, 2009 and 2035
0
100
200
300
400
500
600
700
800 Imports
Domes cproduc on
2009 2035 2009 2035 2009 2035 2009 20352009 2035 2009 2035
United States Japan European Union Other AsiaChina India
bcm
Note: Other Asia had net natural gas exports of 56 bcm in 2009.
© O
EC
D/I
EA
, 2
01
1
Asian demand for gas grows much faster.
China’s demand is 97 BCM in 2009, same as Germany,
In 2035 it grows to 502 BCM same as Europe as a whole in 2009
IEA WEO 2011
8
Chapter 5 -Power and renewablesoutlook 1 8 5
5
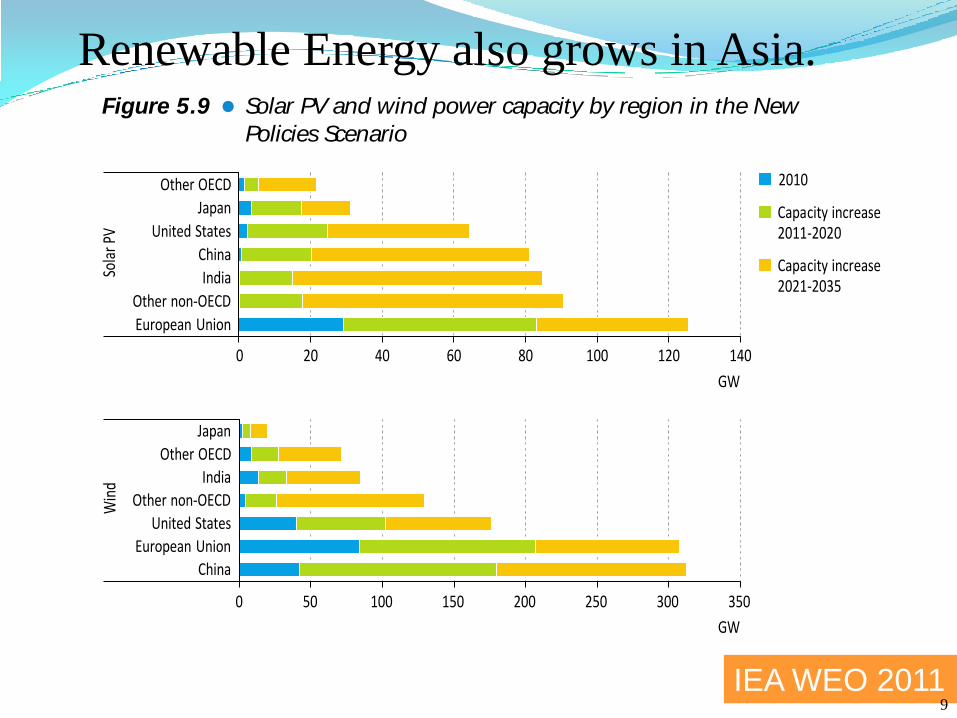
wind power producer. Generation from installed onshore wind capacity increases morethan three-fold in the European Union, from 133 TWh in 2009 to 480 TWh in 2035, andmore than five-fold in the United States, from 74 TWh to 390 TWh. A steady improvementin the economics of offshore wind power encourages widespread increases in the installedcapacity of this technology, which contributes one-fourth of total wind power generationby 2035; output increases from less than 1 TWh in 2009 to 670 TWh in 2035, almost levelwith generation from solar PV. As with onshore wind, the majority of the growth in offshorewind generation occurs in China, the European Union and the United States.
Figure 5.9 Solar PV and wind power capacity by region in the New
Policies Scenario
0 20 40 60 80 100 120 140
European Union
Other non-OECD
India
China
United States
Japan
Other OECD
Sola
rPV
GW
0 50 100 150 200 250 300 350
China
European Union
United States
Other non-OECD
India
Other OECD
Japan
Win
d
GW
2010
Capacity increase2011-2020
Capacity increase2021-2035
Solar PV electricity generation increases substantially over the Outlook period, from20 TWh in 2009 to 740 TWh in 2035 in the New Policies Scenario, growing at an averagerate of 15% per year. The European Union accounted for three-quarters of global solar PVgeneration in 2010. This has been driven by strong government programmes, particularlyin Germany where there has been rapid growth in recent years. Over the early years of theOutlook period, Europe continues to exhibit very strong growth in solar PV but, between2020 and 2035, the increase in solar PV generation in each of China, the United States andIndia is larger than that in the European Union.
Hydropower has already been developed extensively in many OECD countries and thereis limited remaining potential, given the costs and environmental constraints. By contrast,large developments of hydro are expected to take place in many non-OECD countries. Thesecountries account for 85% of total hydro capacity additions in the New Policies Scenario,with China, India and Brazil making up almost 60% of non-OECD hydro additions. In severalcases, these resources are located far away from load centres and require significantinvestment in transmission lines.
© O
EC
D/IE
A,
20
11
IEA WEO 2011
Renewable Energy also grows in Asia.
9
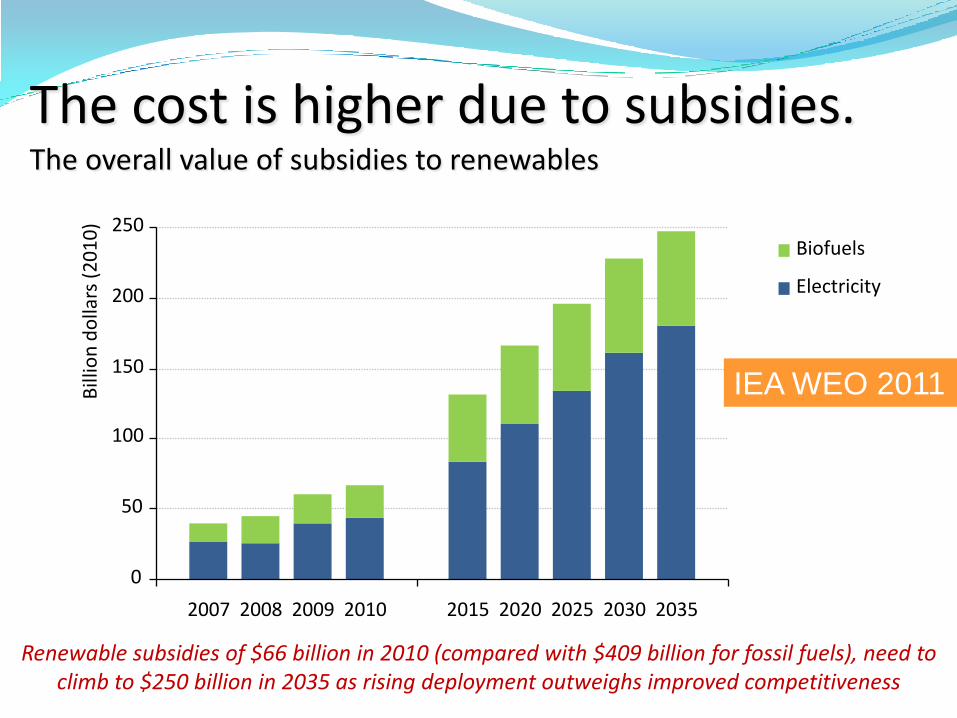
The cost is higher due to subsidies. The overall value of subsidies to renewables
Renewable subsidies of $66 billion in 2010 (compared with $409 billion for fossil fuels), need to climb to $250 billion in 2035 as rising deployment outweighs improved competitiveness
Biofuels
Electricity
0
50
100
150
200
250
2007 2008 2009 2010 2015 2020 2025 2030 2035
Bill
ion
do
llars
(20
10
)
IEA WEO 2011
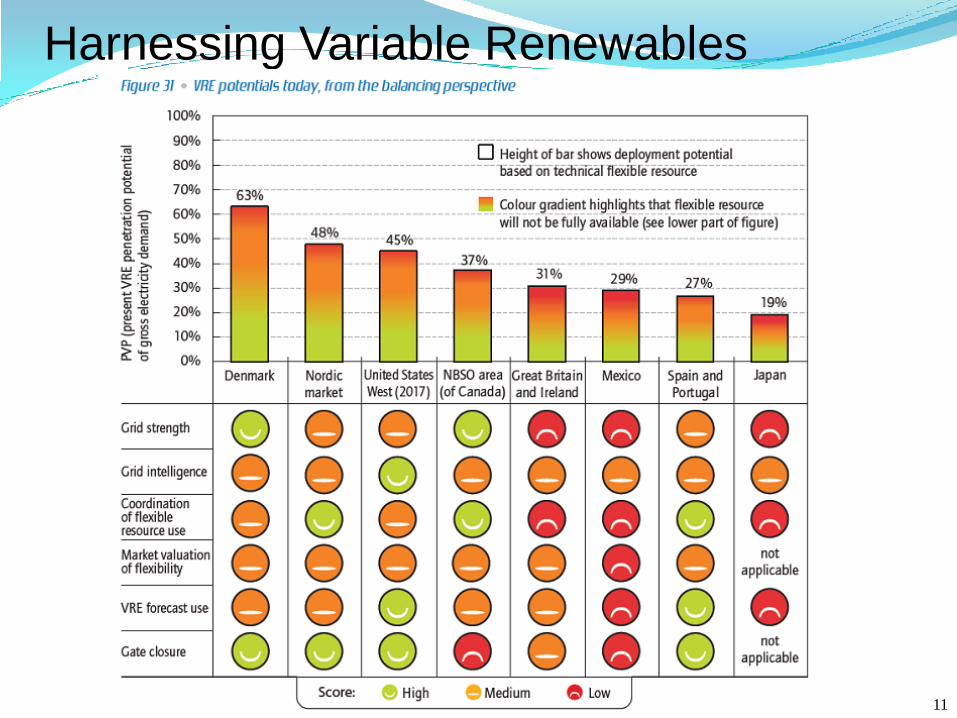
Harnessing Variable Renewables
11
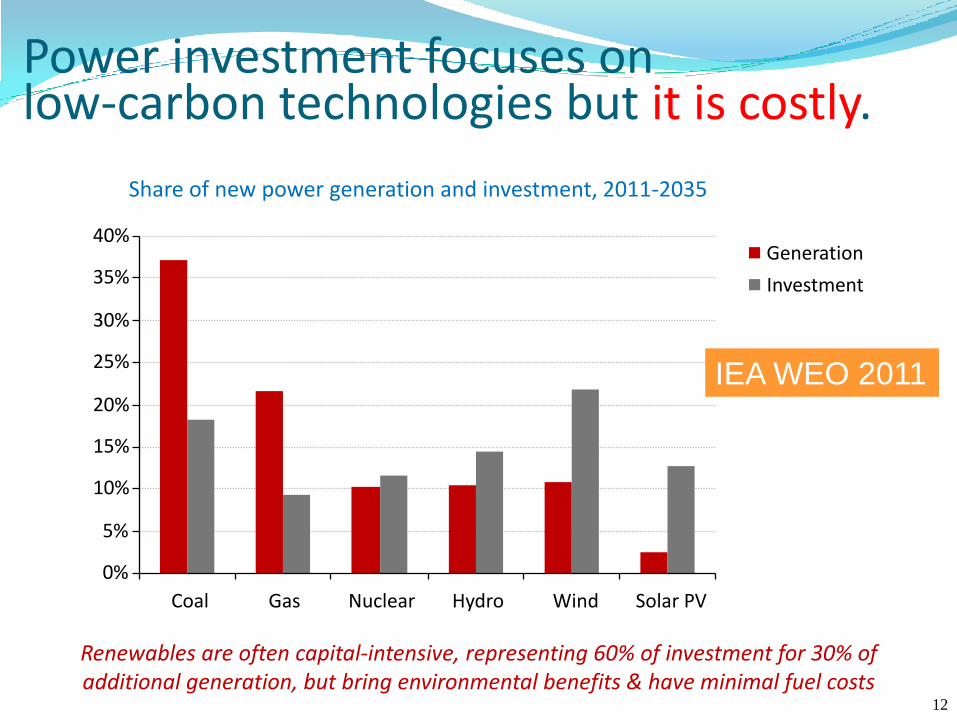
Power investment focuses on low-carbon technologies but it is costly.
Share of new power generation and investment, 2011-2035
Renewables are often capital-intensive, representing 60% of investment for 30% of additional generation, but bring environmental benefits & have minimal fuel costs
0%
5%
10%
15%
20%
25%
30%
35%
40%
Coal Gas Nuclear Hydro Wind Solar PV
Generation
Investment
IEA WEO 2011
12
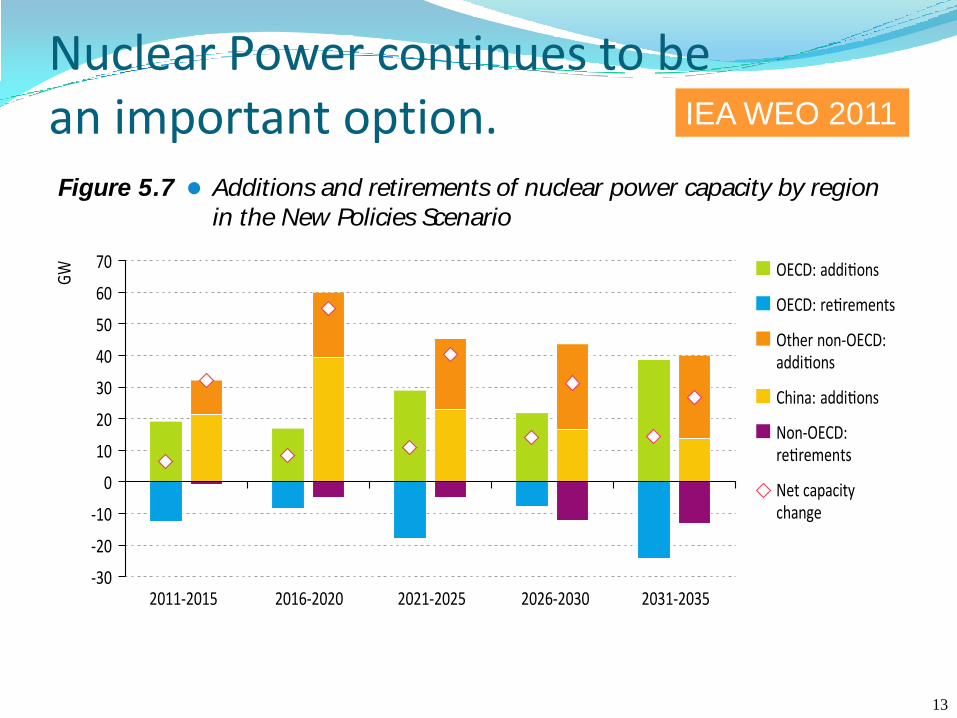
Nuclear Power continues to be an important option.
1 8 4 World EnergyOutlook2011 -GLOBAL ENERGYTRENDS
Figure 5.7 Additions and retirements of nuclear power capacity by region
in the New Policies Scenario
-30
-20
-10
0
10
20
30
40
50
60
70
GW OECD: addi ons
OECD: re rements
Other non-OECD:addi ons
China: addi ons
Non-OECD:re rements
Net capacitychange
2011-2015 2016-2020 2021-2025 2026-2030 2031-2035
Renew ables
The use of renewable energy sources to generate electricity expands significantly in all threescenarios. In the New Policies Scenario, renewables-based electricity generation worldwidealmost triples, from 3 900 TWh in 2009 to 11 100 TWh in 2035. This expansion is drivenlargely by government policies, including subsidies (see Chapter 14), and represents 44%of the growth in total electricity generation over the period. The bulk of this growth comesfrom four sources: wind and hydro provide approximately one-third each, biomass accountsfor about one-sixth and solar PV for one-tenth (Figure 5.8).
Figure 5.8 Incremental global renewables-based electricity generation
relative to 2009 by technology in the New Policies Scenario
30%
32%
34%
36%
38%
40%
42%
44%
46%
0
1 000
2 000
3 000
4 000
5 000
6 000
7 000
8 000
2015 2020 2025 2030 2035
TWh Other renewables
Solar PV
Biomass and waste
Hydro
Wind
Share of renewablesin total increase ingenera on (right axis)
In the New Policies Scenario, over three-quarters of the growth in installed wind capacityand 70% of the growth in solar PV capacity occurs in the United States, European Union,China and India (Figure 5.9). Rapid capacity expansion in China has already seen onshorewind electricity generation increases from just 2 TWh in 2005 to 27 TWh by 2009, and itis projected to reach almost 590 TWh by 2035, making China the world�s leading onshore
© O
EC
D/I
EA
, 2
01
1
IEA WEO 2011
13
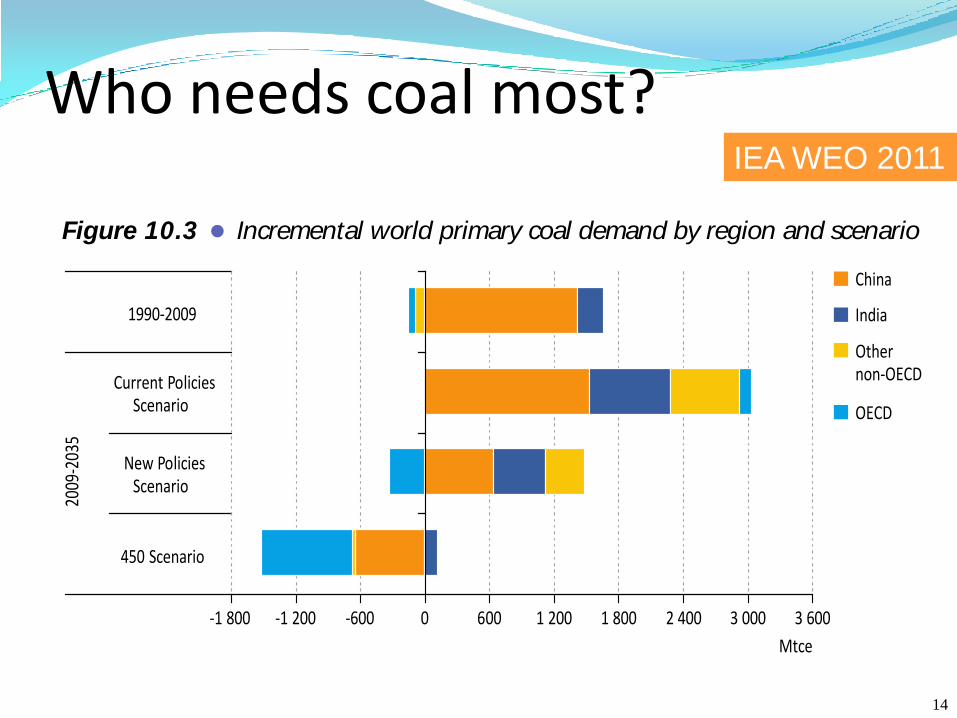
Who needs coal most?
Chapter 10 -Coal demand prospects 3 5 7
10
the imposition of a carbon price and other government policies that improve the economicsof low-carbon energy sources. Even in the Current Policies Scenario, OECD consumptionreaches a plateau by 2020 and falls back close to the level of 2010 by 2035, while in the450 Scenario OECD coal demand is 60% lower than 2010 by the end of the projection period.In the 450 Scenario, China is the biggest contributor to the global fall in coal demand relativeto the New Policies Scenario, reflecting its dominant position in global coal use.
Table 10.1 Coal demand by region and scenario (Mtce)
New PoliciesScenario
Current PoliciesScenario
450Scenario
1980 2009 2020 2035 2020 2035 2020 2035
OECD 1 380 1 476 1 494 1 146 1 609 1 588 1 400 623
United States 537 693 705 599 751 773 698 326
Europe 663 415 383 264 431 400 333 151
Japan 85 145 158 115 165 156 141 60
Non-OECD 1 179 3 229 4 339 4 713 4 699 6 154 3 908 2 685
China 446 2 179 2 863 2 820 3 069 3 709 2 596 1 535
India 75 399 619 883 699 1 148 531 521
Russia n.a. 136 166 168 173 203 150 96
World 2 560 4 705 5 833 5 859 6 308 7 742 5 309 3 309
Share of non-OECD 46% 69% 74% 80% 74% 79% 74% 81%
Share of China 17% 46% 49% 48% 49% 48% 49% 46%
Share of India 3% 8% 11% 15% 11% 15% 10% 16%
Figure 10.3 Incremental world primary coal demand by region and scenario
450 Scenario
New PoliciesScenario
Current PoliciesScenario
2009
-203
5
Mtce
China
India
Othernon-OECD
OECD
1990-2009
-1 800 -1 200 -600 0 600 1 200 1 800 2 400 3 000 3 600
The power sector remains the main driver of global coal demand over the projection periodin all three scenarios. Power generation accounts, respectively, for just over 80% and around75% of the increase in world coal demand in both the Current and New Policies Scenarios,keeping the share of this sector in total coal demand around or above two-thirds
© O
EC
D/I
EA
, 2
01
1
IEA WEO 2011
14
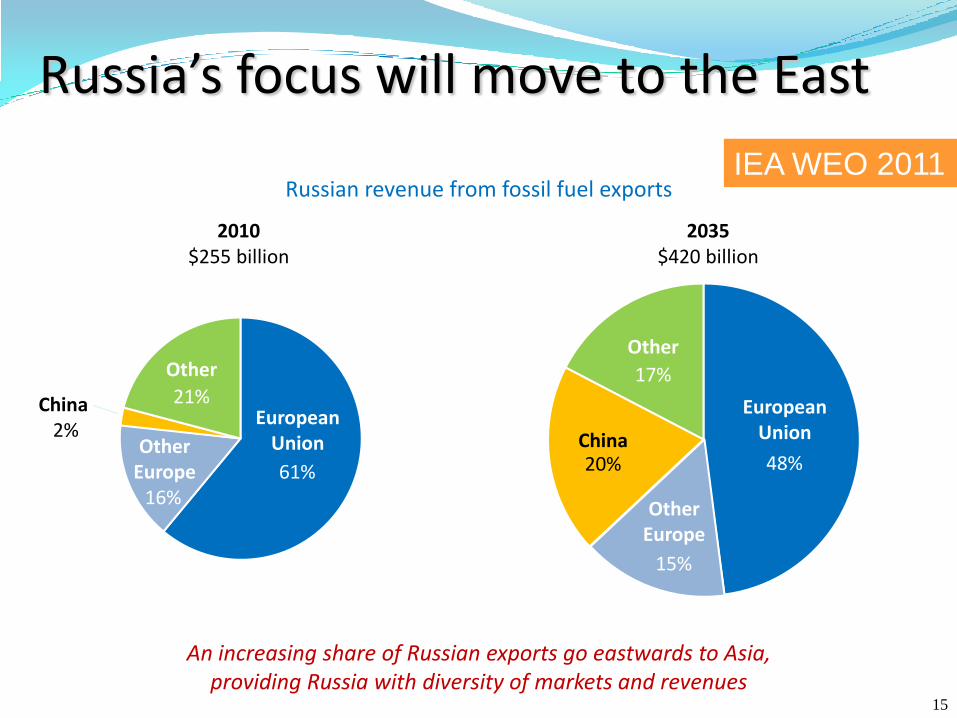
Russia’s focus will move to the East
Russian revenue from fossil fuel exports
An increasing share of Russian exports go eastwards to Asia,providing Russia with diversity of markets and revenues
2010$255 billion
61%16%
21%
2035$420 billion
48%
EuropeanUnion
17%
Other
20%China
15%
OtherEurope
EuropeanUnionOther
Europe
China2%
Other
IEA WEO 2011
15
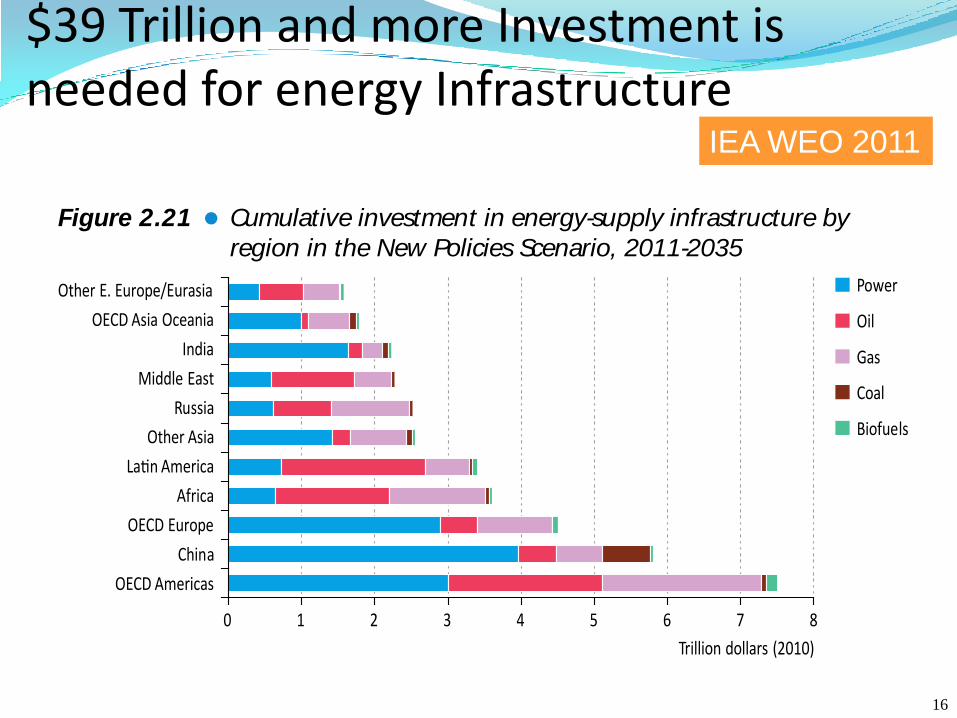
$39 Trillion and more Investment is needed for energy Infrastructure
9 8 World EnergyOutlook2011 -GLOBAL ENERGYTRENDS
countries, compared with the OECD share of energy demand growth, is attributable to theneed to retire and replace more ageing energy infrastructure, the relatively more capital-intensive energy mix and the higher average cost of its capacity additions in each category.The United States accounts for 14% of global cumulative energy supply investment over theOutlook period. China accounts for around 15% of global cumulative investment, amountingto $5.8 trillion and is heavily focused on the power sector (Figure 2.21). Latin America, Africathe Middle East and Russia all require significant levels of investment, particularly in oil andgas, over the Outlook period.
Table 2.4 Cumulative investment in energy-supply infrastructure by fuel
and region in the New Policies Scenario, 2011-2035
(billion in year-2010 dollars)
Coal Oil Gas Power Biofuels Total
OECD 175 2 703 3 756 6 897 216 13 746
Americas 78 2 100 2 172 3 009 142 7 501
Europe 7 511 1 019 2 892 72 4 501
Asia Oceania 90 91 565 996 2 1 745
Non-OECD 934 7 027 5 661 9 986 136 23 744
E. Europe/Eurasia 38 1 398 1 562 1 029 6 4 033
Russia 24 787 1 077 614 0 2 502
Asia 812 963 1 664 7 018 60 10 518
China 647 510 638 3 968 31 5 794
India 87 203 266 1 631 16 2 203
Middle East 0 1 137 510 583 0 2 230
Africa 52 1 557 1 316 638 3 3 564
Latin America 32 1 971 609 718 68 3 399
Inter-regional transport 55 268 80 - 4 407
World 1 164 9 997 9 497 16 883 356 37 897
Figure 2.21 Cumulative investment in energy-supply infrastructure by
region in the New Policies Scenario, 2011-2035
0 1 2 3 4 5 6 7 8
OECD Americas
China
OECD Europe
Africa
La n America
Other Asia
Russia
Middle East
India
OECD Asia Oceania
Other E. Europe/Eurasia
Trillion dollars (2010)
Power
Oil
Gas
Coal
Biofuels
© O
EC
D/I
EA
, 2
01
1
IEA WEO 2011
16
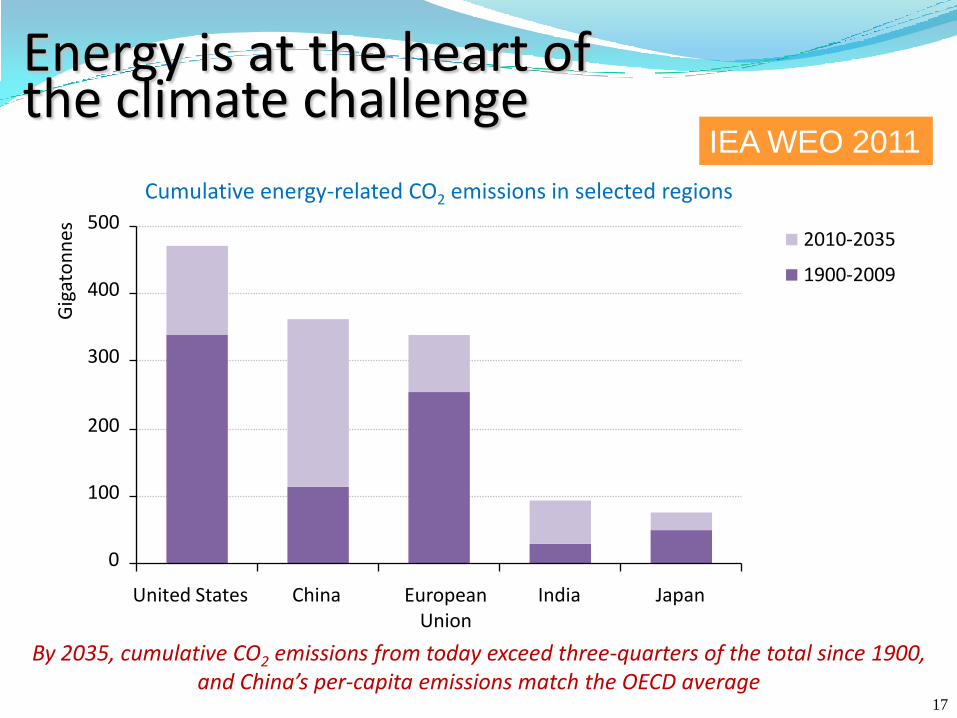
Energy is at the heart ofthe climate challenge
Cumulative energy-related CO2 emissions in selected regions
By 2035, cumulative CO2 emissions from today exceed three-quarters of the total since 1900, and China’s per-capita emissions match the OECD average
EuropeanUnion
0
100
200
300
400
500
United States China India Japan
Gig
ato
nn
es 2010-2035
1900-2009
IEA WEO 2011
17
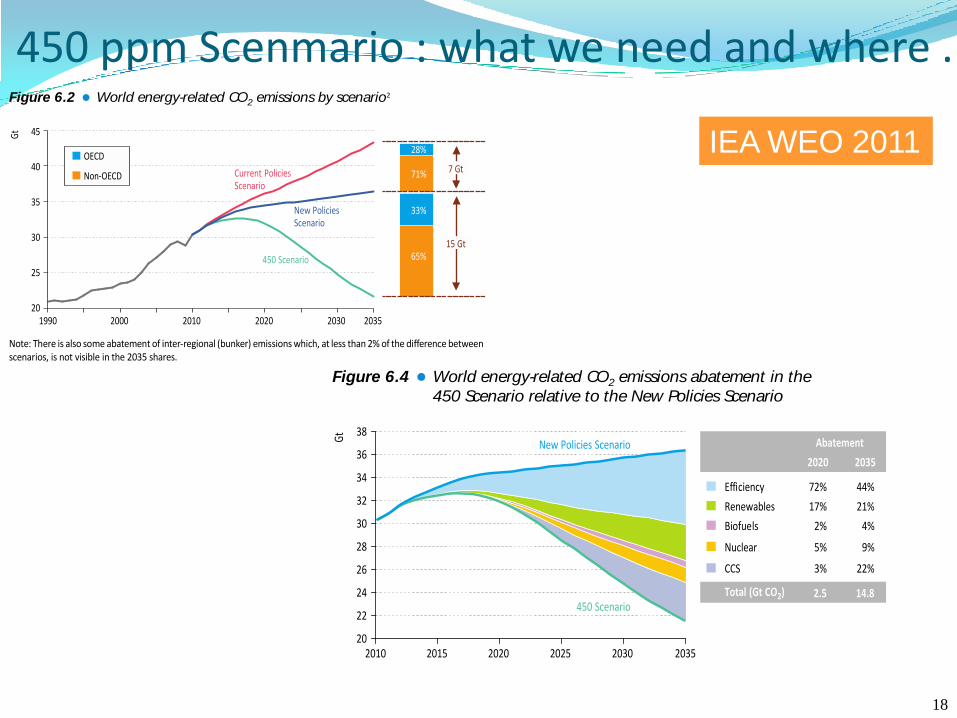
450 ppm Scenmario : what we need and where .
2 1 0 World EnergyOutlook2011 -GLOBAL ENERGYTRENDS
Overview of trends in the 450 ScenarioBefore examining the main trends and implications of the 450 Scenario, it is important tohighlight briefly why the scenario is needed. It is because (as illustrated in Figure 6.2) neitherthe New Policies Scenario, our central scenario, nor the Current Policies Scenario puts us ona future trajectory for greenhouse-gas emissions that is consistent with limiting the increasein global temperature to no more than 2°C, the level climate scientists say is likely to avoidcatastrophic climate change. The 450 Scenario illustrates one plausible path to that objective.
Figure 6.2 World energy-related CO2 emissions by scenario2
20
25
30
35
40
45
1990 2000 2010 2020 2030 2035
Gt
15 Gt
7 Gt71%
65%
33%
28%OECD
Non-OECD Current PoliciesScenario
450 Scenario
New PoliciesScenario
Note: There is also some abatement of inter-regional (bunker) emissions which, at less than 2% of the difference betweenscenarios, is not visible in the 2035 shares.
In line with practice in previous World Energy Outlooks, we have estimated greenhouse-gasemissionsfromall sourcesandforallscenarios(Table6.1).Wehavethen assessed theconsequencesfor long-term concentrations and temperature increases of such emissions trajectories.
The New Policies Scenario, which takes account of both existing government policies anddeclared policy intentions (including cautious implementation of the Copenhagen Accord andCancun Agreements), would result in a level of emissions that is consistent with a long-termaverage temperature increase of more than 3.5°C (see Chapter 2 for energy trends in the NewPolicies Scenario). The outlook in the Current Policies Scenario, which assumes no change ingovernment policies and measures beyond those that were enacted or adopted by mid-2011,is considerably worse, and is consistent with a long term temperature increase of 6°C or more.
The trends and implications of the 450 Scenario, a scenario based on achieving an emissionstrajectory consistent with an average temperature increase of 2°C, are sometimes presentedhere against the baseline of the New Policies Scenario to help demonstrate what moreneeds to be done, particularly in terms of carbon abatement. The main changes to the450 Scenario in WEO-2011 relate to the policy assumptions, which reflect changes indomestic and international energy and climate policies (Box 6.2). Non-policy assumptionsrelating to energy and CO2 prices, GDP and population are presented in Chapter 1.
2. In 2009, energy-related CO2 emissions contributed 61% to total greenhouse-gas emissions.
© O
EC
D/I
EA
, 2
01
1
2 1 4 World EnergyOutlook2011 -GLOBAL ENERGYTRENDS
Energy efficiency measures account for half the cumulative CO2 abatement achieved in the450 Scenario, relative to the New Policies Scenario, over the Outlook period (Figure 6.4).The scale of this reduction underlines the importance of strong policy action to ensurethat potential efficiency gains are realised, in such forms as building standards, vehicle fueleconomy mandates and insistence on widespread use in industry of the best-availabletechnologies (Box 6.3). After the cheaper energy efficiency measures are exploited early inthe Outlook period, more expensive abatement options take a larger share, and the annualshare in abatement of efficiency measures falls to 44% in 2035. The increased adoption ofrenewable energy (including biofuels) is the second-most important source of CO2 abatement,relative to the New Policies Scenario, growing from a combined 19% in 2020 to 25% in 2035, ora cumulative 24% over the period as a whole. Nuclear power grows rapidly in importance andaccounts for a cumulative 9%, while CCS also accounts for an increasing share, growing fromonly 3% of total abatement in 2020 to 22% in 2035, or a cumulative 18%.
Figure 6.4 World energy-related CO2 emissions abatement in the
450 Scenario relative to the New Policies Scenario
Gt
2020 2035
Efficiency
Renewables
Biofuels
Nuclear
72%
17%
2%
5%
44%
21%
4%
9%
3% 22%
Abatement
Total (Gt CO2)
CCS
20
22
24
26
28
30
32
34
36
38
2010 2015 2020 2025 2030 2035
New Policies Scenario
450 Scenario2.5 14.8
Box 6.3 Reaping abatement through efficiency in the 450 Scenario
In the 450 Scenario, energy efficiency policies and measures are the cheapestabatement option available and the most important source of abatement. Efficiencyis responsible for half of cumulative global abatement relative to the New PoliciesScenario, or 73 Gt, between 2011 and 2035. The role of energy efficiency varies bycountry, according to the remaining potential and energy pricing. In OECD countries,despite the strong efficiency improvements already occurring in the New PoliciesScenario, efficiency in the 450 Scenario is responsible for almost 42% of abatementrelative to the New Policies Scenario. This share rises to 54% in non-OECD countries,where efficient energy-producing and -using technologies are in general less widelydeployed. This is due to both their higher costs relative to less efficient technologies,and because energy subsidies often present in these countries do not encourageenergy efficiency.
© O
EC
D/I
EA
, 2
01
1
IEA WEO 2011
18
0
5
10
15
20
25
30
35
40
2010 2020 2025 2030 2035
Delay until 2017
Delay until 2015
2015
Emissions from existinginfrastructure
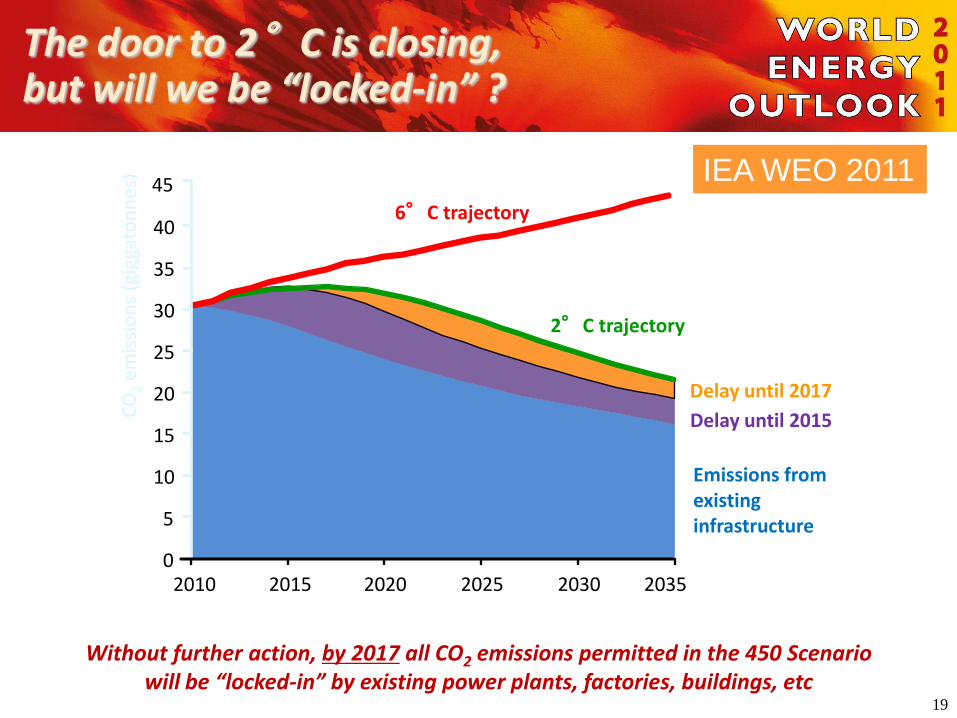
The door to 2°C is closing,but will we be “locked-in” ?
Without further action, by 2017 all CO2 emissions permitted in the 450 Scenariowill be “locked-in” by existing power plants, factories, buildings, etc
45
6°C trajectory
2°C trajectory
CO
2em
issi
on
s (g
igga
ton
nes
) IEA WEO 2011
19
Chapter 6 -Climatechangeand the450 Scenario 2 2 5
6
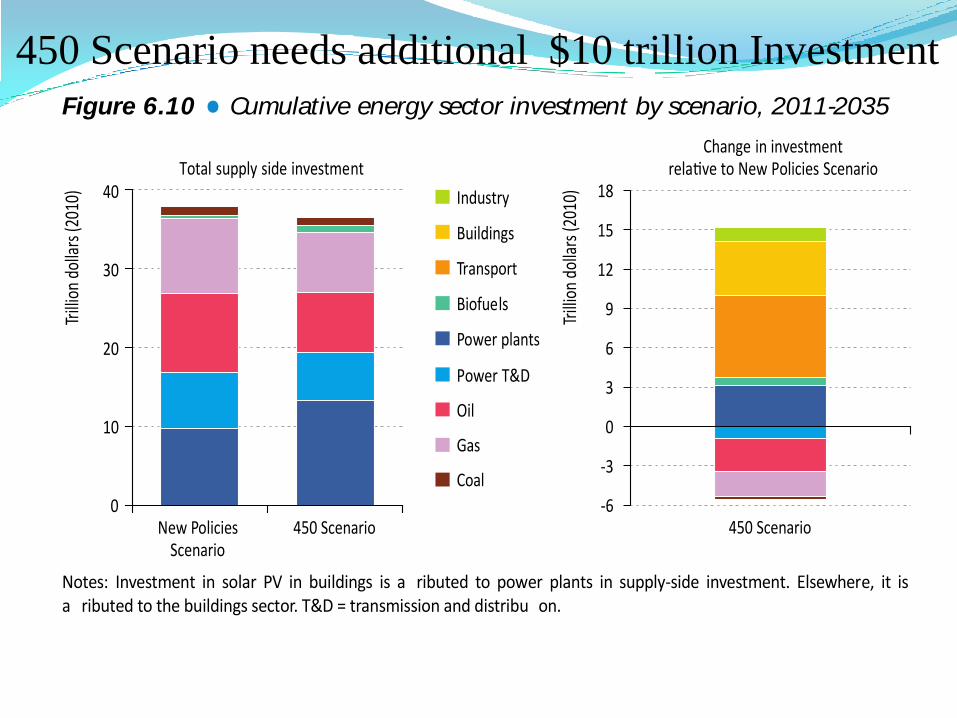
the total).7 Refurbishment of buildings in OECD countries and solar PV installations accountfor most of the investment. The decarbonisation of the power sector requires a net additional$3.1 trillion. About two-thirds of total investment in electricity generation goes to renewable-based technologies, 14% to nuclear, 8% to plants fitted with CCS and 12% to fossil-fuel plantsnot fitted with CCS. Industry invests an additional $1.1 trillion, almost a third of it directed to CCS.
Figure 6.10 Cumulative energy sector investment by scenario, 2011-2035
0
10
20
30
40
New PoliciesScenario
450 Scenario
Trill
ion
dolla
rs(2
010)
Total supply side investment
450 Scenario
Trill
ion
dolla
rs(2
010)Industry
Buildings
Transport
Biofuels
Power plants
Coal
Gas
Oil
Power T&D
Change in investmentrela ve to New Policies Scenario
-6
-3
0
3
6
9
12
15
18
Notes: Investment in solar PV in buildings is a ributed to power plants in supply-side investment. Elsewhere, it isa ributed to the buildings sector. T&D = transmission and distribu on.
Within power generation, there is some avoided investment in electricity transmission anddistribution lines, totalling about $930 billion. The lower level of electricity demand in the450 Scenario �achieved through the $2.7 trillion investment made in buildings and industry inimproving efficiency of electricity end-use�leads to a reduction in grid infrastructure investmentof around $1.1 trillion. The increased usage of renewable energy, which requires greaterinvestment in transmission and distribution than other energy sources (see Chapter 5), addsnearly $165 billion in the 450 Scenario, partially offsetting the savings due to lower demand.
Mirroring their importance in global abatement relative to the New Policies Scenario, Chinaand the United States need the largest additional investment �$3.2 trillion and $2.8 trillionrespectively. Non-OECD countries account for almost half of the total cumulative additionalinvestment relative to the New Policies Scenario, with their share increasing towards theend of the period in line with their share of abatement.
Other spending in the 450 Scenario: fuel costs and subsidies
The changes in the energy sector to achieve the 450 Scenario have an impact on fuelexpenditure, relative to the New Policies Scenario, as lower international fuel prices interact
7. It is important to note that this investment nances not only the direct abatement from the buildings sector reportedin Figure 6.8, but also a propor on of the indirect abatement through electricity demand reduc on due to investment inmore efficient end-use equipment.
© O
EC
D/I
EA
, 2
01
1
450 Scenario needs additional $10 trillion Investment
Low Nuclear Case
4 5 8 World EnergyOutlook2011 -SPECIAL TOPICS
Implications of the Low Nuclear Case for the global
energy landscape
It is still early to arrive at a definite judgment on the extent of any reduction in nuclear powergeneration which might result from Fukushima Daiichi. The Low Nuclear Case attempts tomake no such judgment. Rather, it is intended to illustrate how the global energy landscapewould look with a lower component of nuclear supply. The assumptions about the extentof the lost nuclear capacity are necessarily arbitrary. We have modelled the impact of thefollowing assumptions about nuclear power, keeping all other assumptions the same as inthe New Policies Scenario (Table 12.3):
In OECD countries, no new reactors are built beyond those already under construction.
In non-OECD countries, only 50% of the capacity additions projected in the New PoliciesScenario proceed as planned, although all those already under construction are completed.
Reactors built prior to 1980 are retired after an average lifetime of 45 years (50 years inthe New Policies Scenario).
Reactors built from 1980 onwards are retired after a lifetime of 50 years on average(55 years in the New Policies Scenario).
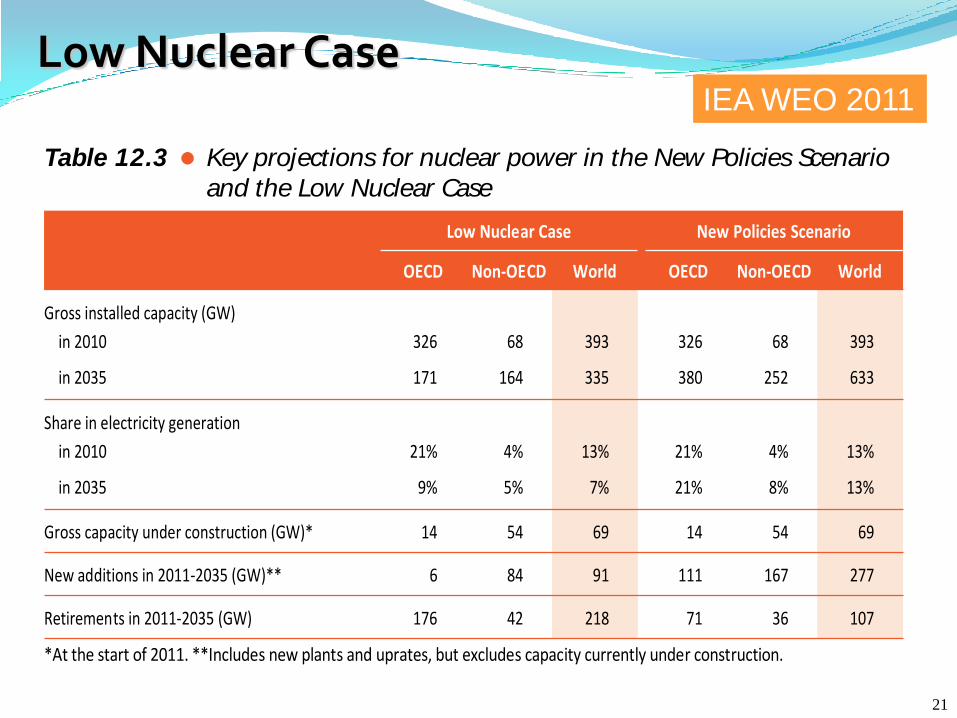
Table 12.3 Key projections for nuclear power in the New Policies Scenario
and the Low Nuclear Case
Low Nuclear Case New Policies Scenario
OECD Non-OECD World OECD Non-OECD World
Gross installed capacity (GW)
in 2010 326 68 393 326 68 393
in 2035 171 164 335 380 252 633
Share in electricity generation
in 2010 21% 4% 13% 21% 4% 13%
in 2035 9% 5% 7% 21% 8% 13%
Gross capacity under construction (GW)* 14 54 69 14 54 69
New additions in 2011-2035 (GW)** 6 84 91 111 167 277
Retirements in 2011-2035 (GW) 176 42 218 71 36 107
*At the start of 2011. **Includes new plants and uprates, but excludes capacity currently under construction.
Pow er sector
In the Low Nuclear Case, the total amount of nuclear power capacity drops from 393 GW in2010 to 335 GW in 2035 �a fall of 15% �as a result of the slower rate of new constructionand a bigger wave of retirements (Figure 12.3). This contrasts with an increase to 633 GWin the New Policies Scenario. In other words, nuclear capacity is little more than half that
© O
EC
D/I
EA
, 2
01
1
IEA WEO 2011
21
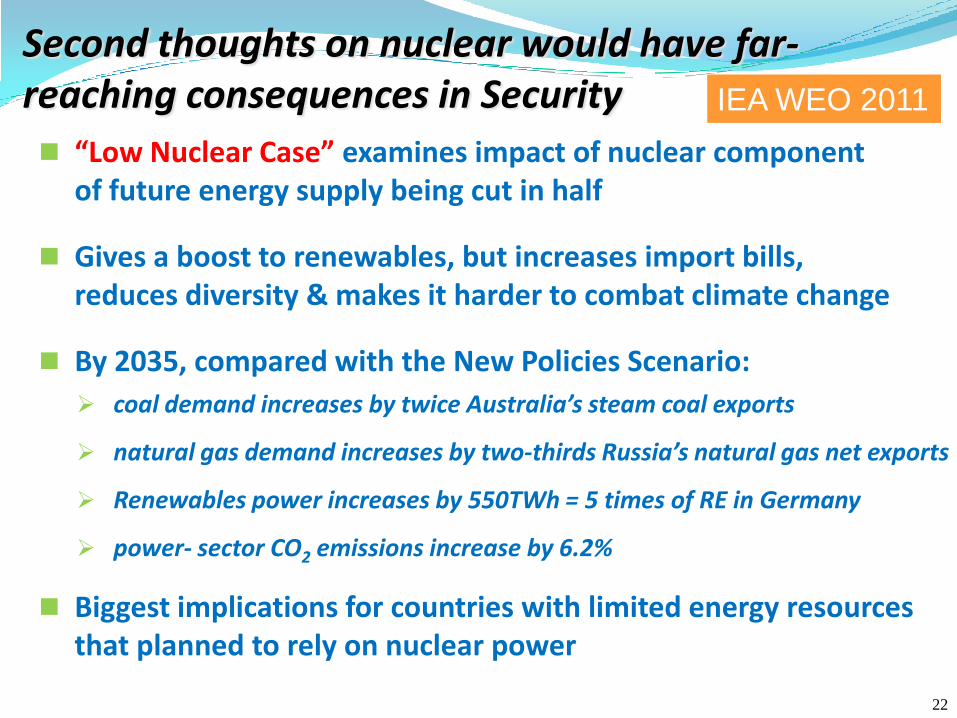
Second thoughts on nuclear would have far-reaching consequences in Security
“Low Nuclear Case” examines impact of nuclear component of future energy supply being cut in half
Gives a boost to renewables, but increases import bills, reduces diversity & makes it harder to combat climate change
By 2035, compared with the New Policies Scenario:
coal demand increases by twice Australia’s steam coal exports
natural gas demand increases by two-thirds Russia’s natural gas net exports
Renewables power increases by 550TWh = 5 times of RE in Germany
power- sector CO2 emissions increase by 6.2%
Biggest implications for countries with limited energy resources that planned to rely on nuclear power
IEA WEO 2011
22
4 6 2 World EnergyOutlook2011 -SPECIAL TOPICS
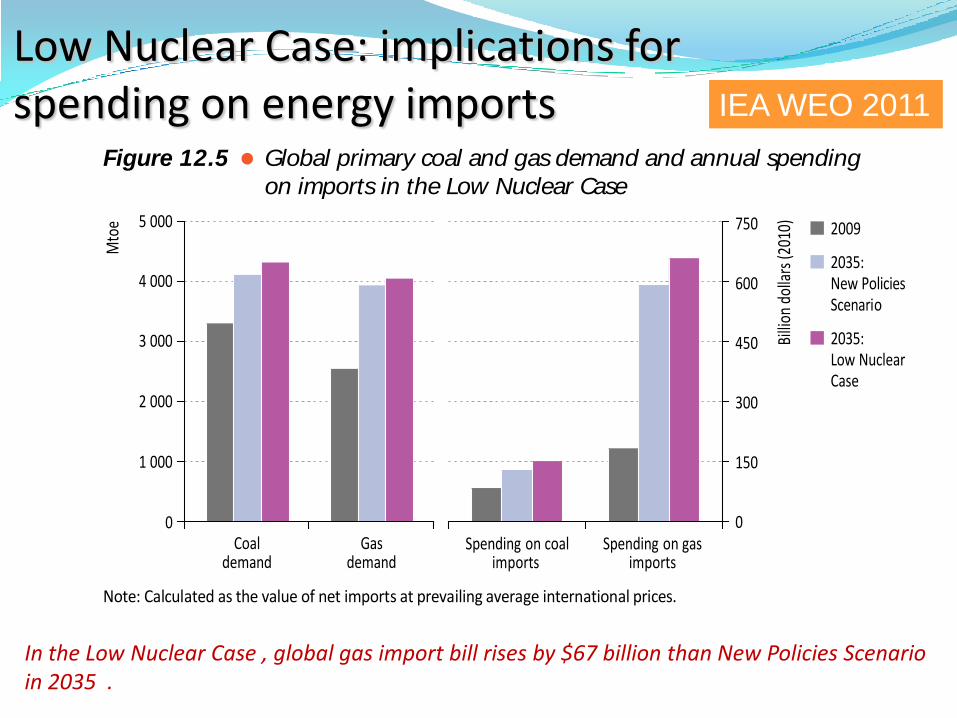
net-importing countries, spending on gas imports is up by around $67 billion, or 11%, whilespending on coal imports is up by around $22 billion, or 17% (Figure 12.5). For countriesthat rely heavily on nuclear power and have limited indigenous energy resources (such asBelgium, France, Japan and Korea), the impact will be more pronounced than the aggregatenumbers suggest.
Figure 12.5 Global primary coal and gas demand and annual spending
on imports in the Low Nuclear Case
Spending on coalimports
Spending on gasimports
0
150
300
450
600
750
Billi
ondo
llars
(201
0) 2009
2035:New PoliciesScenario
2035:Low NuclearCase
0
1 000
2 000
3 000
4 000
5 000
Coaldemand
Gasdemand
Mto
e
Note: Calculated as the value of net imports at prevailing average international prices.
The additional demand for natural gas and coal in the Low Nuclear Case has importantimplications for energy security. Although the share of generation coming from renewablesincreases, the diversity of the power-generation mix declines. The prospect of a limitednumber of producing regions increasingly dominating global gas supply and trade wouldraise concerns about the risk of supply disruptions as well as the risk that some countriesmight seek to use their dominant market position to force prices even higher.
CO2 emissions
One of the major advantages of nuclear power compared with electricity generated fromfossil fuels is that it does not directly generate emissions of carbon dioxide (CO2) or othergreenhouse gases.4 If the 13% of global electricity production that came from nuclear powerplants in 2010 had instead been generated equally from natural gas and coal (based oncurrent average efficiency levels) we estimate that global CO2 emissions from the powersector would have been 2.1 gigatonnes (Gt), or 17%, higher.
As a result of the increased use of fossil fuels in the Low Nuclear Case, energy-related CO2
emissions are higher than in the New Policies Scenario. At the global level, the increase inenergy-related CO2 emissions is roughly 2.6% in 2035. Cumulative CO2 emissions in the
4. There are some CO2 emissions linked to the use of fossil fuels in the nuclear fuel cycle, such as uranium mining andenrichment, but these are at least an order of magnitude lower than the direct emissions from burning fossil fuels.
© O
EC
D/IE
A,
20
11
Low Nuclear Case: implications for spending on energy imports IEA WEO 2011
In the Low Nuclear Case , global gas import bill rises by $67 billion than New Policies Scenario in 2035 .
Chapter 12 -The implicationsof lessnuclear power 4 6 3
12
period 2011 to 2035 are higher by 10.2 Gt, or 1.2%, adding to the rising concentration ofgreenhouse gases in the atmosphere and making it harder and more expensive to combatclimate change. These aggregate numbers mask more dramatic increases in countries thatrely more heavily on nuclear power.
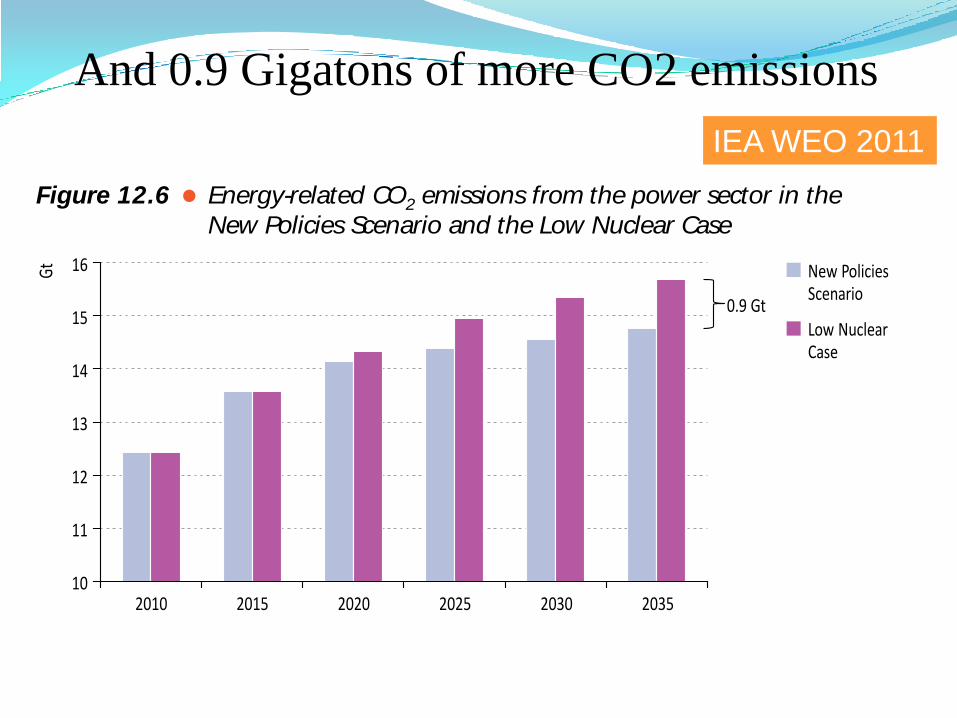
CO2 emissions from power plants reach 15.7 Gt in 2035 in the Low Nuclear Case,0.9 Gt, or 6.2%, higher than in the New Policies Scenario (Figure 12.6). Compared withthe New Policies Scenario, 34% of the increase comes from power plants in non-OECDcountries.
Figure 12.6 Energy-related CO2 emissions from the power sector in the
New Policies Scenario and the Low Nuclear Case
10
11
12
13
14
15
16
2010 2015 2020 2025 2030 2035
Gt New Policies
Scenario
Low NuclearCase
0.9 Gt
Box 12.2 Human capital and the nuclear industry
The development, maintenance and growth of a nuclear power programmerequire a well-trained and experienced work force. Consequently, variousstakeholders �including governments, industry, academia and intergovernmentalorganisations �invest significant resources into human resource management anddevelopment.
One area of concern in recent years has been a looming shortage of people with thenecessary skills, due to the ongoing retirement of workers and the low number of newentrants (IEA, 2010). In the United States, the nuclear industry work force numbered120 000 people in 2009; approximately 40% of this work force will be eligible toretire by 2015 and, in order to maintain the current numbers, the industry will needto hire about 25 000 more workers by then (NEI, 2010). In Korea, where the nuclearindustry is expected to expand in the coming decade, the Ministry of KnowledgeEconomy estimates that an additional 23 900 nuclear workers will be neededby 2020.
© O
EC
D/I
EA
, 2
011
And 0.9 Gigatons of more CO2 emissions
IEA WEO 2011
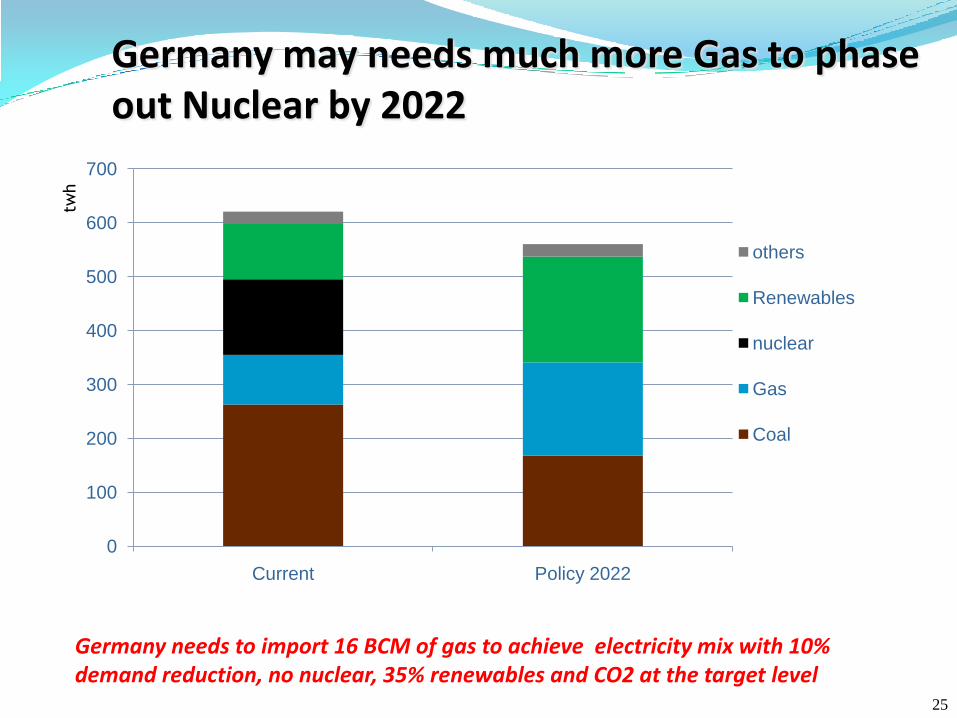
Germany may needs much more Gas to phase out Nuclear by 2022
0
100
200
300
400
500
600
700
Current Policy 2022
others
Renewables
nuclear
Gas
Coal
Germany needs to import 16 BCM of gas to achieve electricity mix with 10% demand reduction, no nuclear, 35% renewables and CO2 at the target level
twh
25
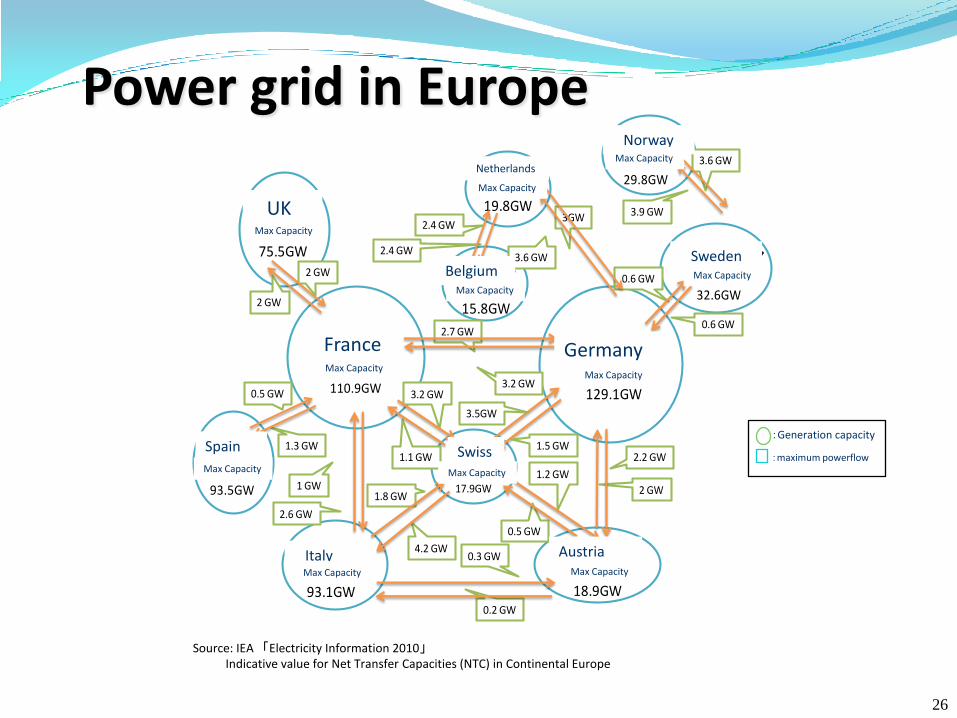
Power grid in Europe
Source: IEA 「Electricity Information 2010」Indicative value for Net Transfer Capacities (NTC) in Continental Europe
:Generation capacity
:maximum powerflow
スウェーデン
ノルウェー
イギリス
フランス ドイツ
オーストリア
スペイン
ベルギー
オランダ
2 GW
2 GW
0.5 GW
1.3 GW
1 GW1.8 GW
4.2 GW0.3 GW
0.2 GW
3.2 GW
1.1 GW
2.7 GW
3.2 GW
2.4 GW
2.4 GW
1.2 GW
0.5 GW
2.2 GW
2 GW
0.6 GW
0.6 GW
3GW
3.6 GW
3.6 GW
3.9 GW
イタリア
スイス
最大発電容量
93.1GW
最大発電容量
19.8GW
最大発電容量
29.8GW
最大発電容量
93.5GW
最大発電容量
32.6GW
最大発電容量17.9GW
最大発電容量
75.5GW
最大発電容量
18.9GW
最大発電容量
15.8GW
最大発電容量
110.9GW最大発電容量
129.1GW3.5GW
1.5 GW
2.6 GW
France Germany
UK
Netherlands
Norway
Sweden
Italy
Spain Swiss
Austria
Belgium
Max Capacity
Max Capacity
Max Capacity
Max Capacity
Max Capacity
Max Capacity
Max Capacity
Max Capacity
Max Capacity
Max Capacity
Max Capacity
26
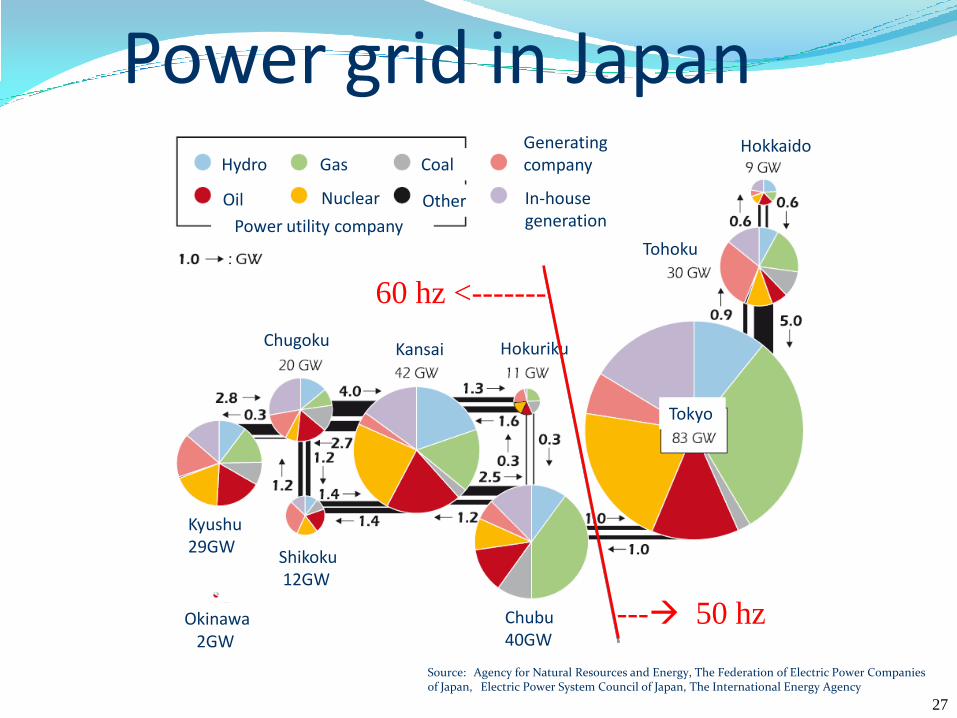
Power grid in Japan
Source: Agency for Natural Resources and Energy, The Federation of Electric Power Companies of Japan, Electric Power System Council of Japan, The International Energy Agency
Tokyo
Hokkaido
Tohoku
HokurikuKansaiChugoku
Kyushu29GW
Shikoku12GW
Chubu 40GW
Okinawa2GW
Hydro
Oil
Gas
Nuclear
Coal
Other
Power utility company
Generating company
In-house generation
--- 50 hz
60 hz <-------
27
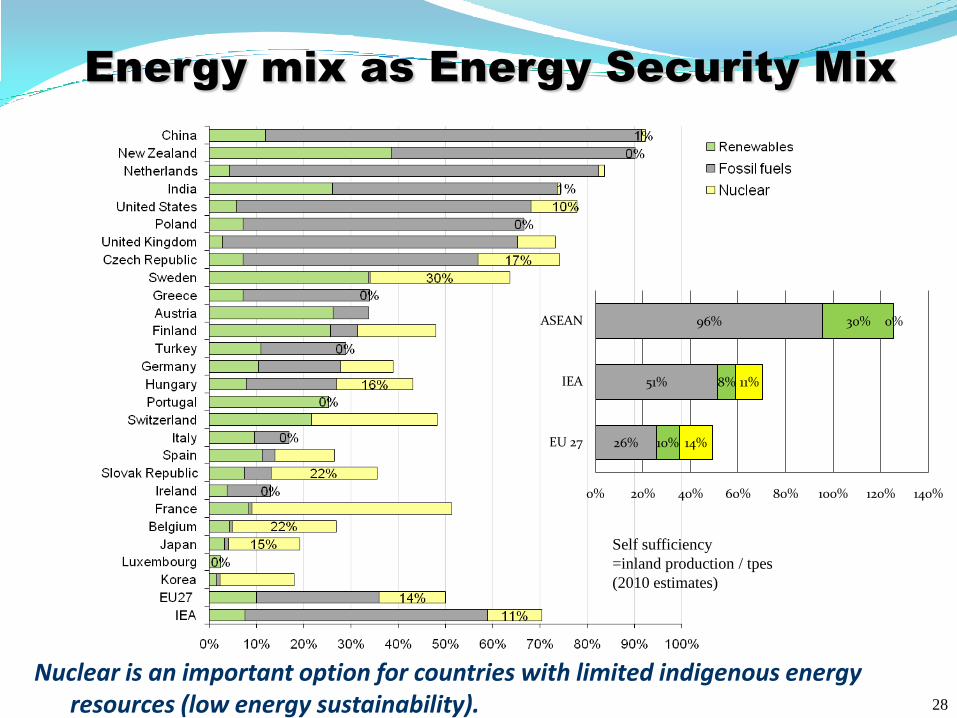
Energy mix as Energy Security Mix
Nuclear is an important option for countries with limited indigenous energy resources (low energy sustainability).
Self sufficiency
=inland production / tpes
(2010 estimates)
26%
51%
96%
10%
8%
30%
14%
11%
0%
0% 20% 40% 60% 80% 100% 120% 140%
EU 27
IEA
ASEAN
28
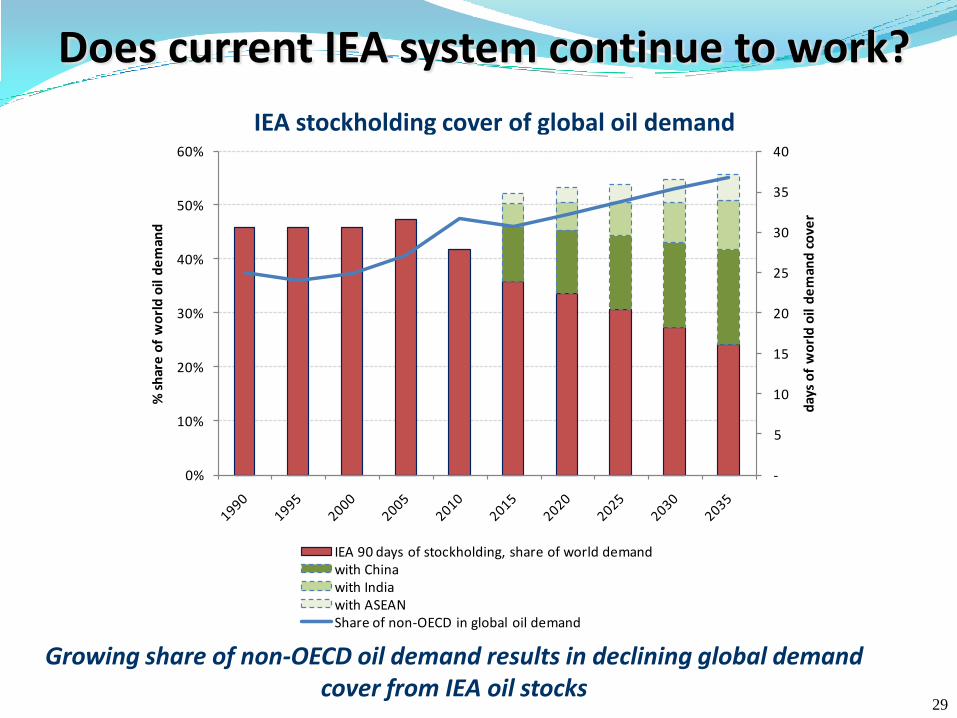
Does current IEA system continue to work?
IEA stockholding cover of global oil demand
Growing share of non-OECD oil demand results in declining global demand cover from IEA oil stocks
-
5
10
15
20
25
30
35
40
0%
10%
20%
30%
40%
50%
60%
day
s o
f w
orl
d o
il d
em
and
co
ver
% s
har
e o
f w
orl
d o
il d
em
and
IEA 90 days of stockholding, share of world demand with Chinawith Indiawith ASEANShare of non-OECD in global oil demand
29
Chap
ter8
-Russian
reso
urces
and
supply
poten
tial3
13
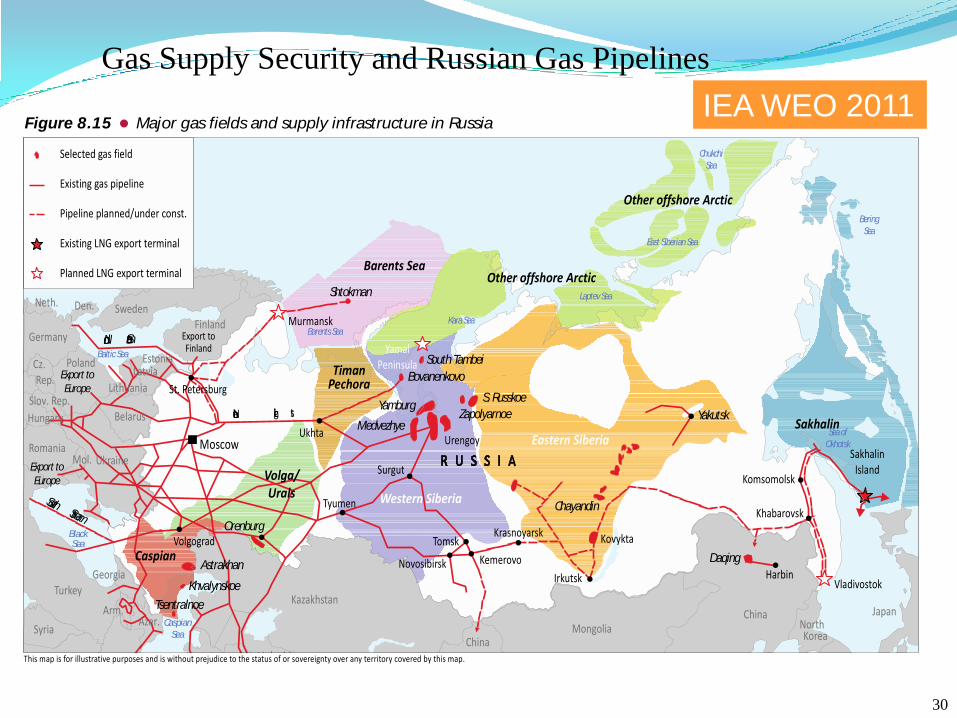
8
Figure 8.15 Major gas fields and supply infrastructure in Russia
Harbin
Northern Ligh ts
Nord Stream
Export to
Europe
Moscow
Yamburg
Medvezhye
Daqing
Shtokman
Urengoy
MongoliaSyria NorthKorea
China
Irkutsk
Japan
Slov. Rep.
Cz.Rep.
Poland
Germany
SwedenDen.
R U S S I A SakhalinIsland
Komsomolsk
Khabarovsk
Bovanenkovo
SouthTambei
Neth.
Chayandin
Zapolyarnoe
S.Russkoe
Krasnoyarsk
Yakutsk
Export toFinland
St. Petersburg
Estonia
Norway
Finland
Latvia
SouthStream
China
Novosibirsk Kemerovo
Tomsk
Surgut
Kazakhstan
U b ki
Tyumen
Orenburg
Astrakhan
Khvalynskoe
TsentralnoeTurkey
Georgia
Azer.Arm.
Volgograd
Ukhta
Vladivostok
Murmansk
YamalPeninsula
Kovykta
Export to
Europe
RomaniaMol.
Hungary Sakhalin
Other offshore Arctic
Other ArcticoffshoreBarents Sea
Eastern Siberia
Western Siberia
Volga/Urals
TimanPechora
Caspian
Ukraine
Lithuania
Belarus
Selected gas field
Existing gas pipeline
Pipeline planned/under const.
Existing LNG export terminal
Planned LNG export terminal
This map is for illustrative purposes and is without prejudice to the status of or sovereignty over any territory covered by this map.
Seaof
Okhotsk
LaptevSea
East SiberianSea
Chukchi
Sea
Bering
Sea
Caspian
Sea
BlackSea
BalticSea
KaraSeaBarentsSea
© OECD/IEA, 2011 Gas Supply Security and Russian Gas Pipelines
IEA WEO 2011
30
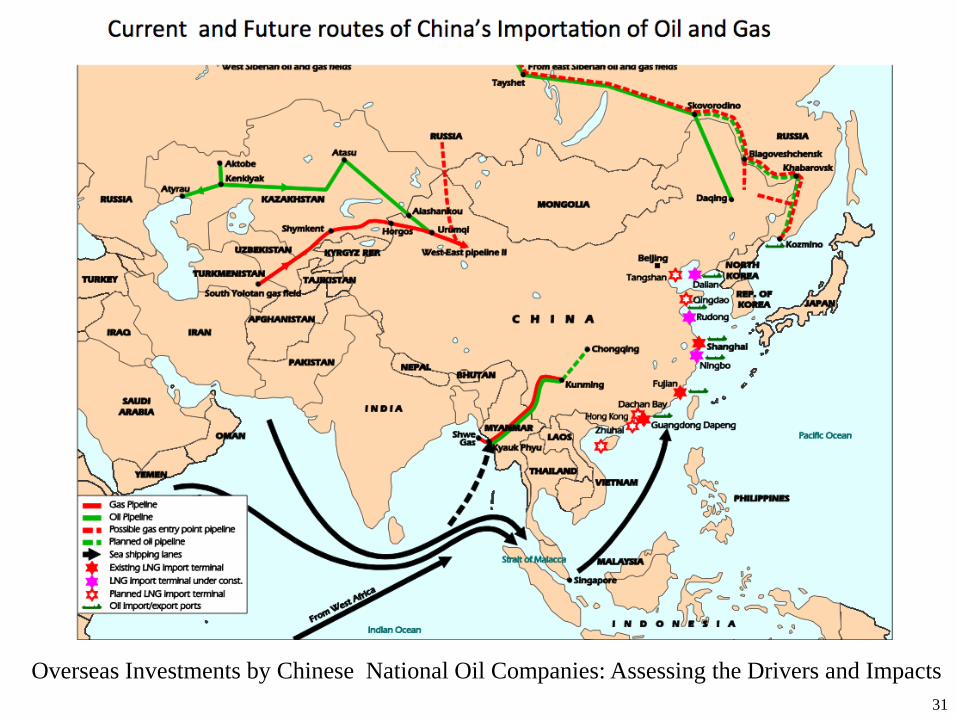
Overseas Investments by Chinese National Oil Companies: Assessing the Drivers and Impacts
31
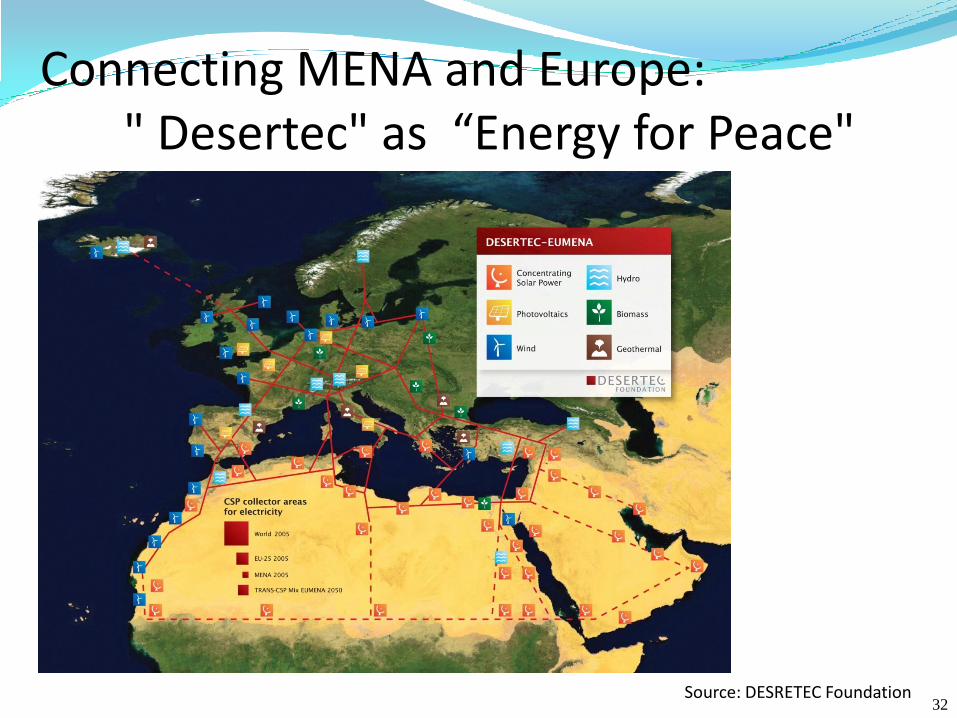
Connecting MENA and Europe:" Desertec" as “Energy for Peace"
Source: DESRETEC Foundation32
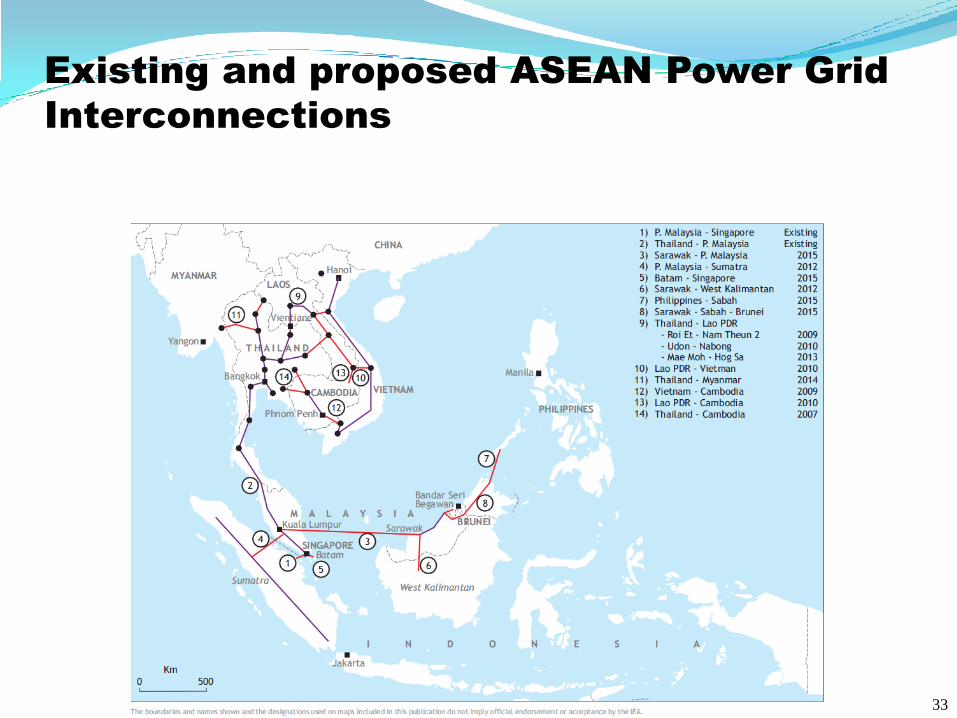
Existing and proposed ASEAN Power Grid
Interconnections
33
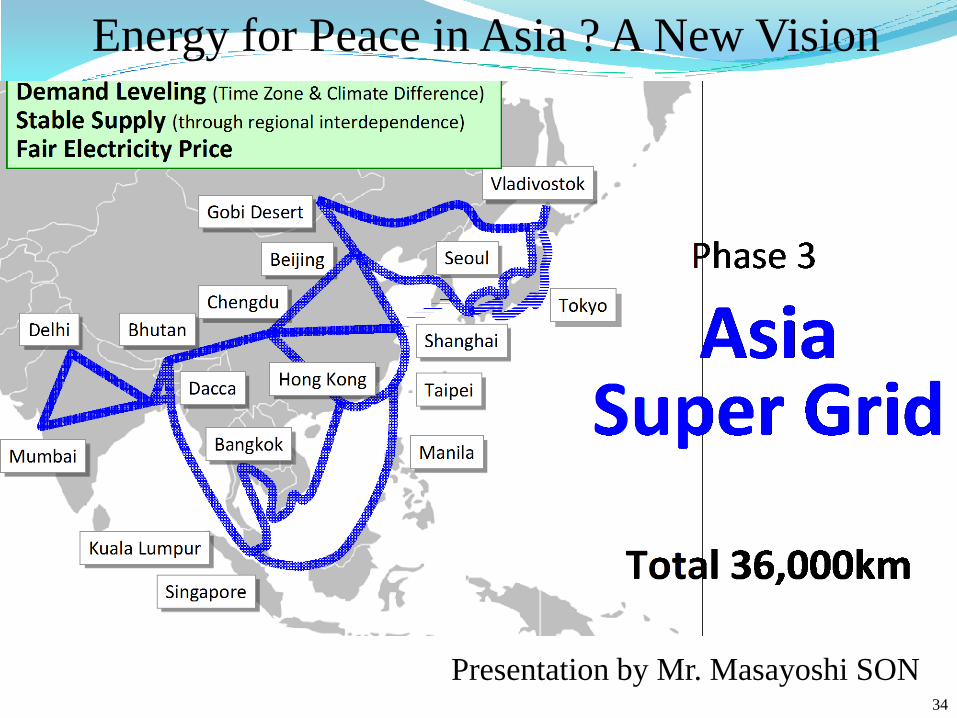
Presentation by Mr. Masayoshi SON
Energy for Peace in Asia ? A New Vision
34
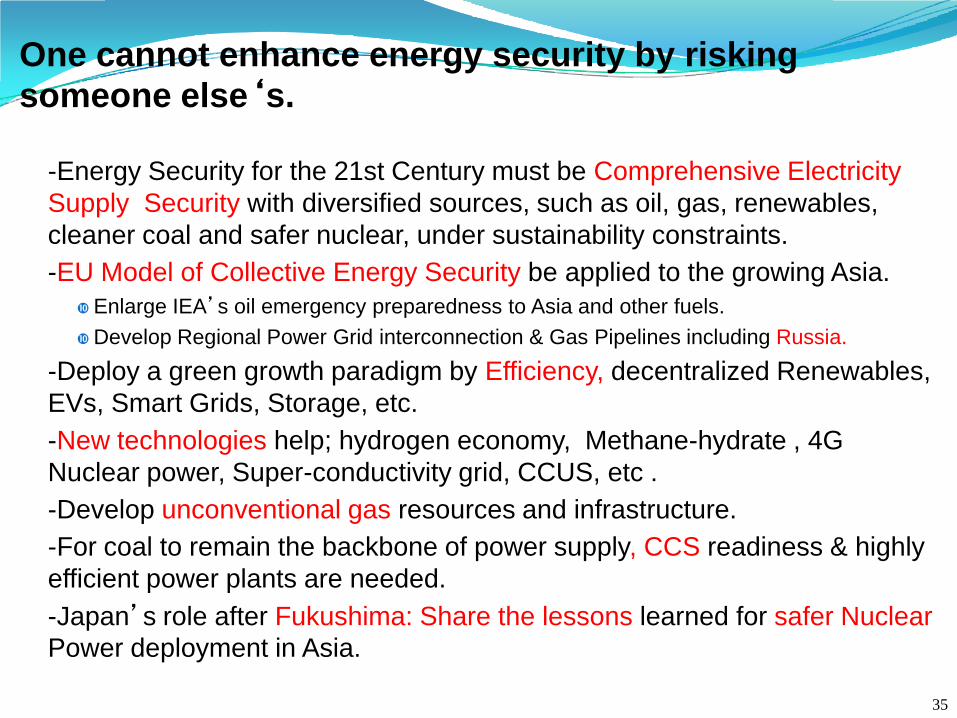
One cannot enhance energy security by risking
someone else‘s.
-Energy Security for the 21st Century must be Comprehensive Electricity
Supply Security with diversified sources, such as oil, gas, renewables,
cleaner coal and safer nuclear, under sustainability constraints.
-EU Model of Collective Energy Security be applied to the growing Asia.
Enlarge IEA’s oil emergency preparedness to Asia and other fuels.
Develop Regional Power Grid interconnection & Gas Pipelines including Russia.
-Deploy a green growth paradigm by Efficiency, decentralized Renewables,
EVs, Smart Grids, Storage, etc.
-New technologies help; hydrogen economy, Methane-hydrate , 4G
Nuclear power, Super-conductivity grid, CCUS, etc .
-Develop unconventional gas resources and infrastructure.
-For coal to remain the backbone of power supply, CCS readiness & highly
efficient power plants are needed.
-Japan’s role after Fukushima: Share the lessons learned for safer Nuclear
Power deployment in Asia.
35