slide 1 An Experiment to Determine the Accuracy of Squeeze-Film Damping Models in the Free-Molecule...
35
slide 1 An Experiment to Determine the An Experiment to Determine the Accuracy of Squeeze-Film Damping Accuracy of Squeeze-Film Damping Models in the Free-Molecule Regime Models in the Free-Molecule Regime Presented at Purdue University Birck Nanotechnology Center April 6, 2007 Sandia is a multiprogram laboratory operated by Sandia Corporation, a Lockheed Martin Company, for the United States Department of Energy’s National Nuclear Security Administration under contract DE-AC04-94AL85000. Hartono (Anton) Sumali Hartono (Anton) Sumali 1526 Applied Mechanics Development 1526 Applied Mechanics Development Albuquerque, NM
-
Upload
chad-floyd -
Category
Documents
-
view
214 -
download
0
Transcript of slide 1 An Experiment to Determine the Accuracy of Squeeze-Film Damping Models in the Free-Molecule...
slide 1
An Experiment to Determine the Accuracy An Experiment to Determine the Accuracy of Squeeze-Film Damping Models in the of Squeeze-Film Damping Models in the
Free-Molecule Regime Free-Molecule Regime
Presented atPurdue University
Birck Nanotechnology CenterApril 6, 2007
Sandia is a multiprogram laboratory operated by Sandia Corporation, a Lockheed Martin Company,for the United States Department of Energy’s National Nuclear Security Administration
under contract DE-AC04-94AL85000.
Hartono (Anton) SumaliHartono (Anton) Sumali
1526 Applied Mechanics Development1526 Applied Mechanics Development
Albuquerque, NM

slide 2Gas damping is important in MEMS.
Motivation:• Many micro/nano devices need high Q factor. Examples abound in
• MEMS switches need high speed (high Q). • Resonant cantilever sensors need high responses. • MEMS gyroscopes.• MEMS accelerometers need controlled damping.
• Damping can reduce Q from several hundred thousands to several hundreds. • Squeeze-film damping determines the dynamics of plates moving a few microns
above the substrate.
Objective:• Provide experimental validation to squeezed-film damping models for rigid plates.
• Continuum models are not known to be valid in rarefied (free molecule) regime. • Molecular-dynamics-based models for predicting squeezed-film damping give
different results.• So which model should one use?• Need experimental validation!
• Published experimental data were obtained for squeeze-film damping on flexible structures. Have been used to validate theory derived for rigid structures.
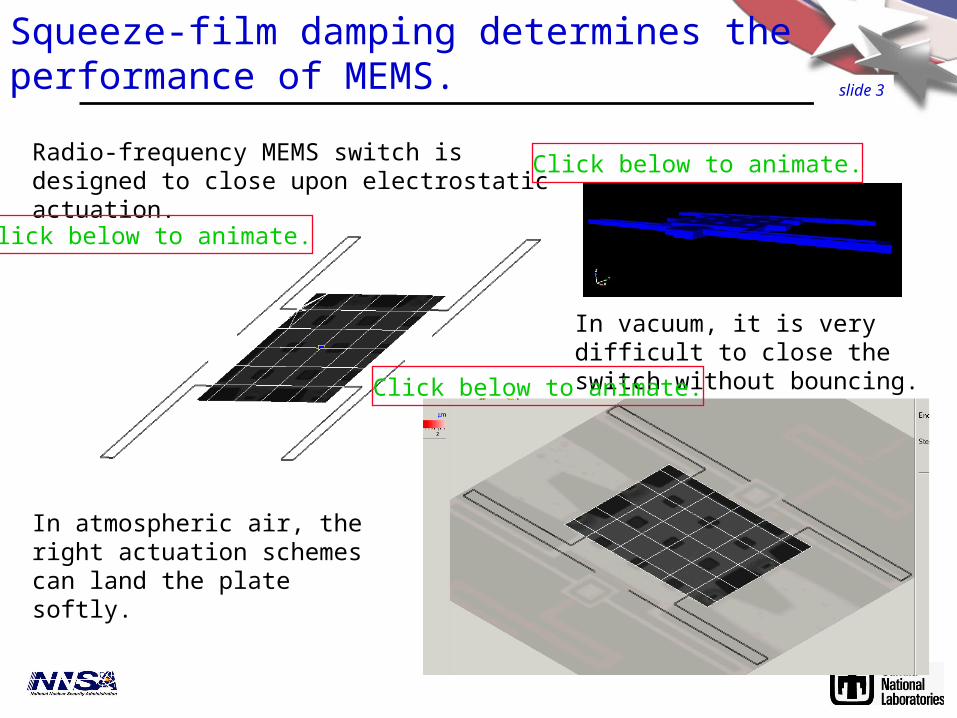
slide 3
Squeeze-film damping determines the performance of MEMS.
Radio-frequency MEMS switch is designed to close upon electrostatic actuation.
In vacuum, it is very difficult to close the switch without bouncing.
In atmospheric air, the right actuation schemes can land the plate softly.
Click below to animate.
Click below to animate.
Click below to animate.
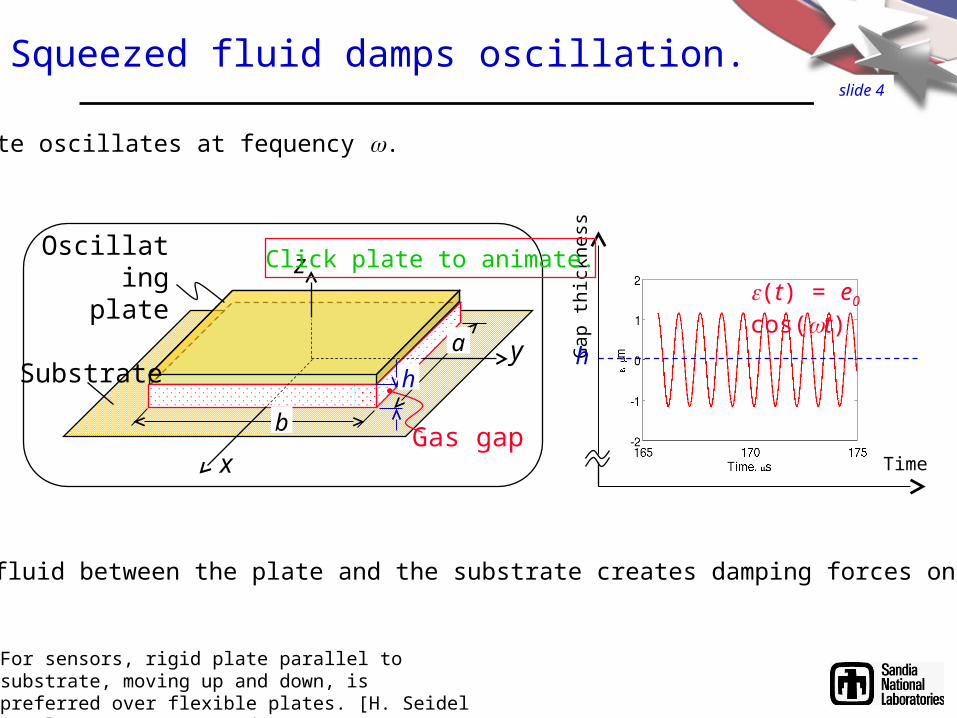
slide 4
Squeezed fluid damps oscillation.
Oscillating plate
Gas gap
Substrate
x
y
z
a
b
h
Gap
thic
knes
s
h
Time
(t) = e0 cos(t)
Plate oscillates at fequency .
The squeezed fluid between the plate and the substrate creates damping forces on the plate.
For sensors, rigid plate parallel to substrate, moving up and down, is preferred over flexible plates. [H. Seidel et al. 1990 Sensors and Actuators, 21 312-315.]
Click plate to animate.

slide 5
Squeeze-film damping is important in the design of MEMS/NEMS
Finite element models
• Simple.• Gives clearer ideas of how parameters affect
damping. • Well suited for design and optimization.
http://www.comsol.com/showroom/gallery/1432.php
32 /)(42.0 habc Andrews
Reduced-order models
ExampleExample
• High resolution.• High fidelity.
However,
Are models based on continuum mechanics valid for rarefied gas in the free-molecule regime?
• Models are needed for predicting and designing performance of MEMS. • Modeling tools are available, especially based on continuum mechanics.

slide 6
Knudsen number determines damping regime
http://www.phas.ucalgary.ca/~annlisen/teaching/Phys223/PHYS223-LECT34.html
mm
RT
P
2 R = universal gas constant, T = temperature, Kmm=molecular mass, kg/mol
•Mean free path
h
z
tP
p
tP
pPh 22
12•Continuum models, eg. Are based on spatial derivatives.
•Do they apply when the gap is not much larger than the mean free path?
Many researchers say no.
•Knudsen number Ks = 1.016 mean free path/(gap size).
We need experimental data.

slide 7
Molecular models for free-space drag were used to calculate squeeze-film damping.
Christian’s model
Kadar et al’s model
R.G. Christian 1966 Vacuum, 16 175
ApTk
mc
TChristian
24
• The models below were derived for free-space drag, not squeeze-film damping. • Have been used to explain data measured on squeeze-film damping.
Improved on Christian’s model by replacing its Maxwell-Boltzman velocity distribution with the Maxwellian stream distribution, resulting in
Z. Kadar et al 1996 Sensors and Actuators A, 53 299-303
Li et al’s model B. Li et al 1999 Sensors and Actuators A, 77 191-194
ChristianTR
MLi cu
c2
3 01
5.1
cKadar = cChristian
Improved on Kadar et al’s model by taking into account the velocity of the moving structure relative to the fluid, resulting in
m = mass of one molecule, kgkT = Boltzman’s constant, J/KT = Temperature, KA = Plate area, m2
p = Pressure, Pa
z
Damping
m
c
Plate
Stiffness
kNo substrate
[S. Hutcherson and W. Ye 2004 J. Micromech. Microeng. 14 1726-1733.]
These are “molecular-based’ models, not molecular dynamic models.

slide 8
Models for free-space drag underestimate squeeze-film damping. Measured on squeeze-film device [J.D. Zook et al 1992 Sensors and Actuators A, 35 51-59] Original free-space damping
model [R.G Christian 1966 Vacuum, 16 175]
Figure in Li et al 1999 Sensors and Actuators A, 77 191-194
Improved model [B. Li et al 1999 Sensors and Actuators A, 77 191-194]
Improved model [Z. Kadar et al 1996 Sensors and Actuators A, 53 299-303]
Models gave higher Q (lower damping) than measured.

slide 9
Squeeze-film damping is much larger than free-space drag.
Predicted with free-space drag: Higher Q (lower damping).
Measured on squeeze-film damped MEMS: Lower Q (higher damping).
Figure in C. Gui et al 1995 J. Micromech. Microeng. 5 183-185.
Also concluded in R. Legtenberg and H.A.C. Tilmans 1994 Sensors and Actuators A 45 57-66.

slide 10
Bao et al 2002 J. Micromech. Microeng. 12 341-346. Bao et al’s model
• The models below are adaptation of the free-space drag model to squeeze-film damping. • Have been used to explain data measured on squeeze-film damping.
Adapts Christian’s model to squeeze-film damping (instead of free-space drag), resulting in
Christianncecircumfere
Bao chL
c16
/
Oscillating plate
Gas gap
Substratea
b
h
Lcircumference = 2a+2bh = Gap thickness
Hutcherson and Ye’s (HY) model
• Refines Bao’s model by taking into account the change of velocity of molecules colliding with the plate and the substrate.
• True molecular model generated by molecular dynamic simulation. • For the case considered in their paper,
cHY ≈ 2.2 cBao
Molecular models for free-space drag were adapted to calculate squeeze-film damping.
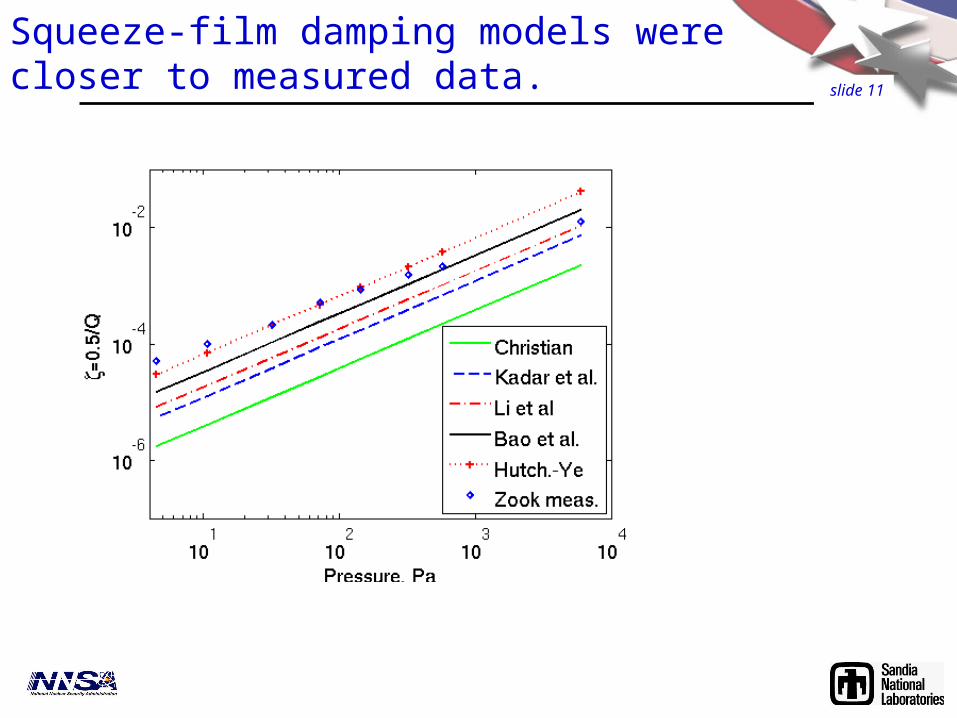
slide 11
Squeeze-film damping models were closer to measured data.

slide 12
Published molecular models still could not explain published measured damping.
Adapted to squeeze-film gap [M Bao et al
2002 J. Micromech. Microeng. 12 341-346.]
MD-simulation-based model [S. Hutcherson and W. Ye 2004 J. Micromech. Microeng. 14 1726-1733.]
Free-space damping model [R.G Christian 1966 Vacuum, 16 175]
Data measured on squeeze-film device [J.D. Zook et al 1992 Sensors and Actuators A, 35 51-59] • Hutcherson and Ye’s (HY) model
appears to be closest to Zook’s data. • However, Zook’s data have a different
slope than all models. • Zook’s geometry and test conditions
are not well known or modeled.
We need • A model that is validated by measured data. • Measurement data with better characterized test device and conditions.
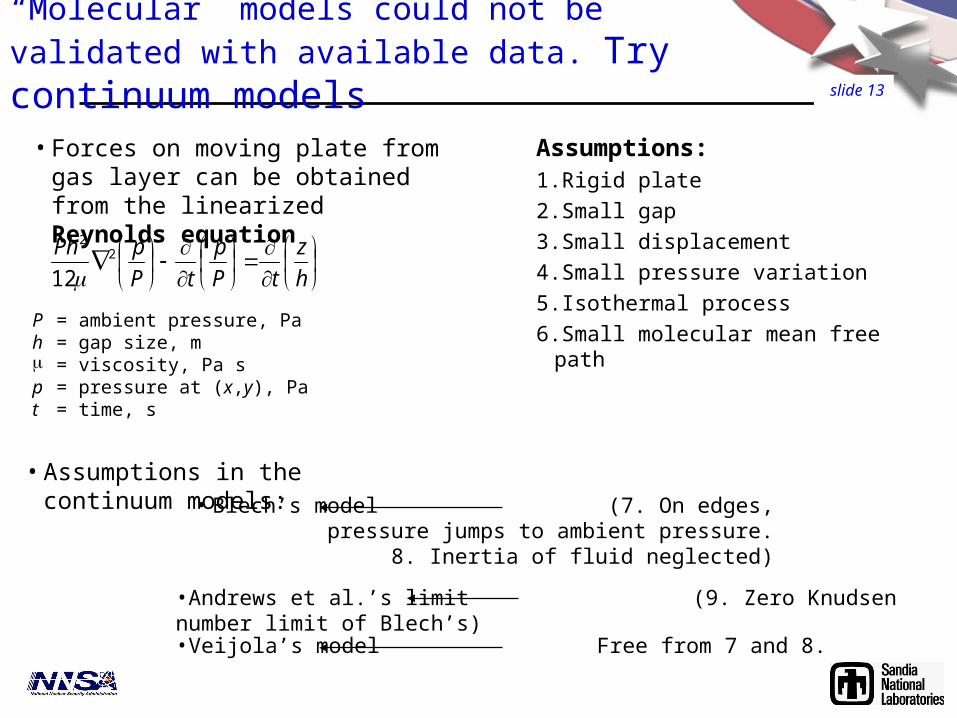
slide 13
• Assumptions in the continuum models:
• Forces on moving plate from gas layer can be obtained from the linearized Reynolds equation
Assumptions:1.Rigid plate
2.Small gap
3.Small displacement
4.Small pressure variation
5.Isothermal process
6.Small molecular mean free path
• Blech’s model (7. On edges, pressure jumps to ambient pressure.
8. Inertia of fluid neglected)
•Andrews et al.’s limit (9. Zero Knudsen number limit of Blech’s)
•Veijola’s model Free from 7 and 8.
h
z
tP
p
tP
pPh 22
12
P = ambient pressure, Pah = gap size, m = viscosity, Pa sp = pressure at (x,y), Pat = time, s
“Molecular” models could not be validated with available data. Try continuum models

slide 14
Blech’s model was derived for continuum regime, low Knudsen number.
e0 = amplitude, mmplate= plate mass, kgt = time, sz = gap displacement, m = frequency, rad/s
Blech, J.J., 1983, “On Isothermal Squeeze Films”, Journal of Lubrication Technology, 105, p 615-620.
mplate
ks cs
Plate
Structural stiffness
Solid damping
fkzzczm plate
~
Blechs cc
Blechs jk
cBlech kBlech
• Squeeze film causes an extra damping coefficient
• and an extra spring stiffness
z(t) = e0 cos(t)
• Oscillating plate has stiffness and intrinsic (non-squeeze-film) damping.
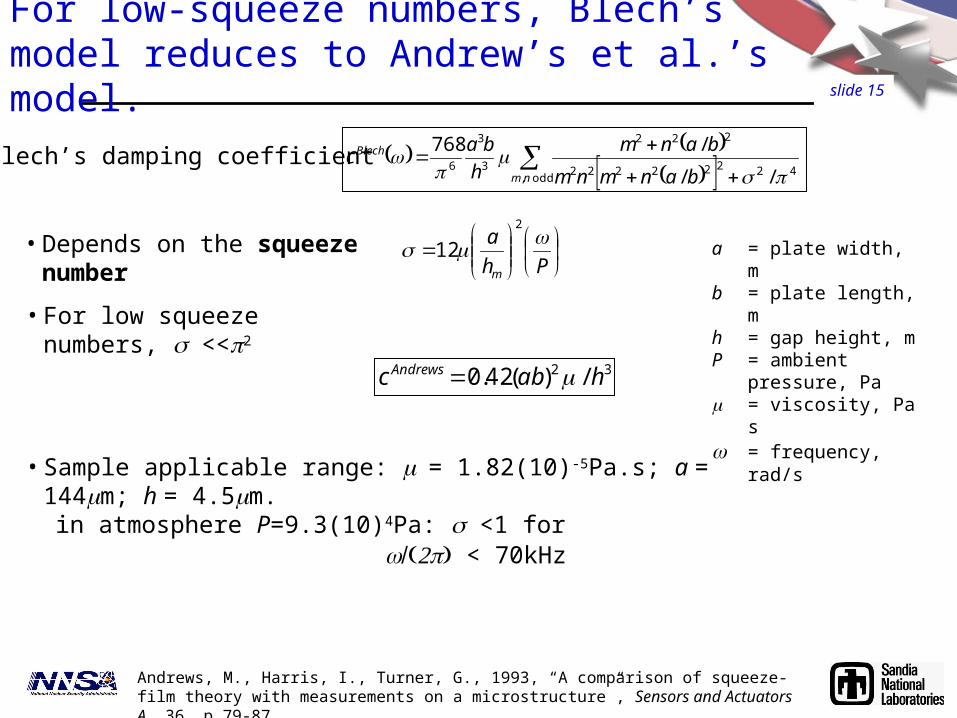
slide 15
For low-squeeze numbers, Blech’s model reduces to Andrew’s et al.’s model.
• For low squeeze numbers, <<2
32 /)(42.0 habc Andrews
Ph
a
m
2
12• Depends on the squeeze number
odd,42222222
222
3
3
6//
/768
nm
Blech
banmnm
banm
h
bac
a = plate width, mb = plate length, mh = gap height, mP = ambient pressure, Pa = viscosity, Pa s = frequency, rad/s
• Sample applicable range: = 1.82(10)-5Pa.s; a = 144m; h = 4.5m. in atmosphere P=9.3(10)4Pa: <1 for
< 70kHz
• Blech’s damping coefficient
Andrews, M., Harris, I., Turner, G., 1993, “A comparison of squeeze-film theory with measurements on a microstructure”, Sensors and Actuators A, 36, p 79-87.
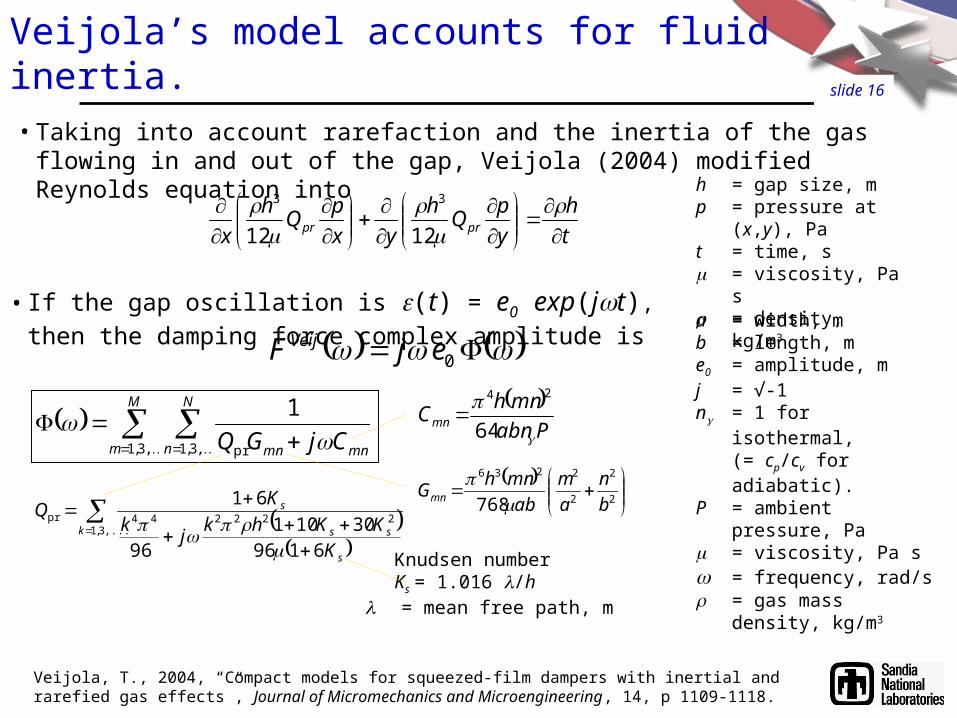
slide 16
h = gap size, mp = pressure at (x,y), Pat = time, s = viscosity, Pa s = density, kg/m3
• Taking into account rarefaction and the inertia of the gas flowing in and out of the gap, Veijola (2004) modified Reynolds equation into
t
h
y
pQ
h
yx
pQ
h
x prpr
1212
33
Knudsen numberKs = 1.016 /h
Veijola, T., 2004, “Compact models for squeezed-film dampers with inertial and rarefied gas effects”, Journal of Micromechanics and Microengineering, 14, p 1109-1118.
= mean free path, m
M
m
N
n mnmn CjGQ ,3,1 ,3,1 pr
1
• If the gap oscillation is (t) = e0 exp(jt), then the damping force
complex amplitude is
Pabn
mnhCmn
64
24
2
2
2
2236
768 b
n
a
m
ab
mnhGmn
a = width, mb = length, me0 = amplitude, mj = √-1n = 1 for isothermal,
(= cp/cv for adiabatic). P = ambient pressure, Pa = viscosity, Pa s = frequency, rad/s = gas mass density, kg/m3
0ejFVeij
,...3,1222244pr
6196
30101
96
61
k
s
ss
s
K
KKhkj
k
KQ
Veijola’s model accounts for fluid inertia.

slide 17
Flexible test devices did not validate model derived for rigid plates.
C.C. Cheng and W. Fang 2005 Microsystem Technologies 11 104–110
• Blech’s model was derived for rigid plates.
• Published test on flexible cantilevers gave lower damping.
We need a rigid plate oscillating up and down while staying parallel to the substrate.
slide 18
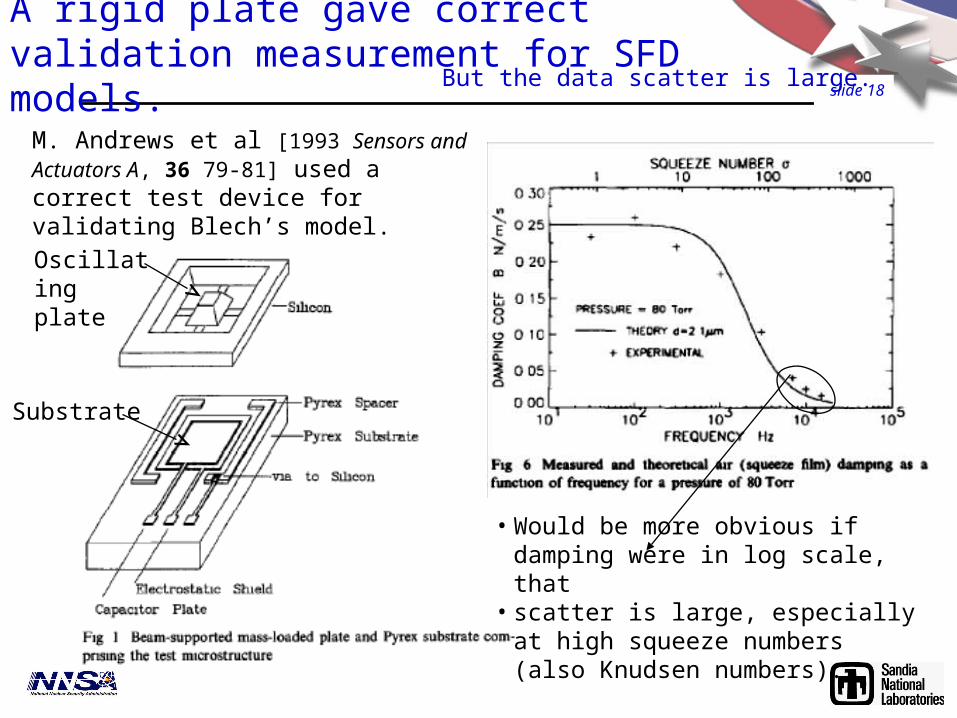
A rigid plate gave correct validation measurement for SFD models.
M. Andrews et al [1993 Sensors and Actuators A, 36 79-81] used a correct test device for validating Blech’s model.
Oscillating plate
Substrate
• Would be more obvious if damping were in log scale, that
• scatter is large, especially at high squeeze numbers (also Knudsen numbers).
But the data scatter is large.
slide 19
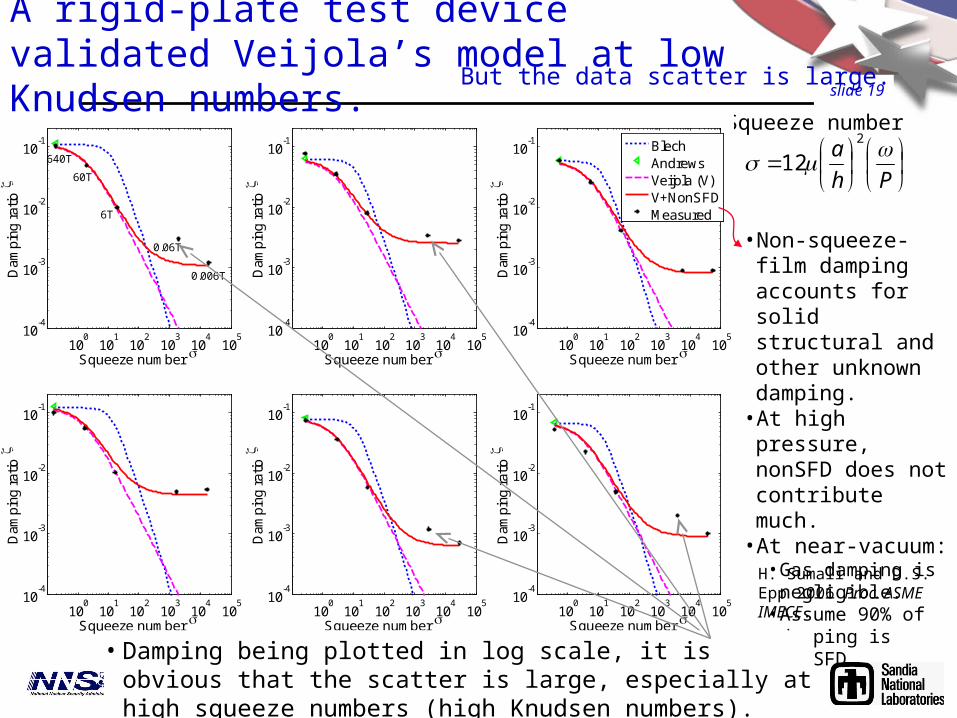
A rigid-plate test device validated Veijola’s model at low Knudsen numbers.
Ph
a 2
12
Squeeze number
• Non-squeeze-film damping accounts for solid structural and other unknown damping.
• At high pressure, nonSFD does not contribute much.
• At near-vacuum: • Gas damping is
negligible. • Assume 90% of
damping is nonSFD.
100
101
102
103
104
10510
-4
10-3
10-2
10-1
Squeeze number
Dam
ping
rat
io
BlechAndrewsVeijola (V)V+NonSFDMeasured
100
101
102
103
104
10510
-4
10-3
10-2
10-1
Squeeze number
Dam
ping
rat
io
100
101
102
103
104
10510
-4
10-3
10-2
10-1
Squeeze number
Dam
ping
rat
io
100
101
102
103
104
10510
-4
10-3
10-2
10-1
Squeeze number
Dam
ping
rat
io
100
101
102
103
104
10510
-4
10-3
10-2
10-1
Squeeze number
Dam
ping
rat
io
100
101
102
103
104
10510
-4
10-3
10-2
10-1
Squeeze number
Dam
ping
rat
io
640T
60T
6T
0.06T
0.006T
H. Sumali and D.S. Epp 2006 Proc. ASME IMECE.
• Damping being plotted in log scale, it is obvious that the scatter is large, especially at high squeeze numbers (high Knudsen numbers).
But the data scatter is large.
slide 20
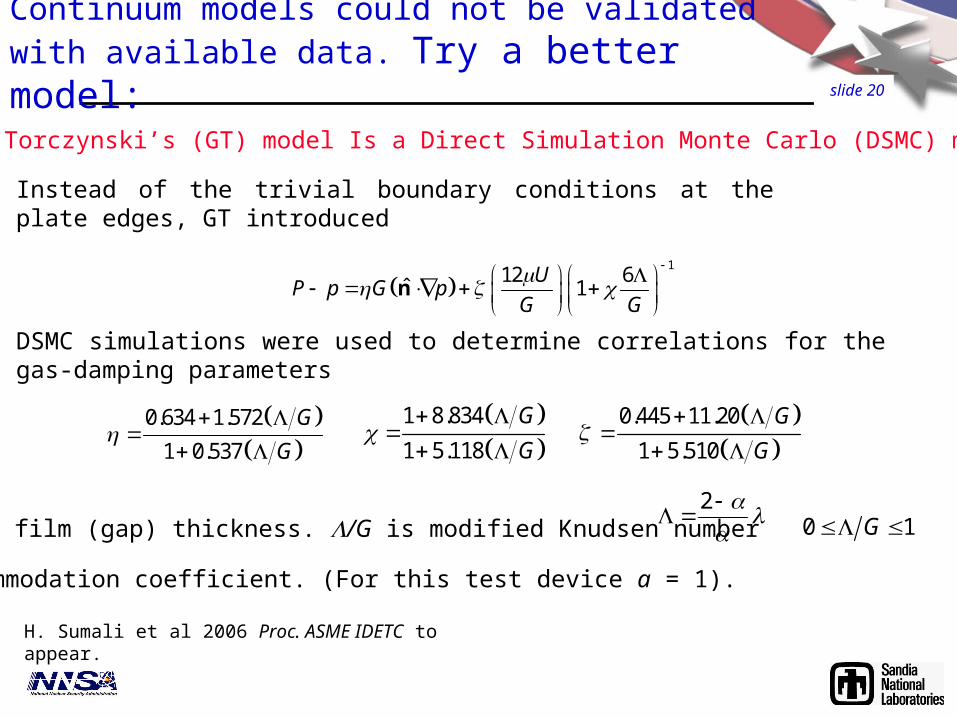
Continuum models could not be validated with available data. Try a better model:
1
12 6ˆ 1
UP p G p
G G
n
Instead of the trivial boundary conditions at the plate edges, GT introduced
DSMC simulations were used to determine correlations for the gas-damping parameters
0.634 1.572
1 0.537
G
G
0.445 11.20
1 5.510
G
G
1 8.834
1 5.118
G
G
0 1G G = gas film (gap) thickness. /G is modified Knudsen number
2
= accommodation coefficient. (For this test device a = 1).
H. Sumali et al 2006 Proc. ASME IDETC to appear.
Gallis and Torczynski’s (GT) model Is a Direct Simulation Monte Carlo (DSMC) method.
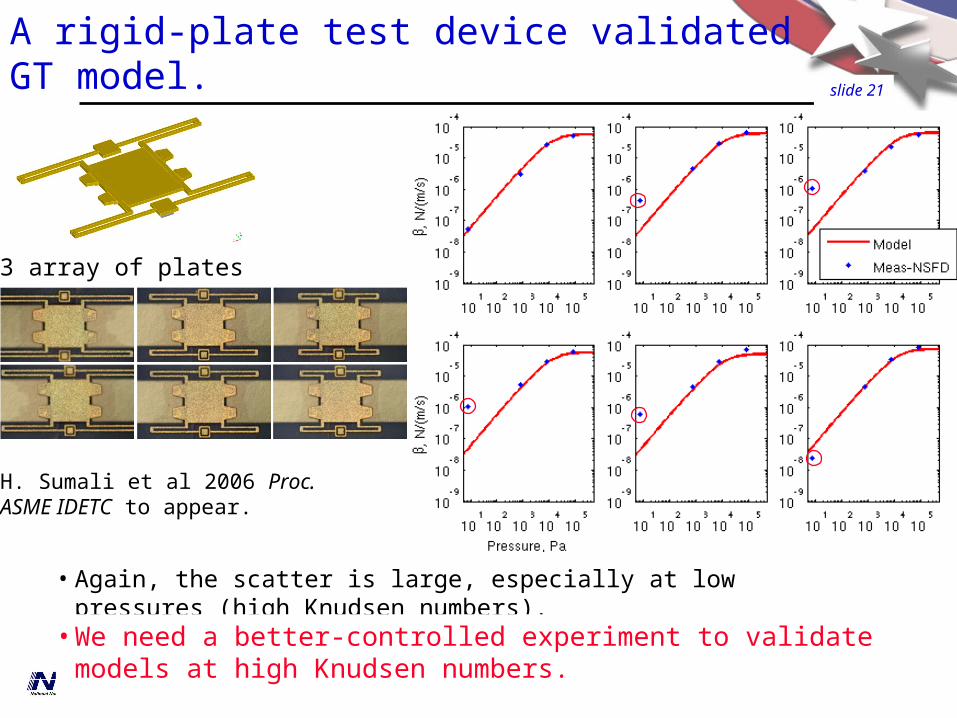
slide 21
A rigid-plate test device validated GT model.
H. Sumali et al 2006 Proc. ASME IDETC to appear.
• Again, the scatter is large, especially at low pressures (high Knudsen numbers).
• We need a better-controlled experiment to validate models at high Knudsen numbers.
• 2x3 array of plates
slide 22
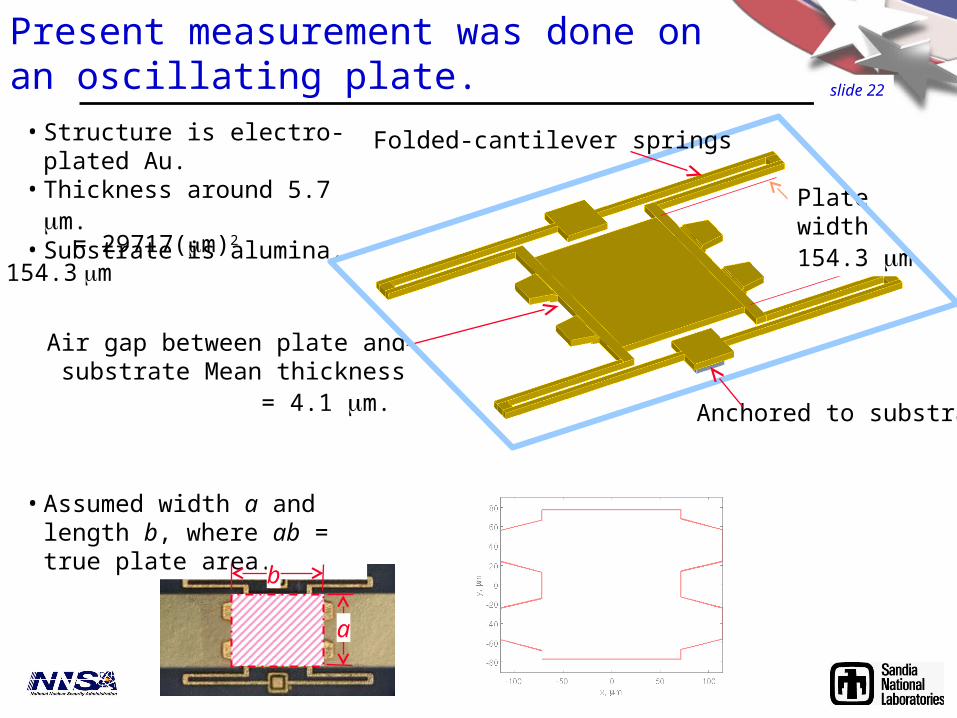
Present measurement was done on an oscillating plate.
Plate width154.3 m
Air gap between plate and substrate Mean thickness = 4.1 m.
• Structure is electro-plated Au. • Thickness around 5.7 m. • Substrate is alumina.
Folded-cantilever springs
Anchored to substrate
• Assumed width a and length b, where ab = true plate area.
b
a
A = 29717(m)2
a = 154.3 m
slide 23
The test structure can be modeled as SDOF.
zb
zzczzkzm bb
• Equation of motionDamping
mplate
c
Plate
Stiffness
k
z(t) = e0 cos(t)
• Frequency response function (FRF) from base displacement to plate displacement:
1
2
2
gassgassb kkccjm
m
Z
Z
non-squeeze-
film
Substrate
Measured
damping
squeeze-film
slide 24
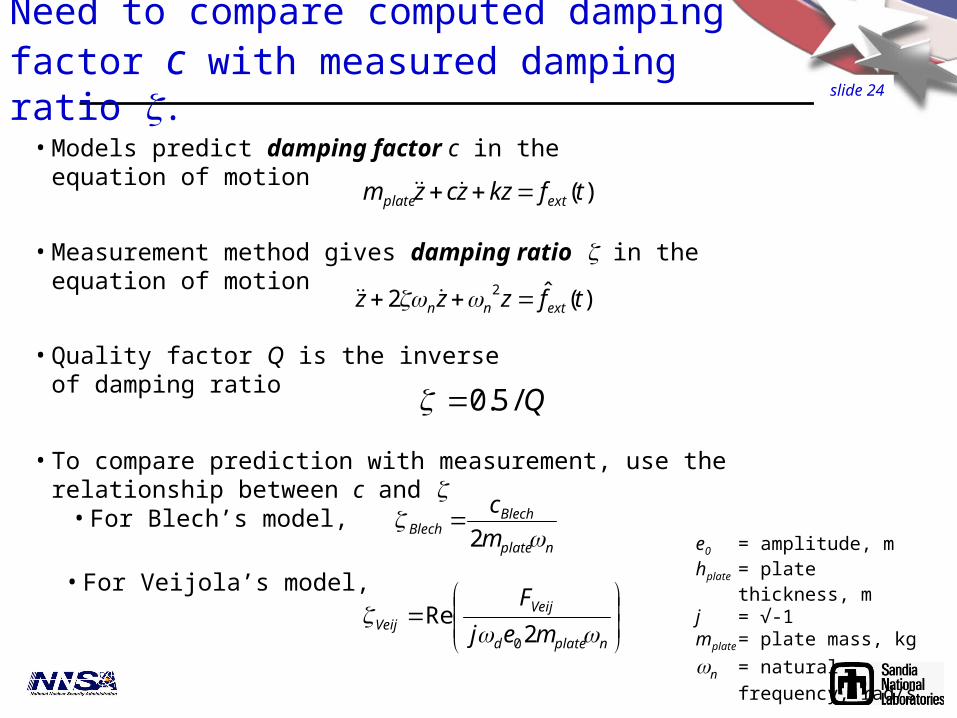
Need to compare computed damping factor c with measured damping ratio .
• To compare prediction with measurement, use the relationship between c and
• Models predict damping factor c in the equation of motion
)(tfkzzczm extplate
)(ˆ2 2 tfzzz extnn
nplate
BlechBlech m
c
2
e0 = amplitude, mhplate = plate thickness, mj = √-1mplate = plate mass, kg
n = natural frequency, rad/s
nplated
VeijVeij mej
F
2Re
0
• For Veijola’s model,
• For Blech’s model,
• Measurement method gives damping ratio in the equation of motion
• Quality factor Q is the inverse of damping ratio
Q/5.0
slide 25
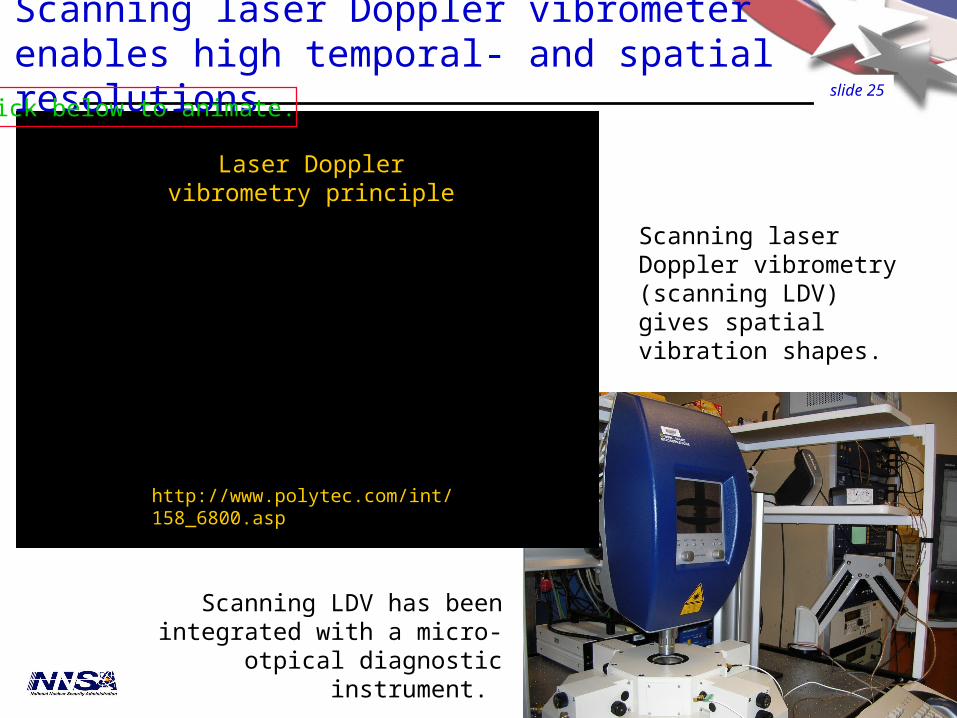
Scanning laser Doppler vibrometer enables high temporal- and spatial resolutions.
http://www.polytec.com/int/158_6800.asp
Laser Doppler vibrometry principle
Scanning laser Doppler vibrometry (scanning LDV) gives spatial vibration shapes.
Scanning LDV has been integrated with a micro-otpical diagnostic instrument.
Click below to animate.
slide 26
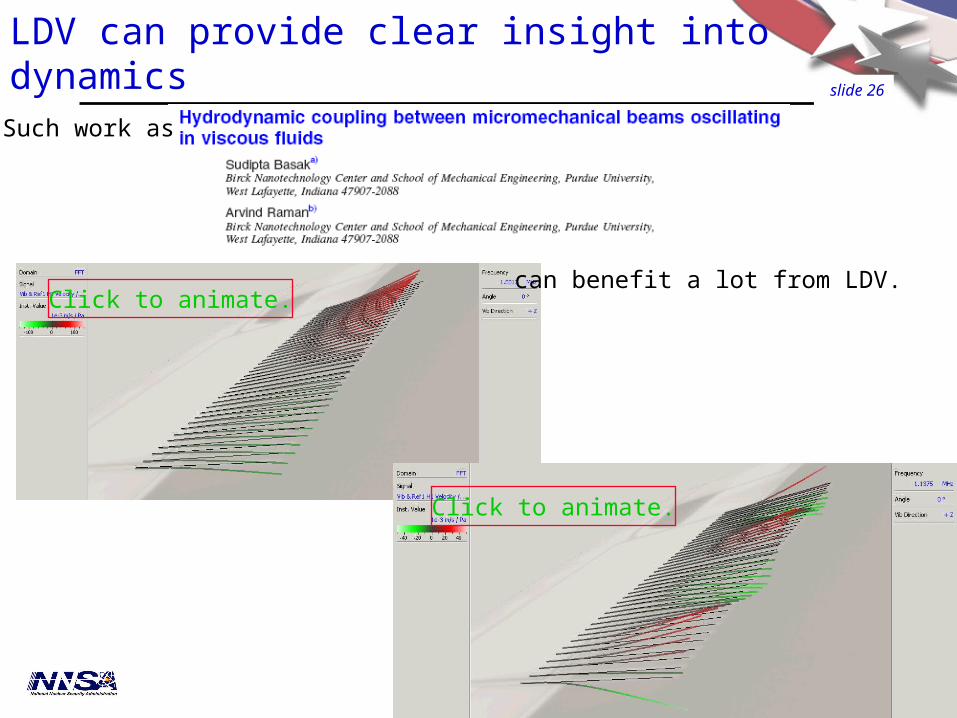
LDV can provide clear insight into dynamics
Such work as
can benefit a lot from LDV.Click to animate.
Click to animate.
slide 27
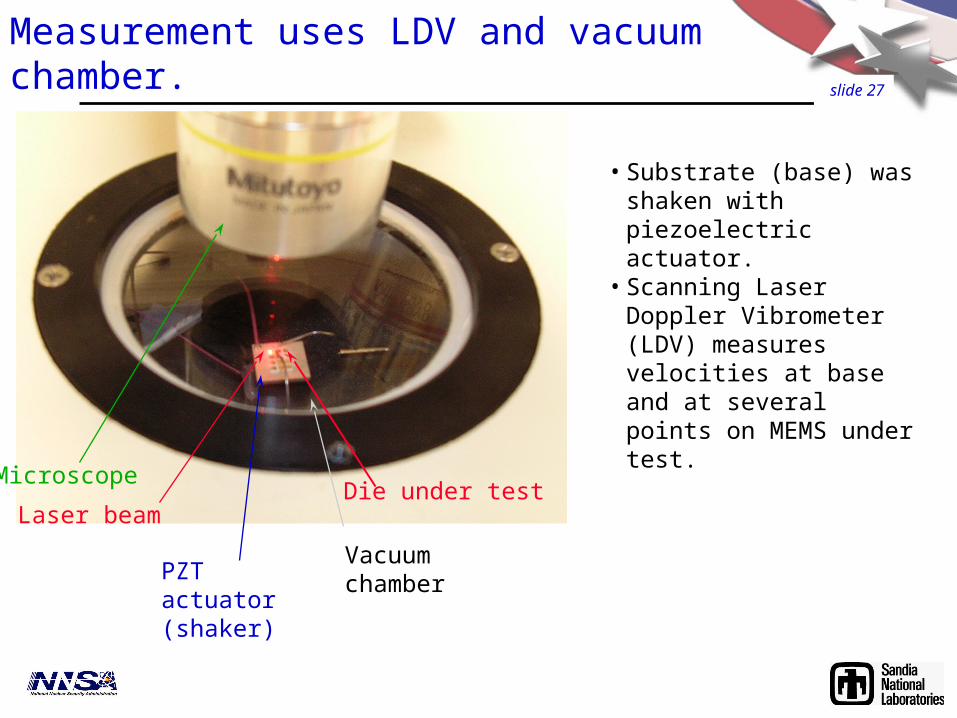
Measurement uses LDV and vacuum chamber.
Microscope
Vacuum chamber
Laser beamDie under test
PZT actuator (shaker)
• Substrate (base) was shaken with piezoelectric actuator.
• Scanning Laser Doppler Vibrometer (LDV) measures velocities at base and at several points on MEMS under test.
slide 28
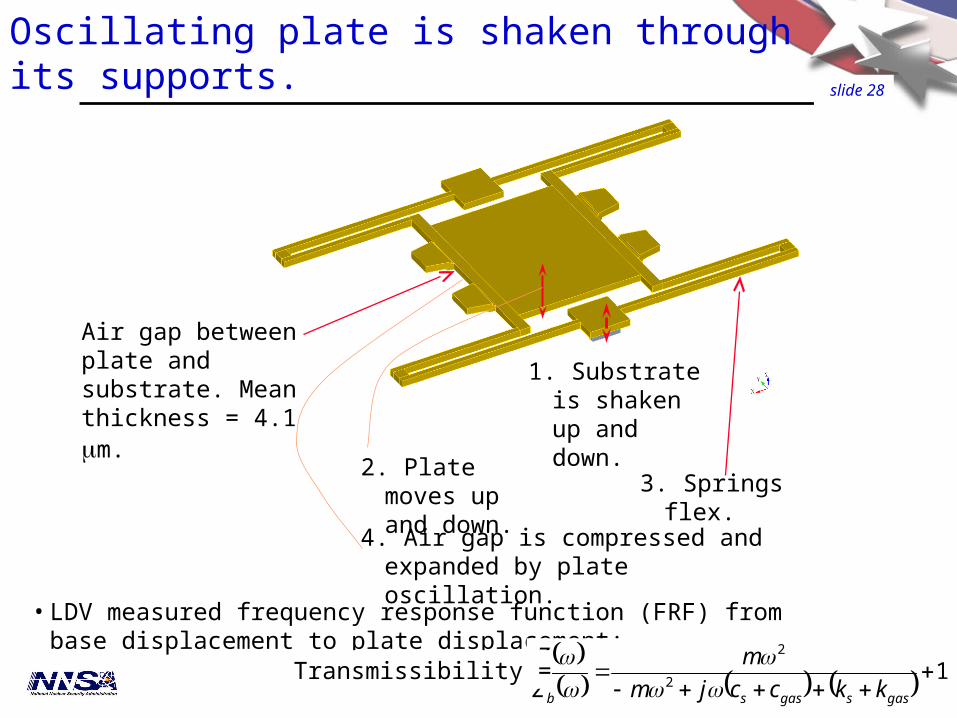
Oscillating plate is shaken through its supports.
1. Substrate is shaken up and down.
2. Plate moves up and down. 3. Springs flex.
4. Air gap is compressed and expanded by plate oscillation.
Air gap between plate and substrate. Mean thickness = 4.1 m.
• LDV measured frequency response function (FRF) from base displacement to plate displacement:
12
2
gassgassb kkccjm
m
Z
Z
Transmissibility =

slide 29
FRFs are curve-fit to give natural frequency, damping and mode shapes
• Tests were repeated at different air pressures from atmospheric (640 Torr) to near-vacuum (<1 milliTorr).
• Frequency response function (FRF) from base displacement to gap displacement:
22
2
2 nnb
gap
jZ
Z
= Transmissibility - 1
• LDV measured transmissibility at 17 points on the plate and springs.
are curve-fit simultaneously using standard Experimental Modal Analysis (EMA) process.
• Commercial EMA software gave natural frequency, damping, and mode shapes.

slide 30
Experimental modal analysis gives natural frequency, damping and mode shapes.
Measured deflection shape, first mode. Higher modes are not considered.
16910Hz. Up-and-down.
27240Hz
33050Hz
• Tests were repeated at different air pressures from atmospheric (640 Torr) to near-vacuum (<1 milliTorr).
Click above to animate.
Click below to animate.
Click below to animate.
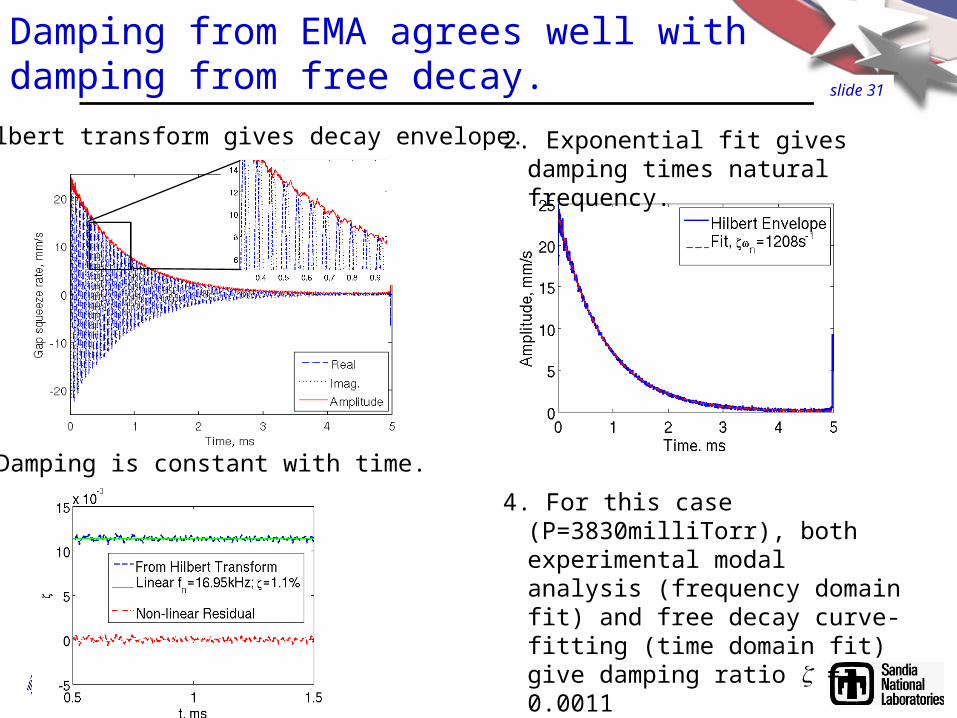
slide 31
Damping from EMA agrees well with damping from free decay.
1. Hilbert transform gives decay envelope. 2. Exponential fit gives damping times natural frequency.
3. Damping is constant with time.
4. For this case (P=3830milliTorr), both experimental modal analysis (frequency domain fit) and free decay curve-fitting (time domain fit) give damping ratio = 0.0011

slide 32
Non-squeeze-film damping is estimated from zero-pressure asymptote.
• At low pressures, Non-Squeeze-Film Damping (NSFD) is the dominant damping.
• Linear-fit total measured damping at a few lowest-pressures. The zero-pressure intercept is NSFD.
• To obtain squeeze-film damping from measured total damping, subtract NSFD from total measured damping.

slide 33
Some models predict measured data very well.
slide 34
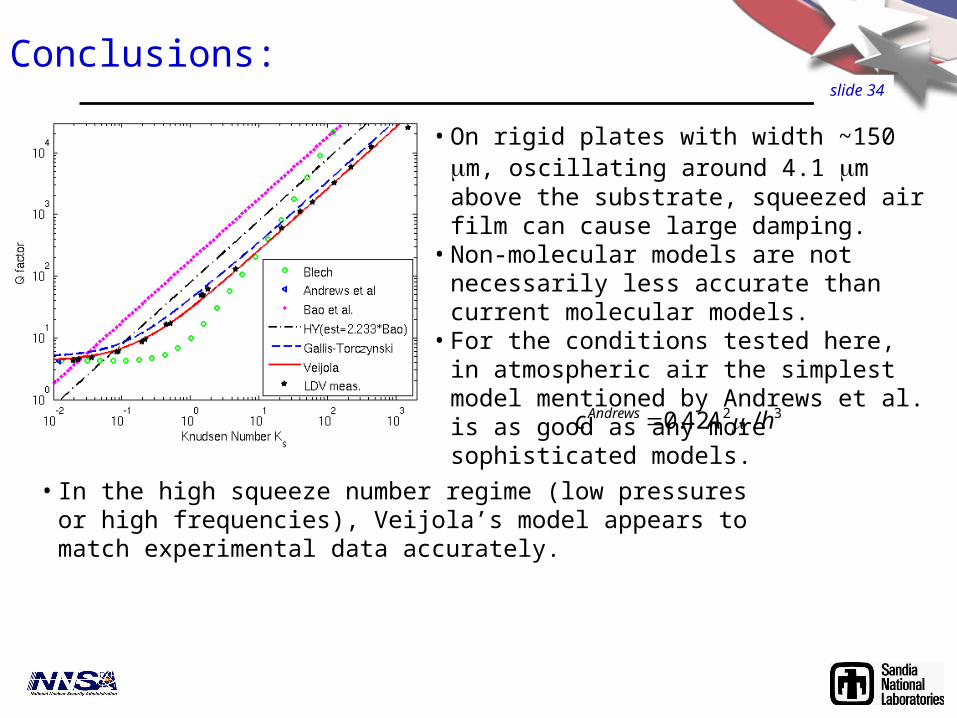
Conclusions:
• On rigid plates with width ~150 m, oscillating around 4.1 m above the substrate, squeezed air film can cause large damping.
• Non-molecular models are not necessarily less accurate than current molecular models.
• For the conditions tested here, in atmospheric air the simplest model mentioned by Andrews et al. is as good as any more sophisticated models.
32 /42.0 hAc Andrews
• In the high squeeze number regime (low pressures or high frequencies), Veijola’s model appears to match experimental data accurately.
slide 35
Acknowledgment
Sandia is a multiprogram laboratory operated by Sandia Corporation, a Lockheed Martin Company,for the United States Department of Energy’s National Nuclear Security Administration
under contract DE-AC04-94AL85000.
The author thanks the following contributors:• Chris Dyck and Bill Cowan’s team for providing
the test structures. • Jim Redmond and Dan Rader for technical
guidance and programmatic support. • David Epp for help with the modal analysis.