Sleep and Chronotype in Adolescents - A Chronobiological Field
111
Aus dem Institut für Medizinische Psychologie der Ludwig-Maximilians-Universität München komm. Vorstand: Prof. Dr. Till Roenneberg Sleep and Chronotype in Adolescents - a Chronobiological Field-Study - Dissertation zum Erwerb des Doktorgrades der Medizin an der medizinischen Fakultät der Ludwig-Maximilians-Universität zu München vorgelegt von Stephanie Böhm aus Thuine 2012
Transcript of Sleep and Chronotype in Adolescents - A Chronobiological Field
Aus dem Institut für Medizinische Psychologie
der Ludwig-Maximilians-Universität München
komm. Vorstand: Prof. Dr. Till Roenneberg
Sleep and Chronotype in Adolescents
- a Chronobiological Field-Study -
Dissertation
zum Erwerb des Doktorgrades der Medizin
an der medizinischen Fakultät der
Ludwig-Maximilians-Universität zu München
vorgelegt von
Stephanie Böhm
aus
Thuine
2012
Mit Genehmigung der Medizinschen Fakultät
der Universität München
Berichterstatter: Prof. Dr. Till Roenneberg
Mitberichterstatter: Prof. Dr. Axel Steiger
Prof. Dr. Brigitte Bondy
Dekan: Prof. Dr. Dr. h.c. Maximilian Reiser, FACR, FRCR
Tag der mündlichen Prüfung: 08.03.2012

Dedicated to Felix

Table of Contents
1 Introduction ................................................................................................... 6
1.1 Chronobiology and Biological Rhythms ....................................................... 6
1.2 Circadian Rhythms in Humans ...................................................................... 7
1.2.1 Chronotype ..................................................................................................... 8
1.2.2 The Circadian Clock in Adolescence ............................................................ 10
1.3 Sleep ................................................................................................................ 11
1.3.1 Anatomy and Physiology of Sleep ................................................................ 12
1.3.2 Sleep-EEG and Sleep Stages .......................................................................... 14
1.3.3 Sleeping into Adulthood: Characteristics of Sleep in Adolescence ............ 16
1.4 “Social Jetlag” and its Effects......................................................................... 18
1.5 Adolescents’ Sleep – a Health Care Subject ................................................. 19
1.6 Aims of this Study .........................................................................................20
2 Materials and Methods .................................................................................24
2.1 Participants ....................................................................................................24
2.1.1 Exclusion Criteria ..........................................................................................24
2.1.2 Ethical Approval ............................................................................................ 25
2.2 Materials ........................................................................................................26
2.2.1 Munich Chronotype Questionnaire (MCTQ) ..............................................26
2.2.2 Sleep Logs (SL) ..............................................................................................26
2.2.3 Zeo® – Advantages and Functions of a Simplified EEG ............................... 27
2.2.4 Software for Data Handling and Computation ........................................... 33
2.3 Methods ......................................................................................................... 33
2.3.1 Data Collection .............................................................................................. 33
2.3.2 Data Treatment ............................................................................................. 35
3 Results ........................................................................................................... 40

3.1 Description of Obtained Data ..................................................................... 40
3.1.1 List of Obtained Data ................................................................................... 40
3.1.2 Zeo®-Measurements ..................................................................................... 40
3.1.3 Further Parameters Calculated from Zeo®-Data.......................................... 41
3.1.4 REM-Phases, Sleep Cyles and Appearance of Sleep-Onset-REM ............... 41
3.2 Analysis of Obtained Data ............................................................................42
3.2.1 Analysing Variance of Sleep-Parameters between the 1st and 2nd Night ....42
3.2.2 Comparing MCTQ-Data with Sleep Log Data ............................................. 43
3.2.3 Comparing MCTQ–Database-Distributions with those of the Present
Study ............................................................................................................. 46
3.2.4 Correlation of Chronotype and Social Jetlag ...............................................47
3.2.5 Relation between MSFsc and øSD .................................................................47
3.2.6 Relations between MSFsc and Zeo®-Parameters ......................................... 48
3.2.7 Relations among Zeo®-Parameters ...............................................................50
3.2.8 Correlation of Sleep Onset and Sleep End between MCTQ and Zeo® ....... 52
3.2.9 Post-Hoc Hypotheses: A Challenge of SOREM ........................................... 52
4 Discussion ...................................................................................................... 55
4.1 Students’ Chronotypes .................................................................................. 55
4.2 Chronotype and Social Jetlag ........................................................................56
4.3 The First Night Effect ....................................................................................56
4.4 Night Phases, Compared to other Studies ................................................... 57
4.5 Sleep Mobile Sleep Timing in Relation to Real Life Sleep Timing .............58
4.6 Sleep-Phases In Relation to Chronotype and in Relation to Each Other ...59
4.7 Correlations among Sleep Phases ................................................................ 60
4.8 Problems Measuring REM Sleep – Post Hoc Hypotheses .......................... 60
4.9 Several Reasons for the Assumption that Zeo® Overestimates REM.......... 63

4.9.1 General Considerations on Measuring REM with Automated- and
Classical EEGs ................................................................................................ 63
4.9.2 Specific Evidence for Zeo’s® Overestimation of REM ..................................65
4.10 Strengths & Weaknesses of this Study .........................................................67
4.11 Follow-Up Perspectives for this Study ........................................................ 69
4.12 Conclusions .................................................................................................. 69
5 References ...................................................................................................... 71
6 Acknowledgements ...................................................................................... 80
6.1 To Colleagues, Friends and Family ............................................................. 80
6.2 To Schools and Participants ........................................................................ 80
7 Deutsche Zusammenfassung ........................................................................82
8 Abstract of the Present Thesis ..................................................................... 86
9 Appendices ................................................................................................... 89
9.1 Consent Form for Students Younger than 18 Years .................................... 89
9.2 Consent Form for Students Older than 18 Years ......................................... 91
9.3 Consent Form for the Publication of Fotos ................................................. 93
9.4 Anamnesis Sheet .......................................................................................... 94
9.5 Percentile Sheets ...........................................................................................97
9.6 WHO-5-Questionnaire ................................................................................ 99
9.7 MCTQ .......................................................................................................... 100
9.8 Students’ MCTQ .......................................................................................... 103
9.9 Sleep Log ..................................................................................................... 106
10 List of Abbreviations ................................................................................... 107
11 Curriculum Vitae ......................................................................................... 109

Boys in bed, girls in bed All now go to sleep
Sleep, sweet dreams Wake to a new today tomorrow
R.E.M. It’s a free world baby (1992)

Introduction
6
1 Introduction
1.1 Chronobiology and Biological Rhythms
Everything has Rhythm. Everything Dances.
Maya Angelou (1928)
Every living organism, from the most simple protozoan to the most complex plant or
animal, including humans, has inherent clock mechanisms that reign its place and
functioning in time (Roenneberg and Merrow 2003; Kuhlman, Mackey et al. 2007).
Among the first to realise that living organisms arrange themselves in advantageous
environmental conditions in order to be provided with the best setting for survival and
reproduction was Darwin (1859 ). He found evolution to occur via selection of ran-
domly appearing genetic mutations that would provide advantages over other species.
Almost 100 years later Hutchinson (1957) termed the unique and advantageous circum-
stance of different species’ settlement as the “ecological niche”. Modern chronobiology
has enlarged the frame of this term by adding the concept of a temporal niche of or-
ganisms. Every organism has its individual arrangement of activity times and rest
times. In this way, advantages can be gained e.g. when being active at times that pro-
vide the best frame for food intake, photosynthesis or mating, at the same time being
minimally endangered by predators (Roenneberg 2010). Rather than only being divided
into rest and activity times, life itself appears to be profoundly rhythmic, as in more
and more physiological processes, rhythmicity is being found to play a vital role
(Arendt 1998). In the human being, among the most basic of such rhythmic processes
are heart rate, respiratory rate, blood pressure, the ovarian cycle, activity bursts, hor-
mone secretion and sleep phases (Aschoff 1965; Zulley and Knab 2003; Moser,
Fruhwirth et al. 2006).
The first scientist who invented a new terminology of rhythms was Halberg (1959).
These, rather than being perfectly exact are “circa-rhythms”, corresponding roughly
with the earth’s rhythms of moon and sun. Chronobiology investigates about biologi-
cal rhythms. These may be circannual- (rhythms of approximately one year), circalu-
Introduction
7
nar- (rhythms of approximately one lunar cycle of 29.5 days), circatidal- (rhythms of
approximately one ocean tide - usually 12 h and 25 min), infradian- (rhythms with a
period longer than 24 h), ultradian- (rhythms with a period shorter than 24 h) or cir-
cadian (rhythms of approximately one day)(Refinetti 2011). The present study will en-
gage in an inquiry into several aspects of circadian sleep-wake rhythms in human ado-
lescents.
1.2 Circadian Rhythms in Humans
Es gibt ein großes und doch ganz alltägliches Geheimnis. Alle Menschen haben daran teil, jeder kennt es,
aber die wenigsten denken je darüber nach. Die meisten Leute nehmen es einfach so hin und wundern sich kein bisschen darüber.
Dieses Geheimnis ist die Zeit.
Michael Ende, Momo (1973)
In his novel „Momo“ (1973/2009), Ende continues, referring to “the mystery of time” as
something every person carries within themselves. Science has shown that this state-
ment beautifully approaches truth. Like all living creatures, the human being has an
internal ability of measuring time within the body (Roenneberg 2010). According to
Roenneberg, this “clock” governs not only sleeping habits, but all bodily functions,
such as blood pressure, hormone levels and body temperature, to name but a few.
While every cell has several clock mechanisms which are governed by numerous genes
(Young and Kay 2001; Roenneberg and Merrow 2003), the master clock consists of the
suprachiasmatic nuclei (SCN), located bilaterally in the anterior hypothalamus,
above the optic chiasm (Fuller, Gooley et al. 2006; Moore 2007). These circadian oscil-
lators contain approximately 20.000 clock neurons in their ventrolateral division, many
of which are spontaneous oscillators. The period length of the SCN approximately ap-
proaches a length of 24 hours, within a range from 22 to 28 hours per day (Ospeck,
Coffey et al. 2009). This phenomenon was first demonstrated by Aschoff et al. (1965),
who showed that participants in temporal isolation, i.e. who were completely deprived
of any external “zeitgeber” (German for “time-giver”) (Golombek and Rosenstein 2010)

Introduction
8
– and thus of any factor that might help to orientate within time, like sunlight, clocks,
noise, or social contacts - (Roenneberg, Wirz-Justice et al. 2003) developed their own
day-lengths that took sometimes up to 30 hours per day. Those experiments showed
that humans have free-running periods which endure even in the absence of any ex-
ternal zeitgeber. The SCN, rather than obtruding their own rhythm to the organism,
serve as coordinating agents, exerting influence on numerous circadian clocks in the
body, throughout several systems, down to a cellular level of circadian metabolism. On
this level, several genes have been identified to be of importance for cellular control-
ling mechanisms (Hastings, Maywood et al. 2008). When the SCN are lesioned, sleep-
wake circadian rhythms are found to become entirely erratic (Lee, Swanson et al.
2009).
Beyond coordinating numerous physiological functions, the main role of the SCN is to
synchronise the individual with external time, responding to the main zeitgeber,
sunlight, in alternation with darkness (Aschoff 1965; Roenneberg, Wirz-Justice et al.
2003; Reinoso-Suarez, de Andres et al. 2011). The inner retina possesses intrinsically
photosensitive retinal ganglion cells (ipRGC), expressing the photopigment melanop-
sin which enables them to respond to light (Berson 2003; Rollag, Berson et al. 2003).
Via the retino-hypothalamic tract, the SCN receive their input (Kumar and Rani 1999;
Hannibal and Fahrenkrug 2006), hence being entrained to the day/night cycle
(Golombek and Rosenstein 2010; Pickard and Sollars 2010). In summary the SCN en-
sure that “physiology across the entire organism is temporally integrated and thus
maximally adapted” (Hastings, Maywood et al. 2008).
1.2.1 Chronotype
“Chronotype refers to the point in time when an individual’s endogenous circadian
clock synchronises (entrains) to the 24 hour day.” (Roenneberg, Kuehnle et al. 2004).
Along with genetic factors, it depends on different environmental cues or individual
characteristics, such as on age (Roenneberg, Wirz-Justice et al. 2003). In his book „Wie
wir ticken “ (2010), Roenneberg states that: „different people can be entirely different
chronotypes – in extreme cases the discrepancy may account up to 12 hours”. A per-
Introduction
9
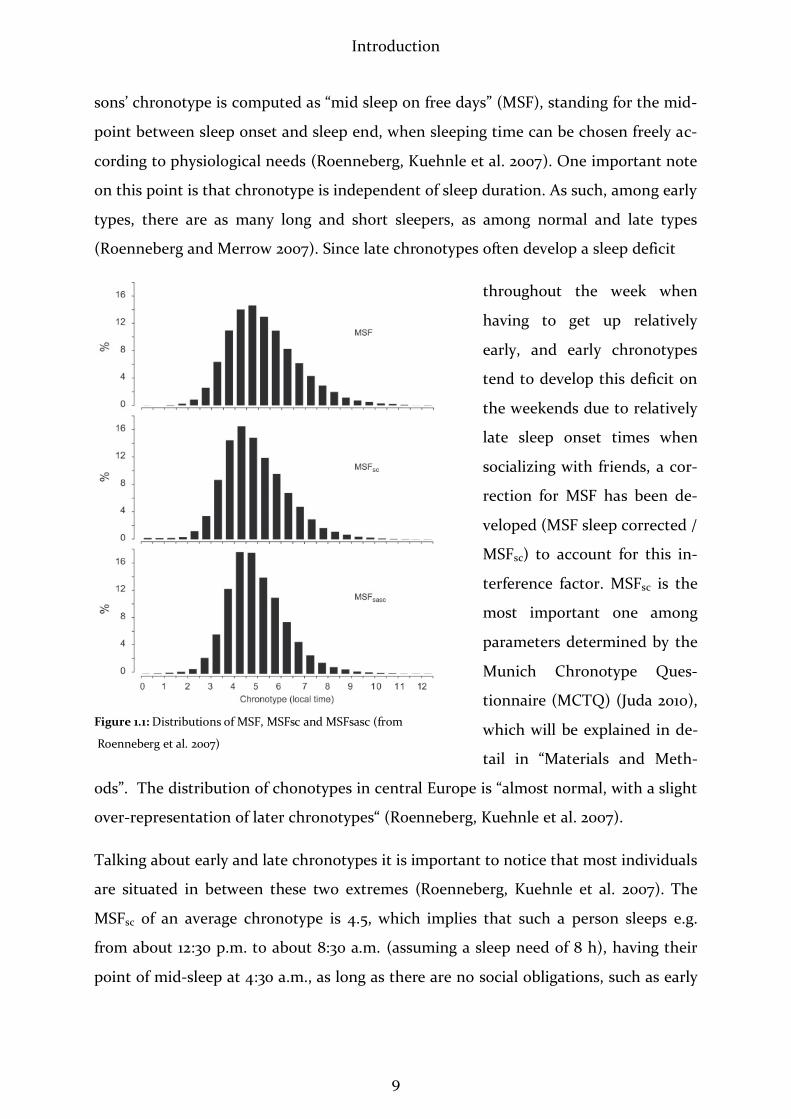
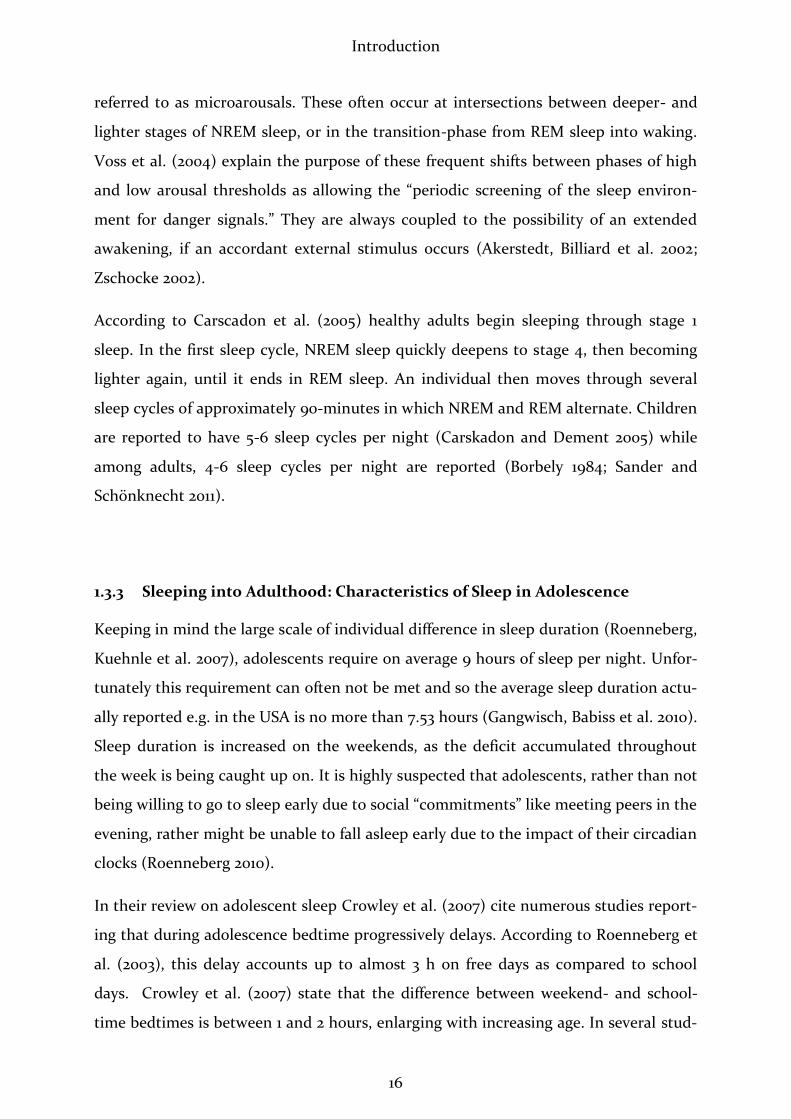
sons’ chronotype is computed as “mid sleep on free days” (MSF), standing for the mid-
point between sleep onset and sleep end, when sleeping time can be chosen freely ac-
cording to physiological needs (Roenneberg, Kuehnle et al. 2007). One important note
on this point is that chronotype is independent of sleep duration. As such, among early
types, there are as many long and short sleepers, as among normal and late types
(Roenneberg and Merrow 2007). Since late chronotypes often develop a sleep deficit
throughout the week when
having to get up relatively
early, and early chronotypes
tend to develop this deficit on
the weekends due to relatively
late sleep onset times when
socializing with friends, a cor-
rection for MSF has been de-
veloped (MSF sleep corrected /
MSFsc) to account for this in-
terference factor. MSFsc is the
most important one among
parameters determined by the
Munich Chronotype Ques-
tionnaire (MCTQ) (Juda 2010),
which will be explained in de-
tail in “Materials and Meth-
ods”. The distribution of chonotypes in central Europe is “almost normal, with a slight
over-representation of later chronotypes“ (Roenneberg, Kuehnle et al. 2007).
Talking about early and late chronotypes it is important to notice that most individuals
are situated in between these two extremes (Roenneberg, Kuehnle et al. 2007). The
MSFsc of an average chronotype is 4.5, which implies that such a person sleeps e.g.
from about 12:30 p.m. to about 8:30 a.m. (assuming a sleep need of 8 h), having their
point of mid-sleep at 4:30 a.m., as long as there are no social obligations, such as early
Figure 1.1: Distributions of MSF, MSFsc and MSFsasc (from
Roenneberg et al. 2007)
Introduction
10
work- or school start times. (Roenneberg, Wirz-Justice et al. 2003; Roenneberg,
Kuehnle et al. 2007).
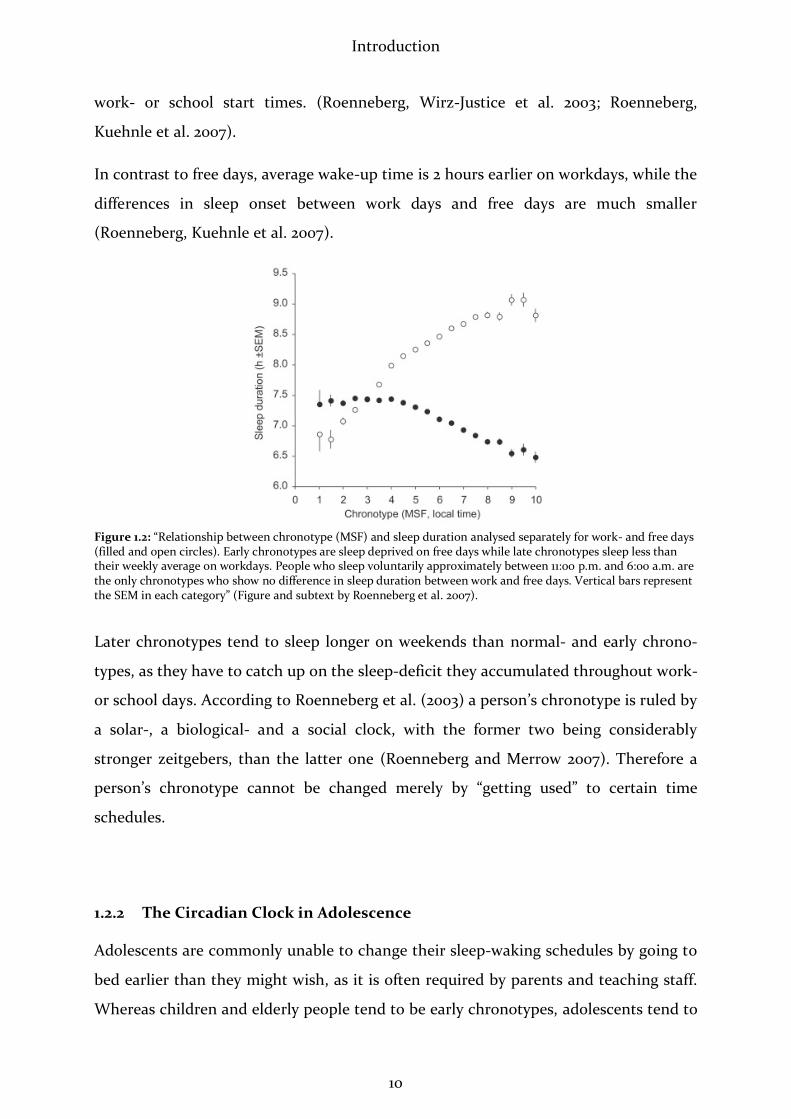
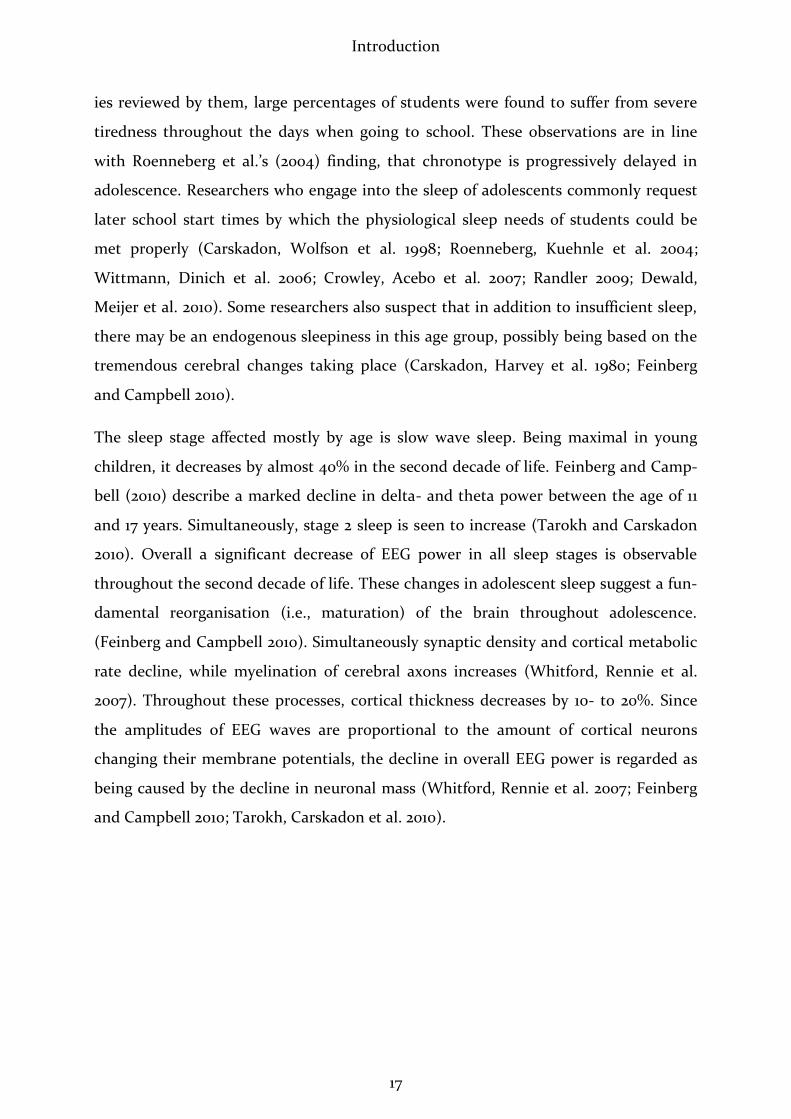
In contrast to free days, average wake-up time is 2 hours earlier on workdays, while the
differences in sleep onset between work days and free days are much smaller
(Roenneberg, Kuehnle et al. 2007).
Figure 1.2: “Relationship between chronotype (MSF) and sleep duration analysed separately for work- and free days (filled and open circles). Early chronotypes are sleep deprived on free days while late chronotypes sleep less than their weekly average on workdays. People who sleep voluntarily approximately between 11:00 p.m. and 6:00 a.m. are the only chronotypes who show no difference in sleep duration between work and free days. Vertical bars represent the SEM in each category” (Figure and subtext by Roenneberg et al. 2007).
Later chronotypes tend to sleep longer on weekends than normal- and early chrono-
types, as they have to catch up on the sleep-deficit they accumulated throughout work-
or school days. According to Roenneberg et al. (2003) a person’s chronotype is ruled by
a solar-, a biological- and a social clock, with the former two being considerably
stronger zeitgebers, than the latter one (Roenneberg and Merrow 2007). Therefore a
person’s chronotype cannot be changed merely by “getting used” to certain time
schedules.
1.2.2 The Circadian Clock in Adolescence
Adolescents are commonly unable to change their sleep-waking schedules by going to
bed earlier than they might wish, as it is often required by parents and teaching staff.
Whereas children and elderly people tend to be early chronotypes, adolescents tend to

Introduction
11
be later types. This fact, being rather familiar to most parents, could be demonstrated
by Roenneberg et al. (2004). At the age of 12, with the onset of puberty, adolescents
start becoming later (Randler 2009), reaching the peak of their “lateness” around the
age of 20 (Roenneberg, Kuehnle et al. 2004). Roenneberg et al. suggest this change of
internal rhythm to be “the first biological marker to indicate the end of adolescence”.
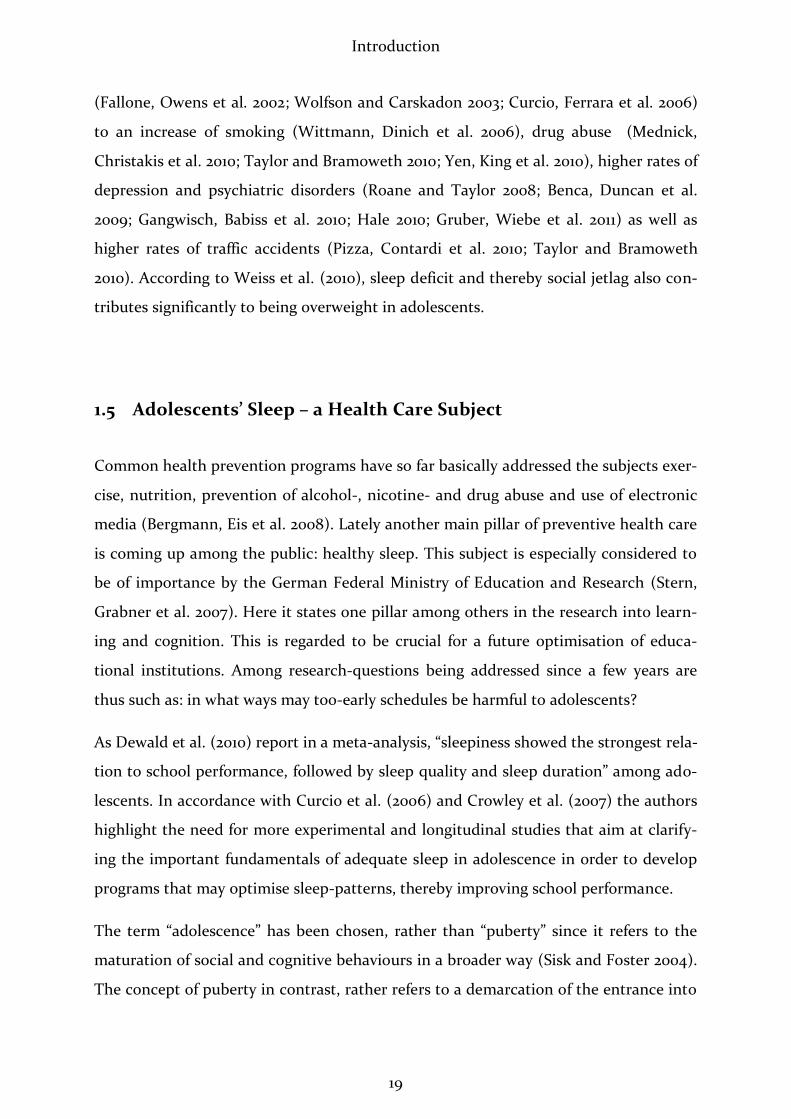
Whereas women have been shown to reach their maximal lateness around an age of
19.5 years, men reach this stage at an average age of 20.9 years. They then remain
slightly later chronotypes than women, until an average age of 50, when no more dif-
ference is observed between both. Despite the physiological age dependent fluctuation
in lateness throughout a person’s life, an individual’s chronotype is usually stable in
relation to other subjects of the same age and sex throughout life. To correct for influ-
ences of sex and age effects among chronotypes, another correction of MSFsc has been
developed by Juda et al. (2010). This is termed the MSF sex age sleep corrected
(MSFsasc).
Figure 1.3: MSFsc-distribution among 14–19 year olds; modified after Roenneberg (2011) - unpublished Data
1.3 Sleep
Curcio et al. (2006) describe sleep as “an active, repetitive and reversible process serv-
ing several different functions, such as repair and growth, memory consolidation, and
restorative processes”. Thus behavioural, physiological and neurocognitive processes
are involved in sleeping, as well as immunological functions (Lange and Born 2011),
although the extents and mechanisms of these functions have not been fully under-

Introduction
12
stood yet (Curcio, Ferrara et al. 2006; Fuller, Gooley et al. 2006; Diekelmann and Born
2010; Smetacek 2010). Sleep deprivation clearly impairs the ability to acquire new
memories (Benca, Duncan et al. 2009), although also the exact mechanisms of mem-
ory-formation are still unknown (Kopasz, Loessl et al. 2010).
1.3.1 Anatomy and Physiology of Sleep
The anatomy of sleep consists of a complex interplay of activating and inhibiting feed-
back loops between several centres in the upper brain stem, and the cortex. Arousal
and its inhibition are mediated mainly via the formatio reticularis in the ascending
arousal system (ARAS) through neural projections to the thalamus and basal forebrain
(Trepel 2004; Saper, Scammell et al. 2005). There are two pathways through which cor-
tical arousal and inhibition is enabled. Via the dorsal route, cholinergic neurons of the
laterodorsal and pedunculopontine tegmental nuclei of the mesopontine tegmentum
serve to excite thalamocortical neurons and the reticular nucleus (Fuller, Gooley et al.
2006). The ventral route involves the hypothalamus and basal forebrain, originating in
the locus coeruleus (noradrenergic), raphe nuclei (serotoninergic), ventral periaque-
ductal grey matter (dopaminergic), tuberomamillary nucleus (histaminergic) and lat-
eral hypothalamus (via orexin and melanin-concentrating hormone) (Saper, Scammell
et al. 2005). According to Fuller (2006), “neurons in all of these cell groups fire more
during wakefulness than during non-REM-sleep, and show virtually no activity during
REM sleep.” A central role in the inhibition of the neural circuits of the ARAS is con-
sidered to be played by the ventrolateral preoptic nucleus. This inhibition occurs be-
tween ventrolateral preoptic nucleus and ARAS, and vice versa, in what is called by
Saper et al. (2005) a “flip-flop-switch-design”. This system is indirectly stabilised by
orexinergic neurons and neurons containing melanin-concentrating hormone of the
lateral hypothalamus, preventing a spontaneous switch of activation/inhibition, as it
occurs e.g. in narcolepsy (Saper, Scammell et al. 2005).
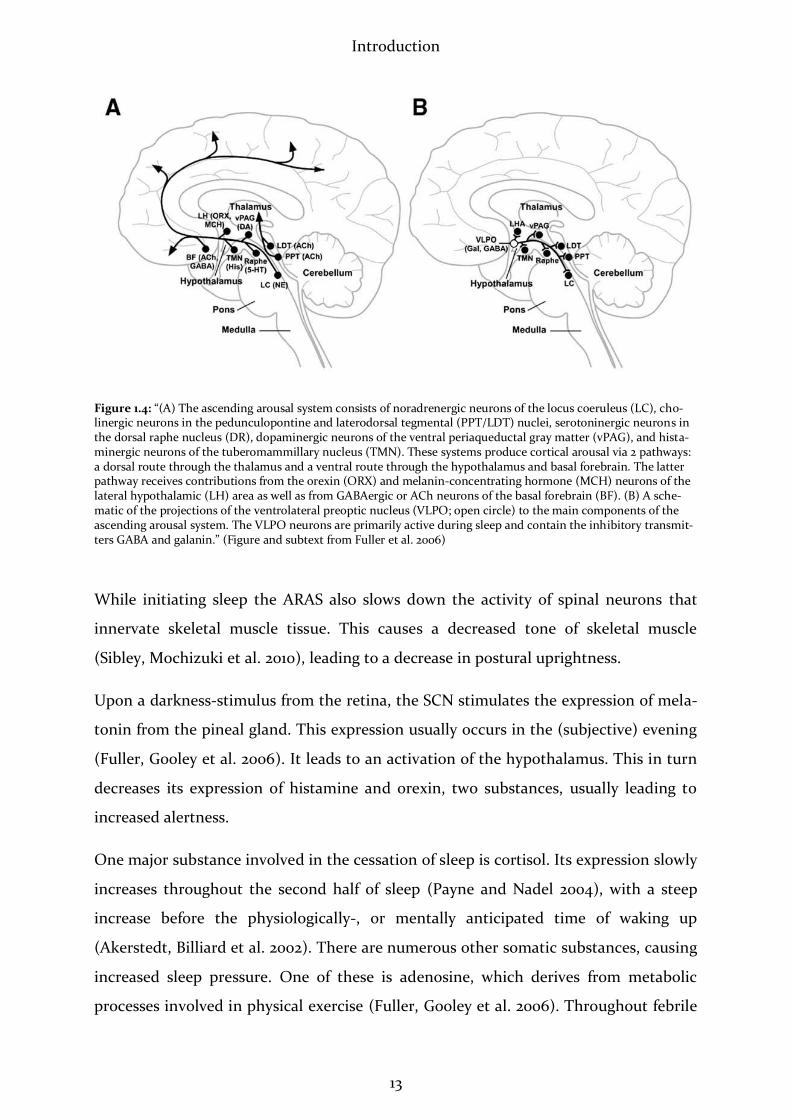
The above named cerebral circuits have been displayed in detail by Fuller et al. (2006),
as shown in the figure below:
Introduction
13
Figure 1.4: “(A) The ascending arousal system consists of noradrenergic neurons of the locus coeruleus (LC), cho-linergic neurons in the pedunculopontine and laterodorsal tegmental (PPT/LDT) nuclei, serotoninergic neurons in the dorsal raphe nucleus (DR), dopaminergic neurons of the ventral periaqueductal gray matter (vPAG), and hista-minergic neurons of the tuberomammillary nucleus (TMN). These systems produce cortical arousal via 2 pathways: a dorsal route through the thalamus and a ventral route through the hypothalamus and basal forebrain. The latter pathway receives contributions from the orexin (ORX) and melanin-concentrating hormone (MCH) neurons of the lateral hypothalamic (LH) area as well as from GABAergic or ACh neurons of the basal forebrain (BF). (B) A sche-matic of the projections of the ventrolateral preoptic nucleus (VLPO; open circle) to the main components of the ascending arousal system. The VLPO neurons are primarily active during sleep and contain the inhibitory transmit-ters GABA and galanin.” (Figure and subtext from Fuller et al. 2006)
While initiating sleep the ARAS also slows down the activity of spinal neurons that
innervate skeletal muscle tissue. This causes a decreased tone of skeletal muscle
(Sibley, Mochizuki et al. 2010), leading to a decrease in postural uprightness.
Upon a darkness-stimulus from the retina, the SCN stimulates the expression of mela-
tonin from the pineal gland. This expression usually occurs in the (subjective) evening
(Fuller, Gooley et al. 2006). It leads to an activation of the hypothalamus. This in turn
decreases its expression of histamine and orexin, two substances, usually leading to
increased alertness.
One major substance involved in the cessation of sleep is cortisol. Its expression slowly
increases throughout the second half of sleep (Payne and Nadel 2004), with a steep
increase before the physiologically-, or mentally anticipated time of waking up
(Akerstedt, Billiard et al. 2002). There are numerous other somatic substances, causing
increased sleep pressure. One of these is adenosine, which derives from metabolic
processes involved in physical exercise (Fuller, Gooley et al. 2006). Throughout febrile
Introduction
14
disease states, inflammatory mediators, such as interleukin-1, interleukin-6 and tumor-
necrosis factor-alpha are known to cause an augmentation of tiredness and sleep
(Bieger 2010).
Homoeostatic regulation of sleep has been proposed by Borbély (1984) to be explained
by a two-process-model. In this model, sleep pressure (process S), which builds up
with increased duration of wakefulness, interacts with an intrinsic circadian process
(process C), which is independent of sleep- and wake-timing. A marker for the build-
up of process S is nowadays considered to be EEG delta power, which increases simul-
taneously with sleep pressure (Fuller, Gooley et al. 2006). Edgar et al. (1993) amplified
Borbély’s model, suggesting that the SCN triggers and maintaines states of wakefulness
and sleep, antagonising process S during the subjective daytime. Lee et al. (2009) dem-
onstrated that the SCN not only accounts for the occurrence of sleep itself, but also for
the occurrence of specific sleep stages as a circadian pacemaker.
1.3.2 Sleep-EEG and Sleep Stages
The classical sleep-EEG is recorded via at least 5 electrodes that are distributed on the
frontopolar, temporal and the occipital regions of the scalp (Zschocke 2002). In con-
ventional polysomnography (PSG), this is usually combined with electrooculogram,
electromusculogram, electrocardiogram and measurements of body position. Addi-
tional measures may be added such as thoracic and abdominal breath-excursions, in-
tranasal airflow, leg-movements, penile erection and peripheral oxygen-saturation
(Keenan 1992), among others.
In awake subjects, the EEG usually displays desynchronised, high-frequency, low am-
plitude beta waves within a range of 14-30Hz (Fuller, Gooley et al. 2006). This changes
as soon as the relaxed subject closes their eyes, which leads to an immediate change to
alpha waves, ranging from 8- to 12 Hz. These waves can preferentially be measured by
occipital electrodes (Zschocke 2002; Toscani, Marzi et al. 2010). The EEG frequency
begins to slow when the individual falls asleep. In sleep stage 1, conscious awareness of
the surroundings slowly disappears and in the EEG, theta waves between 4 and 7 Hz
predominate. The increased amplitude of EEG waves reflects the heightening syn-
Introduction
15
chrony of cortical neurons’ firing. This synchronisation increases with depth of sleep.
The second sleep stage is characterised by an increased appearance of sleep spindles
and K-complexes (Benbadis and Rielo 2010; Perez, Roberts et al. 2010). It goes along
with a complete withdrawal from external awareness. Stages 3 and 4 are usually re-
ferred to- and summarised as slow wave sleep (SWS). In this stage, delta waves pre-
dominate, ranging from 1-3 Hz. These waves reflect the maximally synchronised oscil-
lations of thalamocortical circuit activity (Zschocke 2002). Fuller et al. (2006) state
that: “the neocortex is also capable of generating autonomous delta wave activity.” In
contrast to the non-REM sleep stages, EEG-activity in REM-sleep is rather similar to
that of the awake state or stage 1 sleep (Fuller, Gooley et al. 2006; Benbadis and Rielo
2010). The picture seen in REM is thus one of high frequency, low-amplitude activity
(Feinberg and Campbell 2010). However, an essential difference to waking is seen in
the electroocculogram (EOG), revealing rapid eye movements and the electromusculo-
gram (EMG) showing an intense atony of the skeletal muscles throughout REM sleep.
Fuller et al. (2006) remark that common EEG scalp recordings show only a partial pic-
ture, since they measure solely cortical electrical activity, neglecting activity in subcor-
tical areas.
According to Benbadis and Rielo (2010), healthy young adults spend 3-5% of their sleep
time in stage 1, 50-60% in stage 2, and 10-20% in stages 3 and 4, whereas REM sleep
occupies 10-25%.
Roenneberg et al. (2007) found their largest binned group to sleep 7.5-8 hours on free
days. Notwithstanding this group was made up of only 15.5% of the sample population.
50.5% slept even longer. Sleep durations on free days are varied among individuals
within a normal-distribution range, just as widely as chronotype.
The first third of a night’s sleep is usually dominated by light sleep, alternating with
SWS (Voss 2004). In the following parts of the night, the abundance of SWS decreases
and REM sleep increases, until the last third of the night, in which light sleep alter-
nates with REM sleep. Among healthy, well-rested individuals the latency to a night’s
first episode of REM-sleep (REM latency) takes about 90 minutes (Zschocke 2002;
Carskadon and Dement 2005). Throughout a sleeping episode, numerous arousals are
normally observed. When such arousals do not last longer than 5 seconds, they are
Introduction
16
referred to as microarousals. These often occur at intersections between deeper- and
lighter stages of NREM sleep, or in the transition-phase from REM sleep into waking.
Voss et al. (2004) explain the purpose of these frequent shifts between phases of high
and low arousal thresholds as allowing the “periodic screening of the sleep environ-
ment for danger signals.” They are always coupled to the possibility of an extended
awakening, if an accordant external stimulus occurs (Akerstedt, Billiard et al. 2002;
Zschocke 2002).
According to Carscadon et al. (2005) healthy adults begin sleeping through stage 1
sleep. In the first sleep cycle, NREM sleep quickly deepens to stage 4, then becoming
lighter again, until it ends in REM sleep. An individual then moves through several
sleep cycles of approximately 90-minutes in which NREM and REM alternate. Children
are reported to have 5-6 sleep cycles per night (Carskadon and Dement 2005) while
among adults, 4-6 sleep cycles per night are reported (Borbely 1984; Sander and
Schönknecht 2011).
1.3.3 Sleeping into Adulthood: Characteristics of Sleep in Adolescence
Keeping in mind the large scale of individual difference in sleep duration (Roenneberg,
Kuehnle et al. 2007), adolescents require on average 9 hours of sleep per night. Unfor-
tunately this requirement can often not be met and so the average sleep duration actu-
ally reported e.g. in the USA is no more than 7.53 hours (Gangwisch, Babiss et al. 2010).
Sleep duration is increased on the weekends, as the deficit accumulated throughout
the week is being caught up on. It is highly suspected that adolescents, rather than not
being willing to go to sleep early due to social “commitments” like meeting peers in the
evening, rather might be unable to fall asleep early due to the impact of their circadian
clocks (Roenneberg 2010).
In their review on adolescent sleep Crowley et al. (2007) cite numerous studies report-
ing that during adolescence bedtime progressively delays. According to Roenneberg et
al. (2003), this delay accounts up to almost 3 h on free days as compared to school
days. Crowley et al. (2007) state that the difference between weekend- and school-
time bedtimes is between 1 and 2 hours, enlarging with increasing age. In several stud-
Introduction
17
ies reviewed by them, large percentages of students were found to suffer from severe
tiredness throughout the days when going to school. These observations are in line
with Roenneberg et al.’s (2004) finding, that chronotype is progressively delayed in
adolescence. Researchers who engage into the sleep of adolescents commonly request
later school start times by which the physiological sleep needs of students could be
met properly (Carskadon, Wolfson et al. 1998; Roenneberg, Kuehnle et al. 2004;
Wittmann, Dinich et al. 2006; Crowley, Acebo et al. 2007; Randler 2009; Dewald,
Meijer et al. 2010). Some researchers also suspect that in addition to insufficient sleep,
there may be an endogenous sleepiness in this age group, possibly being based on the
tremendous cerebral changes taking place (Carskadon, Harvey et al. 1980; Feinberg
and Campbell 2010).
The sleep stage affected mostly by age is slow wave sleep. Being maximal in young
children, it decreases by almost 40% in the second decade of life. Feinberg and Camp-
bell (2010) describe a marked decline in delta- and theta power between the age of 11
and 17 years. Simultaneously, stage 2 sleep is seen to increase (Tarokh and Carskadon
2010). Overall a significant decrease of EEG power in all sleep stages is observable
throughout the second decade of life. These changes in adolescent sleep suggest a fun-
damental reorganisation (i.e., maturation) of the brain throughout adolescence.
(Feinberg and Campbell 2010). Simultaneously synaptic density and cortical metabolic
rate decline, while myelination of cerebral axons increases (Whitford, Rennie et al.
2007). Throughout these processes, cortical thickness decreases by 10- to 20%. Since
the amplitudes of EEG waves are proportional to the amount of cortical neurons
changing their membrane potentials, the decline in overall EEG power is regarded as
being caused by the decline in neuronal mass (Whitford, Rennie et al. 2007; Feinberg
and Campbell 2010; Tarokh, Carskadon et al. 2010).

Introduction
18
1.4 “Social Jetlag” and its Effects
The amount of sleep required by the average person is five minutes more.
Wilson Mizner (1876 - 1936)
Whoever has ever flown across several times zones to the east or west has probably
made the experience that the internal clock is not immediately used to local time at
destination. This effect, known as “jetlag” takes place when there is a discrepancy be-
tween one’s internal, biological time and social time. It is then termed a “social jetlag”
(Roenneberg, Wirz-Justice et al. 2003; Wittmann, Dinich et al. 2006). This effect is cor-
related significantly with chronotype: later chronotypes, adhering to a conservative
time-schedule throughout the working-week, tend to develop higher sleep deficits
than early types, and thus experience a stronger social jetlag. Among age groups, this
effect is maximal in adolescents due to their increased tendency for lateness
(Roenneberg, Kuehnle et al. 2004) clashing with consistently early school times in
Germany at around 8 a.m..
Social jetlag is calculated as “the absolute difference between mid-sleep on work days
(MSW) and mid sleep on free days (MSF): ΔMS = |MSF-MSW|.” (Wittmann, Dinich et
al. 2006).
It is known that shift workers, who constantly live against their circadian clocks have
higher risks of developing several illnesses like cancer and heart disease (Arendt 2010).
There is also evidence that late chronotypes are more prone to diseases when living
according to a relatively early schedule, which is coherent with the normal German
custom of beginning work at 8 a.m. (Wittmann, Dinich et al. 2006). Not enough on
this, later chronotypes even appear to possess minor career chances than earlier ones,
as Randler (2010) points out in his paper with the ostensive title: “The early bird really
does get the worm”.
In adolescents, sleep has been shown to be essential for wellbeing, health, cognition
and school performance (Anderson, Storfer-Isser et al. 2009; Randler and Bilger 2009;
Dewald, Meijer et al. 2010). The list of effects from poor sleep, late bedtimes and early
rising on adolescents ranges from decreased learning capacity and school performance
Introduction
19
(Fallone, Owens et al. 2002; Wolfson and Carskadon 2003; Curcio, Ferrara et al. 2006)
to an increase of smoking (Wittmann, Dinich et al. 2006), drug abuse (Mednick,
Christakis et al. 2010; Taylor and Bramoweth 2010; Yen, King et al. 2010), higher rates of
depression and psychiatric disorders (Roane and Taylor 2008; Benca, Duncan et al.
2009; Gangwisch, Babiss et al. 2010; Hale 2010; Gruber, Wiebe et al. 2011) as well as
higher rates of traffic accidents (Pizza, Contardi et al. 2010; Taylor and Bramoweth
2010). According to Weiss et al. (2010), sleep deficit and thereby social jetlag also con-
tributes significantly to being overweight in adolescents.
1.5 Adolescents’ Sleep – a Health Care Subject
Common health prevention programs have so far basically addressed the subjects exer-
cise, nutrition, prevention of alcohol-, nicotine- and drug abuse and use of electronic
media (Bergmann, Eis et al. 2008). Lately another main pillar of preventive health care
is coming up among the public: healthy sleep. This subject is especially considered to
be of importance by the German Federal Ministry of Education and Research (Stern,
Grabner et al. 2007). Here it states one pillar among others in the research into learn-
ing and cognition. This is regarded to be crucial for a future optimisation of educa-
tional institutions. Among research-questions being addressed since a few years are
thus such as: in what ways may too-early schedules be harmful to adolescents?
As Dewald et al. (2010) report in a meta-analysis, “sleepiness showed the strongest rela-
tion to school performance, followed by sleep quality and sleep duration” among ado-
lescents. In accordance with Curcio et al. (2006) and Crowley et al. (2007) the authors
highlight the need for more experimental and longitudinal studies that aim at clarify-
ing the important fundamentals of adequate sleep in adolescence in order to develop
programs that may optimise sleep-patterns, thereby improving school performance.
The term “adolescence” has been chosen, rather than “puberty” since it refers to the
maturation of social and cognitive behaviours in a broader way (Sisk and Foster 2004).
The concept of puberty in contrast, rather refers to a demarcation of the entrance into

Introduction
20
sexual maturity (Oerterer and Montada 2002). In general, when referring to “adoles-
cence”, a span from 11 to 21 years of age is designated.
Although we know that adolescents tend to be the latest „night owls” in society, not a
lot of studies have been carried out on their sleep structure yet. (Roenneberg, Kuehnle
et al. 2007). As has been pointed out above, they are also the age group requiring the
highest amount of sleep in society, yet actually obtaining the least amount (Carskadon,
Wolfson et al. 1998). For this reason the further exploration of adolescents’ sleep and
chronotype is considered to be highly important.
The present study, since being conducted in a field-setting, has several limitations, as
will be pointed out in the discussion. Yet it represents a first step in examining adoles-
cent sleep and chronotype in close-to-real life conditions, within a financially practica-
ble framework. As a positive “side effect”, the conduction of this study has a health-
preventive function, by educating adolescents about the role of sleep in their lives and
sensitizing them to their own sleeping behaviour.
1.6 Aims of this Study
Adolescents spend large amounts of their time at school studying, in order to under-
stand complex matters and to memorise numerous curricular contents. Since it is well
known that sleep has an impact on learning and memorising (Kopasz, Loessl et al.
2010) and that chronotype often has an impact on the amount of sleep an individual
attains in the working society (Roenneberg, Kuehnle et al. 2007), there is an immense
need to optimise circumstances for adolescents at school in order to give them a seri-
ous chance to prepare for their later lives. Consequently, it is worthwhile to broaden
research into the subject of sleep in adolescents. The present study ought to play a
conductive part in providing one building block on the way of developing a basis for
such research by pioneering a method, via which further studies may be performed
expediently.
The overriding aim of this study is to investigate how well chronotype and sleep pro-
files of adolescents may be examined in a field setting, using an explorative approach.
Introduction
21
To do so, students’ sleep profiles are to be examined in a mobile sleep lab (or “sleep
mobile”) that will be based at their school. This study also aims at elucidating the rela-
tionship between chronotype and sleep profiles. To date, such data are still lacking.
The sleep parameters that are to be examined in their overall duration and its relation-
ship with chronotype are: total sleep duration, sleep latency, time awake after sleep
onset, light sleep, deep sleep and REM sleep. Prior to recording sleep profiles, chrono-
types will be measured by the Munich Chronotype Questionnaire (MCTQ). In addi-
tion, sleep logs will be kept by the participants, in order to validate MCTQ-results and
assess sleeping behaviour around the study-period. Since the present study is supposed
to pave the way for further similar studies that might look at related subjects in more
detail, an easy to use, efficient and cost-effective way of realisation was sought. There-
fore the mobile, automated system “Zeo®” was elected as a convenient means of meas-
uring EEG.
The results-part of the present study will consist of two divisions: in the descriptive
part, MCTQ-measurements, sleep-log measurements and sleep parameters as meas-
ured by Zeo® in the sleep mobile will be displayed. In the second part, analyses of sleep
parameters and MCTQ-parameters such as chronotype and social jetlag will take place.
The main question of this thesis is weather common chronobiological expectations
about sleep timing and –phases can be replicated in the sleep-mobile-setting of the
present study, using Zeo®-EEGs. In addition to this explorative approach two hypothe-
ses are posed, as follows:
Later chronotypes will be observed to fall asleep later in the sleep mobile than earlier
ones, and wake up later (hypothesis 1).
Regarding the total sleep duration, another hypothesis is generated based on reasoning
about homoeostatic mechanisms of sleep regulation. Later chronotypes are expected to
accumulate a greater sleep deficiency throughout school days, which is why they have
to catch up on this deficit on the weekend. For this reason they should be observed to
spend more time overall sleeping in the sleep mobile, than earlier chronotypes (hy-
pothesis 2).

Introduction
22
Further questions of interest are:
Is there any correlation between chronotype and sleep parameters? If this was
the case, is there any difference between the earlier- and the later chronotype-
group?
How are correlations among the durations of the measured sleep-phases, such
as total sleep, REM-, light-, deep sleep and time awake after sleep onset?
How is the sleep mobile timing in relation to real life sleep timing? Are sleep
onset and sleep end as measured by Zeo® in the sleep mobile consistent with a
circular sleep window that will be generated from MCTQ-data?
Is the first night effect observed in the sleep mobile, like in common sleep lab
studies?
The latter question is being posed since in standard sleep labs, commonly a first night
effect is observed. This effect usually shows up most evidently through increased sleep
onset latency and increased number of awakenings, accompanied by higher sleep
fragmentation throughout the first night. An adaptation effect can then usually be seen
in the second night (Agnew, Webb et al. 1966; Curcio, Ferrara et al. 2004; Sforza,
Chapotot et al. 2008). To test for the presence of any first-night-effect in the present
study’s setting, measurements of the first and second night will be compared.
Below, several further expectations on the findings of the present study are stated.
These, rather than being expressed as hypotheses, will be examined in order to assess
the consistency of the present study with common chronobiological findings.
As former studies on adolescents could demonstrate repeatedly, students are on aver-
age anticipated to be later chronotypes than the remaining population (Wolfson and
Carskadon 1998; Roenneberg, Kuehnle et al. 2004; Randler 2009). This finding is ex-
pected to be repeated in the present study.
Previous research showed up a strong relation between processed data yielded from
MCTQ and sleep logs (Roenneberg, Kuehnle et al. 2007). Therefore, sleep log data and
the results of the MCTQ assessed among adolescents are expected to show a significant
correlation. At the same time, chronotypes and social jetlags of the participating stu-
dents are expected to be consistent with those of the main MCTQ-database.

Introduction
23
In the findings of Roenneberg et al. (2007) individuals with later chronotypes are less
in phase with their internal clock when having to adhere to a schedule of getting up
early. According to this, the later chronotypes among participating students in this
study are expected to suffer from relatively higher social jetlags.
Another enquiry will be made into the question if the common observation, that total
sleep throughout the week is less in late chronotypes than in early ones, will be ob-
served among participating students.
Materials and Methods
24
2 Materials and Methods
2.1 Participants
34 healthy students (8 male) from different grammar schools in Germany volunteered
to participate in this study. Their mean age was 17.04 years with a range from 14 to 19
years. Mean BMI was 20.82, with a standard deviation (stdev.) of 2.58.
Prior to participation, every student was thoroughly informed about the aims and pro-
cedure of the study. Those who were less than 18 years old had their parents signing an
informed consent, while students older than 18 years signed by themselves (see appen-
dixes 1 and 2). These consent forms also contained information about anonymisation of
any personal data for further computation and use. For any published material display-
ing the participants, an approval form (see appendix 3) was signed by themselves, or
respectively by their legal representatives, as well.
Most of the students went to school regularly during the test phase. However, three of
them had holidays and one indicated every day as school day due to school-workshop-
activities on the weekend.
For all participants, school usually started at 8 a.m. and ended approximately at 2:30
p.m. School-times were declared by all participating students as very inflexible. The
duration of school days varied among participants.
2.1.1 Exclusion Criteria
Every participant was subjected to medical history taking and physical examination, in
order to exclude those who had sleep disturbances, physical or mental diseases. A
standard anamnesis sheet (see appendix 4) was used in order to detect any physical or
mental pathologies. Examined were: head, eyes, mouth and fauces, cervical lymph
nodes, thyroid gland, heart and lungs, abdomen, nervous system, skeletal system and
skin. Inquiries were made about physical wellbeing, digestive function and micturition,
allergies, medications, drug abuse and mental wellbeing. In addition, every student

Materials and Methods
25
was asked about the quality of his/her sleep. As recommended by Fricke-Oerkermann
et al. (2007), special attention in recruiting participants was also drawn on excluding
subjects with common diseases that might affect sleep, such as pathologies of the car-
diovascular system and the respiratory tract, as well as those with pruritic skin dis-
eases, like neurodermatitis. Further exclusion criteria were substance abuse, disturbed
sleep, e.g. by bruxism, nightmares, sleep apnoea or snoring, and a BMI >25. Students
with ADHD and those who took medications other than oral contraception were also
excluded from the study.
Height and weight of students were recorded on percentile-sheets (see appendix 5).
In order to exclude depressive students, the WHO-5 questionnaire was used. This
score aims to investigate wellbeing by assessing basic properties of subjective quality of
life, like mood, vitality and interests ((Bech 2010) and appendix 6). For rating the
score, each of the five questions is allocated on a 6-point Likert scale from 0 to 5, or
respectively from “not present” to “present”. As a result, raw scoring from 0 to 25 is
possible, with higher scores standing for better wellbeing. Scoring less than 13 points is
defined as being a hint to poor wellbeing. For such cases, further testing for depression
is recommended. In this study, students with a score below 13 were excluded.
2.1.2 Ethical Approval
The ethics committee at the Department of Psychology, Ludwig-Maximilian-University
(Munich), gave ethical approval for this study. Participants were informed about their
right to end participation without any explanatory statement at any time. They were
also informed about their data being coded so that data evaluation could occur on an
anonymous basis. Since the accomplishment of the study was declared as a school-
project, participating students were covered by school insurance.
Materials and Methods
26
2.2 Materials
2.2.1 Munich Chronotype Questionnaire (MCTQ)
This questionnaire (see appendix 7) aims at assessing individual sleep timing and
phase of entrainment by asking simple questions about sleep-wake behaviour sepa-
rately for workdays and free days (Roenneberg, Wirz-Justice et al. 2003; Roenneberg
and Merrow 2007). Subjective statements are enquired, regarding time of going to bed,
time to fall asleep, time of waking up and getting up, as well as use of an alarm clock.
Furthermore age, sex, height and weight are inquired. The MCTQ facilitates an accu-
rate quantification of the human phase of entrainment (Roenneberg and Merrow
2007). The exact parameters measured and calculated with the MCTQ are displayed
under 2.3.2 (“Data Treatment”).
Reliability and external validity of the MCTQ are high (Kuehnle 2006) as shown with
repeated sleep log assessment. Actimetry measurements confirmed the validity of the
MCTQ (Kantermann 2008). Mid-sleep on free days (MSF), as extracted from the
MCTQ, also correlates highly with the Morningness-Eveningness-Qestionnaire (MEQ)
(Zavada, Gordijn et al. 2005). The MCTQ exists in several languages, as well as in spe-
cial versions for shift workers and for pupils (Juda 2010). The latter version, which was
used in this case, contains an addition of questions about school start and end-times
and about the flexibility of school times (see appendix 8). It also asks how and in which
time frame students arrive at school, in order to add this information to an estimation
of daily exposure to sunlight.
Answering the MCTQ takes approximately 5 to 10 minutes (Vetter 2010). It was filled in
online under http://thewep.org/en/pupils_study.php .
2.2.2 Sleep Logs (SL)
Participants were instructed to fill in sleep logs daily every morning after getting up for
a study period of two weeks.

Materials and Methods
27
The following items were extracted from the sleep logs: time spent outside during the
prior day, bed-time, time of preparing for sleep, sleep latency, subjective alertness at
bed-time (0 = very tired; 10 = very alert), wake-up time, time to get up, use of an alarm
clock, subjective sleep quality (0 = slept very badly; 10 = slept very well), subjective
alertness when waking up (0 = very tired; 10 = very alert), whether it was the morning
of a work- or free day and personal annotations as to what factors might have influ-
enced sleeping. Students were also asked to add the category “wellbeing” (WB) for the
previous day, respectively (0 = feeling very bad; 10 = feeling very good).
Further parameters computed from the sleep log data are displayed in section 2.3.2
“Data Treatment”).
The sleep logs were handed out to participants together with a detailed explanatory
sheet (see appendix 9) about their usage. Furthermore, each student was explained by
word of mouth, how to utilise the sleep log.
2.2.3 Zeo® – Advantages and Functions of a Simplified EEG
The application of an EEG and the respective visual scoring of the obtained data is a
labour-intensive task which is reserved to be performed correctly by well-trained clini-
cians (Tran, Thuraisingham et al. 2009). According to Gold (2002) the advantages of
polysomnography (PSG) are becoming scrutinised in Germany. Being based on the
recording of a classical EEG, it is rather expensive and labour-intensive. Against the
background of health-policies aiming at economising the health-system, the use of
classical EEG appears not to have sufficient viability in many cases, as in the present
study within its field setting.
Obviously it would be desirable to profit of an entire EEG-system that is both: easily
applied and easy to be analysed. Anderson et al. (2010) expound the need for auto-
mated systems that could approximate these requirements, commenting that in clini-
cal settings the need of using EEGs is often higher than the number of experts needed
to read these. Throughout the past, several attempts have been made to create simpli-
Materials and Methods
28
fications of EEGs in usage and evaluation that can compete with insights obtained
from visual scoring of the classical EEG.
A novel attempt of simplifying EEG has been forwarded with Zeo®, which appealed as
an ideal tool in order to easily and cheaply record EEG-data in the field.
Five Zeos® from Zeo.Inc. in Newton, MA, USA were used in the present study. These
consist of a headband with integrated sensors, which according to Zeo.Inc. (2010) wire-
lessly transmit EEG, EOG and EMG -signals to a base station for processing (Fabregas, J
et al. 2009). Sleep stages are scored automatically by a neural network to phase sleep;
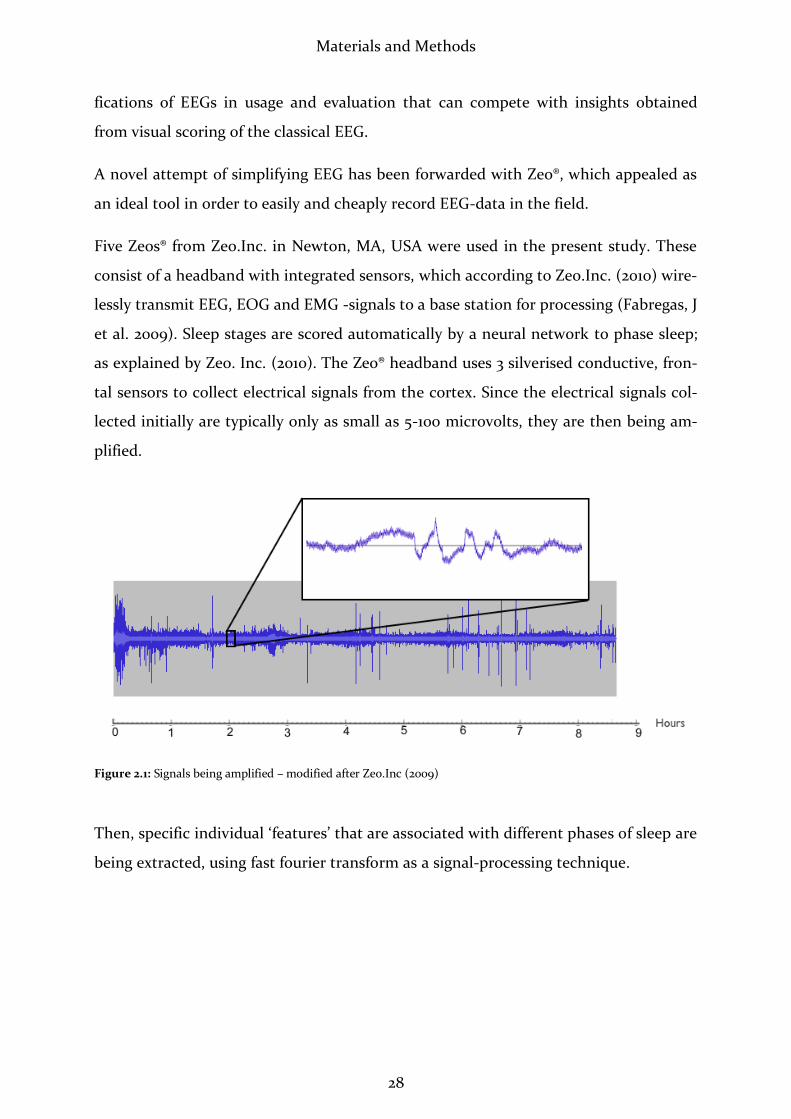
as explained by Zeo. Inc. (2010). The Zeo® headband uses 3 silverised conductive, fron-
tal sensors to collect electrical signals from the cortex. Since the electrical signals col-
lected initially are typically only as small as 5-100 microvolts, they are then being am-
plified.
Figure 2.1: Signals being amplified – modified after Zeo.Inc (2009)
Then, specific individual ‘features’ that are associated with different phases of sleep are
being extracted, using fast fourier transform as a signal-processing technique.

Materials and Methods
29
Figure 2.2: Sample features from amplified signals – modified after Zeo.Inc (2009)
After this step, according to Zeo (2010), artificial intelligence is being added, by com-
paring the signal ‘features’ from the last step to those usually seen in PSG. A neural
network then estimates the probability that an individual is in a certain phase of sleep.
Figure 2.3: Zeo® neural network – probabilities of wake, REM, light or deep phases – modified after Zeo.Inc (2009)
The neural network codes a certain sleep phase every second of the night, but the sleep
phases are being smoothed out and the results reported for every 30 sec. and five min.
interval. Zeo.Inc. declare that all measured sleep parameters are being analysed ac-
cording to the guidelines of Rechtschaffen and Kales (Blake, Pittman et al. 2009).
Figure 2.4: Sleep phases for 30 second (blue) and 5 minute intervals (green) – modified after Zeo.Inc. (2009)
Materials and Methods
30
Thus no raw data can be retrieved from Zeo®.
Zeo® was developed by a group of students at Brown University, Newton, Massachu-
setts. In an abstract, Shambroom et al. (2009) state to have compared it to the sleep
stage measures derived from PSG that was manually scored following the guidelines of
Rechtschaffen and Kales (1973) by two trained technicians blinded to the results of the
wireless EEG. The results derived from the wireless system were alleged to be reasona-
bly comparable to those derived from PSG (Shambroom, J et al. 2009). In a likewise
study out of which only the abstract and a poster were available, Blake et al. (2009)
found this wireless system to yield similar results as PSG, stating also that the device
performed better on healthy volunteers than on sleep disordered subjects. Both Sham-
broom et al. (2009) and Blake et al. (2009) agree that the system shows promise as an
easy to use method for measuring sleep stages related to sleep quality.
The parameters measured by Zeo® are listed as follows:
Zeo®-Parameter:
Commentary:
Total Sleep (TS): A summation of Time in REM, Time in Light and Time in
Deep. Since Zeo® appeared to perform an uprounding of any
cipher behind the decimal point in ciphers resulting from
this calculation, TS was corrected to being either down-
rounded in ciphers up to .49 or uprounded in ciphers on-
ward from .5, according to DIN 1333 standards (Hackbusch,
H.R. et al. 2003). The company’s client contact did not reply
when asked about further information regarding the round-
ing-algorithms via email. Thus for further calculations the
corrected values were used. These differed by one minute in
half of the cases and were the same for the other half group.
Time to Sleep (TTS): Time between taking the headband off the base-station and
falling asleep. Since students often put on the headbands

Materials and Methods
31
before actually turning off the lights, TTS was corrected,
subtracting the time between putting on the headband and
turning off the lights when in bed.
Time in Wake (TIW): Time spent awake during the night. This did not include
TTS or time awake after the last sleep phase of the night.
Time in REM (TIR): Time spent in REM-sleep.
Time in Light (TIL): Time spent in sleep stages 1 and 2, which are centralised as
light sleep.
Time in Deep (TID): Time spent in sleep stages 3 and 4, which are centralised as
deep sleep.
Awakenings (Aw): Number of times a test-person woke up during the night,
irrespective of the duration of the time spent awake.
Start of Night (SN): Date and time of day when taking the headband off the
base-station to put it on. Zeo® rounds these values by five
minutes.
End of Night (EN): Date and time of day when putting the headband back onto
the base station after a night’s sleep. In contrast to Start of
Night and Rise Time, this measure displays the exact, un-
rounded time.
Rise Time / Sleep End (SE):
Date and time of day when waking up after the night’s last
sleep phase. These values are also rounded by five minutes.
Sleep Graph: Drawn from numbers between 0 and 4 in the downloadable
excel-file. This graph averages the initial measurements of
30-second-intervals by five minutes. 0 = no measurement.
This may occur when the headband is not in correct posi-
tion on the forehead. 1 = awakeness, 2 = REM-sleep, 3 = light
sleep and 4 = deep sleep. Individual sleep graphs are dis-
played on the password-coded part of Zeo’s® website, turn-

Materials and Methods
32
ing numbers of sleep phases into bars.
Detailed Sleep Graph: Displays numbers as mentioned above, in 30-second-
intervals throughout the night.
Sleep Date: Displays the date of start of night.
ZQ: This measure is suggested to measure sleep quality (Zeo
2010). It combines information about TS, restorative sleep
and disrupted sleep, which stands for time spent awake and
times woken up. Restorative sleep is defined by Zeo® as con-
sisting of deep sleep and REM sleep. Since no valid studies
could be found on this subject, ZQ was not paid any atten-
tion to in this work.
Figure 2.5: Sleep graph as displayed by Zeo®, displaying night-intervals of five minutes – source: Zeo.Inc. (2011)
Data received by the base-station of the wireless EEG can be uploaded via an SD-card
in the base station that can be connected to a computer for uploading on
www.myzeo®.org, from where it may be exported as an excel-file.
For reasons of copyright, Zeo.Inc. did not divulge the exact algorithms of data process-
ing.
Materials and Methods
33
2.2.4 Software for Data Handling and Computation
All data were first entered into Excel 2004 for Mac, where initial data arrangement and
computation were conducted. Statistical analyses were done with SPSS 10 for PC.
Graphs and figures were drawn in Excel 2007 for PC.
2.3 Methods
2.3.1 Data Collection
The survey was conducted between June and August 2010.
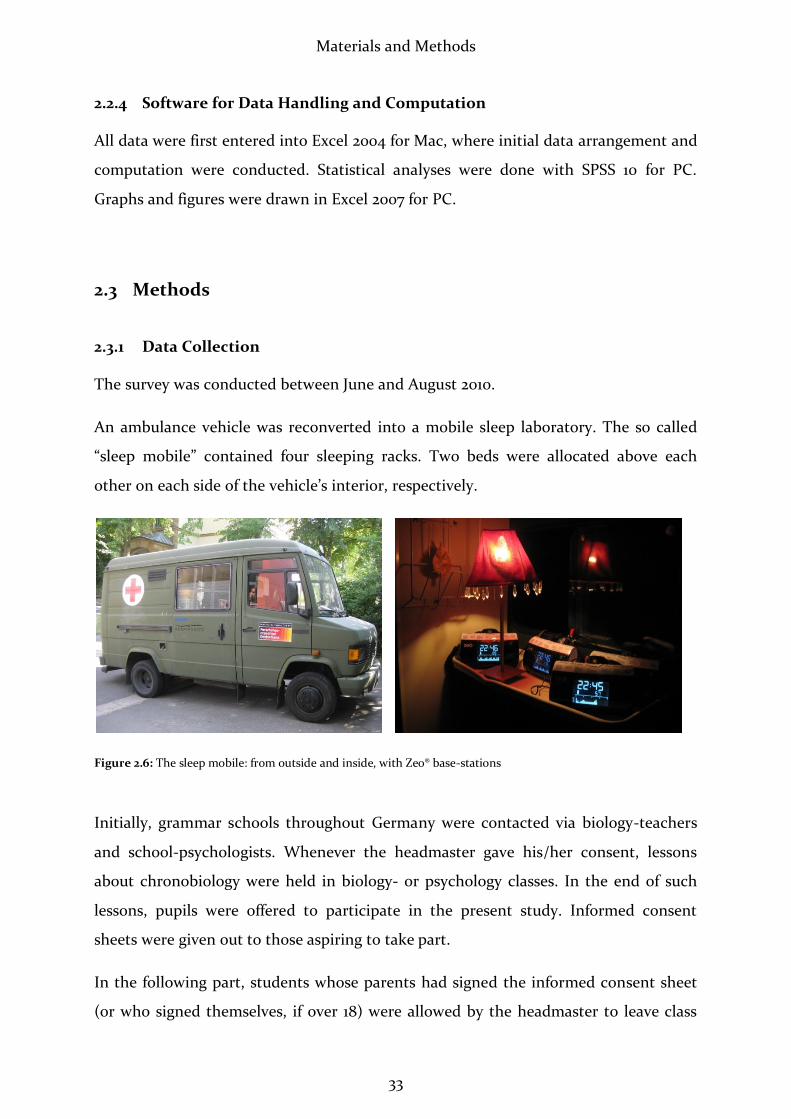
An ambulance vehicle was reconverted into a mobile sleep laboratory. The so called
“sleep mobile” contained four sleeping racks. Two beds were allocated above each
other on each side of the vehicle’s interior, respectively.
Figure 2.6: The sleep mobile: from outside and inside, with Zeo® base-stations
Initially, grammar schools throughout Germany were contacted via biology-teachers
and school-psychologists. Whenever the headmaster gave his/her consent, lessons
about chronobiology were held in biology- or psychology classes. In the end of such
lessons, pupils were offered to participate in the present study. Informed consent
sheets were given out to those aspiring to take part.
In the following part, students whose parents had signed the informed consent sheet
(or who signed themselves, if over 18) were allowed by the headmaster to leave class

Materials and Methods
34
for 15 minutes for a personal meeting, including anamnesis and physical examination.
They were also asked to fill out the MCTQ.
Subsequently, two consecutive nights of Zeo®-measurements in the sleep mobile fol-
lowed for each participant. Each measuring occurred ahead of free days, in order to let
the students sleep in, according to their physiological needs. The door of the sleep mo-
bile made a lot of noise when closing or opening it, and there was fluctuation of the
vehicle when people moved inside. Due to this, it was assumed that the adherence to
entirely individual sleep-timing could not be met. Students of the same group of par-
ticipants were thus allowed to go to sleep at the same time. Respectively up to four
students of the same sex slept in the sleep mobile on two succeeding nights. The vehi-
cle was parked on the schoolyard with bathroom facilities next to it. The study-
conductor (St.B.) spent the night awake in a room immediately next to the sleep mo-
bile, and was thus always addressable through an open window. The school-
psychologist was also always approachable during the nights. Prior to measurement-
nights, the local police was informed, their number saved and access to telephoning-
facilities assured.
Participants were called into school at 8 p.m. They engaged in games and conversa-
tions held in quiet surroundings with slightly dimmed lights until becoming tired. The
time of going to bed was optionally chosen. Zeo®-headbands were applied shortly be-
fore going to sleep in order for the participants to get used to wearing them. Time of
“lights out” was recorded manually in order to correct Zeo®’s recording of “time to fall
asleep” later on. The latter measurement was also limited, by students being allowed to
talk “a little bit” when lying in bed.
In the mornings students were allowed to get up at individual times, although their
timing was often similar due to unsteadiness of the vehicle and noise of the door
whenever a person left it.
As an incentive and an acknowledgement to the students, each participant received an
email with his/her personal sleep-profile after recording of the EEG, and they were be-
stowed with book-presents dealing with chronobiology and sleep.
Materials and Methods
35
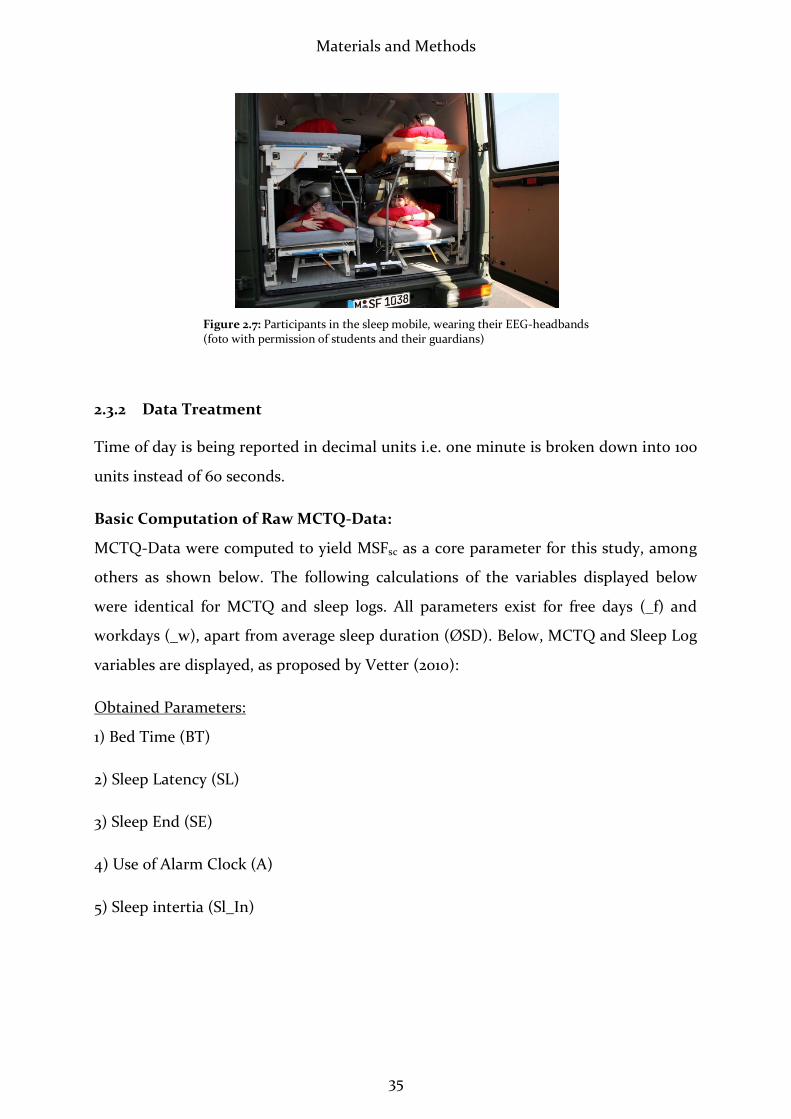
Figure 2.7: Participants in the sleep mobile, wearing their EEG-headbands (foto with permission of students and their guardians)
2.3.2 Data Treatment
Time of day is being reported in decimal units i.e. one minute is broken down into 100
units instead of 60 seconds.
Basic Computation of Raw MCTQ-Data:
MCTQ-Data were computed to yield MSFsc as a core parameter for this study, among
others as shown below. The following calculations of the variables displayed below
were identical for MCTQ and sleep logs. All parameters exist for free days (_f) and
workdays (_w), apart from average sleep duration (ØSD). Below, MCTQ and Sleep Log
variables are displayed, as proposed by Vetter (2010):
Obtained Parameters:
1) Bed Time (BT)
2) Sleep Latency (SL)
3) Sleep End (SE)
4) Use of Alarm Clock (A)
5) Sleep intertia (Sl_In)

Materials and Methods
36
Computed Parameters and their Algorithms:
1) Sleep Onset (SO):
2) Sleep Duration (SD):
3) Mid-Sleep (MS):
4) Average Sleep Duration (ØSD):
* = relative number of workdays / = relative number of free days
5) MSFsc /Chronotype:
6) Social Jetlag (SJL): (Wittmann, Dinich et al.
2006)
Basic Computation of Raw Sleep-Log-Data:
Sleep logs were entered into Excel-files in order to calculate further parameters as ex-
plained for the MCTQ.
Test persons 16, 19 and 27 had only free days: in their cases MSF was used instead of
MSFsc. ID 22 was excluded from MSF- and ØSD-calculation because this student had
no free days during sleep-log keeping.
ØSD was calculated in accordance with Roenneberg et al. (2004) and Frey et al. (2009)
with the formula:
. In case of IDs 16, 19 and 27, their mean SD_f was used as
ØSD, instead of applying the named formula.
Basic Computation of Zeo®-Data:
Three cases (IDs 13.1, 30.1 and 32.2), in which the Zeo®-headband fell off during the
night were excluded from measurements.
Materials and Methods
37
“Lights Out” (LO) was calculated as an additional parameter instead of the Zeo®-
parameter “Start of Night” (SN) since the latter did not correspond to the given cir-
cumstances (see above). The manually recorded time spent outside bed with headband
on was subtracted from SN. Like SN, LO was averaged by 5 minutes.
SO was calculated using the formula: SN + TTS. SO was then displayed before 0:00 o’
clock with negative- and after 0:00 o’ clock with positive ciphers.
“Sleep Duration (SD) from Sleep Onset to Rise Time” (SDSORT) was computed by calcu-
lating SE – SO. The attained value displays the duration of the complete individual
night, including all arousal phases.
MS was calculated via the formula:
.
Identifying REM-Phases (REMP) and Sleep Cycles (SC):
REM-occurrences and SC were counted visually per person and means were calculated.
A SC was counted from one REMP to the next, with exception of the first cycle, which
was counted from SO to first REMP, unless it began with a SOREM phase. A nights’
last SC would thus end with the nights’ last REMP. Two REMPs interrupted by a wake-
phase would not be counted as a SC.
SOREMPs were also identified visually. According to the American Academy of Sleep
Medicine (2001), any REMP that occurred within 10 minutes of sleep onset was defined
as SOREM.
Numbers of REMP and of SC were transformed with z-scores. Then entries with > 2
stdev. were identified as outliers and excluded from further calculations. This was the
case for IDs 12.1 and 28.1 for both nr. of REMP and SC. After this the count of REMP
and SC was correlated with the appearance of SOREM (see Results).
Statistical Tests:
Prior to any statistical testing, ouliers were excluded, that exceeded 2 standart devia-
tions from the mean. Statistical tests were always controlled for violation of the as-
Materials and Methods
38
sumption of normality of distribution. This was tested with the Kolmogorov-Smirnov-
test which is recommended by Weiß (2008) for small sample sizes. Whenever violation
of normality would occur, the corresponding tests would be applied – such as the
Mann-Whitney-U-test, instead of students’ T-test; as will be remarked in the respec-
tive cases. For continuous data correlation, the bivariate two-tailed correlation coeffi-
cient was calculated, whereas nominal and ordinal data were correlated using point-
biserial, two-tailed correlation. Whenever no comment is stated on the applied kind of
correlation, bivariate, two-tailed correlation was applied. The classification of correla-
tion-results and effect sizes occurred according to the criteria of Buehner (2004). The
level of significance at which hypotheses could be accepted was defined at .05.
Comparison of MCTQ/Sleep-Log-Data:
Whenever parameters such as “MSFsc”, derived from MCTQ or SL are not specified into
“_MCTQ” or “_SL”, MCTQ-data were used preferentially, whereas SL-data served only
for filling in when students had completed the MCTQ inadequately. This was the case
for IDs 7, 19 and 27. From IDs 15, 17 and 18, neither MCTQ nor SL could be obtained.
In accordance with Field (2005), effect sizes for t – values were calculated by the for-
mula:
.
Comparing Variance between Nights:
For the question of significant variances of differences between 1st and 2nd night, re-
peated measures analysis of variance (rANOVA)was performed with the Zeo®-data,
using the covariates: MSFsc & age (MSF from MCTQ, except for ID 7 of whom MSF
from sleep log was used because no MCTQ entry could be obtained. IDs 9, 15, 17 and 18
could not be used for MSF correlation because no sleep log or MCTQ data were re-
ceived). All tests of within-subject-effects resulted insignificant apart from TTS & re-
spectively interaction between night-number and age in months. Considering these
results, the decision was made to use both first and second night per student for fur-
ther statistical means.

Materials and Methods
39
Correlation of MCTQ-, Sleep-Log- and EEG-Data:
In order to correlate data from MCTQ, Sleep-Log and Zeo®, median-values were taken
from sleep logs, while means were used from MCTQ and Zeo®. The sleep logs were
treated this way to minimise mavericks, as they were only kept for the short time of
two weeks.
Results
40
3 Results
3.1 Description of Obtained Data
3.1.1 List of Obtained Data
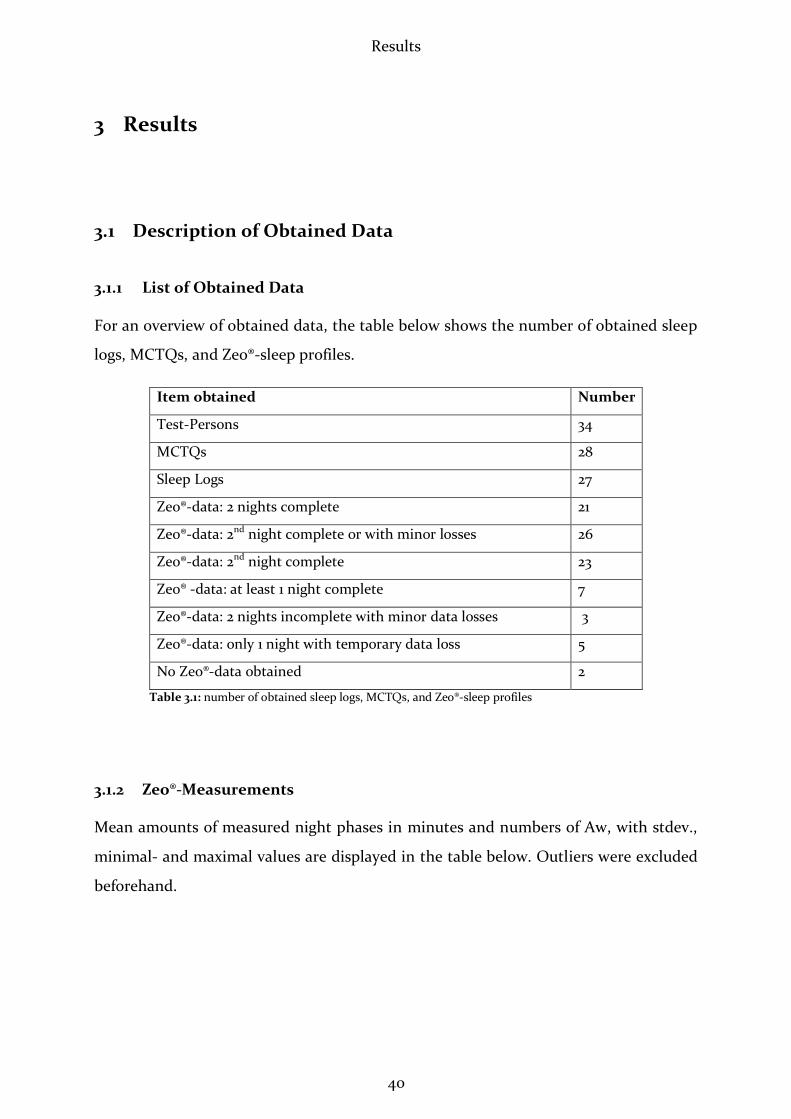
For an overview of obtained data, the table below shows the number of obtained sleep
logs, MCTQs, and Zeo®-sleep profiles.
Item obtained Number
Test-Persons 34
MCTQs 28
Sleep Logs 27
Zeo®-data: 2 nights complete 21
Zeo®-data: 2nd night complete or with minor losses 26
Zeo®-data: 2nd night complete 23
Zeo® -data: at least 1 night complete 7
Zeo®-data: 2 nights incomplete with minor data losses 3
Zeo®-data: only 1 night with temporary data loss 5
No Zeo®-data obtained 2
Table 3.1: number of obtained sleep logs, MCTQs, and Zeo®-sleep profiles
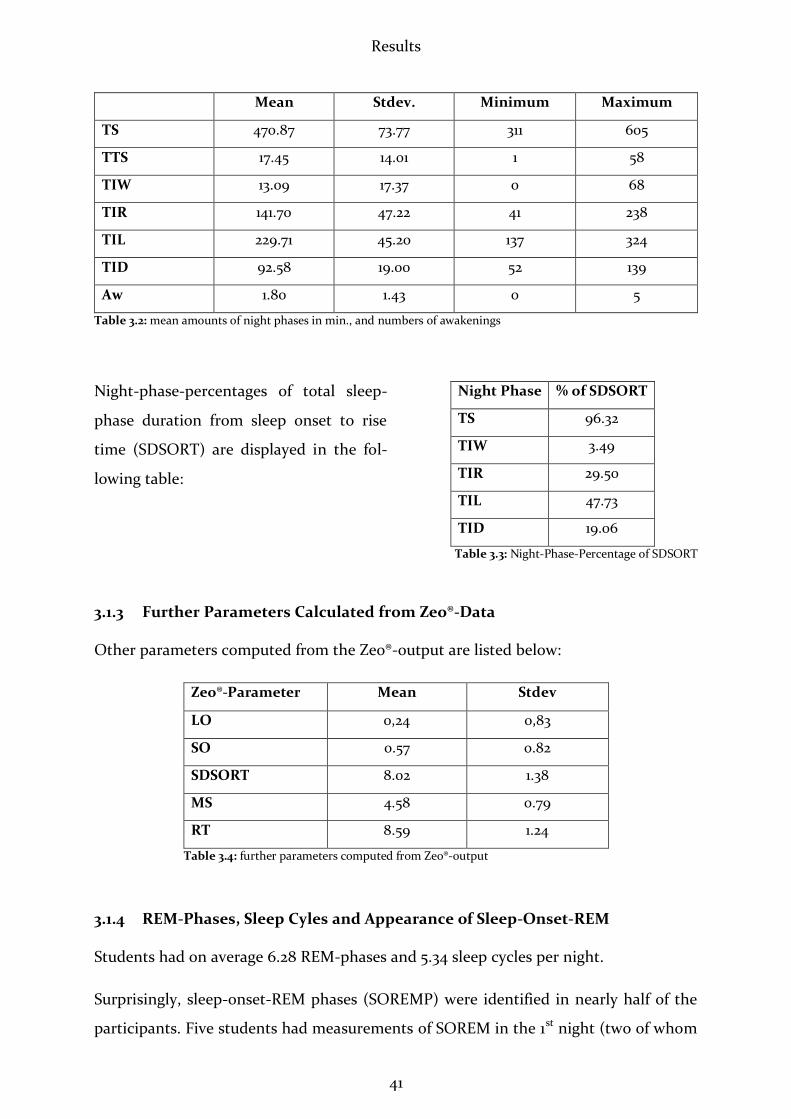
3.1.2 Zeo®-Measurements
Mean amounts of measured night phases in minutes and numbers of Aw, with stdev.,
minimal- and maximal values are displayed in the table below. Outliers were excluded
beforehand.
Results
41
Mean Stdev. Minimum Maximum
TS 470.87 73.77 311 605
TTS 17.45 14.01 1 58
TIW 13.09 17.37 0 68
TIR 141.70 47.22 41 238
TIL 229.71 45.20 137 324
TID 92.58 19.00 52 139
Aw 1.80 1.43 0 5
Table 3.2: mean amounts of night phases in min., and numbers of awakenings
Night-phase-percentages of total sleep-
phase duration from sleep onset to rise
time (SDSORT) are displayed in the fol-
lowing table:
3.1.3 Further Parameters Calculated from Zeo®-Data
Other parameters computed from the Zeo®-output are listed below:
Zeo®-Parameter Mean Stdev
LO 0,24 0,83
SO 0.57 0.82
SDSORT 8.02 1.38
MS 4.58 0.79
RT 8.59 1.24
Table 3.4: further parameters computed from Zeo®-output
3.1.4 REM-Phases, Sleep Cyles and Appearance of Sleep-Onset-REM
Students had on average 6.28 REM-phases and 5.34 sleep cycles per night.
Surprisingly, sleep-onset-REM phases (SOREMP) were identified in nearly half of the
participants. Five students had measurements of SOREM in the 1st night (two of whom
Night Phase % of SDSORT
TS 96.32
TIW 3.49
TIR 29.50
TIL 47.73
TID 19.06
Table 3.3: Night-Phase-Percentage of SDSORT
Results
42
spent only one night in the sleep mobile, three showed SOREM only in the 2nd night
and eleven showed SOREM in both nights. Given this unexpected observation, post-
hoc hypotheses were generated, as elucidated in the discussion. Various correlations
were then performed pertaining to SOREM, as pointed out detailed in 3.2.
3.2 Analysis of Obtained Data
3.2.1 Analysing Variance of Sleep-Parameters between the 1st and 2nd Night
Initially, first and second nights were compared, in order to test for a first-night effect
and to evaluate the necessity to exclude the first night from further computation.
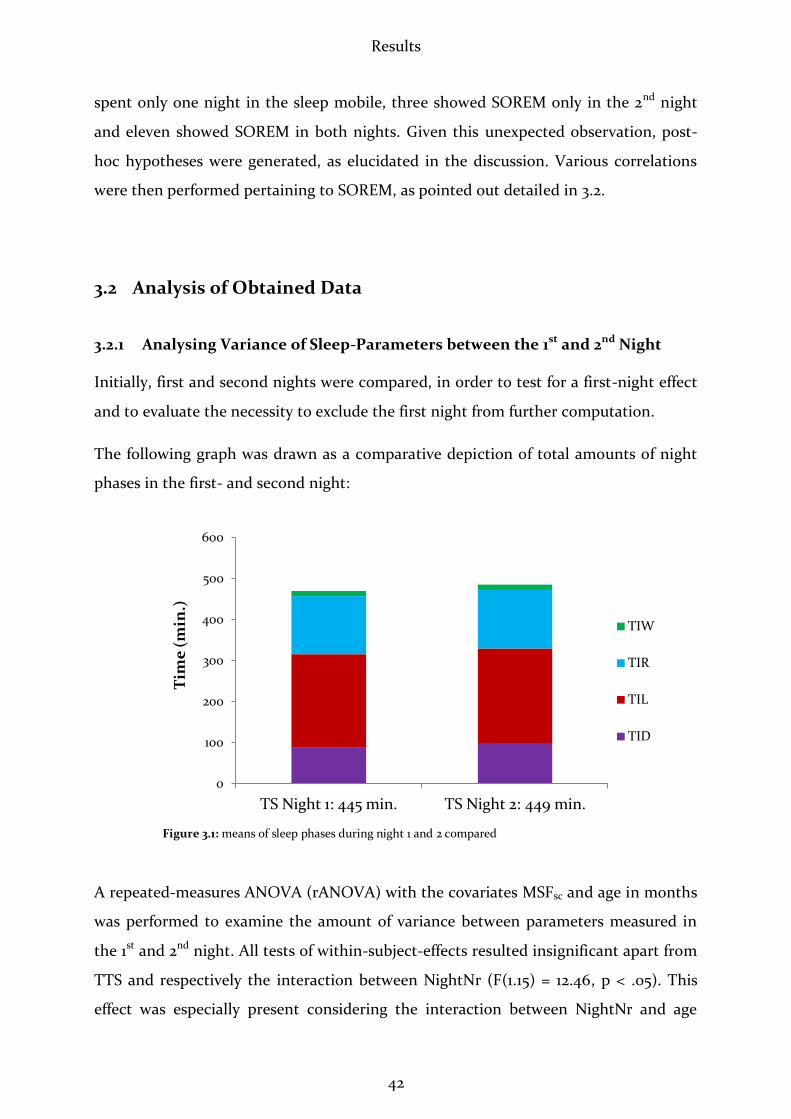
The following graph was drawn as a comparative depiction of total amounts of night
phases in the first- and second night:
Figure 3.1: means of sleep phases during night 1 and 2 compared
A repeated-measures ANOVA (rANOVA) with the covariates MSFsc and age in months
was performed to examine the amount of variance between parameters measured in
the 1st and 2nd night. All tests of within-subject-effects resulted insignificant apart from
TTS and respectively the interaction between NightNr (F(1.15) = 12.46, p < .05). This
effect was especially present considering the interaction between NightNr and age
0
100
200
300
400
500
600
TS Night 1: 445 min. TS Night 2: 449 min.
Tim
e (
min
.)
TIW
TIR
TIL
TID

Results
43
(F(1.15) = 11.23, p < .05). The mean of TTS was 4.14 min. longer in the 2nd night. How-
ever, it should be remarked that TTS is no confident parameter since test persons usu-
ally went to sleep at the same time. Although the usual expectation is that test-persons
sleep better in the 2nd night due to the “first night effect” (Agnew, Webb et al. 1966;
Curcio, Ferrara et al. 2004; Sforza, Chapotot et al. 2008), this result does not show any
significant customization of the students between the 1st and 2nd night. For these rea-
sons both nights were used when performing further computations. Mean times spent
in the measured night phases, and results of rANOVA are displayed in the table below:
Comparing 1st and 2nd night
1st Night 2nd Night F P
TS 444.56 (17.09) 449.97 (18.06) 2.39 .142
TTS 15.42 (2.34) 19.56 (3.00) 12.43 .003
TIW 12.41 (2.80) 13.81 (3.88) .94 .347
TIR 141.26 (9.61) 142.15 (8.45) 2.55 .130
TIL 227.07 (8.50) 232.67 (8.90) .457 .510
TID 88.70 (3.64) 96.76 (3.48) .510 .032
Aw 2 (0.23) 1.56(0.23) .17 .682
Table 3.5: means and SEM (within parentheses), and rANOVA results of sleep variables during 1st and 2nd nights
3.2.2 Comparing MCTQ-Data with Sleep Log Data
Means and stdev. of those MCTQ- and sleep-log parameters of capital importance are
opposed in the following table:
MCTQs Sleep Logs
Mean Stdev. Mean Stdev.
MSFsc 4.48 .62 4.53 .70
MSF 5.32 .63 4.87 .52
MSW 2.86 .63 3.17 .73
SD_f 9.19 .97 7.88 .86
SD_w 7.09 .92 7.14 .83
ØSD 7.84 .59 7.46 .83
Table 3.6: means and stdev. of important MCTQ- and sleep-log parameters

Results
44
MSFsc, MSF, MSW, SD_f, SD_w and øSD from MCTQs and Sleep logs were first sub-
jected to bivariate, two-sided correlation and then compared in paired samples t-tests.
Effect sizes r were calculated.
Correlation of MCTQ- and Sleep Log Data:
As can be seen in the following table, MSFsc _MCTQ showed an intermediate correla-
tion with MSFsc _SL (r = .420, p < .05). Between the other mentioned parameters, no
correlation could be found.
Parameter N r p
MSFsc _MCTQ & MSFsc _SL 24 .420 .041
MSF_MCTQ & MSF_SL 22 .299 .177
MSW_MCTQ & SW_SL 23 .398 .060
SD_f_MCTQ & SDf_SL 24 -.122 .571
SD_w_MCTQ & SDw_SL 23 .256 .239
ØSD_MCTQ & ØSD_SL 23 -.026 .905
Table 3.7: correlations for paired samples between MCTQ and SL
Figure 3.2: correlation between MSFsc _MCTQ and MSFsc _SL (R2 Linear =.177; N=24; r=.42; p=.041)
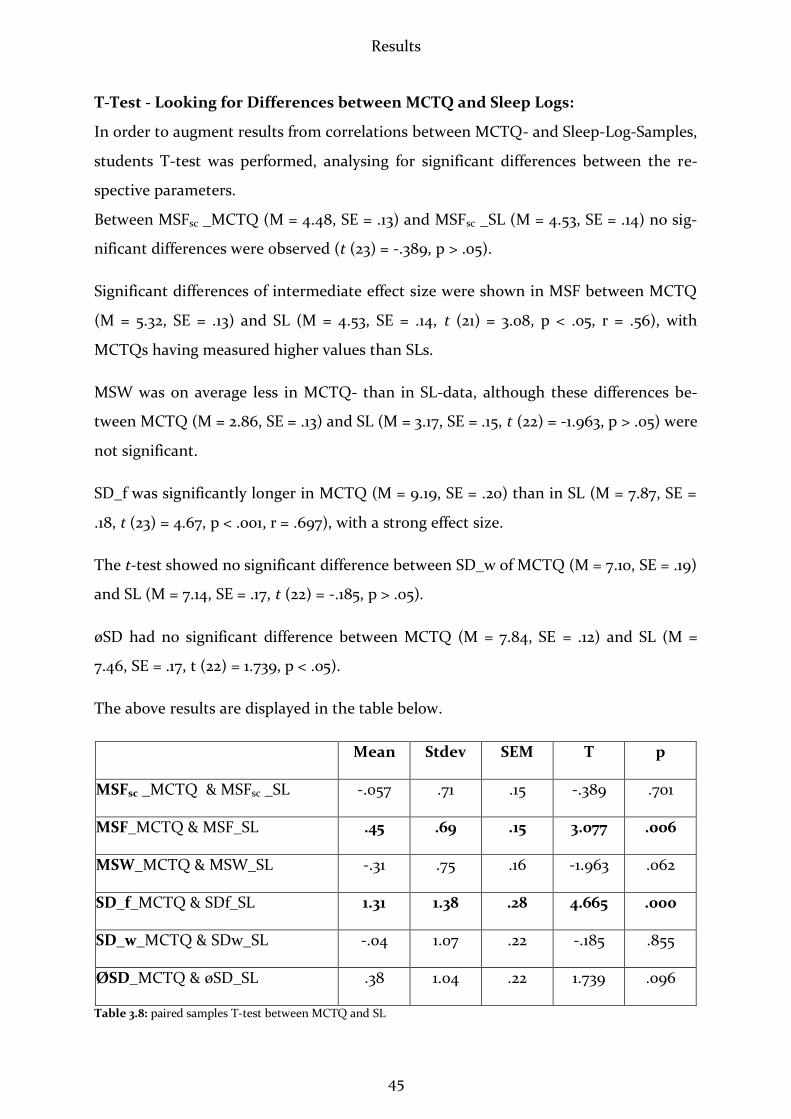
Results
45
T-Test - Looking for Differences between MCTQ and Sleep Logs:
In order to augment results from correlations between MCTQ- and Sleep-Log-Samples,
students T-test was performed, analysing for significant differences between the re-
spective parameters.
Between MSFsc _MCTQ (M = 4.48, SE = .13) and MSFsc _SL (M = 4.53, SE = .14) no sig-
nificant differences were observed (t (23) = -.389, p > .05).
Significant differences of intermediate effect size were shown in MSF between MCTQ
(M = 5.32, SE = .13) and SL (M = 4.53, SE = .14, t (21) = 3.08, p < .05, r = .56), with
MCTQs having measured higher values than SLs.
MSW was on average less in MCTQ- than in SL-data, although these differences be-
tween MCTQ (M = 2.86, SE = .13) and SL (M = 3.17, SE = .15, t (22) = -1.963, p > .05) were
not significant.
SD_f was significantly longer in MCTQ (M = 9.19, SE = .20) than in SL (M = 7.87, SE =
.18, t (23) = 4.67, p < .001, r = .697), with a strong effect size.
The t-test showed no significant difference between SD_w of MCTQ (M = 7.10, SE = .19)
and SL (M = 7.14, SE = .17, t (22) = -.185, p > .05).
øSD had no significant difference between MCTQ (M = 7.84, SE = .12) and SL (M =
7.46, SE = .17, t (22) = 1.739, p < .05).
The above results are displayed in the table below.
Mean Stdev SEM T p
MSFsc _MCTQ & MSFsc _SL -.057 .71 .15 -.389 .701
MSF_MCTQ & MSF_SL .45 .69 .15 3.077 .006
MSW_MCTQ & MSW_SL -.31 .75 .16 -1.963 .062
SD_f_MCTQ & SDf_SL 1.31 1.38 .28 4.665 .000
SD_w_MCTQ & SDw_SL -.04 1.07 .22 -.185 .855
ØSD_MCTQ & øSD_SL .38 1.04 .22 1.739 .096
Table 3.8: paired samples T-test between MCTQ and SL
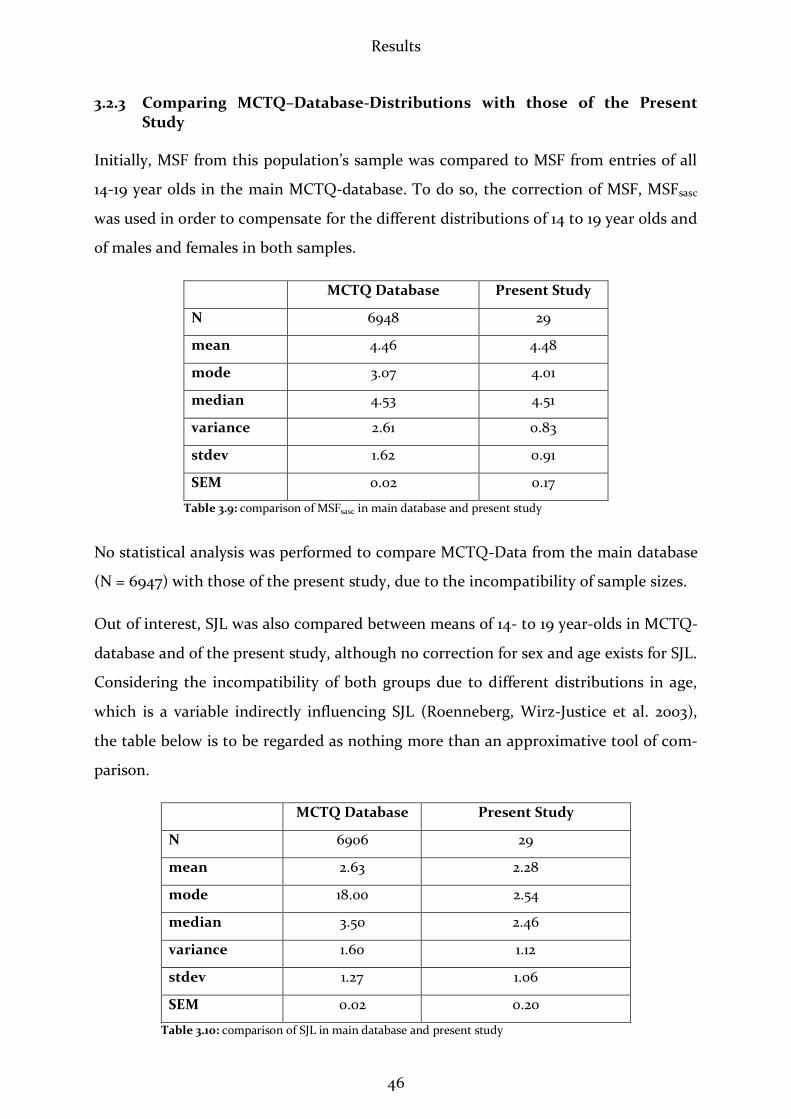
Results
46
3.2.3 Comparing MCTQ–Database-Distributions with those of the Present Study
Initially, MSF from this population’s sample was compared to MSF from entries of all
14-19 year olds in the main MCTQ-database. To do so, the correction of MSF, MSFsasc
was used in order to compensate for the different distributions of 14 to 19 year olds and
of males and females in both samples.
MCTQ Database Present Study
N 6948 29
mean 4.46 4.48
mode 3.07 4.01
median 4.53 4.51
variance 2.61 0.83
stdev 1.62 0.91
SEM 0.02 0.17
Table 3.9: comparison of MSFsasc in main database and present study
No statistical analysis was performed to compare MCTQ-Data from the main database
(N = 6947) with those of the present study, due to the incompatibility of sample sizes.
Out of interest, SJL was also compared between means of 14- to 19 year-olds in MCTQ-
database and of the present study, although no correction for sex and age exists for SJL.
Considering the incompatibility of both groups due to different distributions in age,
which is a variable indirectly influencing SJL (Roenneberg, Wirz-Justice et al. 2003),
the table below is to be regarded as nothing more than an approximative tool of com-
parison.
MCTQ Database Present Study
N 6906 29
mean 2.63 2.28
mode 18.00 2.54
median 3.50 2.46
variance 1.60 1.12
stdev 1.27 1.06
SEM 0.02 0.20
Table 3.10: comparison of SJL in main database and present study
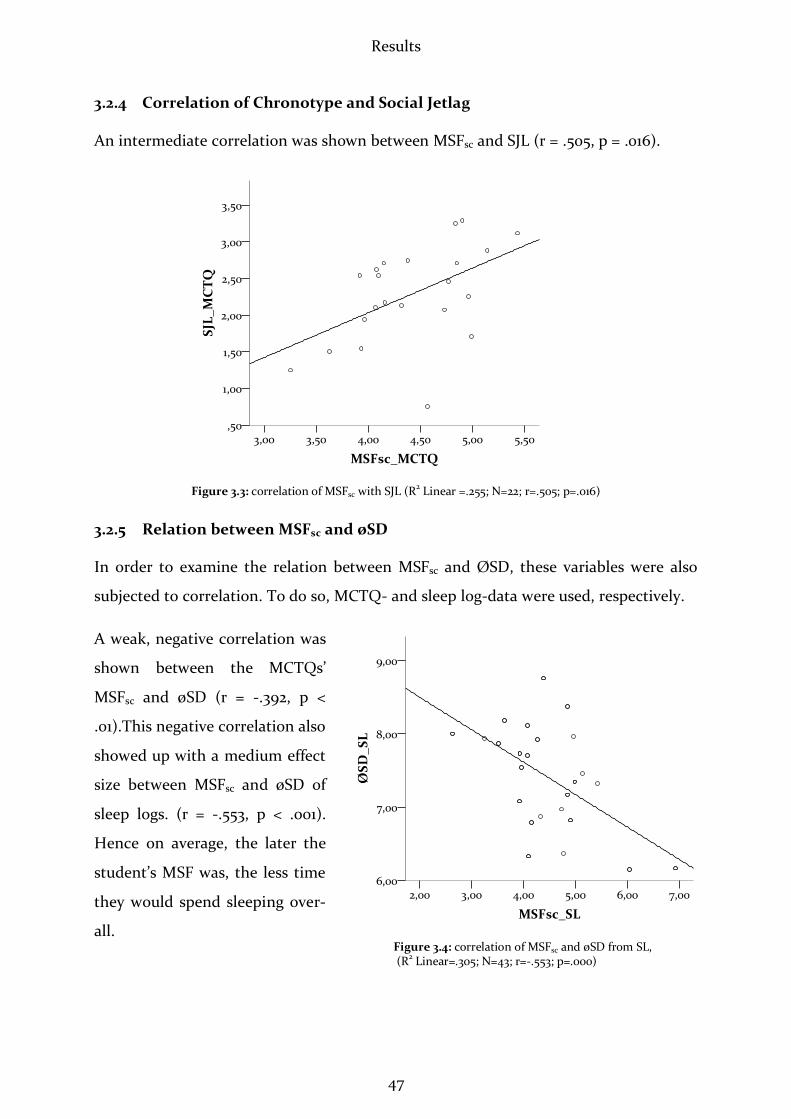
Results
47
3.2.4 Correlation of Chronotype and Social Jetlag
An intermediate correlation was shown between MSFsc and SJL (r = .505, p = .016).
3.2.5 Relation between MSFsc and øSD
In order to examine the relation between MSFsc and ØSD, these variables were also
subjected to correlation. To do so, MCTQ- and sleep log-data were used, respectively.
A weak, negative correlation was
shown between the MCTQs’
MSFsc and øSD (r = -.392, p <
.01).This negative correlation also
showed up with a medium effect
size between MSFsc and øSD of
sleep logs. (r = -.553, p < .001).
Hence on average, the later the
student’s MSF was, the less time
they would spend sleeping over-
all.
Figure 3.3: correlation of MSFsc with SJL (R2 Linear =.255; N=22; r=.505; p=.016)
Figure 3.4: correlation of MSFsc and øSD from SL, (R2 Linear=.305; N=43; r=-.553; p=.000)

Results
48
MSFsc was then subjected to correlation with SD_f and SD_w. An intermediate nega-
tive correlation was seen between MSFsc and SD_f (r = -.452, p = .03), while there was
no significant effect between MSFsc and SD_w (r = -.363, p = .097).
The following graph depicts the relation between sleep duration on school- and free
days with MSFsc. It shows the longer sleep duration on free days as compared to week
days. The regression line is seen to decline less steeply on free days than on workdays,
with increasing lateness of chronotype.
Figure 3.5: comparison of sleep duration on free- and schooldays, in relation to MSFsc (see data above)
3.2.6 Relations between MSFsc and Zeo®-Parameters
No significant correlation could be shown between MSFsc and the Zeo®-parameters
displayed in the table below.
Zeo®-Parameter r p
TS -.219 .144
TTS -.115 .455
TIW -.014 .927
TIR -.104 .492
TIL -.269 .077
TID -.216 .155
Aw .097 .522
Table 3.11: correlations of Zeo®-parameters with MSFsc
6
7
8
9
10
2 3 4 5 6 7 8
Sle
ep
Du
rati
on
(h
)
Chronotype (MSFsc)
SD_f
SD_w
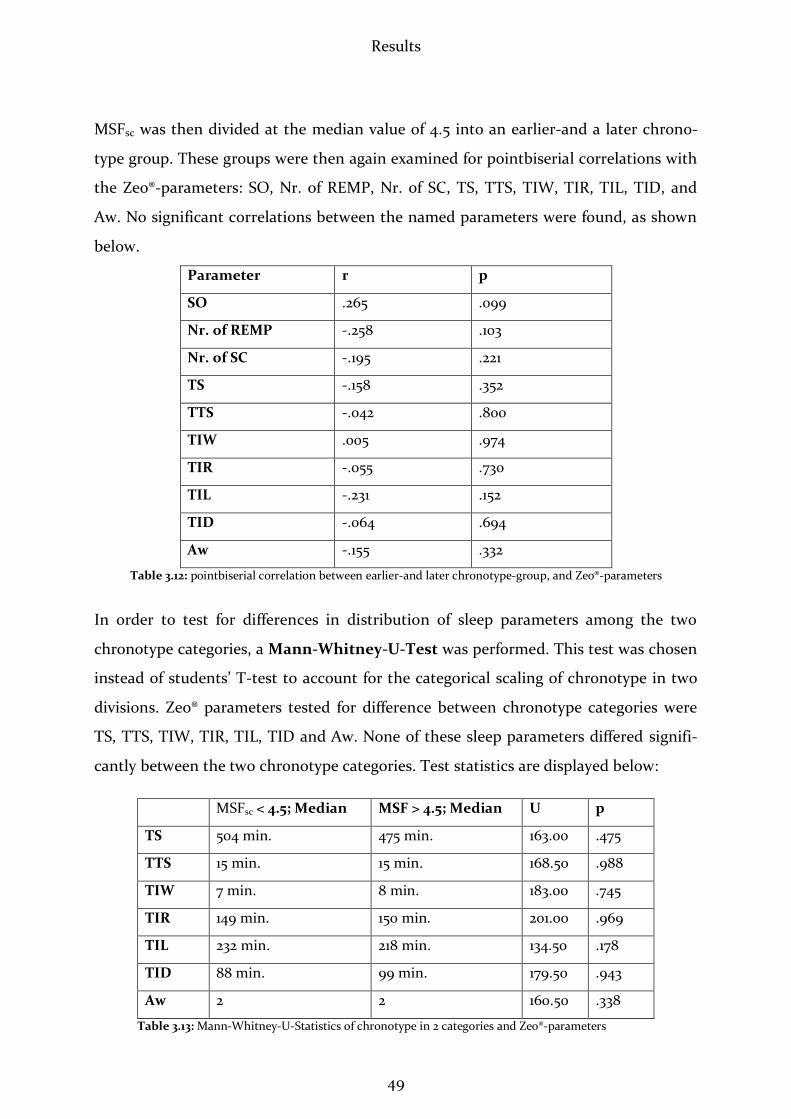
Results
49
MSFsc was then divided at the median value of 4.5 into an earlier-and a later chrono-
type group. These groups were then again examined for pointbiserial correlations with
the Zeo®-parameters: SO, Nr. of REMP, Nr. of SC, TS, TTS, TIW, TIR, TIL, TID, and
Aw. No significant correlations between the named parameters were found, as shown
below.
Parameter r p
SO .265 .099
Nr. of REMP -.258 .103
Nr. of SC -.195 .221
TS -.158 .352
TTS -.042 .800
TIW .005 .974
TIR -.055 .730
TIL -.231 .152
TID -.064 .694
Aw -.155 .332
Table 3.12: pointbiserial correlation between earlier-and later chronotype-group, and Zeo®-parameters
In order to test for differences in distribution of sleep parameters among the two
chronotype categories, a Mann-Whitney-U-Test was performed. This test was chosen
instead of students’ T-test to account for the categorical scaling of chronotype in two
divisions. Zeo® parameters tested for difference between chronotype categories were
TS, TTS, TIW, TIR, TIL, TID and Aw. None of these sleep parameters differed signifi-
cantly between the two chronotype categories. Test statistics are displayed below:
MSFsc < 4.5; Median MSF > 4.5; Median U p
TS 504 min. 475 min. 163.00 .475
TTS 15 min. 15 min. 168.50 .988
TIW 7 min. 8 min. 183.00 .745
TIR 149 min. 150 min. 201.00 .969
TIL 232 min. 218 min. 134.50 .178
TID 88 min. 99 min. 179.50 .943
Aw 2 2 160.50 .338
Table 3.13: Mann-Whitney-U-Statistics of chronotype in 2 categories and Zeo®-parameters

Results
50
Beyond testing for relations between MSFsc and initial Zeo®-Parameters, MSFsc was also
examined for correlations with several Zeo®-derived parameters. This occurred, per-
forming pointbiserial correlation, since these parameters were categorical variables.
MSFsc showed no relation with the appearance of SOREM, nr. of REMP and SC (see
table below).
r p
SOREM -.187 .203
Nr. of REMP -.217 .148
SC -.258 .084
Table 3.14: pointbiserial correlation of MSFsc with SOREM, nr. of REMPs and SCs
3.2.7 Relations among Zeo®-Parameters
Correlating Zeo®-parameters among each other, significant positive effects were ob-
served between TS and TIR (r = .471, p < .001 – medium effect), and between TS and
TIL (r = .316, p < .05 – weak effect).
Figure 3.6: correlation of total sleep and time in REM (R2 Linear=.222; N=52; r=.471; p=.000)
Figure 3.7: correlation of total sleep and time in light sleep (R2 Linear=.1; N=50; r=.316; p=.025)
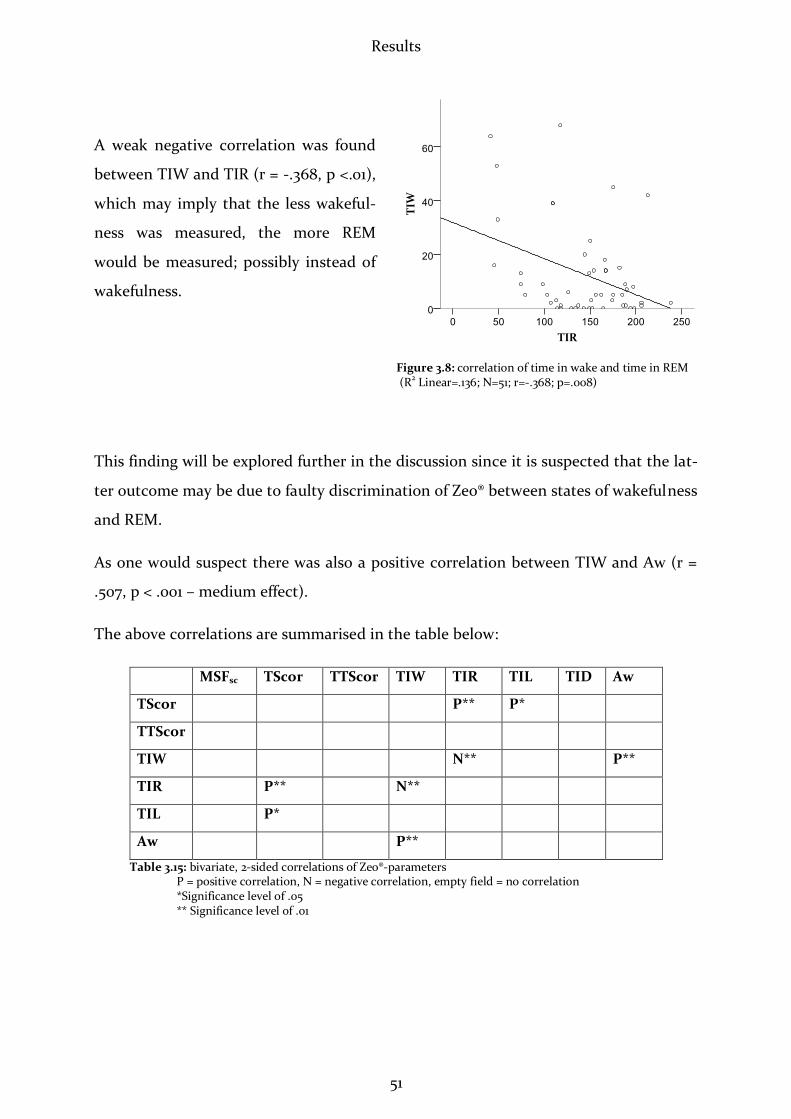
Results
51
A weak negative correlation was found
between TIW and TIR (r = -.368, p <.01),
which may imply that the less wakeful-
ness was measured, the more REM
would be measured; possibly instead of
wakefulness.
This finding will be explored further in the discussion since it is suspected that the lat-
ter outcome may be due to faulty discrimination of Zeo® between states of wakefulness
and REM.
As one would suspect there was also a positive correlation between TIW and Aw (r =
.507, p < .001 – medium effect).
The above correlations are summarised in the table below:
MSFsc TScor TTScor TIW TIR TIL TID Aw
TScor P** P*
TTScor
TIW N** P**
TIR P** N**
TIL P*
Aw P**
Table 3.15: bivariate, 2-sided correlations of Zeo®-parameters P = positive correlation, N = negative correlation, empty field = no correlation *Significance level of .05 ** Significance level of .01
Figure 3.8: correlation of time in wake and time in REM (R2 Linear=.136; N=51; r=-.368; p=.008)

Results
52
3.2.8 Correlation of Sleep Onset and Sleep End between MCTQ and Zeo®
A weak, positive correlation was found between SO_MCTQ and SO_Zeo® (r = .339, p =
.028).
SE_MCTQ and SE_Zeo® showed no correlation (r = .054, p = .728).
The relation between ØSO and ØSE measured by Zeo® and MSFsc from MCTQ in the
first- and SL in the second place is depicted on the graphic below. A circular 24-h-
diagram was drawn, displaying an MCTQ/SL-derived sleep window (blue), which was
calculated by the formulas: ØSO = ØMSFsc – ½ ØSD and ØSE = ØMSFsc + ½ ØSD.
Zeo®-derived SO- and SE-measurements were then also averaged and the range of their
Stdevs (red) set into the corresponding time-frame. The depiction shows that Zeo®-
measurements roughly met MCTQ-/SL-measurements, although only SO_MCTQ and
SO_Zeo® showed a correlation.
Figure 3.9: stdev. of ØSO and ØSE measured by Zeo®, in relation to MCTQ-derived ø sleep window on a 24-h-scale
3.2.9 Post-Hoc Hypotheses: A Challenge of SOREM
As mentioned in chapter 3.4, several post-hoc hypotheses were generated upon the
frequent finding of sleep-onset-REM among the participating students. These were as
follows:
12:00
24:00
ØMSFsc
Stdev ØSO_Zeo®
Stdev ØSE_Zeo®
Ø Sleep Window MCTQ
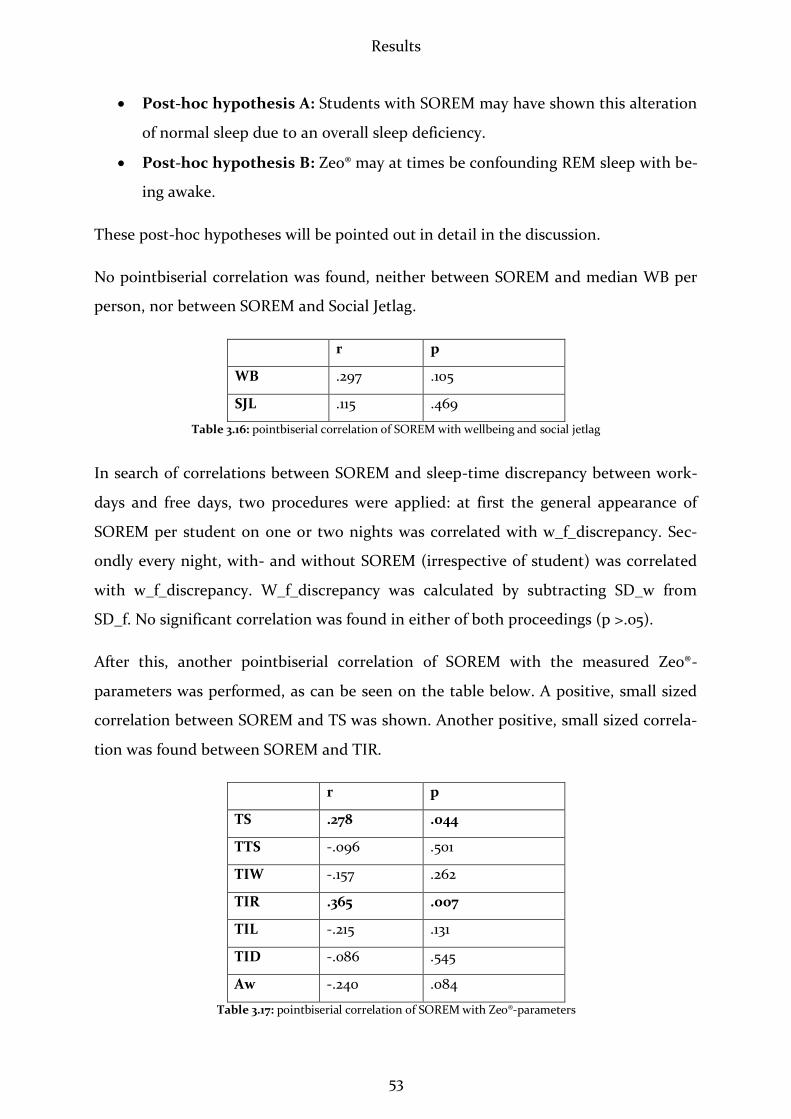
Results
53
Post-hoc hypothesis A: Students with SOREM may have shown this alteration
of normal sleep due to an overall sleep deficiency.
Post-hoc hypothesis B: Zeo® may at times be confounding REM sleep with be-
ing awake.
These post-hoc hypotheses will be pointed out in detail in the discussion.
No pointbiserial correlation was found, neither between SOREM and median WB per
person, nor between SOREM and Social Jetlag.
r p
WB .297 .105
SJL .115 .469
Table 3.16: pointbiserial correlation of SOREM with wellbeing and social jetlag
In search of correlations between SOREM and sleep-time discrepancy between work-
days and free days, two procedures were applied: at first the general appearance of
SOREM per student on one or two nights was correlated with w_f_discrepancy. Sec-
ondly every night, with- and without SOREM (irrespective of student) was correlated
with w_f_discrepancy. W_f_discrepancy was calculated by subtracting SD_w from
SD_f. No significant correlation was found in either of both proceedings (p >.05).
After this, another pointbiserial correlation of SOREM with the measured Zeo®-
parameters was performed, as can be seen on the table below. A positive, small sized
correlation between SOREM and TS was shown. Another positive, small sized correla-
tion was found between SOREM and TIR.
r p
TS .278 .044
TTS -.096 .501
TIW -.157 .262
TIR .365 .007
TIL -.215 .131
TID -.086 .545
Aw -.240 .084
Table 3.17: pointbiserial correlation of SOREM with Zeo®-parameters
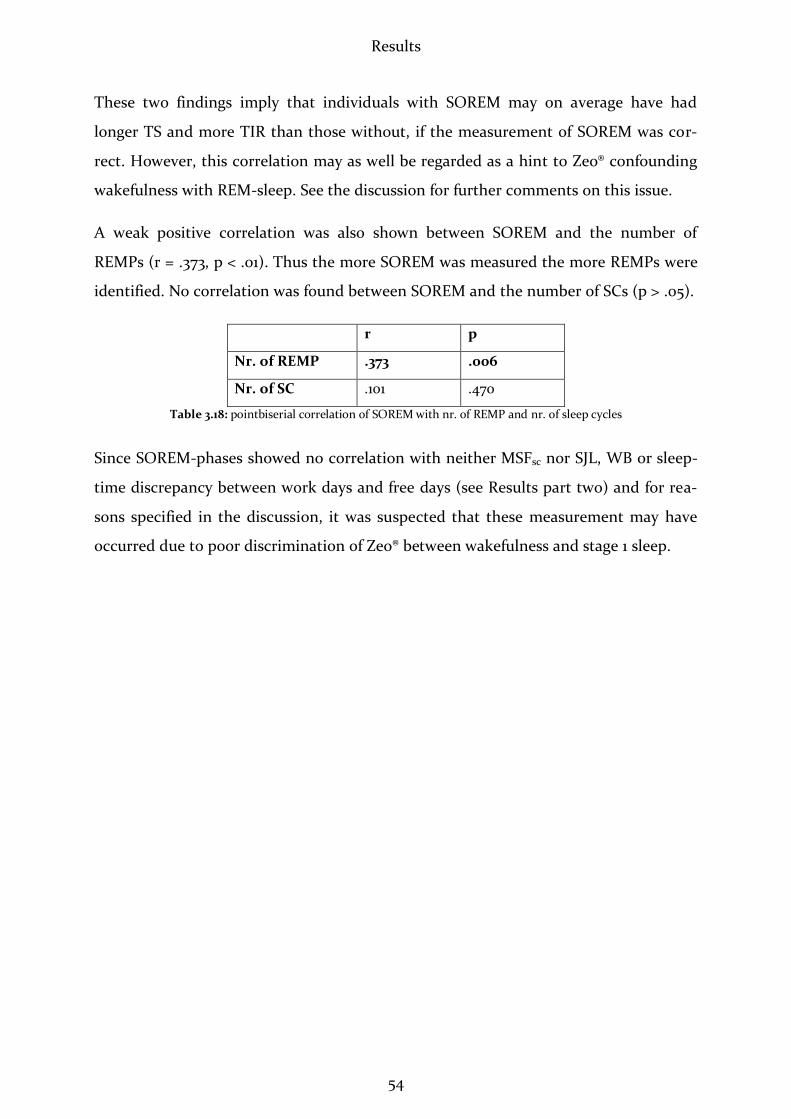
Results
54
These two findings imply that individuals with SOREM may on average have had
longer TS and more TIR than those without, if the measurement of SOREM was cor-
rect. However, this correlation may as well be regarded as a hint to Zeo® confounding
wakefulness with REM-sleep. See the discussion for further comments on this issue.
A weak positive correlation was also shown between SOREM and the number of
REMPs (r = .373, p < .01). Thus the more SOREM was measured the more REMPs were
identified. No correlation was found between SOREM and the number of SCs (p > .05).
r p
Nr. of REMP .373 .006
Nr. of SC .101 .470
Table 3.18: pointbiserial correlation of SOREM with nr. of REMP and nr. of sleep cycles
Since SOREM-phases showed no correlation with neither MSFsc nor SJL, WB or sleep-
time discrepancy between work days and free days (see Results part two) and for rea-
sons specified in the discussion, it was suspected that these measurement may have
occurred due to poor discrimination of Zeo® between wakefulness and stage 1 sleep.
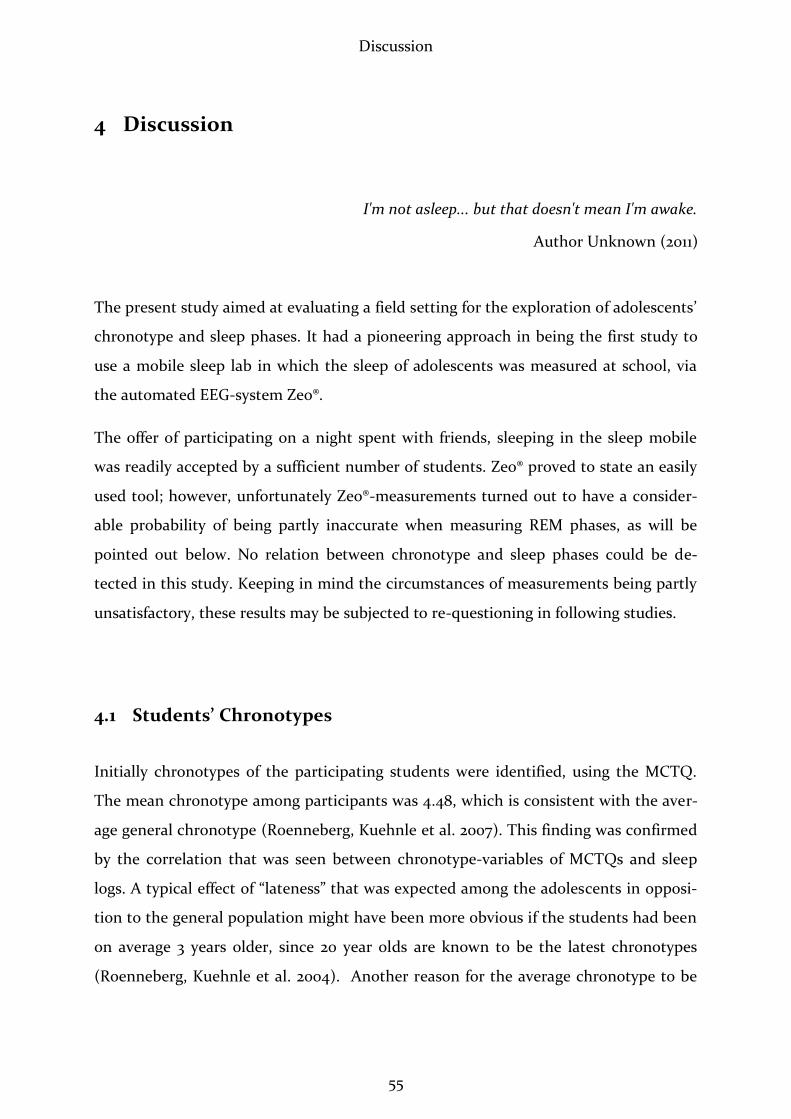
Discussion
55
4 Discussion
I'm not asleep... but that doesn't mean I'm awake.
Author Unknown (2011)
The present study aimed at evaluating a field setting for the exploration of adolescents’
chronotype and sleep phases. It had a pioneering approach in being the first study to
use a mobile sleep lab in which the sleep of adolescents was measured at school, via
the automated EEG-system Zeo®.
The offer of participating on a night spent with friends, sleeping in the sleep mobile
was readily accepted by a sufficient number of students. Zeo® proved to state an easily
used tool; however, unfortunately Zeo®-measurements turned out to have a consider-
able probability of being partly inaccurate when measuring REM phases, as will be
pointed out below. No relation between chronotype and sleep phases could be de-
tected in this study. Keeping in mind the circumstances of measurements being partly
unsatisfactory, these results may be subjected to re-questioning in following studies.
4.1 Students’ Chronotypes
Initially chronotypes of the participating students were identified, using the MCTQ.
The mean chronotype among participants was 4.48, which is consistent with the aver-
age general chronotype (Roenneberg, Kuehnle et al. 2007). This finding was confirmed
by the correlation that was seen between chronotype-variables of MCTQs and sleep
logs. A typical effect of “lateness” that was expected among the adolescents in opposi-
tion to the general population might have been more obvious if the students had been
on average 3 years older, since 20 year olds are known to be the latest chronotypes
(Roenneberg, Kuehnle et al. 2004). Another reason for the average chronotype to be

Discussion
56
intermediate rather than late in the present study is the size of the sample group. In a
larger group instead, such an effect would usually have been observed.
Another expectation that was assumed previously to the present study predicted a
positive correlation between chronotype-values of MCTQs and sleep logs, as this corre-
lation has been demonstrated thoroughly. In contrast to findings of Kühnle et
al.(2006) a significant correlation between MCTQs and sleep logs could be shown only
for MSFsc. No correlations were found among the other parameters measured by
MCTQ and sleep logs. This is believed to have occurred due to inadequate filling in of
sleep logs, as will be pointed out in “Strengths and Weaknesses of this Study”. It is ex-
pected that if sleep-log keeping could be optimised, the correlations between sleep-
log- and MCTQ-variables would be higher.
4.2 Chronotype and Social Jetlag
Students’ chronotypes showed an intermediate correlation with their social jetlags.
This fact is consistent with Roenneberg el al’s (2007) finding, that among individuals
who follow a similarly early schedule of getting up, those with later chronotypes will be
less in line with their internal phase. Later chronotypes will therefore have a higher
social jetlag. Adding up to this, the relation between chronotype and average sleep du-
ration was examined. It was seen that generally, the later students’ chronotypes were,
the less time they would spend sleeping on the average night. Sleep duration was
longer on free days than on school days and always decreased with increasing chrono-
type. These effects underline the impact social time schedules have on students, when
these schedules are not in line with their physiological needs.
4.3 The First Night Effect
When variances of Zeo® parameters between nights were compared in repeated meas-
ures ANOVA, no first night effect was detected. There was no significant variance
Discussion
57
among sleep-parameters between the first and second night, with an exception of the
time needed to fall asleep. This parameter was on average 4.14 min. longer in the sec-
ond night. Such a finding is unusual when compared with studies examining the first
night effect. The common finding in polysomnography would be a decrease in sleep
latency rather than an increase (Agnew, Webb et al. 1966; Curcio, Ferrara et al. 2004;
Sforza, Chapotot et al. 2008). One may argue that this increase may have been a result
of the students having a greater sleep deficit on Friday night, following a week of get-
ting up early, as compared to Saturday night, when they had already caught up on this
deficit. One may also speculate that students might have been more relaxed in the sec-
ond night, being more accustomed to the experimental setting, so that they had a ten-
dency to talk more than in the first night. Anyhow, this finding may as well have oc-
curred merely by chance, especially since the small size of the test-group would have
rendered it more vulnerable to such a mistake.
The usual standard in sleep labs is to exclude the first night’s data from further exami-
nation (Gold 2002). This is due to the common consideration that the first night is one
in which the subject has to get used to the artificial surroundings in the sleep lab. Nev-
ertheless, it should be kept in mind that the mobile sleep lab setting is not comparable
with being subjected to the rather artificially appearing surroundings in real polysom-
nography. Most students seemed to enjoy the night in the sleep mobile as a kind of
“adventure” – possibly comparable to sleeping in a camp or at a friend’s house, so that
they may not have slept as badly as it is known from first nights in real sleep labs. In
the present study thus, since it had few participants and ANOVA did not reveal any
major variance between nights, the further use of both nights for evaluation was con-
sidered to be justified.
4.4 Night Phases, Compared to other Studies
The participating students were found to have spent 3.49% of their total sleep-phase
after sleep onset awake, 29.5% in REM sleep, 47.73% in light sleep and 19.06% in deep
sleep. For convenience, the values of the present study are compared to those of other
studies in the two tables below. It has to be remarked that this comparison is limited
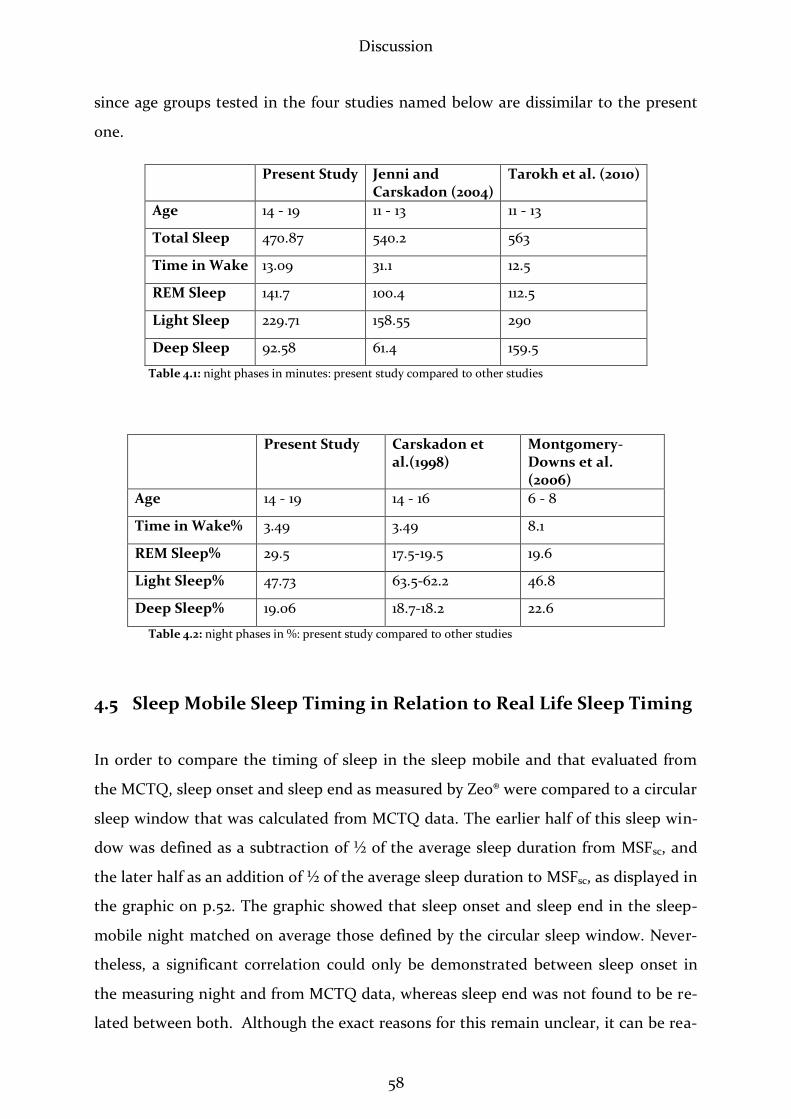
Discussion
58
since age groups tested in the four studies named below are dissimilar to the present
one.
Present Study Jenni and Carskadon (2004)
Tarokh et al. (2010)
Age 14 - 19 11 - 13 11 - 13
Total Sleep 470.87 540.2 563
Time in Wake 13.09 31.1 12.5
REM Sleep 141.7 100.4 112.5
Light Sleep 229.71 158.55 290
Deep Sleep 92.58 61.4 159.5
Table 4.1: night phases in minutes: present study compared to other studies
Present Study Carskadon et al.(1998)
Montgomery-Downs et al. (2006)
Age 14 - 19 14 - 16 6 - 8
Time in Wake% 3.49 3.49 8.1
REM Sleep% 29.5 17.5-19.5 19.6
Light Sleep% 47.73 63.5-62.2 46.8
Deep Sleep% 19.06 18.7-18.2 22.6
Table 4.2: night phases in %: present study compared to other studies
4.5 Sleep Mobile Sleep Timing in Relation to Real Life Sleep Timing
In order to compare the timing of sleep in the sleep mobile and that evaluated from
the MCTQ, sleep onset and sleep end as measured by Zeo® were compared to a circular
sleep window that was calculated from MCTQ data. The earlier half of this sleep win-
dow was defined as a subtraction of ½ of the average sleep duration from MSFsc, and
the later half as an addition of ½ of the average sleep duration to MSFsc, as displayed in
the graphic on p.52. The graphic showed that sleep onset and sleep end in the sleep-
mobile night matched on average those defined by the circular sleep window. Never-
theless, a significant correlation could only be demonstrated between sleep onset in
the measuring night and from MCTQ data, whereas sleep end was not found to be re-
lated between both. Although the exact reasons for this remain unclear, it can be rea-

Discussion
59
soned that the disturbances in the sleep mobile upon the getting up of the first of four
students were too strong to allow physiological “sleeping in” of more than one person
at a time.
4.6 Sleep-Phases In Relation to Chronotype and in Relation to
Each Other
In order to elicit the influence of chronotype on the durations of sleep phases, the pa-
rameters total sleep, time to sleep, time in wake, time in REM-, light-, deep sleep and
awakenings were tested for correlations with the chronotype and with each other. No
correlation was shown between chronotype and any of the named parameters; neither
when using MSFsc as a metrical variable in bivariate correlation, nor when dividing it
into an older and a younger chronotype group in pointbiserial correlation. There were
also no significant differences seen when performing a Mann-Whitney-U-test.
Hypothesis 1 predicted that later chronotypes would be observed to fall asleep later in
the sleep mobile, than earlier ones. Contrasting this hypothesis no correlation between
chronotype and sleep latency was detected. This is believed to be a consequence of a)
the study setting in which students were allowed to go to sleep by four persons at a
time, and b) two effects countering each other: on the one hand, later chronotypes are
well known to go to bed later than their peers (Roenneberg, Kuehnle et al. 2007). On
the other hand, the later types would be expected to have a higher sleep pressure than
the earlier types, when having similarly early getting-up schedules. These two effects
may equal each other out. In a larger group, effects may well have been observable if
they were not countering each other with the same strength. Hypothesis 1 thus has to
be refuted since it has been shown that the applied setting lacks individual opportuni-
ties of sleep-timing, thereby enlarging the risk of falsifying outcomes in sleep latency.
Hypothesis 2 stated that later chronotypes should have been observed to spend more
time sleeping in the sleep mobile overall than earlier types, due to the greater sleep
deficiency they developed throughout the preceding school-week. Since no such effect
could be observed within the applied setting, it is believed that the same argument

Discussion
60
applies for this question, as for hypothesis 1: the overall setting lacked individuality in
the election of sleep-timing. This especially applies for being allowed to go to sleep at
the same time as the other three students of the respective group and the sleep mobile
moving and making noise whenever the door would be opened, which are factors that
lead to a falsification of a commonly well-known picture. Thus hypothesis 2 has to be
refuted as well.
4.7 Correlations among Sleep Phases
Correlating Zeo®-parameters with each other, a significant relationship was found be-
tween the total duration of sleep and times spent in REM- and light sleep. This relation
may well have been expected, being founded on the common observation that the sec-
ond half of sleep consists basically of light sleep and REM sleep (Borbely 1984; Payne
and Nadel 2004; Carskadon and Dement 2005).
However, an unexpected negative correlation was seen between time in wake and time
in REM, implying either that the less time students would be awake, the more time
they would spend in REM, or that Zeo® may have overestimated REM-sleep. The latter
thesis is favoured in this case because, as will be pointed out below, there is a consid-
erable possibility for a frontal EEG of confounding the awake state with REM sleep.
The named observation is not properly supportable by the common literature. For this
reason, post-hoc hypotheses were generated and tested, as will be pointed out below.
4.8 Problems Measuring REM Sleep – Post Hoc Hypotheses
A perfection of means, and confusion of aims, seems to be our main problem.
Albert Einstein (1879-1955)
For the present study, an easy to use and inexpensive means was sought in order to
measure EEG, instead of applying classical EEGs. Indeed, Zeo® proved to fulfil the

Discussion
61
named requirements, yet unfortunately it also proved to miss the aim of yielding fully
reliable measurements, as will be pointed out.
After surprisingly among 19 out of 32 participants, sleep onset REM (SOREM) was
measured overnight, two Post-hoc hypotheses were added to the previous ones.
SOREM is usually known to appear in subjects who suffer from depression or other
psychological illnesses as well as in narcoleptics and in those who are severely sleep
deprived (AASM and Medicine 2001). Singh et al. (2006) investigated the appearance
of SOREM among the common population in Detroit/USA among 539 subjects. They
examined several variables for any influence on the appearance of this phenomenon,
finding that the only measure that appeared to be significantly associated with it was
an objectively excessive sleepiness, as measured by the multiple sleep latency test,
which is commonly applied to objectify sleepiness (Sullivan and Kushida 2008). They
conclude that “therefore, subpopulations with excessive sleepiness (e.g. shift workers,
young adults, patients with apnoea) are likely to have a greater prevalence of
SOREMPs.” In succession to the findings of Singh et al. (2006), the primary post hoc
assumption is that those students who revealed an appearance of SOREM in their Zeo®
measurements, being otherwise healthy, may have shown this alteration of what is
known as “normal sleep” due to an overall sleep deficiency (post-hoc hypothesis A).
Grounding this hypothesis, it was suspected that MSFsc may be correlated with appear-
ance of SOREM because sleep-deprived individuals (& thus later chronotypes) tend to
have more SOREM. This was not the case. There was also thought to be a negative cor-
relation between SOREM and wellbeing if SOREM occurred due to an accumulated
sleep deficiency. However, as stated above, wellbeing was filled in unsatisfactorily in
sleep logs, so that this query-item could not be evaluated properly. SOREM was further
on assumed to correlate positively with social jetlag, as an increased misalignment with
internal phase is expected to lead to an increased REM-pressure upon falling asleep.
This assumption was made because SOREM is known to appear more frequently in
sleep deprived individuals (Shaikh, Patel et al. 2010), who in turn may be sleep de-
prived as a consequence of being later chronotypes and suffering from an increased
social jetlag. Due to a lack of studies on the phenomenon of SOREM in relation to
chronotype, the expectation of SOREM to increase with increased social jetlag is one
that cannot be justified perfectly. No relation between chronotype and SOREM was

Discussion
62
found which may have been due to the overall physical and mental health of students,
who may have compensated their social jetlags well, not showing any signs of phase
disalignment. There are currently no studies available on the subject of SOREM and
social jetlag, so that argumentation on this question remains hypothetical. In order to
test more precisely for an expected relation between increased sleep deficit and in-
creased appearance of SOREM, this phenomenon was also subjected to correlation
with sleep discrepancy between schooldays & free days. If post-hoc hypothesis A was
true, individuals with SOREM would be expected to have higher sleep discrepancies
between school- and free days than those without, because they would have to recu-
perate on a higher sleep deficiency. In statistical analysis, no such relation was seen
between SOREM and sleep discrepancy. Since all tests failed to support post-hoc hy-
pothesis A, it has to be refuted. Notwithstanding, one may still consider the possibil-
ity that SOREM, rather than being a sign of any pathological or sleep deficiency-
process as it is known from adults, may be a physiological phenomenon in adolescents.
Bishop et al. (1996) found SOREM to appear in 23% out of 139 healthy young adults.
Mignot el al. (2006) detected SOREM in 7% among 556 test persons who were not nar-
coleptic. Nevertheless, both studies examined adults and the affected subjects tended
to be young males, which reduces the possibility of comparison with the present study
in which females predominated. Carskadon et al. (1998) discovered high rates of
SOREM in adolescents. This was especially the case after their school start times had
been advanced between 9th and 10th grade from 8:25 to 7:20. Whereas in 9th grade, 4 of
32 subjects manifested SOREM, this rate rose up to 12 of 25 in 10th grade. They there-
fore conclude that the appearance of SOREM is closely linked to increased sleep depri-
vation which is caused by the advance of school start time. It has to be emphasised
that all three studies mentioned above mainly investigated the occurrence of SOREM
in the Multiple Sleep Latency Test (MSLT). This test is performed in daytime, as an
objective measure of physiological sleepiness. Individuals are encouraged to sleep sev-
eral times per day, having their sleep latencies evaluated along with standard EEG
(Sullivan and Kushida 2008). Unfortunately no studies exist as to the incidence of
SOREM in the night-sleep of healthy adolescents. Tarokh et al. (2010), who performed
all-night PSG in young adolescents do not refer to any occurrence of SOREM in their
measurements. Carskadon and Jenni (2004) compared all-night PSG-measured be-

Discussion
63
tween children and young adolescents and did not report any cases of SOREM. Other
polysomnography studies that have been performed on children have neither found
increased incidences of SOREM (Coble, Kupfer et al. 1984; Montgomery-Downs,
Hawley et al. 2006). Summing up the observations in the studies named above, al-
though there is a possibility of SOREM to appear in healthy young individuals, it is
rather unlikely that this would occur as frequently as it did in the present study.
Opposing post-hoc hypothesis A, another possibility explaining the frequent appear-
ance of SOREM in sleep profiles is that Zeo® may at times be confounding REM sleep
with being awake (post-hoc hypothesis B). General considerations in support of this
assumption are pointed out in the chapter below.
4.9 Several Reasons for the Assumption that Zeo® Overestimates
REM
4.9.1 General Considerations on Measuring REM with Automated- and Classi-cal EEGs
It is well known that raw EEG-data in REM sleep tend to appear similar to those meas-
ured in awake subjects (Zschocke 2002). However, using standard EEG, there are sev-
eral ways of distinguishing these states. As such, it is the occipital electrodes of the
classical EEG that best measure α-waves and are thus the best locations to discriminate
between wakefulness and stage 1 sleep (Zschocke 2002). A common sign of tiredness
are slow eye movements. Slow eye movements are occasionally also seen in tired indi-
viduals with closed eyes. These movements disappear upon the entrance into stage 1.
Such eye movements could be confused by Zeo® with rapid eye movements. In combi-
nation with the non-specific EEG signals they may support mistaking sleepy-but-
awake-states with REM. This becomes obvious, considering that fast frontal beta-
activity may be measured in awake subjects, as well as in stage 1 and in REM sleep.
Zschocke (2002) highlights that in automated analyses of EEG there is a heightened
chance of confounding the named states. He draws the conclusion that „In order to
attain a complete overview on the electroencephalographic sleep organisation, an ap-
Discussion
64
plication of electrodes from the frontopolar to the occipital region is indispensable.” In
accordance with Zschocke, Gelisse and Crespel (2008) could demonstrate in a poly-
somnography study that individuals show similar rhythms in REM sleep as when
awake or merely drowsy. This similarity is focussed on a high alpha output during
REM, as well as in quiet rest with closed eyes.
A system similar to Zeo®, called QUISI® also works with three sensor electrodes placed
on the forehead. It was evaluated by Ehlert et al. (1998) against standard polysomno-
graphy. In their evaluation, Ehlert et al. state that: “While sleep period time, total sleep
and sleep onset latency showed high correlations, REM and slow wave sleep were gen-
erally overestimated.” Both, REM-and slow wave overestimation may have occurred
partly as a consequence of lacking occipital derivations, in which alpha and delta waves
can be measured best (Zschocke 2002). Ehlert et al. (1998) reason that their findings
may be a consequence of eye movements in awake stages during the night. These
phases, particularly when combined with low muscle potentials may be falsely recog-
nized as REM. Later studies performed by Gfullner and Siemon (2000) and Fischer et
al. (2008) agreed that although QUISI® supplied a basic impression of sleep architec-
ture, it was not able to replace common PSG, lacking its accuracy.
Another example of an automated EEG-system is the bispectral index (BIS®). Originally
developed to measure the depth of anaesthesia during surgery, this frontal EEG was
also tested for its ability to evaluate sleep stages. Like Zeo®, it is combined with EOG
and EMG. Raw data of BIS® are automatically transcribed into an index, reaching from
0 to 100 – the higher the count, the more alert the individual. Two studies (Sleigh,
Andrzejowski et al. 1999; Nieuwenhuijs, Coleman et al. 2002) had to conclude, that
although BIS® was worthwhile at approximately estimating depth of sleep, it could not
accurately classify sleep stages. Especially between REM-sleep and the awake state, a
considerable overlap was seen.
Ehlert et al. (1998) cite Herrmann and Kubicki (1984), who compared seven different
automated systems of sleep-analysis with PSG. All but one system used EOG and EMG
in addition to four EEG-channels. Herrmann and Kubicki’s (1984) findings are stated to
have shown that five of seven systems overestimated the amount of SWS, while two
underestimated it. REM-sleep was overestimated by all seven systems. Awakeness was
Discussion
65
calculated only by six of the seven systems, out of which four over– and two underes-
timated awakeness. In addition to these findings, Ehlert et al. (1998) state that most of
the literature they reviewed “showed an overestimation of REM stage and of slow wave
sleep if automatic analysis methods were compared with visual analysis according to
Rechtschaffen and Kales.”
Since Zeo.Inc. do not specify the mechanisms underlying the discrimination between
REM-sleep and awakeness, it is assumed that similar properties as in other automated
EEGs may lead to similar faults in measurement. Although its mere measures of frontal
EEG derivations may well be correct, the simple fact that an EEG has to be derived
from several cortical regions in order to be properly evaluated explains the insuffi-
ciency of frontal derivations in the accurate evaluation of sleep stages. Most impor-
tantly occipital electrodes are needed in order to complete the analysis of sleep pro-
files.
4.9.2 Specific Evidence for Zeo’s® Overestimation of REM
Examining the influence of the measured Zeo®-parameters with each other, a signifi-
cant negative correlation between time in wake and time in REM was found. This find-
ing would imply that the longer students were awake the less REM would be meas-
ured, or in other words that whenever they woke up they would have been deprived
from REM-sleep, which was rather surprising. Although there is a slight tendency in
younger adolescents to wake up out of REM-sleep (Akerstedt, Billiard et al. 2002), it is
implausible that this fact would lead to a general decline of REM sleep in those who
woke up from this stage. Therefore it is suspected that this finding may be due to
faulty discrimination of Zeo® between states of wakefulness and REM. This suspicion is
undermined by the fact that Zeo® measured sleep onset REM-phases in nearly half of
the students, despite any correlation of these phases with social jetlag or with the dis-
crepancy between sleep duration on school days and sleep duration on free days.
Another improbability is that there would have been a positive correlation between
SOREM and the duration of total sleep. This correlation may rather be regarded as a
hint to Zeo® confounding wakefulness with REM-sleep.

Discussion
66
On their website (http://www.myZeo®.com/pages/52_for_health_professionals.cfm ),
Zeo.Inc. publish several abstracts of studies performed on Zeo®. Yet unfortunately
there is no link available to any full-text-papers. The studies are listed below:
Wright K, Johnstone J, Fabregas SE, Shambroom JR. Evaluation of a Portable,
Dry Sensor-Based Automatic Sleep Monitoring System. Sleep. 2008;31
Wright K, Johnstone J, Fabregas SE, Shambroom JR. Assessment of Dry Head-
band Technology forAutomatic Sleep Monitoring. Journal of Sleep Research.
2008
Fabregas SE, Johnstone J, Shambroom JR. Performance of a Wireless Dry Sensor
System in Automatically Monitoring Sleep and Wakefulness. Sleep. 2009;32
Shambroom JR, Johnstone J, Fabregas SE. Evaluation of a Portable Monitor for
Sleep Staging. Sleep. 2009;32
Blake SK, Pittman SD, MacDonald MM, et al. Assessment of a wireless dry sen-
sor to detect sleep in healthy volunteers and subjects with sleep disorders.
Sleep. 2009;32
According to Zeo® (Fabregas 2011), these studies were all reported as abstracts at meet-
ings of the Associated Professional Sleep Societies and the European Sleep Research
Society. Zeo® claims to have been working on a full manuscript for submission, which,
however, has not yet been published.
In March 2011, after acquisition and evaluation of data for the present study had been
finished, Prof. T. Roenneberg had a personal communication at a congress with the
president of Zeo.Inc., D.P. Dickinson. Mr. Dickinson is reported to have stated that
“Zeo® never evaluated the amount of REM-sleep adequately” (Roenneberg 2011).
For all reasons named above, post-hoc hypothesis B, stating that Zeo® tends to con-
found the awake state with REM sleep is being adopted.

Discussion
67
4.10 Strengths & Weaknesses of this Study
The present study succeeded well in testing a procedure to examine the sleep of ado-
lescents in a field setting; yet the applied procedure has been shown to yield unsatis-
factory results. As a major factor, unfortunately the obtained Zeo®-measurements
proved to be too inaccurate to provide a reliable foundation for scientific research.
Having known earlier the rather suspicious fact that Zeo.Inc. had not published their
full-text results of testing Zeo® against polysomnography, one should primarily have
indulged in this approach before applying this tool in the field. It is strongly suggested
to perform serious comparisons of Zeo® against standard PSG before conducting any
further inquiries about sleep architecture with Zeo®. Special attendance should then be
paid to the amount and timing of REM sleep.
Vetter (2010) writes one chapter on the general assessment of chronotype in field stud-
ies. She addresses several criteria that may restrict the outcomes of such studies. The
first priority among these is given to the compliance of participants. For the present
study, aiming at yielding objective measurements by Zeo® to be compared with subjec-
tive measurements from MCTQ and sleep logs, compliance is regarded as being on the
same priority level as accurateness of measuring instruments. Vetter (2010) suggests
that interventions should be minimised in order to serve compliance. This is of special
importance since field studies like the present one deal with relatively small sample
sizes in which dropouts cannot be replaced easily. It is generally thought that this
study did not exceed requests to the participants. However, there may still be ways of
minimising the effort requested by them, as will be pointed out below. Vetter (2010)
remarks that: “Exact replications of such studies are not possible.” Keeping this in
mind, ways should be sought, to yield results as accurate as practicable.
A generally positive aspect of this study was that adolescents were overall very inter-
ested in the subject of sleep and chronotype, although sleep log keeping appeared to
be perceived as a burden by many of them. Consequentially the sleep logs appeared to
be a possible source of error. Most students had to be reminded numerous times to
return their sleep logs. Reminding showed to have a higher efficiency whenever it oc-
curred via the internet then via different communication pathways. Personal commu-
Discussion
68
nication with the parents of several participating students revealed that often sleep
logs would not be filled in as required. This became especially obvious in the subject of
rating their wellbeing. This query-item was not among the questions listed on the
questionnaire and thus students were asked to fill it in themselves – the compliance in
filling in this variable was regarded too low to use it for further computations (N = 19).
Such incompliance may be prevented in future studies, applying more effort initially
e.g. by establishing the possibility to fill in sleep logs online, having a direct possibility
of controlling the date and time of day on which they were filled in. Simultaneously,
students could then be reminded automatically, whenever they would forget to fill in
their sleep logs. One possibility that may be thought of, stating an incentive of compli-
ance at the same time, would be I-phones, given out to participants that might fulfil
this task (Roenneberg 2011). Obviously such proceeding would be more labour- and
cost expensive. However, sleep logs would be more reliable. A simpler enhancement on
this subject might also be to give out special prices to those who would return their
sleep logs within the appropriate time-frame.
The fact that students were generally allowed to choose their own times of going to
sleep was considered favourable. Nevertheless, this advantage was narrowed by the
fact that four students were going to sleep at the same time. Future studies on sleep
should always aim at allowing subjects to sleep throughout their personal sleep win-
dow; since e.g. sending a late chronotype to bed at 10 pm and waking them up at 6 am
would definitely not reveal what may be termed as physiological sleep.
The timing and relation of sleep phases in relation to each other within the individual
sleep architecture could theoretically have been examined as well in addition to exam-
ining the summative duration of sleep phases. However, this would have involved
highly complicated analyses, using “regular expressions”, which would have exceeded
the scope of this thesis.
Discussion
69
4.11 Follow-Up Perspectives for this Study
In studies to follow, it would be preferable to obtain raw EEG data, rather than those
already evaluated. In this way, more insights into details within the sleep-EEG of ado-
lescents could be made. Although this would certainly involve more effort, this effort
would be worthwhile as it would yield data of considerably higher quality.
Since overall the sleep-mobile setting was received well by participants, further studies
in a similar setting may be planned. As a proposal to begin with, the present study
could be iterated engaging in the sensible effort of applying classical EEGs. Further on,
a similar study could investigate the differences in parameters measured in the present
study between subjects in school time and in mid-to end-vacation time. An alternative
to this may also be to compare students who go to school at 8:00 o’clock with others
who begin school regularly on a later schedule. Shifting the emphasis to a rather medi-
cal point of view, it is also conceivable to test only subjects with certain diseases, such
as ADHD.
Feinberg and Campbell (2010), as well as Tarokh and Carskadon (2010) recommend
that more research into adolescent sleep should be performed in order to deepen un-
derstanding of the changes taking place in the adolescent brain. They suggest that
such research could best be carried out in the adolescents’ homes with easy to use
EEGs. Obviously a Zeo®-like technique would be a good means for this in order to op-
timise compliance and to permit a normal sleeping environment. However, this should
not occur unless there is valid proof for such a system of being comparable to PSG.
4.12 Conclusions
The setting of measuring student’s sleep profiles in school on weekends within the
sleep mobile was accepted well by the students and can be recommended for further
research. However, knowledge to be gained out of Zeo® measurements is rather lim-
ited, especially since no raw data may be obtained. The mere apportionment of sleep
into light sleep, REM sleep, deep sleep and awakeness does not provide enough in-
Discussion
70
sights, especially when examining the sleep of special subgroups among students like
those suffering from ADHD or from drug abuse. In these cases more detailed data
would be of interest. Thus the use of classical EEGs would be favourable. This may be
done in the same setting as in the present study. The use of classical EEGs would be
more time-consuming in applying-, as well as interpreting them; however, results ob-
tained would be of far higher quality with more details and thus providing a more pro-
found basis for new insights.
Even though Zeo® is not seen as recommendable for serious research, it may well serve
for use in health prevention programs, where it could be applied for being used by stu-
dents in order to gain insights into their own sleep architecture, thus supporting
awareness of sleep as an existential subject that deserves to attain high attention.

References
71
5 References
AASM and A. A. o. S. Medicine (2001). "The International Classification of Sleep Disorders ICSD."
Agnew, H. W., Jr., W. B. Webb, et al. (1966). "The first night effect: an EEG study of
sleep." Psychophysiology 2(3): 263-266. Akerstedt, T., M. Billiard, et al. (2002). "Awakening from sleep." Sleep Med Rev 6(4):
267-286. Anderson, B., A. Storfer-Isser, et al. (2009). "Associations of executive function with
sleepiness and sleep duration in adolescents." Pediatrics 123(4): 701-707. Anderson, N. R. and L. M. Doolittle (2010). "Automated analysis of EEG: opportunities
and pitfalls." J Clin Neurophysiol 27(6): 453-457. Angelou, M. (1928). "Everything has Rhythm. Everything Dances." from
http://thinkexist.com/quotation/everything-has-rhythm-everything-dances/347517.html.
Arendt, J. (1998). "Biological rhythms: the science of chronobiology." J R Coll
Physicians Lond 32(1): 27-35. Arendt, J. (2010). "Shift work: coping with the biological clock." Occup Med (Lond)
60(1): 10-20. Aschoff, J. (1965). "Circadian Rhythms in Man." Science 148: 1427-1432. Bech, P. (2010). "WHO-Five Well-being Index (WHO-5) ", from http://www.who-
5.org/. Benbadis, S. R. and D. R. Rielo. (2010). "Normal Sleep EEG." from
http://www.emedicine.medscape.com. Benca, R., M. J. Duncan, et al. (2009). "Biological rhythms, higher brain function, and
behavior: Gaps, opportunities, and challenges." Brain Res Rev 62(1): 57-70. Bergmann, E., D. Eis, et al., Eds. (2008). “Lebensphasenspezifische Gesundheit von
Kindern und Jugendlichen in Deutschland - Ergebnisse des Nationalen Kinder- und Jugendgesundheitssurveys (KiGGS). Beiträge zur Gesundheitsberichterstattung des Bundes. “Robert-Koch-Institut, Statistisches Bundesamt, Berlin.
Berson, D. M. (2003). "Strange vision: ganglion cells as circadian photoreceptors."
Trends Neurosci 26(6): 314-320.

References
72
Bieger, W. P. (2010). “Neuroendokrinologie des Schlafes / Schlaf - Insomnie. Pathophysiologie der Schlafregulation. “ Lab4More, Munic.
Bishop, C., L. Rosenthal, et al. (1996). "The frequency of multiple sleep onset REM
periods among subjects with no excessive daytime sleepiness." Sleep 19(9): 727-730.
Blake, S., S. Pittman, et al. (2009). "Assessment of a Wireless Dry Sensor To detect
Sleep in Healthy Volunteers and Subjects with Sleep Disorders." Sleep 32. Borbely, A. A. (1984). “Das Geheimnis des Schlafs. Neue Wege und Erkentnisse der
Forschung.” http://www.pharma.uzh.ch/static/schlafbuch/TITEL.htm Buehner, M., Ed. (2004). “Einführung in die Test- und Fragebogenkonstruktion.”, 3rd
edition, Pearson Studium, München Carskadon, M. A. and W. C. Dement. (2005). "Normal Human Sleep: An Overview."
from http://apsychoserver.psychofizz.psych.arizona.edu/JJBAReprints/PSYC50 1A/Readings/Carskadon_Dement_Normal_Human_Sleep_2005.pdf
Carskadon, M. A., K. Harvey, et al. (1980). "Pubertal changes in daytime sleepiness."
Sleep 2(4): 453-460. Carskadon, M. A., A. R. Wolfson, et al. (1998). "Adolescent sleep patterns, circadian
timing, and sleepiness at a transition to early school days." Sleep 21(8): 871-881. Coble, P. A., D. J. Kupfer, et al. (1984). "EEG sleep of normal healthy children. Part I:
Findings using standard measurement methods." Sleep 7(4): 289-303. Crowley, S. J., C. Acebo, et al. (2007). "Sleep, circadian rhythms, and delayed phase in
adolescence." Sleep Med 8(6): 602-612. Curcio, G., M. Ferrara, et al. (2006). "Sleep loss, learning capacity and academic
performance." Sleep Med Rev 10(5): 323-337. Curcio, G., M. Ferrara, et al. (2004). "Paradoxes of the first-night effect: a quantitative
analysis of antero-posterior EEG topography." Clin Neurophysiol 115(5): 1178-1188.
Darwin, C., Ed. (1859 ). “Die Entstehung der Arten durch natürliche Zuchtauswahl”,
Kröner-Verlag, Leipzig Dewald, J. F., A. M. Meijer, et al. (2010). "The influence of sleep quality, sleep duration
and sleepiness on school performance in children and adolescents: A meta-analytic review." Sleep Medicine Reviews 14(3): 179-189.
Diekelmann, S. and J. Born (2010). "The memory function of sleep." Nat Rev Neurosci
11(2): 114-126.
References
73
Edgar, D. M., W. C. Dement, et al. (1993). "Effect of SCN lesions on sleep in squirrel monkeys: evidence for opponent processes in sleep-wake regulation." J Neurosci 13(3): 1065-1079.
Ehlert, I., H. Danker-Hopfe, et al. (1998). "A comparison between EEG-Recording and
Scoring by QUISI version 1.0 and Standard PSG with Visual Scoring." Somnologie 2: 104-116.
Einstein, A. (1879-1955). "A perfection of means, and confusion of aims, seems to be our
main problem." from http://www.brainyquote.com/quotes/quotes/a/alberteins 109805.html.
Ende, M., Ed. (1973/2009). "Momo", Thienemann Verlag, Stuttgart Fabregas, S. (2011). personal communication with S. Böhm (03/01/2011) Fabregas, S., J. J, et al. (2009). "Performance of a Wireless Dry SensorSystem in
Automatically Monitoring Sleep and Wakefullness". Sleep. 32.
Fallone, G., J. A. Owens, et al. (2002). "Sleepiness in children and adolescents: clinical implications." Sleep Med Rev 6(4): 287-306.
Feinberg, I. and I. G. Campbell (2010). "Sleep EEG changes during adolescence: an
index of a fundamental brain reorganization." Brain Cogn 72(1): 56-65. Field, A. (2005). "Discovering Statistics using SPSS - and Sex Drugs and Rock'n Roll"
Sage Publications, London Fischer, F. M., R. Nagai, et al. (2008). "Explaining sleep duration in adolescents: the
impact of socio-demographic and lifestyle factors and working status." Chronobiol Int 25(2): 359-372.
Frey, S., S. Balu, et al. (2009). "Consequences of the timing of menarche on female
adolescent sleep phase preference." PLoS One 4(4): 5217. Fricke-Oerkermann, L., J. Frölich, et al. (2007). "Leitfaden Kinder- und
Jugendpsychotherapie - Schlafstörungen." Hogrefe-Verlag, Göttingen. Fuller, P. M., J. J. Gooley, et al. (2006). "Neurobiology of the sleep-wake cycle: sleep
architecture, circadian regulation, and regulatory feedback." J Biol Rhythms 21(6): 482-493.
Gangwisch, J. E., L. A. Babiss, et al. (2010). "Earlier parental set bedtimes as a protective
factor against depression and suicidal ideation." Sleep 33(1): 97-106. Gelisse, P. and A. Crespel (2008). "Slow alpha variant during REM sleep." Neurophysiol
Clin 38(1): 3-8.
References
74
Gfullner, F. and G. Siemon (2000). "[Studies with the fully automated EEG sleep analysis system QUISI]." Pneumologie 54(12): 580-583.
Gold, A. R. (2002). "Der differentialdiagnostische Nutzen der Polysomnographie bei
chronischer Insomnie - eine retrospektive Studie unter besonderer Berücksichtigung der Diagnose "Fehlbeurteilung des Schlafzustandes", Dissertation, Fakultät für Medizin, Technische Universität, München
Golombek, D. A. and R. E. Rosenstein (2010). "Physiology of circadian entrainment."
Physiol Rev 90(3): 1063-1102. Gruber, R., S. Wiebe, et al. (2011). "Impact of sleep restriction on neurobehavioral
functioning of children with attention deficit hyperactivity disorder." Sleep 34(3): 315-323.
Hackbusch, W., S. H.R., et al., Eds. (2003). “Teubner-Taschenbuch der Mathematik”,
Zeidler E, Wiesbaden. Halberg, F. (1959). "Physiologic 24-hour periodicity; general and procedural
considerations with reference to the adrenal cycle." Int Z Vitaminforsch Beih 10: 225-296.
Hale, L. (2010). "Bedtimes and the blues: evidence in support of improving adolescent
sleep." Sleep 33(1): 17-18. Hannibal, J. and J. Fahrenkrug (2006). "Neuronal input pathways to the brain's
biological clock and their functional significance." Adv Anat Embryol Cell Biol 182: 1-71.
Hastings, M. H., E. S. Maywood, et al. (2008). "Two decades of circadian time." J
Neuroendocrinol 20(6): 812-819. Herrmann, W. M. and S. Kubicki (1984). "Various techniques of computer analysis in
nocturnal sleep." Epilepsy, Sleep and Sleep Deprivation: 207-229. Hutchinson, G. E. (1957). "Concluding remarks." Yale University. New Haven,
Connecticut. Jenni, O. G. and M. A. Carskadon (2004). "Spectral analysis of the sleep
electroencephalogram during adolescence." Sleep 27(4): 774-783. Juda, M. (2010). "The Importance of Chronotype in Shift Work Research."Academic
dissertation; Institute for medicinal psychology, Ludwig Maximilians Universität, Munich.

References
75
Kantermann, T. (2008). "Challenging the human circadian clock by Daylight Saving Time and Shift-Work."Academic dissertation; Institute for medicinal psychology, Ludwig Maximilians Universität, Munich.
Keenan, S. A. (1992). "Polysomnography: technical aspects in adolescents and adults."
J Clin Neurophysiol 9(1): 21-31. Kopasz, M., B. Loessl, et al. (2010). "Sleep and memory in healthy children and
adolescents - a critical review." Sleep Med Rev 14(3): 167-177. Kuehnle, T. (2006). "Quantitative Analysis of Human Chronotypes." Academic
dissertation, Institute for medicinal psychology, Ludwig Maximilians Universität, Munich.
Kuhlman, S. J., S. R. Mackey, et al. (2007). "Biological Rhythms Workshop I:
introduction to chronobiology." Cold Spring Harb Symp Quant Biol 72: 1-6. Kumar, V. and S. Rani (1999). "Light sensitivity of the photoperiodic response system
in higher vertebrates: wavelength and intensity effects." Indian J Exp Biol 37(11): 1053-1064.
Lange, T. and J. Born (2011). "The immune recovery function of sleep - tracked by
neutrophil counts." Brain Behav Immun 25(1): 14-15. Lee, M. L., B. E. Swanson, et al. (2009). "Circadian timing of REM sleep is coupled to an
oscillator within the dorsomedial suprachiasmatic nucleus." Curr Biol 19(10): 848-852.
Mednick, S. C., N. A. Christakis, et al. (2010). "The spread of sleep loss influences drug
use in adolescent social networks." PLoS One 5(3): 9775. Mignot, E., L. Lin, et al. (2006). "Correlates of sleep-onset REM periods during the
Multiple Sleep Latency Test in community adults." Brain 129(Pt 6): 1609-1623. Mizner, W. (1876 - 1936). “The amount of sleep required by the average person is five
minutes more”, from http://www.sleepaidguide.com/quotes-about-sleep.html. Montgomery-Downs, P., E. Hawley, et al. (2006). "Polysomnographic Characteristics in
Normal Preschool and Early School-Aged Children " Pediatrics Vol. 117 No. 3 741-753.
Moore, R. Y. (2007). "Suprachiasmatic nucleus in sleep-wake regulation." Sleep Med 8
Suppl 3: 27-33. Moser, M., M. Fruhwirth, et al. (2006). "Why life oscillates - from a topographical
towards a functional chronobiology." Cancer Causes Control 17(4): 591-599.
References
76
Nieuwenhuijs, D., E. L. Coleman, et al. (2002). "Bispectral index values and spectral edge frequency at different stages of physiologic sleep." Anesth Analg 94(1): 125-129, table of contents.
Oerterer, R. and L. Montada, Eds. (2002). "Entwicklungspsychologie." BeltzPVU, Basel. Ospeck, M. C., B. Coffey, et al. (2009). "Light-dark cycle memory in the mammalian
suprachiasmatic nucleus." Biophys J 97(6): 1513-1524. Payne, J. D. and L. Nadel (2004). "Sleep, dreams, and memory consolidation: the role of
the stress hormone cortisol." Learn Mem 11(6): 671-678. Perez, A., R. E. Roberts, et al. (2010). "Disturbed sleep among adolescents living in 2
communities on the Texas-Mexico border, 2000-2003." Prev Chronic Dis 7(2): A40.
Pickard, G. E. and P. J. Sollars (2010). "Intrinsically photosensitive retinal ganglion
cells." Sci China Life Sci 53(1): 58-67. Pizza, F., S. Contardi, et al. (2010). "Sleep quality and motor vehicle crashes in
adolescents." J Clin Sleep Med 6(1): 41-45. R.E.M. (1992). “Boys in bed, girls in bed...” from "It’s a free world baby", Athens,US. Randler, C. (2009). "Young people's time of day preference affects their school
performance." Journal of Youth Studies 12, No. 6. Randler, C. (2010). "The early bird really does get the worm." Harv Bus Rev 88(7-8): 30-
31. Randler, C. and S. Bilger (2009). "Associations among sleep, chronotype, parental
monitoring, and pubertal development among German adolescents." Journal of Psychology 143(5): 509-520.
Rechtschaffen, A. and A. Kales (1973). "A Manual of Standardized Terminology,
Techniques and Scoring System for Sleep Stages of Human Subjects." from http://www.claudealbertario.info/resources/r&k.htm
Refinetti, D. R. (2011). "Dictionary of Circadian Physiology." from
http://www.circadian.org/dictionary.html. Reinoso-Suarez, F., I. de Andres, et al. (2011). "Functional anatomy of the sleep-
wakefulness cycle: wakefulness." Adv Anat Embryol Cell Biol 208: 1-128. Roane, B. M. and D. J. Taylor (2008). "Adolescent insomnia as a risk factor for early
adult depression and substance abuse." Sleep 31(10): 1351-1356.

References
77
Roenneberg, T. (2010). "Wie wir ticken - die Bedeutung der Chronobiologie für unser Leben." Dumont-Verlag, Köln.
Roenneberg, T. (2011). personal communication with S. Boehm (03/21/11). Roenneberg, T., T. Kuehnle, et al. (2007). "Epidemiology of the human circadian
clock." Sleep Med Rev 11(6): 429-438. Roenneberg, T., T. Kuehnle, et al. (2004). "A marker for the end of adolescence." Curr
Biol 14(24): R1038-1039. Roenneberg, T. and M. Merrow (2003). "The network of time: understanding the
molecular circadian system." Curr Biol 13(5): R198-207. Roenneberg, T. and M. Merrow (2007). "Entrainment of the human circadian clock."
Cold Spring Harb Symp Quant Biol 72: 293-299. Roenneberg, T., A. Wirz-Justice, et al. (2003). "Life between Clocks: Daily Temporal
Patterns of Human Chronotypes " J of Biological Rhythms 18 No. 1: 80-90. Rollag, M. D., D. M. Berson, et al. (2003). "Melanopsin, ganglion-cell photoreceptors,
and mammalian photoentrainment." J Biol Rhythms 18(3): 227-234. Sander, C. and P. Schönknecht (2011). "Störungen der Vigilanzregulation bei
depressiven Erkrankungen." Nervenheilkunde - Zeitschrift für interdisziplinäre Fortbildung, Schattauer Verlag 11/2011.
Saper, C. B., G. Cano, et al. (2005). "Homeostatic, circadian, and emotional regulation
of sleep." J Comp Neurol 493(1): 92-98. Saper, C. B., T. E. Scammell, et al. (2005). "Hypothalamic regulation of sleep and
circadian rhythms." Nature 437(7063): 1257-1263. Sforza, E., F. Chapotot, et al. (2008). "Time of night and first night effects on arousal
response in healthy adults." Clin Neurophysiol 119(7): 1590-1599. Shaikh, W. A., M. Patel, et al. (2010). "Association of sleep duration with arterial blood
pressure profile of gujarati Indian adolescents." Indian J Community Med 35(1): 125-129.
Shambroom, J., J. J, et al. (2009). “Evaluation of a Portable Monitor for Staging Sleep”
Sleep. 32. Sibley, K. M., G. Mochizuki, et al. (2010). "The relationship between physiological
arousal and cortical and autonomic responses to postural instability." Exp Brain Res 203(3): 533-540.
References
78
Singh, M., C. L. Drake, et al. (2006). "The Prevalence of Multiple Sleep-Onset REM Periods in a Population-Based Sample." Sleep.
Sisk, C. L. and D. L. Foster (2004). "The neural basis of puberty and adolescence." Nat
Neurosci 7(10): 1040-1047. Sleigh, J. W., J. Andrzejowski, et al. (1999). "The bispectral index: a measure of depth of
sleep?" Anesth Analg 88(3): 659-661. Smetacek, V. (2010). "Recalibrating sleep: is recalibration and readjustment of sense
organs and brain-body connections the core function of sleep?" Med Hypotheses 75(4): 401-404.
Stern, E., M. S. Grabner, et al., Eds. (2007). "Lehr-Lern-Forschung und
Neurowissenschaften - Erwartungen, Befunde, Forschungsperspektiven." Bundesministerium für Bildung und Forschung, Referat Öffentlichkeitsarbeit, Bonn.
Sullivan, S. S. and C. A. Kushida (2008). "Multiple sleep latency test and maintenance
of wakefulness test." Chest 134(4): 854-861. Tarokh, L. and M. A. Carskadon (2010). "Developmental changes in the human sleep
EEG during early adolescence." Sleep 33(6): 801-809. Tarokh, L., M. A. Carskadon, et al. (2010). "Developmental changes in brain
connectivity assessed using the sleep EEG." Neuroscience 171(2): 622-634. Taylor, D. J. and A. D. Bramoweth (2010). "Patterns and consequences of inadequate
sleep in college students: substance use and motor vehicle accidents." J Adolesc Health 46(6): 610-612.
Toscani, M., T. Marzi, et al. (2010). "Alpha waves: a neural signature of visual
suppression." Exp Brain Res 207(3-4): 213-219. Tran, Y., R. A. Thuraisingham, et al. (2009). "Evaluating the efficacy of an automated
procedure for EEG artifact removal." Conf Proc IEEE Eng Med Biol Soc 2009: 376-379.
Trepel, M., Ed. (2004). “Neuroanatomie - Struktur und Funktion”, Urban & Fischer
Munic. Unknown. (2011). "I'm not asleep... but that doesn't mean I'm awake." from
http://www.sleepaidguide.com/quotes-about-sleep.html. Vetter, C. (2010). "Clocks in Action - Exploring the impact of internal time in real life."
Academic dissertation; Institute for medicinal psychology, Ludwig Maximilians Universität, Munich.
References
79
Voss, U. (2004). "Functions of sleep architecture and the concept of protective fields." Rev Neurosci 15(1): 33-46.
Weiss, A., F. Xu, et al. (2010). "The association of sleep duration with adolescents' fat
and carbohydrate consumption." Sleep 33(9): 1201-1209. Weiß, C. (2008). “Basiswissen Medizinische Statistik”, Springer-Verlag, Heidelberg. Whitford, T. J., C. J. Rennie, et al. (2007). "Brain maturation in adolescence: concurrent
changes in neuroanatomy and neurophysiology." Hum Brain Mapp 28(3): 228-237.
Wittmann, M., J. Dinich, et al. (2006). "Social jetlag: misalignment of biological and
social time." Chronobiol Int 23(1-2): 497-509. Wolfson, A. R. and M. A. Carskadon (1998). "Sleep schedules and daytime functioning
in adolescents." Child Dev 69(4): 875-887. Wolfson, A. R. and M. A. Carskadon (2003). "Understanding adolescents' sleep patterns
and school performance: a critical appraisal." Sleep Med Rev 7(6): 491-506. Yen, C. F., B. H. King, et al. (2010). "The association between short and long nocturnal
sleep durations and risky behaviours and the moderating factors in Taiwanese adolescents." Psychiatry Res 179(1): 69-74.
Young, M. W. and S. A. Kay (2001). "Time zones: a comparative genetics of circadian
clocks." Nat Rev Genet 2(9): 702-715. Zavada, A., M. C. Gordijn, et al. (2005). "Comparison of the Munich Chronotype
Questionnaire with the Horne-Ostberg's Morningness-Eveningness Score." Chronobiol Int 22(2): 267-278.
Zeo.Inc. (2010). "5 Steps to Phasing Sleep." from http://blog.myzeo.com/5-steps-to-
phasing-sleep/. Zeo.Inc. (2010). "ZQ defined." from http://www.myzeo.com/sleep/knowledge-
center/articles/whats-your-zq Zschocke, S., Ed. (2002). "Klinische Elektroenzephalographie." Springer-Verlag, Berlin. Zulley, J. and B. Knab, Eds. (2003). "Unsere Innere Uhr.", Herder, Freiburg.
Acknowledgements
80
6 Acknowledgements
6.1 To Colleagues, Friends and Family
I would like to thank the following people for their help in realising this work:
My advisor Prof. Till Roenneberg for his delighting and entertaining ability to inspire
one’s interest in science and especially in circadian science as a basic enquiry into the
questions of life. My tutor Ildiko Meny for initiating the project with enthusiasm and
creativity. My tutor Céline Vetter for the patience of talking through the proceedings
over and again, always having time and a good advice. Alexandra Obermayr for helping
out with the tiring and time-consuming task of typing sleep log-entries into Excel files.
Karla Allebrand, being my first contact-person in the Institute of Medical Psychol-
ogy/LMU, who always helped out wherever there was any question. Manfred Gödel for
frequently helping out with technical advice. All people in the department for chrono-
biology in IMP/LMU for their consistent help with small, yet important things. My fi-
ancé Felix Engemann who via his work as a school-psychologist helped to initiate my
contacts with schools and who enlightened my insights into Excel and formatting pro-
grams. My parents for encouraging me in searching for an interesting subject to write
a thesis on – this was the most interesting subject I could have found! Family Enge-
mann for providing quiet and comfortable space and food for writing whenever neces-
sary. I would also specially like to thank the trees that served for providing the largest
amount of paper I have ever used in one work.
6.2 To Schools and Participants
Without the schools and all their members who welcomed me warmly and helped out
wherever possible, this project would not have been realisable. My special thanks go
to the following people:

Acknowledgements
81
Spessart Gymnasium Alzenau: The headmaster, Mr. Sommer, who was very open to
circadian research, always aiming at making school a perfect place to live-and learn in
wholeheartedly for both, students and teachers. Thank you also for wonderful conver-
sations! The caretaker Mr. Klüber for for supplying keys and helping out with electric-
ity and sanitary facilities. All biology teachers who allowed me to “invade” their classes
and focus the subject on chronobiology and the present study. All teachers who wel-
comed me warmly and discussed the project with great interest in the evenings. Of
course my greatest thanks pertain to the participating pupils: it was really fun to work
with you!
E.T.A. Hoffmann Gymnasium Bamberg: The headmaster, Mr. Schubert, who had
great interest in offering one further activity (among many others) to the students in
order to raise their interest in science. I felt wonderfully welcomed by you! The
school-psychologist Mr. Schuckert, who offered his psychology-class to me for giving a
lesson in chronobiology and recruiting participants for the present study. The care-
taker Mr. Neukam for helping out with electricity when there was no light. Finally
again greatest thanks to the pupils who participated – I enjoyed the time with you all
very much!

Deutsche Zusammenfassung
82
7 Deutsche Zusammenfassung
Es ist allgemein bekannt und durch Studien belegt, dass Adoleszenten die Altersgrup-
pe mit dem spätesten Chronotyp in der Gesellschaft darstellen. Sie gehen
physiologischerweise später schlafen und stehen später auf, als die meisten Menschen
anderer Altersgruppen. Gleichzeitig stellen Adoleszenten die Altersgruppe dar, welche
die meiste Zeit mit Lernen verbringt, um sich (in der Schule) auf das spätere (Berufs-)
Leben vorzubereiten. Da die von den meisten Schulen in Deutschland eingeforderten
Zeiten des Schulbeginns um 8:00 Uhr eher denen früherer Chronotypen entsprechen,
gehören Adoleszenten neben Schichtarbeitern zu der Altersgruppe mit dem höchsten
Schlafmangel.
Es ist inzwischen anerkannt, dass gesunder Schlaf sowohl eine (der gesunden Ernäh-
rung und dem Sport ebenbürtige) Säule der Gesundheit und des Wohlbefindens dar-
stellt, als auch eine entscheidende Rolle in der Konsolidierung von Gedächtnisinhalten
spielt. Deshalb erscheint es wünschenswert, das Schlafverhalten von Jugendlichen zu
optimieren. Hieraus ergibt sich als Konsequenz, dass die Zusammenhänge zwischen
Chronotyp und Schlaf bestmöglich verstanden werden sollten, um neue Erkenntnisse
zur Gestaltung von Gesundheitspräventionsprogrammen – speziell an Schulen - her-
anzuziehen.
Das Ziel war, einen weiterführenden Baustein für derartige Forschung darzustellen.
In einem explorativen Ansatz sollte eine Methode untersucht werden, mit welcher der
Schlaf “im wirklichen Leben”, in einer Feldstudie untersucht werden könnte. Hierzu
sollte eine einfache und kostengünstige Weise getestet werden, um Hypnogramme von
Schülern in einem mobilen Schlaflabor (“Schlafmobil”) unmittelbar in ihren Schulen
zu ermitteln. Das mobile, automatisierte und leicht anwendbare EEG-System Zeo® er-
schien diesem Anspruch gerecht zu werden. Kabellos und mithilfe eines mit drei fron-
talen Elektroden versehenen Stirnbandes wertet dieses System unmittelbar die folgen-
den Schlafparameter aus: Gesamtschlafdauer, Schlaflatenz, Wach-Zeit nach dem Ein-

Deutsche Zusammenfassung
83
schlafen, Leichtschlaf (Statium 1 + 2), Tiefschlaf (Stadium 3 + 4) und REM-Schlaf. So-
mit müssen rohe EEG-Daten nicht mehr manuell ausgewertet werden.
Nach Erhalt der Hypnogramme wurden deren Daten mit den Chronotypen der Schüler
korreliert. Hierzu erfolgte eine Untersuchung der genannten Schlaf-Parameter auf ihre
Gesamtdauer in Relation zum Chronotyp. Außerdem wurden jw. die Gesamtdauern
der Schlafphasen während einer Nacht miteinander korreliert. Vor Ableitung des
Schlafprofils an jeweils zwei aufeinanderfolgenden Nächten pro Schüler wurde jeweils
anhand des Münchener Chronotyp-Fragebogens der Chronotyp des Probanden ermit-
telt. Um diesen zu validieren und einen Einblick in das Schlafverhalten des jeweiligen
Probanden während der Testphase zu gewinnen, wurden für jw. 14 T. Schlaftagbücher
geführt.
Die Hauptfragestellung war, ob grundlegende chronobiologische Erkenntnisse über
Schlafzeiten und –Phasen im Rahmen dieses Studiensettings mithilfe der Zeos® wie
erwartet reproduzierbar wären.
Ein normalerweise in Schlaflaboren beobachteter First-Night-Effect konnte in einer
Gegenüberstellung beider Nächte durch eine Messwiederholungs ANOVA nicht darge-
stellt werden, so dass für weitere Untersuchungen die erste und zweite Nacht herange-
zogen wurde.
Die erste Erwartung, dass spätere Chronotypen in genanntem Versuchsaufbau später
einschlafen und aufwachen würden, als frühere Chronotypen, ließ sich nicht bestäti-
gen. Auch die zweite Erwartung, dass spätere Chronotypen aufgrund eines erhöhten,
unter der Schulwoche angesammelten Schlafdefizits einen längeren Gesamtschlaf auf-
weisen würden, um dieses Defizit aufzuholen, wurde nicht beobachtet. Beide Ergeb-
nisse könnten Auswirkungen des Versuchsaufbaus sein, in welchem jeweils vier Schü-
ler zur gleichen Zeit im Schlafmobil übernachteten, so dass es einem Schüler kaum
möglich war, aufzustehen- oder schlafen zu gehen, ohne dabei die anderen zu wecken.
Es wurde keine Korrelation zwischen dem Chronotyp und der Gesamtlänge der ge-
nannten Schlafparameter beobachtet. Schlafbeginn und –Ende wurden mit einem aus
dem MCTQ und Schlaftagebüchern errechneten zirkulären 24-h-Schlaffenster abgegli-
chen. Während der mit Zeo® gemessene Einschlafzeitpunkt mit dem Errechneten kor-

Deutsche Zusammenfassung
84
relierte, konnte keine Korrelation zwischen gemessenem und errechnetem Aufwach-
zeitpunkt aufgezeigt werden.
Eine unerwartete Auffälligkeit bei mehr als der Hälfte der Hypnogramme war, dass
Schüler mit einer REM-Phase einzuschlafen schienen, statt erwartungsgemäß mit einer
Leichtschlafphase. Unter der Testung der Gesamtlängen der einzelnen Schlafphasen
auf Korrelationen untereinander zeigten sich folgende Ergebnisse:
Die Gesamtschlafdauer korrelierte positiv mit der Leichtschlaf-Dauer.
Die Gesamtschlafdauer korrelierte positiv mit der REM-Dauer.
Die Wach-Zeit nach dem Einschlafen korrelierte negativ mit der REM-Dauer.
Auch die letztere Feststellung war unerwartet, da nicht davon ausgegangen werden
konnte, dass nächtliche Aufwachphasen zu einer Verminderung des REM-Schlafes füh-
ren sollten. Aufgrund der unerwarteten Beobachtungen bezüglich des REM-Schlafes
wurde die Post-Hoc-Hypothese entwickelt, nach welcher Zeo® dazu neigt, Wachsta-
dien und REM zu verwechseln. Dies erschien nach weiterer Literaturrecherche sehr
wahrscheinlich, zumal 1) der im EEG frontal gemessene REM-Schlaf dem Wach-
Stadium sehr ähnelt, und alpha-Wellen, die dem entspannten Wachstadium mit ge-
schlossenen Augen entsprechen, am besten dorsal abgeleitet werden können. 2) sämt-
liche Studien, nach denen Zeo® hoch mit herkömmlicher Polysomnographie korreliere,
nur als Abstracts existieren und bisher nicht veröffentlicht wurden. Zudem wurden
gegen Ende dieser Studie mündliche Mitteilungen von Zeo® bekannt, nach denen die
Hardware der Geräte keine perfekte Beurteilung von REM-Phasen gewährleisten kön-
ne.
Schlussfolgernd kann festgestellt werden, dass der angewendete Studienaufbau des
Erstellens von persönlichen Schlafprofilen bei Übernachtung im Schlafmobil grund-
sätzlich gut von den Schülern angenommen wurde und somit für nachfolgende Studi-
en empfohlen werden kann. Eine Einschränkung diesbezüglich betrifft die Auswertung
der Gesamtschlafdauer, bzw. des Einschlaf- und des Aufwachzeitpunktes, welche
durch das gemeinsame Schlafengehen und Aufstehen ent-individualisiert werden. Von
der weiteren Benutzung von Zeo® im Rahmen wissenschaftlicher Studien muss dahin-
gegen abgeraten werden. Sinnvoll erscheint die Wiederholung dieser Studie mit klassi-
Deutsche Zusammenfassung
85
schen EEGs. Obwohl diese im Vergleich zu Zeo® eine erhebliche Erhöhung des Ar-
beitsaufwandes durch Anbringen und manuelle Auswertung mit sich ziehen würden,
wäre dennoch simultan die Verlässlichkeit der Daten wesentlich erhöht. Zudem wäre
eine größere Datenmenge erhältlich, da die rohen, unausgewerteten Daten eine
Grundlage für eine verfeinerte Prüfung darstellen würden. Indessen kann Zeo® als ein
durchaus verwendbares Gerät zur Schlaferziehung in Gesundheitspräventionspro-
grammen betrachtet werden, in denen es weniger darum geht, verlässliche Daten zu
erhalten, und mehr, auf einfache Weise den Blick auf den eigenen Schlaf, seine Struk-
tur und seine Wichtigkeit zu schärfen.

Abstract of the Present Thesis
86
8 Abstract of the Present Thesis
As it is commonly known and confirmed by several studies, adolescence is the time in
life that goes along with being the latest chronotype in community. This implies that
physiologically adolescents tend to go to sleep later and get up later than other age
groups. At the same time adolescents are the age group who spend the highest amount
of time studying (at school), in order to prepare for their later (working) life. Since the
usually requested school start times in Germany around 8:00 a.m. rather meet the
needs of earlier chronotypes than those of normal- and later ones, adolescents and
shift workers belong to the groups with the largest sleep deficit.
There is a recognition that healthy sleep (adjacent to healthy nutrition and physical
exercise) states one pillar of health and wellbeing, as well as playing a role in the con-
solidation of memory. For this reason it appears worthwhile to aim at optimising sleep
behaviour and –circumstances in adolescents. Consequently the relations between
chronotype and sleep should be understood, in order to gain new insights for the con-
ductance of health prevention programs; especially in schools. The aim was to create
one building block for such research. Thus the present study aspired to finding a
method of examining the sleep of adolescents “in real life” via a field study with a
mainly explorative approach. In order to do so, a simple and cost-effective method was
sought, to obtain hypnograms of students in a mobile sleep lab at their school. The
mobile, automated and easy to use EEG “Zeo®” was elected since it appeared to be an
ideal tool for meeting the requests of the present study. This device consists of a head-
band with three frontal electrodes and a base station that records, inter alia, the fol-
lowing sleep parameters: total sleep, sleep latency, time awake after falling asleep, light
sleep (stage 1 and 2), deep sleep (stage 3 and 4) and REM sleep. These are interpreted
automatically so that no more manual evaluation of raw EEG-data has to be per-
formed.
After hypnograms were obtained, their data were assessed in relation with the stu-
dents’ chronotypes. To do so, the total duration of the respective named sleep parame-
ters were correlated with the chronotypes. Total durations of the respective sleep
phases were also correlated with each other. Prior to deducing EEGs on two consecu-

Abstract of the Present Thesis
87
tive nights per student, the chronotype of each participant was determined via the
Munich Chronotype Questionnaire. In order to validate the obtained data and gain
further insights into the individual sleeping-behaviour of participants, these were
asked to fill in sleep logs for two weeks during the test-phase.
The main question of this thesis was weather common chronobiological expectations
about sleep timing and –phases could be replicated in the sleep-mobile-setting, using
Zeo®.
In opposition to the usual observance in sleep-labs, no first night effect was seen be-
tween the first- and second nights in repeated measures ANOVA. For this reason both
nights were used for further analysis in this study.
The first hypothesis was that later chronotypes would be observed to fall asleep later in
the sleep mobile, and wake up later. This hypothesis could not be confirmed. Similarly
the second hypothesis, which expected later chronotypes to be observed to spend
more time overall sleeping in the sleep mobile than earlier types, because they would
have to catch up on their accumulated sleep deficit throughout the week, could not be
approved. Both outcomes may be influenced by the study’s set-up in which respec-
tively four students slept in the sleep mobile at the same time. Thus there hardly was a
possibility for one student to get up or go to sleep without waking up the others.
No correlation was seen between chronotype and the total duration of the above
named sleep parameters. Sleep onset and sleep end were compared to an MCTQ- and
sleep-log-deduced 24-h-sleep window. While sleep onset, as measured by Zeo® was
correlated with the calculated value, no such correlation could be shown between cal-
culated- and measured values for sleep end.
An unexpected finding in half of the hypnograms was that students were observed to
have fallen asleep via a REM-phase rather than via a light sleep phase, as usual. Testing
for correlations between the total durations of sleep phases, the following observations
were made:
Total sleep showed a positive correlation with light sleep.
Total sleep showed a positive correlation with REM sleep.

Abstract of the Present Thesis
88
Time awake after falling asleep showed a negative correlation with REM sleep
The latter discovery was unexpected, since there is no explanation as to why wake-up
phases throughout the night might lead to a decline in REM-sleep. Due to the named
unexpected findings regarding REM sleep, a post-hoc hypothesis was generated. This
hypothesis assumes that Zeo® tends to confound wakefulness with states of REM. Fur-
ther literature research showed a high probability of this hypothesis being correct,
since 1) the frontal EEG-deductions during REM-sleep are rather similar to those de-
ducted during wakefulness, whereas alpha-waves that can be observed in relaxed,
awake test-persons with closed eyes are ideally deducted in the dorsal regions of the
head. 2) all studies in which Zeo’s® output is claimed to have a high correlation with
classical polysomnography exist only as abstracts and have not yet been published
completely. Furthermore, towards the end of the present study, oral communication
with Zeo® approved that the device’s hardware could not facilitate a perfect evaluation
of REM-phases.
In retrospection the setting of measuring student’s sleep profiles in school on week-
ends within the sleep mobile was accepted well by students and can be recommended
for further research. A limitation in this regard is the analysis of total sleep, sleep onset
and sleep end that are being de-individualised by the collective residence of students
in the sleep mobile. A further use of Zeo® for scientific purposes cannot be advised,
while a repetition of the present study with classical EEGs is regarded to be commend-
able. Although such proceeding would include a higher workload in applying and
manually evaluating EEGs, the reliability of data would be considerably higher.
Moreover, the raw, unevaluated data that would be obtained could be used for a re-
fined evaluation. In the meantime Zeo® may well serve for use in health care programs,
where it could be applied for individuals to gain insights into their own sleep, its struc-
ture and importance.
Appendices
89
9 Appendices
9.1 Consent Form for Students Younger than 18 Years

Appendices
90
Appendices
91
9.2 Consent Form for Students Older than 18 Years

Appendices
92
Appendices
93
9.3 Consent Form for the Publication of Fotos
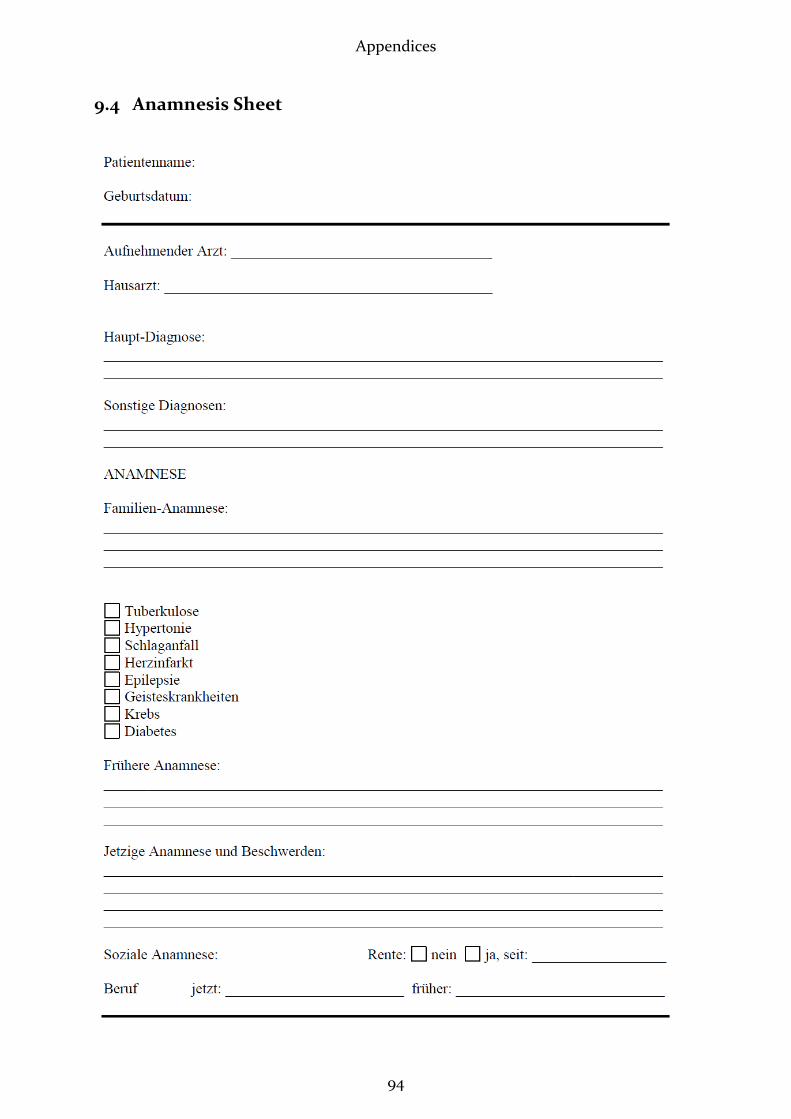
Appendices
94
9.4 Anamnesis Sheet
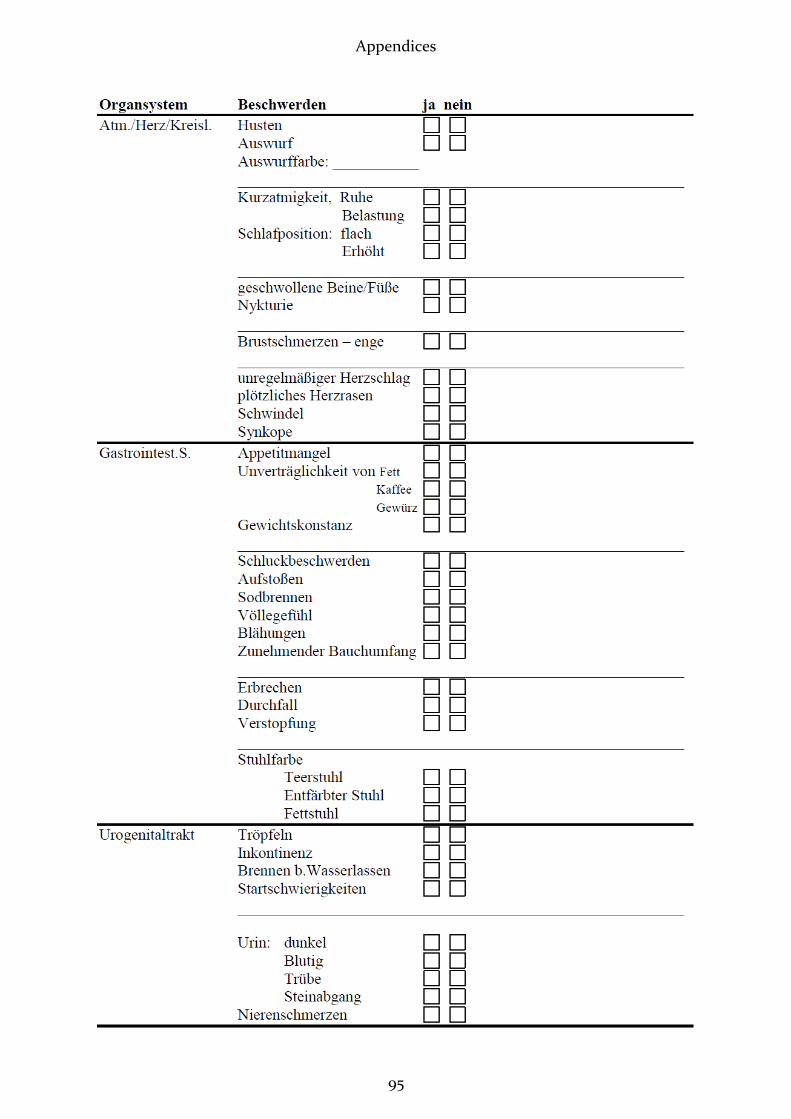
Appendices
95

Appendices
96
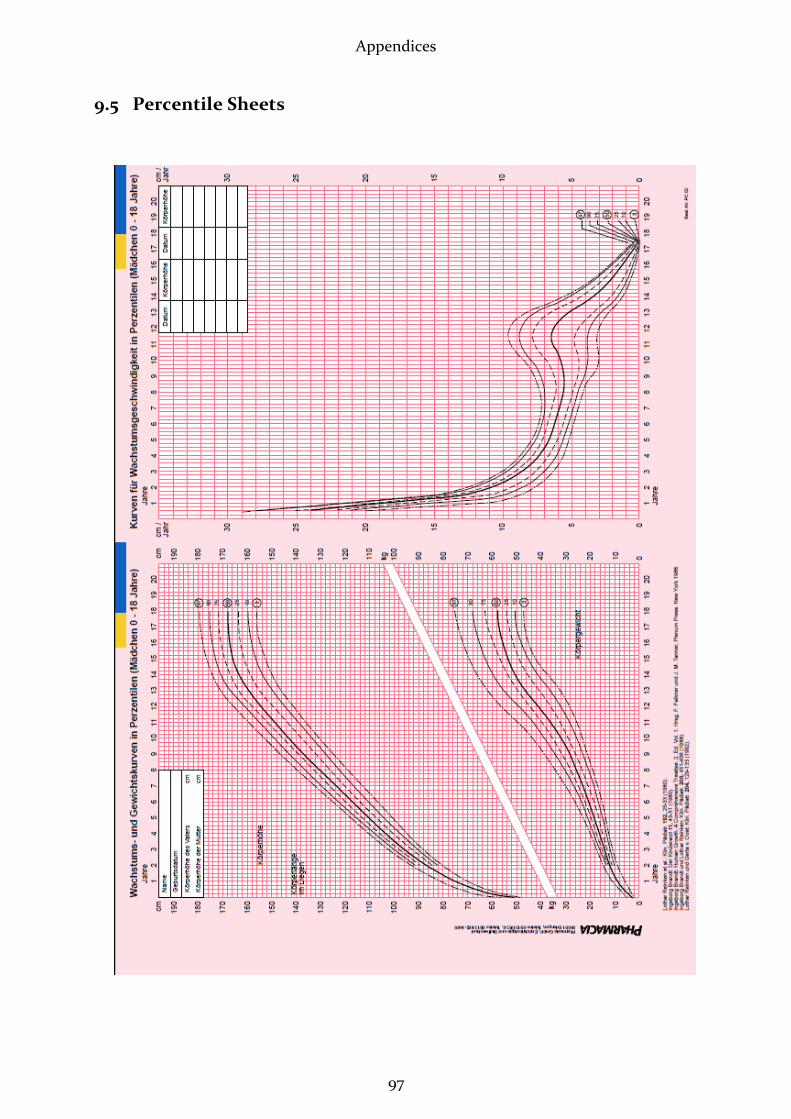
Appendices
97
9.5 Percentile Sheets
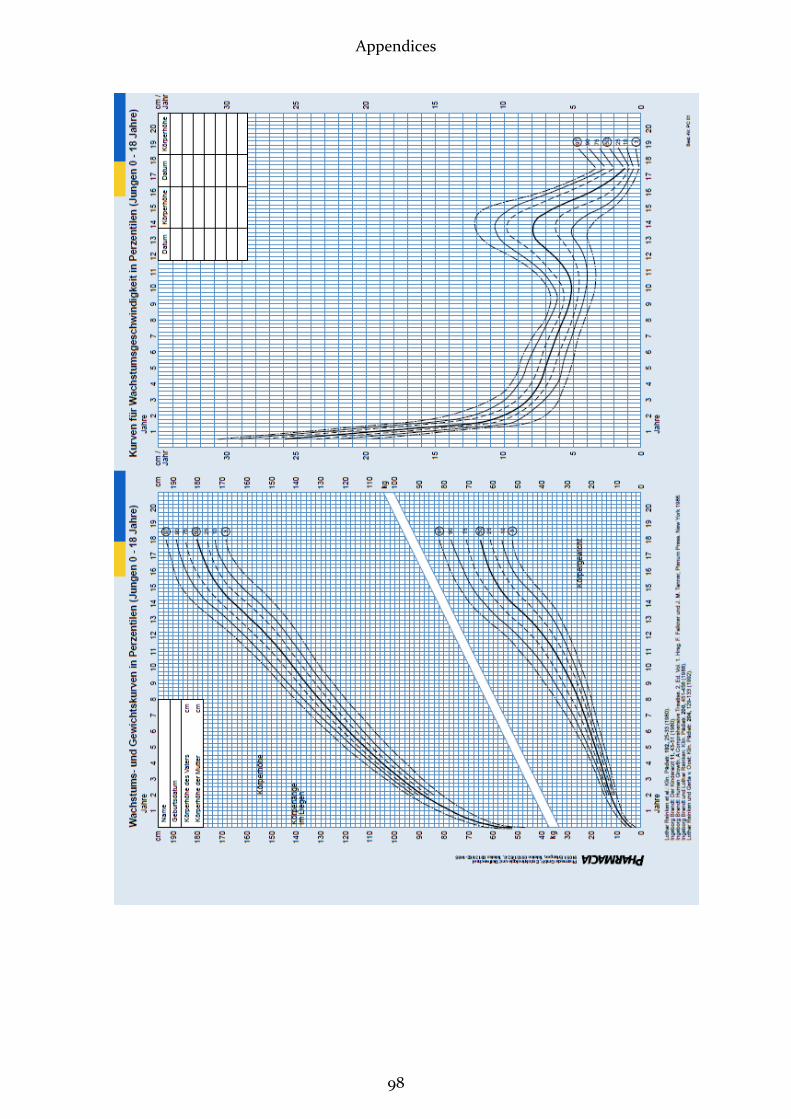
Appendices
98
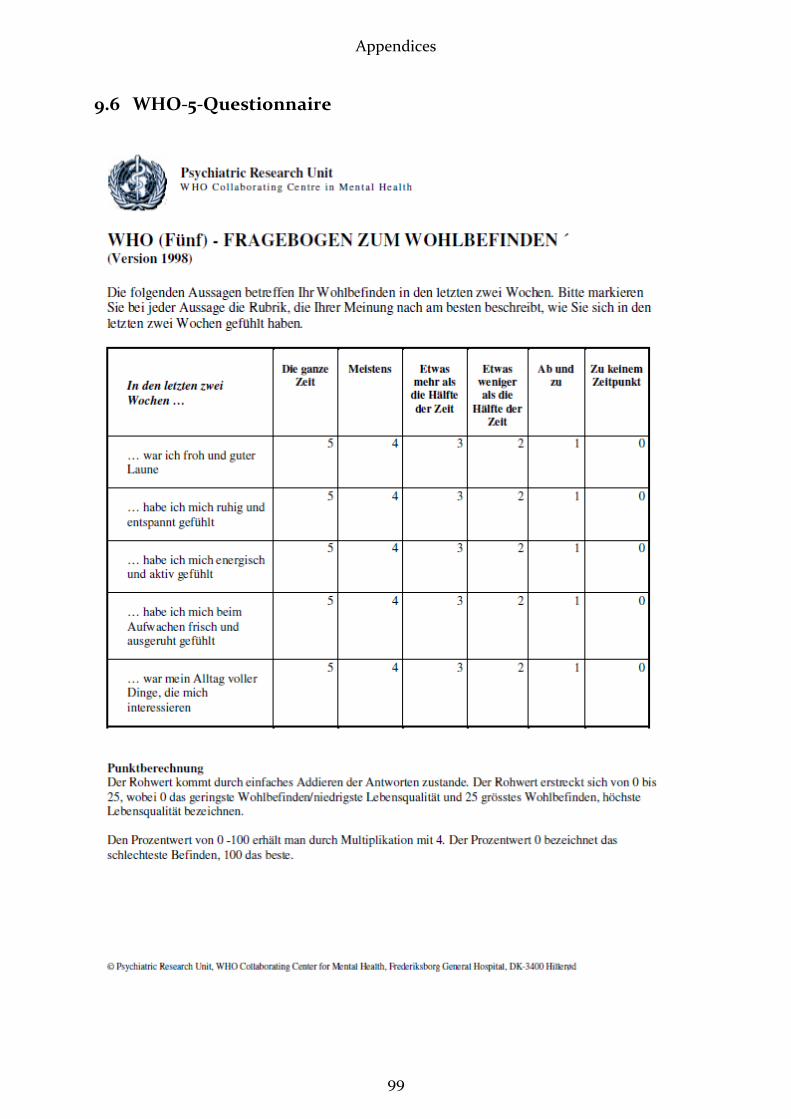
Appendices
99
9.6 WHO-5-Questionnaire
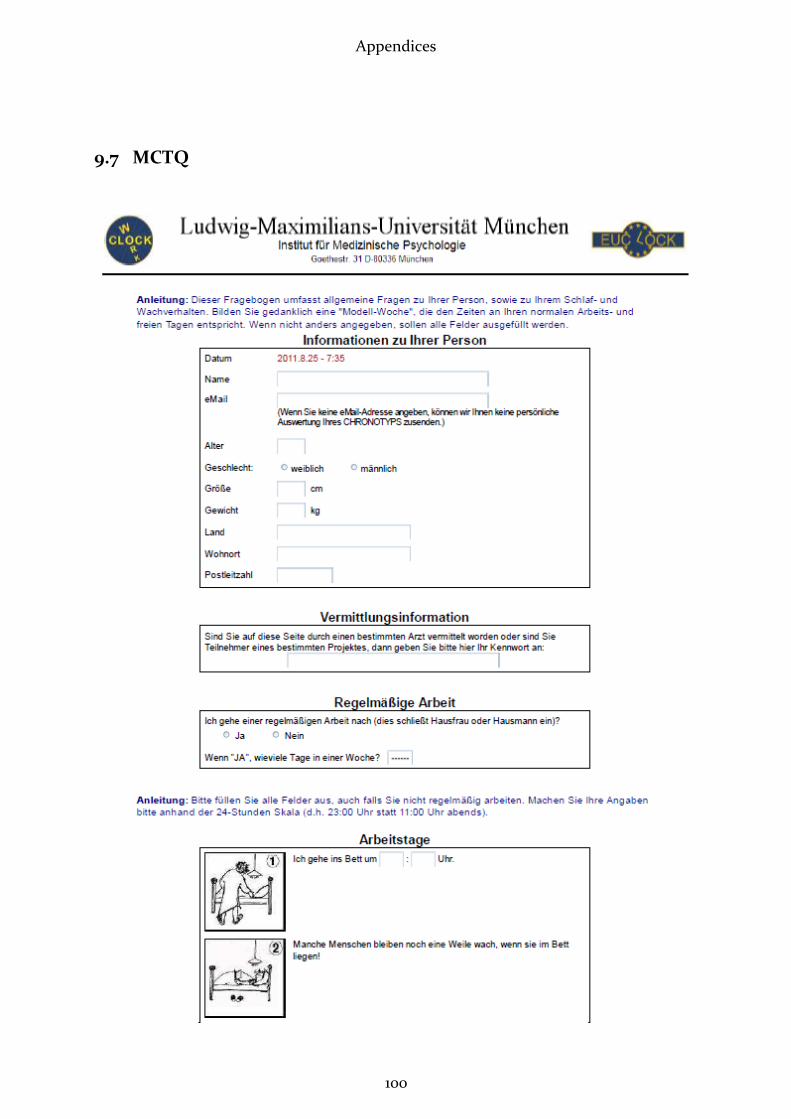
Appendices
100
9.7 MCTQ
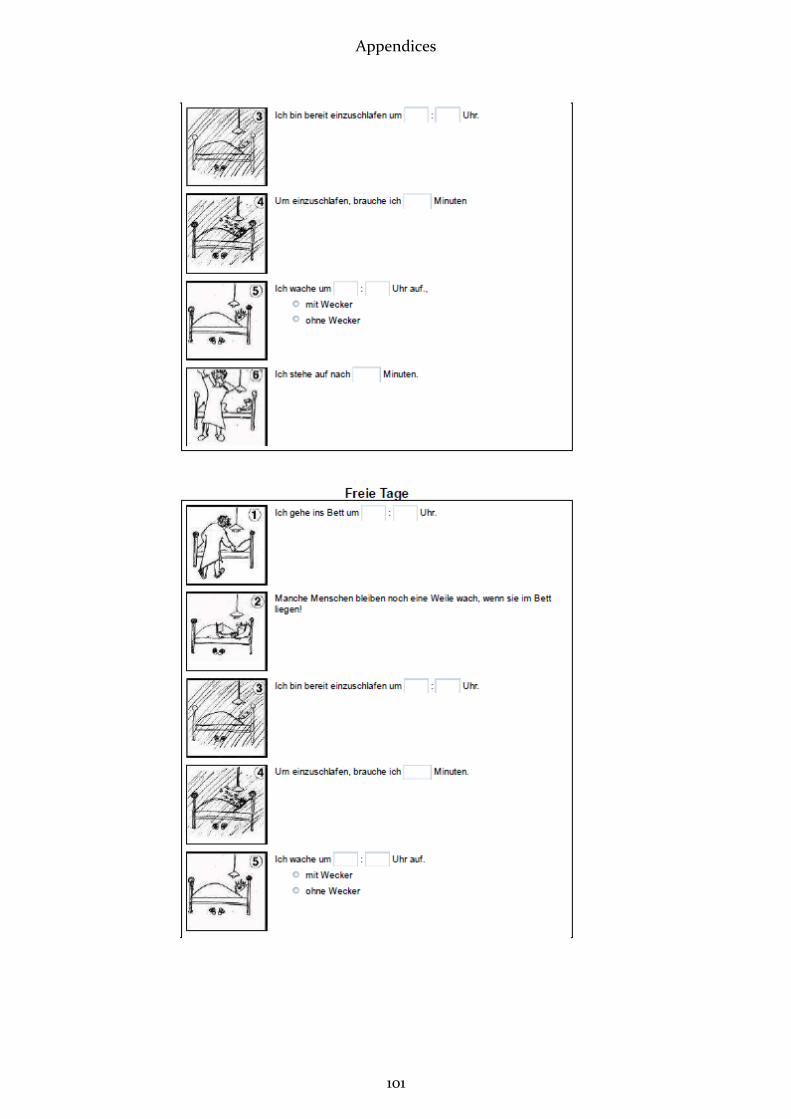
Appendices
101

Appendices
102

Appendices
103
9.8 Students’ MCTQ

Appendices
104
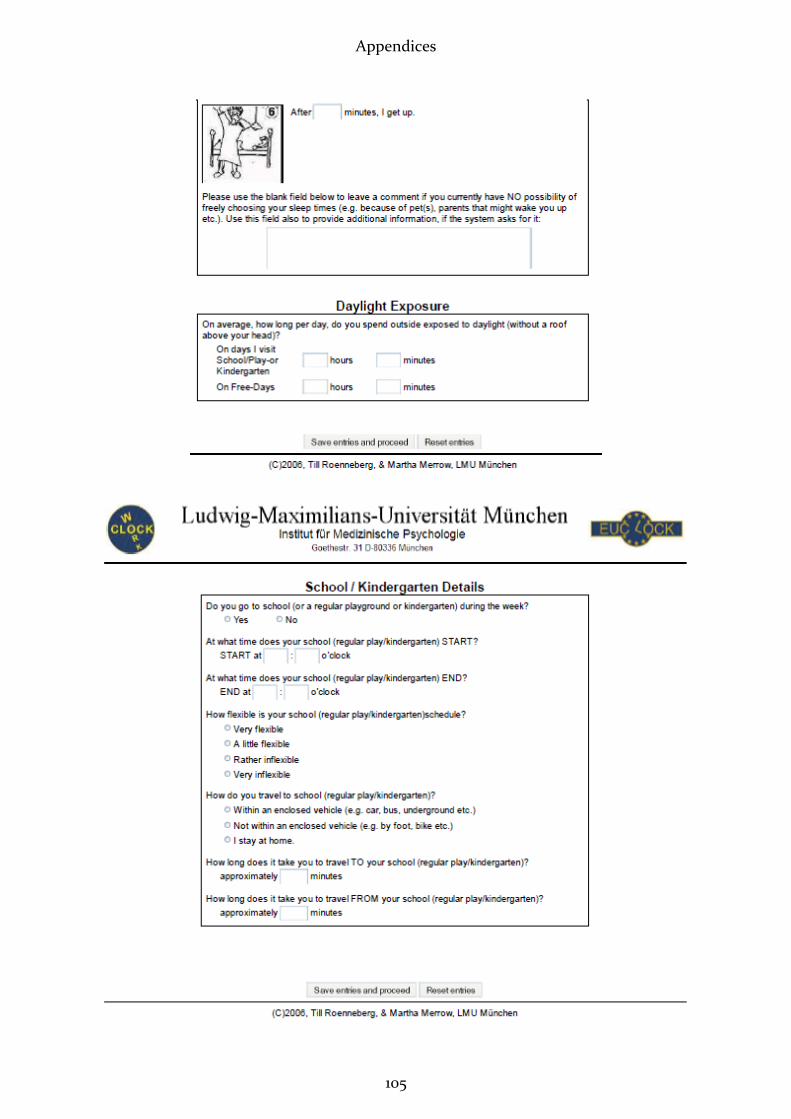
Appendices
105

Appendices
106
9.9 Sleep Log
List of Abbreviations
107
10 List of Abbreviations
An abbreviation followed by _w stands for “on workdays“, while _f abbreviates “on
free days”, respectively. An ending on _cor stands for corrected values. For average val-
ues, the common symbol Ø is used. Abbreviations may also end on _MCTQ, _Zeo, or
_SL (= Sleep log), depending on the source of the named item. The following abbrevia-
tions are listed in alphabetical order:
Al Alarm
ANOVA Analysis of variance
Aw Awakenings
ARAS Ascending arousal system
BT Bed-time
BIS Bispectral index
EN End of night
EOG Electrooculogram
EEG Electroencephalogram
GABA Gamma-amino-butyric acid
ipRGC Intrinsically photosensitive Retinal Ganglion Cells
LE Light exposure
LO Lights out MS Mid sleep
MSF Mid sleep on free days
MSFsc Mid sleep on free days corrected for sleep debt on work days
MSFsasc Mid sleep on free days corrected for sleep dept on work days, age and sex.
MSLT Multiple Sleep Latency Test
MSW Mid sleep on work days
PSG Polysomnography
rANOVA Repeated measures ANOVA (q.v. ANOVA)
REMP REM-phase

List of Abbreviations
108
SC Sleep cycle SD Sleep duration
SE Sleep end / “rise time”
ØSD Average weekly sleep duration SD Sleep duration
SDSORT Sleep-phase duration from sleep onset to rise time SE Sleep end
SI Sleep inertia
SJL Social jetlag
SL Sleep latency
SN Start of night
SO Sleep onset
SOREM Sleep onset REM
SWS Slow wave sleep
Stdev. Standard deviation
TID Time in deep sleep
TIL Time in light sleep
TIR Time in REM
TIW Time in wake
TS Total sleep
TTS Time needed to fall asleep (=Sleep latency)
WB Wellbeing
w_f_Disc Discrepancy between SD on schooldays and free days

Curriculum Vitae
109
11 Curriculum Vitae
Stephanie Ellen Böhm
born 06/16/1978 in Thuine
1997: Abitur at Gymnasium Johanneum, Lingen
1997-1998: Yoga-Certificate, Bihar School of Yoga, Munger, India
1998-1999: Yoga Teacher at VHS Lingen
1999-2003: Bachelor of Natural and Complementary Medicine, Southern Cross Uni-
versity, Lismore, NSW, Australien
2003: Nursing Internship at Bonifatius Hospital, Lingen
2003-2004: Medical Studies, Goethe-University, Frankfurt a.M.
2004-2010: Medical Studies, University Witten/Herdecke in Model Course
2008-2009: Practical Year
2010: State Examination and Licensure as a Physician
2010-2011: Dissertation/Present Thesis, Institute of Medical Psychology, LMU
Munich
2010/2011: Instructor for Seminars in Medical Psychology, LMU, Munich
2011-2012: Resident Physician in Klinikum Josephinum, Munich