Sky High Economics Chapter One - lse.ac.uk
30
Chapter One: Quantifying the commercial opportunities of passenger connectivity for the global airline industry In association with Dr Alexander Grous Department of Media and Communications London School of Economics and Political Science
Transcript of Sky High Economics Chapter One - lse.ac.uk

1
Chapter One: Quantifying the commercial opportunities of passenger connectivity for the global airline industry
In association with
Dr Alexander GrousDepartment of Media and CommunicationsLondon School of Economics and Political Science

SKY HIGH ECONOMICS SKY HIGH ECONOMICS
1 2
Contents
Foreword, by Frederik van Essen 2
Executive summary 3
Broadband in the Sky by Robin Mansell 5
Dr Alexander Grous Biography 7
Sky High Economics: Chapter One 8
Overview 9
Market drivers 10
Research approach 14
Airline passenger growth 17
Ancillary revenue forecast summary 17
Average revenue contribution 23
Broadband-enabled ancillary revenue 26
Regional segmentation 27
Full service carriers and low cost carriers 30
Regional broadband-enabled revenue categories 36
Advertising 37
Advertising: Page impressions and pay per click 37
Advertising: Ad-supporting free broadband connectivity 40
Broadband access revenue 43
Premium content 46
E-commerce and destination shopping 49
Conclusion 52
Bibliography 53
References 54
Disclaimer 56
Frederik van Essen
Foreword
Welcome to the first instalment of the ‘Sky High Economics’ study.
This study, conducted by the London School of Economics and Political
Science, is the first of its kind to comprehensively model the socio-economic
impact of the connectivity revolution on the aviation industry. This will include
a later report looking at the potential benefits that connectivity will bring to
Operations & Safety and the impact of passenger connectivity on Loyalty &
Behaviour within the aviation industry.
This first report looks at the Revenue and Economics of inflight passenger
connectivity. The findings point to a future in which airlines will require a high
quality, global solution to capitalise on the potential revenue opportunities
that exist within the market; the seismic shift to an ‘always connected’ culture
means passenger Wi-Fi is now a necessity rather than a luxury. With this
connected network of passengers comes a sizeable revenue opportunity with
the power to entirely re-shape the aviation industry.
I am proud to say that Inmarsat Aviation is uniquely positioned as a partner
to help meet the growing demands for high quality aviation connectivity, with
its wholly owned and operated global satellite networks.
The skies represent the final frontier in the race to connect travellers to high
quality broadband connectivity, and this research clearly demonstrates the
magnitude of the opportunity at stake.
Bring It On!
Senior Vice President Aviation Strategy and Communication, Inmarsat Aviation

SKY HIGH ECONOMICS SKY HIGH ECONOMICS
3 4
Executive Summary
The global airline industry is on the cusp of a connectivity revolution. Currently 3.8 billion passengers fly
annually, with only around 25% of planes in the air offering them some form of onboard broadband. This is
often of variable quality, with patchy coverage, slow speeds and low data limits. By 2035, it is likely that inflight
connectivity will be ubiquitous across the world.
Non-broadband-enabled ‘traditional’ sources such as seat upgrades, onboard duty free and baggage fees are
currently worth around $60 billion to airlines. For the first time, this research study bridges the gap between
current market estimates of traditional revenues and the forecasting of incremental revenue from broadband-
enabled cabins. Using IATA passenger traffic data and forecasts of growth, including a near doubling of
passenger numbers to 7.2 billion annually, this research study forecasts that broadband-enabled ancillary
revenue will reach an estimated $30 billion for airlines by 2035. Overall, a total market of $130 billion of
additional revenues will be created. As well as airlines, this market will include content providers, retail goods
suppliers, hotel and car suppliers, airlines and advertisers.
The four primary areas of broadband enabled ancillary revenue have been defined in the research are:
• Broadband access
• Advertising, encompassing interruptive advertising and pay-per-click
• E-commerce and destination shopping
• Streaming, including premium content
The research looks at six key regions: Asia Pacific, Europe, North America, Africa, Middle East and Latin
America, analysed using both primary and secondary research, drawing on available data of passenger
numbers and of forecasted aircraft growth globally.
By 2035, broadband-access revenue is forecast to remain the highest single source of new ancillary revenues,
accounting for 53% of the total market, followed by e-commerce and destination shopping at 40% of the
market, with advertising revenue accounting for 8% of the market, and premium content at around 2.5%
of the market. Per passenger, this means an increase of 1,129% in broadband enabled ancillary revenue
from the current $0.23 per passenger in 2018, to $2.82 in 2028, reaching $4 per passenger by 2035. With
current traditional ancillary revenue for airlines of around $17 per passenger, the research study projects that
broadband connectivity will add around 24% to ancillary revenues for airlines in real terms by 2035.
Growth in broadband-enabled ancillary revenue will be driven by the introduction of new generation satellites.
These address the key requirements sought by passengers that have been lacking to date in many cases,
most importantly high bandwidth and continuous connectivity. Passenger surveys continue to confirm that
these are integral components of quality, which remains the primary driver of broadband take-up, and that
passengers are willing to pay more for high quality onboard connectivity.
When combined with a well-developed ecosystem of content, products and services, this can spur the
development of related ancillary revenues from both leisure and business passengers on Low Cost Carriers
and Full Service Carriers. Globally, Low Cost Carriers (LCCs) are forecast to account for around $11 billion of
revenues, and Full Service Carriers (FSC) around $19 billion. The capitalisation of opportunities presented by
a connected cabin with high quality continuous coverage will depend on the degree that airlines are willing
to engage with third party suppliers, retailers, destination companies, content providers and others.
The research study forecasts that by 2035, from the estimated $30 billion airline share of the total broadband-
enabled revenue of $130 billion, Asia Pacific has the highest figure at $10.3 billion, followed by Europe with
$8.2 billion, North America with $7.6 billion, Latin America with $1.9 billion, Middle East at $1.3 billion and Africa
with $0.58 billion.
The opportunity for revenue growth from broadband enabled services is dependent on airlines
commercialising passenger data to a much greater degree than occurs currently. Today, only 11% of existing
airline schemes offer personalised rewards based on purchase history or location data. More loyal customers
can generate a 23% premium in profitability and revenue to airlines. Airlines today have failed to fully develop
the potential opportunities offered by passenger data. Airlines are in the driver’s seat for realising a massive
opportunity. By bringing together right technological, retail, advertising and content partners, airlines will be
able to offer passengers the services they are asking for, whilst improving the bottom line. With the number of
passengers currently flying every day forecast to almost double by 2035 this is a ‘sky high’ multibillion dollar
opportunity for the global airline industry.

SKY HIGH ECONOMICS SKY HIGH ECONOMICS
5 6
Broadband in the Sky by Robin Mansell
Networked information technologies and solutions are an integral part of everyday life in the 21st Century,
producing a major demand for connectivity. This demand is extending the desire for connectivity: to be
always and everywhere connected. Amplifying this demand is the increase in the mobility of people, with total
domestic and international passenger air travel journeys exceeding 3.8 billion.1 The demand for connectivity
is the driver for massive investment in mobility, with $880 billion invested in telecommunication infrastructure
worldwide over the past five years, and global smartphone sales of $1.8 trillion over the same period.2 Access
to the internet increasingly is with smartphones and tablets for personal use, and the trend toward mobile
or ubiquitous computing and communication is also mobilising the workplace and blurring the boundaries
between workspace and living space – professional and social. Mobility is an extension of the communicative
capacity of individuals and is now a familiar feature of everyday life.
Mobility and the proliferation of Cloud services provide the ability for individuals to consume media, work and
communicate ‘on the move’ or at a distance. Maintaining the connectivity that makes this possible is becoming
an expectation but progress in providing this is uneven. Different rates and consistency of data transmission
are experienced in all mobile telecommunication networks leading to user concerns about quality, and major
gaps in connectivity remain. These gaps are particularly apparent in the transit between urban areas, with
long distance travel typically involving prolonged ‘outages’ or degradations in connectivity. At the same time,
users are likely to expect connectivity to be present in an ever greater number of locations, both free and
via subscription. These developments make any ‘in transit’ outages experienced by passengers during long
distance travel more conspicuous. An individual may choose to defer connection during travel. However, since
modern working and social lives involve a high level of communication, immediacy, and a sense of urgency to
work or engage in communication or entertainment, the trends towards higher levels of mobile connectivity
may indicate a willingness to pay additional charges for connectivity.
The availability and reliability of connectivity influences the degree of engagement people have with their
online personal and work domains, and the extent to which these are utilised. Inflight wireless broadband
provides the opportunity for individuals to continue their engagement with these domains inflight. A high-
reliability service that provides an end to the inflight blackouts that are often experienced, and maintains
Professor of New Media and the Internet, London School of Economics and Political Science
connectivity when individuals are airborne, will enable those who value this continuity to pay for inflight
services. Those for whom this is a requirement, including many business and corporate flyers, are likely to
welcome the ability to remain productive inflight while also enjoying the social and recreational opportunities
available to them through online connection. There are others who may prefer a free-access model, including
some younger travellers whose experience is mainly with free access to Wi-Fi or others who are unwilling to
pay for faster connectivity, greater data provision, premium services, and other features. However, the share
of the air travelling population with a willingness to pay for inflight broadband is likely to increase due to the
defining nature of connectivity in people’s lives, the value of online connectivity for conducting work, and the
role that connectivity plays in maintaining and extending social and professional networks. For all of these
applications the terrestrial services available at a journey’s end, with inclusive tariffs at high speeds, for many
provide a benchmark for cost and quality. As a result, the quality of an inflight broadband service must be high
– in practice, indistinguishable from the service likely to be received in a modern business traveller hotel.
The value of connectivity may be translated into business models in several different ways. A comparison
is wireless broadband connectivity in business hotel accommodation. Although initially a differentiator that
created competitive advantage for hotels offering such services, a wireless broadband service has become
a common expectation and a cost of doing business, not only for business traveller hotels, but for almost all
accommodation, although, in some cases, there are limitations on the ‘free-time’ provided, data download
speeds and other restrictions. The provision of inflight wireless broadband is an added cost for the airline, and
the extent of deployment will influence whether this service is a differentiator, a common facility (treated as a
cost of providing air travel services that is incorporated in airfares), or an opportunity to generate additional
revenue for the airline as new digital channels emerge enabled by broadband in the cabin.
A comparison with the development of mobile telecommunication services and the earlier history of internet
service provision suggests several options for airlines in the provision of broadband for passengers. The
simplest for the user seeking persistent online connectivity is a limited offering of inflight online service
based on a portal or ‘walled garden’ used to generate revenue through pay-per-view services and advertising
content. A second is for airlines to provide connectivity but to limit access to higher bandwidths which can
be used for services such as video streaming. Limitations can be imposed by charging premium prices or by
using technical barriers like those imposed by mobile telephone operators which charge by the amount of data
accessed and do not assure the user that higher bandwidth services will work. The third strategy is to strive
for comparable levels of connectivity to terrestrial wireless broadband connections and to charge a flat rate
for such access or to provide it for ‘free’. The viability of the free option will depend on whether airlines find
sufficient revenue offsets in providing advertising, online shopping, paid inflight entertainment and user data
collection for internal use or resale or other areas of revenue to pay for the costs of the service.
Many users will welcome the extension of online connectivity to air travel, one of the few spaces in which
connectivity options are currently limited. The mobile internet market is maturing rapidly with users becoming
intensely reliant upon and engaged with their network-enabled devices. Gaps and reliability problems still
limit the user experience of online mobility with quality (consistency) rapidly becoming an expectation among
passengers. Opportunities for airlines are opening up as a result of the additional services that a broadband-
enabled cabin can create. At the simplest level, a tiered paid-for and free service can be offered. More complex
services and offerings can be added to these. The provision of inflight services offering comparable quality
and consistency to terrestrial coverage will be influenced by the tension between user expectations for free
broadband access or a charged-for service and the strength of user demand by those who are unable or
unwilling to defer or interrupt their connectivity during aircraft travel. The consistent attribute among these
groups is that connectivity is becoming the norm, not the exception.

SKY HIGH ECONOMICS SKY HIGH ECONOMICS
7 8
Dr Alexander Grous Biography
Dr Alexander Grous has been engaged at the LSE since 2005, and works across the Department of Media
and Communications at the LSE in a combined teaching and research role in the areas of Innovation,
Socioeconomics, Communication Technology and Transport Economics, amongst other areas.
Dr Grous is also Director of the Research Function in LSE Enterprise, engaged across multiple projects for
clients. He brings considerable commercial experience to the LSE from previous roles at CxO level in mobile
communications (including satellite), high-technology, FMCG, e-commerce, Banking and Finance.
Dr Grous specialises in the quantification of socio-economic value encompassing both a social and economic
impact at the company level, regional, national level, or wider. His extensive work in these areas has resulted
in high profile reports and media coverage including the impact of cycling to the UK economy, business
and health; the socioeconomic impact of mission critical broadband to the UK and the EU; the productivity-
enhancing impact of communications in the UK, and recent extensive socio-economic work for FTSE 100 firms
that are not public domain including Microsoft, Warner Brothers, Amadeus, GB Group, and others.
Dr Grous’ work is often utilised for Policy and Government input, and he engages at this level to facilitate. Dr
Grous also brings considerable experience in telecommunications having held strategy roles in mobile strategy
and satellite communications with Telstra (Australia/UK) including engagement over two years with Inmarsat
in the UK as Telstra’s representative on the Working Group related to the initial development of Inmarsat’s
mobile satellite service.
He was also MD of Lockheed Martin’s Infocom Division for EMEA and CEE/CIS including participating in
satellite communication launches and joint ventures for fixed, mobile and broadband in the region, defining
the market potential for services across ground and air. Dr Grous maintains transport economics and
communication technology as an active area of research and teaching.
Department of Media and Communications, London School of Economics and Political Science
Chapter One: Quantifying the commercial opportunities of passenger connectivity for the global airline industry
SKY HIGH ECONOMICS SKY HIGH ECONOMICS
9 10
Overview
“ We are pushing the airlines to have the same mind-set as Amazon, which is a recommendation engine. But this means a change of mind-set.”
Raphael Bejar, CEO, Airsavings3
The need to ‘always be connected’ has continued to grow in the 21st Century, across both business and social segments.4 Ubiquitous
connectivity is no longer the domain of business travellers as Generation Y and Z have normalised the ingrained nature of mobile
connectivity.5 As connectivity no longer becomes an exception in everyday life, the focus is shifting to areas where it is often less
available, including travel.6 Over 70% of consumers utilise their mobile devices during the week across environments including home,
work and when commuting and traveling, with 63% of global consumers willing to pay for mobile broadband value added services.
‘Video’ is one of the most requested services, with research indicating that over 60% of consumers would like video to be optimised
further than present quality.7 The most requested aspect of mobile broadband continues to be quality of experience.8 Almost 80%
of global consumers experience issues with mobile connectivity that directly impacts their utilisation including slow speeds (62%),
network coverage (39%), and connection drops (36%).9 These contribute to mobile churn rates between carriers of around 31%
across countries, with reliability, coverage or speed impacting utilisation and retention.10
Broadband connectivity ‘in the sky’ represents a significant opportunity for the generation of ancillary revenue that is currently in its
infancy or absent from the commercial aviation sector. The market today is not necessarily the market that will be there tomorrow as
step-changes are occurring in trends and dynamics that have the potential to augment the current ‘traditional’ model of ancillary revenue.
Broadband connectivity offers the opportunity for a step-change encompassing both digital and e-tailing opportunities. This expands
the more ‘traditional’ ancillary revenue opportunities focused to date on four primary areas: frequent flyer mile sales, travel retail sales
(car rental, hotels, insurance), baggage fees and onboard a la carte sales, estimated to be worth $67 billion.11 Mobile broadband has
the potential to be a disruptor, however, and foster opportunities that leverage changing social, economic and technical factors that
can potentially migrate the onboard and operational experience ‘to new heights’. These can generate additional benefits for airlines by
‘monetising’ passengers to a greater degree, whilst concurrently enhancing their end-to-end travel experience and generating greater
loyalty in the process. As a result, airlines can gain a higher net present value (NPV) per passenger and maximise the return on investment
(ROI) in onboard broadband connectivity. If the onboard connectivity experience begins to approach or equal terrestrial broadband, the
playing field can be levelled at the very least between the two, creating significant opportunity for the aircraft cabin to generate high
broadband-enabled ancillary revenue. This outcome can usher in purchasing behaviour that is the same between the two environments,
making it possible for airlines to dramatically expand their shopping offers beyond the narrow sample offered today. Critically, this moves
away from the current duty-free basket of goods offered to a wide portfolio of products.
Research indicates that when broadband is offered in the cabin, some consumer expectations are carried with them and rank higher
in affecting their adoption of the service. In particular, over 75% of airline passengers value reliability over price (19%) and speed
(6%).12 With more than half of all data traffic estimated to be streamed by 2020,13 a reliable and consistent grade of broadband
service by airlines can generate additional revenue opportunities and also influence loyalty.14 Around ten million people are estimated
to fly each day, up from eight million in 2013.15 The potential for this group to generate revenue is high if they are provided with the
appropriate onboard connectivity, content, and pricing. With 1.6 billion people spending $1.9 trillion on e-commerce in 2016,16 a
similar per person annual spending profile of $1,188 in the air could yield significant sales today, with some forecasts estimating this at
around $2.5 billion.17 The key enabler is the creation of high bandwidth, reliable connectivity that facilitates a paradigm shift in thinking
by both airlines and passengers alike, where the distinction between on-the-ground broadband blurs, or disappears altogether. If
used strategically, loyalty programmes can enhance this further: only 11% of existing airline schemes offer personalised rewards based
on a customer’s purchase history or location data today, providing significant room for improvement.18
Market Drivers
“ There’s nothing more frustrating for a passenger than being told it’s there and you’re waiting there with your screen to upload or refresh.”
Willie Walsh, CEO, IAG.
If a broadband service is offered by the airlines that meets or exceeds passenger expectations, this can result in greater loyalty:
greater loyalty amongst consumers can deliver a 23% premium over the average customer in terms of profitability and revenue.20
After experiencing better service, loyal customers have been observed to focus less on price and more on the rewards of the
experience (‘quality’) and convenience, resulting in revenue gains.21 Loyalty from a better service experience can diminish price
sensitivity, contributing to an increase in long-term revenue and profitability.22
Increasingly, the mobile channel has become an important engagement mode for many consumers with both their loyalty
programmes and travel providers, including airlines. Facilitated by the development of apps and direct bookings: in-app bookings
account for 12% of total mobile bookings for travel worldwide,24 with mobile bookings for air travel on average 21% higher than
desktop bookings, and 13% higher for car rental.24 In the US, 83% of passengers have a smartphone, whilst 15% travel with three
mobile devices (mobile phone, table, laptop),25 offering pre and post-departure revenue opportunities with this mobile medium.
This can be maximised if airlines utilise a greater degree of personalisation: consumers today are more willing to receive and act
upon online and mobile personalised offers.26 This can lead to a sales uplift for e-retailers with results indicating a 12% increase in the
average order value for personalised transactions versus sales without personalisation.27 The key contributing factor to the success of
online personalisation is the acquisition and use of detailed customer information.28
The shift from a more ‘traditional’ ancillary revenue model to a broadband enabled model encompassing e-commerce, destination
shopping, entertainment and other elements is in its early stages but offers growth opportunities for airlines.29 These can be driven by
a number of factors:
• Around half of all passengers between the age of 18-51 require onboard connectivity;30
• Business passengers display a propensity to pay $10 for broadband connectivity for flights up to three hours; $20 for up to five
hours, and $25 for greater than five hours;31
• The trend to quality vs price is also observed amongst millennials, who represent a $290 billion market in the US and the most
connected generation: 44% indicate that they are loyal to brands they buy, with 52% choosing quality over price;32
• 85% of millennials own a smartphone and spend the highest proportion of time on this versus other segments, at 15 hours
per week;33
• Around 28% of retailers report that customer loyalty increased through the deployment of in-store customer Wi-Fi34, denoted as
wireless access to broadband.

SKY HIGH ECONOMICS SKY HIGH ECONOMICS
11 12
Significant variation in the price that airlines are charging for broadband connectivity is observed. This is also currently the primary
ancillary digital revenue for the majority of airlines, with advertising revenue, premium content, and personalised revenue in its infancy:
the majority of airlines have not capitalised on such opportunities, often due to the lack of bandwidth and its reliability and quality.
Optimising consumer take-up of these and other related opportunities requires the marketing and delivery of ancillary services with
an appropriate fit with the mobile and onboard technology that facilitates their commercialisation.35 The initial growth in the market
is dovetailing with new opportunities, such as enabling broadband technology for airlines, aligning with passenger expectations and
technical improvements in technology. Figure 1 depicts the evolution of passenger expectations for broadband in the cabin, and the
commensurate airline opportunities that can be capitalised upon, underpinned by market, social and technological trends.
Price
Speed
Quality
Speed
• ‘Age of the app’
• Streaming growth
• Free and paid online
• ‘Content is King’
• Consolidation devices
• Monetising user data
• Shifting loyalty patterns
• ‘Instant’ consumption
Broadband
revenue
Broadband
revenue
Ancillary
revenue
Broadband
revenue
Ancillary
revenue
Passenger Expectation
Airline Opportunity
Trends
• Basic mobile
• ‘Desktop’ digital
• Limited on- board content
• LCC growth
• Mobile: 3G, 4G+
• Generation Y, Z
• Variable content
Price
Quality
Quality
Speed
Price
Premium content
Online advertising
E-commerce
Equipment fit out
Primary driver
1st generation broadband-enabled
1st generation ‘traditional’
non-broadband enabled
Industry Infancy Initial growth Current stage
Lower elasticity if quality higher
Trade-off with price and quality
Next
generation
broadband-
enabled
ancillary
revenue
Cu
mu
lati
ve
Figure 1: The evolving airline ancillary revenue model
Quality appears to be the most significant enabler, with passengers indicating a preference for a number of related attributes:36
• A service with seamless connectivity across large areas;
• A lack of persistent buffering to enable higher bandwidth applications such as streaming;
• A lack of persistent drop-outs of connectivity;
• A lack of buffering;
• Higher speeds capable of delivering video and interactive services with a quality of experience comparable to high-speed
terrestrial bandwidth.37
In order to fully capitalise upon the opportunities offered by high quality cabin broadband, airlines need to improve their current
passenger data utilisation, which is often limited.38 This involves the greater use of data held by airlines from bookings, current non-
broadband-enabled ancillary revenue, frequent flyer profiles, apps, and other sources.39 Airlines are not, in general, fully utilising
passenger data to maximise revenue. A change in this strategy can complement a broadband-enabled cabin, however, and drive
related ancillary revenue with airlines capitalising on a number of areas:
• Utilising extensively held consumer preference information;
• Identifying target travelers;
• Offering opportunities to purchase ancillary services using multiple access devices including mobile phones, laptops, and tablets
to facilitate pre-flight, onboard and post-flight activities;
• Exposing passengers to multiple revenue-generating modes including advertising across platforms and types (mirroring their
terrestrial experience);
• Identifying a sub-set of passengers who can act as innovators in their particular consumer segments and become ‘ambassadors’
for using the technology for other passengers, generating ‘word-of-mouth’ and referral feedback through travel websites, airline
forums, and social media;
• Broadband-enabled ancillary services that can be personalised to enhance the passenger’s air travel experience.
These areas are relevant in facilitating the broadband-enabled generation of ancillary revenue from both of the major airline
segments: Low Cost Carriers (LCC) and Full Service Carriers (FSC). Discussions with airlines and secondary research indicates:
• A blurring has occurred in the airline type selected by many business passengers, with LCCs and FSCs often selected based on
price, route and schedule: airline status (LCC vs FSC) does not appear to be as prevalent a factor in selection;
• Business passengers travelling on LCCs are creating demand for elements of travel expected with FSCs such as preferential status
for boarding; priority bag tagging; additional carry-on baggage and allowances; and other factors;
• Demand for connectivity, with many business passengers expecting their airline to offer broadband;
• Many budget travelers choosing FSCs are also expecting free broadband and a free selection of entertainment, contrasting with
business travelers in the main;
• Global recessions have resulted in many companies mandating that their business travelers seek the lowest cost for travel and
accommodation spurring a crossover of some travel to LCCs.
The ancillary revenue model is particularly suited to LCCs, who have in the main pioneered the ‘a la carte’ concept as the core of their
ancillary strategy. As such, passengers flying with LCCs have experience with an add-on approach for additional services or features.
These airlines may also exhibit better adaptability at implementing broadband-enabled ancillary services as a result, and stronger
passenger take-up. In addition, LCC leisure passengers, and in particular holidaymakers, are likely to have a greater propensity
to spend than some other leisure and business travelers. It is expected that LCCs will continue to penetrate the market above the
current 28%-60%40 observed in Europe, North America,41 Asia Pacific and Latin America.42 Continued pressure from corporate travel
departments is expected to result in further dilution between the choice of an LCC or an FSC with over 85% of business passengers
indicating that lowest-cost travel was the primary factor defining the choice of a carrier.43

SKY HIGH ECONOMICS SKY HIGH ECONOMICS
13 14
Primary research indicates that 85% of passengers can be influenced to make a purchase in a connected cabin if they have
confidence that a pool of relevant content and products exists:44 liquidity of supply. This ‘liquidity’ encompasses airlines offering a
pool of products and services to a passenger at terms that can stimulate a purchase. To be optimised, liquidity needs to be combined
with ‘attractive’ pricing and fulfilment that caters for the immediacy of some purchases, such as digital confirmation of destination
hotels, flights and car hire, in addition to non-urgent deliveries. Figure 2 depicts how these factors can create passenger confidence
to defer purchases until onboard. This is analogous to the online person-to-person (p2p) betting market in which liquidity and better
odds drive the confidence for individuals to seek this out and bet versus alternative options.
Figure 2: Creating passenger confidence through liquidity, price and fulfilment
Larger pool can stimulate demand
Passengers can defer purchase to on-board
Greater confidence equals higher propensity to spend
Price must be attractive
Fulfilment must be relevant: “instant”
(via digital) and deferred (to destination/home).
Key Enabler
The supply of the products and services must exit
Liquidity
This research assesses low-cost, full service carriers, leisure and business passengers, and their forecast propensity to undertake
broadband-enabled spending when onboard. Secondary and primary research was undertaken to define relevant contributory
factors affecting take-up rates between segments for broadband-enabled offerings in the cabin.
Research Approach
Existing research and data on airline ancillary revenue overwhelmingly focus on the ‘traditional’ model of opportunities available
to airlines that in the main are not facilitated by broadband. A gap exists in the quantification of opportunities that passenger
connectivity facilitates. This report seeks to identify and quantify a number of potential areas of opportunity that have been narrowed
following exploratory primary research with passengers, consumers, some broadband technology providers and secondary data
sources. The methodology used commences with an identification of the regions to be utilised and the definition of the ancillary
revenue services and their assumptions. Figure 3 depicts the overarching methodology.
Define ancillary revenue
services and assumptions
Define passenger
growth 2018-2035
Define aircraft growth
and utilisation
Define passenger segments
and take-up
Free and paid
broadband
5 ancillary revenue services
Quantify revenue
By: region; service;
passenger segment;
distance; year
Define regions
Figure 3: Demand and revenue quantification approach
Six geographic regions have been utilised: North America, Latin America, Asia Pacific, Europe, Africa and the Middle East.
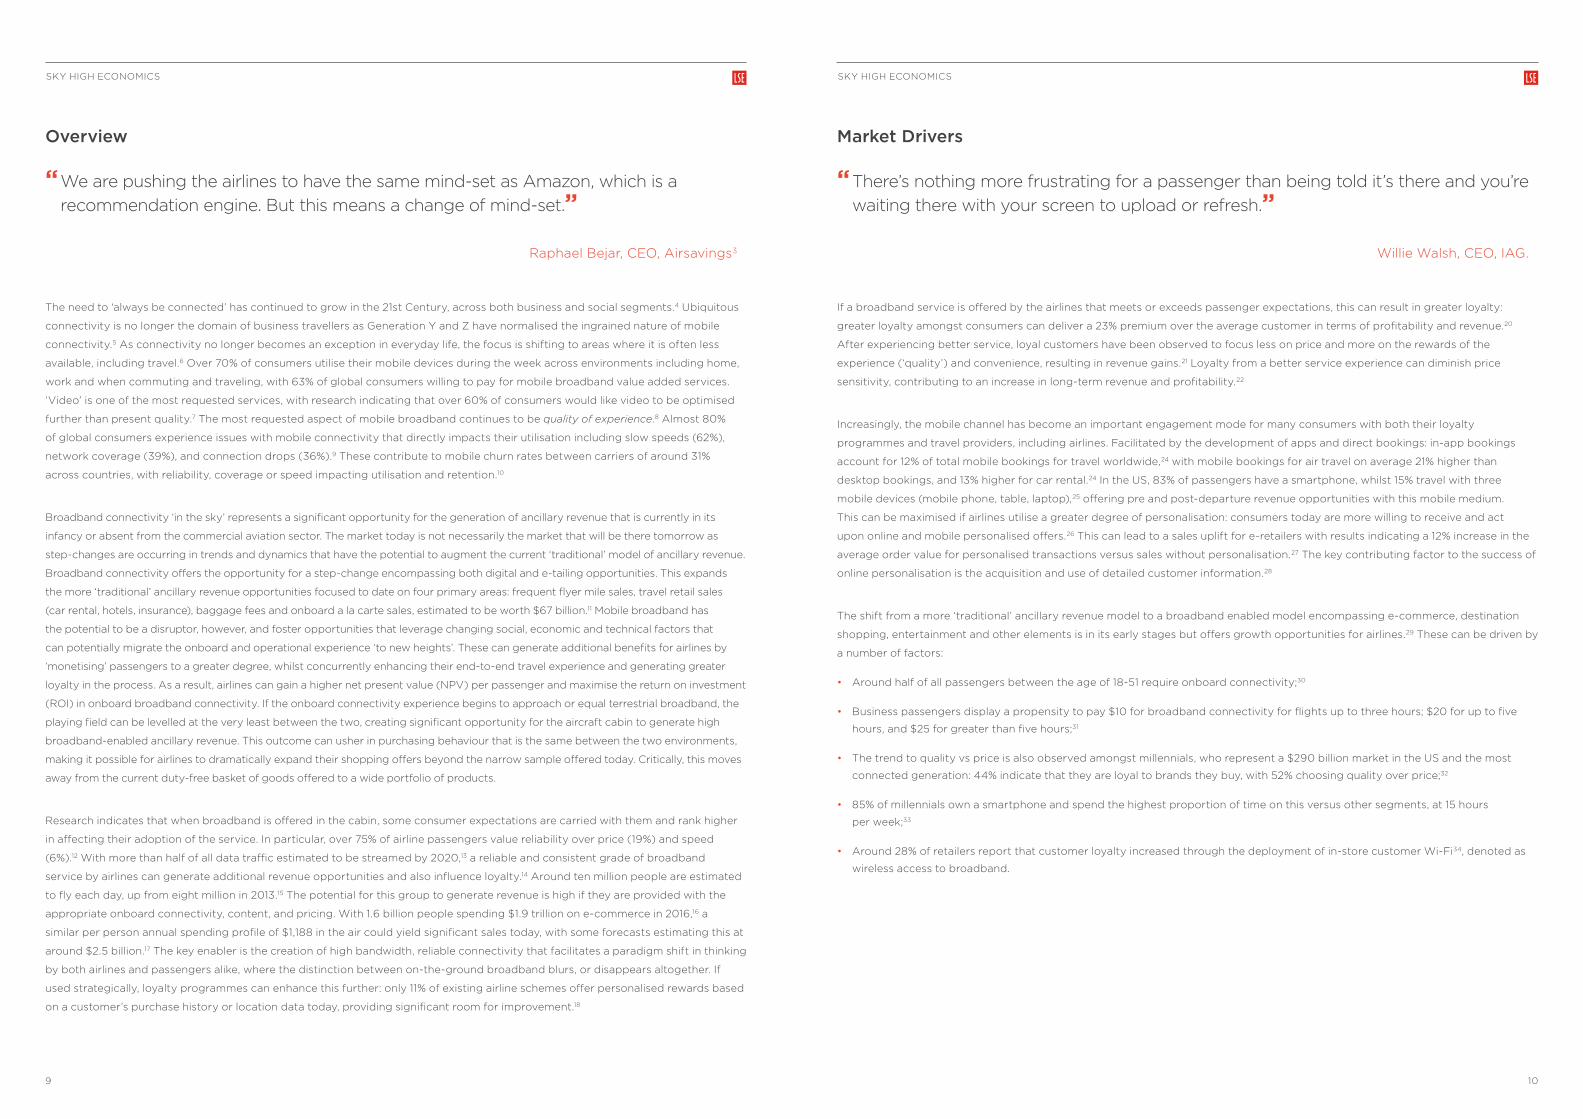
Four broadband-enabled service opportunities have been defined and assessed for each region, as depicted in Figure 4. In order
of potential forecast market size, this includes broadband access revenue; e-commerce & destination shopping; advertising
(almost equal between page impressions and interrupting adverts), and Premium Content and Devices. The forecasts utilise
regional demand inputs such as passenger travel growth, with IATA-obtained passenger forecasts for 2016 and 2035 indicating a
near doubling of global passenger numbers from 3.8 billion to 7.2 billion respectively.45 These forecasts were extrapolated to yield
regional forecasts from 2018-2035 by region, reaching a global figure of 7.2 billion passengers in 2035, as forecast by IATA. Within the
forecasts, segmentation between domestic and international travel occurred, and between LCC and FSC passengers and the revenue
that each segment generated.
“ I don’t think I know how to live without Wi-Fi. I’m always on my phone, laptop or tablet. Often at the same time. It is important to everything that I do. Messaging friends on WhatsApp, Facebook or even looking for jobs on LinkedIn – it’s online. I can’t remember the last time I watched TV in real time or took a photo and didn’t think Instagram! It makes me chuckle that my parents leave the house to buy a newspaper. Why would you? Everything I need is in my pocket just a tap away. Taking that away from me at times like a long flight is tantamount to torture.”
Millennial
SKY HIGH ECONOMICS SKY HIGH ECONOMICS
15 16
Broadband- enabled ancillary
revenue
Broadband
access revenue
Advertising:
• Page impressions and pay per click
• Interrupting adverts in free broadband
E-commerce and
destination shoppingPremium content
Figure 4: Identified areas of opportunity for airline broadband-enabled ancillary revenue
These represent a mix of existing broadband airline ancillary revenue and new opportunities. They are predicated on existing passenger
engagement with digital modes such as websites, e-marketing campaigns, e-tailing and other ‘everyday’ digital experiences.
Broadband Access Revenue This is the most widely utilised revenue generating category for airlines and technology and service providers for inflight broadband
connectivity. Most of the airlines today derive revenue from access charges with multiple options often available including charges
per hour; per day; per flight; defined data amounts, and other options. These are driven by the strategy of the airline, which in some
cases provides some connectivity without charge, but with options available for ‘upgrading’. They are provided through a mix
of direct and indirect channels to the airlines. This research has defined a range of access charges available today and draws on
interviews and research to define take-up rates relevant to each region.
AdvertisingThis category has been segmented between revenue from page impressions and click-through in both paid and free broadband
options, and revenue from interrupting-adverts for free broadband. Pay per click is one of the core areas of online revenue
generation, the familiar practice of clicking on adverts placed on pages. The development of commercial opportunities with
providers of content could generate revenue for adverts viewed by airline passengers on a revenue-sharing basis with the potential
to offer tailored adverts and content specific to routes, destinations, target passengers (e.g. business vs leisure flights) and other
criteria. The additional area of revenue generation is the free access model that interrupts content with short adverts as utilised by
YouTube, Spotify, SoundCloud and others. Utilising data and assumptions derived from this sector, revenue generation has been
forecast for ad-supported ‘free’ broadband access. Technical and operational challenges exist in the initial establishment of this
area, such as ensuring that revenue from interrupted streamed content is attributed to the airline when sharing revenue with content
providers. If these elements can be addressed, this segment offers strong revenue generation opportunities. As this segment evolves,
further opportunities could also be developed from sponsored participation by advertisers and other organisations. The ultimate
development of this segment could encompass a portfolio of these areas.
Premium ContentSome airlines currently stream content and offer premium options utilising bring-your-own-device (BYOD), although this is limited
at present. This opportunity encompasses premium live content, on-demand video, and bundled Wireless Inflight Entertainment
Connectivity (W-IFEC). It represents a potential growth area by offering passengers topical content charged over and above that
provided by any Inflight Entertainment (IFE) as a standalone premium service. Although this may be unconnected to broadband,
Wi-Fi enabled Inflight Entertainment (W-IFE) can be offered as a premium priced add-on to IFC, despite the content not utilising
broadband. This would occur through the content being streamed to the aircraft via satcoms, with a premium paid by passengers for
live broadcasts such as sporting events, live TV soap operas, and others. In addition, this service could include continuously streamed
premium content being delivered to the passenger. This opportunity represents ancillary revenue enabled by broadband, with content
streamed to the aircraft and accessed on BYOD or via the aircraft’s static inflight connectivity system. This offering can take the form
of a tiered pricing model: basic content could include news, shows, or other content, whilst premium content could include events,
specially negotiated content such as ‘box sets’ or other content. Higher bandwidth could enable airlines to dynamically change or
update content onboard to complement an aircraft’s route, flight duration, passenger mix, and maximise revenue opportunities.
E-commerce and Destination Shopping‘Traditional’ ancillary revenue includes some destination and e-commerce shopping by passengers. In this model, broadband is not
the enabler: passenger activity before the flight and inflight purchases are the primary drivers. In the emerging e-commerce model
facilitated by inflight broadband, passengers can be targeted via a number of modes that take advantage of a captive market, such as
late bookings and opportunistic purchases. Passenger purchases have been reviewed to define a package that represents destination
purchases of two of the most popular items: car hire and hotels. An additional representative component of ‘leisure’ purchases has
been defined that can encompass tours, transfers and goods (‘e-tailing’) and other items promoted by the airline. This opportunity,
encompassing duty-free purchases enabled by connectivity, has the potential to generate significant revenue above those forecast, if
the airlines can establish the appropriate partners and suppliers for goods and services. A key distinguishing feature of the revenue-
generation potential of this category is the ability of the airlines to personalise offers based on passenger knowledge, particularly if
the passenger is utilising the airline’s app to manage the flight. A second feature capitalises on the penetration of logistical ‘giants’,
such as Amazon and other in-country category leaders, that can provide fulfilment to an end-destination or conversely, back to a
passenger’s home. Degrees of take-up have been estimated and penetration of this category to define its potential.
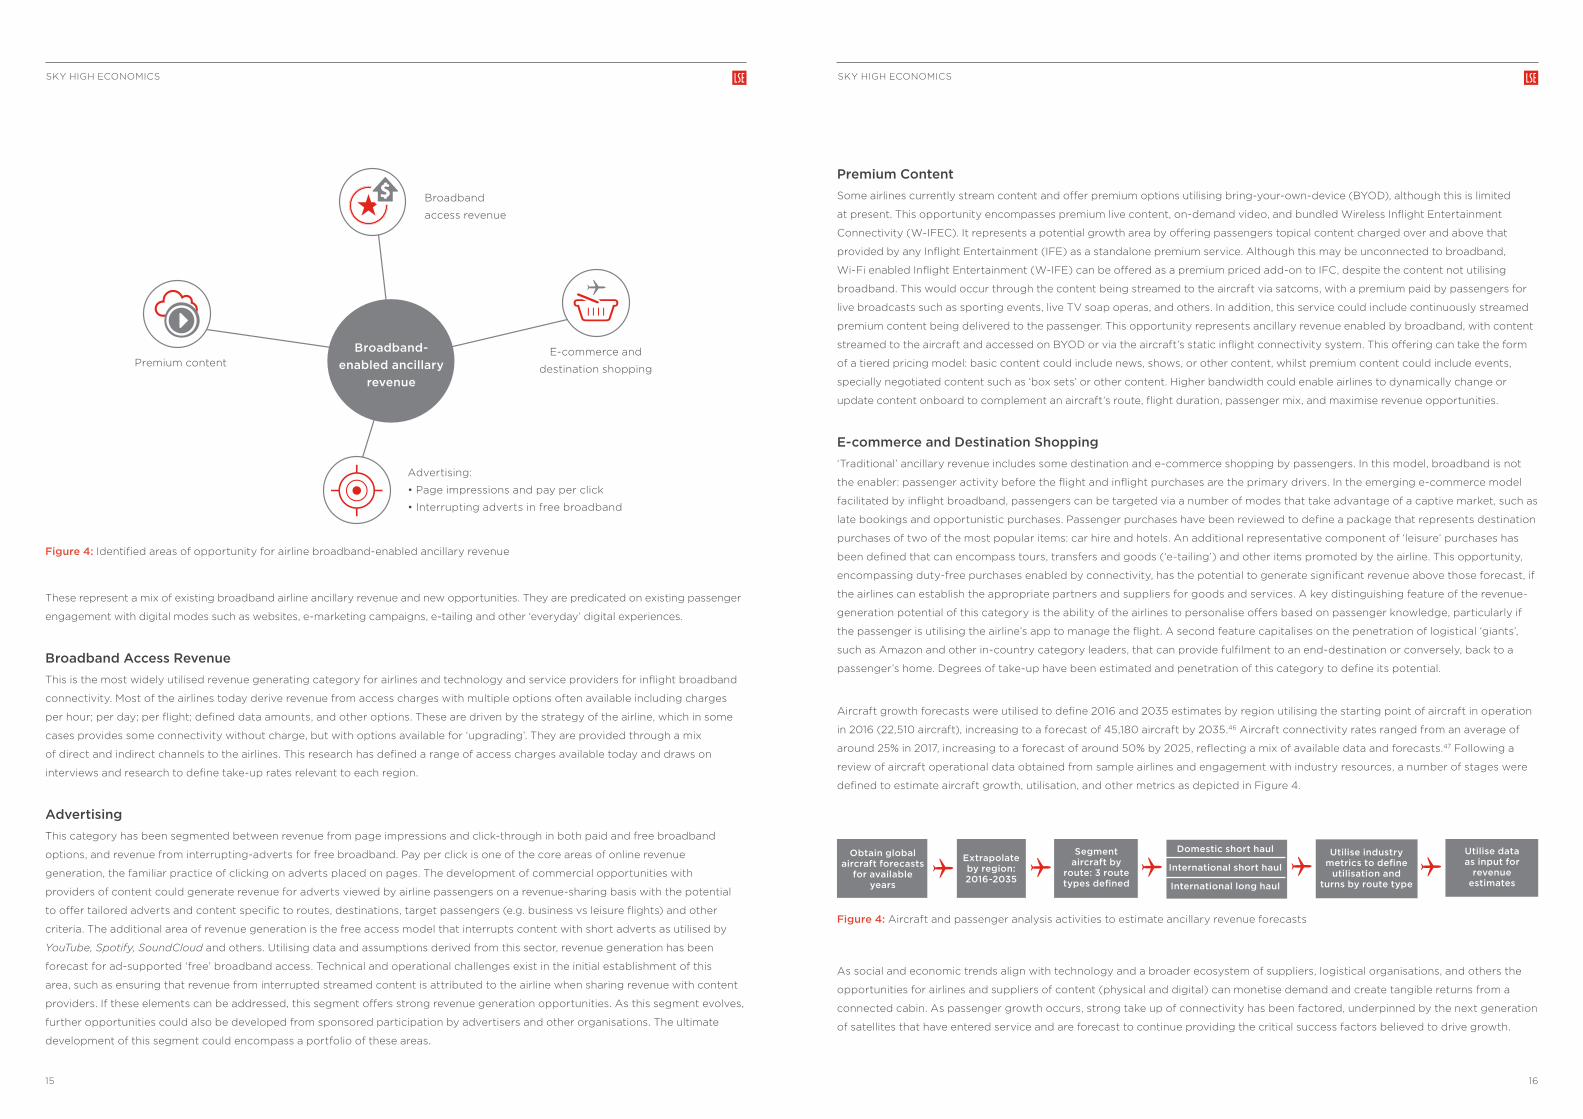
Aircraft growth forecasts were utilised to define 2016 and 2035 estimates by region utilising the starting point of aircraft in operation
in 2016 (22,510 aircraft), increasing to a forecast of 45,180 aircraft by 2035.46 Aircraft connectivity rates ranged from an average of
around 25% in 2017, increasing to a forecast of around 50% by 2025, reflecting a mix of available data and forecasts.47 Following a
review of aircraft operational data obtained from sample airlines and engagement with industry resources, a number of stages were
defined to estimate aircraft growth, utilisation, and other metrics as depicted in Figure 4.
Obtain global aircraft forecasts
for available years
Domestic short haul
International short haul
International long haul
Extrapolate by region: 2016-2035
Segment aircraft by
route: 3 route types defined
Utilise industry metrics to define
utilisation and turns by route type
Utilise data as input for
revenue estimates
Figure 4: Aircraft and passenger analysis activities to estimate ancillary revenue forecasts
As social and economic trends align with technology and a broader ecosystem of suppliers, logistical organisations, and others the
opportunities for airlines and suppliers of content (physical and digital) can monetise demand and create tangible returns from a
connected cabin. As passenger growth occurs, strong take up of connectivity has been factored, underpinned by the next generation
of satellites that have entered service and are forecast to continue providing the critical success factors believed to drive growth.

SKY HIGH ECONOMICS SKY HIGH ECONOMICS
17 18
Airline Passenger Growth
The development of global airline passenger traffic forecasts utilised publicly available data for a number of anchor years with
extrapolation occurring between these. Data were obtained from IATA for passenger forecasts for 2016 and 2035 of 3.8 billion and
7.2 billion respectively, and for an estimate of the distribution of passengers for some regions for these dates.48 Additional data and
feedback were obtained from discussions with industry resources and from multiple other sources including government statistical
information, industry bodies in regions, and others, to estimate the distribution of passengers for the remaining regions between
these dates, including between domestic and international passengers.49 Where data were not available, assumptions were made
on the distribution of passengers using other available data points to yield overall passenger traffic forecasts between 2018-2035,
segmented by region and by domestic versus international passengers, including LCC versus FSC travel. The forecasts were also
aligned with those from organisations such as IATA.
The potential revenue forecasts estimated in this report indicate that Asia Pacific is the largest market, accounting for 42% of traffic
as well as forecast to be one of the major growth markets, accounting for over 50% of new passengers by 2035.50 Europe is likely
to be marginally larger than North America as the next biggest market in 2035, with these two regions forecast to account for
21% and 18% of total passengers respectively. Latin America is forecast to account for the next largest market (9%), followed by
the Middle East (6%) and Africa (4%). These forecasts are within 1% of other sourced region estimates for 2035.51, 52, 53 Analysis has
defined passenger forecasts in 2035 of 3.1 billion for Asia Pacific; 1.5 billion for Europe; 1.3 billion for N. America; 0.658 billion for Latin
America; 0.414 billion for the Middle East and 0.303 billion for Africa. This forms the initial stage in quantifying broadband-enabled
ancillary revenue for airlines, with this data utilised to define adoption, demand forecasts and revenue.
“ The expectation from passengers before was: ‘Give me something to entertain myself with’. Now they are just saying: ‘connect me’.”54
G. Saretsky, CEO, WestJet.
Ancillary Revenue Forecast Summary Four broadband-enabled airline revenue opportunities have been identified and forecast. In order of potential market size, this
includes (1) broadband access revenue; (2) advertising via page impressions and interrupting adverts for content; (3) e-commerce
and destination shopping; (4) premium content. The opportunity for each of these has been quantified. In 2018, the broadband-
enabled ancillary market will still be in its relative infancy, although onboard connectivity has been offered for a number of years.
Table 1 summarises the total revenue estimated, and the proportion accruing to the airlines.
Ancillary Revenue
2018 2028 2035
Revenue % of total Revenue % of total Revenue % of total
Advertising $48,733,691 5.98% $5,540,353,422 8.32% $10,706,212,518 8.18%
Broadband Access Revenue $3,290,566,450 66.50% $36,254,590,888 54.47% $63,675,993,215 48.65%
Streaming and Devices $78,682,487 3.98% $1,724,989,166 2.59% $3,250,234,177 2.48%
E-Commerce: Destination Shopping $442,883,408 23.55% $23,040,989,877 34.62% $53,245,035,926 40.68%
Total Market Revenue $3,860,866,035 $66,560,923,353 $130,877,475,836
Airline Proportion $925,518,156 $15,901,909,247 $30,082,080,853
Table 1: Broadband-enabled ancillary revenue by service and as a proportion of total revenue
Airlines are forecast to generate $0.9 billion in 2018 in broadband-enabled ancillary revenues, with almost all of this accounted for
by access revenue, from a total forecast market of $3.8 billion, with the remaining proportion generated for providers of broadband
capacity in the main, some content and goods and services providers. This is forecast to grow to $15.9 billion and $30 billion for
airlines by 2028 and 2035 respectively, and a total market of $66 billion and $130 billion respectively. Chart 1 illustrates the forecast
growth of the broadband-enabled ancillary revenue market for the airlines.
$0
$100,000,000
$200,000,000
$300,000,000
$400,000,000
$500,000,000
$600,000,000
$700,000,000
$800,000,000
$900,000,000
$1,000,000,000
$0
$5,000,000,000
$10,000,000,000
$15,000,000,000
$20,000,000,000
$25,000,000,000
$30,000,000,000
$35,000,000,000
2035202820182018
E-Commerce: DestinationShopping
Streaming and Devices
Broadband Access Revenue
Advertising: Page Impressions/Pay Per Click
Chart 1: Forecast airline broadband-enabled ancillary revenue: 2018, 2028, 2035
The forecast total market growth generated by broadband-enabled ancillary revenue, is depicted in Chart 2.
2035202820182018
E-Commerce: DestinationShopping
Streaming and Devices
Broadband Access Revenue
Advertising: Page Impressions/Pay Per Click
$0
$500,000,000
$1,000,000,000
$1,500,000,000
$2,000,000,000
$2,500,000,000
$3,000,000,000
$3,500,000,000
$4,000,000,000
$4,500,000,000
$0
$20,000,000,000
$40,000,000,000
$60,000,000,000
$80,000,000,000
$100,000,000,000
$120,000,000,000
$140,000,000,000
Chart 2: Forecast market revenue for broadband-enabled ancillary revenue: 2018, 2028, 2035

SKY HIGH ECONOMICS SKY HIGH ECONOMICS
19 20
The consolidated 10-year total market forecast revenue encompassing the four ancillary services enabled by onboard connectivity is
presented in Table 2. This reflects a global broadband-enabled ancillary revenue market of $3.8 billion in 2018, growing to $66 billion
by year 10, 2028.
2018 2019 2020 2021 2022 2023
Total Market Size $3,860,866,035 $6,502,994,035 $10,294,901,001 $16,357,783,272 $23,182,819,726 $27,607,226,355
Airline Revenue $925,518,156 $1,606,664,891 $2,517,120,926 $3,891,721,978 $5,549,934,929 $6,619,624,004
2024 2025 2026 2027 2028
Total Market Size $34,376,538,780 $43,011,199,340 $52,258,117,997 $56,324,093,252 $66,560,923,353
Airline Revenue $8,205,830,239 $10,211,528,436 $12,554,297,607 $13,560,711,128 $15,901,909,247
Table 2: The growth of broadband-enabled ancillary revenue market and airline share: 2018-2028
The forecast airline revenue component of this is $0.92 billion in 2018, comprised of revenue sharing from advertising, e-commerce
and destination shopping, and broadband access activities. This is forecast to rise to $30 billion by 2035 as depicted in Chart 3, from
a total market forecast of $130 billion by 2035.
203520342033203220312030202920282027202620252024202320222021202020192018$0
$20,000,000,000
$40,000,000,000
$60,000,000,000
$80,000,000,000
$100,000,000,000
$120,000,000,000
$160,000,000,000
$140,000,000,000
$200,000,000,000
$180,000,000,000
$3
,86
0,8
66
,03
5
$9
25,5
18,15
6
$6
,50
2,9
94
,03
5
$1,6
06
,66
4,8
91
$10
,29
4,9
01,0
01
$2,
517,
120
,926
$16
,357
,78
3,2
72
$3
,89
1,721
,978
$23
,182,
819
,726
$5,
549
,93
4,9
29
$27
,60
7,22
6,3
55
$6
,619
,624
,00
4
$3
4,3
76,5
38
,78
0
$8
,20
5,8
30
,23
9
$4
3,0
11,19
9,3
40
$10
,211
,528
,43
6
$52
,258
,117,
99
7
$12
,554
,29
7,6
07
$56
,324
,09
3,2
52
$13
,56
0,7
11,12
8
$6
6,5
60
,923
,353
$15
,90
1,90
9,2
47
$74
,34
6,8
17,2
06
$17
,624
,23
5,0
48
$8
2,6
39
,756
,479
$19
,64
1,40
8,2
87
$9
2,9
59,5
38
,558
$21
,612
,676
,39
1
$10
3,4
22,7
45,
38
3
$23
,83
3,9
62,
216
$11
2,4
71,13
6,0
53
$25
,88
9,7
60
,411
$12
2,0
77,8
81,8
89
$28
,020
,856
,58
2
$13
0,8
77,4
75,8
36
$3
0,0
82,
08
0,8
53
Total Market Size Airline Revenue
Chart 3: The growth of broadband-enabled ancillary revenue market and airline share: 2018-2035
Chart 4 depicts total revenue and airline revenue for broadband-enabled ancillary opportunities in 2018, 2028 and 2035. This depicts
a more accelerated growth forecast as a greater user base is generated and penetration of both paid and free onboard broadband
access increases concurrent to the penetration of services.
2018 2028 2035
$0
$20,000,000,000
$40,000,000,000
$60,000,000,000
$80,000,000,000
$100,000,000,000
$120,000,000,000
$140,000,000,000
$160,000,000,000
$15,901,909,247
$66,560,923,353
$925,518,156
$3,860,866,035
$130,877,475,836
$30,082,080,853
Total Market Size Airline Revenue
Chart 4: Broadband-enabled ancillary revenue market and airline share: 2018 2028, 2035
Revenue has been defined by both domestic and international travel from the five major regions, and segmented further by LCC
and FSC. Table 3 summarises forecasts for domestic travel for LCC and FSC (‘LCC-Dom’ and ‘FSC-Dom’ respectively), and for
international travel (‘LCC-Int’ and ‘FSC-Int’). Variation exists internationally between airlines on how they define short haul, long
haul, domestic and international flights.55 Due to disparate data sources and these varying definitions on short haul, medium haul,
long haul and ‘regions’, a simplified approach has been utilised to consolidate and harmonise data against narrowed definitions. Two
categories have been utilised: ‘Domestic’ and ‘International’. Domestic includes short haul flights, whilst International includes medium
and long haul. ‘Regions’ have not been utilised to denote ‘Domestic’. It is recognised that in some cases, this will result in a skewing of
flights to be classed as international, such as within Europe and between Europe and neighbouring countries. This does not affect the
assessment of revenue enabled broadband activity however: the definitions are utilised to consolidate travel to defined categories.
Global 2024 2025 2026 2027 2028
LCC-Dom $1,742,442,289 $2,233,133,072 $2,740,657,606 $3,008,931,434 $3,678,630,441
FCC-Dom $1,985,917,304 $2,502,142,770 $3,139,975,403 $3,354,950,116 $3,816,928,170
LCC-Int $1,087,984,554 $1,298,680,317 $1,573,693,613 $1,778,039,154 $2,148,200,189
FCC-Int $3,380,976,899 $4,165,932,138 $5,087,091,957 $5,406,768,487 $6,262,013,079
Total $8,197,321,046 $10,199,888,297 $12,541,418,579 $13,548,689,190 $15,905,771,879
Table 3: Broadband-enabled airline ancillary revenue by LCCs and FSCs: 2018-2028

SKY HIGH ECONOMICS SKY HIGH ECONOMICS
21 22
Chart 5 depicts the 10-year forecast for these four categories
20282027202620252024202320222021202020192018$0
$2,000,000,000
$4,000,000,000
$6,000,000,000
$8,000,000,000
$10,000,000,000
$12,000,000,000
$16,000,000,000
$14,000,000,000
$18,000,000,000
LCC-Dom FCC-Dom LCC-Int FCC-Int
Chart 5: Broadband-enabled airline ancillary revenue by LCCs and FSCs: 2018-2028
The analysis and forecasts provide a number of observations:
• Opportunities exist for both LCCs and FSCs to generate revenue from enhanced cabin broadband;
• FSCs could offer greater opportunity for accelerating some areas due to the larger proportion of business travelers utilising these
airlines, including for long haul flights, and premium passengers seeking greater ‘luxury’ when travelling;
• Premium economy upgrades are also being utilised to attract greater passengers to economy;
• LCCs continue to grow and penetrate traditional FSC markets, but do not represent ‘low value’ passengers, with the average
income of 56% of EU LCCs being €48,000;56
• LCCs can generate ancillary broadband enabled revenue from domestic flights in particular, reflecting shorter-haul flights that do
not fall into medium-long haul. This is changing as some LCCs begin to embark on long-haul routes with more efficient aircraft
such as the 787 Dreamliner and undertake international flights to a greater degree as a result.
Recent industry surveys indicate that 80% of passengers spent an average of $62 on their flight for ancillary services, but would
spend almost $100 if this improved their travel experience, including inflight connectivity.57 Around half of passengers also indicate
that they are willing to share personal information in exchange for personalised offers. This reinforces the opportunities quantified
for broadband-enabled ancillary revenue in particular, with passenger engagement and registration often a key component of digital
engagement and value-added opportunities.
These factors can contribute to strong growth beyond a 10-year forecast. Forecasts to 2035, to the IATA-supplied annual global
passenger estimate of 7.2 billion are summarised in Table 4:
Global 2029 2030 2031 2032 2033 2034 2035
LCC-Dom $3,998,611,531 $4,404,063,303 $4,824,113,982 $5,410,307,255 $5,853,330,477 $6,295,222,532 $6,729,438,688
FCC-Dom $4,156,784,308 $4,388,971,625 $4,759,402,486 $5,167,177,928 $5,469,090,701 $5,890,656,579 $6,313,743,881
LCC-Int $2,431,189,726 $2,741,850,655 $3,025,901,230 $3,371,065,446 $3,711,763,985 $4,036,447,804 $4,369,215,068
FCC-Int $7,044,472,122 $8,112,943,690 $9,010,651,716 $9,892,203,656 $10,863,464,907 $11,805,464,028 $12,680,100,064
Total $17,631,057,687 $19,647,829,274 $21,620,069,413 $23,840,754,284 $25,897,650,069 $28,027,790,944 $30,092,497,701
Table 4: Broadband-enabled airline ancillary revenue by LCCs and FSCs: 2029-3035
The opportunity exists for airline revenue to be further maximised if above-average industry revenue sharing can be negotiated: the
nature of airline travel offers advertisers a unique opportunity to target a ‘captive’ audience, along with destination shopping and
e-commerce. Primary research indicates that above-average revenue sharing could be achieved due to a number of drivers:
• The captive nature of air passengers;
• The ability to ‘replay’ key messages to an audience with higher propensity for expenditure in the case of frequent travellers;
• Initiating ‘immediate’ call-to-action for personalised goods and services or for opportunistic purchases based on destination or
preferences;
• The opportunity to capture additional consumer data in exchange for access to services.

SKY HIGH ECONOMICS SKY HIGH ECONOMICS
23 24
Average Revenue Contribution The profile for broadband-enabled ancillary services globally is depicted in Chart 6 for the 10-year period between 2018-2028.
This depicts a number of average metrics and the migration in the mix of income from broadband access to other areas.
2028202520222020
$0.23
$0.96
$0.73
$1.80$0.58
$2.39$3.83
$1.20
$2.00
$2.82
$5.03
$8.44
$6.44
$8.97
$11.79
20180%
Advertising Broadband access revenue Streaming and devices E-Commerce: Destination shopping
10%
20%
30%
40%
50%
60%
70%
80%
90%
100%
$0
$2
$4
$6
$8
10
$2
$14
Airline revenue/PAX Supplier revenue/PAX Industry per PAX value and Total Market/PAX
11.47% 26.31% 32.77% 34.62%35.65%
2.04%
85.23% 62.48% 56.13%
53.31% 54.47%
4.14%
2.84%2.78%
8.25% 8.32%8.26%7.07%1.26%
2.59%
Chart 6: Broadband-enabled ancillary revenue by service and average per passenger revenue: 2018-2028
The average revenue per passenger for broadband-enabled ancillary services is $0.96 in 2018, comprised of $0.73 for suppliers
and $0.23 for airlines. By 2028, revenue from broadband access is forecast to reduce to 54% of the total market revenue, whilst
e-commerce revenue is forecast to triple from 11% of total revenue in 2018 to 34% by 2028. Advertising-generated revenue is forecast
to reach 8% of total revenue, with premium content forecast to reach 2.5% of total revenue by 2028. Average airline revenue per
passenger is forecast to increase by 1,060% to $2.67 by 2028. The contribution from each segment is forecast to level off after 2030,
with broadband access revenue flattening at 53% of total revenue and e-commerce at around 40% of the total revenue. Chart 7
depicts growth over 2030-2035.
20352034203320322031
$3
$14
$10$11
$3
$15
$12
$4 $4 $4 $4
$16
$13
$14 $14
$8.97
$17$18 $18
20300%
Advertising Broadband access revenue Streaming and devices E-Commerce: Destination shopping
10%
20%
30%
40%
50%
60%
70%
80%
90%
100%
$2
$2
$4
$6
$8
$10
$12
$14
$16
$18
$20
Airline revenue/PAX Supplier revenue/PAX Total Market/PAX
35.98%38.31% 40.04% 40.91% 40.68%40.62%
53.15% 50.88% 48.65%48.39%49.34% 48.65%
2.51%
2.51%2.47%
4.17% 4.14% 4.13%4.18%4.33%8.37%
2.48% 2.48% 2.48%
Chart 7: Broadband-enabled ancillary revenue by service and average per passenger: 2030-2035

SKY HIGH ECONOMICS SKY HIGH ECONOMICS
25 26
The average airline revenue per passenger is forecast to continue rising to around $4 until 2033 and remaining at this figure
thereafter. This revenue is forecast to generate an average of around $14 per passenger for airline partners engaged in the delivery
of broadband-enabled products and services, yielding a total average per passenger of $18 by 2035, depicted in Chart 8.
203520282025202220202018$0
$2
$4
$6
$8
$10
$12
$14
$18
$16
$20
Supplier revenue/PAX Airline Revenue/PAX Total Market/PAX
$0
.73
$0
.96
$0
.23
$1.8
0
$2.
39
$0
.58
$3
.83 $
5.0
3
$1.2
0
$6
$8
$2
$9
$12
$14
$4
$18
$3
Chart 8: Total ancillary revenue with broadband enabled ancillary revenue growth
Connectivity-enabled ancillary revenue can be complementary to current ancillary revenue, with the majority of this derived from
non-broadband sources such as onboard duty free goods, and accommodation and travel related sales.
Broadband-Enabled Ancillary Revenue
“ The airline industry is rapidly evolving to become retail-focused and airlines will have to reinvent themselves as retailers. Airlines could learn a lot from retail chains like WalMart and Tesco, especially when it comes to offering the right product to the right customer at the right time.”
A. Brogan, CEO, Datalex
The opportunities offered by a broadband-enabled cabin that meets passenger expectations with respect to bandwidth, quality, and
reliability can be significant across both LCCs and FSCs. Of the four segments reviewed, broadband access revenue is forecast to be
the dominant ancillary revenue category. This is likely to reduce to a degree over time as a proportion of the total market as other
services such as advertising, e-commerce, and premium content increase. The revenue that can be generated across all categories
will depend on a number of factors:
• Bargaining power with suppliers, particularly for advertisement revenue sharing and per-ad fees/page impression fees;
• Strategic relationships with major global brands that can provide content;
• Margins obtained from the sale of any goods by the airline from negotiated terms with suppliers;
• The routes flown, with some pairs or destinations offering greater potential for some types of ancillary services enabled
by broadband;
• The composition of the passenger base including low cost versus full service; business versus leisure;58 short haul versus medium
or long haul and other factors;
• The carrier’s strategy: some carriers may outsource all broadband ancillary revenue opportunities and derive a lower commission
whilst others may engage deeper to enhance their operations and margins in the process.
E-commerce and destination shopping represent one of the most significant areas of potential growth that could exceed the
estimates in this paper, due to their under-developed status and the greatest possibility to be impacted by high quality cabin
connectivity. Although this forecast trails broadband revenue and advertising, it has the potential to exceed estimates due to scale
and value of the purchase opportunities. The degree to which this occurs depends on the ability of the airlines to develop shopping,
suppliers and other services that passengers can purchase. Primary research has highlighted that close engagement between an
airline and the participants in the broadband-enabled ancillary revenue ecosystem is a key success factor. The revenue opportunity
areas are summarised in a 10-year revenue window to 2028, and a 20-year window to 2035, aligning with an IATA end-of-period date
for passenger forecasts.
SKY HIGH ECONOMICS SKY HIGH ECONOMICS
27 28
Regional Segmentation
“ Passenger connectivity in aircraft is transforming the aviation industry. Fast, consistent and reliable broadband for passengers is now a reality and, in our always-connected culture, this service is now a necessity rather than a luxury. In the longer term, the connectivity revolution will change the on board retail offering. Nimbler technology and faster broadband connectivity means that advertisers can offer richer online shopping experiences that could see us say goodbye to the traditional inflight trolley.”
M. Franci, SVP, European Sales & Revenue and Inflight Services, Inmarsat Aviation
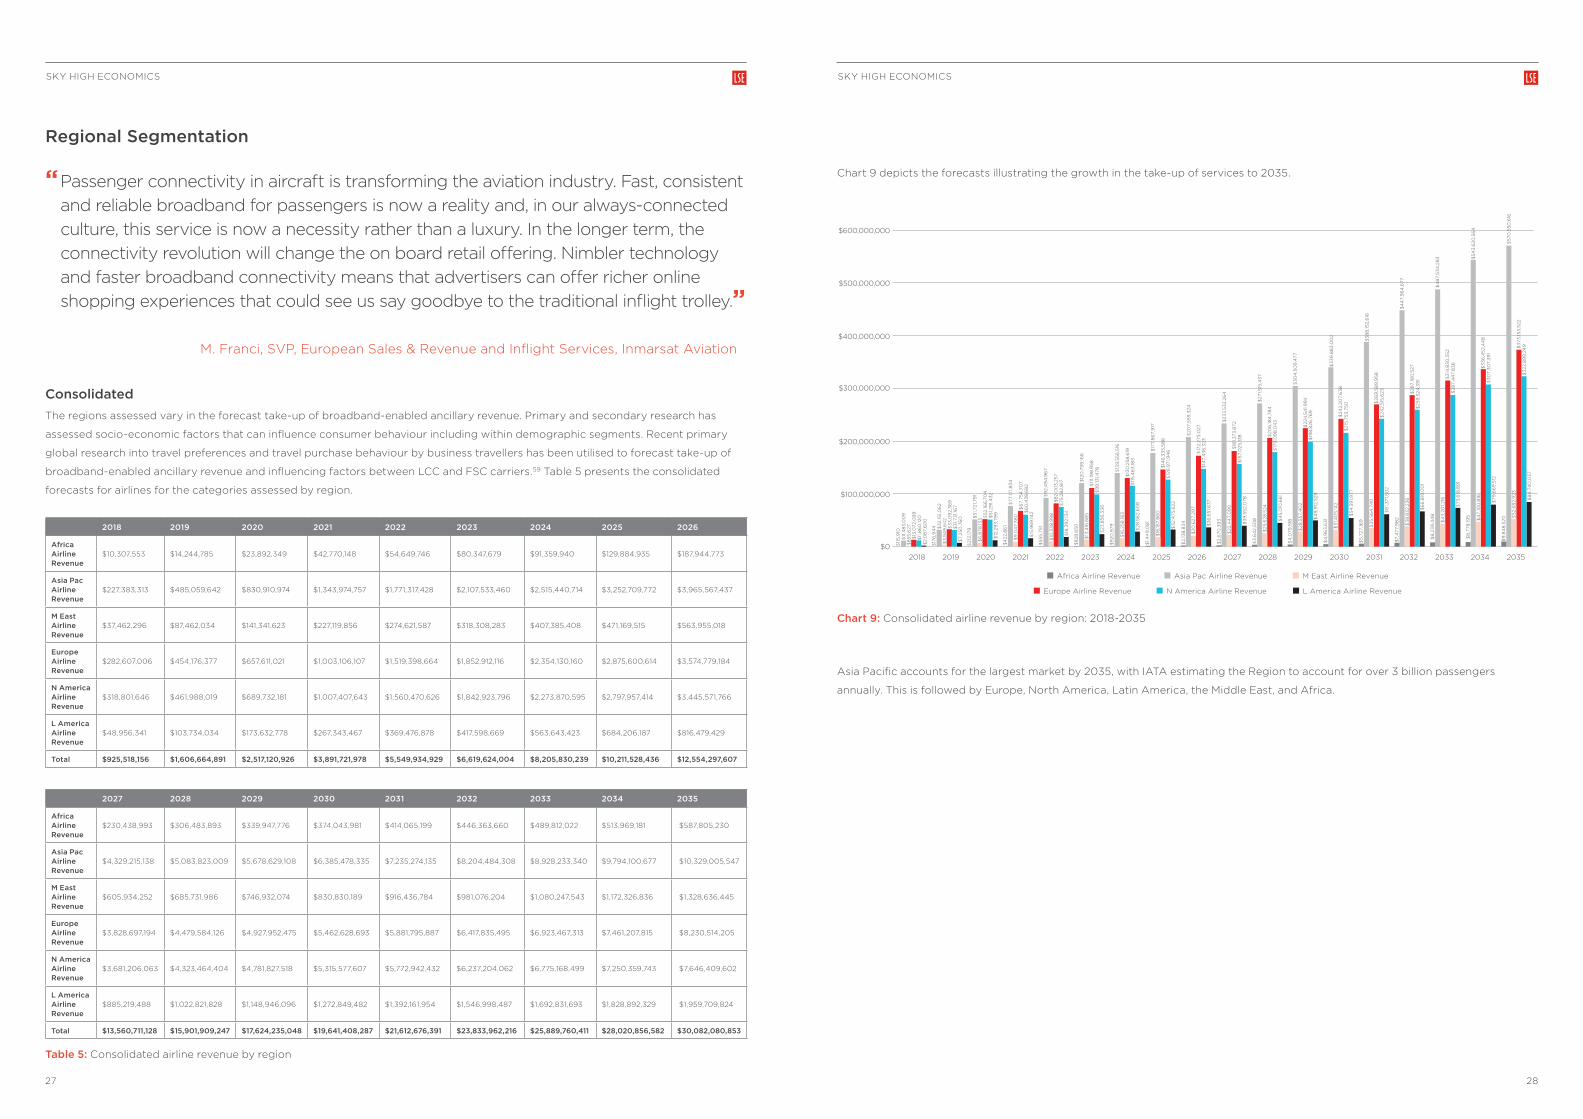
Consolidated The regions assessed vary in the forecast take-up of broadband-enabled ancillary revenue. Primary and secondary research has
assessed socio-economic factors that can influence consumer behaviour including within demographic segments. Recent primary
global research into travel preferences and travel purchase behaviour by business travellers has been utilised to forecast take-up of
broadband-enabled ancillary revenue and influencing factors between LCC and FSC carriers.59 Table 5 presents the consolidated
forecasts for airlines for the categories assessed by region.
2018 2019 2020 2021 2022 2023 2024 2025 2026
Africa Airline Revenue
$10,307,553 $14,244,785 $23,892,349 $42,770,148 $54,649,746 $80,347,679 $91,359,940 $129,884,935 $187,944,773
Asia Pac Airline Revenue
$227,383,313 $485,059,642 $830,910,974 $1,343,974,757 $1,771,317,428 $2,107,533,460 $2,515,440,714 $3,252,709,772 $3,965,567,437
M East Airline Revenue
$37,462,296 $87,462,034 $141,341,623 $227,119,856 $274,621,587 $318,308,283 $407,385,408 $471,169,515 $563,955,018
Europe Airline Revenue
$282,607,006 $454,176,377 $657,611,021 $1,003,106,107 $1,519,398,664 $1,852,912,116 $2,354,130,160 $2,875,600,614 $3,574,779,184
N America Airline Revenue
$318,801,646 $461,988,019 $689,732,181 $1,007,407,643 $1,560,470,626 $1,842,923,796 $2,273,870,595 $2,797,957,414 $3,445,571,766
L America Airline Revenue
$48,956,341 $103,734,034 $173,632,778 $267,343,467 $369,476,878 $417,598,669 $563,643,423 $684,206,187 $816,479,429
Total $925,518,156 $1,606,664,891 $2,517,120,926 $3,891,721,978 $5,549,934,929 $6,619,624,004 $8,205,830,239 $10,211,528,436 $12,554,297,607
2027 2028 2029 2030 2031 2032 2033 2034 2035
Africa Airline Revenue
$230,438,993 $306,483,893 $339,947,776 $374,043,981 $414,065,199 $446,363,660 $489,812,022 $513,969,181 $587,805,230
Asia Pac Airline Revenue
$4,329,215,138 $5,083,823,009 $5,678,629,108 $6,385,478,335 $7,235,274,135 $8,204,484,308 $8,928,233,340 $9,794,100,677 $10,329,005,547
M East Airline Revenue
$605,934,252 $685,731,986 $746,932,074 $830,830,189 $916,436,784 $981,076,204 $1,080,247,543 $1,172,326,836 $1,328,636,445
Europe Airline Revenue
$3,828,697,194 $4,479,584,126 $4,927,952,475 $5,462,628,693 $5,881,795,887 $6,417,835,495 $6,923,467,313 $7,461,207,815 $8,230,514,205
N America Airline Revenue
$3,681,206,063 $4,323,464,404 $4,781,827,518 $5,315,577,607 $5,772,942,432 $6,237,204,062 $6,775,168,499 $7,250,359,743 $7,646,409,602
L America Airline Revenue
$885,219,488 $1,022,821,828 $1,148,946,096 $1,272,849,482 $1,392,161,954 $1,546,998,487 $1,692,831,693 $1,828,892,329 $1,959,709,824
Total $13,560,711,128 $15,901,909,247 $17,624,235,048 $19,641,408,287 $21,612,676,391 $23,833,962,216 $25,889,760,411 $28,020,856,582 $30,082,080,853
Table 5: Consolidated airline revenue by region
Chart 9 depicts the forecasts illustrating the growth in the take-up of services to 2035.
$0
$100,000,000
$200,000,000
$300,000,000
$400,000,000
$500,000,000
$600,000,000
Africa Airline Revenue Asia Pac Airline Revenue M East Airline Revenue
Europe Airline Revenue L America Airline Revenue N America Airline Revenue
203520342033203220312030202920282027202620252024202320222021202020192018
$11
5,9
10
$11
,48
3,0
09
$
855
,627
$
13,0
72,0
99
$
11,8
60
,120
$
2,0
87,
60
0
$17
6,9
44
$
32,
151,0
62
$3
,94
9,6
42
$3
3,0
92,
36
9
$3
1,73
1,16
7 $
7,25
0,7
60
$21
3,17
9$
51,7
21,7
91
$6
,878
,133 $
52,16
6,7
04
$51
,29
1,43
2$
12,2
93
,79
9
$4
22,8
61
$77
,171,8
34
$9
,04
7,3
80
$6
7,75
4,7
07
$6
0,4
38
,68
2$
15,9
69
,142
$55
5,75
1$
92,
49
4,9
67
$10
,33
8,9
98
$8
2,0
03
,257
$75
,28
2,8
17$
18,3
92,
134
$8
28,6
50$
120
,759
,166
$13
,416
,68
5$
111,1
98
,958
$9
9,13
1,478
$23
,856
,33
6
$9
20,9
79$
139
,556
,516
$16
,258
,183
$13
0,2
58,6
19$
115,
46
3,18
3$
28,5
62,
60
8
$1,4
49
,08
1
$2,
138
,83
4
$17
7,8
67,
917
$18
,157,
86
0$
146
,33
5,58
8$
126
,971
,94
6$
32,
475
,622
$20
7,55
9,3
24$
20,6
27,2
97
$17
2,27
5,0
27$
147,
43
6,3
23$
36
,651
,63
7
$2,
670
,39
3$
233
,53
2,26
4$
22,4
47,
09
0$
181,3
73,8
72$
157,
025
,138
$27
1,515
,43
7
$20
6,18
4,7
84
$17
9,0
98
,04
3
$3
9,5
52,0
78
$3
,64
2,50
8
$25
,628
,524
$4
5,0
10,6
81
$3
04
,50
9,4
77
$22
4,5
41,9
94
$
198
,826
,76
9
$3
39
,88
3,0
02
$24
2,20
7,6
38
$21
5,75
3,7
50
$4
,079
,198
$28
,557
,40
2
$4
9,9
12,5
29
$4
,96
3,6
31
$3
1,40
5,14
2
$54
,39
1,977
$3
88
,152,
616
$26
9,5
89
,958
$24
2,51
5,6
23
$5,
727,
169
$3
5,56
4,7
40
$6
1,371
,50
2
$4
47,
96
4,6
77
$28
7,18
0,5
27$
259
,524
,39
1
$7,
477
,98
2
$3
8,8
32,
236
$6
6,8
19,0
01
$4
87,
534
,28
3
$3
14,8
30
,352
$28
7,4
47,
83
6
$8
,23
9,4
48
$4
3,2
01,2
16
$73
,618
,89
1
$54
3,6
20,5
64
$3
36
,452
,44
8$
30
7,3
07,
39
1
$8
,778
,195
$4
7,10
0,8
16
$79
,66
9,5
12
$57
0,5
50,6
16
$3
73,15
3,5
22$
322
,89
9,2
49
$9
,84
8,5
20
$52
,68
2,9
23
$8
4,7
40
,03
7
Chart 9: Consolidated airline revenue by region: 2018-2035
Asia Pacific accounts for the largest market by 2035, with IATA estimating the Region to account for over 3 billion passengers
annually. This is followed by Europe, North America, Latin America, the Middle East, and Africa.
SKY HIGH ECONOMICS SKY HIGH ECONOMICS
29 30
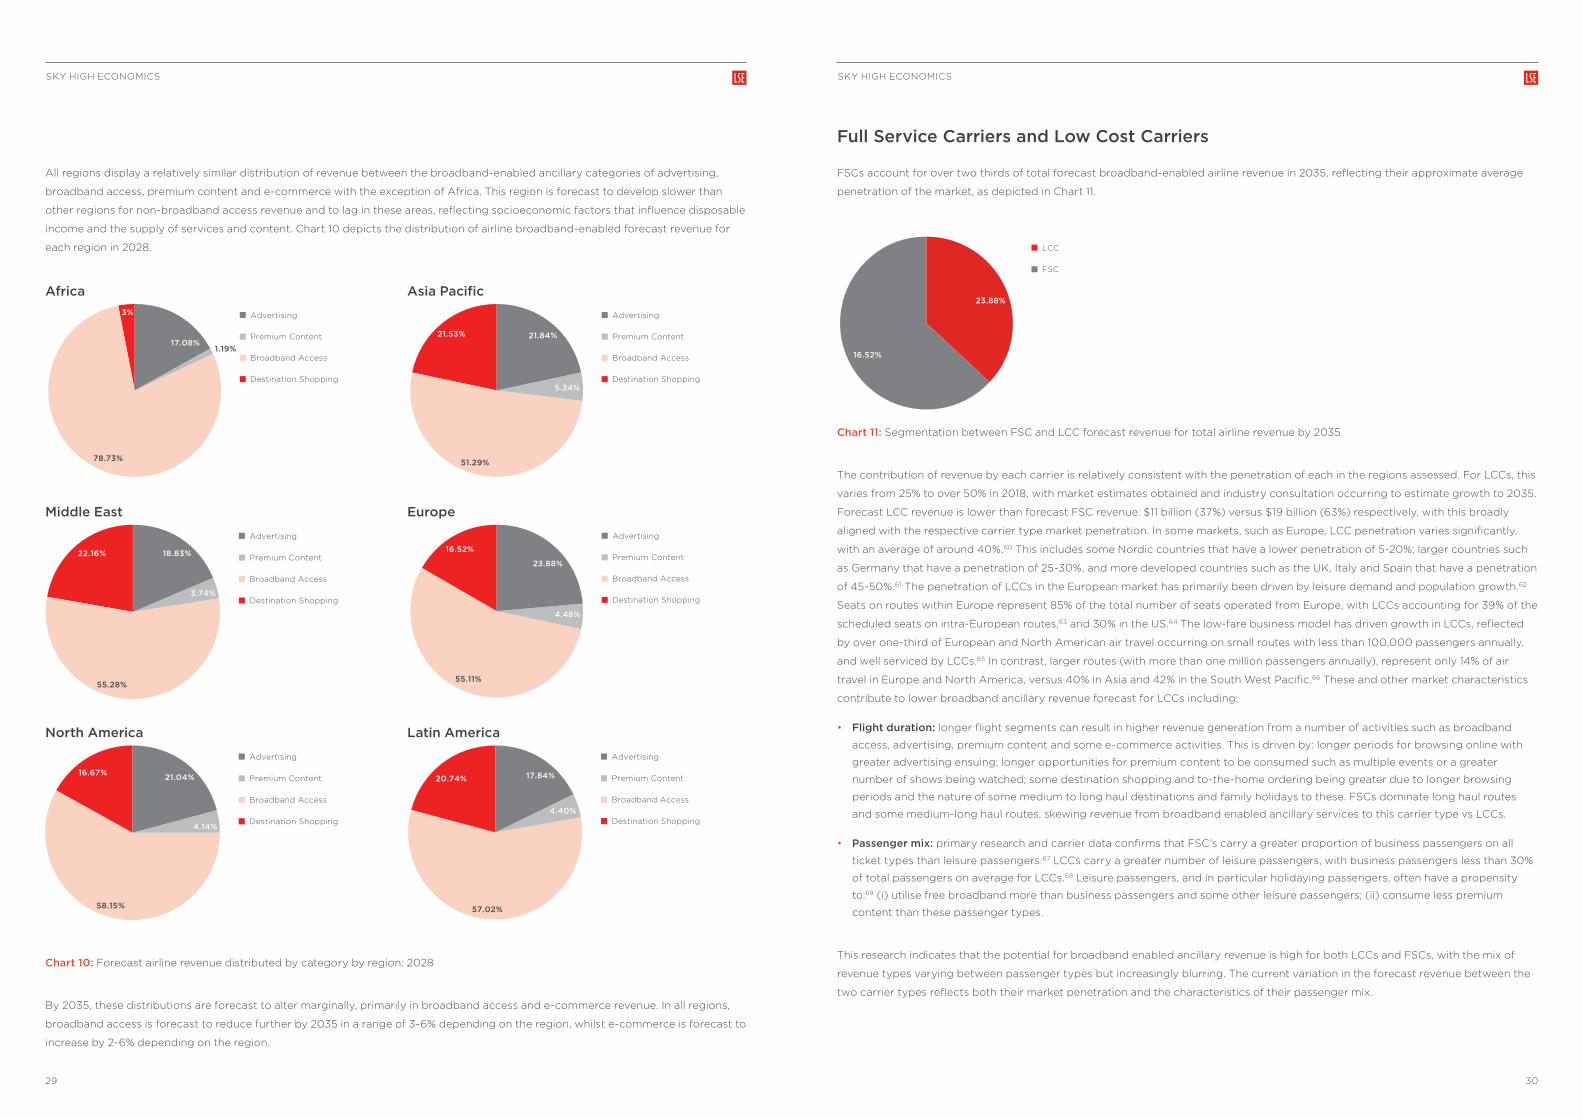
All regions display a relatively similar distribution of revenue between the broadband-enabled ancillary categories of advertising,
broadband access, premium content and e-commerce with the exception of Africa. This region is forecast to develop slower than
other regions for non-broadband access revenue and to lag in these areas, reflecting socioeconomic factors that influence disposable
income and the supply of services and content. Chart 10 depicts the distribution of airline broadband-enabled forecast revenue for
each region in 2028.
21.84%21.53%
5.34%
51.29%
Advertising
Premium Content
Broadband Access
Destination Shopping
Asia Pacific
17.08%
3%
1.19%
78.73%
Advertising
Premium Content
Broadband Access
Destination Shopping
Africa
18.83%22.16%
3.74%
55.28%
Advertising
Premium Content
Broadband Access
Destination Shopping
Middle East
Advertising
Premium Content
Broadband Access
Destination Shopping
23.88%
16.52%
4.48%
55.11%
Europe
21.04%16.67%
4.14%
58.15%
Advertising
Premium Content
Broadband Access
Destination Shopping
North America
17.84%20.74%
4.40%
57.02%
Advertising
Premium Content
Broadband Access
Destination Shopping
Latin America
Chart 10: Forecast airline revenue distributed by category by region: 2028
By 2035, these distributions are forecast to alter marginally, primarily in broadband access and e-commerce revenue. In all regions,
broadband access is forecast to reduce further by 2035 in a range of 3-6% depending on the region, whilst e-commerce is forecast to
increase by 2-6% depending on the region.
Full Service Carriers and Low Cost Carriers
FSCs account for over two thirds of total forecast broadband-enabled airline revenue in 2035, reflecting their approximate average
penetration of the market, as depicted in Chart 11.
LCC
FSC
23.88%
16.52%
Chart 11: Segmentation between FSC and LCC forecast revenue for total airline revenue by 2035
The contribution of revenue by each carrier is relatively consistent with the penetration of each in the regions assessed. For LCCs, this
varies from 25% to over 50% in 2018, with market estimates obtained and industry consultation occurring to estimate growth to 2035.
Forecast LCC revenue is lower than forecast FSC revenue: $11 billion (37%) versus $19 billion (63%) respectively, with this broadly
aligned with the respective carrier type market penetration. In some markets, such as Europe, LCC penetration varies significantly,
with an average of around 40%.60 This includes some Nordic countries that have a lower penetration of 5-20%; larger countries such
as Germany that have a penetration of 25-30%, and more developed countries such as the UK, Italy and Spain that have a penetration
of 45-50%.61 The penetration of LCCs in the European market has primarily been driven by leisure demand and population growth.62
Seats on routes within Europe represent 85% of the total number of seats operated from Europe, with LCCs accounting for 39% of the
scheduled seats on intra-European routes,63 and 30% in the US.64 The low-fare business model has driven growth in LCCs, reflected
by over one-third of European and North American air travel occurring on small routes with less than 100,000 passengers annually,
and well serviced by LCCs.65 In contrast, larger routes (with more than one million passengers annually), represent only 14% of air
travel in Europe and North America, versus 40% in Asia and 42% in the South West Pacific.66 These and other market characteristics
contribute to lower broadband ancillary revenue forecast for LCCs including:
• Flight duration: longer flight segments can result in higher revenue generation from a number of activities such as broadband
access, advertising, premium content and some e-commerce activities. This is driven by: longer periods for browsing online with
greater advertising ensuing; longer opportunities for premium content to be consumed such as multiple events or a greater
number of shows being watched; some destination shopping and to-the-home ordering being greater due to longer browsing
periods and the nature of some medium to long haul destinations and family holidays to these. FSCs dominate long haul routes
and some medium-long haul routes, skewing revenue from broadband enabled ancillary services to this carrier type vs LCCs.
• Passenger mix: primary research and carrier data confirms that FSC’s carry a greater proportion of business passengers on all
ticket types than leisure passengers.67 LCCs carry a greater number of leisure passengers, with business passengers less than 30%
of total passengers on average for LCCs.68 Leisure passengers, and in particular holidaying passengers, often have a propensity
to:69 (i) utilise free broadband more than business passengers and some other leisure passengers; (ii) consume less premium
content than these passenger types.
This research indicates that the potential for broadband enabled ancillary revenue is high for both LCCs and FSCs, with the mix of
revenue types varying between passenger types but increasingly blurring. The current variation in the forecast revenue between the
two carrier types reflects both their market penetration and the characteristics of their passenger mix.

SKY HIGH ECONOMICS SKY HIGH ECONOMICS
31 32
“ Travelling for work is something I do pretty regularly, so in recent years the ability to use the internet in the sky has become an added bonus. When it’s not there, I definitely notice it. Being connected just makes things easier. I don’t need to worry about missing an email or accessing a document. I can let my family know what I’m up to and it makes the whole process much better.”
Business Traveller
AfricaForecast broadband-enabled revenue for Africa shows a stronger growth for domestic LCCs and FSCs, reflecting the greater
emphasis on travel within Africa. Growth is lower amongst international LCCs, reflecting their lower predominance, but higher
amongst FSCs internationally as the market develops over time. The total airline market is forecast to be worth $306 million by
10-years to 2028 as depicted in Chart 12.
20282027202620252024202320222021202020192018$0
$50,000,000
$100,000,000
$150,000,000
$200,000,000
$300,000,000
$250,000,000
$350,000,000
LCC-Dom FCC-Dom LCC-Int FCC-Int
2018 2019 2020 2021 2022 2023 2024 2025 2026 2027 2028
LCC-DOM $3,400,094 $3,979,950 $6,539,465 $12,254,722 $15,222,812 $23,274,502 $25,735,367 $39,081,129 $56,704,050 $64,093,767 $91,012,971
FSC-DOM $4,710,381 $6,028,590 $10,177,110 $18,712,958 $22,840,255 $33,996,833 $38,146,039 $53,988,644 $76,958,000 $105,452,310 $139,040,792
LCC-INT $407,633 $879,040 $1,404,810 $1,935,713 $3,062,605 $4,508,044 $5,381,704 $6,754,559 $9,314,957 $10,438,310 $14,165,294
FSC-INT $1,796,167 $3,370,017 $5,785,552 $9,886,367 $13,549,483 $18,599,737 $22,132,003 $30,103,903 $45,036,366 $50,540,587 $62,386,669
Total $10,314,275 $14,257,597 $23,906,937 $42,789,761 $54,675,155 $80,379,115 $91,395,112 $129,928,236 $188,013,373 $230,524,975 $306,605,726
Chart 12: Total airline broadband enabled ancillary revenue for Africa by LCC and FSC vs. domestic and international travel
Asia PacificAsia Pacific broadband-enabled forecasts contrast African forecasts in both scale and the composition of LCC and FSC segments.
Airline revenue is forecast to be over $5 billion for the region by 2028, with a more even distribution of revenue estimated between
LCC and FSC categories. A number of international LCCs are emerging from this region, reflecting forecast ancillary revenue from
cabin activities driven by connectivity as a result, as depicted in Chart 13.
20282027202620252024202320222021202020192018$0
$1,000,000,000
$2,000,000,000
$3,000,000,000
$5,000,000,000
$4,000,000,000
$6,000,000,000
LCC-Dom FCC-Dom LCC-Int FCC-Int
2018 2019 2020 2021 2022 2023 2024 2025 2026 2027 2028
LCC-DOM $54,811,786 $130,157,874 $237,184,076 $401,684,657 $528,491,266 $621,518,049 $758,759,187 $1,066,304,006 $1,277,314,732 $1,433,173,058 $1,792,042,130
FSC-DOM $54,426,867 $107,755,339 $190,365,993 $301,861,691 $389,961,559 $456,314,123 $512,264,878 $708,428,145 $898,011,262 $958,278,190 $1,108,343,475
LCC-INT $14,797,777 $39,069,451 $58,240,888 $84,246,161 $122,376,041 $164,388,867 $207,056,873 $249,064,278 $303,996,055 $333,243,441 $423,919,905
FSC-INT $103,568,372 $206,814,344 $342,527,447 $552,216,148 $723,104,383 $858,894,161 $1,028,815,410 $1,217,229,903 $1,473,297,761 $1,592,412,530 $1,763,258,298
Total $227,604,802 $483,797,007 $828,318,404 $1,340,008,657 $1,763,933,249 $2,101,115,200 $2,506,896,348 $3,241,026,332 $3,952,619,809 $4,317,107,218 $5,087,563,808
Chart 13: Total airline broadband enabled ancillary revenue for Asia Pacific by LCC and FSC vs. domestic and international travel

SKY HIGH ECONOMICS SKY HIGH ECONOMICS
33 34
Middle EastThe Middle East region represents one of the higher revenue opportunities for both domestic and international FSCs, depicting the
very strong position of many global FSCs have that are based in this region. This includes many of these airlines offering onboard
connectivity and passenger-centric value added services, including free and paid broadband, shopping and other services. Carriers
from this and other regions are expected to continue offering both free and paid-for broadband connectivity with ‘free’ options
characterised by restricted bandwidth and download data limits and other criteria.70 It is expected that this trend will continue. The
Middle East is forecast to generate almost $700 million by 2028 for airlines as depicted in Chart 14.
20282027202620252024202320222021202020192018$0
$100,000,000
$300,000,000
$200,000,000
$400,000,000
$500,000,000
$700,000,000
$600,000,000
$800,000,000
LCC-Dom FCC-Dom LCC-Int FCC-Int
2018 2019 2020 2021 2022 2023 2024 2025 2026 2027 2028
LCC-DOM $11,293,006 $22,506,064 $36,469,221 $56,428,831 $68,324,179 $77,014,441 $103,884,003 $120,739,562 $135,567,561 $148,275,454 $169,346,789
FSC-DOM $17,170,136 $44,306,618 $72,716,762 $111,699,144 $129,339,455 $147,200,570 $189,281,392 $210,099,593 $260,066,331 $276,142,651 $301,495,739
LCC-INT $1,164,550 $3,317,588 $5,033,811 $7,968,474 $10,836,271 $15,387,760 $18,734,594 $22,412,176 $27,414,440 $30,167,462 $39,503,869
FSC-INT $7,834,603 $17,331,764 $27,121,828 $51,023,406 $66,121,683 $78,705,512 $95,485,419 $117,918,184 $140,906,686 $151,348,685 $175,385,589
Total $37,462,296 $87,462,034 $141,341,623 $227,119,856 $274,621,587 $318,308,283 $407,385,408 $471,169,515 $563,955,018 $605,934,252 $685,731,986
Chart 14: Total airline broadband enabled ancillary revenue for the Middle East by LCC and FSC vs. domestic and international travel
EuropeChart 15 depicts the forecast airline revenue for Europe, which is estimated to reach $4.4 billion by 2028. This region displays a
disproportionally high revenue from international FSCs, including medium and long haul flights. Both international FSCs and LCCs
show the highest broadband-enabled ancillary revenue potential, with FSCs in particular accounting for around two thirds of the total
forecast airline revenue. Around one third is accounted for by international LCCs.
20282027202620252024202320222021202020192018$0
$500,000,000
$1,000,000,000
$2,000,000,000
$4,000,000,000
$3,000,000,000
$5,000,000,000
$1,500,000,000
$3,500,000,000
$2,500,000,000
$4,500,000,000
LCC-Dom FCC-Dom LCC-Int FCC-Int
2018 2019 2020 2021 2022 2023 2024 2025 2026 2027 2028
LCC-DOM $53,693,285 $75,517,009 $100,746,030 $127,664,402 $191,938,049 $221,021,115 $275,242,865 $319,592,775 $407,641,768 $447,986,587 $509,661,791
FSC-DOM $56,852,803 $79,602,510 $101,728,057 $149,693,222 $231,075,006 $256,980,119 $342,094,372 $413,945,597 $531,273,361 $529,409,265 $606,281,690
LCC-INT $64,917,686 $117,961,748 $183,571,300 $242,431,015 $388,819,694 $507,444,472 $627,663,258 $746,521,685 $895,448,578 $1,036,363,497 $1,183,510,955
FSC-INT $107,143,232 $181,095,109 $271,565,634 $483,317,468 $707,565,914 $867,466,409 $1,109,129,664 $1,395,540,557 $1,740,415,478 $1,814,937,845 $2,180,129,691
Total $282,607,006 $454,176,377 $657,611,021 $1,003,106,107 $1,519,398,664 $1,852,912,116 $2,354,130,160 $2,875,600,614 $3,574,779,184 $3,828,697,194 $4,479,584,126
Chart 15: Total airline broadband enabled ancillary revenue for Europe by LCC and FSC vs. domestic and international travel

SKY HIGH ECONOMICS SKY HIGH ECONOMICS
35 36
North AmericaNorth America displays strong international FSC forecast revenue, accounting for over $4.3 billion estimated broadband-enabled
ancillary revenue by 2028. The region also has a strongly developed domestic LCC and FSC market, and over time, a growing
international LCC market. Chart 16 depicts the four segments and the move to greater mirroring of the two FSC and the two LCC
segments respectively over time.
20282027202620252024202320222021202020192018$0
$500,000,000
$1,000,000,000
$2,000,000,000
$4,000,000,000
$3,000,000,000
$5,000,000,000
$1,500,000,000
$3,500,000,000
$2,500,000,000
$4,500,000,000
LCC-Dom FCC-Dom LCC-Int FCC-Int
2018 2019 2020 2021 2022 2023 2024 2025 2026 2027 2028
LCC-DOM $93,256,115 $111,554,274 $144,019,235 $176,737,507 $262,489,433 $292,635,150 $391,002,891 $467,674,138 $608,466,453 $639,562,328 $789,393,942
FSC-DOM $122,413,947 $168,377,742 $226,132,064 $327,227,090 $500,435,201 $567,200,017 $702,805,513 $865,903,756 $1,068,448,344 $1,151,054,688 $1,294,266,853
LCC-INT $11,427,172 $30,815,345 $51,925,936 $71,501,926 $115,442,209 $162,896,346 $199,935,803 $238,960,173 $294,372,187 $320,642,298 $424,324,065
FSC-INT $91,704,413 $151,240,659 $267,654,947 $431,941,120 $682,103,783 $820,192,284 $980,126,389 $1,225,419,346 $1,474,284,782 $1,569,946,749 $1,815,479,544
Total $318,801,646 $461,988,019 $689,732,181 $1,007,407,643 $1,560,470,626 $1,842,923,796 $2,273,870,595 $2,797,957,414 $3,445,571,766 $3,681,206,063 $4,323,464,404
Chart 16: Total airline broadband enabled ancillary revenue for North America by LCC and FSC vs. domestic and international travel
Latin AmericaLatin America is forecast to generate $1 billion in broadband enabled revenue for the airlines by 2028, as depicted in Chart 17. Large
internal distances and strong established international routes from FSCs serve to drive the potential distribution of revenue to FSCs,
but this is expected to become relatively more equal over time in this market. International LCCs generate a smaller but growing
revenue component, reflecting a global trend towards more LCCs entering long-haul flights, facilitated by new generations of more
fuel efficient aircraft capable of flying long distances.
20282027202620252024202320222021202020192018$0
$200,000,000
$1,200,000,000
$400,000,000
$800,000,000
$600,000,000
$1,000,000,000
LCC-Dom FCC-Dom LCC-Int FCC-Int
2018 2019 2020 2021 2022 2023 2024 2025 2026 2027 2028
LCC-DOM $16,000,897 $36,408,811 $60,397,839 $89,582,881 $115,344,761 $131,101,398 $187,817,977 $219,741,461 $254,963,043 $275,840,240 $327,172,818
FSC-DOM $20,067,323 $38,958,037 $67,910,312 $94,168,525 $138,931,204 $146,203,436 $201,325,110 $249,777,035 $305,218,105 $334,613,012 $367,499,620
LCC-INT $1,564,631 $4,913,620 $7,385,962 $11,573,438 $16,590,040 $23,275,762 $29,212,322 $34,967,446 $43,147,397 $47,184,146 $62,776,101
FSC-INT $11,323,490 $23,453,565 $37,938,665 $72,018,624 $98,610,873 $117,018,072 $145,288,013 $179,720,245 $213,150,885 $227,582,090 $265,373,289
Total $48,956,341 $103,734,034 $173,632,778 $267,343,467 $369,476,878 $417,598,669 $563,643,423 $684,206,187 $816,479,429 $885,219,488 $1,022,821,828
Chart 17: Total airline broadband enabled ancillary revenue for Latin America by LCC and FSC vs. domestic and international travel
Regional Broadband-Enabled Revenue CategoriesThis section consolidates the forecasts per region for LCCs and FSCs, both for 10-year forecasts to 2028 and to 2035. It provides
further background to the categories utilised and displays the forecasts by region for advertising, broadband revenue, premium
content and e-commerce and destination Shopping.

SKY HIGH ECONOMICS SKY HIGH ECONOMICS
37 38
AdvertisingConsumers are bringing their online expectations to travel environments irrespective of whether this is with an LCC or an FSC. Airlines
are currently segmenting their broadband access in many cases to offer free and paid-for access. ‘Free broadband’ most often entails
some restrictions such as throttled speed; data restrictions; advertising (both static and dynamic adverts and video), and other
modes that offset the cost of service or can act as a profit centre. Research indicates that user acceptance of mobile advertising
can be high, especially when ‘trust’ is established.71 The use of add-on advertising is widely accepted by consumers. Advertisers are
increasingly shifting to ‘relevance’ with content that consumers can identify with.72 This also maximises the call-to-action that can
yield additional revenue being generated either through purchasing behaviour or through the clicking of advertisements or content
that is presented.
Two potential advertising-driven revenue generation modes have been quantified. These mirror terrestrial online advertising models
that consumers are familiar with, and that advertisers and content providers utilise to reach their target markets. The two areas of
opportunity assessed encompass: (1) page impressions and click-through-revenue generation applicable to both paid and free-
access broadband, and; (2) video/content interrupting advertising applicable to ‘free access’ broadband (e.g. YouTube and Spotify).
Advertising: Page Impressions and Pay Per ClickThis revenue opportunity reflects one of the most mature elements of internet browsing: the use of advertisements positioned
on pages with the aim of promoting a click-through. This area is not currently developed to a significant degree today, but the
opportunity exists for airlines to generate higher revenue from advertising. This includes a greater degree of airline engagement
and investment, such as managing the promotion of adverts on its network of pages that range such as on a portal (landing page)
from which the airline can capture and channel registration, through to offering web browsing but with appropriate identification
and commercial arrangements to capture page impressions and click-through on adverts by passengers to generate revenue for
the airline.
The use of advertising at 35,000 feet poses challenges when using traditional modes of calculating payment rates, including cross-
border considerations, any technical elements required to be implemented to enable the clear identification and assignment of
revenue and the unique nature of the captive market that has a lower substitutability factor for other activities compared to terrestrial
browsing. This could result in airlines offering internet access through their portal after registration by a passenger, as occurs with
many free broadband Wi-Fi services in hotels, venues, and other locations. Passenger activity can be tracked and revenue generated
through the capturing of calls-to-action including click-through and conversions. In order to define revenue in one of the more
difficult areas of activity to quantify at present, due to the infancy of this opportunity, industry averages were utilised where possible
and a simplified approach utilised based on payment per click but reflecting the unique nature of the opportunity to personalise
content. This included an estimation of the time a passenger could view content based on flight characteristics (duration; browsing
times available) and an average pay per click and sharing of revenue with a third party, such as a content provider.
Primary research indicates that the unique nature of a ‘contained’ passenger audience in the air offers airlines the opportunity to
segment and offer multiple services for broadband access. This includes revenue generation from pay per click. The degree to which
this can occur is dependent on multiple factors including the engagement of the airline and the development of commercial, technical
and other collaborative arrangements with third parties. This encompasses both an ‘open access model’ for broadband connectivity
and lower participation by the airline, and a proactive model of engagement facilitating a wide ecosystem of pay per click including
personalised content. The degree to which the identification of the flight and the airline can occur will determine the size of the
opportunity available and the rates negotiated. This is expected to be higher than terrestrial browsing, reflecting an ‘audience in
the sky’ that the airline is seeking to monetise for a finite duration. This potential opportunity should be viewed as a starting point
with the degree of revenue generation dependent on such factors and others. Table 6 depicts the potential market opportunity for
this service:
Advertising – Page Impressions/Pay Per Click
2018 2019 2020 2021 2022 2023 2024 2025 2026
Africa $186,904 $2,465,288 $3,663,464 $5,506,004 $10,148,280 $11,269,198 $14,345,020 $18,769,443 $27,407,215
Asia Pac $6,762,944 $71,852,270 $119,489,827 $176,334,125 $304,200,473 $354,244,241 $478,908,434 $555,899,546 $756,844,727
Middle East $745,024 $9,672,493 $16,286,321 $22,650,338 $38,234,759 $45,771,485 $62,122,261 $68,995,947 $91,934,177
Europe $4,511,692 $47,641,353 $83,934,614 $119,664,655 $208,710,411 $253,541,231 $341,129,954 $382,458,614 $515,417,565
N America $7,751,341 $71,010,194 $126,856,495 $157,410,341 $295,833,644 $344,099,999 $458,948,445 $501,245,621 $670,276,847
L America $1,376,723 $14,350,762 $23,854,739 $32,840,144 $54,866,062 $65,069,233 $87,752,630 $96,647,122 $127,770,146
Total Market Forecast $21,334,628 $216,992,359 $374,085,461 $514,405,607 $911,993,629 $1,073,995,387 $1,443,206,744 $1,624,016,293 $2,189,650,676
Total Airline Revenue $10,667,314 $108,496,179 $187,042,730 $257,202,803 $455,996,814 $536,997,693 $721,603,372 $812,008,146 $1,094,825,338
2027 2028 2029 2030 2031 2032 2033 2034 2035
Africa $31,842,683 $34,974,085 $38,979,999 $42,679,866 $48,410,281 $53,080,687 $58,201,669 $63,816,694 $69,342,042
Asia Pac $835,590,514 $907,613,023 $1,060,428,287 $1,160,497,742 $1,348,427,595 $1,580,635,659 $1,716,792,272 $1,889,017,250 $1,981,280,763
Middle East $100,182,036 $109,169,779 $126,379,720 $137,720,261 $158,890,397 $173,150,991 $199,162,318 $217,040,385 $232,615,491
Europe $552,988,695 $592,399,091 $675,584,233 $724,217,403 $823,270,063 $883,076,849 $1,001,430,044 $1,074,472,572 $1,200,634,607
N America $718,268,257 $769,682,132 $892,126,847 $956,052,141 $1,102,129,963 $1,181,104,171 $1,355,183,654 $1,452,294,161 $1,525,979,220
L America $138,070,218 $149,200,440 $171,365,964 $185,185,523 $211,970,252 $229,069,951 $261,401,613 $282,467,957 $297,367,930
Total Market Forecast $2,376,942,404 $2,563,038,551 $2,964,865,051 $3,206,352,936 $3,693,098,551 $4,100,118,309 $4,592,171,569 $4,979,109,020 $5,307,220,053
Total Airline Revenue $1,188,471,202 $1,281,519,276 $1,482,432,526 $1,603,176,468 $1,846,549,275 $2,050,059,154 $2,296,085,784 $2,489,554,510 $2,653,610,027
Table 6: Broadband-enabled pay per click revenue: 2018-2028

SKY HIGH ECONOMICS SKY HIGH ECONOMICS
39 40
A slower initial take-up has been factored, reflecting feedback from primary research on the period potentially required for this
service to become established and to permit the appropriate operational models to be defined. A nominal figure of $10 million has
been forecast for airlines in 2018, due to the infancy of this opportunity and the activities required to facilitate its implementation.
Revenue has subsequently been forecast to rise to almost $1.3 billion for airlines by 10-years to 2028 and $2.7 billion by 2035,
depending on the revenue sharing arrangements implemented, commission rates secured and other factors including differing
delivery models. This could take the form of ‘sponsorship’ on a per passenger basis by an advertiser including by route (‘destination’),
or on other factors that monetise the value of a more captive audience. The forecast revenue should be viewed as indicative of the
potential opportunities inherent in the market, with the ultimate delivery model formative at present. Chart 18 depicts the forecast
revenue component for airlines by region to 2035.
$0
$200,000,000
$400,000,000
$800,000,000
$600,000,000
$1,000,000,000
$1,200,000,000
$1,400,000,000
Africa Airline Revenue Asia Pac Airline Revenue M East Airline Revenue
Europe Airline Revenue L America Airline Revenue N America Airline Revenue
203520342033203220312030202920282027202620252024202320222021202020192018
$13
2,4
00
$5,
376
,83
5$
576
,50
4$
3,6
69
,229
$5,
740
,28
2$
94
2,9
21
$9
15,3
83
$3
4,9
45,
286
$4
,379
,44
6$
23,7
29,2
02
$3
2,4
72,4
73$
6,5
80
,48
7
$1,9
21,8
77 $71
,452
,273
$9
,079
,98
0$
46
,96
5,4
73$
69
,251
,28
1$
13,4
74,8
77
$3
,823
,221
$13
0,9
61,8
15$
16,6
34
,40
9$
80
,117,
511
$10
9,18
0,7
18$
24,0
78,16
1
$6
,26
7,3
74$
214
,06
0,7
22$
25,7
04
,98
6 $12
7,8
55,13
9$
189
,199
,970
$3
7,9
41,1
80
$9
,23
0,7
03
$26
0,9
43
,721
$3
1,070
,33
6$
162,
94
2,0
79$
233
,116
,029
$4
4,9
04
,03
6
$11
,679
,850
$3
30
,755
,474
$4
1,98
0,7
51$
211,4
50,6
66
$29
6,3
11,4
45
$6
0,0
14,4
09
$15
,66
4,5
70
$24
,34
3,5
99
$4
20,4
27,2
28$
49
,09
5,16
1$
250
,912
,228 $3
47,
46
7,0
53$
72,16
6,0
00
$52
2,15
1,40
0$
60
,70
4,3
86
$3
23,8
69
,73
8 $4
38
,160
,94
3$
89
,03
5,0
07
$26
,816
,876
$56
4,4
49
,522
$6
5,3
33
,670
$3
43
,478
,08
4 $4
63
,64
7,6
69
$6
56,4
76,4
35
$3
87,
650
,84
0 $52
4,8
72,2
95
$9
4,8
74,13
8
$3
4,8
74,4
28
$74
,53
7,4
83
$10
7,8
27,0
53
$70
9,9
24,7
75
$4
10,9
74,3
04
$55
8,5
48
,46
8
$8
32,
655
,79
0
$4
73,6
06
,78
2$
652
,93
7,22
3
$3
7,76
7,27
0
$79
,951
,771
$11
6,14
7,6
36
$4
1,30
4,7
97
$9
2,71
4,7
28
$13
3,12
2,52
4
$9
09
,78
4,16
4
$50
9,0
51,0
72$
703
,74
7,9
41
$4
5,3
92,
64
5
$10
1,50
7,19
4
$14
4,4
85,
96
5
$9
93
,96
2,16
0
$54
1,212
,105
$74
6,3
64
,56
4
$4
9,0
64
,99
0
$10
8,5
16,10
9
$15
5,3
42,
623
$1,0
83
,68
0,7
98
$58
1,84
7,13
5$
80
5,8
59,8
88
$53
,94
1,815
$11
9,0
30
,720
$16
8,8
87,
221
$1,1
77,2
10,8
80
$6
23,5
57,7
92
$8
62,
80
9,7
19
$57
,28
0,3
18
$12
9,2
65,
296
$18
2,4
75,3
03
$1,2
34
,76
6,3
04
$6
95,
798
,49
0$
90
6,5
86
,102
$6
4,0
89
,03
1
$14
5,3
87,
278
$19
2,4
62,
99
9
Chart 18: Broadband-enabled ancillary revenue for airlines for pay per click: 2018-2035
Advertising: Ad-Supported Free Broadband Connectivity The second broadband-enabled source of advertising revenue is widely utilised by leading dynamic content providers of ‘free access’
such as YouTube, Spotify and SoundCloud: interrupted content with advertisements. This can take the form of short or longer videos,
audio adverts, static adverts, with more popular content often attracting a higher frequency of interruptions. YouTube is a market
leader in the monetisation of its 1.3 billion user base that watches five billion videos per day,73 through both interrupted and placed
adverts. This model bridges a gap between Netflix’s subscription ad-free service and the development of a new service offering
original shows, supported by adverts. The Company has highlighted a gap in the market for those seeking a subscription-free content
experience for original shows.74 Following primary and secondary research, the model defined for ad-supported free broadband
utilises a number of elements drawn directly from leading ad-supported content models:
• Interruption of free broadband access with either video, audio or static adverts;
• The time between interruptions is based on flight duration, with longer flights (medium and long-haul) resulting in longer times
between interruptions;
• The type of adverts presented vary and include a mix of audio, video and static modes;
• Adverts can be personalised to individual passengers if they are logged in based on information known about them, or to a
segment such as a popular holiday route or a high-frequency city route.
Revenue sharing could potentially occur equally, or even higher for the airline, depending on the commercial terms negotiated.
The potential revenue for this market is summarised in Table 7, with an equal revenue sharing assumed for ads. This yields potential
revenue for airlines of around $1.8 billion by 2028.
Advertising- Commercials (for free Connectivity Option)
2018 2019 2020 2021 2022 2023 2024 2025 2026
Africa $220,666 $1,525,638 $3,203,128 $6,372,034 $10,445,623 $15,384,505 $19,466,416 $26,107,617 $40,572,666
Asia Pac $8,963,502 $58,248,835 $119,111,080 $218,320,691 $356,833,837 $434,982,385 $551,361,606 $700,855,574 $870,417,353
Middle East $960,841 $7,299,077 $15,133,301 $27,724,015 $42,841,644 $51,783,894 $69,967,918 $81,825,268 $101,173,976
Europe $6,115,382 $39,548,669 $78,275,789 $133,529,186 $213,091,898 $271,570,132 $352,417,776 $418,187,046 $539,782,896
N America $9,567,137 $54,120,789 $115,418,801 $181,967,863 $315,333,284 $388,526,715 $493,852,408 $579,111,755 $730,268,239
L America $1,571,535 $10,967,478 $22,458,129 $40,130,269 $63,235,300 $74,840,060 $100,024,015 $120,276,666 $148,391,678
Total Market Forecast $27,399,063 $171,710,486 $353,600,228 $608,044,059 $1,001,781,585 $1,237,087,691 $1,587,090,140 $1,926,363,927 $2,430,606,807
Total Airline Revenue $16,438,171 $103,022,277 $212,145,762 $364,795,835 $601,029,370 $742,206,904 $952,192,595 $1,155,732,239 $1,458,265,073
2027 2028 2029 2030 2031 2032 2033 2034 2035
Africa $44,694,794 $58,124,046 $62,945,450 $68,841,328 $75,654,408 $81,774,983 $89,903,025 $95,467,196 $106,815,052
Asia Pac $940,922,026 $1,094,378,041 $1,183,480,600 $1,388,066,098 $1,516,640,272 $1,656,989,569 $1,806,554,491 $1,962,502,465 $2,058,452,631
Middle East $108,889,450 $124,229,138 $133,252,952 $154,524,546 $169,178,657 $180,860,182 $198,384,534 $215,442,161 $242,312,129
Europe $572,463,473 $646,084,733 $684,957,173 $789,344,636 $848,418,454 $902,020,174 $969,745,225 $1,039,262,987 $1,159,664,151
N America $772,746,115 $874,787,158 $930,914,113 $1,088,228,705 $1,172,913,235 $1,243,940,940 $1,343,099,813 $1,438,016,198 $1,510,976,836
L America $158,123,564 $179,711,755 $193,579,393 $221,870,874 $240,809,942 $258,904,372 $281,478,701 $304,125,504 $320,771,665
Total Market Forecast $2,597,839,422 $2,977,314,871 $3,189,129,681 $3,710,876,187 $4,023,614,968 $4,324,490,220 $4,689,165,789 $5,054,816,512 $5,398,992,465
Total Airline Revenue $1,558,599,960 $1,786,238,533 $1,913,314,224 $2,226,341,844 $2,413,968,981 $2,594,462,551 $2,813,247,577 $3,032,599,308 $3,239,090,204
Table 7: Broadband-enabled ancillary revenue for ad-supported free broadband connectivity

SKY HIGH ECONOMICS SKY HIGH ECONOMICS
41 42
The market potential for this segment displays the highest potential for commercialisation, with industry discussions highlighting a
number of factors for the accelerated take-up of the services commencing from a lower base. By 2035, this market could generate
around $3.2 billion in revenue, for airlines. This utilises current advertisement costs drawn from a representative group of online global
brands that utilise interrupted advertising; revenue sharing data; passenger demand forecasts and other factors.
20282027202620252024202320222021202020192018$0
$1,000,000,000
$6,000,000,000
$2,000,000,000
$4,000,000,000
$3,000,000,000
$5,000,000,000
Africa Asia Pacific Middle East Europe North America Latin America
Chart 19: Broadband-enabled ancillary revenue for ad-supported free broadband connectivity: 2018-2035
$0
$50,000,000
$100,000,000
$200,000,000
$300,000,000
$250,000,000
$150,000,000
$400,000,000
$350,000,000
$450,000,000
$500,000,000
Africa Airline Revenue Asia Pac Airline Revenue M East Airline Revenue
Europe Airline Revenue L America Airline Revenue N America Airline Revenue
20352027202620252024202320222021202020192018
$9
3,4
52$
3,3
81,4
72
$3
72,5
12
$2,
255,
84
6
$3
,875
,670
$6
88
,36
2
$4
5,9
67,
08
8
$3
1,06
1,13
1
$19
,117,
379
$1,2
32,
64
4 $3
5,9
26,13
5
$4
,83
6,2
46
$23
,820
,676
$3
5,50
5,0
97
$7,
175,
38
1
$1,8
31,7
32
$59
,74
4,9
13
$8
,143
,161 $
41,9
67,
30
7
$6
3,4
28,2
48
$11
,927
,36
9
$2,
753
,00
2
$8
8,16
7,0
62
$11
,325
,169
$59
,83
2,3
27
$16
,420
,072
$78
,70
5,17
1
$5,
074
,140
$15
2,10
0,2
36
$10
4,3
55,2
05
$27
,43
3,0
31
$5,
63
4,5
99
$14
7,9
16,8
22
$17
7,12
2,12
0
$12
6,7
70,6
15
$22
,88
5,74
3
$17
2,0
50,0
00
$7,
172,
510
$3
2,53
4,6
16
$23
9,4
54,2
17
$4
3,8
76,3
15
$17
0,5
64
,977
$22
9,4
74,2
23
$4
8,3
23,5
61
$27
7,9
49
,773
$9
,38
4,7
22
$3
4,4
97,
973
$19
1,229
,30
7
$25
0,6
22,8
10
$3
78,4
22,3
63
$13
,70
3,6
08
$25
7,70
8,7
82
$4
17,7
95,
257
$3
35,
138
,423
$6
3,8
85,
073
$3
59,13
4,12
9
$15
,921
,34
2
$27
6,4
94
,34
8
$54
,58
4,8
90
$4
53,8
06
,511
$29
6,19
9,5
46
$3
84
,84
1,06
6
$50
,09
1,018
$6
9,0
35,
109
$17
,48
7,0
43
$74
,60
0,2
20
Chart 20: Broadband-enabled ancillary revenue for airline share of ad-supported free connectivity: 2018-2028
Chart 20 depicts the segmentation between regions for advertising-supported free connectivity between 2018-2028 by region.
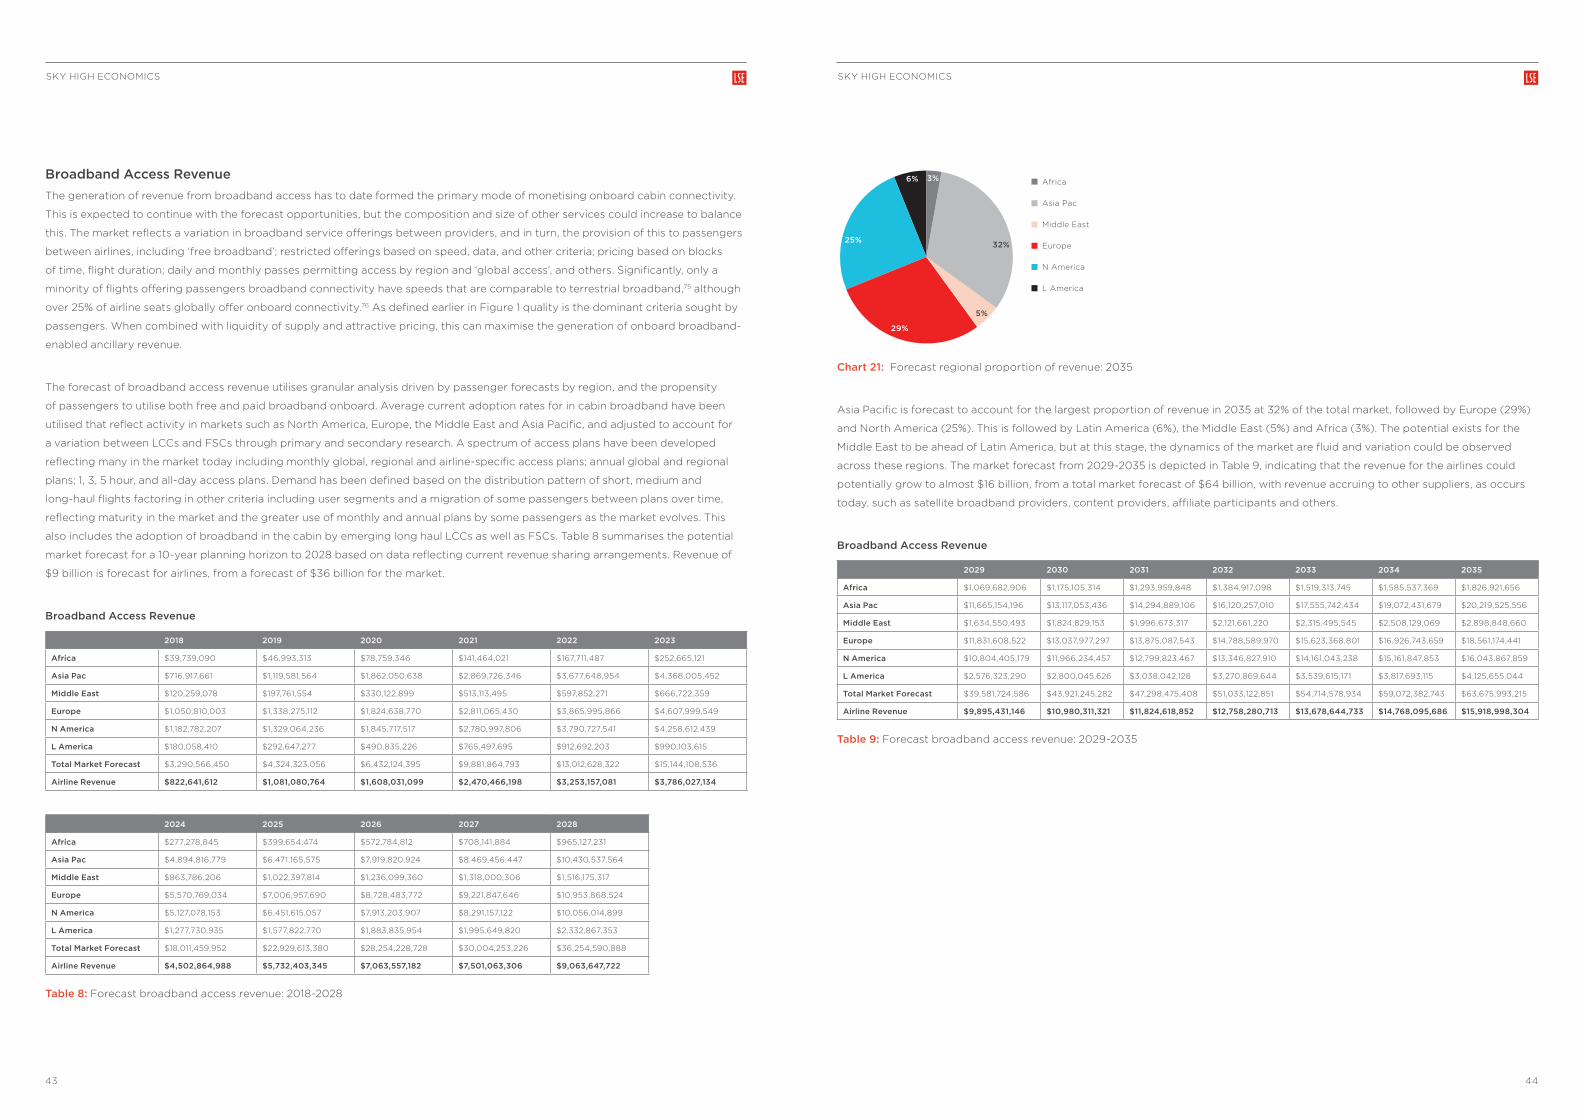
SKY HIGH ECONOMICS SKY HIGH ECONOMICS
43 44
Broadband Access RevenueThe generation of revenue from broadband access has to date formed the primary mode of monetising onboard cabin connectivity.
This is expected to continue with the forecast opportunities, but the composition and size of other services could increase to balance
this. The market reflects a variation in broadband service offerings between providers, and in turn, the provision of this to passengers
between airlines, including ‘free broadband’; restricted offerings based on speed, data, and other criteria; pricing based on blocks
of time, flight duration; daily and monthly passes permitting access by region and ‘global access’, and others. Significantly, only a
minority of flights offering passengers broadband connectivity have speeds that are comparable to terrestrial broadband,75 although
over 25% of airline seats globally offer onboard connectivity.76 As defined earlier in Figure 1 quality is the dominant criteria sought by
passengers. When combined with liquidity of supply and attractive pricing, this can maximise the generation of onboard broadband-
enabled ancillary revenue.
The forecast of broadband access revenue utilises granular analysis driven by passenger forecasts by region, and the propensity
of passengers to utilise both free and paid broadband onboard. Average current adoption rates for in cabin broadband have been
utilised that reflect activity in markets such as North America, Europe, the Middle East and Asia Pacific, and adjusted to account for
a variation between LCCs and FSCs through primary and secondary research. A spectrum of access plans have been developed
reflecting many in the market today including monthly global, regional and airline-specific access plans; annual global and regional
plans; 1, 3, 5 hour, and all-day access plans. Demand has been defined based on the distribution pattern of short, medium and
long-haul flights factoring in other criteria including user segments and a migration of some passengers between plans over time,
reflecting maturity in the market and the greater use of monthly and annual plans by some passengers as the market evolves. This
also includes the adoption of broadband in the cabin by emerging long haul LCCs as well as FSCs. Table 8 summarises the potential
market forecast for a 10-year planning horizon to 2028 based on data reflecting current revenue sharing arrangements. Revenue of
$9 billion is forecast for airlines, from a forecast of $36 billion for the market.
Broadband Access Revenue
2018 2019 2020 2021 2022 2023
Africa $39,739,090 $46,993,313 $78,759,346 $141,464,021 $167,711,487 $252,665,121
Asia Pac $716,917,661 $1,119,581,564 $1,862,050,638 $2,869,726,346 $3,677,648,954 $4,368,005,452
Middle East $120,259,078 $197,761,554 $330,122,899 $513,113,495 $597,852,271 $666,722,359
Europe $1,050,810,003 $1,338,275,112 $1,824,638,770 $2,811,065,430 $3,865,995,866 $4,607,999,549
N America $1,182,782,207 $1,329,064,236 $1,845,717,517 $2,780,997,806 $3,790,727,541 $4,258,612,439
L America $180,058,410 $292,647,277 $490,835,226 $765,497,695 $912,692,203 $990,103,615
Total Market Forecast $3,290,566,450 $4,324,323,056 $6,432,124,395 $9,881,864,793 $13,012,628,322 $15,144,108,536
Airline Revenue $822,641,612 $1,081,080,764 $1,608,031,099 $2,470,466,198 $3,253,157,081 $3,786,027,134
2024 2025 2026 2027 2028
Africa $277,278,845 $399,654,474 $572,784,812 $708,141,884 $965,127,231
Asia Pac $4,894,816,779 $6,471,165,575 $7,919,820,924 $8,469,456,447 $10,430,537,564
Middle East $863,786,206 $1,022,397,814 $1,236,099,360 $1,318,000,306 $1,516,175,317
Europe $5,570,769,034 $7,006,957,690 $8,728,483,772 $9,221,847,646 $10,953,868,524
N America $5,127,078,153 $6,451,615,057 $7,913,203,907 $8,291,157,122 $10,056,014,899
L America $1,277,730,935 $1,577,822,770 $1,883,835,954 $1,995,649,820 $2,332,867,353
Total Market Forecast $18,011,459,952 $22,929,613,380 $28,254,228,728 $30,004,253,226 $36,254,590,888
Airline Revenue $4,502,864,988 $5,732,403,345 $7,063,557,182 $7,501,063,306 $9,063,647,722
Table 8: Forecast broadband access revenue: 2018-2028
Africa Asia Pac Middle East Europe N America L America
3%
29%
25%
6%
32%
5%
Chart 21: Forecast regional proportion of revenue: 2035
Asia Pacific is forecast to account for the largest proportion of revenue in 2035 at 32% of the total market, followed by Europe (29%)
and North America (25%). This is followed by Latin America (6%), the Middle East (5%) and Africa (3%). The potential exists for the
Middle East to be ahead of Latin America, but at this stage, the dynamics of the market are fluid and variation could be observed
across these regions. The market forecast from 2029-2035 is depicted in Table 9, indicating that the revenue for the airlines could
potentially grow to almost $16 billion, from a total market forecast of $64 billion, with revenue accruing to other suppliers, as occurs
today, such as satellite broadband providers, content providers, affiliate participants and others.
Broadband Access Revenue
2029 2030 2031 2032 2033 2034 2035
Africa $1,069,682,906 $1,175,105,314 $1,293,959,848 $1,384,917,098 $1,519,313,745 $1,585,537,369 $1,826,921,656
Asia Pac $11,665,154,196 $13,117,053,436 $14,294,889,106 $16,120,257,010 $17,555,742,434 $19,072,431,679 $20,219,525,556
Middle East $1,634,550,493 $1,824,829,153 $1,996,673,317 $2,121,661,220 $2,315,495,545 $2,508,129,069 $2,898,848,660
Europe $11,831,608,522 $13,037,977,297 $13,875,087,543 $14,788,589,970 $15,623,368,801 $16,926,743,659 $18,561,174,441
N America $10,804,405,179 $11,966,234,457 $12,799,823,467 $13,346,827,910 $14,161,043,238 $15,161,847,853 $16,043,867,859
L America $2,576,323,290 $2,800,045,626 $3,038,042,128 $3,270,869,644 $3,539,615,171 $3,817,693,115 $4,125,655,044
Total Market Forecast $39,581,724,586 $43,921,245,282 $47,298,475,408 $51,033,122,851 $54,714,578,934 $59,072,382,743 $63,675,993,215
Airline Revenue $9,895,431,146 $10,980,311,321 $11,824,618,852 $12,758,280,713 $13,678,644,733 $14,768,095,686 $15,918,998,304
Table 9: Forecast broadband access revenue: 2029-2035
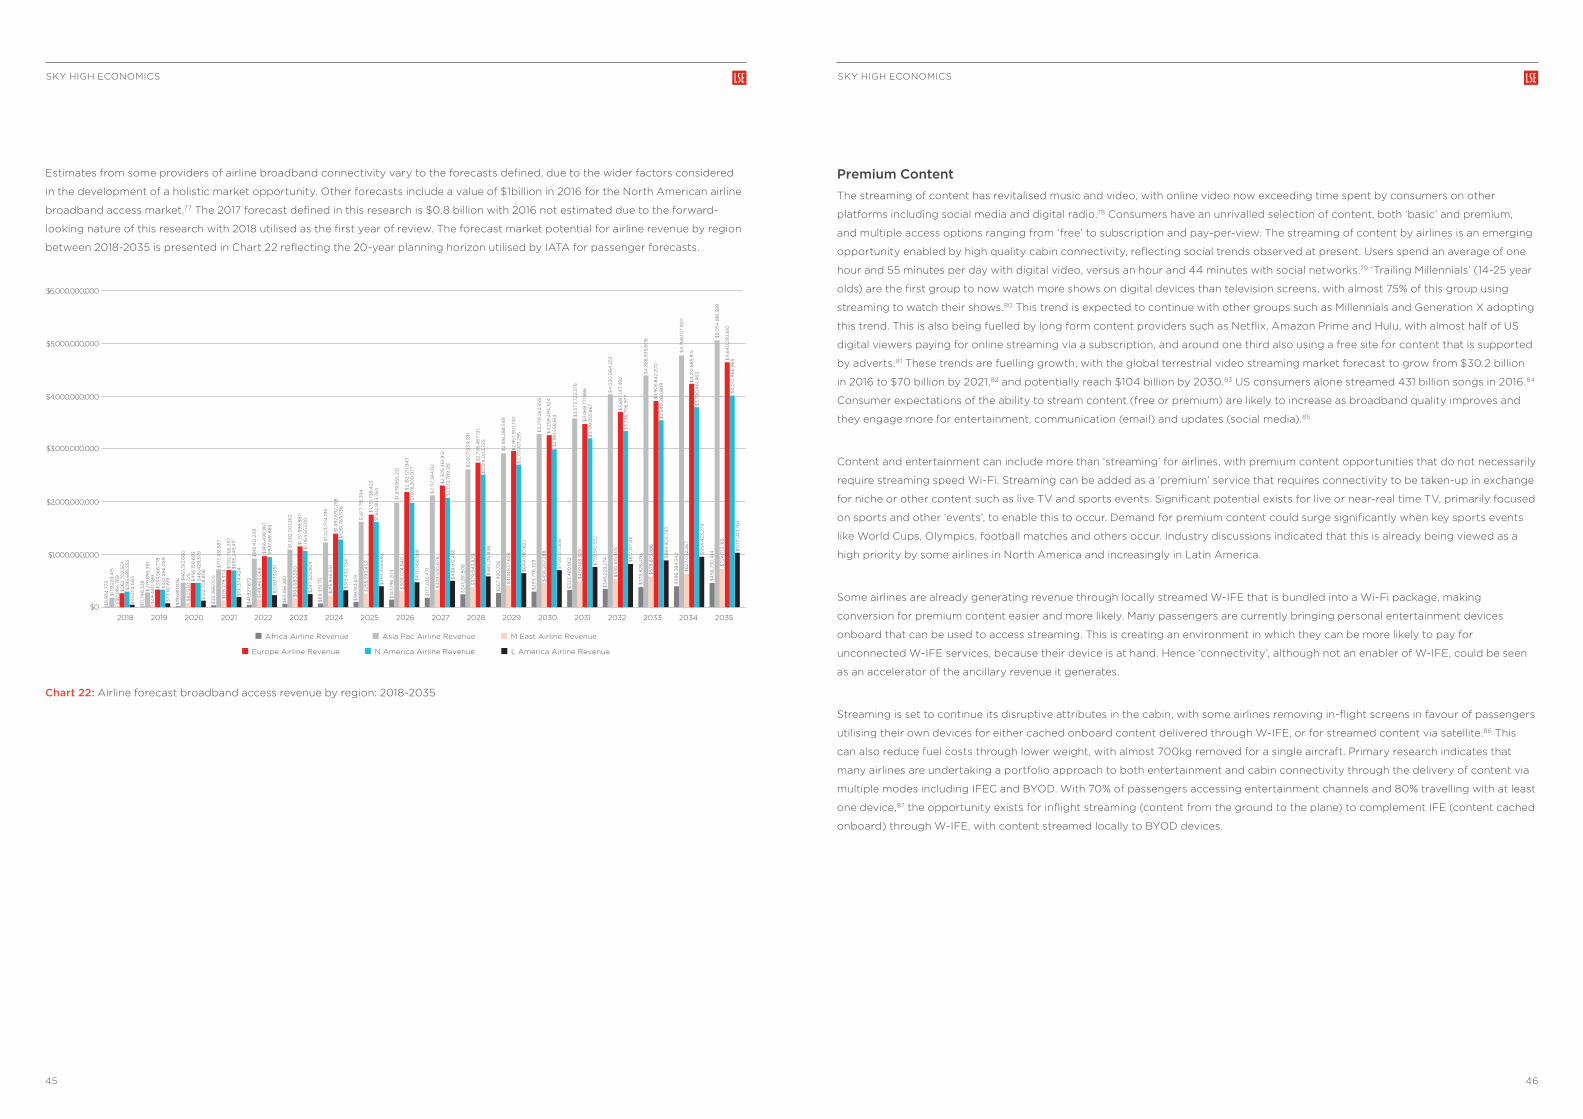
SKY HIGH ECONOMICS SKY HIGH ECONOMICS
45 46
Estimates from some providers of airline broadband connectivity vary to the forecasts defined, due to the wider factors considered
in the development of a holistic market opportunity. Other forecasts include a value of $1billion in 2016 for the North American airline
broadband access market.77 The 2017 forecast defined in this research is $0.8 billion with 2016 not estimated due to the forward-
looking nature of this research with 2018 utilised as the first year of review. The forecast market potential for airline revenue by region
between 2018-2035 is presented in Chart 22 reflecting the 20-year planning horizon utilised by IATA for passenger forecasts.
$0
$1,000,000,000
$2,000,000,000
$3,000,000,000
$4,000,000,000
$5,000,000,000
$6,000,000,000
Africa Airline Revenue Asia Pac Airline Revenue M East Airline Revenue
Europe Airline Revenue L America Airline Revenue N America Airline Revenue
203520342033203220312030202920282027202620252024202320222021202020192018
$9
,93
4,7
73$
179
,229
,415
$3
0,0
64
,76
9$
262,
702,
501
$29
5,6
95,
552
$4
5,0
14,6
03
$11
,74
8,3
28$
279
,89
5,3
91
$4
9,4
40
,38
9$
33
4,5
68
,778
$3
32,
266
,059
$73
,161,8
19
$19
,68
9,8
36 $
46
5,51
2,6
60
$8
2,53
0,7
25 $4
56,15
9,6
93
$4
61,4
29,3
79$
122,
708
,80
6
$3
5,3
66
,00
5$
717,
43
1,58
7$
128
,278
,374
$70
2,76
6,3
57$
69
5,24
9,4
51$
191,3
74,4
24
$4
1,927
,872
$9
19,4
12,2
39
$14
9,4
63
,06
8$
96
6,4
98
,96
7$
94
7,6
81,8
85
$22
8,17
3,0
51
$6
3,16
6,2
80
$1,0
92,
00
1,36
3$
166
,68
0,5
90
$1,1
51,9
99
,88
7$
1,06
4,6
53,11
0$
247,
525,
90
4
$6
9,3
19,7
11$
1,223
,70
4,19
5$
215,
94
6,5
51$
1,39
2,6
92,
258
$1,2
81,7
69
,53
8$
319
,43
2,73
4
$9
9,9
13,6
19
$14
3,19
6,2
03
$1,6
17,7
91,3
94
$25
5,59
9,4
53$
1,751
,73
9,4
23$
1,612
,90
3,7
64
$3
94
,455
,69
2
$1,9
79,9
55,2
31
$3
09
,024
,84
0$
2,18
2,12
0,9
43
$1,9
78,3
00
,977
$4
70,9
58,9
88
$17
7,0
35,
471
$2,
117,
36
4,11
2$
329
,50
0,0
76$
2,3
05,
46
1,912
$2,
072
,78
9,2
81
$2,
60
7,6
34
,39
1
$2,
738
,46
7,13
1$
2,51
4,0
03
,725
$4
98
,912
,455
$24
1,28
1,80
8
$3
79,0
43
,829
$58
3,2
16,8
38
$2,
916
,28
8,5
49
$2,
957
,90
2,13
0$
2,70
1,10
1,29
5 $3
,279
,26
3,3
59
$3
,259
,49
4,3
24$
2,9
91,5
58,6
14
$26
7,4
20,7
26
$4
08
,63
7,6
23
$6
44
,08
0,8
22
$29
3,7
76,3
29
$4
56,2
07,
288
$70
0,0
11,4
06
$3
,573
,722
,276
$3
,46
8,7
71,8
86
$3
,199
,955
,86
7
$3
23,4
89
,96
2
$4
99
,168
,329
$75
9,5
10,5
32
$4
,03
0,0
64
,253
$3
,69
7,14
7,4
92
$3
,33
6,7
06
,977
$3
46
,229
,274
$53
0,4
15,3
05
$8
17,7
17,4
11
$4
,38
8,9
35,
60
8
$3
,90
5,8
42,
200
$3
,54
0,2
60
,80
9
$3
79,8
28,4
36
$57
8,8
73,8
86
$8
84
,90
3,7
93
$4
,76
8,10
7,9
20
$4
,23
1,68
5,9
15$
3,7
90
,46
1,96
3
$3
96
,38
4,3
42
$6
27,0
32,
267
$9
54,4
23,2
79
$5,
054
,88
1,38
9
$4
,64
0,2
93
,610
$4
,010
,96
6,9
65
$4
56,7
30
,414
$72
4,7
12,16
5
$1,0
31,4
13,7
61
Chart 22: Airline forecast broadband access revenue by region: 2018-2035
Premium ContentThe streaming of content has revitalised music and video, with online video now exceeding time spent by consumers on other
platforms including social media and digital radio.78 Consumers have an unrivalled selection of content, both ‘basic’ and premium,
and multiple access options ranging from ‘free’ to subscription and pay-per-view. The streaming of content by airlines is an emerging
opportunity enabled by high quality cabin connectivity, reflecting social trends observed at present. Users spend an average of one
hour and 55 minutes per day with digital video, versus an hour and 44 minutes with social networks.79 ‘Trailing Millennials’ (14-25 year
olds) are the first group to now watch more shows on digital devices than television screens, with almost 75% of this group using
streaming to watch their shows.80 This trend is expected to continue with other groups such as Millennials and Generation X adopting
this trend. This is also being fuelled by long form content providers such as Netflix, Amazon Prime and Hulu, with almost half of US
digital viewers paying for online streaming via a subscription, and around one third also using a free site for content that is supported
by adverts.81 These trends are fuelling growth, with the global terrestrial video streaming market forecast to grow from $30.2 billion
in 2016 to $70 billion by 2021,82 and potentially reach $104 billion by 2030.83 US consumers alone streamed 431 billion songs in 2016.84
Consumer expectations of the ability to stream content (free or premium) are likely to increase as broadband quality improves and
they engage more for entertainment, communication (email) and updates (social media).85
Content and entertainment can include more than ‘streaming’ for airlines, with premium content opportunities that do not necessarily
require streaming speed Wi-Fi. Streaming can be added as a ‘premium’ service that requires connectivity to be taken-up in exchange
for niche or other content such as live TV and sports events. Significant potential exists for live or near-real time TV, primarily focused
on sports and other ‘events’, to enable this to occur. Demand for premium content could surge significantly when key sports events
like World Cups, Olympics, football matches and others occur. Industry discussions indicated that this is already being viewed as a
high priority by some airlines in North America and increasingly in Latin America.
Some airlines are already generating revenue through locally streamed W-IFE that is bundled into a Wi-Fi package, making
conversion for premium content easier and more likely. Many passengers are currently bringing personal entertainment devices
onboard that can be used to access streaming. This is creating an environment in which they can be more likely to pay for
unconnected W-IFE services, because their device is at hand. Hence ‘connectivity’, although not an enabler of W-IFE, could be seen
as an accelerator of the ancillary revenue it generates.
Streaming is set to continue its disruptive attributes in the cabin, with some airlines removing in-flight screens in favour of passengers
utilising their own devices for either cached onboard content delivered through W-IFE, or for streamed content via satellite.86 This
can also reduce fuel costs through lower weight, with almost 700kg removed for a single aircraft. Primary research indicates that
many airlines are undertaking a portfolio approach to both entertainment and cabin connectivity through the delivery of content via
multiple modes including IFEC and BYOD. With 70% of passengers accessing entertainment channels and 80% travelling with at least
one device,87 the opportunity exists for inflight streaming (content from the ground to the plane) to complement IFE (content cached
onboard) through W-IFE, with content streamed locally to BYOD devices.

SKY HIGH ECONOMICS SKY HIGH ECONOMICS
47 48
The opportunity exists for airlines to maximise the opportunities offered by a connected cabin with forecasts identifying a number of
opportunities for potential ancillary revenue generation enabled by broadband. This includes a tiered ‘basic’ and ‘premium’ offering,
with analysis and forecasting based on a simple approach that contains the potential to be inclusive of numerous content offerings.
Passenger research on ‘satisfaction’ indicates that 64% value entertainment and own-device use for streaming, text, email, above
other inflight services, with around 56% of passengers willing to consider being up-sold full connectivity with 60% indicating that
being in touch with the ground provides an emotional benefit.88
An additional area of forecast is the rental of access devices for passengers, with some airlines already offering this in light of
regulatory changes or for passengers who do not possess their own device.89 A proportion of passengers have been forecast
to adopt this. This reflects a portion of users who may not possess a BYOD or those who may choose to use another device for
entertainment. It also provides an alternative for any regulatory impediment to passengers using larger BYODs.
Forecasts quantifying the potential value of satellite streaming of content to the cabin have utilised a defined basic and a premium
offering, following industry feedback, this could entail the ‘bundling’ of broadband access as depicted earlier in this paper, with the
use of IFE and W-IFE.
Premium Content
2018 2019 2020 2021 2022 2023
Africa $208,626 $319,014 $385,637 $758,824 $996,951 $1,483,523
Asia Pac $11,483,009 $32,151,062 $51,721,791 $77,171,834 $92,494,967 $120,759,166
Middle East $1,404,043 $6,710,926 $11,831,813 $15,603,739 $17,806,793 $23,139,037
Europe $22,030,951 $56,601,373 $89,848,999 $116,893,234 $141,636,967 $193,058,706
N America $19,555,725 $53,143,599 $87,085,546 $103,143,521 $128,096,697 $169,250,106
L America $3,483,016 $12,325,082 $21,146,231 $27,537,884 $31,680,279 $41,152,667
Total Market Forecast $58,165,369 $161,251,058 $262,020,018 $341,109,036 $412,712,654 $548,843,206
Total airline revenue $39,474,366 $108,351,945 $174,565,039 $230,804,605 $279,067,924 $369,191,274
2024 2025 2026 2027 2028
Africa $1,649,081 $2,583,170 $3,821,839 $4,784,025 $6,510,842
Asia Pac $139,556,516 $177,867,917 $207,559,324 $233,532,264 $271,515,437
Middle East $28,050,264 $31,359,394 $35,589,214 $38,805,329 $44,047,179
Europe $226,201,690 $254,118,233 $299,224,837 $316,181,773 $359,751,767
N America $197,141,210 $217,205,936 $252,011,098 $269,393,419 $303,972,305
L America $49,286,825 $56,113,916 $63,271,061 $68,407,295 $77,418,828
Total Market Forecast $641,885,587 $739,248,567 $861,477,374 $931,104,104 $1,063,216,358
Total airline revenue $431,020,089 $503,258,013 $586,688,442 $636,600,835 $731,079,978
Table 10: Forecast Premium Content revenue by region: 2018-2028
The forecast market revenue from this sector is around $39 million for airlines in 2018, as depicted in Table 10 rising to almost
$0.7 billion by 2028. This is forecast to rise to rise to $1.4 billion for the airlines by 2035. Chart 23 depicts this distribution
across regions.
$0
$1,000,000,000
$2,000,000,000
$3,000,000,000
$4,000,000,000
$5,000,000,000
$6,000,000,000
Africa Airline Revenue Asia Pac Airline Revenue M East Airline Revenue
Europe Airline Revenue L America Airline Revenue N America Airline Revenue
203520342033203220312030202920282027202620252024202320222021202020192018
$11
5,9
10$
11,4
83
,00
9$
855
,627
$13
,072
,09
9$
11,8
60
,120
$2,
08
7,6
00
$17
6,9
44 $
32,
151,0
62
$3
,94
9,6
42
$3
3,0
92,
36
9$
31,7
31,1
67
$7,
250
,76
0
$21
3,17
9$
51,7
21,7
91
$6
,878
,133
$52
,166
,70
4$
51,2
91,4
32
$12
,29
3,7
99
$4
22,8
61
$77
,171,8
34
$9
,04
7,3
80
$6
7,75
4,7
07
$6
0,4
38
,68
2$
15,9
69
,142
$55
5,75
1$
92,
49
4,9
67
$10
,33
8,9
98
$8
2,0
03
,257
$75
,28
2,8
17$
18,3
92,
134
$8
28,6
50$
120
,759
,166
$13
,416
,68
5$
111,1
98
,958
$9
9,13
1,478
$23
,856
,33
6
$9
20,9
79$
139
,556
,516
$16
,258
,183
$13
0,2
58,6
19$
115,
46
3,18
3$
28,5
62,
60
8
$1,4
49
,08
1
$2,
138
,83
4
$17
7,8
67,
917
$18
,157,
86
0$
146
,33
5,58
8$
126
,971
,94
6$
32,
475
,622
$20
7,55
9,3
24$
20,6
27,2
97
$17
2,27
5,0
27$
147,
43
6,3
23$
36
,651
,63
7
$2,
670
,39
3$
233
,53
2,26
4$
22,4
47,
09
0$
181,3
73,8
72$
157,
025
,138
$27
1,515
,43
7
$20
6,18
4,7
84
$17
9,0
98
,04
3
$3
9,5
52,0
78
$3
,64
2,50
8
$25
,628
,524
$4
5,0
10,6
81
$3
04
,50
9,4
77
$22
4,5
41,9
94
$19
8,8
26,7
69
$3
39
,88
3,0
02
$24
2,20
7,6
38
$21
5,75
3,7
50
$4
,079
,198
$28
,557
,40
2
$4
9,9
12,5
29
$4
,96
3,6
31
$3
1,40
5,14
2
$54
,39
1,977
$3
88
,152,
616
$26
9,5
89
,958
$24
2,51
5,6
23
$5,
727,
169
$3
5,56
4,7
40
$6
1,371
,50
2
$4
47,
96
4,6
77
$28
7,18
0,5
27$
259
,524
,39
1
$7,
477
,98
2
$3
8,8
32,
236
$6
6,8
19,0
01
$4
87,
534
,28
3
$3
14,8
30
,352
$28
7,4
47,
83
6
$8
,23
9,4
48
$4
3,2
01,2
16
$73
,618
,89
1
$54
3,6
20,5
64
$3
36
,452
,44
8$
30
7,3
07,
39
1
$8
,778
,195 $4
7,10
0,8
16
$79
,66
9,5
12
$57
0,5
50,6
16
$3
73,15
3,5
22$
322
,89
9,2
49
$9
,84
8,5
20 $52
,68
2,9
23
$8
4,7
40
,03
7
Chart 23: Forecast airline premium content revenue by region: 2018-2035

SKY HIGH ECONOMICS SKY HIGH ECONOMICS
49 50
E-commerce and destination shopping‘Traditional’ ancillary revenue includes revenue airlines derived from hotel bookings; the sale of frequent flyer miles; the provision
of à la carte onboard services and some other services.90 The airline revenue from these is estimated to be $67 billion in 2018.91 A
step-change is required for airlines to extend this to broadband-enabled ancillary revenue that capitalises on e-commerce, mobile
technology, changing consumption patterns, and low-cost, last-minute holidays. The most popular travel-related booking categories
have remained relatively constant, and include airlines, hotels and auto-rentals, searched both through travel websites and directly,
along with destination-related themes such as transfers; tours; tickets for attractions.92
Destination shopping represents one component of the e-tail opportunity. The potential is much larger however. In particular,
the environment of onboard retail is currently restricted by size, weight and time, and the logistics of inventory management and
delivery. Connectivity enables airlines to greatly expand their e-commerce duty-free offering to a wider range of goods that may
be purchased less often, to higher priced goods, and to goods that can be conveniently delivered to a home or destination address.
Connectivity also permits real-time credit card authorisation, resulting in lower fraud incidence and increasing the potential value of
goods that can be sold. This is further maximised by increasing the time available for passengers to browse and purchase, rather than
being restricted to circulation of the duty-free trolley onboard. E-commerce also creates the opportunity for innovative partnerships
and concession models, where partner brands participate in the airline’s e-commerce environment. Alternatively, this could occur
through outsourced partnerships.
Amongst the drivers facilitating a change in the onboard connectivity paradigm is liquidity: this requires passengers to defer some
of their trip purchases to when they are en route, including car hire, hotel and tour bookings, transfers, and general shopping. This
permits airlines to capture bookings that currently occur pre- and post-flight without their participation. Factors facilitating the
propensity of travellers to engage in this include:
• Over 40% of tour and activity bookings are made online, with these often made after arrival in a destination city or location;93
• 5% of tours and around 40% of entertainment activities and events are booked online before a trip, with this doubling in the space
of 12 months;94
• 45% of travellers utilise their smartphone to book travel activities pre-trip;95
• Almost 100 million internet users utilised coupons to lower the cost of activities purchased online, and 20% use deals and savings
apps when shopping;96
• 33% of Millennials, 25% of Generation X and 17% of Baby Boomers used mobile coupons in 2016.97
The broadband-enabled ancillary revenue model defined in this paper is shown in Figure 1. This highlights trends that primary
research has indicated are relevant for airlines as they define a 21st Century connected-cabin model. Amongst the factors for
consideration that spur forecasts are:
• Major city pair-routes offer opportunities for airlines to engage with global e-tailing brands such as Amazon across activities
including the website/landing page, content and fulfilment, particularly for major cities where established operations exist.
This includes the joint commercialisation of passenger data to personalise offers, commencing when the passenger has been
‘captured’, potentially from their app log-in at the start of their journey, through to landing at the destination. Connectivity with the
passenger via a smartphone, tablet, or laptop, can deliver personalised destination offers via the airline or from a partner fulfilling
this to the destination address;
• Other service offers can be delivered through targeted means via the same channels focusing on tours, attractions, transfers,
coupons for discounts, with the development of a wider network of participating partners that can utilise both last-minute offers
and tailored offers;
• Relationships with ‘traditional’ travel suppliers such as car hire and accommodation providers can be developed to provide tailored
offers ‘pushed’ to the passenger based on route, destination, known preferences, and other criteria;
• Engagement with other e-tailors could be developed that provides a unique opportunity available only whilst a passenger is on
route and connected that could result in purchases being dispatched to a residential address, or if developed with specific high-
traffic routes that can be served from a logistical perspective, to the destination address.
These areas represent e-commerce not currently being captured within ‘traditional’ ancillary revenue activities with the exception of
some accommodation, car hire and related purchases, but these are not occurring within the context of an on-the-move passenger
that is targeted with personalised offers in real-time along the journey. This opportunity amalgamates suppliers, passengers and
airlines in a just-in-time model that also provides added incentive in some cases for suppliers of services in particular to offer steeper
discounts with short-dated items such as spare seats on buses for transfers; under-utilised rental vehicles; capacity in hotel rooms;
and even events such as concerts, festivals, restaurant discounts, and other elements that generate zero return if not utilised by a
specific period.
Table 11 consolidates the broadband enabled e-commerce opportunity. This is forecast to commence from a smaller base, generating
$36 million revenue for airlines in 2018, growing to a forecast $3 billion in 10 years to 2028.
E-Commerce: Destination Shopping
2018 2019 2020 2021 2022 2023 2024 2025 2026
Africa $198,437 $1,026,595 $1,405,064 $2,343,648 $4,934,283 $8,846,394 $13,527,236 $20,936,464 $27,516,557
Asia Pac $387,555,394 $1,022,130,370 $1,935,564,015 $3,539,843,723 $4,261,792,337 $4,968,028,402 $6,253,644,116 $7,912,041,252 $9,191,521,136
Middle East $36,912,476 $149,189,520 $209,697,871 $374,416,180 $424,584,065 $509,168,333 $620,155,627 $691,311,179 $775,950,879
Europe $5,988,291 $188,599,513 $298,044,089 $480,508,412 $1,401,028,579 $1,759,571,067 $2,712,134,647 $3,257,417,334 $3,915,787,696
N America $10,757,986 $139,037,225 $218,023,979 $331,566,735 $1,199,620,929 $1,657,353,980 $2,095,156,240 $2,736,573,607 $3,264,158,431
L America $1,470,824 $31,154,837 $46,059,030 $75,521,844 $305,933,923 $361,964,131 $601,678,415 $715,995,254 $819,452,630
Total Market Forecast $442,883,408 $1,531,138,060 $2,708,794,048 $4,804,200,543 $7,597,894,116 $9,264,932,307 $12,296,296,282 $15,334,275,091 $17,994,387,330
Total airline revenue $36,296,692 $205,713,726 $335,336,296 $568,452,536 $960,683,740 $1,185,200,998 $1,598,149,195 $2,008,126,692 $2,350,961,572
2027 2028 2029 2030 2031 2032 2033 2034 2035
Africa $47,345,635 $55,150,849 $66,182,266 $74,663,190 $88,657,904 $99,414,532 $109,046,712 $113,767,011 $131,059,707
Asia Pac $9,937,244,152 $11,576,453,362 $12,971,190,139 $14,394,536,469 $18,750,021,929 $21,575,353,122 $23,428,190,481 $26,074,098,566 $27,367,086,558
Middle East $829,393,676 $922,923,750 $1,001,361,690 $1,092,022,013 $1,208,626,350 $1,303,980,134 $1,443,353,933 $1,568,744,802 $1,748,341,650
Europe $4,444,632,248 $5,174,209,094 $6,116,975,383 $6,942,759,403 $7,581,756,806 $8,935,812,027 $10,029,347,158 $10,740,924,602 $11,943,423,487
N America $3,678,281,948 $4,227,711,801 $5,229,148,940 $5,750,630,591 $6,357,921,306 $7,567,511,041 $8,519,760,500 $9,108,888,069 $9,571,045,786
L America $914,283,114 $1,084,541,021 $1,329,504,386 $1,475,057,907 $1,624,033,518 $1,925,462,058 $2,150,941,796 $2,334,127,979 $2,484,078,738
Total Market Forecast $19,851,180,773 $23,040,989,877 $26,714,362,804 $29,729,669,573 $35,611,017,814 $41,407,532,914 $45,680,640,579 $49,940,551,030 $53,245,035,926
Total airline revenue $2,675,975,826 $3,039,423,738 $3,522,629,782 $3,942,973,516 $4,524,617,675 $5,323,360,984 $5,886,910,289 $6,407,678,150 $6,856,507,452
Table 11: Forecast e-commerce destination ancillary revenue by region: 2018-2035

SKY HIGH ECONOMICS SKY HIGH ECONOMICS
51 52
The market opportunity for this segment is considerable but requires a higher degree of participation by airlines if the benefits are to
be realised. Chart 24 summarises the regional growth opportunity. The growth in Asia Pacific revenue is driven by passenger growth
that is forecast by IATA to account for around 40% of total passenger numbers by 2035.98
$0
$500,000,000
$1,000,000,000
$1,500,000,000
$2,000,000,000
$2,500,000,000
$3,000,000,000
Africa Airline Revenue Asia Pac Airline Revenue M East Airline Revenue
Europe Airline Revenue L America Airline Revenue N America Airline Revenue
203520342033203220312030202920282027202620252024202320222021202020192018
$3
1,019
$27
,912
,58
2$
5,59
2,8
83
$9
07,
33
0$
1,63
0,0
22$
222,
855
$17
1,48
5$
102,
141,7
68
$24
,856
,311
$3
8,9
65,
352
$3
0,0
13,2
22$
9,5
65,
587
$23
5,72
5 $18
2,4
79,3
37
$3
4,7
09
,624
$6
0,3
51,8
44
$4
4,3
31,8
41
$13
,227
,925
$4
05,
059
$3
30
,24
2,4
60
$6
1,83
4,5
24$
92,
63
5,20
4$
63
,83
3,6
21$
19,5
01,6
68
$8
24,6
10$
39
3,2
49
,26
5$
69
,99
7,15
5$
238
,68
6,0
96
$20
0,3
89
,132
$57
,53
7,4
82
$1,4
87,
44
7$
456
,70
7,0
90
$8
4,2
54,9
29 $3
00
,00
0,5
75$
273
,973
,180
$6
8,7
77,7
77
$2,
266
,89
0$
581,9
70,3
12$
102,
138
,79
2$
44
9,16
3,6
40
$3
50,8
52,2
06
$11
1,757
,357
$3
,472
,94
3
$4
,56
2,52
9
$75
8,6
73,4
61
$11
3,8
19,0
68
$53
5,3
84
,06
9$
459
,99
1,84
0$
136
,78
5,3
11
$8
77,4
79,11
8$
127,
63
1,40
7$
63
8,8
04
,69
5$
546
,53
5,0
99
$15
5,9
48
,724
$7,
99
4,9
11$
99
6,0
73,9
83
$13
8,5
62,
39
8$
721,8
88
,979
$6
28,6
09
,84
7
$1,0
94
,39
0,2
35
$8
51,0
81,8
25$
720
,64
9,2
76
$18
2,8
45,
708
$9
,198
,106
$15
1,93
7,26
0
$21
2,16
7,0
36
$1,2
17,6
92,
163
$9
96
,74
1,93
0$
877
,28
7,56
3
$1,3
53,4
27,3
13
$1,1
25,2
11,2
48
$9
77,3
01,9
50
$11
,190
,58
3
$16
6,5
95,
418
$25
3,12
2,12
7
$12
,659
,29
3
$18
1,64
2,9
00
$29
2,73
0,8
12
$1,6
89
,40
1,28
2
$1,2
22,7
47,
94
0$
1,075
,658
,019
$15
,250
,28
2
$20
0,7
51,3
22
$3
20,8
08
,829
$1,9
42,
175,
38
9
$1,4
50,7
56,9
47
$1,3
04
,056
,04
4
$17
,051
,070 $
216
,73
7,0
58
$3
92,
584
,476
$2,
109
,68
6,5
14
$1,6
20,2
32,
60
3$
1,46
4,0
08
,139
$18
,70
1,48
8 $23
9,5
60
,56
2
$4
34
,720
,98
3
$2,
36
0,6
52,6
89
$1,7
32,
275,
374
$1,5
63
,63
3,5
88
$19
,617
,979
$26
0,4
08
,26
4
$4
71,0
90
,257
$2,
478
,166
,856
$1,9
20,9
51,2
79$
1,64
2,9
67,
677
$22
,46
6,2
44
$28
9,5
46
,33
4
$50
2,4
09
,06
2
Chart 24: Forecast e-commerce airline destination ancillary revenue by region: 2018-2035
By 2035, e-commerce revenue for airlines is forecast to reach $6.8 billion, from a total estimated market of $53 billion. This product
category has significant growth potential that can be capitalised if airlines offer passengers a relevant and large enough pool of
products and services (‘liquidity of supply’) at an attractive price, with fulfilment options: both digital and physical. If this occurs, trust
can be created and passengers are more likely to defer or undertake purchasing onboard.
Conclusion
The introduction of next generation satellites is ushering in high-bandwidth, continuous coverage. This is creating a step-change in
the connected cabin with enhanced opportunities for airlines to develop broadband-enabled ancillary revenue that complements
traditional ancillary revenue. Passengers display a propensity to pay more for high quality broadband, valuing this attribute above
price. The formative nature of the broadband-enabled ancillary market in the cabin creates both opportunities and challenges:
the development of broadband-enabled ancillary revenue by airlines requires alignment between content, products and services;
technical and operational components; commercial arrangements and proactive airline participation. This entails the greater use of
passenger data by airlines, and an engaged approach to monetising this.
This research has estimated that the total market size for broadband enabled ancillary revenue is $130 billion by 2035, with the airline
component estimated to be $30 billion. The ultimate market size enabled by the advent of the high-speed cabin requires a review by
airlines of their current operating model to define how revenue can be maximised from a ‘captive pool’ of consumers at 35,000 feet.
Some segments are currently less defined, such as advertising, and could be lower than forecast depending on the operating and
revenue models adopted, whilst others such as e-commerce and destination shopping, premium content and access revenue could
exceed forecasts if the appropriate requirements exist.
The estimated near doubling of global passengers to 7.2 billion by 2035 provides the backdrop for airlines to develop broadband-
enabled ancillary revenue. In contrast to a flattening of per passenger revenue from traditional ancillary revenue, broadband
enabled ancillary revenue is at its infancy and has the potential to grow for both LCCs and FSCs for the categories defined. Due
to the formative nature of this market, these opportunities could be higher or lower than those forecast in this research. As higher
bandwidth becomes available in the cabin, airlines must ensure that they keep pace by developing their offers, infrastructure,
operations and passenger engagement to the degree required to deliver and maximise connected-revenue. If this occurs, ‘sky high’
economics are attainable and airlines can gain a return on investment that translates into a growing contribution to their bottom
line. This must also be accompanied by a shift in culture that puts passengers at the centre of a retailing and e-tailing ethos and
personalises their journey: both onboard and to their destination.

SKY HIGH ECONOMICS
54
SKY HIGH ECONOMICS
53
Bibliography
Broadband Commission for Sustainable Development (2016) The State of Broadband 2016: Broadband Catalysing Sustainable
Development, ITU/UNESCO, Geneva, Sept.
Adrianna de Souza e Silva and Mimi Scheller (eds) (2015) Mobility and Locative Media: Mobile Communication in Hybrid Spaces.
Abingdon: Routledge.
Anthony Elliott and David Radford (2015) ‘Terminal experimentation: The transformation of experiences, events and escapes at
global airports’, Environment and Planning D: Society and Space, 33(6): 1063–1079.
Gerald Goggin (ed) (2008) Mobile Phone Cultures. Abingdon: Routledge.
Kevin Fitchard (2015) ‘The crazy economics of inflight Wi-Fi’, Fortune, fortune.com/2015/07/01/flight-wi-fi-travel/, accessed
18 Apr. 2017.
Veronika Konok, Ákos Pogány, and Ádám Miklósi (2017) “Mobile attachment: Separation from the mobile phone induces
physiological and behavioural stress and attentional bias to separation-related stimuli,” Computers in Human Behavior, 71 228-239.
Rich Ling (2012) Taken for Grantedness: The Embedding of Mobile Communication into Society. Cambridge, MA: MIT Press.
Giovanna Mascheroni and Jane Vincent (2016) ‘Perpetual contact as a communicative affordance: Opportunities, constraints, and
emotions’, Mobile Media & Communication, 4(3): 310 – 326.
Luis Martin-Domingo and Juan Carlos Martín (2016) ‘Airport mobile internet an innovation’, Journal of Air Transport Management,
55: 102-112.
Galit Nimrod (2015) ‘The hierarchy of mobile phone incorporation among older users’, Mobile Media & Communication, 4(2): 149-168.
Sakari Taipale (2016) ‘Do the mobile-rich get richer? Internet use, travelling and social differentiations in Finland’, New Media &
Society, 18(1): 44-61.
John Urry (2002) ‘Mobility and proximity’, Sociology, 36(2): 255-274.
Mariek M. P. Vanden Abeele (2016) ‘Mobile youth culture: A conceptual development’, Mobile Media & Communication, 4(1): 85–101.
Rowan Wilken and Gerard Goggin (eds) (2012) Mobile Technology and Place. New York: Routledge.
Notes:1 See Airports Council International, ‘International Passenger & Freight Summary
2015’, http://www.aci.aero/Data-Centre/Monthly-Traffic-Data/International-Passenger-and-Freight-Summary, and Air Transport Action Group, ‘Facts & Figures’, http://www.atag.org/facts-and-figures.html.
2 All telecom operator investment, 2011-2015, p. 3 at https://www.gsmaintelligence.com/research/?file=97928efe09cdba2864cdcf1ad1a2f58c &download and value of smart phone sales estimated from the same four years given by https://www.statista.com/statistics/237505/global-revenue-from-smartphones-since-2008/, extrapolated backwards using the slowest rate of annual growth in the series.
3 As cited in: http://www.futuretravelexperience.com/2013/08/increasing-onboard-ancillary-revenues-through-data-connectivity-and-a-retailing-mindset/
4 Christin et al, (2014). Always Connected: A first insight into the influence of smartphone adoption on the activity-travel behaviour of mobile professionals in Indonesia. Social Technologies. October. Vol.4(1); pp.76-92
5 Bradley, D.J. (2013). Review of The new digital shoreline: How web 2.0 and millennials are revolutionizing higher education. Journal of College Student Retention: Research, Theory and Practice, 2013, Vol.15;(3); p.459-462.
6 Goggin, G. (2012). Driving the Internet: Mobile Internets, Cars, and the Social. Future Internet. Vol: 4(1); pp: 306-321; doi:10.3390/fi4010306
7 Acision Research (2011). Seizing the Opportunity in Mobile Broadband.
8 Ibid.
9 Ibid.
10 Ibid, and GFK/Inmarsat Passenger Survey 2017, covering 9,000 respondents (access to source data).
11 http://www.ideaworkscompany.com/wp-content/uploads/2016/04/Press-Release-103-Global-Estimate.pdf
12 GFK/Inmarsat Passenger Survey, 2016.
13 Citrix Mobile Analytics Report, (2015).
14 Taneja, N.K., (2011). The Passenger Has Gone Digital and Mobile: Accessing and Connecting Through Information and Technology. Ashgate Publishing.
15 http://www.iata.org/pressroom/pr/Pages/2013-12-30-01.aspx
16 https://www.statista.com/topics/871/online-shopping/
17 https://www.retail-week.com/analysis/opinion/opinion-sales-on-a-plane-why-in-flight-retail-is-about-to-take-off/7012295.article
18 Cap Gemini Consulting, (2015). The Passenger Has Gone Digital and Mobile: Accessing and Connecting Through Information and Technology.
19 https://www.theguardian.com/business/2016/may/06/ba-adds-superfast-wi-fi-transatlantic-trips
20 Ibid.
21 Umashankar, N, et al. (2016). Do loyal customers really pay more for services? Journal of the Academy of Marketing Science. DOI 10.1007/s11747-016-0491-8
22 Ibid.
23 Criteo, Travel Flash Report, September 2014.
24 Ibid.
25 SITA. 2016 Passenger IT Trends Survey.
26 Li, T., and Unger, T. (2012). Willing to pay for quality personalization? Trade-off between quality and privacy. European Journal of Information Systems. November. Vol 21(6); pp 621–642.
27 Siwicki B (2011) Online sales of full-priced items jump in April. Internet Retailer, 12 May; http://www.internetretailer.com/2011/05/12/online-sales-full-priced-items-jump-april-mybuys-finds, referenced in Li and Unger (2012), op cit.
28 Sigala, M. (2011). eCRM 2.0 applications and trends: The use and perceptions of Greek tourism firms of social networks and intelligence. Computers in Human Behavior; Vol 27; pp: 655–661.
29 http://www.futuretravelexperience.com/2013/08/increasing-onboard-ancillary-revenues-through-data-connectivity-and-a-retailing-mindset/
30 Guidon, J. (2009). Ancillary revenues from a connected aircraft. Row 44. Airline Channel Sales Forum, Miami 12 May, in Williams, G., and O’Connell, J.F. (2016). Air Transport in the 21st Century: Key Strategic Developments. Routlege.
31 Christodoulidou, N. (2008). Which ancillary revenue products best complement the travel purchasing corridor and deliver maximum profits. Ancillary Revenue in Travel Conference, Las Vegas, Nevada, October 1-2 in Williams and O’Connell, (2016) op cit.
32 http://blog.accessdevelopment.com/customer-loyalty-statistics-2015-edition
33 http://connectedlife.tnsglobal.com/
34 http://www.prnewswire.com/news-releases/study-finds-28-of-retailers-report-increased-customer-loyalty-due-to-in-store-wifi-300019094.html
35 Morosan, C. (2014). Toward an integrated model of adoption of mobile phones for purchasing ancillary services in air travel. International Journal of Contemporary Hospitality Management. Vol. 26(2); pp.246-271.
36 Inflight Connectivity Survey, 2016. Inmarsat and GFK. Access to data and LSE research.
37 Consolidated results from primary research, interviews, passenger surveys.
38 Chen, C.C., and Schwartz, Z. (2013). On revenue management and last minute booking dynamics. International Journal of Contemporary Hospitality Management. Vol. 25(1); pp: 7-22.
39 As consolidated in Morosan, C., (2014), op cit.
40 https://aviationvoice.com/aviation-industrys-growth-in-latin-america-201604291050/
41 http://www.totalbluesky.com/2013/04/16/cost-airlines-dominated-global-market/
42 http://ec.europa.eu/eurostat/statistics-explained/index.php/Air_passenger_transport_-_monthly_statistics
43 LSE research and interviews on business travel July-Dec 2016.
44 LSE research of passengers for unpublished global study assessing drivers of travel purchases and behaviour.
45 http://www.iata.org/pressroom/pr/Pages/2016-10-18-02.aspx
46 http://www.boeing.com/commercial/market/long-term-market/ world-regions/#/north-america
47 https://www.ses.com/sites/default/files/2016-10/Sky%20High%20Connectivity.pdf
48 http://airlines.iata.org/sites/default/files/P18-22_IATA_64_CEO%20WestJet.pdf
49 Multiple references were utilised across regions including industry bodies, trade associations, airlines, government and other sources. These were assessed and assumptions defined that yielded estimates for regional passenger traffic: https://www.rita.dot.gov/bts/data_and_statistics/by_subject/passenger.html; https://www.transtats.bts.gov/Tables.asp?DB_ID=111&DB_Name=Air%20Carrier%20Statistics%20%28Form%2041%20Traffic%29-%20All%20Carriers&DB_Short_Name=Air%20Carriers; https://www.transportation.gov/policy/aviation-policy/us-international-air-passenger-and-freight-statistics-report; http://www.iata.org/pressroom/pr/Pages/2016-10-18-02.aspx; http://www.aapairlines.org/defaultV2.aspx; https://www.icao.int/sustainability/pages/eap_fp_forecastmed.aspx; http://tinet.ita.doc.gov/tinews/archive/tinews2017/20170216.asp; http://ec.europa.eu/eurostat/statistics-explained/index.php/Air_transport_statistics; https://www.transtats.bts.gov/TRAFFIC/; http://www.iata.org/publications/economics/Pages/regional.aspx; https://www.rita.dot.gov/bts/press_releases/bts018_16; http://tinet.ita.doc.gov/view/f-2000-99-001/forecast/Forecast-REGIONS.pdf; https://www.statista.com/topics/1151/passenger-airlines/; https://www.skal.org/sites/default/files/media/Public/Web/PDFs/1014_etn_english.pdf
50 http://www.iata.org/pressroom/pr/Pages/2016-10-18-02.aspx, and industry interviews.
51 http://tinet.ita.doc.gov/tinews/archive/tinews2017/20170216.asp
52 http://ec.europa.eu/eurostat/statistics-explained/index.php/Air_transport_statistics, http://www.iata.org/pressroom/pr/Pages/2016-10-18-02.aspx, and industry interviews.
53 http://www.iata.org/pressroom/pr/Pages/2015-11-26-01.aspx
54 https://www.ft.com/content/2812a962-7274-11e5-bdb1-e6e4767162cc?mhq5j=e2
55 https://en.wikipedia.org/wiki/Flight_length
56 https://ink-global.com/news/low-cost-passenger-isnt-low-cost-consumer
57 https://www.sabre.com/files/Sabre_Personalisation-and-the-regional-traveller.pdf
58 The segmentation between business and leisure travellers is less defined today, with many business travellers flying with low cost carriers, resulting in a blurring of the distinction between a ‘business passenger’ based on carrier type.
59 LSE research on global business travel, unpublished, encompassing interviews at multiple levels in 20 major corporates internationally including the EU, US, Asia Pacific, and other regions.
References

SKY HIGH ECONOMICS SKY HIGH ECONOMICS
55 56
60 http://www.rdcaviation.com/Insights/Article/141/Low-Cost-Airline-Penetration
61 Ibid.
62 Ibid.
63 https://centreforaviation.com/insights/analysis/european-airline-seat-capacity-growth-accelerates---perhaps-too-quickly-outlook-for-winter-201617-310109
64 https://www.statista.com/topics/2849/low-cost-carrier-lccs-market-in-the-united-states/
65 http://www.lowcostandregional.com/feature/air-traffic-data-amadeus?session_id=hoa6nt51254f9j7oiluuaeb4a5
66 Ibid
67 http://fortune.com/2015/09/23/southwest-airlines-business-travel/
68 http://www.businesstravel-iq.com/article/2015/05/27/low-cost-vs-legacy-european-airlines
69 LSE Team primary research; LSE Business Travel research 2016-2017.
70 https://www.ausbt.com.au/three-airlines-get-a-reality-check-on-inflight-internet
71 Okazaki, S., et al (2012). Mobile advertising avoidance: exploring the role of ubiquity. Electronic Markets. September; Volume 22(3); pp 169–183.
72 Srisawatsakul, C., and Papasratorn, B. (2013). Factors Affecting Consumer Acceptance Mobile Broadband Services with Add-on Advertising: Thailand Case Study. Wireless Personal Communications April; Vol 69(3); pp 1055–1065
73 https://www.bluecorona.com/blog/how-much-does-it-cost-to-advertise-youtube
74 https://9to5google.com/2017/05/04/youtube-original-content-efforts-ellen-kevin-hart/
75 https://www.routehappy.com/insights/wi-fi/2017
76 https://www.digitaltrends.com/cool-tech/satellite-broadband-airlines/
77 http://ir.gogoair.com/phoenix.zhtml?c=251827&p=irol-newsarticle&ID=2249576
78 Deloitte, (2014). Digital Media. The Rise of On-Demand Content.
79 https://contently.com/strategist/2015/07/06/the-explosive-growth-of-online-video-in-5-charts/
80 Ibid.
81 Hub Research, “What’s TV Worth?”, April 30, 2015, cited in https://contently.com/strategist/2015/07/06/the-explosive-growth-of-online-video-in-5-charts/
82 Video Streaming Market Report (2016). Markets and Markets.
83 http://www.goldmansachs.com/our-thinking/pages/technology-driving-innovation-folder/music-in-the-air/video-01.html
84 https://www.ft.com/content/cd99b95e-d8ba-11e6-944b-e7eb37a6aa8e
85 http://www.sitaonair.aero/passenger-inflight-wishes-airline-connectivity/
86 http://www.dailymail.co.uk/news/article-3284231/End-inflight-movie-Screens-set-axed-long-haul-flights-carriers-streaming-content-passengers-phones-tablets.html
87 https://immfly.com/movies-streaming-short-mid-haul-routes/
88 http://www.sitaonair.aero/passenger-inflight-wishes-airline-connectivity/
89 https://www.nytimes.com/2015/08/02/travel/airlines-in-flight-entertainment-options.html?_r=0
90 http://www.ideaworkscompany.com/wp-content/uploads/2016/11/Press-Release-115-Global-Estimate.pdf
91 Ibid.
92 http://www.alexa.com/topsites/category/Recreation/Travel
93 https://www.rezdy.com/resource/travel-statistics-for-tour-operators/
94 Ibid.
95 https://www.tripadvisor.com/TripAdvisorInsights/n2642/are-you-reaching-lucrative-connected-traveler
96 https://www.retailmenot.com/corp/static/8643c0/filer_public/50/e0/50e0636c-4419-4470-a1b7-9449b869ceFCC/rmn_holiday_insight_wp_100416.pdf
97 http://www.opportunityhealthcenter.org/spotlight/2017-coupon-promo-code-study/
98 http://www.iata.org/pressroom/pr/Pages/2016-10-18-02.aspx
This research represents forecasts and analysis undertaken through both primary and secondary investigation.
The data are provided to illustrate potential market growth and are underpinned by assumptions and
estimations. Any reliance on the information occurs at the risk and discretion of the user. No responsibility is
taken for the use of information, with users encouraged to undertake their own analysis to validate any decisions.
Disclaimer

SKY HIGH ECONOMICS
57