Skoolbo Skills Map and Learning Metrics Skills Map.pdf · Skoolbo Skills Map and ... In the US we...
82
1 Skoolbo Skills Map and Learning Metrics
Transcript of Skoolbo Skills Map and Learning Metrics Skills Map.pdf · Skoolbo Skills Map and ... In the US we...

1
Skoolbo Skills Map andLearning Metrics
2
Skoolbo
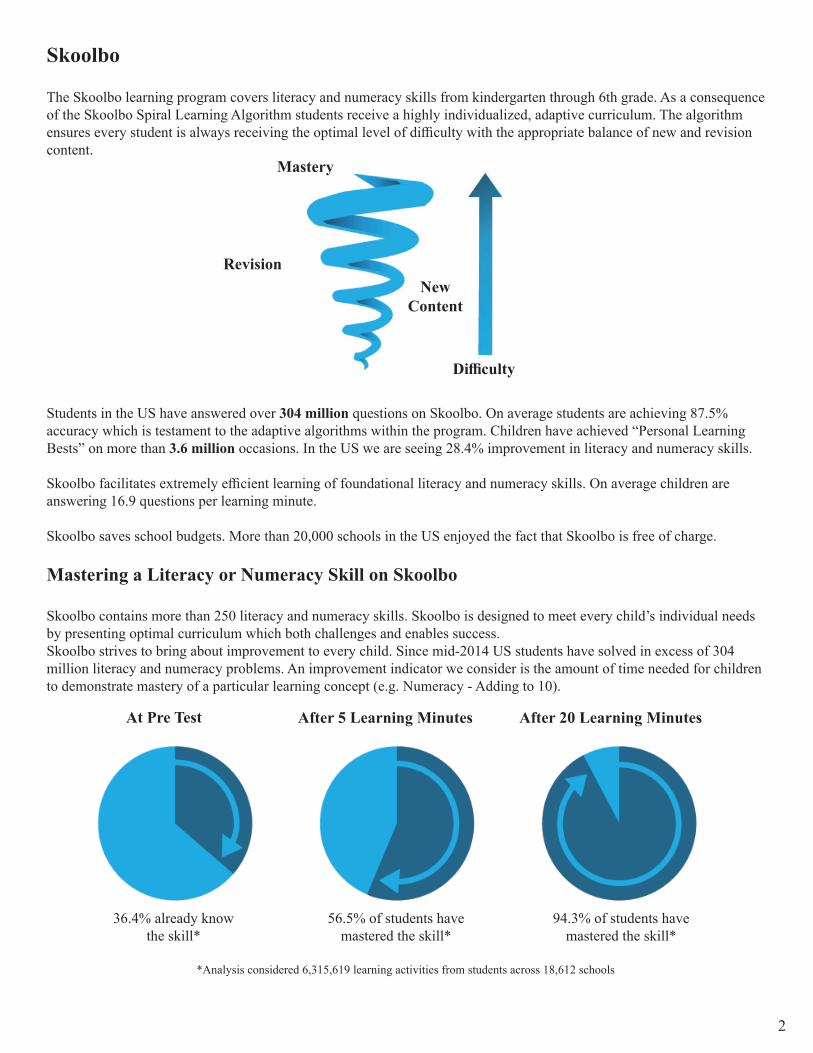
The Skoolbo learning program covers literacy and numeracy skills from kindergarten through 6th grade. As a consequence of the Skoolbo Spiral Learning Algorithm students receive a highly individualized, adaptive curriculum. The algorithm ensures every student is always receiving the optimal level of diffi culty with the appropriate balance of new and revision content.
Students in the US have answered over 304 million questions on Skoolbo. On average students are achieving 87.5% accuracy which is testament to the adaptive algorithms within the program. Children have achieved “Personal Learning Bests” on more than 3.6 million occasions. In the US we are seeing 28.4% improvement in literacy and numeracy skills.
Skoolbo facilitates extremely effi cient learning of foundational literacy and numeracy skills. On average children are answering 16.9 questions per learning minute.
Skoolbo saves school budgets. More than 20,000 schools in the US enjoyed the fact that Skoolbo is free of charge.
Mastering a Literacy or Numeracy Skill on Skoolbo
Skoolbo contains more than 250 literacy and numeracy skills. Skoolbo is designed to meet every child’s individual needs by presenting optimal curriculum which both challenges and enables success. Skoolbo strives to bring about improvement to every child. Since mid-2014 US students have solved in excess of 304 million literacy and numeracy problems. An improvement indicator we consider is the amount of time needed for children to demonstrate mastery of a particular learning concept (e.g. Numeracy - Adding to 10).
Mastery
RevisionNew
Content
Diffi culty
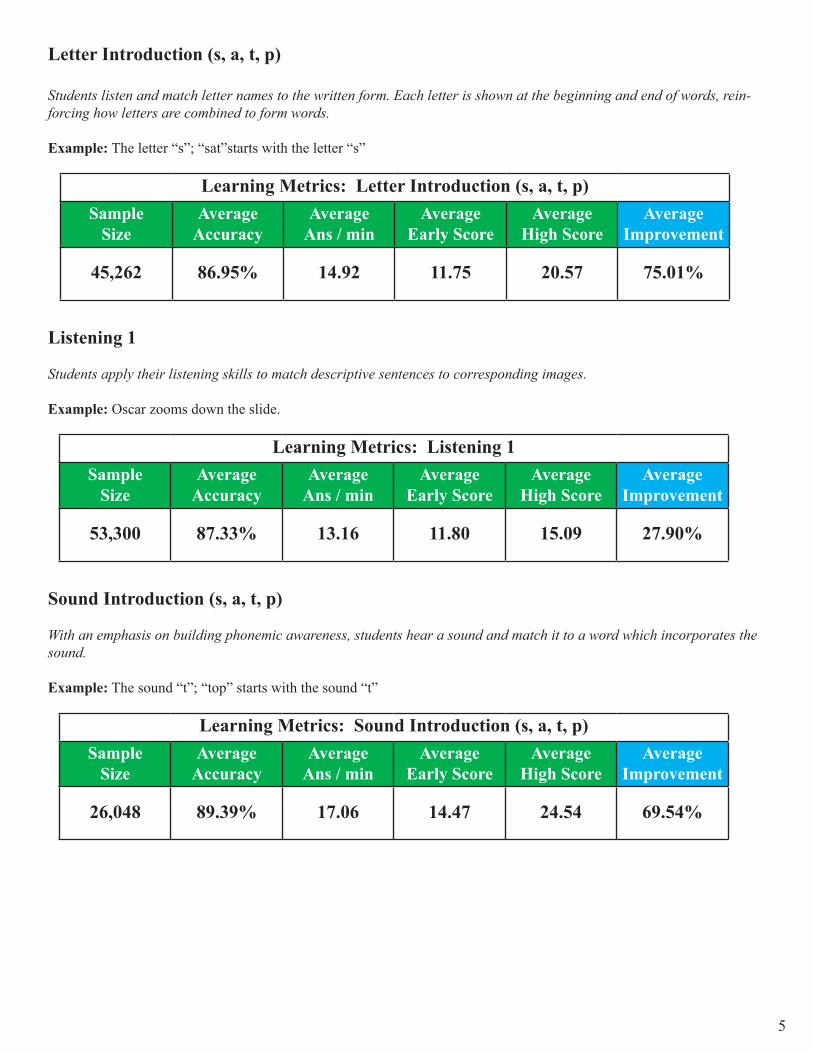
At Pre Test After 5 Learning Minutes After 20 Learning Minutes
36.4% already knowthe skill*
56.5% of students have mastered the skill*
94.3% of students have mastered the skill*
*Analysis considered 6,315,619 learning activities from students across 18,612 schools

3
The data indicates that 36.4% of students already have mastery of a learning concept when fi rst presented with the skill. The Skoolbo Learning Algorithm quickly moves these students on to more challenging tasks. Pre-testing and moving children on is important to help ensure learning boredom does not set in.
Skoolbo facilitates ultra-rapid progress with 56.5% of students mastering a skill within 5 learning minutes, while 94.3% of the cohort achieved mastery within 20 learning minutes. In other words, almost all students successfully master a literacy or numeracy skill within 20 learning minutes on Skoolbo.
Skoolbo enables highly effi cient skill development personalized to each child. Teachers and parents are equipped with dashboards to monitor each child’s progress.
Skoolbo Course Outline
The course outline that follows contains Learning Metrics which comes from an analysis of students who have completed more than twenty learning minutes on the particular literacy or numeracy skill. The Learning Metrics involved analyzing data from almost 10 million learning activities by students.

4
Literacy
5
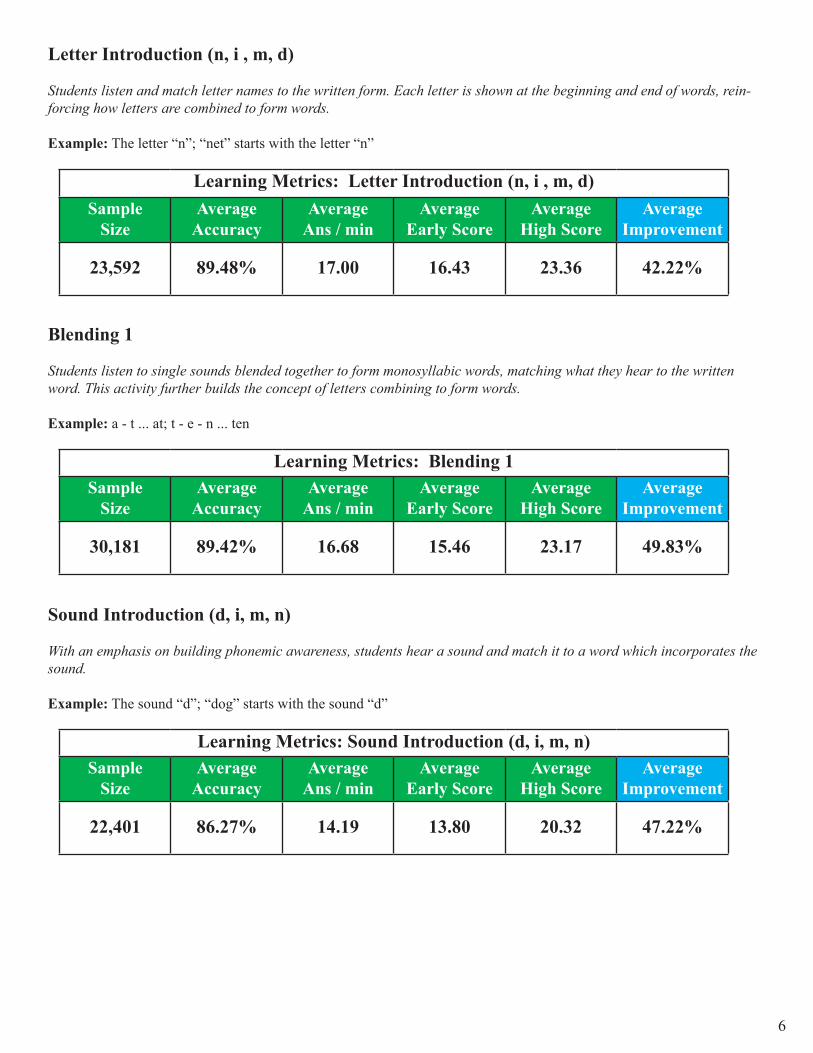
Letter Introduction (s, a, t, p)
Students listen and match letter names to the written form. Each letter is shown at the beginning and end of words, rein-forcing how letters are combined to form words.
Example: The letter “s”; “sat”starts with the letter “s”
Learning Metrics: Letter Introduction (s, a, t, p)Sample
SizeAverage
AccuracyAverage
Ans / minAverage
Early ScoreAverage
High ScoreAverage
Improvement
45,262 86.95% 14.92 11.75 20.57 75.01%
Listening 1 Students apply their listening skills to match descriptive sentences to corresponding images.
Example: Oscar zooms down the slide.
Learning Metrics: Listening 1Sample
SizeAverage
AccuracyAverage
Ans / minAverage
Early ScoreAverage
High ScoreAverage
Improvement
53,300 87.33% 13.16 11.80 15.09 27.90%
Sound Introduction (s, a, t, p) With an emphasis on building phonemic awareness, students hear a sound and match it to a word which incorporates the sound.
Example: The sound “t”; “top” starts with the sound “t”
Learning Metrics: Sound Introduction (s, a, t, p)Sample
SizeAverage
AccuracyAverage
Ans / minAverage
Early ScoreAverage
High ScoreAverage
Improvement
26,048 89.39% 17.06 14.47 24.54 69.54%
6
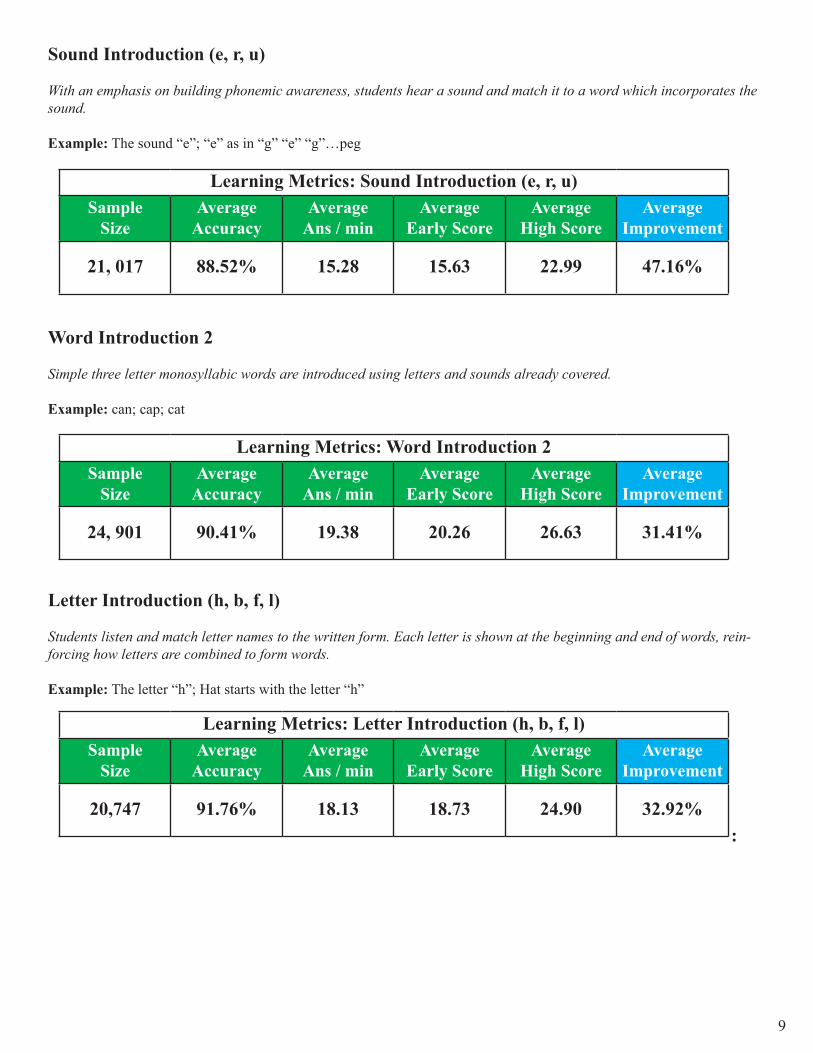
Letter Introduction (n, i , m, d)
Students listen and match letter names to the written form. Each letter is shown at the beginning and end of words, rein-forcing how letters are combined to form words.
Example: The letter “n”; “net” starts with the letter “n”
Learning Metrics: Letter Introduction (n, i , m, d)Sample
SizeAverage
AccuracyAverage
Ans / minAverage
Early ScoreAverage
High ScoreAverage
Improvement
23,592 89.48% 17.00 16.43 23.36 42.22%
Blending 1
Students listen to single sounds blended together to form monosyllabic words, matching what they hear to the written word. This activity further builds the concept of letters combining to form words.
Example: a - t ... at; t - e - n ... ten
Learning Metrics: Blending 1Sample
SizeAverage
AccuracyAverage
Ans / minAverage
Early ScoreAverage
High ScoreAverage
Improvement
30,181 89.42% 16.68 15.46 23.17 49.83%
Sound Introduction (d, i, m, n)
With an emphasis on building phonemic awareness, students hear a sound and match it to a word which incorporates the sound.
Example: The sound “d”; “dog” starts with the sound “d”
Learning Metrics: Sound Introduction (d, i, m, n)Sample
SizeAverage
AccuracyAverage
Ans / minAverage
Early ScoreAverage
High ScoreAverage
Improvement
22,401 86.27% 14.19 13.80 20.32 47.22%

7
Word Introduction 1
Simple three letter monosyllabic words are introduced using letters and sounds already covered.
Example: Dad; dam; did
Learning Metrics: Word Introduction 1Sample
SizeAverage
AccuracyAverage
Ans / minAverage
Early ScoreAverage
High ScoreAverage
Improvement
27,104 91.38% 21.46 23.00 29.94 30.19%
Letter Introduction (g, o, c, k)
Students listen and match letter names to the written form. Each letter is shown at the beginning and end of words, rein-forcing how letters are combined to form words.
Example: The letter “c”; “cat” starts with the letter “c”
Learning Metrics: Letter Introduction (g, o, c, k) Sample
SizeAverage
AccuracyAverage
Ans / minAverage
Early ScoreAverage
High ScoreAverage
Improvement
22,895 91.80% 18.34 19.00 24.59 29.37%
Vocabulary 1
Vocabulary activities expose students to a range of words, moving from common to less familiar terms. Students listen and view words before matching them to corresponding images.
Example: angel; angry; apple
Learning Metrics: Vocabulary 1Sample
SizeAverage
AccuracyAverage
Ans / minAverage
Early ScoreAverage
High ScoreAverage
Improvement
26,346 90.15% 13.87 13.92 14.65 5.24%

8
Sound Introduction (g, k)
With an emphasis on building phonemic awareness, students hear a sound and match it to a word which incorporates the sound.
Example: The sound “g”; “g” as in “g” “a” “s”…gas
Learning Metrics: Sound Introduction (g, k)Sample
SizeAverage
AccuracyAverage
Ans / minAverage
Early ScoreAverage
High ScoreAverage
Improvement
19,262 89.91% 16.80 17.52 25.02 42.82%
Letter Introduction (e, u, r)
Students listen and match letter names to the written form. Each letter is shown at the beginning and end of words, rein-forcing how letters are combined to form words.
Example: The letter “r”; robot starts with the letter “r”
Learning Metrics: Letter Introduction (e, u, r) Sample
SizeAverage
AccuracyAverage
Ans / minAverage
Early ScoreAverage
High ScoreAverage
Improvement
20, 245 91.70% 18.49 17.75 24.17 36.18%
Blending 2 Students listen to single sounds blended together to form monosyllabic words, matching what they hear to the written word. This activity further builds the concept of letters combining to form words. Example: “c” as in “c” “a” “n”…can
Learning Metrics: Blending 2Sample
SizeAverage
AccuracyAverage
Ans / minAverage
Early ScoreAverage
High ScoreAverage
Improvement
21, 790 87.69% 15.28 14.90 21.83 46.51%
9
Sound Introduction (e, r, u) With an emphasis on building phonemic awareness, students hear a sound and match it to a word which incorporates the sound. Example: The sound “e”; “e” as in “g” “e” “g”…peg
Learning Metrics: Sound Introduction (e, r, u)Sample
SizeAverage
AccuracyAverage
Ans / minAverage
Early ScoreAverage
High ScoreAverage
Improvement
21, 017 88.52% 15.28 15.63 22.99 47.16%
Word Introduction 2 Simple three letter monosyllabic words are introduced using letters and sounds already covered. Example: can; cap; cat
Learning Metrics: Word Introduction 2Sample
SizeAverage
AccuracyAverage
Ans / minAverage
Early ScoreAverage
High ScoreAverage
Improvement
24, 901 90.41% 19.38 20.26 26.63 31.41%
Letter Introduction (h, b, f, l) Students listen and match letter names to the written form. Each letter is shown at the beginning and end of words, rein-forcing how letters are combined to form words. Example: The letter “h”; Hat starts with the letter “h”
Learning Metrics: Letter Introduction (h, b, f, l)Sample
SizeAverage
AccuracyAverage
Ans / minAverage
Early ScoreAverage
High ScoreAverage
Improvement
20,747 91.76% 18.13 18.73 24.90 32.92%:

10
Blending 3 Students listen to single sounds blended together to form monosyllabic words, matching what they hear to the written word. This activity further builds the concept of letters combining to form words. Example: “ss” as in “m” “e” “ss”…mess
Learning Metrics: Blending 3Sample
SizeAverage
AccuracyAverage
Ans / minAverage
Early ScoreAverage
High ScoreAverage
Improvement
22, 266 87.37% 14.97 16.43 23.22 41.39%
Sound Introduction (h, b, f, l) With an emphasis on building phonemic awareness, students hear a sound and match it to a word which incorporates the sound. Example: The sound “b”; “b” as in “b” “e” “t”…bet
Learning Metrics: Sound Introduction (h, b, f, l)Sample
SizeAverage
AccuracyAverage
Ans / minAverage
Early ScoreAverage
High ScoreAverage
Improvement
21,282 88.27% 15.04 15.85 22.63 42.81%
Word Introduction 3
Simple three letter monosyllabic words are introduced using letters and sounds already covered. Example: all; and
Learning Metrics: Word Introduction 3Sample
SizeAverage
AccuracyAverage
Ans / minAverage
Early ScoreAverage
High ScoreAverage
Improvement
19,404 91.24% 20.16 20.68 27.57 33.29%

11
Letter Introduction (j, v, w, x) Students listen and match letter names to the written form. Each letter is shown at the beginning and end of words, rein-forcing how letters are combined to form words. Example: The letter “w”; “wet” starts with the letter “w”
Learning Metrics: Letter Introduction (j, v, w, x) Sample
SizeAverage
AccuracyAverage
Ans / minAverage
Early ScoreAverage
High ScoreAverage
Improvement
17,911 91.74% 18.92 19.54 25.04 28.17%
Sound Introduction (j, v, w, x)
With an emphasis on building phonemic awareness, students hear a sound and match it to a word which incorporates the sound.
Example: The sound “j”; “j” as in “j” “e” “t”…jet
Learning Metrics: Sound Introduction (j, v, w, x)Sample
SizeAverage
AccuracyAverage
Ans / minAverage
Early ScoreAverage
High ScoreAverage
Improvement
18,672 92.00% 18.04 18.31 24.72 35.03%
Letter Introduction (y, z, q) Students listen and match letter names to the written form. Each letter is shown at the beginning and end of words, rein-forcing how letters are combined to form words. Example: The letter “y”; The letter “z”; The letter “q”; yell starts with the letter “y”
Learning Metrics: Letter Introduction (y, z, q)Sample
SizeAverage
AccuracyAverage
Ans / minAverage
Early ScoreAverage
High ScoreAverage
Improvement
20,796 90.86% 18.51 18.14 24.44 34.72%
12
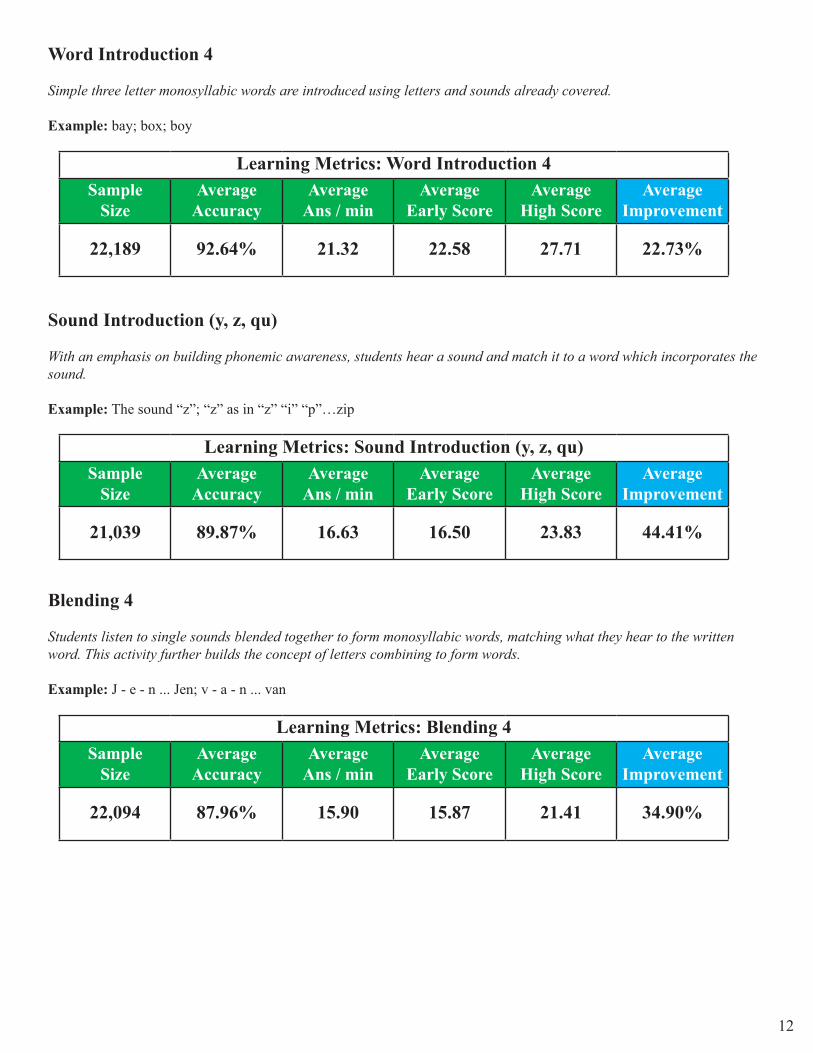
Word Introduction 4 Simple three letter monosyllabic words are introduced using letters and sounds already covered. Example: bay; box; boy
Learning Metrics: Word Introduction 4Sample
SizeAverage
AccuracyAverage
Ans / minAverage
Early ScoreAverage
High ScoreAverage
Improvement
22,189 92.64% 21.32 22.58 27.71 22.73%
Sound Introduction (y, z, qu) With an emphasis on building phonemic awareness, students hear a sound and match it to a word which incorporates the sound. Example: The sound “z”; “z” as in “z” “i” “p”…zip
Learning Metrics: Sound Introduction (y, z, qu)Sample
SizeAverage
AccuracyAverage
Ans / minAverage
Early ScoreAverage
High ScoreAverage
Improvement
21,039 89.87% 16.63 16.50 23.83 44.41%
Blending 4 Students listen to single sounds blended together to form monosyllabic words, matching what they hear to the written word. This activity further builds the concept of letters combining to form words. Example: J - e - n ... Jen; v - a - n ... van
Learning Metrics: Blending 4Sample
SizeAverage
AccuracyAverage
Ans / minAverage
Early ScoreAverage
High ScoreAverage
Improvement
22,094 87.96% 15.90 15.87 21.41 34.90%

13
High Frequency Words 1 High frequency words are emphasized through these listening and viewing match-up activities. Example: all; and
Learning Metrics: High Frequency Words 1Sample
SizeAverage
AccuracyAverage
Ans / minAverage
Early ScoreAverage
High ScoreAverage
Improvement
20,966 93.61% 22.62 24.97 29.86 19.56%
Sound Introduction (ch, sh, th)
With an emphasis on building phonemic awareness, students hear a sound and match it to a word which incorporates the sound. Example: The sound “th”; “th” as in “th” “e” “n”…then
Learning Metrics: Sound Introduction (ch, sh, th)Sample
SizeAverage
AccuracyAverage
Ans / minAverage
Early ScoreAverage
High ScoreAverage
Improvement
18,454 88.24% 15.90 13.70 20.54 49.86%
Isolating and pronouncing sounds
High frequency words are partitioned by their initial, medial and latter sounds. Students listen and match what they hear to the written form. Example: z - oo ... zoo; sh - i - p ... ship
Learning Metrics: Isolating and pronouncing soundsSample
SizeAverage
AccuracyAverage
Ans / minAverage
Early ScoreAverage
High ScoreAverage
Improvement
18,089 89.24% 16.64 16.11 22.93 42.37%
14
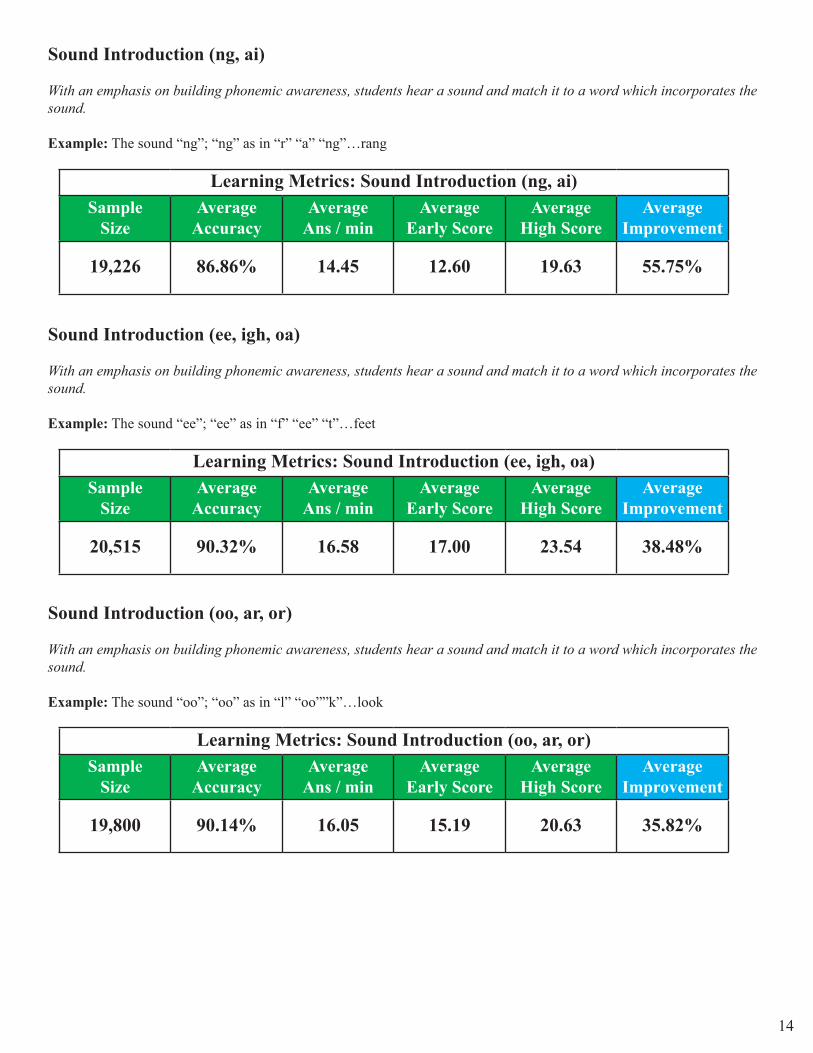
Sound Introduction (ng, ai)
With an emphasis on building phonemic awareness, students hear a sound and match it to a word which incorporates the sound. Example: The sound “ng”; “ng” as in “r” “a” “ng”…rang
Learning Metrics: Sound Introduction (ng, ai)Sample
SizeAverage
AccuracyAverage
Ans / minAverage
Early ScoreAverage
High ScoreAverage
Improvement
19,226 86.86% 14.45 12.60 19.63 55.75%
Sound Introduction (ee, igh, oa) With an emphasis on building phonemic awareness, students hear a sound and match it to a word which incorporates the sound.
Example: The sound “ee”; “ee” as in “f” “ee” “t”…feet
Learning Metrics: Sound Introduction (ee, igh, oa)Sample
SizeAverage
AccuracyAverage
Ans / minAverage
Early ScoreAverage
High ScoreAverage
Improvement
20,515 90.32% 16.58 17.00 23.54 38.48%
Sound Introduction (oo, ar, or)
With an emphasis on building phonemic awareness, students hear a sound and match it to a word which incorporates the sound.
Example: The sound “oo”; “oo” as in “l” “oo””k”…look
Learning Metrics: Sound Introduction (oo, ar, or)Sample
SizeAverage
AccuracyAverage
Ans / minAverage
Early ScoreAverage
High ScoreAverage
Improvement
19,800 90.14% 16.05 15.19 20.63 35.82%

15
Word Families 1 With a focus on the ending of words, students listen then select the matching word. Example: “ad” as in mad; “ad” as in sad
Learning Metrics: Word Families 1Sample
SizeAverage
AccuracyAverage
Ans / minAverage
Early ScoreAverage
High ScoreAverage
Improvement
21,054 91.31% 17.33 16.46 20.60 25.15%
Listening 2
Students apply their listening skills to match descriptive sentences to corresponding images.
Example: The boys are playing ping-pong.
Learning Metrics: Listening 2Sample
SizeAverage
AccuracyAverage
Ans / minAverage
Early ScoreAverage
High ScoreAverage
Improvement
27,628 90.98% 14.14 14.05 14.62 4.03%
Sound Introduction (ur, ow, oi)
With an emphasis on building phonemic awareness, students hear a sound and match it to a word which incorporates the sound.
Example: The sound “ur”; “ur” as in “b” “ur””p”…burp
Learning Metrics: Sound Introduction (ur, ow, oi)Sample
SizeAverage
AccuracyAverage
Ans / minAverage
Early ScoreAverage
High ScoreAverage
Improvement
19,442 88.04% 15.64 12.84 19.87 54.75%
16
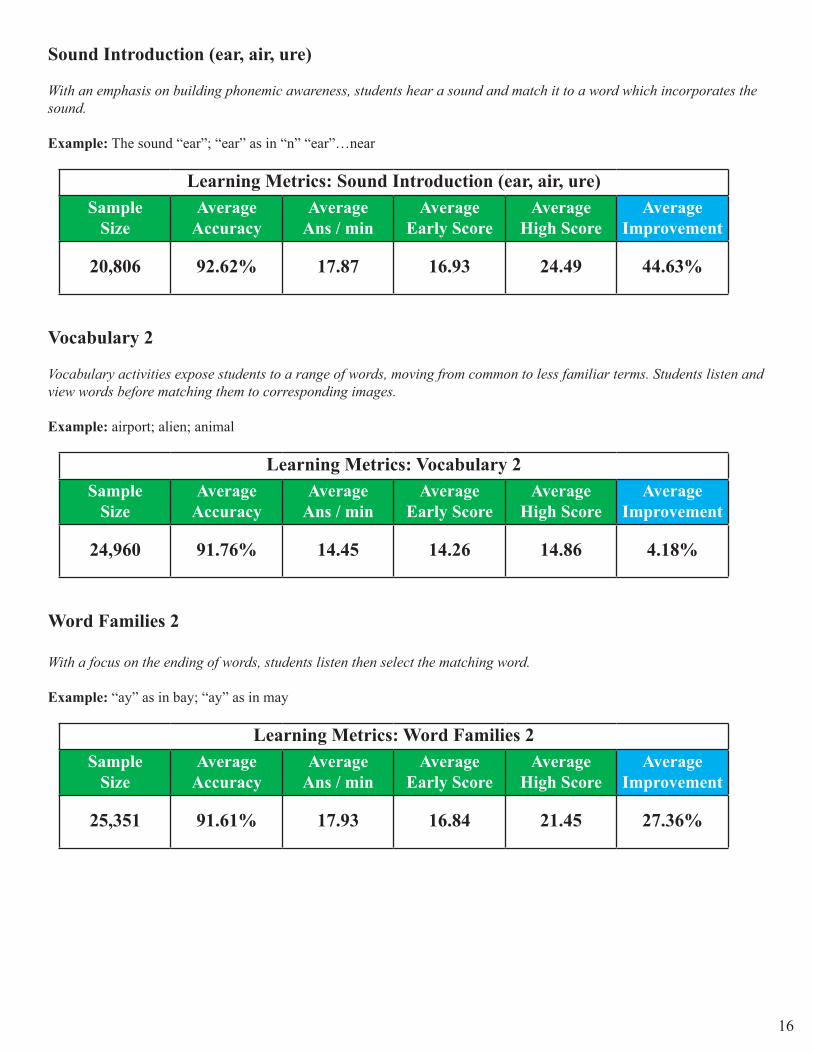
Sound Introduction (ear, air, ure)
With an emphasis on building phonemic awareness, students hear a sound and match it to a word which incorporates the sound.
Example: The sound “ear”; “ear” as in “n” “ear”…near
Learning Metrics: Sound Introduction (ear, air, ure)Sample
SizeAverage
AccuracyAverage
Ans / minAverage
Early ScoreAverage
High ScoreAverage
Improvement
20,806 92.62% 17.87 16.93 24.49 44.63%
Vocabulary 2
Vocabulary activities expose students to a range of words, moving from common to less familiar terms. Students listen and view words before matching them to corresponding images.
Example: airport; alien; animal
Learning Metrics: Vocabulary 2Sample
SizeAverage
AccuracyAverage
Ans / minAverage
Early ScoreAverage
High ScoreAverage
Improvement
24,960 91.76% 14.45 14.26 14.86 4.18%
Word Families 2
With a focus on the ending of words, students listen then select the matching word.
Example: “ay” as in bay; “ay” as in may
Learning Metrics: Word Families 2Sample
SizeAverage
AccuracyAverage
Ans / minAverage
Early ScoreAverage
High ScoreAverage
Improvement
25,351 91.61% 17.93 16.84 21.45 27.36%
17
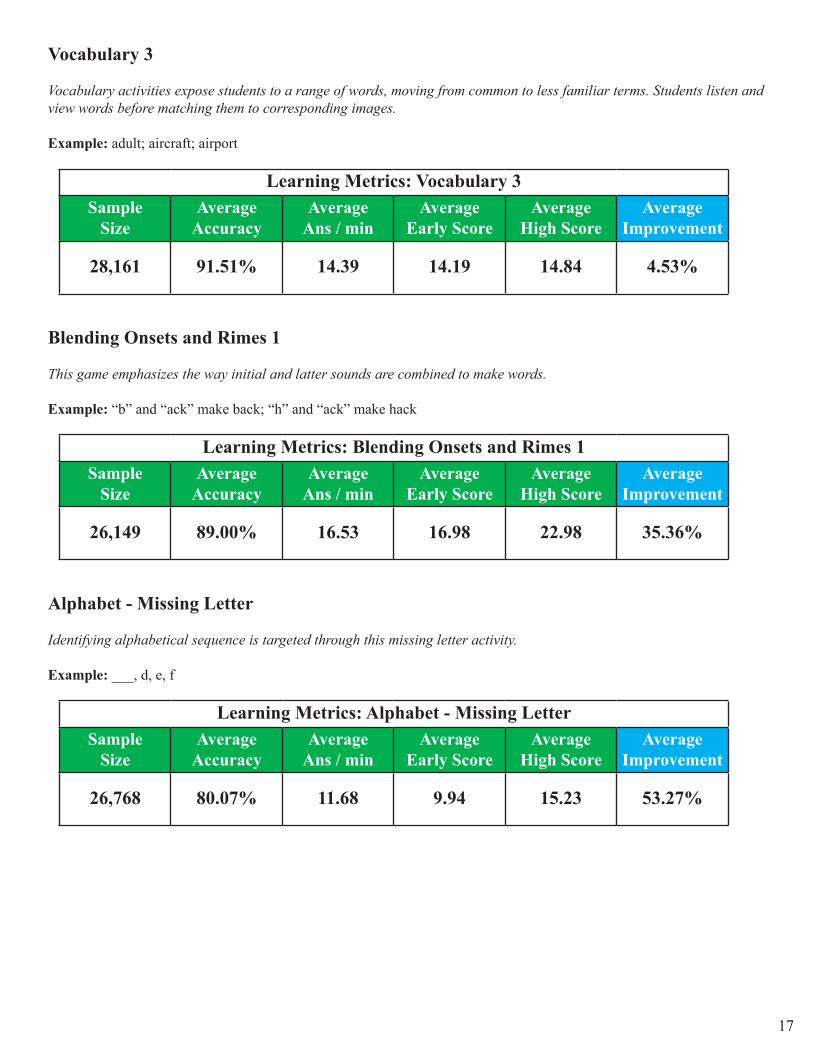
Vocabulary 3
Vocabulary activities expose students to a range of words, moving from common to less familiar terms. Students listen and view words before matching them to corresponding images.
Example: adult; aircraft; airport
Learning Metrics: Vocabulary 3Sample
SizeAverage
AccuracyAverage
Ans / minAverage
Early ScoreAverage
High ScoreAverage
Improvement
28,161 91.51% 14.39 14.19 14.84 4.53%
Blending Onsets and Rimes 1
This game emphasizes the way initial and latter sounds are combined to make words.
Example: “b” and “ack” make back; “h” and “ack” make hack
Learning Metrics: Blending Onsets and Rimes 1Sample
SizeAverage
AccuracyAverage
Ans / minAverage
Early ScoreAverage
High ScoreAverage
Improvement
26,149 89.00% 16.53 16.98 22.98 35.36%
Alphabet - Missing Letter
Identifying alphabetical sequence is targeted through this missing letter activity.
Example: ___, d, e, f
Learning Metrics: Alphabet - Missing LetterSample
SizeAverage
AccuracyAverage
Ans / minAverage
Early ScoreAverage
High ScoreAverage
Improvement
26,768 80.07% 11.68 9.94 15.23 53.27%
18
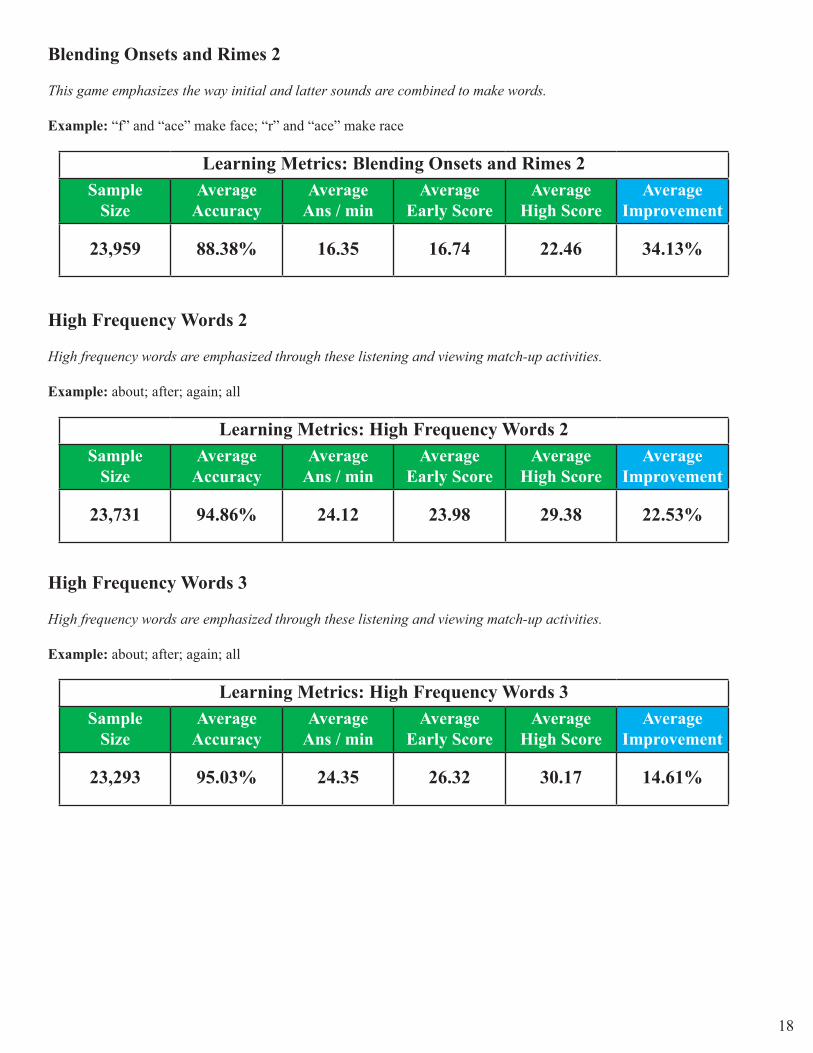
Blending Onsets and Rimes 2
This game emphasizes the way initial and latter sounds are combined to make words.
Example: “f” and “ace” make face; “r” and “ace” make race
Learning Metrics: Blending Onsets and Rimes 2Sample
SizeAverage
AccuracyAverage
Ans / minAverage
Early ScoreAverage
High ScoreAverage
Improvement
23,959 88.38% 16.35 16.74 22.46 34.13%
High Frequency Words 2
High frequency words are emphasized through these listening and viewing match-up activities.
Example: about; after; again; all
Learning Metrics: High Frequency Words 2Sample
SizeAverage
AccuracyAverage
Ans / minAverage
Early ScoreAverage
High ScoreAverage
Improvement
23,731 94.86% 24.12 23.98 29.38 22.53%
High Frequency Words 3
High frequency words are emphasized through these listening and viewing match-up activities.
Example: about; after; again; all
Learning Metrics: High Frequency Words 3Sample
SizeAverage
AccuracyAverage
Ans / minAverage
Early ScoreAverage
High ScoreAverage
Improvement
23,293 95.03% 24.35 26.32 30.17 14.61%
19
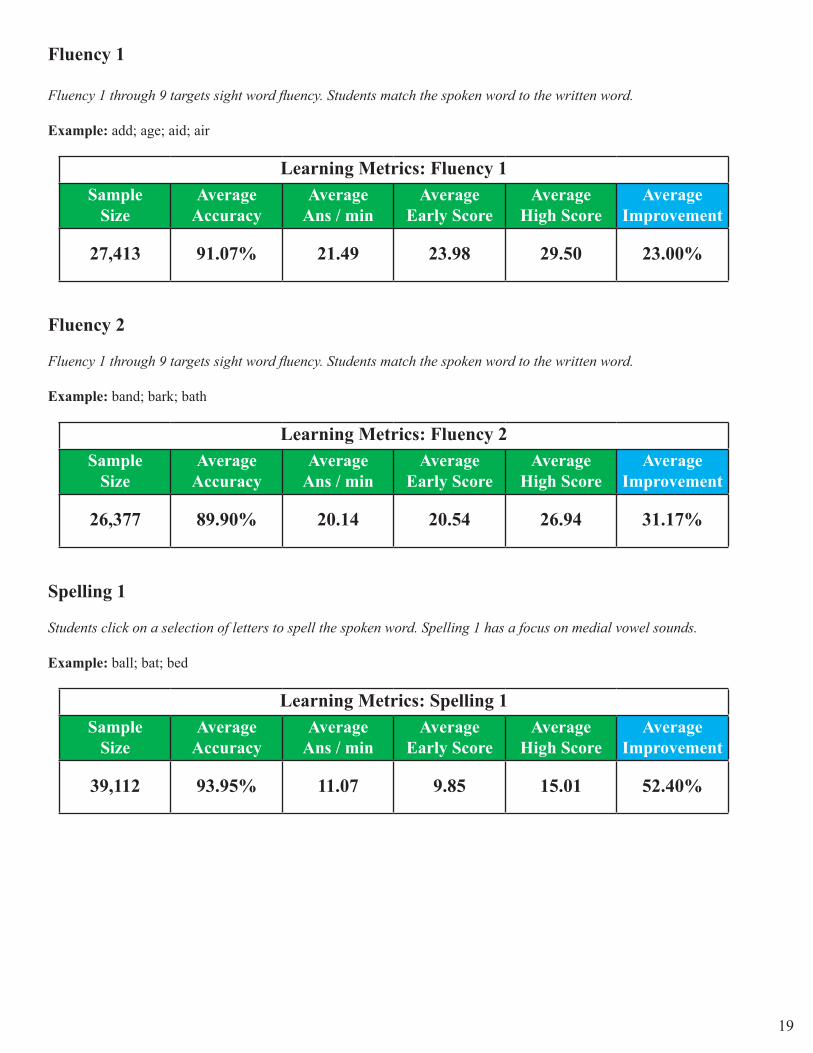
Fluency 1
Fluency 1 through 9 targets sight word fluency. Students match the spoken word to the written word.
Example: add; age; aid; air
Learning Metrics: Fluency 1Sample
SizeAverage
AccuracyAverage
Ans / minAverage
Early ScoreAverage
High ScoreAverage
Improvement
27,413 91.07% 21.49 23.98 29.50 23.00%
Fluency 2
Fluency 1 through 9 targets sight word fluency. Students match the spoken word to the written word.
Example: band; bark; bath
Learning Metrics: Fluency 2Sample
SizeAverage
AccuracyAverage
Ans / minAverage
Early ScoreAverage
High ScoreAverage
Improvement
26,377 89.90% 20.14 20.54 26.94 31.17%
Spelling 1
Students click on a selection of letters to spell the spoken word. Spelling 1 has a focus on medial vowel sounds.
Example: ball; bat; bed
Learning Metrics: Spelling 1Sample
SizeAverage
AccuracyAverage
Ans / minAverage
Early ScoreAverage
High ScoreAverage
Improvement
39,112 93.95% 11.07 9.85 15.01 52.40%
20
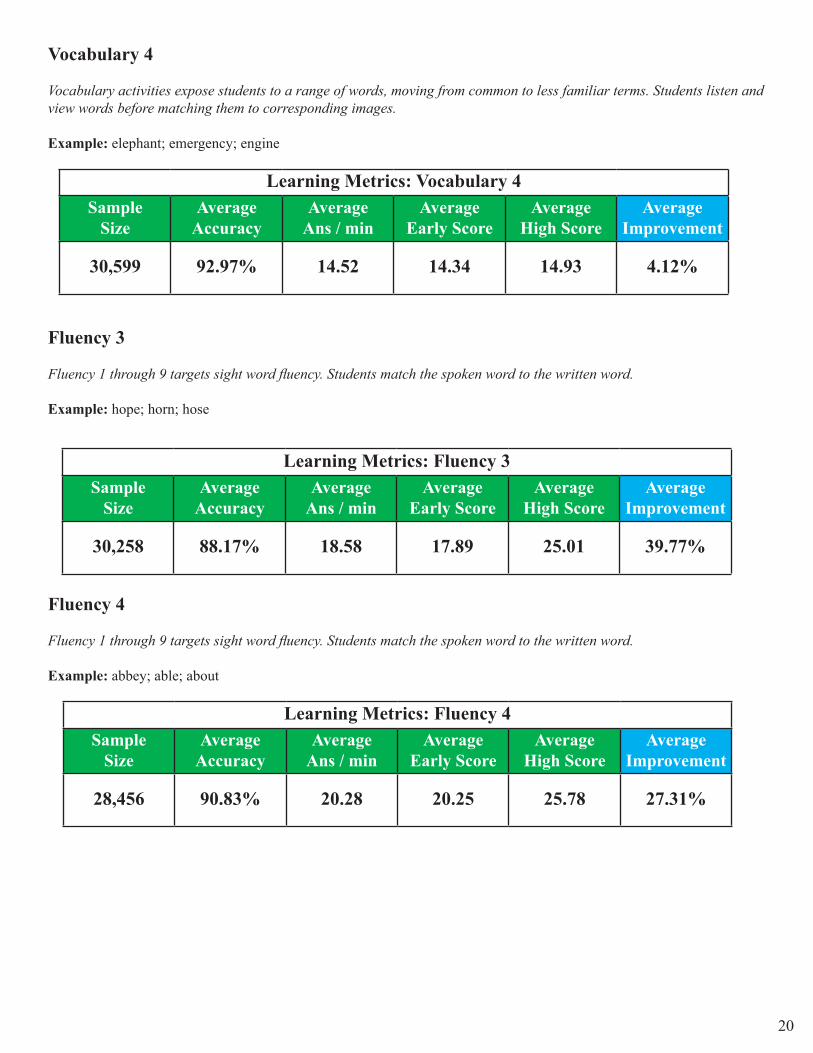
Vocabulary 4
Vocabulary activities expose students to a range of words, moving from common to less familiar terms. Students listen and view words before matching them to corresponding images.
Example: elephant; emergency; engine
Learning Metrics: Vocabulary 4Sample
SizeAverage
AccuracyAverage
Ans / minAverage
Early ScoreAverage
High ScoreAverage
Improvement
30,599 92.97% 14.52 14.34 14.93 4.12%
Fluency 3
Fluency 1 through 9 targets sight word fluency. Students match the spoken word to the written word.
Example: hope; horn; hose
Learning Metrics: Fluency 3Sample
SizeAverage
AccuracyAverage
Ans / minAverage
Early ScoreAverage
High ScoreAverage
Improvement
30,258 88.17% 18.58 17.89 25.01 39.77%
Fluency 4
Fluency 1 through 9 targets sight word fluency. Students match the spoken word to the written word.
Example: abbey; able; about
Learning Metrics: Fluency 4Sample
SizeAverage
AccuracyAverage
Ans / minAverage
Early ScoreAverage
High ScoreAverage
Improvement
28,456 90.83% 20.28 20.25 25.78 27.31%
21
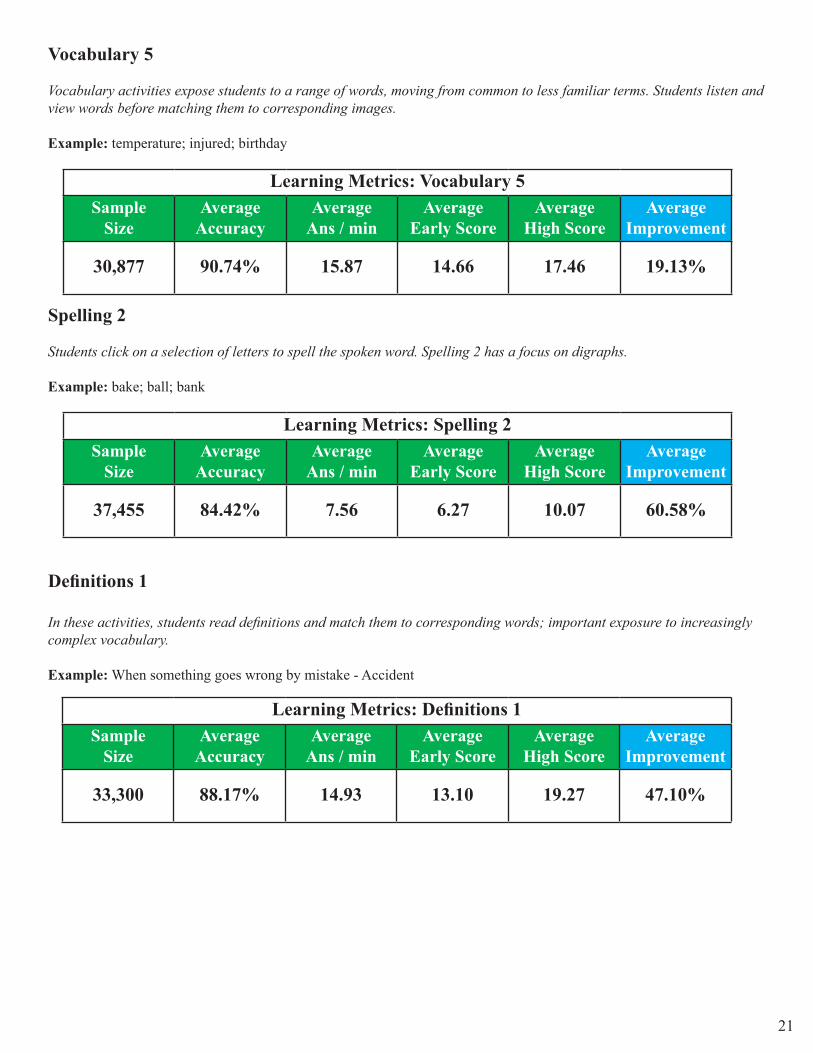
Vocabulary 5
Vocabulary activities expose students to a range of words, moving from common to less familiar terms. Students listen and view words before matching them to corresponding images.
Example: temperature; injured; birthday
Learning Metrics: Vocabulary 5Sample
SizeAverage
AccuracyAverage
Ans / minAverage
Early ScoreAverage
High ScoreAverage
Improvement
30,877 90.74% 15.87 14.66 17.46 19.13%
Spelling 2
Students click on a selection of letters to spell the spoken word. Spelling 2 has a focus on digraphs.
Example: bake; ball; bank
Learning Metrics: Spelling 2Sample
SizeAverage
AccuracyAverage
Ans / minAverage
Early ScoreAverage
High ScoreAverage
Improvement
37,455 84.42% 7.56 6.27 10.07 60.58%
Definitions 1
In these activities, students read definitions and match them to corresponding words; important exposure to increasingly complex vocabulary.
Example: When something goes wrong by mistake - Accident
Learning Metrics: Definitions 1Sample
SizeAverage
AccuracyAverage
Ans / minAverage
Early ScoreAverage
High ScoreAverage
Improvement
33,300 88.17% 14.93 13.10 19.27 47.10%
22
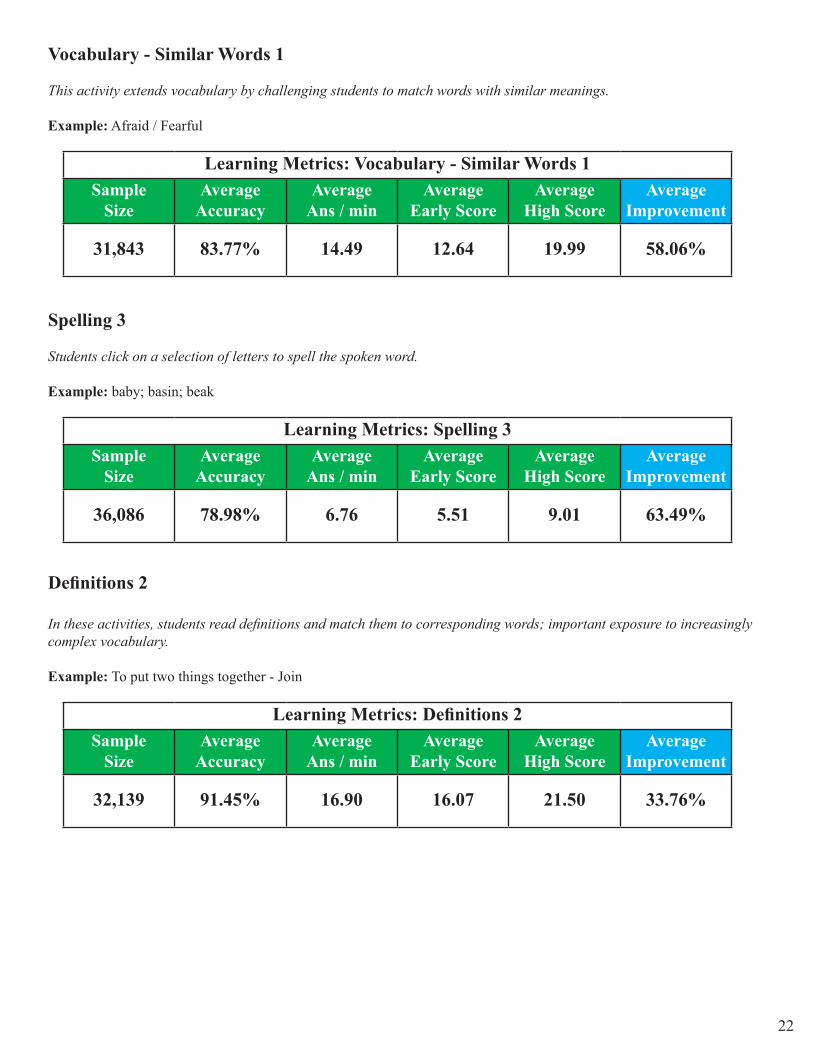
Vocabulary - Similar Words 1
This activity extends vocabulary by challenging students to match words with similar meanings.
Example: Afraid / Fearful
Learning Metrics: Vocabulary - Similar Words 1Sample
SizeAverage
AccuracyAverage
Ans / minAverage
Early ScoreAverage
High ScoreAverage
Improvement
31,843 83.77% 14.49 12.64 19.99 58.06%
Spelling 3
Students click on a selection of letters to spell the spoken word.
Example: baby; basin; beak
Learning Metrics: Spelling 3Sample
SizeAverage
AccuracyAverage
Ans / minAverage
Early ScoreAverage
High ScoreAverage
Improvement
36,086 78.98% 6.76 5.51 9.01 63.49%
Definitions 2
In these activities, students read definitions and match them to corresponding words; important exposure to increasingly complex vocabulary.
Example: To put two things together - Join
Learning Metrics: Definitions 2Sample
SizeAverage
AccuracyAverage
Ans / minAverage
Early ScoreAverage
High ScoreAverage
Improvement
32,139 91.45% 16.90 16.07 21.50 33.76%
23
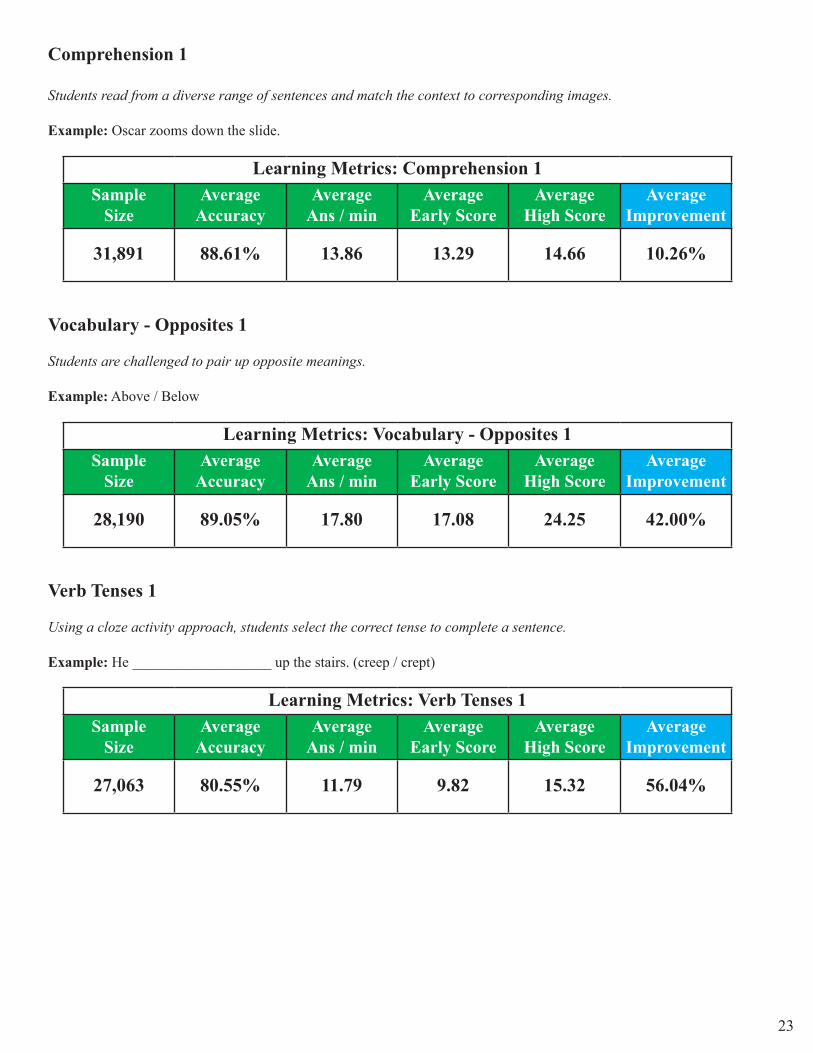
Comprehension 1
Students read from a diverse range of sentences and match the context to corresponding images.
Example: Oscar zooms down the slide.
Learning Metrics: Comprehension 1Sample
SizeAverage
AccuracyAverage
Ans / minAverage
Early ScoreAverage
High ScoreAverage
Improvement
31,891 88.61% 13.86 13.29 14.66 10.26%
Vocabulary - Opposites 1
Students are challenged to pair up opposite meanings.
Example: Above / Below
Learning Metrics: Vocabulary - Opposites 1Sample
SizeAverage
AccuracyAverage
Ans / minAverage
Early ScoreAverage
High ScoreAverage
Improvement
28,190 89.05% 17.80 17.08 24.25 42.00%
Verb Tenses 1
Using a cloze activity approach, students select the correct tense to complete a sentence.
Example: He ___________________ up the stairs. (creep / crept)
Learning Metrics: Verb Tenses 1Sample
SizeAverage
AccuracyAverage
Ans / minAverage
Early ScoreAverage
High ScoreAverage
Improvement
27,063 80.55% 11.79 9.82 15.32 56.04%
24
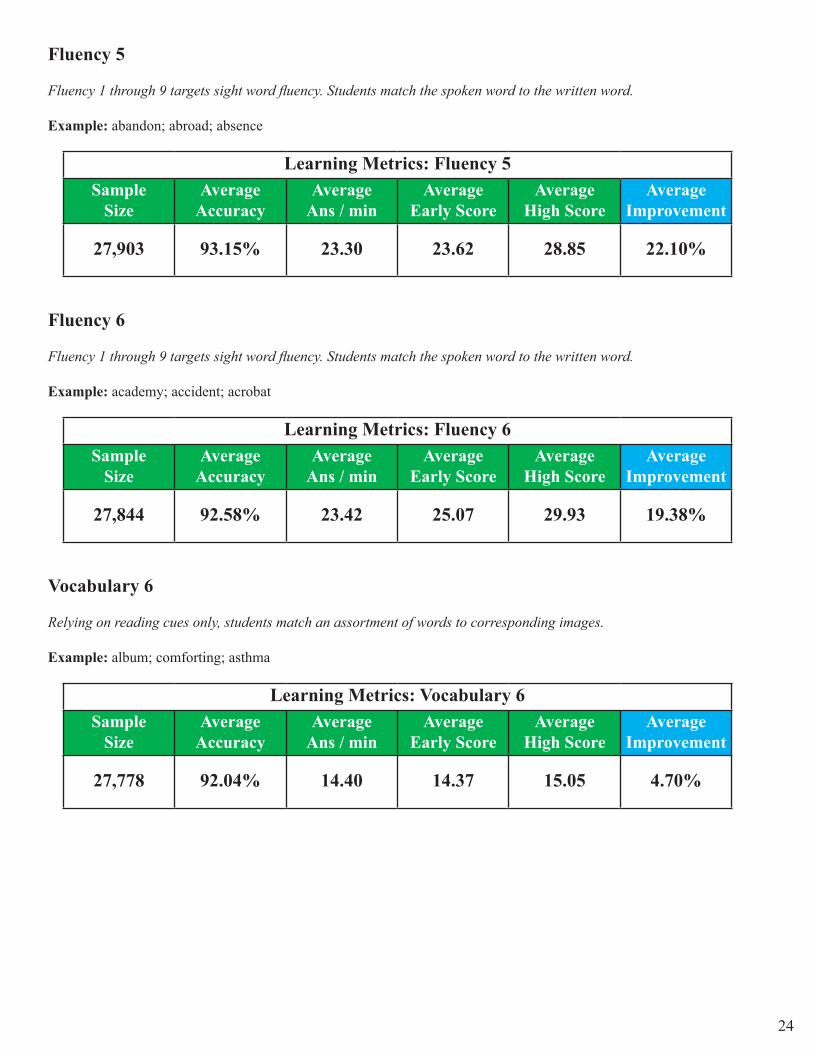
Fluency 5
Fluency 1 through 9 targets sight word fluency. Students match the spoken word to the written word.
Example: abandon; abroad; absence
Learning Metrics: Fluency 5Sample
SizeAverage
AccuracyAverage
Ans / minAverage
Early ScoreAverage
High ScoreAverage
Improvement
27,903 93.15% 23.30 23.62 28.85 22.10%
Fluency 6
Fluency 1 through 9 targets sight word fluency. Students match the spoken word to the written word.
Example: academy; accident; acrobat
Learning Metrics: Fluency 6Sample
SizeAverage
AccuracyAverage
Ans / minAverage
Early ScoreAverage
High ScoreAverage
Improvement
27,844 92.58% 23.42 25.07 29.93 19.38%
Vocabulary 6
Relying on reading cues only, students match an assortment of words to corresponding images.
Example: album; comforting; asthma
Learning Metrics: Vocabulary 6Sample
SizeAverage
AccuracyAverage
Ans / minAverage
Early ScoreAverage
High ScoreAverage
Improvement
27,778 92.04% 14.40 14.37 15.05 4.70%
25
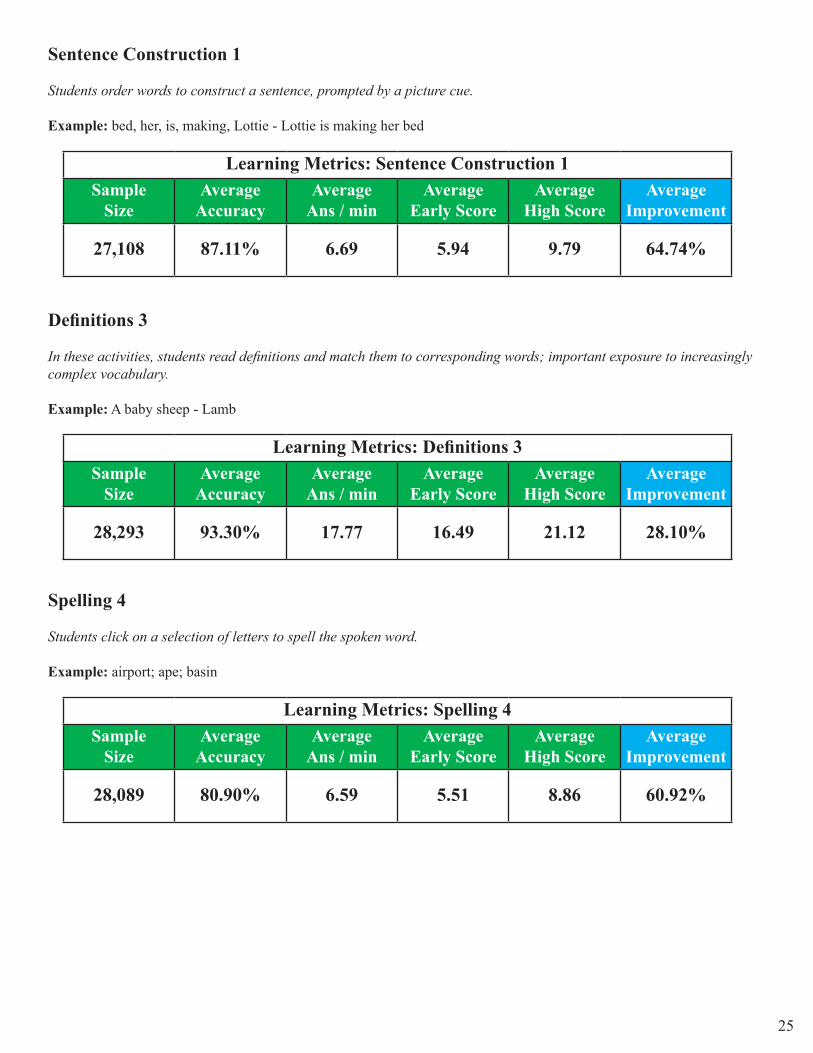
Sentence Construction 1
Students order words to construct a sentence, prompted by a picture cue.
Example: bed, her, is, making, Lottie - Lottie is making her bed
Learning Metrics: Sentence Construction 1Sample
SizeAverage
AccuracyAverage
Ans / minAverage
Early ScoreAverage
High ScoreAverage
Improvement
27,108 87.11% 6.69 5.94 9.79 64.74%
Definitions 3
In these activities, students read definitions and match them to corresponding words; important exposure to increasingly complex vocabulary.
Example: A baby sheep - Lamb
Learning Metrics: Definitions 3Sample
SizeAverage
AccuracyAverage
Ans / minAverage
Early ScoreAverage
High ScoreAverage
Improvement
28,293 93.30% 17.77 16.49 21.12 28.10%
Spelling 4
Students click on a selection of letters to spell the spoken word.
Example: airport; ape; basin
Learning Metrics: Spelling 4Sample
SizeAverage
AccuracyAverage
Ans / minAverage
Early ScoreAverage
High ScoreAverage
Improvement
28,089 80.90% 6.59 5.51 8.86 60.92%

26
Definitions 4
In these activities, students read definitions and match them to corresponding words; important exposure to increasingly complex vocabulary.
Example: A banner showing information - Sign
Learning Metrics: Definitions 4Sample
SizeAverage
AccuracyAverage
Ans / minAverage
Early ScoreAverage
High ScoreAverage
Improvement
24,183 90.67% 15.85 14.63 19.81 35.46%
Spelling 5
Students click on a selection of letters to spell the spoken word.
Example: bumped; button; camping
Learning Metrics: Spelling 5Sample
SizeAverage
AccuracyAverage
Ans / minAverage
Early ScoreAverage
High ScoreAverage
Improvement
26,637 76.44% 5.92 4.56 8.28 81.82%
Verb Tenses 2
Using a cloze activity approach, students select the correct tense to complete a sentence.
Example: After careful consideration I ___________________ the invitation. (decline / declined)
Learning Metrics: Verb Tenses 2Sample
SizeAverage
AccuracyAverage
Ans / minAverage
Early ScoreAverage
High ScoreAverage
Improvement
20,484 80.86% 12.07 10.57 16.83 59.24%

27
Fluency 7
Fluency 1 through 9 targets sight word fluency. Students match the spoken word to the written word.
Example: abandon; abbey; Abigail
Learning Metrics: Fluency 7Sample
SizeAverage
AccuracyAverage
Ans / minAverage
Early ScoreAverage
High ScoreAverage
Improvement
20,591 93.33% 25.34 27.38 31.65 15.58%
Comprehension 2
Students read from a diverse range of sentences and match the context to corresponding images.
Example: Oscar and Ru were suspicious of the strange smell coming from the factory.
Learning Metrics: Comprehension 2Sample
SizeAverage
AccuracyAverage
Ans / minAverage
Early ScoreAverage
High ScoreAverage
Improvement
21,568 87.23% 13.82 13.58 15.05 10.80%
Vocabulary - Similar Words 2
This activity extends vocabulary by challenging students to match words with similar meanings.
Example: Abroad / Overseas
Learning Metrics: Vocabulary - Similar Words 2Sample
SizeAverage
AccuracyAverage
Ans / minAverage
Early ScoreAverage
High ScoreAverage
Improvement
17,880 91.45% 20.65 21.07 26.67 26.60%
28
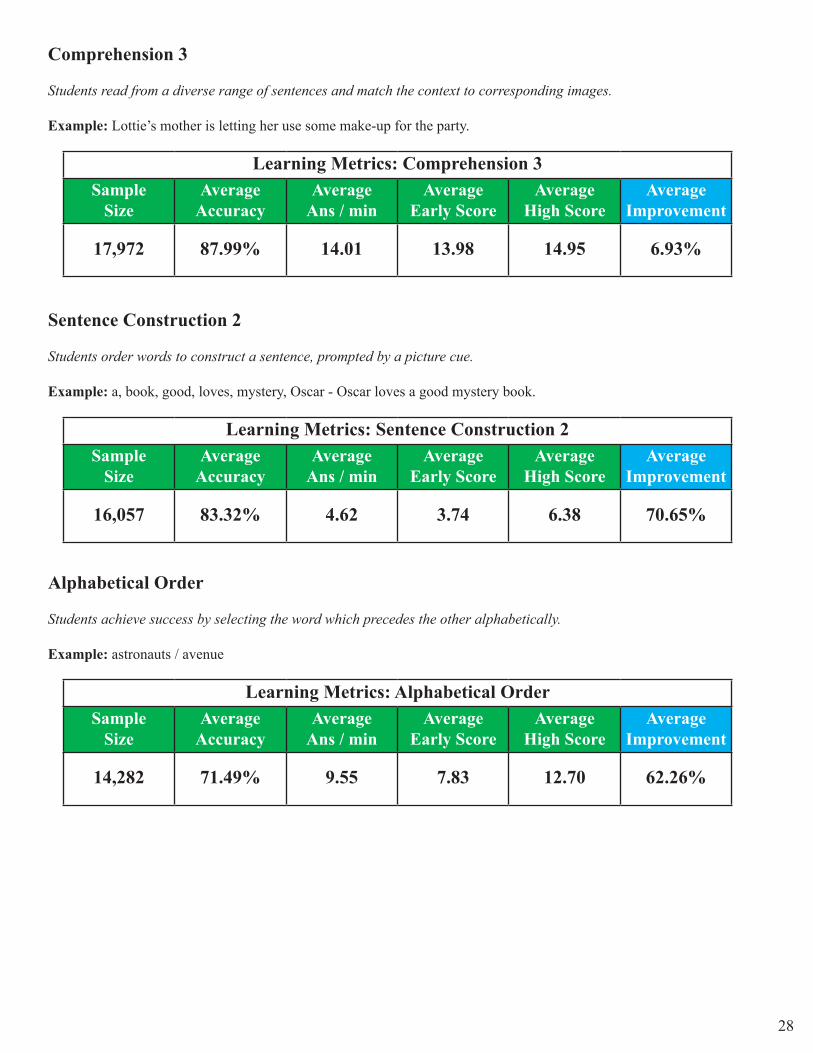
Comprehension 3
Students read from a diverse range of sentences and match the context to corresponding images.
Example: Lottie’s mother is letting her use some make-up for the party.
Learning Metrics: Comprehension 3Sample
SizeAverage
AccuracyAverage
Ans / minAverage
Early ScoreAverage
High ScoreAverage
Improvement
17,972 87.99% 14.01 13.98 14.95 6.93%
Sentence Construction 2
Students order words to construct a sentence, prompted by a picture cue.
Example: a, book, good, loves, mystery, Oscar - Oscar loves a good mystery book.
Learning Metrics: Sentence Construction 2Sample
SizeAverage
AccuracyAverage
Ans / minAverage
Early ScoreAverage
High ScoreAverage
Improvement
16,057 83.32% 4.62 3.74 6.38 70.65%
Alphabetical Order
Students achieve success by selecting the word which precedes the other alphabetically.
Example: astronauts / avenue
Learning Metrics: Alphabetical OrderSample
SizeAverage
AccuracyAverage
Ans / minAverage
Early ScoreAverage
High ScoreAverage
Improvement
14,282 71.49% 9.55 7.83 12.70 62.26%
29
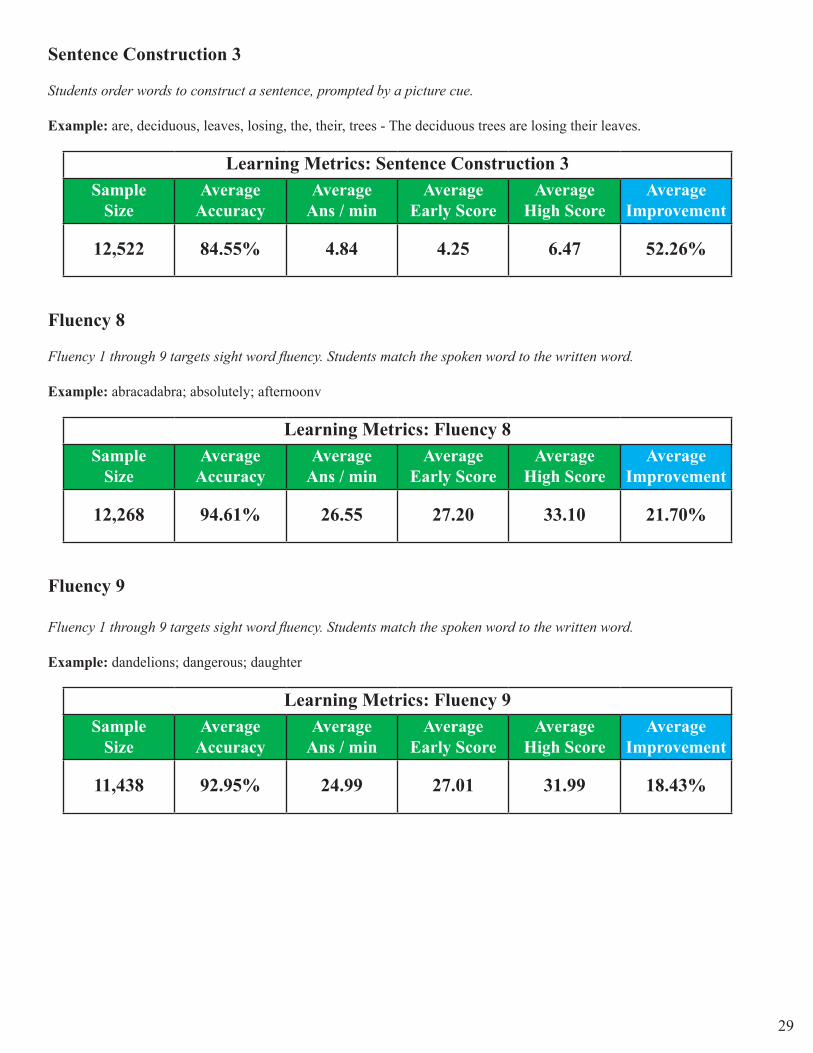
Sentence Construction 3
Students order words to construct a sentence, prompted by a picture cue.
Example: are, deciduous, leaves, losing, the, their, trees - The deciduous trees are losing their leaves.
Learning Metrics: Sentence Construction 3Sample
SizeAverage
AccuracyAverage
Ans / minAverage
Early ScoreAverage
High ScoreAverage
Improvement
12,522 84.55% 4.84 4.25 6.47 52.26%
Fluency 8
Fluency 1 through 9 targets sight word fluency. Students match the spoken word to the written word.
Example: abracadabra; absolutely; afternoonv
Learning Metrics: Fluency 8Sample
SizeAverage
AccuracyAverage
Ans / minAverage
Early ScoreAverage
High ScoreAverage
Improvement
12,268 94.61% 26.55 27.20 33.10 21.70%
Fluency 9
Fluency 1 through 9 targets sight word fluency. Students match the spoken word to the written word.
Example: dandelions; dangerous; daughter
Learning Metrics: Fluency 9Sample
SizeAverage
AccuracyAverage
Ans / minAverage
Early ScoreAverage
High ScoreAverage
Improvement
11,438 92.95% 24.99 27.01 31.99 18.43%
30
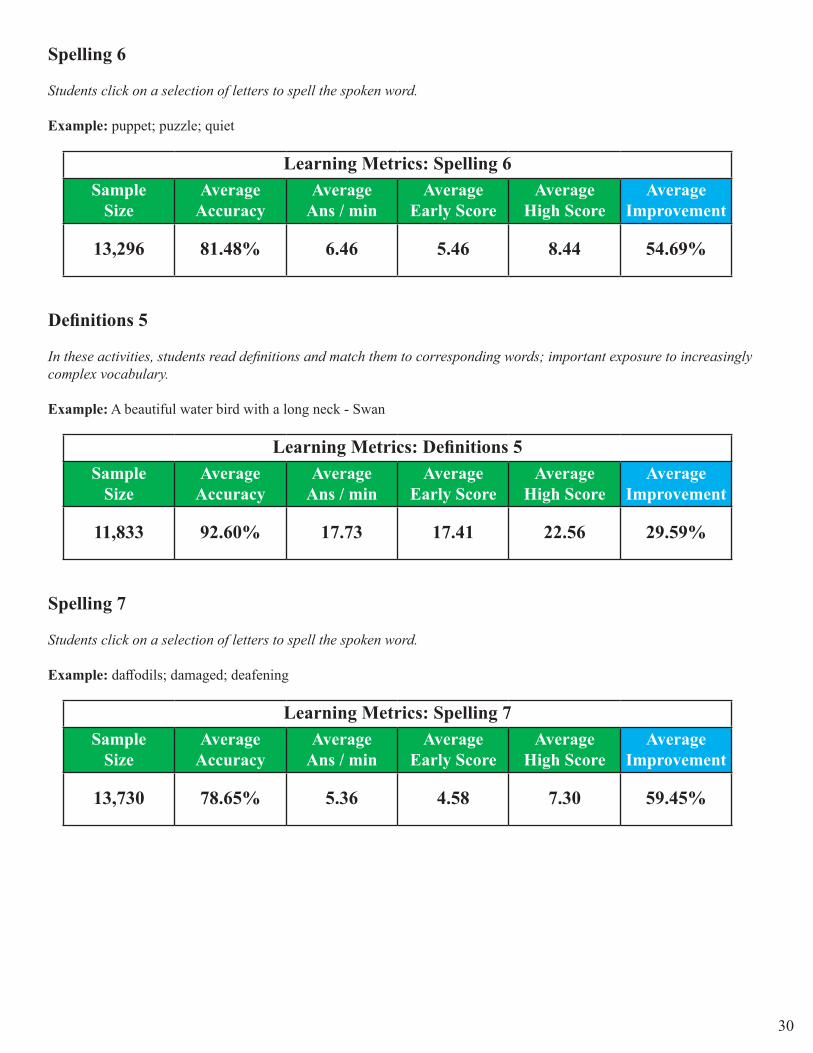
Spelling 6
Students click on a selection of letters to spell the spoken word.
Example: puppet; puzzle; quiet
Learning Metrics: Spelling 6Sample
SizeAverage
AccuracyAverage
Ans / minAverage
Early ScoreAverage
High ScoreAverage
Improvement
13,296 81.48% 6.46 5.46 8.44 54.69%
Definitions 5
In these activities, students read definitions and match them to corresponding words; important exposure to increasingly complex vocabulary.
Example: A beautiful water bird with a long neck - Swan
Learning Metrics: Definitions 5Sample
SizeAverage
AccuracyAverage
Ans / minAverage
Early ScoreAverage
High ScoreAverage
Improvement
11,833 92.60% 17.73 17.41 22.56 29.59%
Spelling 7
Students click on a selection of letters to spell the spoken word.
Example: daffodils; damaged; deafening
Learning Metrics: Spelling 7Sample
SizeAverage
AccuracyAverage
Ans / minAverage
Early ScoreAverage
High ScoreAverage
Improvement
13,730 78.65% 5.36 4.58 7.30 59.45%
31
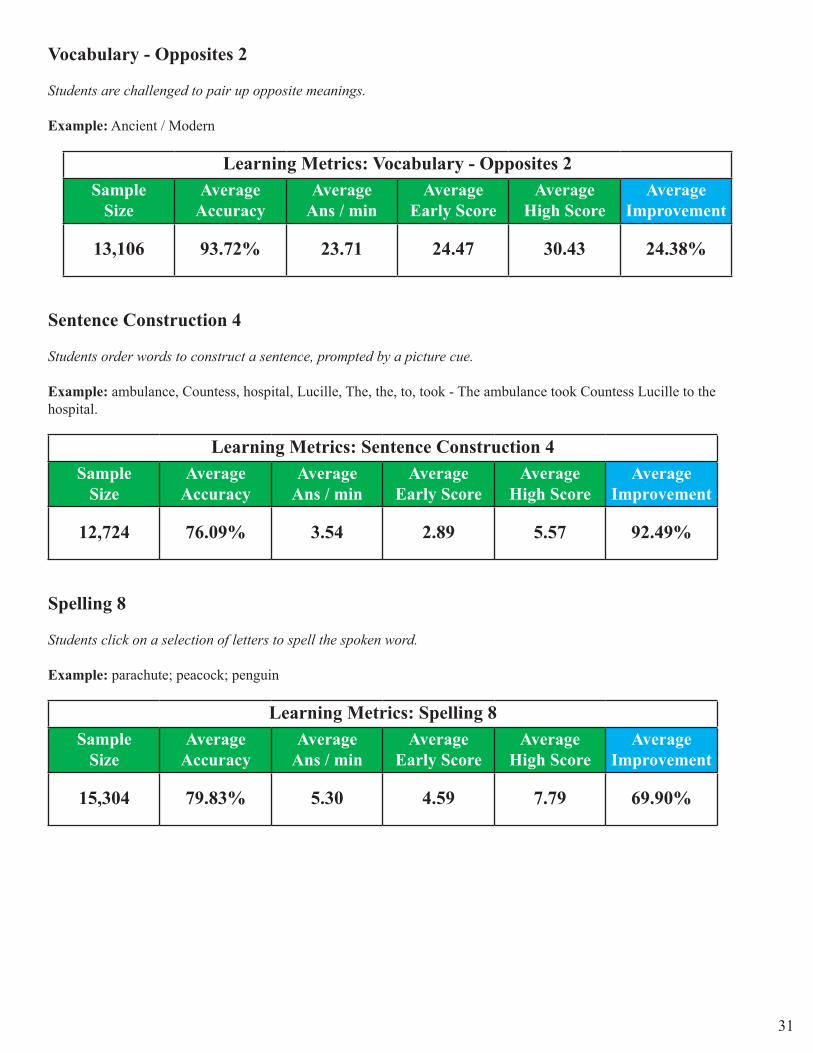
Vocabulary - Opposites 2
Students are challenged to pair up opposite meanings.
Example: Ancient / Modern
Learning Metrics: Vocabulary - Opposites 2Sample
SizeAverage
AccuracyAverage
Ans / minAverage
Early ScoreAverage
High ScoreAverage
Improvement
13,106 93.72% 23.71 24.47 30.43 24.38%
Sentence Construction 4
Students order words to construct a sentence, prompted by a picture cue.
Example: ambulance, Countess, hospital, Lucille, The, the, to, took - The ambulance took Countess Lucille to the hospital.
Learning Metrics: Sentence Construction 4Sample
SizeAverage
AccuracyAverage
Ans / minAverage
Early ScoreAverage
High ScoreAverage
Improvement
12,724 76.09% 3.54 2.89 5.57 92.49%
Spelling 8
Students click on a selection of letters to spell the spoken word.
Example: parachute; peacock; penguin
Learning Metrics: Spelling 8Sample
SizeAverage
AccuracyAverage
Ans / minAverage
Early ScoreAverage
High ScoreAverage
Improvement
15,304 79.83% 5.30 4.59 7.79 69.90%
32
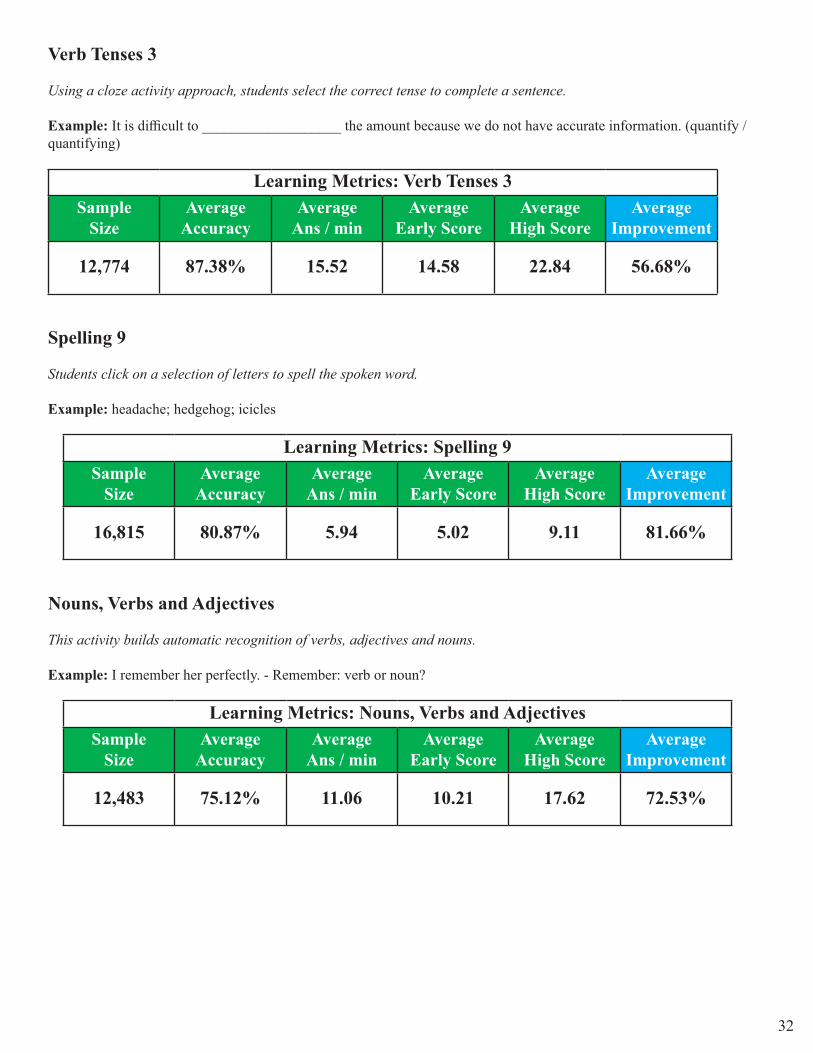
Verb Tenses 3
Using a cloze activity approach, students select the correct tense to complete a sentence.
Example: It is difficult to ___________________ the amount because we do not have accurate information. (quantify / quantifying)
Learning Metrics: Verb Tenses 3Sample
SizeAverage
AccuracyAverage
Ans / minAverage
Early ScoreAverage
High ScoreAverage
Improvement
12,774 87.38% 15.52 14.58 22.84 56.68%
Spelling 9
Students click on a selection of letters to spell the spoken word.
Example: headache; hedgehog; icicles
Learning Metrics: Spelling 9Sample
SizeAverage
AccuracyAverage
Ans / minAverage
Early ScoreAverage
High ScoreAverage
Improvement
16,815 80.87% 5.94 5.02 9.11 81.66%
Nouns, Verbs and Adjectives
This activity builds automatic recognition of verbs, adjectives and nouns.
Example: I remember her perfectly. - Remember: verb or noun?
Learning Metrics: Nouns, Verbs and AdjectivesSample
SizeAverage
AccuracyAverage
Ans / minAverage
Early ScoreAverage
High ScoreAverage
Improvement
12,483 75.12% 11.06 10.21 17.62 72.53%
33
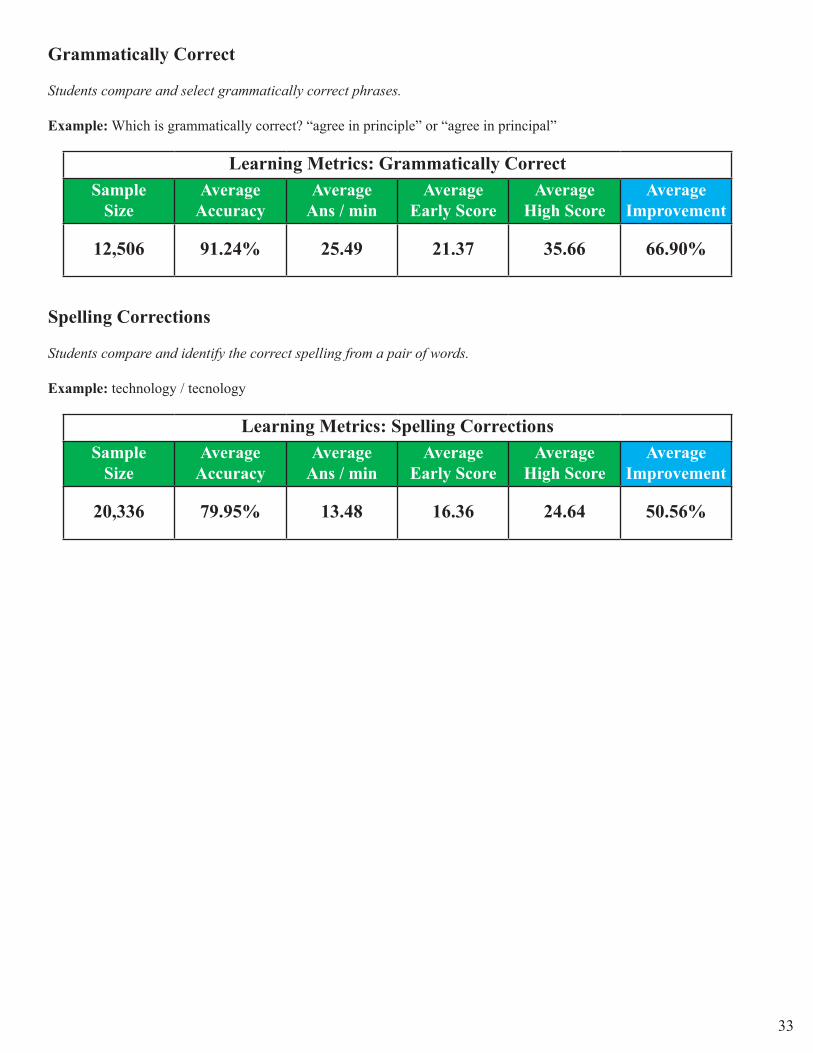
Grammatically Correct
Students compare and select grammatically correct phrases.
Example: Which is grammatically correct? “agree in principle” or “agree in principal”
Learning Metrics: Grammatically CorrectSample
SizeAverage
AccuracyAverage
Ans / minAverage
Early ScoreAverage
High ScoreAverage
Improvement
12,506 91.24% 25.49 21.37 35.66 66.90%
Spelling Corrections
Students compare and identify the correct spelling from a pair of words.
Example: technology / tecnology
Learning Metrics: Spelling CorrectionsSample
SizeAverage
AccuracyAverage
Ans / minAverage
Early ScoreAverage
High ScoreAverage
Improvement
20,336 79.95% 13.48 16.36 24.64 50.56%

34
Numeracy
35
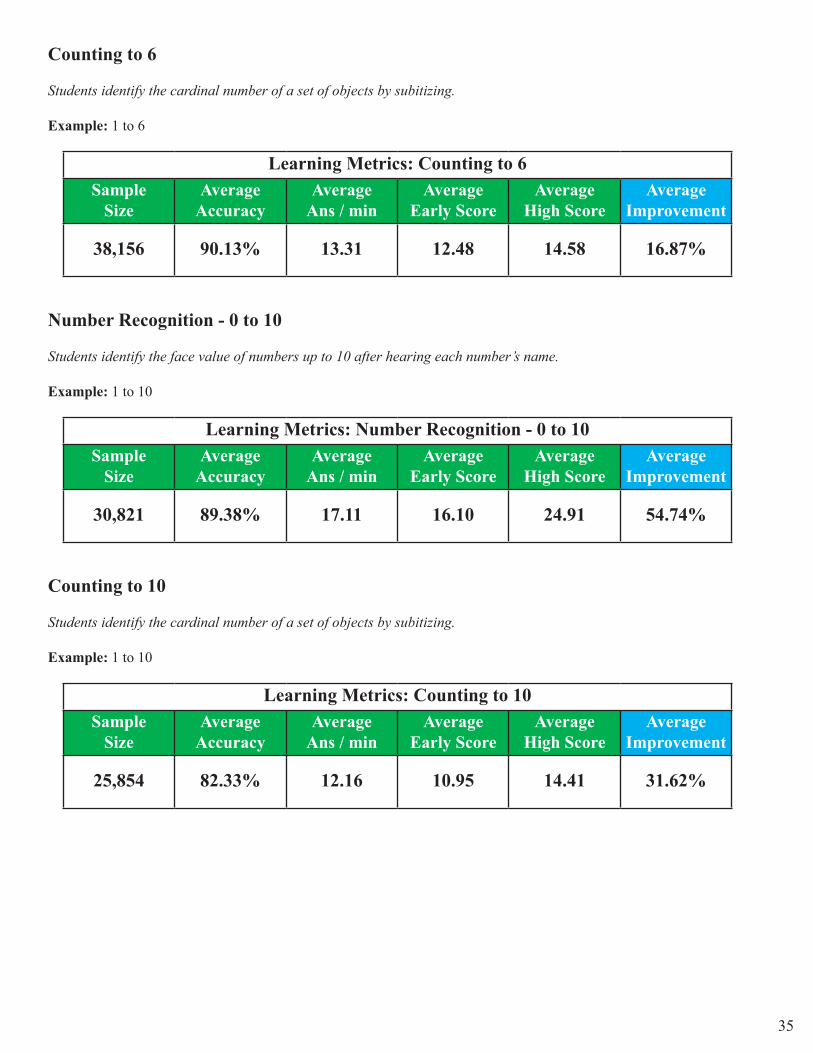
Counting to 6
Students identify the cardinal number of a set of objects by subitizing.
Example: 1 to 6
Learning Metrics: Counting to 6Sample
SizeAverage
AccuracyAverage
Ans / minAverage
Early ScoreAverage
High ScoreAverage
Improvement
38,156 90.13% 13.31 12.48 14.58 16.87%
Number Recognition - 0 to 10
Students identify the face value of numbers up to 10 after hearing each number’s name.
Example: 1 to 10
Learning Metrics: Number Recognition - 0 to 10Sample
SizeAverage
AccuracyAverage
Ans / minAverage
Early ScoreAverage
High ScoreAverage
Improvement
30,821 89.38% 17.11 16.10 24.91 54.74%
Counting to 10
Students identify the cardinal number of a set of objects by subitizing.
Example: 1 to 10
Learning Metrics: Counting to 10Sample
SizeAverage
AccuracyAverage
Ans / minAverage
Early ScoreAverage
High ScoreAverage
Improvement
25,854 82.33% 12.16 10.95 14.41 31.62%
36
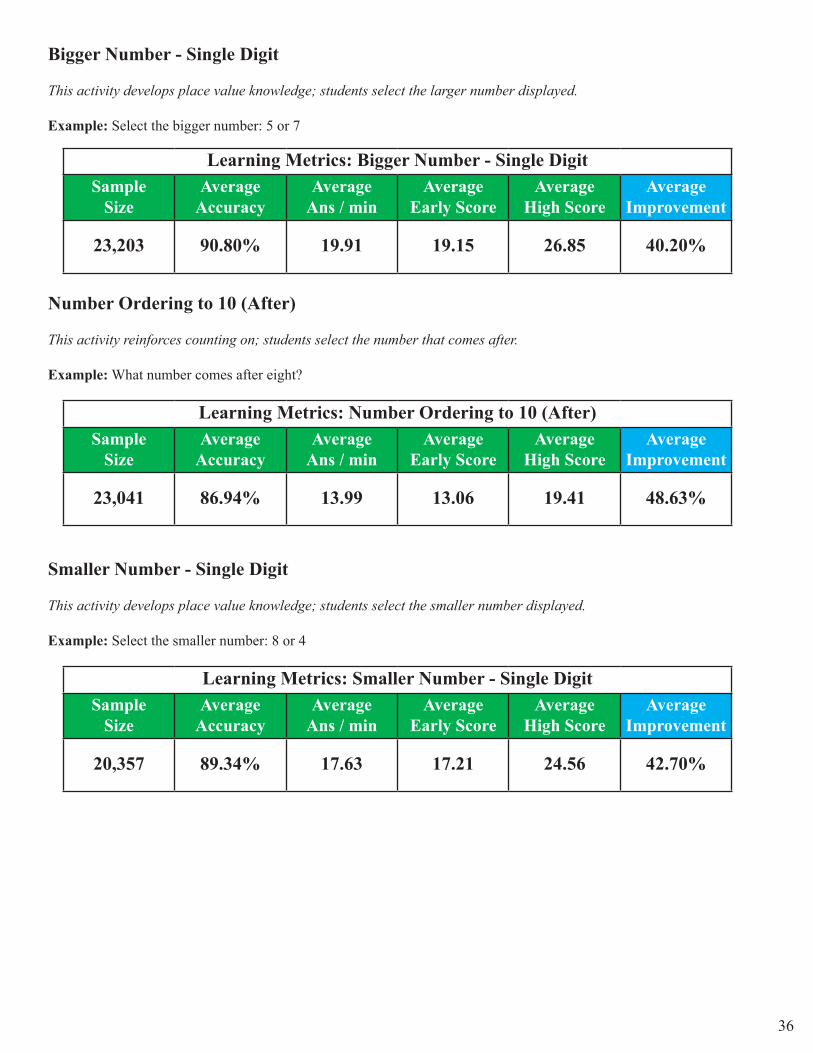
Bigger Number - Single Digit
This activity develops place value knowledge; students select the larger number displayed.
Example: Select the bigger number: 5 or 7
Learning Metrics: Bigger Number - Single DigitSample
SizeAverage
AccuracyAverage
Ans / minAverage
Early ScoreAverage
High ScoreAverage
Improvement
23,203 90.80% 19.91 19.15 26.85 40.20%
Number Ordering to 10 (After)
This activity reinforces counting on; students select the number that comes after.
Example: What number comes after eight?
Learning Metrics: Number Ordering to 10 (After)Sample
SizeAverage
AccuracyAverage
Ans / minAverage
Early ScoreAverage
High ScoreAverage
Improvement
23,041 86.94% 13.99 13.06 19.41 48.63%
Smaller Number - Single Digit
This activity develops place value knowledge; students select the smaller number displayed.
Example: Select the smaller number: 8 or 4
Learning Metrics: Smaller Number - Single DigitSample
SizeAverage
AccuracyAverage
Ans / minAverage
Early ScoreAverage
High ScoreAverage
Improvement
20,357 89.34% 17.63 17.21 24.56 42.70%

37
Number Ordering to 10 (Before)
This activity reinforces counting back; students select the number that comes before.
Example: What number comes before eight?
Learning Metrics: Number Ordering to 10 (Before)Sample
SizeAverage
AccuracyAverage
Ans / minAverage
Early ScoreAverage
High ScoreAverage
Improvement
21,504 84.78% 13.26 12.20 19.21 57.48%
Number Recognition - 0 to 20
Students listen to and then select a number based on its face value.
Example: 0 to 20
Learning Metrics: Number Recognition - 0 to 20Sample
SizeAverage
AccuracyAverage
Ans / minAverage
Early ScoreAverage
High ScoreAverage
Improvement
22,399 94.33% 22.21 24.33 29.11 19.61%
Addition to 6
Students complete an equation by selecting the sum.
Example: 1 + 2
Learning Metrics: Addition to 6Sample
SizeAverage
AccuracyAverage
Ans / minAverage
Early ScoreAverage
High ScoreAverage
Improvement
21,463 89.22% 16.14 15.18 22.24 46.54%
38
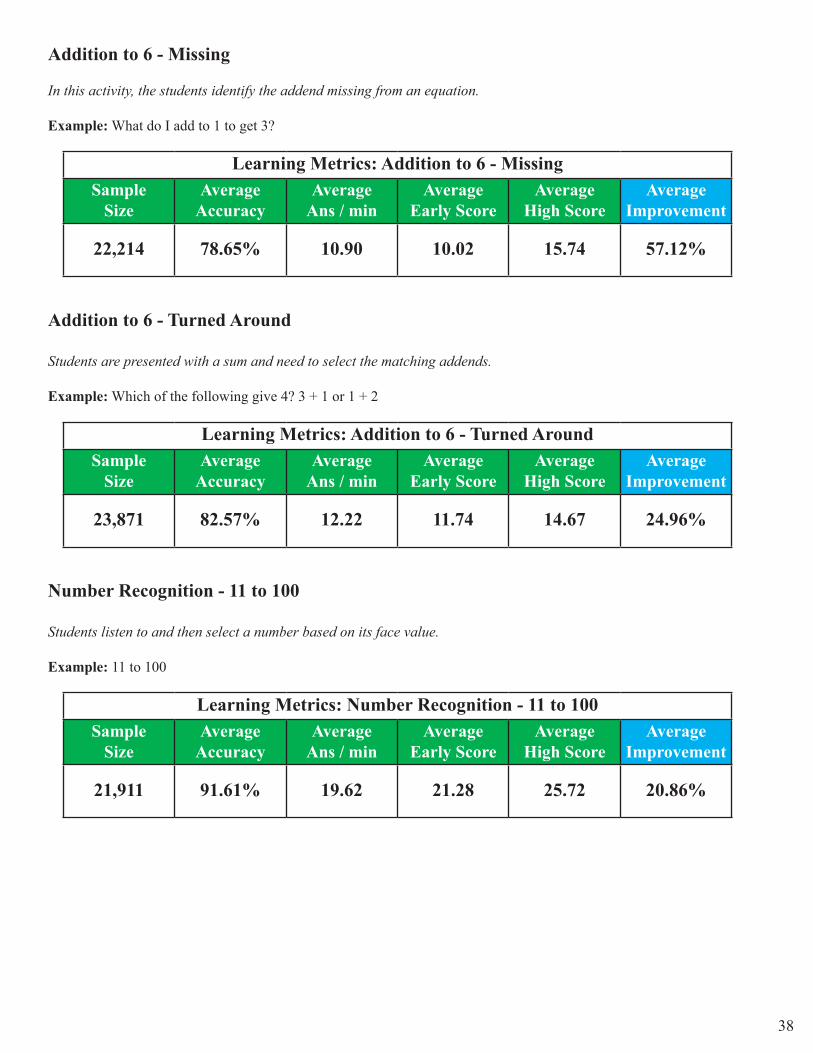
Addition to 6 - Missing
In this activity, the students identify the addend missing from an equation.
Example: What do I add to 1 to get 3?
Learning Metrics: Addition to 6 - MissingSample
SizeAverage
AccuracyAverage
Ans / minAverage
Early ScoreAverage
High ScoreAverage
Improvement
22,214 78.65% 10.90 10.02 15.74 57.12%
Addition to 6 - Turned Around
Students are presented with a sum and need to select the matching addends.
Example: Which of the following give 4? 3 + 1 or 1 + 2
Learning Metrics: Addition to 6 - Turned AroundSample
SizeAverage
AccuracyAverage
Ans / minAverage
Early ScoreAverage
High ScoreAverage
Improvement
23,871 82.57% 12.22 11.74 14.67 24.96%
Number Recognition - 11 to 100
Students listen to and then select a number based on its face value.
Example: 11 to 100
Learning Metrics: Number Recognition - 11 to 100Sample
SizeAverage
AccuracyAverage
Ans / minAverage
Early ScoreAverage
High ScoreAverage
Improvement
21,911 91.61% 19.62 21.28 25.72 20.86%
39
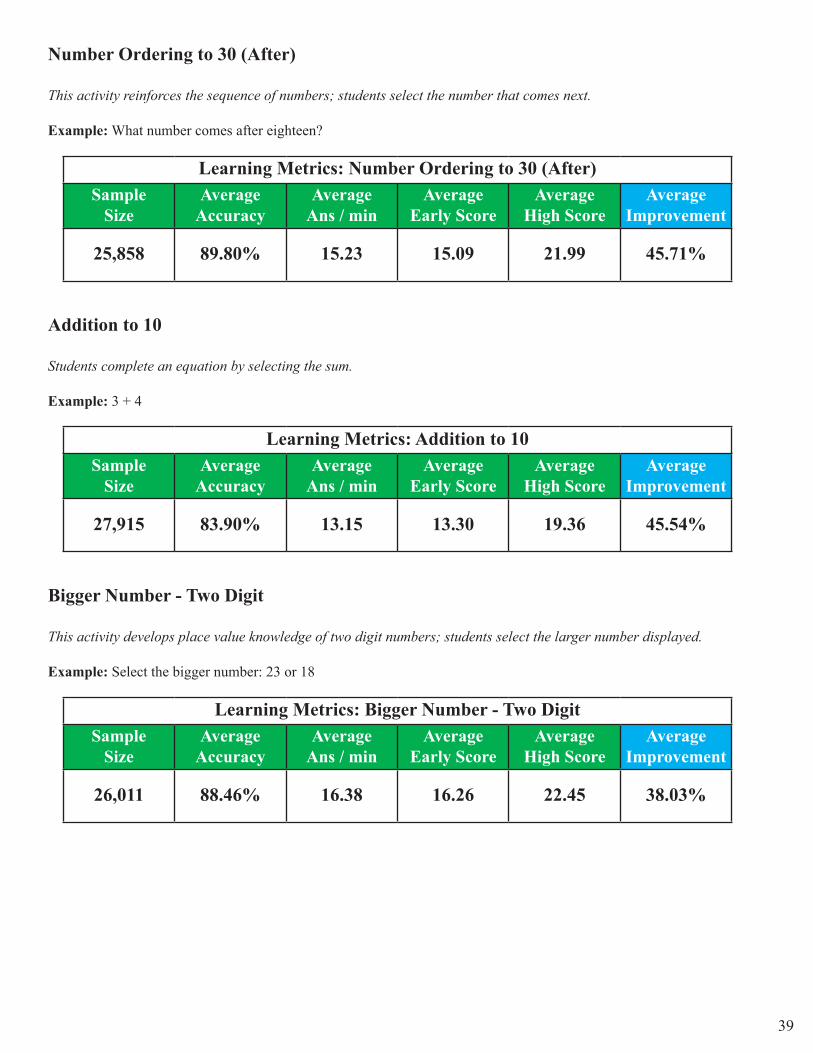
Number Ordering to 30 (After)
This activity reinforces the sequence of numbers; students select the number that comes next.
Example: What number comes after eighteen?
Learning Metrics: Number Ordering to 30 (After)Sample
SizeAverage
AccuracyAverage
Ans / minAverage
Early ScoreAverage
High ScoreAverage
Improvement
25,858 89.80% 15.23 15.09 21.99 45.71%
Addition to 10
Students complete an equation by selecting the sum.
Example: 3 + 4
Learning Metrics: Addition to 10Sample
SizeAverage
AccuracyAverage
Ans / minAverage
Early ScoreAverage
High ScoreAverage
Improvement
27,915 83.90% 13.15 13.30 19.36 45.54%
Bigger Number - Two Digit
This activity develops place value knowledge of two digit numbers; students select the larger number displayed.
Example: Select the bigger number: 23 or 18
Learning Metrics: Bigger Number - Two DigitSample
SizeAverage
AccuracyAverage
Ans / minAverage
Early ScoreAverage
High ScoreAverage
Improvement
26,011 88.46% 16.38 16.26 22.45 38.03%
40
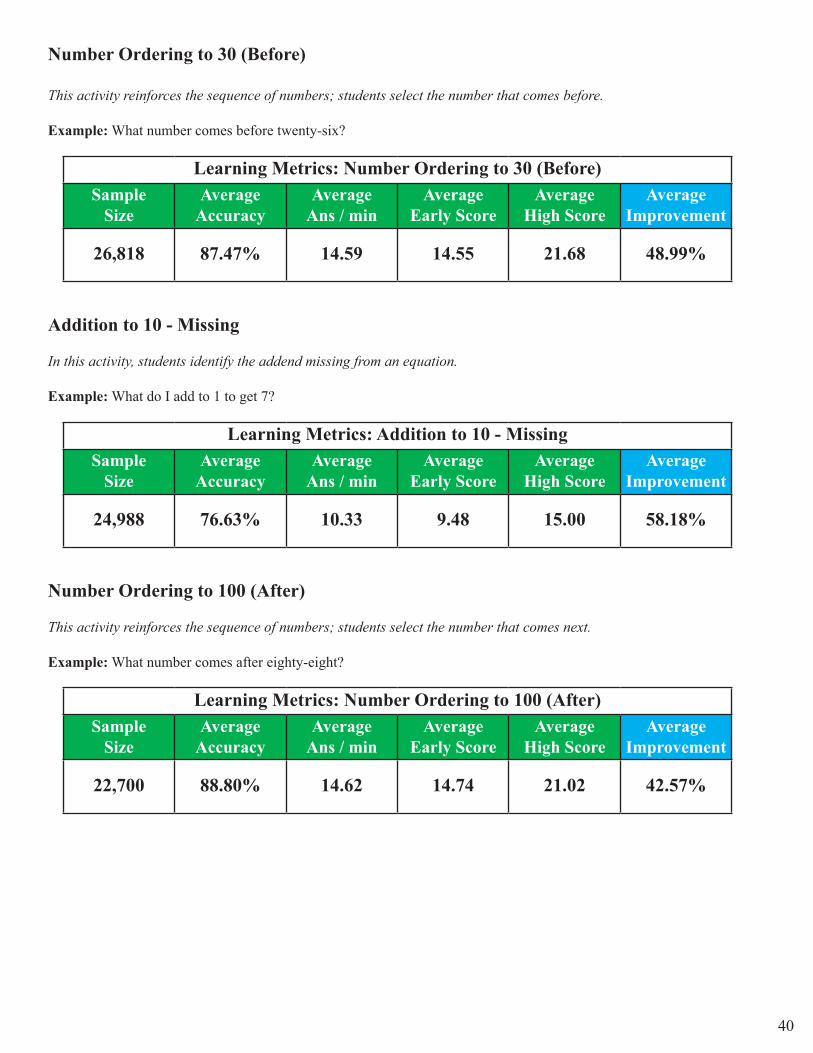
Number Ordering to 30 (Before)
This activity reinforces the sequence of numbers; students select the number that comes before.
Example: What number comes before twenty-six?
Learning Metrics: Number Ordering to 30 (Before)Sample
SizeAverage
AccuracyAverage
Ans / minAverage
Early ScoreAverage
High ScoreAverage
Improvement
26,818 87.47% 14.59 14.55 21.68 48.99%
Addition to 10 - Missing
In this activity, students identify the addend missing from an equation.
Example: What do I add to 1 to get 7?
Learning Metrics: Addition to 10 - MissingSample
SizeAverage
AccuracyAverage
Ans / minAverage
Early ScoreAverage
High ScoreAverage
Improvement
24,988 76.63% 10.33 9.48 15.00 58.18%
Number Ordering to 100 (After)
This activity reinforces the sequence of numbers; students select the number that comes next.
Example: What number comes after eighty-eight?
Learning Metrics: Number Ordering to 100 (After)Sample
SizeAverage
AccuracyAverage
Ans / minAverage
Early ScoreAverage
High ScoreAverage
Improvement
22,700 88.80% 14.62 14.74 21.02 42.57%
41
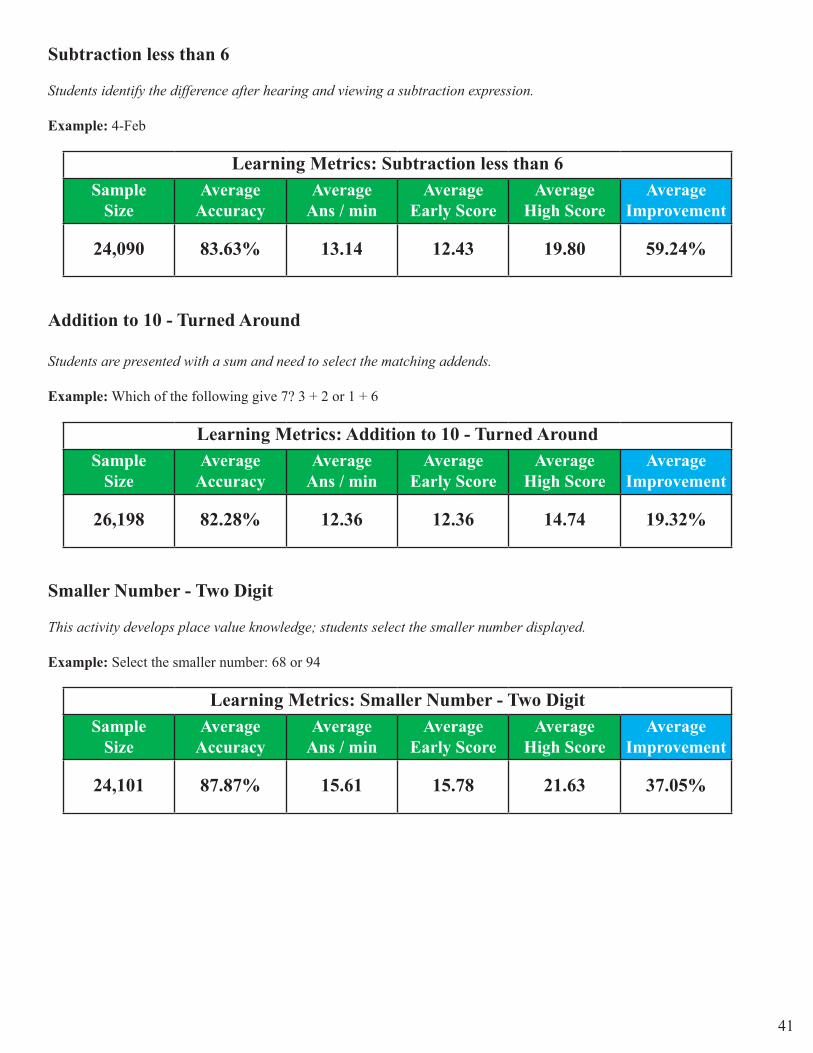
Subtraction less than 6
Students identify the difference after hearing and viewing a subtraction expression.
Example: 4-Feb
Learning Metrics: Subtraction less than 6Sample
SizeAverage
AccuracyAverage
Ans / minAverage
Early ScoreAverage
High ScoreAverage
Improvement
24,090 83.63% 13.14 12.43 19.80 59.24%
Addition to 10 - Turned Around
Students are presented with a sum and need to select the matching addends.
Example: Which of the following give 7? 3 + 2 or 1 + 6
Learning Metrics: Addition to 10 - Turned AroundSample
SizeAverage
AccuracyAverage
Ans / minAverage
Early ScoreAverage
High ScoreAverage
Improvement
26,198 82.28% 12.36 12.36 14.74 19.32%
Smaller Number - Two Digit
This activity develops place value knowledge; students select the smaller number displayed.
Example: Select the smaller number: 68 or 94
Learning Metrics: Smaller Number - Two DigitSample
SizeAverage
AccuracyAverage
Ans / minAverage
Early ScoreAverage
High ScoreAverage
Improvement
24,101 87.87% 15.61 15.78 21.63 37.05%
42
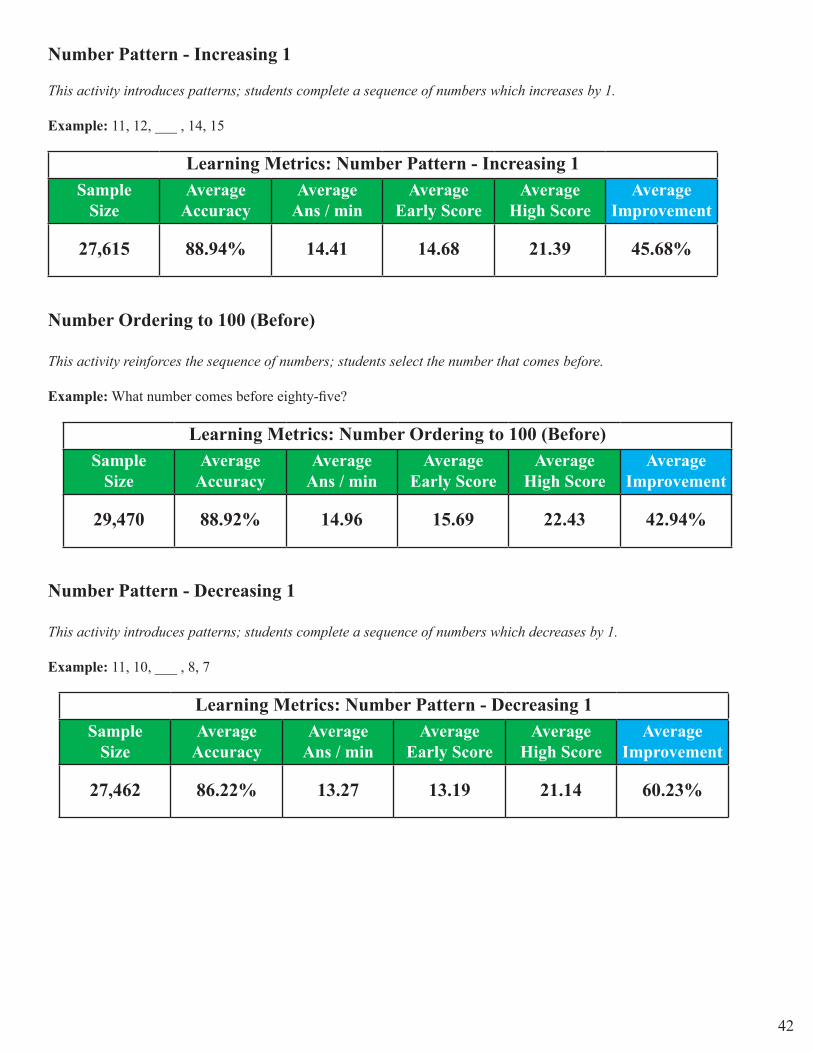
Number Pattern - Increasing 1
This activity introduces patterns; students complete a sequence of numbers which increases by 1.
Example: 11, 12, ___ , 14, 15
Learning Metrics: Number Pattern - Increasing 1Sample
SizeAverage
AccuracyAverage
Ans / minAverage
Early ScoreAverage
High ScoreAverage
Improvement
27,615 88.94% 14.41 14.68 21.39 45.68%
Number Ordering to 100 (Before)
This activity reinforces the sequence of numbers; students select the number that comes before.
Example: What number comes before eighty-five?
Learning Metrics: Number Ordering to 100 (Before)Sample
SizeAverage
AccuracyAverage
Ans / minAverage
Early ScoreAverage
High ScoreAverage
Improvement
29,470 88.92% 14.96 15.69 22.43 42.94%
Number Pattern - Decreasing 1
This activity introduces patterns; students complete a sequence of numbers which decreases by 1.
Example: 11, 10, ___ , 8, 7
Learning Metrics: Number Pattern - Decreasing 1Sample
SizeAverage
AccuracyAverage
Ans / minAverage
Early ScoreAverage
High ScoreAverage
Improvement
27,462 86.22% 13.27 13.19 21.14 60.23%
43
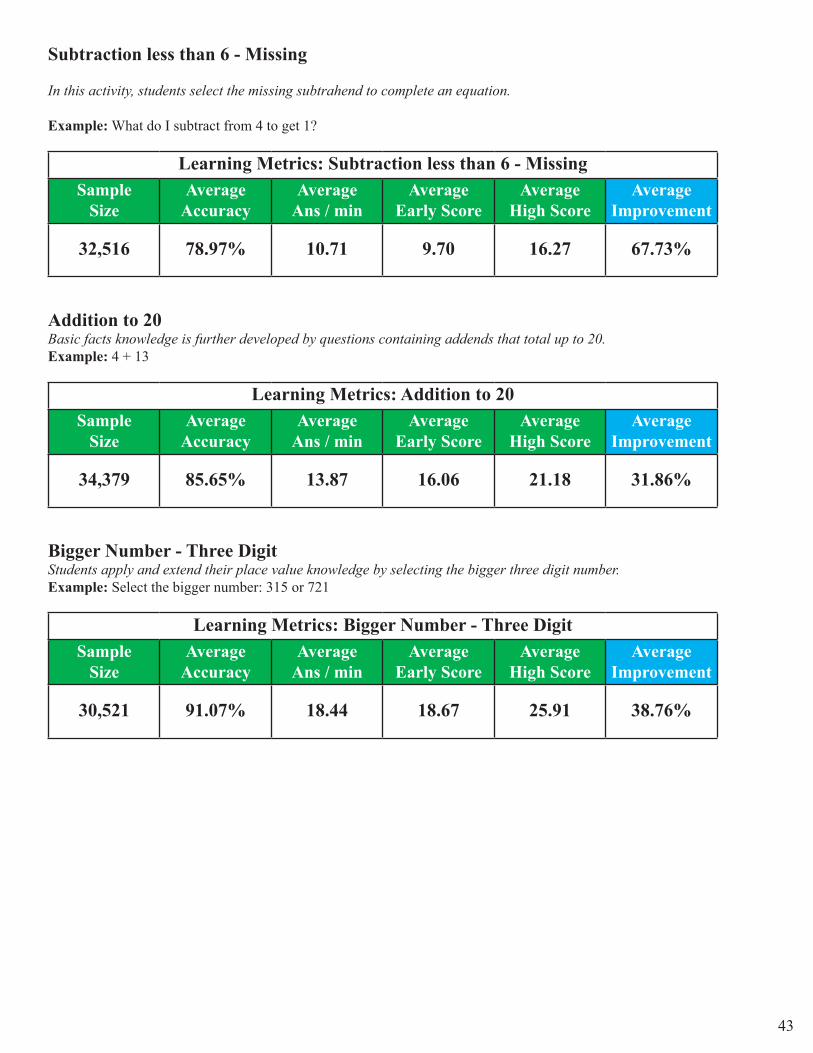
Subtraction less than 6 - Missing
In this activity, students select the missing subtrahend to complete an equation.
Example: What do I subtract from 4 to get 1?
Learning Metrics: Subtraction less than 6 - MissingSample
SizeAverage
AccuracyAverage
Ans / minAverage
Early ScoreAverage
High ScoreAverage
Improvement
32,516 78.97% 10.71 9.70 16.27 67.73%
Addition to 20Basic facts knowledge is further developed by questions containing addends that total up to 20.Example: 4 + 13
Learning Metrics: Addition to 20Sample
SizeAverage
AccuracyAverage
Ans / minAverage
Early ScoreAverage
High ScoreAverage
Improvement
34,379 85.65% 13.87 16.06 21.18 31.86%
Bigger Number - Three DigitStudents apply and extend their place value knowledge by selecting the bigger three digit number.Example: Select the bigger number: 315 or 721
Learning Metrics: Bigger Number - Three DigitSample
SizeAverage
AccuracyAverage
Ans / minAverage
Early ScoreAverage
High ScoreAverage
Improvement
30,521 91.07% 18.44 18.67 25.91 38.76%
44
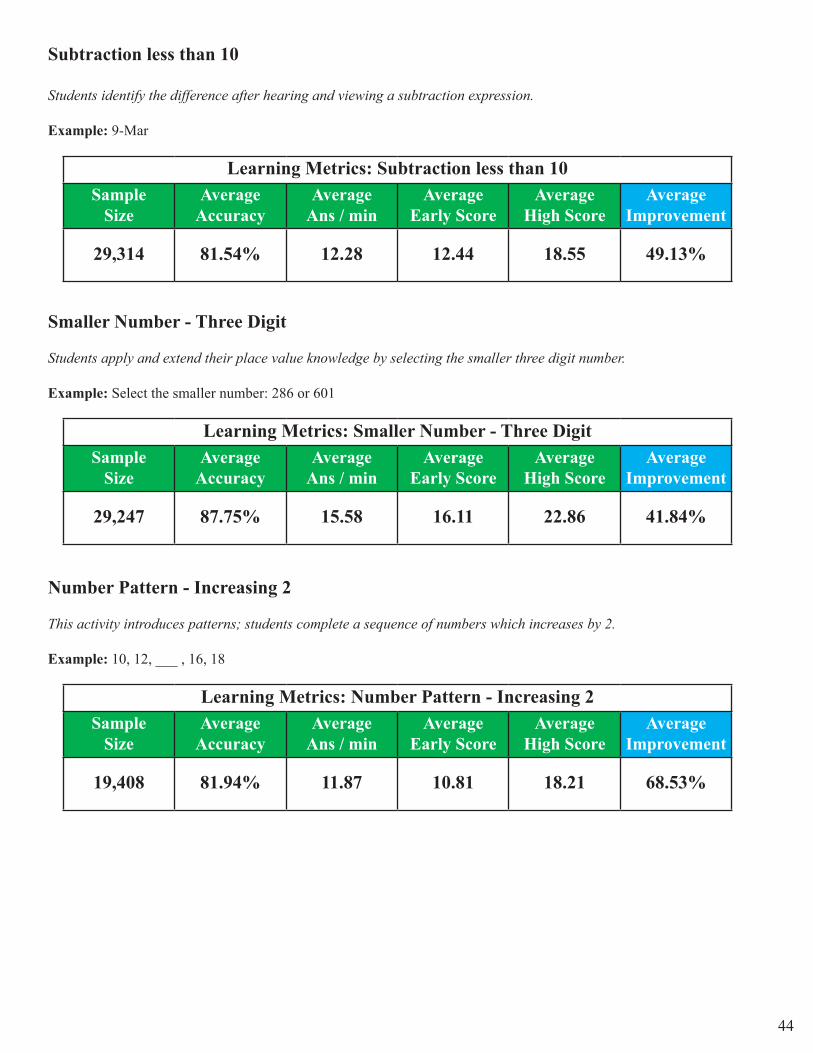
Subtraction less than 10
Students identify the difference after hearing and viewing a subtraction expression.
Example: 9-Mar
Learning Metrics: Subtraction less than 10Sample
SizeAverage
AccuracyAverage
Ans / minAverage
Early ScoreAverage
High ScoreAverage
Improvement
29,314 81.54% 12.28 12.44 18.55 49.13%
Smaller Number - Three Digit
Students apply and extend their place value knowledge by selecting the smaller three digit number.
Example: Select the smaller number: 286 or 601
Learning Metrics: Smaller Number - Three DigitSample
SizeAverage
AccuracyAverage
Ans / minAverage
Early ScoreAverage
High ScoreAverage
Improvement
29,247 87.75% 15.58 16.11 22.86 41.84%
Number Pattern - Increasing 2
This activity introduces patterns; students complete a sequence of numbers which increases by 2.
Example: 10, 12, ___ , 16, 18
Learning Metrics: Number Pattern - Increasing 2Sample
SizeAverage
AccuracyAverage
Ans / minAverage
Early ScoreAverage
High ScoreAverage
Improvement
19,408 81.94% 11.87 10.81 18.21 68.53%
45
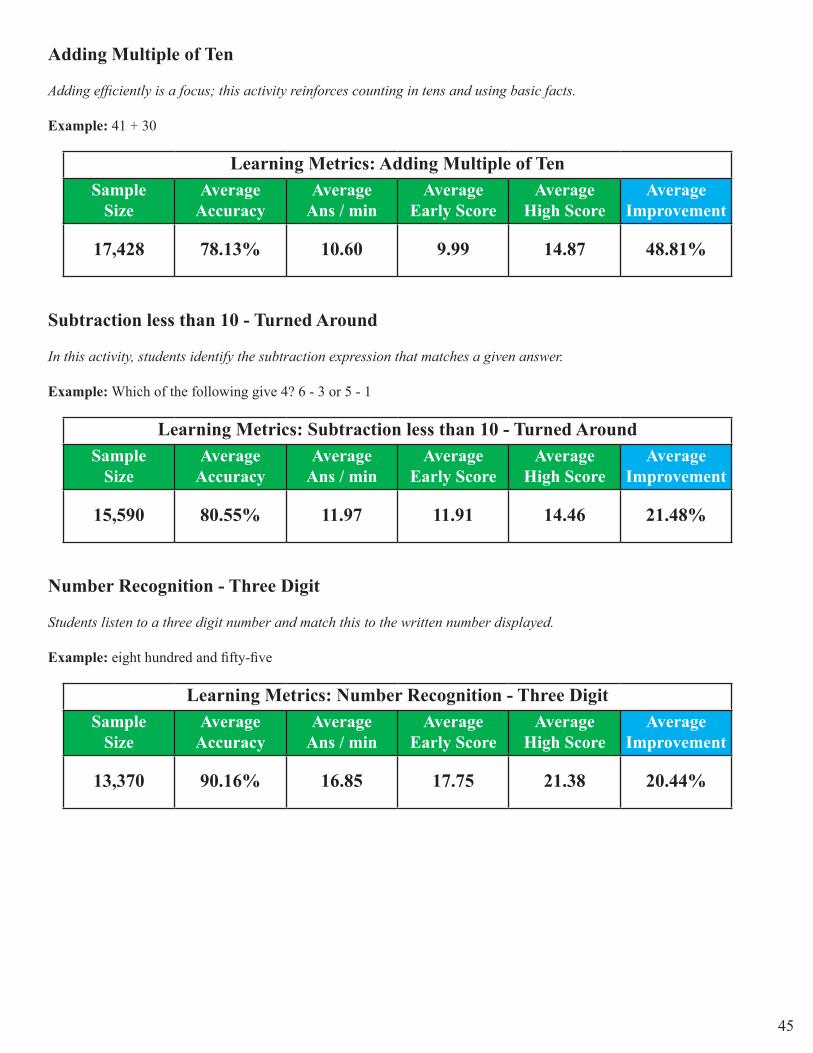
Adding Multiple of Ten
Adding efficiently is a focus; this activity reinforces counting in tens and using basic facts.
Example: 41 + 30
Learning Metrics: Adding Multiple of TenSample
SizeAverage
AccuracyAverage
Ans / minAverage
Early ScoreAverage
High ScoreAverage
Improvement
17,428 78.13% 10.60 9.99 14.87 48.81%
Subtraction less than 10 - Turned Around
In this activity, students identify the subtraction expression that matches a given answer.
Example: Which of the following give 4? 6 - 3 or 5 - 1
Learning Metrics: Subtraction less than 10 - Turned AroundSample
SizeAverage
AccuracyAverage
Ans / minAverage
Early ScoreAverage
High ScoreAverage
Improvement
15,590 80.55% 11.97 11.91 14.46 21.48%
Number Recognition - Three Digit
Students listen to a three digit number and match this to the written number displayed.
Example: eight hundred and fifty-five
Learning Metrics: Number Recognition - Three DigitSample
SizeAverage
AccuracyAverage
Ans / minAverage
Early ScoreAverage
High ScoreAverage
Improvement
13,370 90.16% 16.85 17.75 21.38 20.44%

46
Number Pattern - Decreasing 2
This activity introduces patterns; students complete a sequence of numbers which decreases by 2.
Example: 11, 9, ___ , 5, 3
Learning Metrics: Number Pattern - Decreasing 2Sample
SizeAverage
AccuracyAverage
Ans / minAverage
Early ScoreAverage
High ScoreAverage
Improvement
12,403 78.95% 11.08 10.95 18.24 66.65%
Arithmetic 1
Students are exposed to adding three addends at a time, prompting the change of order when adding.
Example: 2 + 2 + 4
Learning Metrics: Arithmetic 1Sample
SizeAverage
AccuracyAverage
Ans / minAverage
Early ScoreAverage
High ScoreAverage
Improvement
11,119 75.23% 9.51 8.42 13.09 55.52%
Two Digit + One Digit Without Carry
Students apply a combination of place value knowledge and basic facts to add above 20.
Example: 21 + 3
Learning Metrics: Two Digit + One Digit Without CarrySample
SizeAverage
AccuracyAverage
Ans / minAverage
Early ScoreAverage
High ScoreAverage
Improvement
13,428 83.45% 12.71 11.86 16.46 38.78%
47
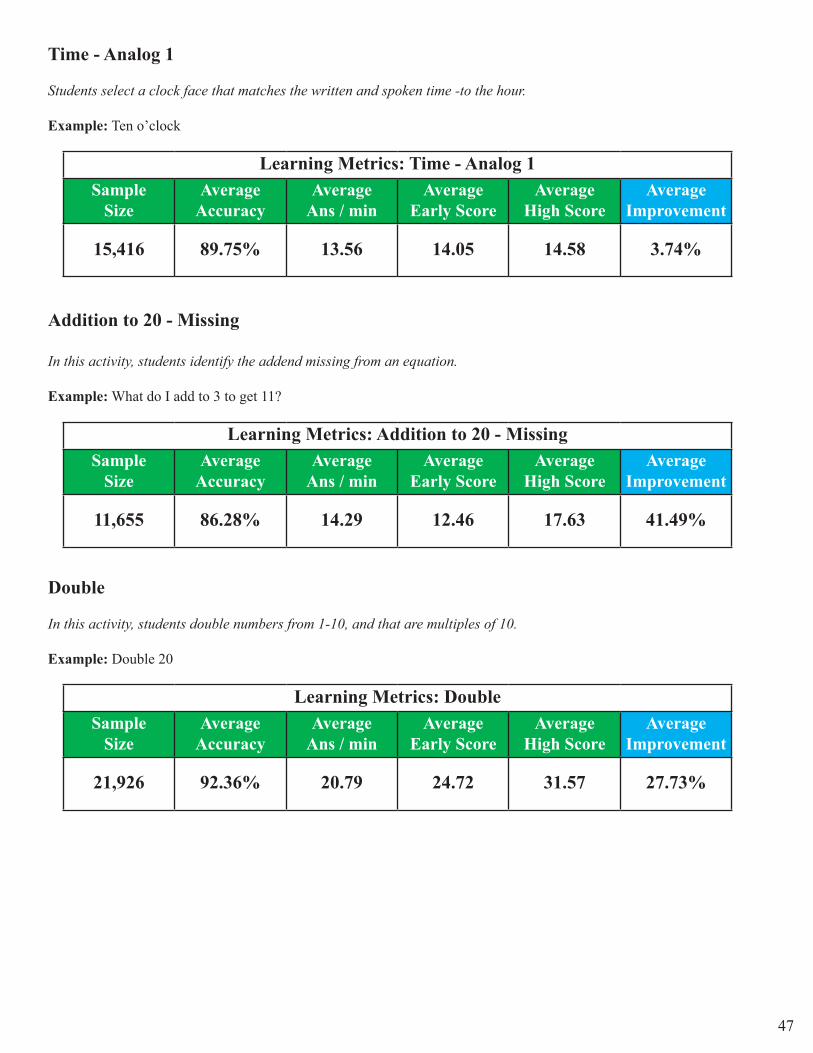
Time - Analog 1
Students select a clock face that matches the written and spoken time -to the hour.
Example: Ten o’clock
Learning Metrics: Time - Analog 1Sample
SizeAverage
AccuracyAverage
Ans / minAverage
Early ScoreAverage
High ScoreAverage
Improvement
15,416 89.75% 13.56 14.05 14.58 3.74%
Addition to 20 - Missing
In this activity, students identify the addend missing from an equation.
Example: What do I add to 3 to get 11?
Learning Metrics: Addition to 20 - MissingSample
SizeAverage
AccuracyAverage
Ans / minAverage
Early ScoreAverage
High ScoreAverage
Improvement
11,655 86.28% 14.29 12.46 17.63 41.49%
Double
In this activity, students double numbers from 1-10, and that are multiples of 10.
Example: Double 20
Learning Metrics: DoubleSample
SizeAverage
AccuracyAverage
Ans / minAverage
Early ScoreAverage
High ScoreAverage
Improvement
21,926 92.36% 20.79 24.72 31.57 27.73%
48
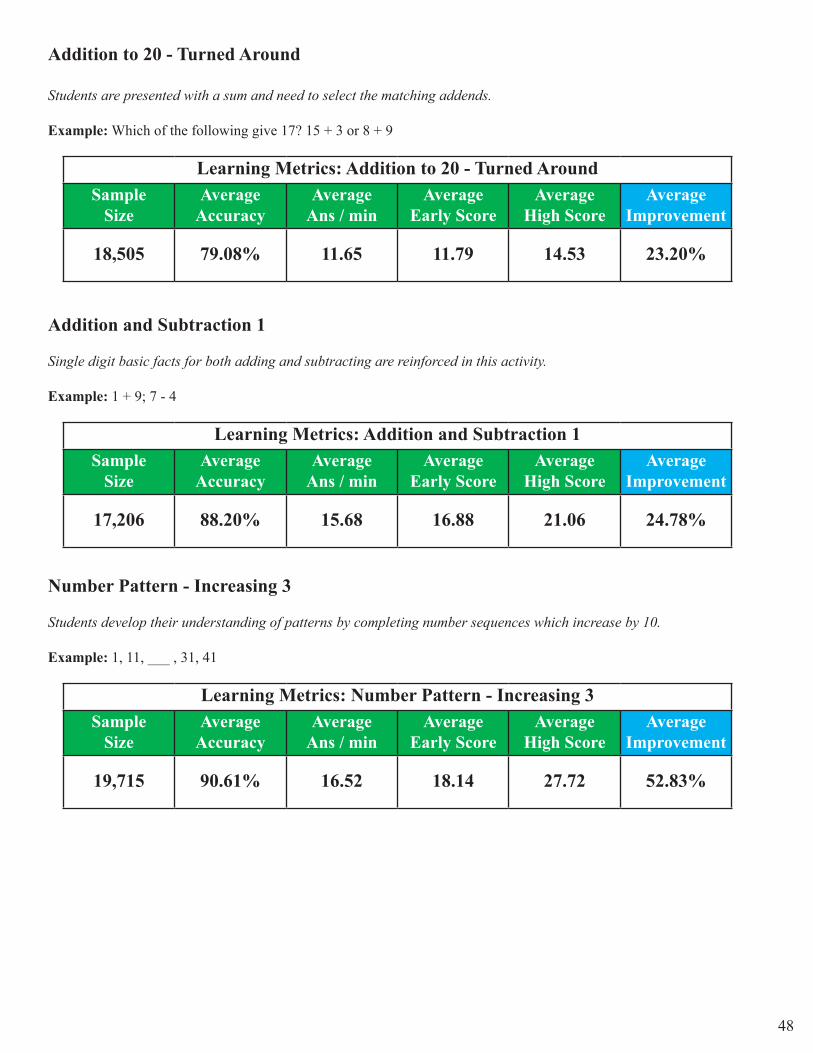
Addition to 20 - Turned Around
Students are presented with a sum and need to select the matching addends.
Example: Which of the following give 17? 15 + 3 or 8 + 9
Learning Metrics: Addition to 20 - Turned AroundSample
SizeAverage
AccuracyAverage
Ans / minAverage
Early ScoreAverage
High ScoreAverage
Improvement
18,505 79.08% 11.65 11.79 14.53 23.20%
Addition and Subtraction 1
Single digit basic facts for both adding and subtracting are reinforced in this activity.
Example: 1 + 9; 7 - 4
Learning Metrics: Addition and Subtraction 1Sample
SizeAverage
AccuracyAverage
Ans / minAverage
Early ScoreAverage
High ScoreAverage
Improvement
17,206 88.20% 15.68 16.88 21.06 24.78%
Number Pattern - Increasing 3
Students develop their understanding of patterns by completing number sequences which increase by 10.
Example: 1, 11, ___ , 31, 41
Learning Metrics: Number Pattern - Increasing 3Sample
SizeAverage
AccuracyAverage
Ans / minAverage
Early ScoreAverage
High ScoreAverage
Improvement
19,715 90.61% 16.52 18.14 27.72 52.83%
49
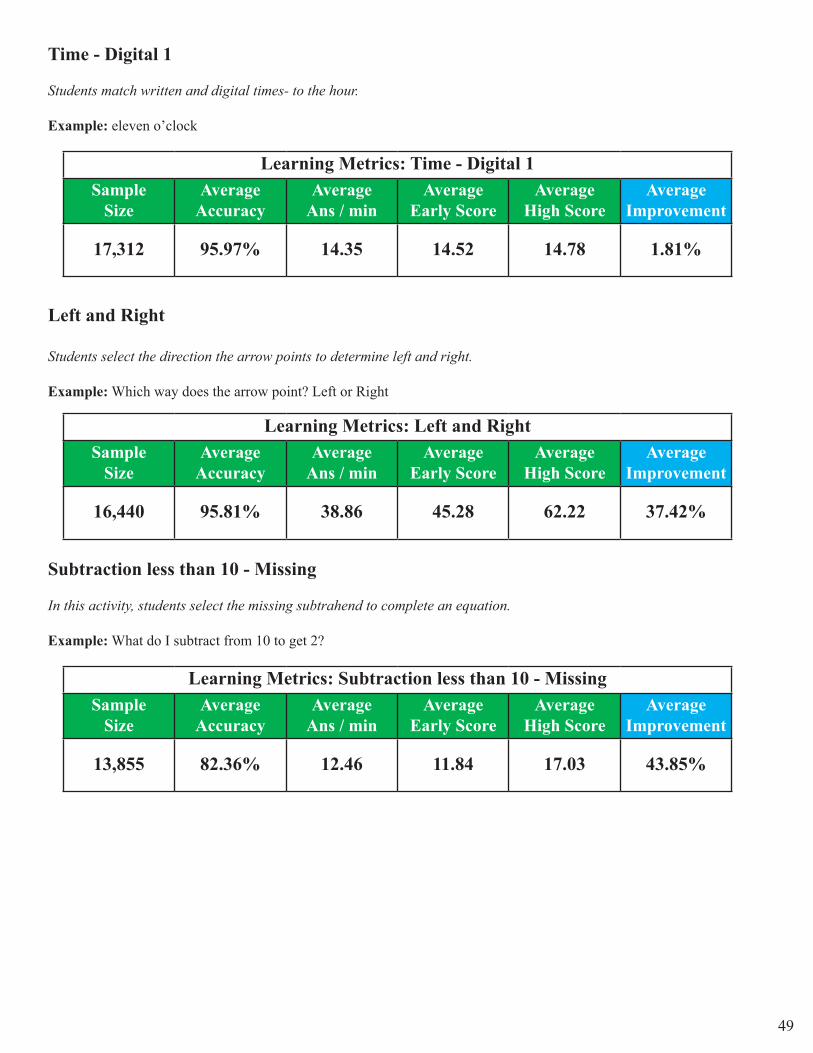
Time - Digital 1
Students match written and digital times- to the hour.
Example: eleven o’clock
Learning Metrics: Time - Digital 1Sample
SizeAverage
AccuracyAverage
Ans / minAverage
Early ScoreAverage
High ScoreAverage
Improvement
17,312 95.97% 14.35 14.52 14.78 1.81%
Left and Right
Students select the direction the arrow points to determine left and right.
Example: Which way does the arrow point? Left or Right
Learning Metrics: Left and RightSample
SizeAverage
AccuracyAverage
Ans / minAverage
Early ScoreAverage
High ScoreAverage
Improvement
16,440 95.81% 38.86 45.28 62.22 37.42%
Subtraction less than 10 - Missing
In this activity, students select the missing subtrahend to complete an equation.
Example: What do I subtract from 10 to get 2?
Learning Metrics: Subtraction less than 10 - MissingSample
SizeAverage
AccuracyAverage
Ans / minAverage
Early ScoreAverage
High ScoreAverage
Improvement
13,855 82.36% 12.46 11.84 17.03 43.85%
50
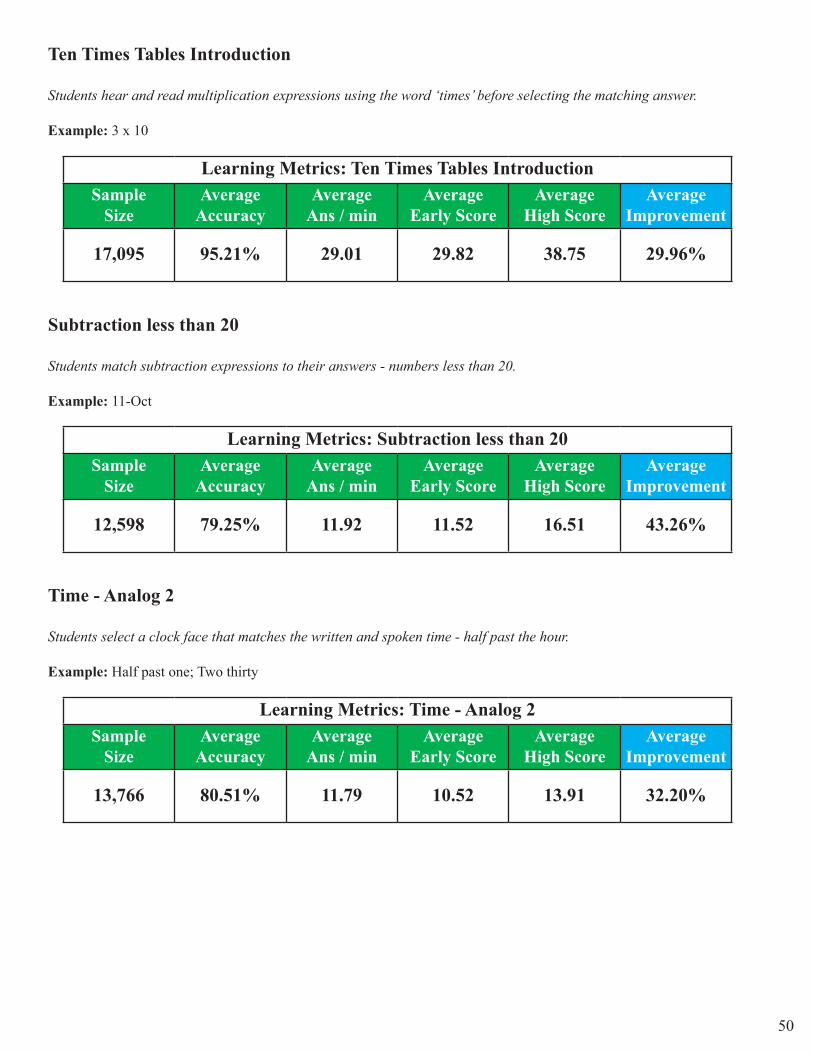
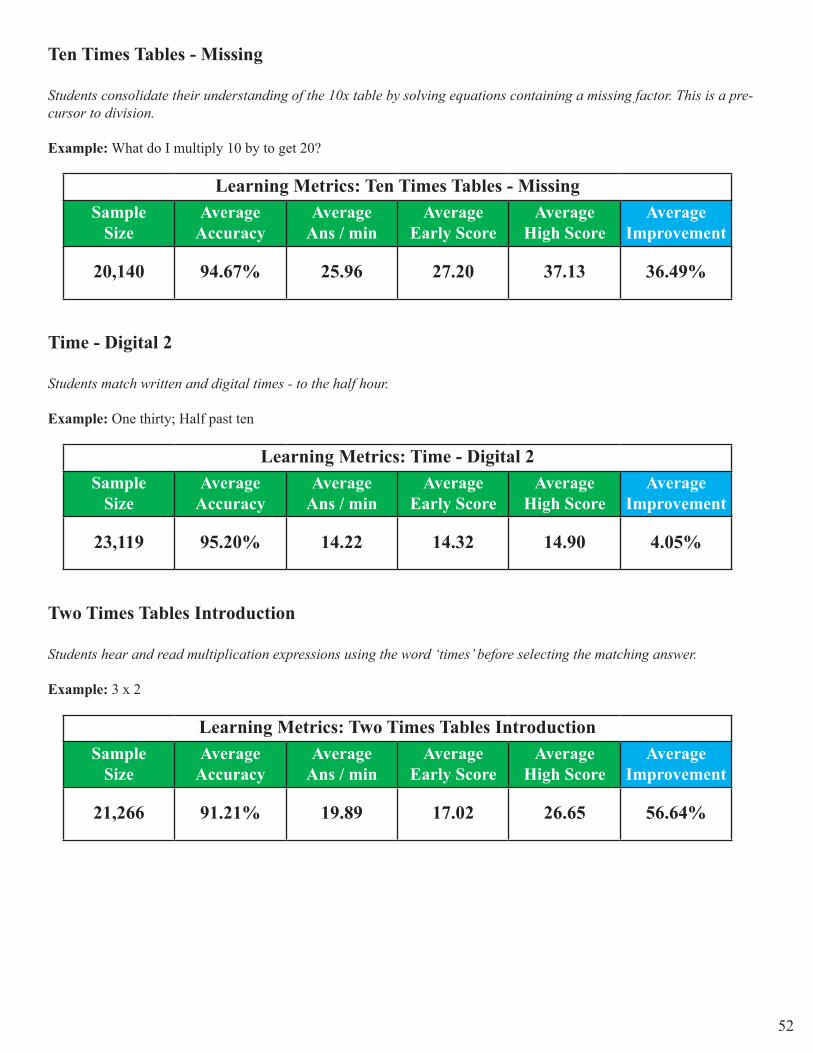
Ten Times Tables Introduction
Students hear and read multiplication expressions using the word ‘times’ before selecting the matching answer.
Example: 3 x 10
Learning Metrics: Ten Times Tables IntroductionSample
SizeAverage
AccuracyAverage
Ans / minAverage
Early ScoreAverage
High ScoreAverage
Improvement
17,095 95.21% 29.01 29.82 38.75 29.96%
Subtraction less than 20
Students match subtraction expressions to their answers - numbers less than 20.
Example: 11-Oct
Learning Metrics: Subtraction less than 20Sample
SizeAverage
AccuracyAverage
Ans / minAverage
Early ScoreAverage
High ScoreAverage
Improvement
12,598 79.25% 11.92 11.52 16.51 43.26%
Time - Analog 2
Students select a clock face that matches the written and spoken time - half past the hour.
Example: Half past one; Two thirty
Learning Metrics: Time - Analog 2Sample
SizeAverage
AccuracyAverage
Ans / minAverage
Early ScoreAverage
High ScoreAverage
Improvement
13,766 80.51% 11.79 10.52 13.91 32.20%

51
Two Digit + One Digit With Carry
In this activity, students hear and view two digit + one digit with carry expressions and select the matching answers.
Example: 21 + 9
Learning Metrics: Two Digit + One Digit With CarrySample
SizeAverage
AccuracyAverage
Ans / minAverage
Early ScoreAverage
High ScoreAverage
Improvement
12,828 76.20% 10.58 9.88 13.98 41.47%
Ten Times Tables
Students find the matching products for 10x table expressions. (“4 tens are..”) (4x10)
Example: 10 x 10
Learning Metrics: Ten Times TablesSample
SizeAverage
AccuracyAverage
Ans / minAverage
Early ScoreAverage
High ScoreAverage
Improvement
17,047 96.18% 29.63 33.89 40.67 20.02%
Number Pattern - Decreasing 3
Students develop their understanding of patterns by completing number sequences which decreases by 10.
Example: 41, 31, ___ , 11, 1
Learning Metrics: Number Pattern - Decreasing 3Sample
SizeAverage
AccuracyAverage
Ans / minAverage
Early ScoreAverage
High ScoreAverage
Improvement
14,108 92.47% 18.49 18.25 26.28 44.00%
52
Ten Times Tables - Missing
Students consolidate their understanding of the 10x table by solving equations containing a missing factor. This is a pre-cursor to division.
Example: What do I multiply 10 by to get 20?
Learning Metrics: Ten Times Tables - MissingSample
SizeAverage
AccuracyAverage
Ans / minAverage
Early ScoreAverage
High ScoreAverage
Improvement
20,140 94.67% 25.96 27.20 37.13 36.49%
Time - Digital 2
Students match written and digital times - to the half hour.
Example: One thirty; Half past ten
Learning Metrics: Time - Digital 2Sample
SizeAverage
AccuracyAverage
Ans / minAverage
Early ScoreAverage
High ScoreAverage
Improvement
23,119 95.20% 14.22 14.32 14.90 4.05%
Two Times Tables Introduction
Students hear and read multiplication expressions using the word ‘times’ before selecting the matching answer.
Example: 3 x 2
Learning Metrics: Two Times Tables IntroductionSample
SizeAverage
AccuracyAverage
Ans / minAverage
Early ScoreAverage
High ScoreAverage
Improvement
21,266 91.21% 19.89 17.02 26.65 56.64%
53
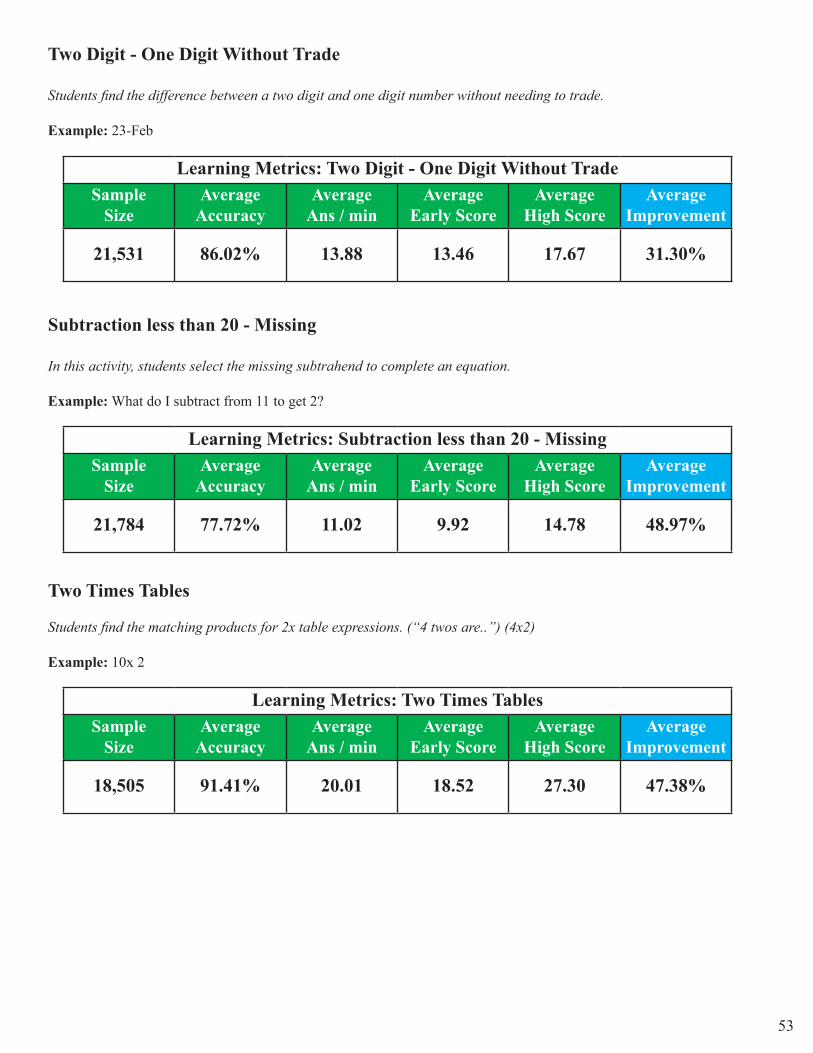
Two Digit - One Digit Without Trade
Students find the difference between a two digit and one digit number without needing to trade.
Example: 23-Feb
Learning Metrics: Two Digit - One Digit Without TradeSample
SizeAverage
AccuracyAverage
Ans / minAverage
Early ScoreAverage
High ScoreAverage
Improvement
21,531 86.02% 13.88 13.46 17.67 31.30%
Subtraction less than 20 - Missing
In this activity, students select the missing subtrahend to complete an equation.
Example: What do I subtract from 11 to get 2?
Learning Metrics: Subtraction less than 20 - MissingSample
SizeAverage
AccuracyAverage
Ans / minAverage
Early ScoreAverage
High ScoreAverage
Improvement
21,784 77.72% 11.02 9.92 14.78 48.97%
Two Times Tables
Students find the matching products for 2x table expressions. (“4 twos are..”) (4x2)
Example: 10x 2
Learning Metrics: Two Times TablesSample
SizeAverage
AccuracyAverage
Ans / minAverage
Early ScoreAverage
High ScoreAverage
Improvement
18,505 91.41% 20.01 18.52 27.30 47.38%

54
Ten Times Tables - Turned Around
In this activity, students read the product and identify the expression that matches.
Example: Which of the following give 30? 3 x 10 or 10 x 10
Learning Metrics: Ten Times Tables - Turned AroundSample
SizeAverage
AccuracyAverage
Ans / minAverage
Early ScoreAverage
High ScoreAverage
Improvement
19,452 95.97% 14.36 14.49 14.83 2.35%
Divide by Ten
Students apply 10x tables knowledge to answer division questions.
Example: 30 ÷ 10
Learning Metrics: Divide by TenSample
SizeAverage
AccuracyAverage
Ans / minAverage
Early ScoreAverage
High ScoreAverage
Improvement
18,388 95.97% 29.06 29.29 37.86 29.23%
Five Times Tables Introduction
Students hear and read multiplication expressions using the word ‘times’ before selecting the matching answer. Questions are asked in sequence.
Example: 3 x 5
Learning Metrics: Five Times Tables IntroductionSample
SizeAverage
AccuracyAverage
Ans / minAverage
Early ScoreAverage
High ScoreAverage
Improvement
16,057 89.89% 19.93 17.39 27.97 60.81%
55
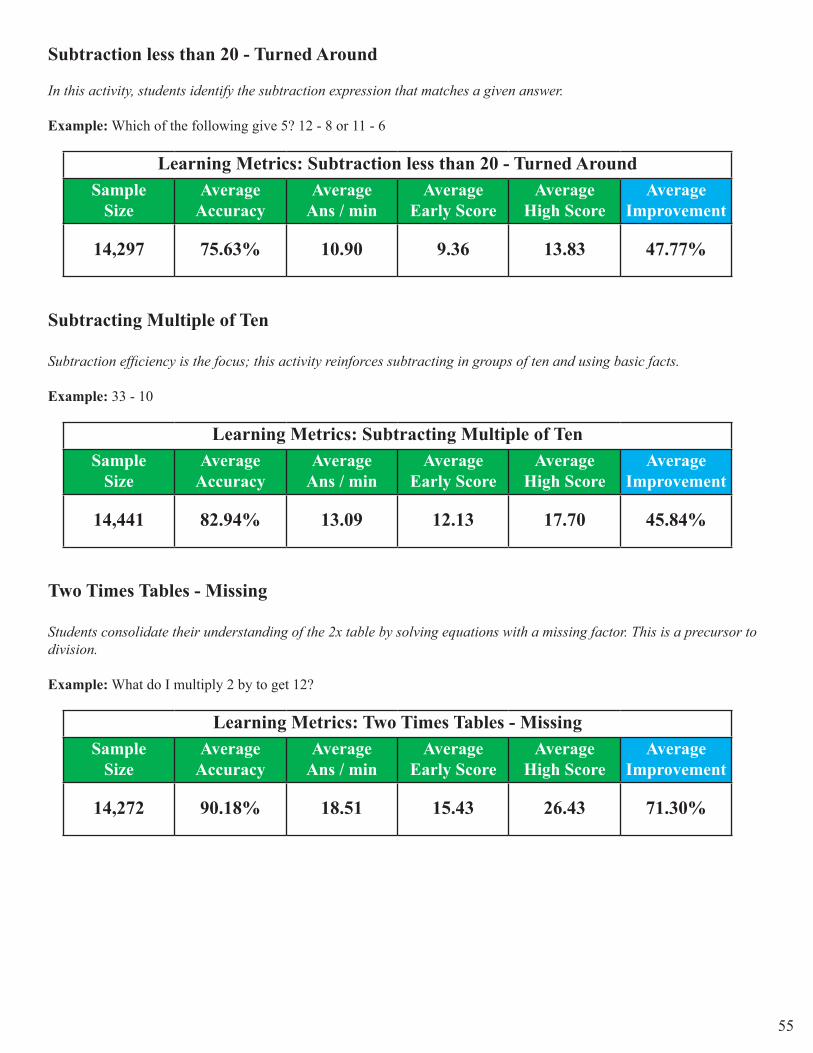
Subtraction less than 20 - Turned Around
In this activity, students identify the subtraction expression that matches a given answer.
Example: Which of the following give 5? 12 - 8 or 11 - 6
Learning Metrics: Subtraction less than 20 - Turned AroundSample
SizeAverage
AccuracyAverage
Ans / minAverage
Early ScoreAverage
High ScoreAverage
Improvement
14,297 75.63% 10.90 9.36 13.83 47.77%
Subtracting Multiple of Ten
Subtraction efficiency is the focus; this activity reinforces subtracting in groups of ten and using basic facts.
Example: 33 - 10
Learning Metrics: Subtracting Multiple of TenSample
SizeAverage
AccuracyAverage
Ans / minAverage
Early ScoreAverage
High ScoreAverage
Improvement
14,441 82.94% 13.09 12.13 17.70 45.84%
Two Times Tables - Missing
Students consolidate their understanding of the 2x table by solving equations with a missing factor. This is a precursor to division.
Example: What do I multiply 2 by to get 12?
Learning Metrics: Two Times Tables - MissingSample
SizeAverage
AccuracyAverage
Ans / minAverage
Early ScoreAverage
High ScoreAverage
Improvement
14,272 90.18% 18.51 15.43 26.43 71.30%
56
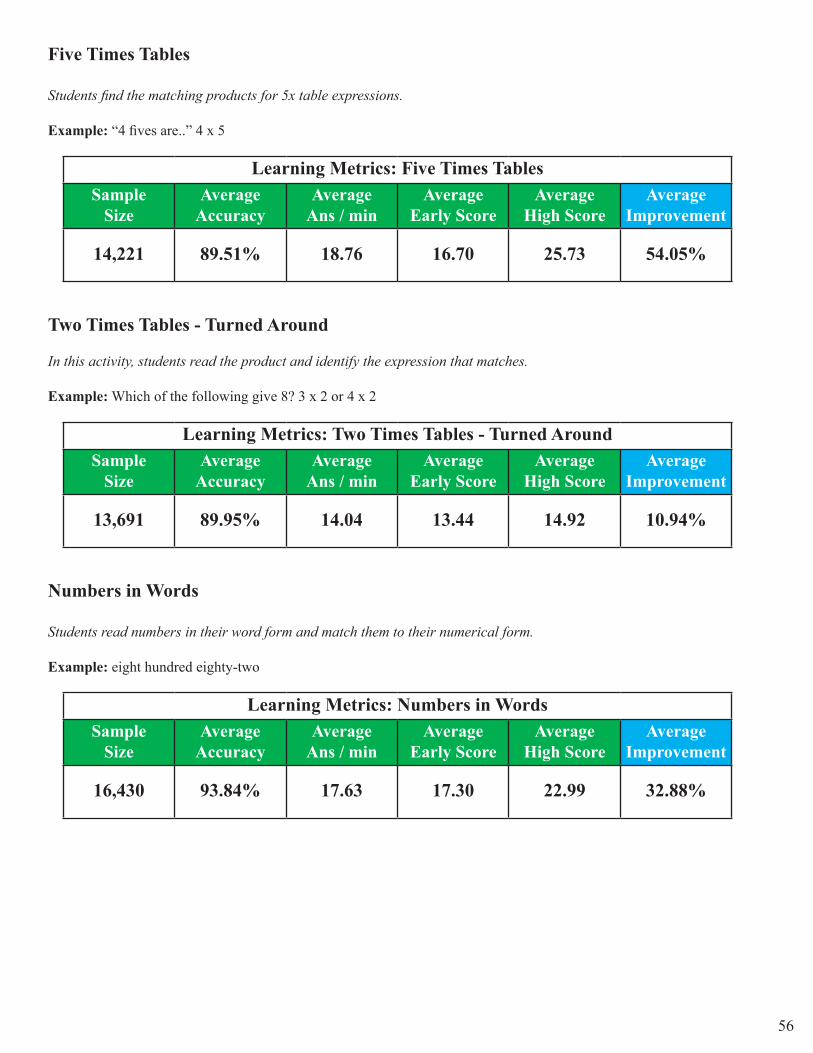
Five Times Tables
Students find the matching products for 5x table expressions.
Example: “4 fives are..” 4 x 5
Learning Metrics: Five Times TablesSample
SizeAverage
AccuracyAverage
Ans / minAverage
Early ScoreAverage
High ScoreAverage
Improvement
14,221 89.51% 18.76 16.70 25.73 54.05%
Two Times Tables - Turned Around
In this activity, students read the product and identify the expression that matches.
Example: Which of the following give 8? 3 x 2 or 4 x 2
Learning Metrics: Two Times Tables - Turned AroundSample
SizeAverage
AccuracyAverage
Ans / minAverage
Early ScoreAverage
High ScoreAverage
Improvement
13,691 89.95% 14.04 13.44 14.92 10.94%
Numbers in Words
Students read numbers in their word form and match them to their numerical form.
Example: eight hundred eighty-two
Learning Metrics: Numbers in WordsSample
SizeAverage
AccuracyAverage
Ans / minAverage
Early ScoreAverage
High ScoreAverage
Improvement
16,430 93.84% 17.63 17.30 22.99 32.88%

57
Halve
Students apply 2x table and number knowledge to halve numbers.
Example: Half of 12
Learning Metrics: HalveSample
SizeAverage
AccuracyAverage
Ans / minAverage
Early ScoreAverage
High ScoreAverage
Improvement
16,433 94.49% 24.76 23.92 31.03 29.70%
Five Times Tables - Turned Around
In this activity, students read the product and identify the expression that matches.
Example: Which of the following give 35? 7 x 5 or 9 x 5
Learning Metrics: Five Times Tables - Turned AroundSample
SizeAverage
AccuracyAverage
Ans / minAverage
Early ScoreAverage
High ScoreAverage
Improvement
16,134 84.83% 13.08 11.63 14.74 26.74%
Two Digit - One Digit With Trade
Students extend their skills by subtracting from two digit numbers where trade is required.
Example: 31 - 4
Learning Metrics: Two Digit - One Digit With TradeSample
SizeAverage
AccuracyAverage
Ans / minAverage
Early ScoreAverage
High ScoreAverage
Improvement
15,975 80.91% 12.42 11.27 16.54 46.80%

58
Five Times Tables - Missing
Students consolidate their understanding of the 5x tables by solving equations with a missing factor. This is a precursor to division.
Example: What do I multiply 5 by to get 20?
Learning Metrics: Five Times Tables - MissingSample
SizeAverage
AccuracyAverage
Ans / minAverage
Early ScoreAverage
High ScoreAverage
Improvement
14,118 89.60% 18.27 16.54 25.83 56.20%
Eleven Times Tables Introduction
Students hear and read multiplication expressions using the word ‘times’ before selecting the matching answer. Questions are asked in sequence.
Example: “4 elevens are...” 4 x 11
Learning Metrics: Eleven Times Tables IntroductionSample
SizeAverage
AccuracyAverage
Ans / minAverage
Early ScoreAverage
High ScoreAverage
Improvement
14,517 96.17% 31.07 31.03 40.68 31.11%
Divide by Two
In this activity, students apply basic facts and number knowledge to answer ‘divide by two’ questions.
Example: 6 ÷ 2
Learning Metrics: Divide by TwoSample
SizeAverage
AccuracyAverage
Ans / minAverage
Early ScoreAverage
High ScoreAverage
Improvement
12,920 93.24% 22.00 21.34 29.75 39.43%
59
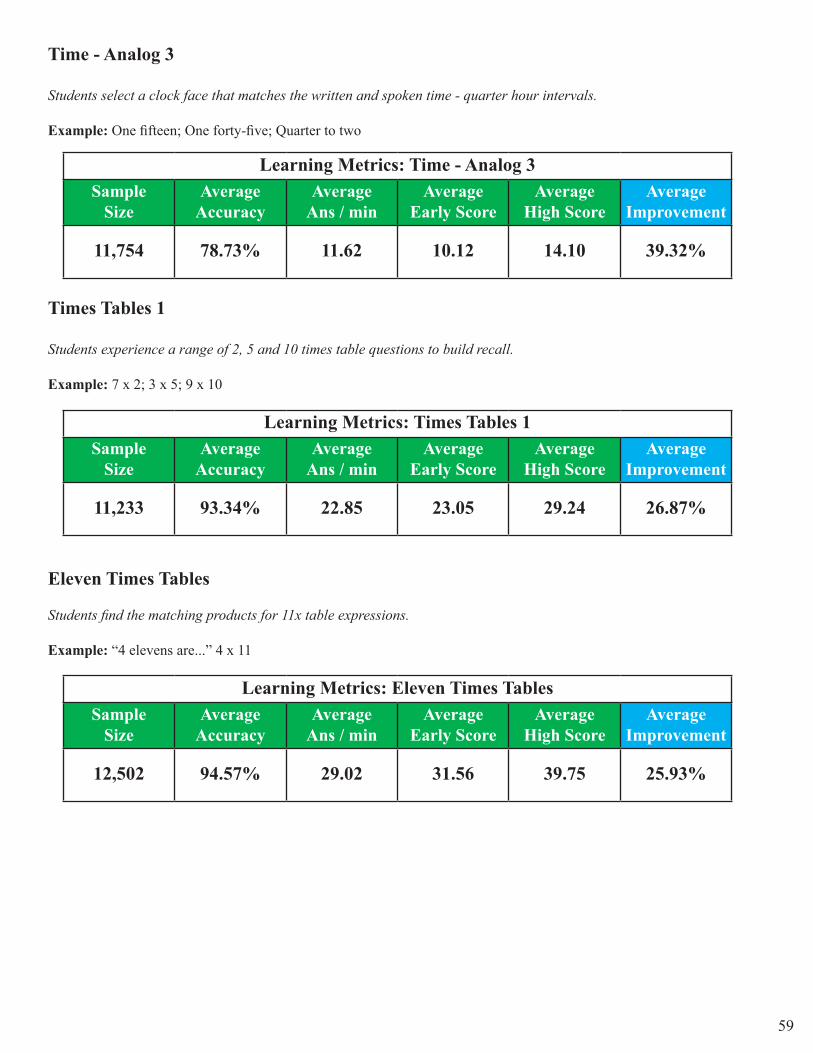
Time - Analog 3
Students select a clock face that matches the written and spoken time - quarter hour intervals.
Example: One fifteen; One forty-five; Quarter to two
Learning Metrics: Time - Analog 3Sample
SizeAverage
AccuracyAverage
Ans / minAverage
Early ScoreAverage
High ScoreAverage
Improvement
11,754 78.73% 11.62 10.12 14.10 39.32%
Times Tables 1
Students experience a range of 2, 5 and 10 times table questions to build recall.
Example: 7 x 2; 3 x 5; 9 x 10
Learning Metrics: Times Tables 1Sample
SizeAverage
AccuracyAverage
Ans / minAverage
Early ScoreAverage
High ScoreAverage
Improvement
11,233 93.34% 22.85 23.05 29.24 26.87%
Eleven Times Tables
Students find the matching products for 11x table expressions.
Example: “4 elevens are...” 4 x 11
Learning Metrics: Eleven Times TablesSample
SizeAverage
AccuracyAverage
Ans / minAverage
Early ScoreAverage
High ScoreAverage
Improvement
12,502 94.57% 29.02 31.56 39.75 25.93%
60
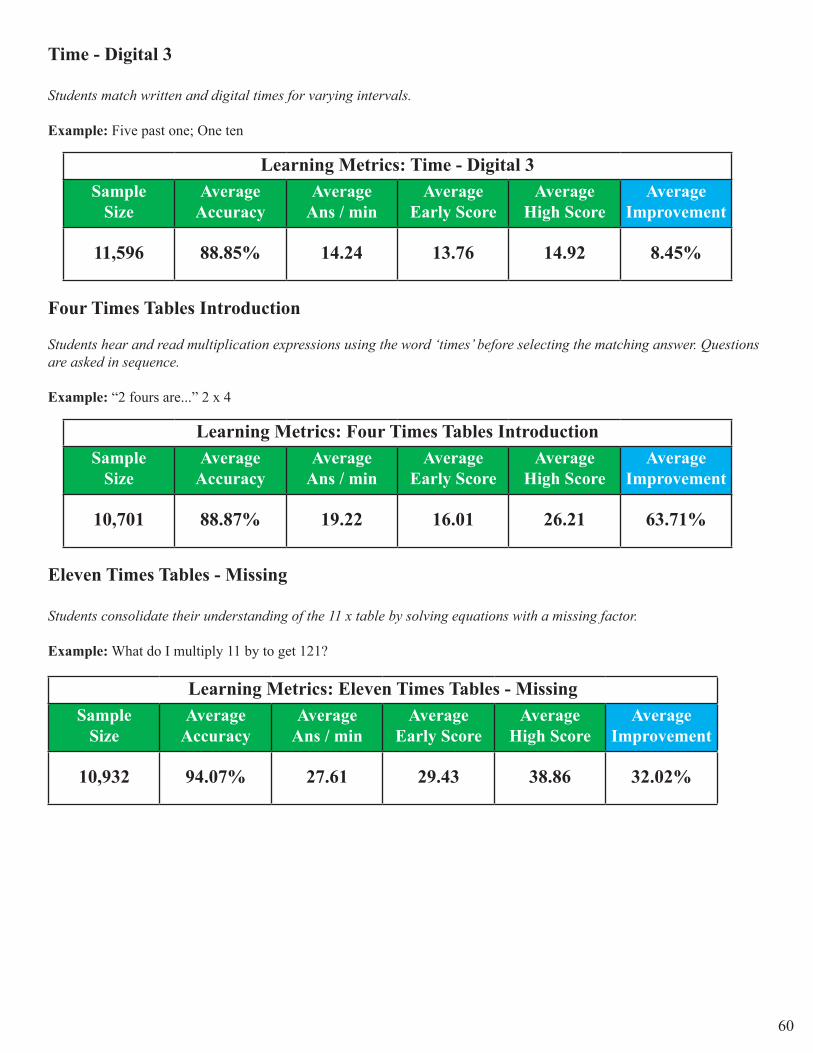
Time - Digital 3
Students match written and digital times for varying intervals.
Example: Five past one; One ten
Learning Metrics: Time - Digital 3Sample
SizeAverage
AccuracyAverage
Ans / minAverage
Early ScoreAverage
High ScoreAverage
Improvement
11,596 88.85% 14.24 13.76 14.92 8.45%
Four Times Tables Introduction
Students hear and read multiplication expressions using the word ‘times’ before selecting the matching answer. Questions are asked in sequence.
Example: “2 fours are...” 2 x 4
Learning Metrics: Four Times Tables IntroductionSample
SizeAverage
AccuracyAverage
Ans / minAverage
Early ScoreAverage
High ScoreAverage
Improvement
10,701 88.87% 19.22 16.01 26.21 63.71%
Eleven Times Tables - Missing
Students consolidate their understanding of the 11 x table by solving equations with a missing factor.
Example: What do I multiply 11 by to get 121?
Learning Metrics: Eleven Times Tables - MissingSample
SizeAverage
AccuracyAverage
Ans / minAverage
Early ScoreAverage
High ScoreAverage
Improvement
10,932 94.07% 27.61 29.43 38.86 32.02%

61
Divide by Five
In this activity, students apply basic facts and number knowledge to answer ‘divide by five’ questions.
Example: 15 ÷ 5
Learning Metrics: Divide by FiveSample
SizeAverage
AccuracyAverage
Ans / minAverage
Early ScoreAverage
High ScoreAverage
Improvement
11,978 88.51% 18.22 16.85 25.91 53.79%
Eleven Times Tables - Turned Around
In this activity, students read the product and identify the expression that matches.
Example: Which of the following give 66? 6 x11 or 3 x 11
Learning Metrics: Eleven Times Tables - Turned AroundSample
SizeAverage
AccuracyAverage
Ans / minAverage
Early ScoreAverage
High ScoreAverage
Improvement
13,101 92.18% 14.63 14.34 14.87 3.66%
Four Times Tables
Students find the matching products for 4x table expressions. (“3 fours are..”) (3x4)
Example: 11 x 4
Learning Metrics: Four Times TablesSample
SizeAverage
AccuracyAverage
Ans / minAverage
Early ScoreAverage
High ScoreAverage
Improvement
12,156 87.12% 17.51 13.93 23.75 70.43%
62
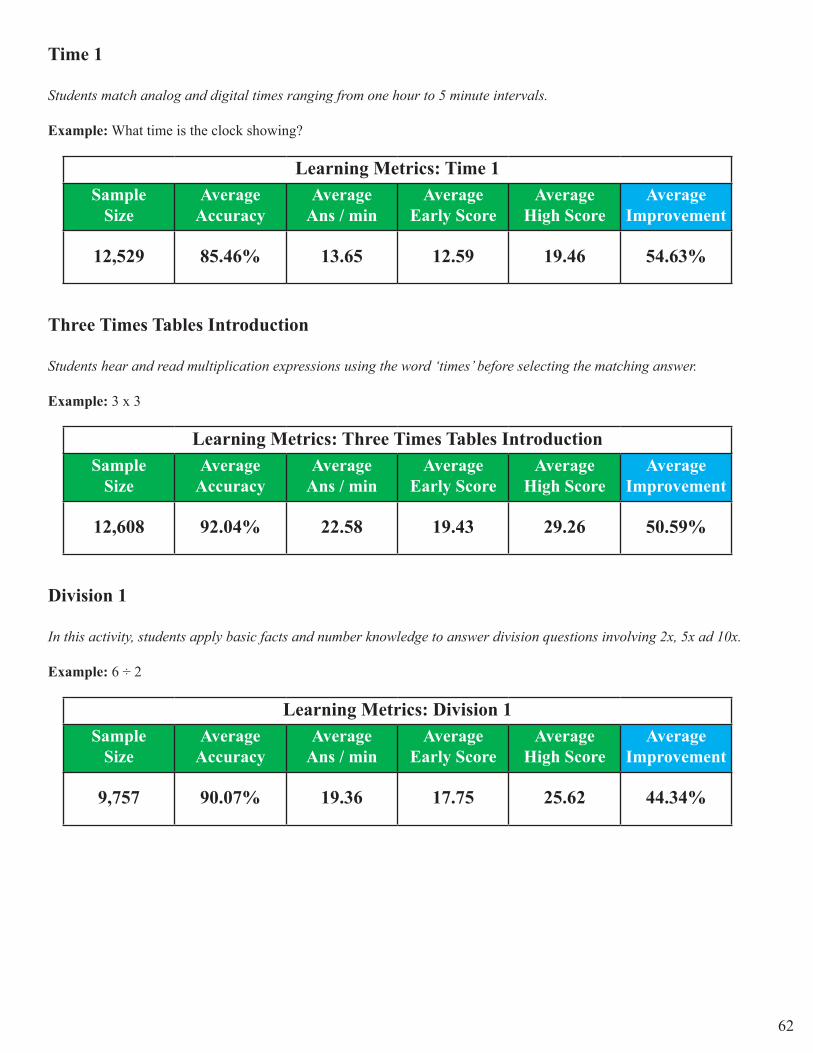
Time 1
Students match analog and digital times ranging from one hour to 5 minute intervals.
Example: What time is the clock showing?
Learning Metrics: Time 1Sample
SizeAverage
AccuracyAverage
Ans / minAverage
Early ScoreAverage
High ScoreAverage
Improvement
12,529 85.46% 13.65 12.59 19.46 54.63%
Three Times Tables Introduction
Students hear and read multiplication expressions using the word ‘times’ before selecting the matching answer.
Example: 3 x 3
Learning Metrics: Three Times Tables IntroductionSample
SizeAverage
AccuracyAverage
Ans / minAverage
Early ScoreAverage
High ScoreAverage
Improvement
12,608 92.04% 22.58 19.43 29.26 50.59%
Division 1
In this activity, students apply basic facts and number knowledge to answer division questions involving 2x, 5x ad 10x.
Example: 6 ÷ 2
Learning Metrics: Division 1Sample
SizeAverage
AccuracyAverage
Ans / minAverage
Early ScoreAverage
High ScoreAverage
Improvement
9,757 90.07% 19.36 17.75 25.62 44.34%
63
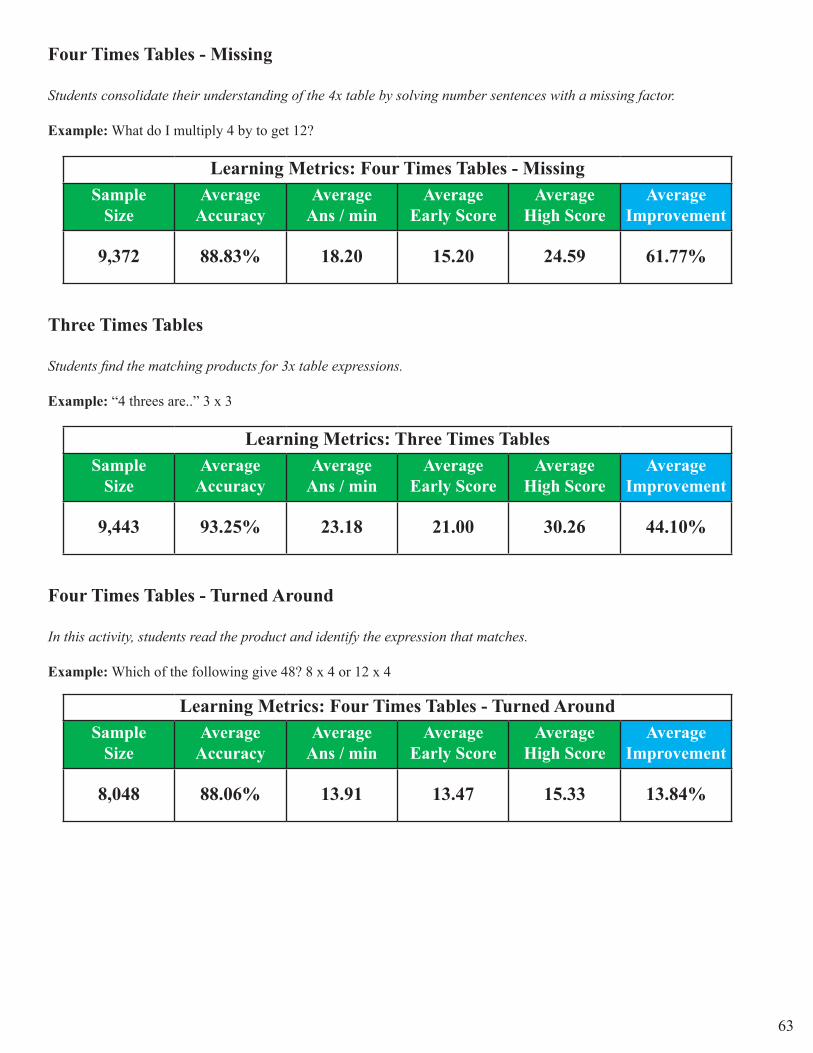
Four Times Tables - Missing
Students consolidate their understanding of the 4x table by solving number sentences with a missing factor.
Example: What do I multiply 4 by to get 12?
Learning Metrics: Four Times Tables - MissingSample
SizeAverage
AccuracyAverage
Ans / minAverage
Early ScoreAverage
High ScoreAverage
Improvement
9,372 88.83% 18.20 15.20 24.59 61.77%
Three Times Tables
Students find the matching products for 3x table expressions.
Example: “4 threes are..” 3 x 3
Learning Metrics: Three Times TablesSample
SizeAverage
AccuracyAverage
Ans / minAverage
Early ScoreAverage
High ScoreAverage
Improvement
9,443 93.25% 23.18 21.00 30.26 44.10%
Four Times Tables - Turned Around
In this activity, students read the product and identify the expression that matches.
Example: Which of the following give 48? 8 x 4 or 12 x 4
Learning Metrics: Four Times Tables - Turned AroundSample
SizeAverage
AccuracyAverage
Ans / minAverage
Early ScoreAverage
High ScoreAverage
Improvement
8,048 88.06% 13.91 13.47 15.33 13.84%
64
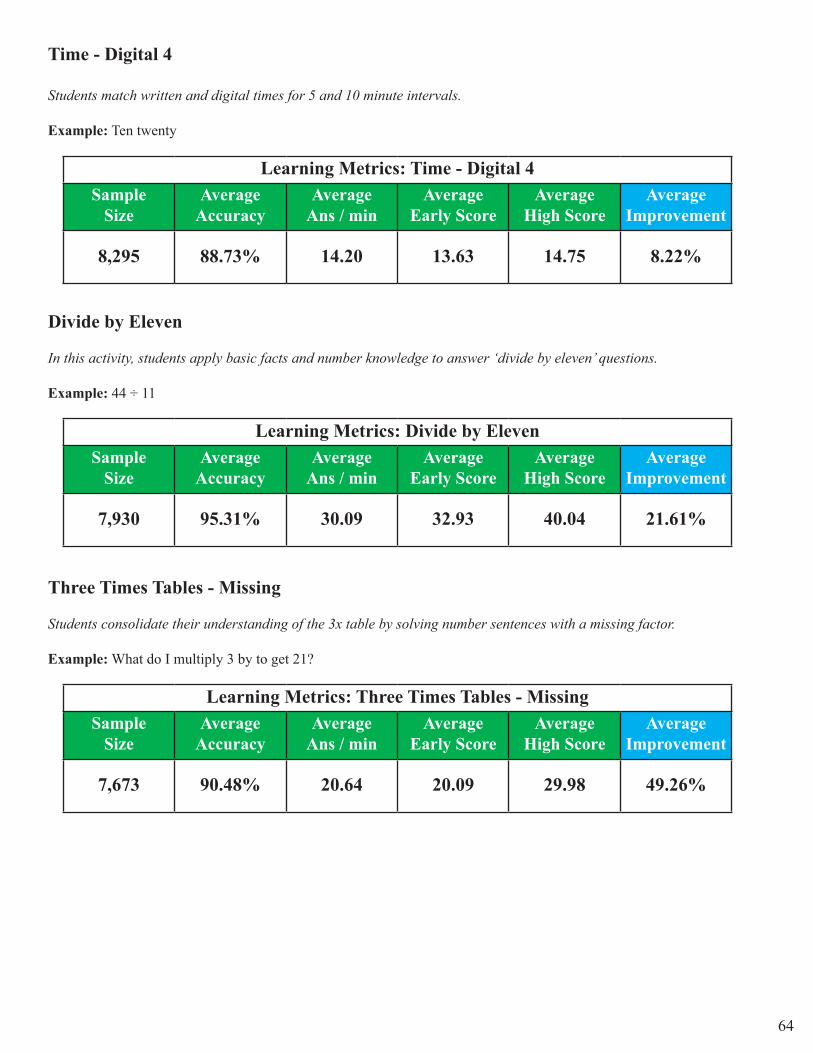
Time - Digital 4
Students match written and digital times for 5 and 10 minute intervals.
Example: Ten twenty
Learning Metrics: Time - Digital 4Sample
SizeAverage
AccuracyAverage
Ans / minAverage
Early ScoreAverage
High ScoreAverage
Improvement
8,295 88.73% 14.20 13.63 14.75 8.22%
Divide by Eleven
In this activity, students apply basic facts and number knowledge to answer ‘divide by eleven’ questions.
Example: 44 ÷ 11
Learning Metrics: Divide by ElevenSample
SizeAverage
AccuracyAverage
Ans / minAverage
Early ScoreAverage
High ScoreAverage
Improvement
7,930 95.31% 30.09 32.93 40.04 21.61%
Three Times Tables - Missing
Students consolidate their understanding of the 3x table by solving number sentences with a missing factor.
Example: What do I multiply 3 by to get 21?
Learning Metrics: Three Times Tables - MissingSample
SizeAverage
AccuracyAverage
Ans / minAverage
Early ScoreAverage
High ScoreAverage
Improvement
7,673 90.48% 20.64 20.09 29.98 49.26%

65
Three Times Tables - Turned Around
In this activity, students read the product and identify the expression that matches.
Example: Which of the following give 27? 7 x 3 or 9 x 3
Learning Metrics: Three Times Tables - Turned AroundSample
SizeAverage
AccuracyAverage
Ans / minAverage
Early ScoreAverage
High ScoreAverage
Improvement
8,094 92.03% 14.48 14.41 15.19 5.37%
Addition and Subtraction 2
Students solve a range of subtraction and addition problems involving trade and carrying.
Example: 22 + 9
Learning Metrics: Addition and Subtraction 2Sample
SizeAverage
AccuracyAverage
Ans / minAverage
Early ScoreAverage
High ScoreAverage
Improvement
7,778 83.83% 13.69 12.94 17.22 33.01%
Time - Analog 4
Students select a clock face that matches the written and spoken time - to five minute intervals
Example: Five past one
Learning Metrics: Time - Analog 4Sample
SizeAverage
AccuracyAverage
Ans / minAverage
Early ScoreAverage
High ScoreAverage
Improvement
8,211 77.52% 11.39 10.18 15.31 50.42%
66
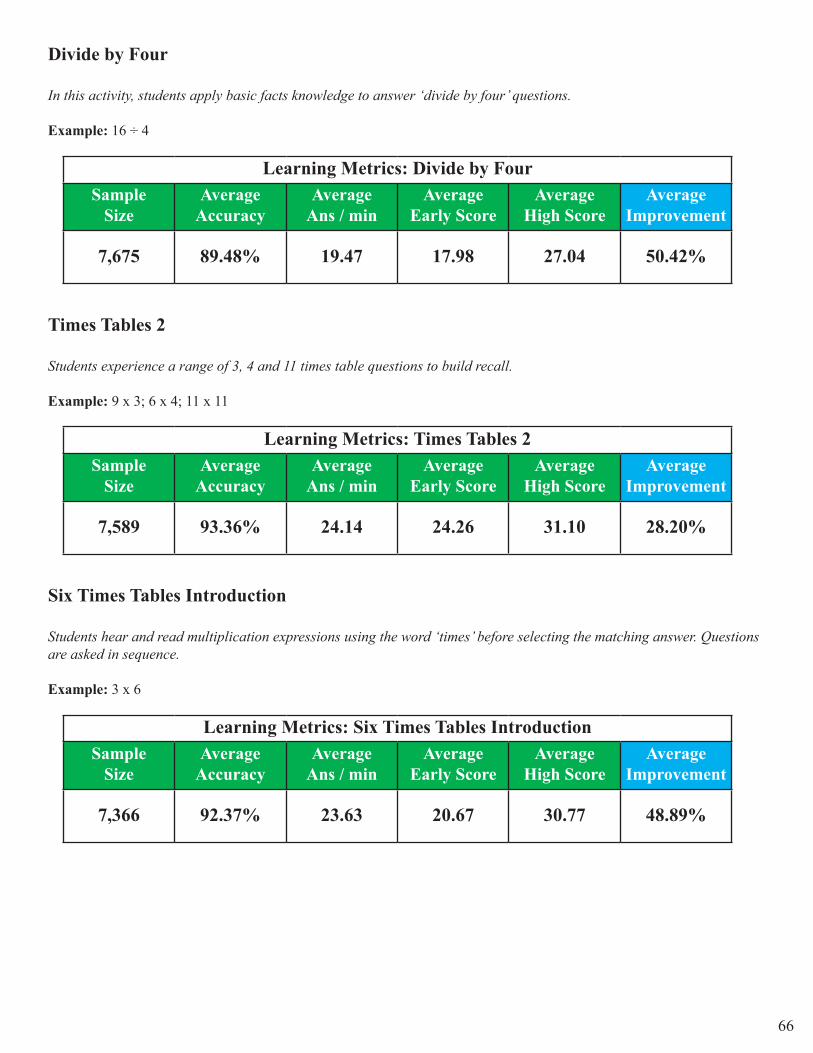
Divide by Four
In this activity, students apply basic facts knowledge to answer ‘divide by four’ questions.
Example: 16 ÷ 4
Learning Metrics: Divide by FourSample
SizeAverage
AccuracyAverage
Ans / minAverage
Early ScoreAverage
High ScoreAverage
Improvement
7,675 89.48% 19.47 17.98 27.04 50.42%
Times Tables 2
Students experience a range of 3, 4 and 11 times table questions to build recall.
Example: 9 x 3; 6 x 4; 11 x 11
Learning Metrics: Times Tables 2Sample
SizeAverage
AccuracyAverage
Ans / minAverage
Early ScoreAverage
High ScoreAverage
Improvement
7,589 93.36% 24.14 24.26 31.10 28.20%
Six Times Tables Introduction
Students hear and read multiplication expressions using the word ‘times’ before selecting the matching answer. Questions are asked in sequence.
Example: 3 x 6
Learning Metrics: Six Times Tables IntroductionSample
SizeAverage
AccuracyAverage
Ans / minAverage
Early ScoreAverage
High ScoreAverage
Improvement
7,366 92.37% 23.63 20.67 30.77 48.89%
67
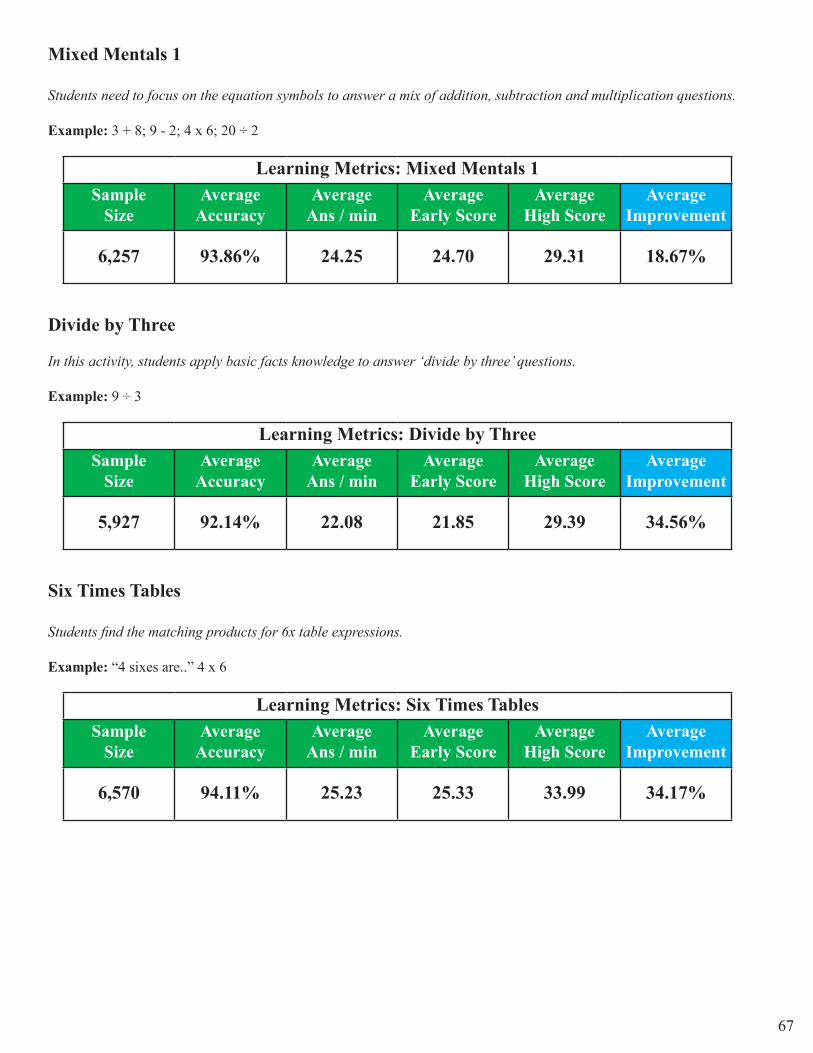
Mixed Mentals 1
Students need to focus on the equation symbols to answer a mix of addition, subtraction and multiplication questions.
Example: 3 + 8; 9 - 2; 4 x 6; 20 ÷ 2
Learning Metrics: Mixed Mentals 1Sample
SizeAverage
AccuracyAverage
Ans / minAverage
Early ScoreAverage
High ScoreAverage
Improvement
6,257 93.86% 24.25 24.70 29.31 18.67%
Divide by Three
In this activity, students apply basic facts knowledge to answer ‘divide by three’ questions.
Example: 9 ÷ 3
Learning Metrics: Divide by ThreeSample
SizeAverage
AccuracyAverage
Ans / minAverage
Early ScoreAverage
High ScoreAverage
Improvement
5,927 92.14% 22.08 21.85 29.39 34.56%
Six Times Tables
Students find the matching products for 6x table expressions.
Example: “4 sixes are..” 4 x 6
Learning Metrics: Six Times TablesSample
SizeAverage
AccuracyAverage
Ans / minAverage
Early ScoreAverage
High ScoreAverage
Improvement
6,570 94.11% 25.23 25.33 33.99 34.17%

68
Number Pattern - Increasing 4
This activity introduces patterns; students complete a sequence of numbers which increases by 3, 4 or 5.
Example: 0, 4, ___ , 12, 16
Learning Metrics: Number Pattern - Increasing 4Sample
SizeAverage
AccuracyAverage
Ans / minAverage
Early ScoreAverage
High ScoreAverage
Improvement
5,436 79.91% 11.92 10.60 15.25 43.77%
Eight Times Tables Introduction
Students hear and read multiplication expressions using the word ‘times’ before selecting the matching answer. Questions are asked in sequence.
Example: 3 x 8
Learning Metrics: Eight Times Tables IntroductionSample
SizeAverage
AccuracyAverage
Ans / minAverage
Early ScoreAverage
High ScoreAverage
Improvement
5,605 91.17% 22.39 19.72 28.56 44.81%
Six Times Tables - Missing
Students consolidate their understanding of the 6x table by solving equations with a missing factor.
Example: What do I multiply 6 by to get 30?
Learning Metrics: Six Times Tables - MissingSample
SizeAverage
AccuracyAverage
Ans / minAverage
Early ScoreAverage
High ScoreAverage
Improvement
5,395 92.56% 23.23 21.96 33.72 53.55%
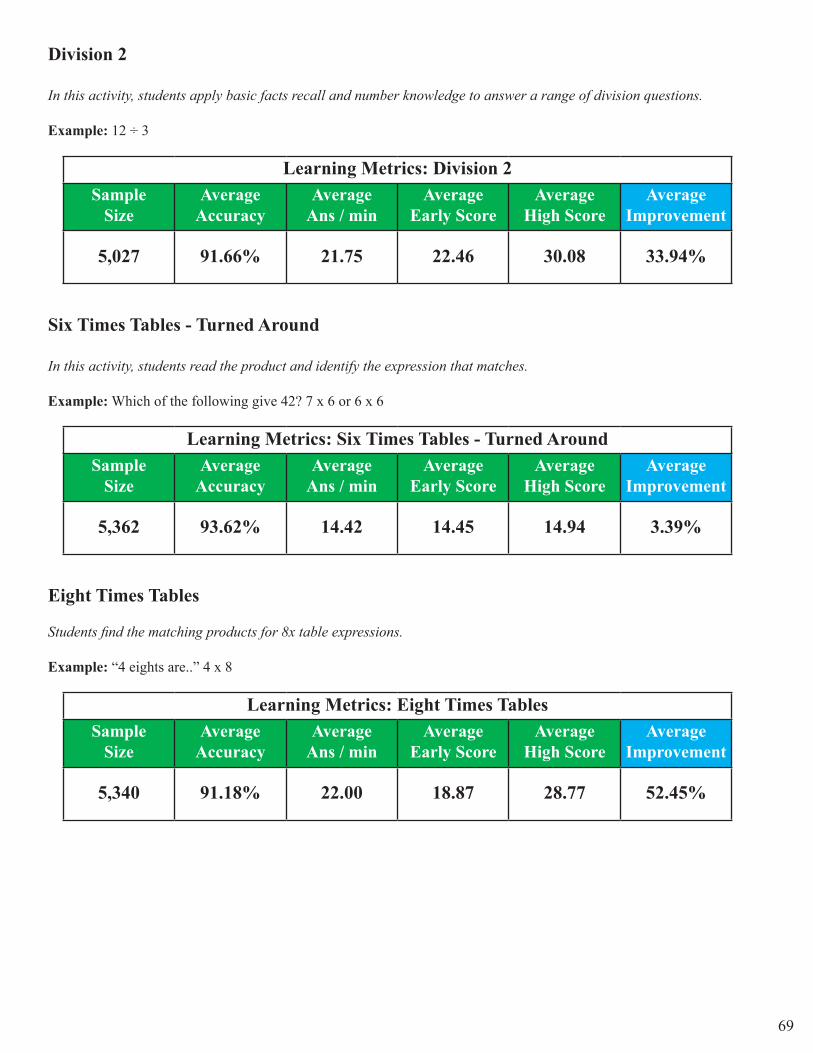
69
Division 2
In this activity, students apply basic facts recall and number knowledge to answer a range of division questions.
Example: 12 ÷ 3
Learning Metrics: Division 2Sample
SizeAverage
AccuracyAverage
Ans / minAverage
Early ScoreAverage
High ScoreAverage
Improvement
5,027 91.66% 21.75 22.46 30.08 33.94%
Six Times Tables - Turned Around
In this activity, students read the product and identify the expression that matches.
Example: Which of the following give 42? 7 x 6 or 6 x 6
Learning Metrics: Six Times Tables - Turned AroundSample
SizeAverage
AccuracyAverage
Ans / minAverage
Early ScoreAverage
High ScoreAverage
Improvement
5,362 93.62% 14.42 14.45 14.94 3.39%
Eight Times Tables
Students find the matching products for 8x table expressions.
Example: “4 eights are..” 4 x 8
Learning Metrics: Eight Times TablesSample
SizeAverage
AccuracyAverage
Ans / minAverage
Early ScoreAverage
High ScoreAverage
Improvement
5,340 91.18% 22.00 18.87 28.77 52.45%

70
Divide by Six
In this activity, students apply basic facts and number knowledge to answer ‘divide by six’ questions.
Example: 24 ÷ 6
Learning Metrics: Divide by SixSample
SizeAverage
AccuracyAverage
Ans / minAverage
Early ScoreAverage
High ScoreAverage
Improvement
5,196 91.64% 22.49 20.40 30.60 50.02%
Nine Times Tables Introduction
Students hear and read multiplication expressions using the word ‘times’ before selecting the matching answer. Questions are asked in sequence.
Example: 3 x 9
Learning Metrics: Nine Times Tables IntroductionSample
SizeAverage
AccuracyAverage
Ans / minAverage
Early ScoreAverage
High ScoreAverage
Improvement
5,468 93.03% 24.84 21.26 31.56 48.42%
Arithmetic 2
Students apply their number knowledge to answer a range of two digit and one digit addition and subtraction questions.
Example: 38 - 2 - 4
Learning Metrics: Arithmetic 2Sample
SizeAverage
AccuracyAverage
Ans / minAverage
Early ScoreAverage
High ScoreAverage
Improvement
4,506 76.81% 10.48 8.81 13.86 57.27%
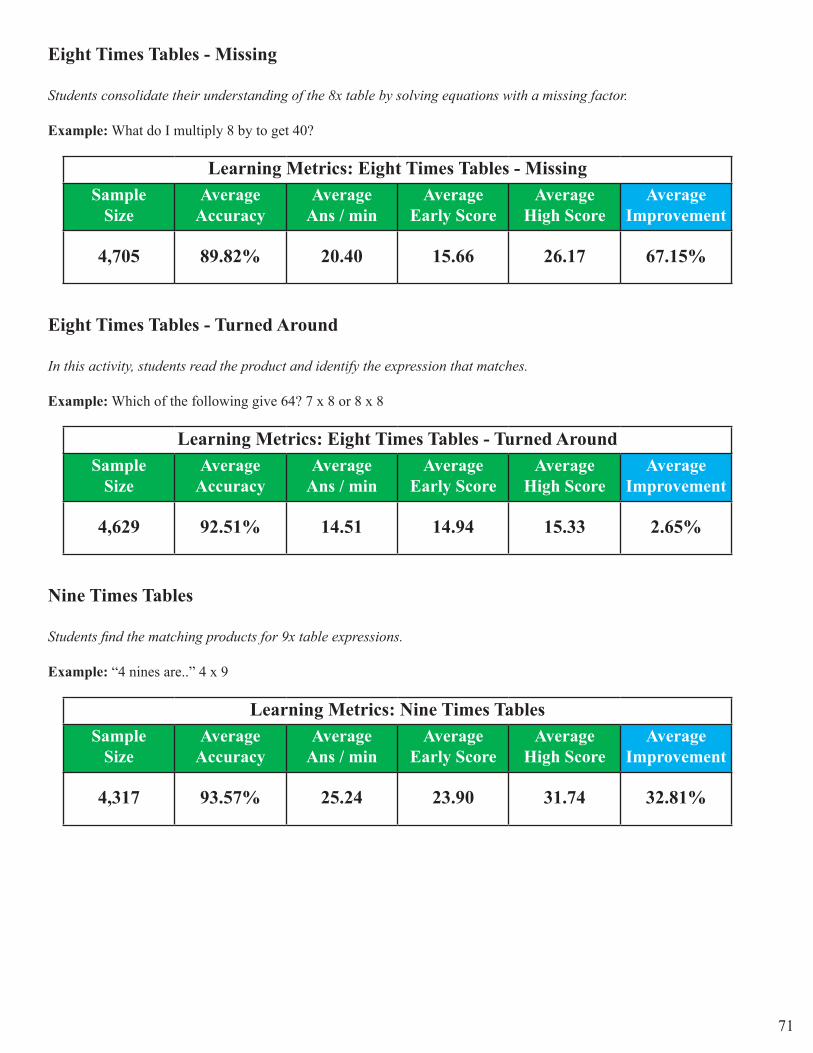
71
Eight Times Tables - Missing
Students consolidate their understanding of the 8x table by solving equations with a missing factor.
Example: What do I multiply 8 by to get 40?
Learning Metrics: Eight Times Tables - MissingSample
SizeAverage
AccuracyAverage
Ans / minAverage
Early ScoreAverage
High ScoreAverage
Improvement
4,705 89.82% 20.40 15.66 26.17 67.15%
Eight Times Tables - Turned Around
In this activity, students read the product and identify the expression that matches.
Example: Which of the following give 64? 7 x 8 or 8 x 8
Learning Metrics: Eight Times Tables - Turned AroundSample
SizeAverage
AccuracyAverage
Ans / minAverage
Early ScoreAverage
High ScoreAverage
Improvement
4,629 92.51% 14.51 14.94 15.33 2.65%
Nine Times Tables
Students find the matching products for 9x table expressions.
Example: “4 nines are..” 4 x 9
Learning Metrics: Nine Times TablesSample
SizeAverage
AccuracyAverage
Ans / minAverage
Early ScoreAverage
High ScoreAverage
Improvement
4,317 93.57% 25.24 23.90 31.74 32.81%
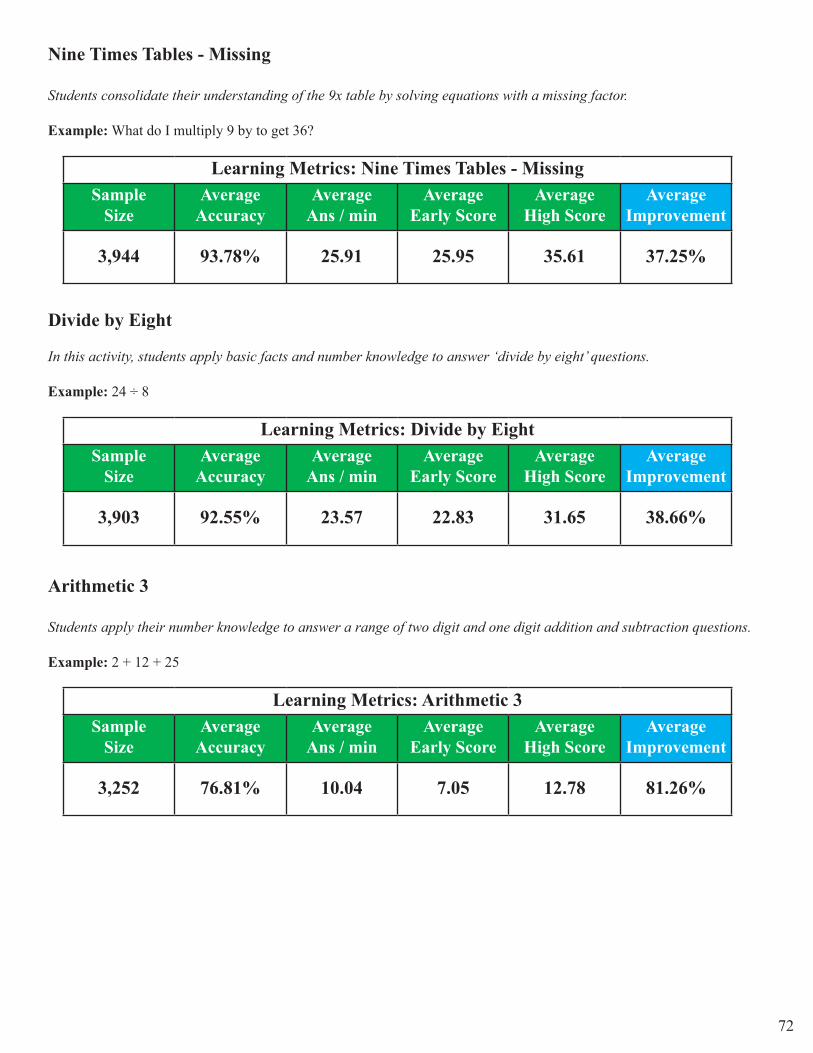
72
Nine Times Tables - Missing
Students consolidate their understanding of the 9x table by solving equations with a missing factor.
Example: What do I multiply 9 by to get 36?
Learning Metrics: Nine Times Tables - MissingSample
SizeAverage
AccuracyAverage
Ans / minAverage
Early ScoreAverage
High ScoreAverage
Improvement
3,944 93.78% 25.91 25.95 35.61 37.25%
Divide by Eight
In this activity, students apply basic facts and number knowledge to answer ‘divide by eight’ questions.
Example: 24 ÷ 8
Learning Metrics: Divide by EightSample
SizeAverage
AccuracyAverage
Ans / minAverage
Early ScoreAverage
High ScoreAverage
Improvement
3,903 92.55% 23.57 22.83 31.65 38.66%
Arithmetic 3
Students apply their number knowledge to answer a range of two digit and one digit addition and subtraction questions.
Example: 2 + 12 + 25
Learning Metrics: Arithmetic 3Sample
SizeAverage
AccuracyAverage
Ans / minAverage
Early ScoreAverage
High ScoreAverage
Improvement
3,252 76.81% 10.04 7.05 12.78 81.26%

73
Nine Times Tables - Turned Around
In this activity, students read the product and identify the expression that matches.
Example: Which of the following give 72? 12 x 9 or 8 x 9
Learning Metrics: Nine Times Tables - Turned AroundSample
SizeAverage
AccuracyAverage
Ans / minAverage
Early ScoreAverage
High ScoreAverage
Improvement
3,807 92.41% 14.60 14.35 14.86 3.59%
Times Tables 3
Students experience a range of times table questions to build recall.
Example: 4 x 8; 5 x 9; 7 x 6
Learning Metrics: Times Tables 3Sample
SizeAverage
AccuracyAverage
Ans / minAverage
Early ScoreAverage
High ScoreAverage
Improvement
3,673 92.98% 24.19 23.32 29.93 28.33%
Divide by Nine
In this activity, students apply basic facts and number knowledge to answer ‘divide by nine’ questions.
Example: 36 ÷ 9
Learning Metrics: Divide by NineSample
SizeAverage
AccuracyAverage
Ans / minAverage
Early ScoreAverage
High ScoreAverage
Improvement
3,421 94.72% 27.34 27.59 34.76 25.97%
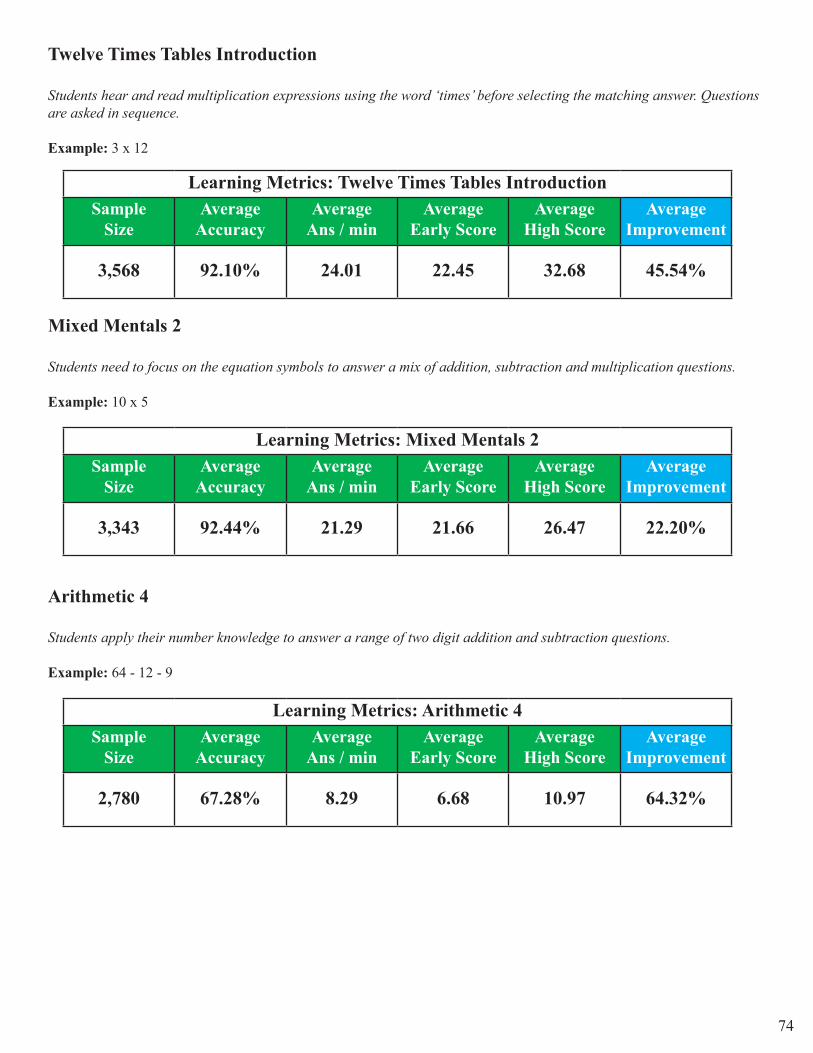
74
Twelve Times Tables Introduction
Students hear and read multiplication expressions using the word ‘times’ before selecting the matching answer. Questions are asked in sequence.
Example: 3 x 12
Learning Metrics: Twelve Times Tables IntroductionSample
SizeAverage
AccuracyAverage
Ans / minAverage
Early ScoreAverage
High ScoreAverage
Improvement
3,568 92.10% 24.01 22.45 32.68 45.54%
Mixed Mentals 2
Students need to focus on the equation symbols to answer a mix of addition, subtraction and multiplication questions.
Example: 10 x 5
Learning Metrics: Mixed Mentals 2Sample
SizeAverage
AccuracyAverage
Ans / minAverage
Early ScoreAverage
High ScoreAverage
Improvement
3,343 92.44% 21.29 21.66 26.47 22.20%
Arithmetic 4
Students apply their number knowledge to answer a range of two digit addition and subtraction questions.
Example: 64 - 12 - 9
Learning Metrics: Arithmetic 4Sample
SizeAverage
AccuracyAverage
Ans / minAverage
Early ScoreAverage
High ScoreAverage
Improvement
2,780 67.28% 8.29 6.68 10.97 64.32%
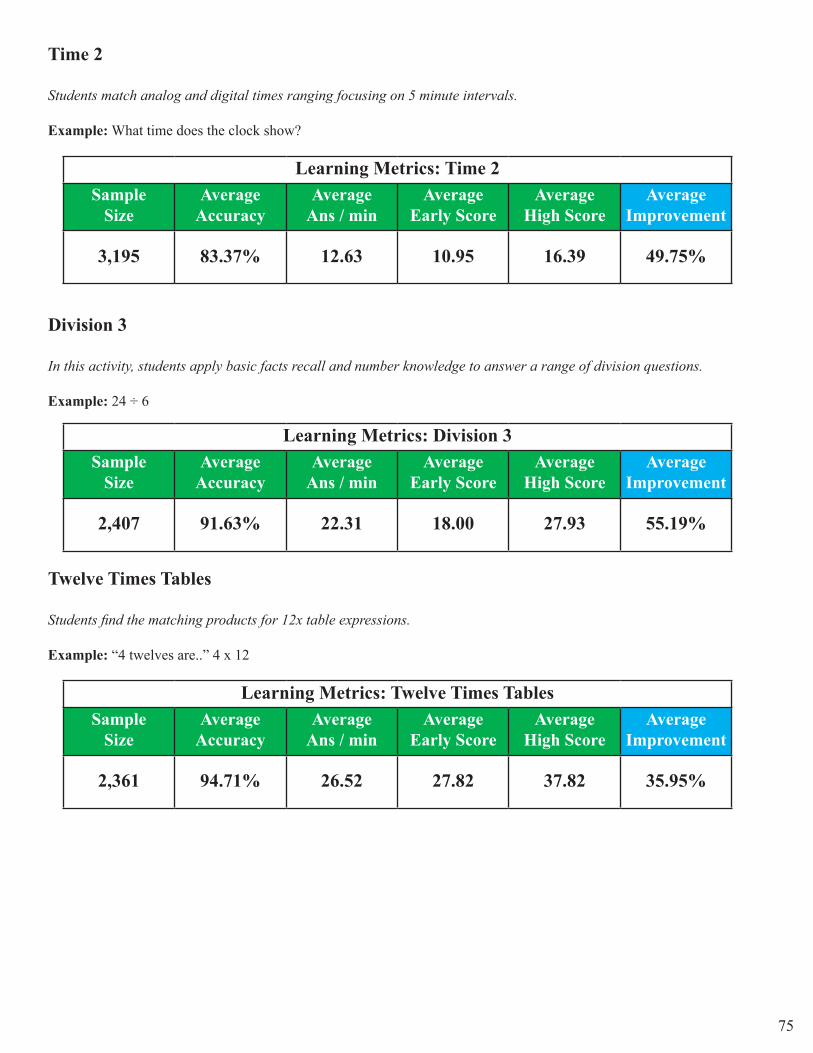
75
Time 2
Students match analog and digital times ranging focusing on 5 minute intervals.
Example: What time does the clock show?
Learning Metrics: Time 2Sample
SizeAverage
AccuracyAverage
Ans / minAverage
Early ScoreAverage
High ScoreAverage
Improvement
3,195 83.37% 12.63 10.95 16.39 49.75%
Division 3
In this activity, students apply basic facts recall and number knowledge to answer a range of division questions.
Example: 24 ÷ 6
Learning Metrics: Division 3Sample
SizeAverage
AccuracyAverage
Ans / minAverage
Early ScoreAverage
High ScoreAverage
Improvement
2,407 91.63% 22.31 18.00 27.93 55.19%
Twelve Times Tables
Students find the matching products for 12x table expressions.
Example: “4 twelves are..” 4 x 12
Learning Metrics: Twelve Times TablesSample
SizeAverage
AccuracyAverage
Ans / minAverage
Early ScoreAverage
High ScoreAverage
Improvement
2,361 94.71% 26.52 27.82 37.82 35.95%
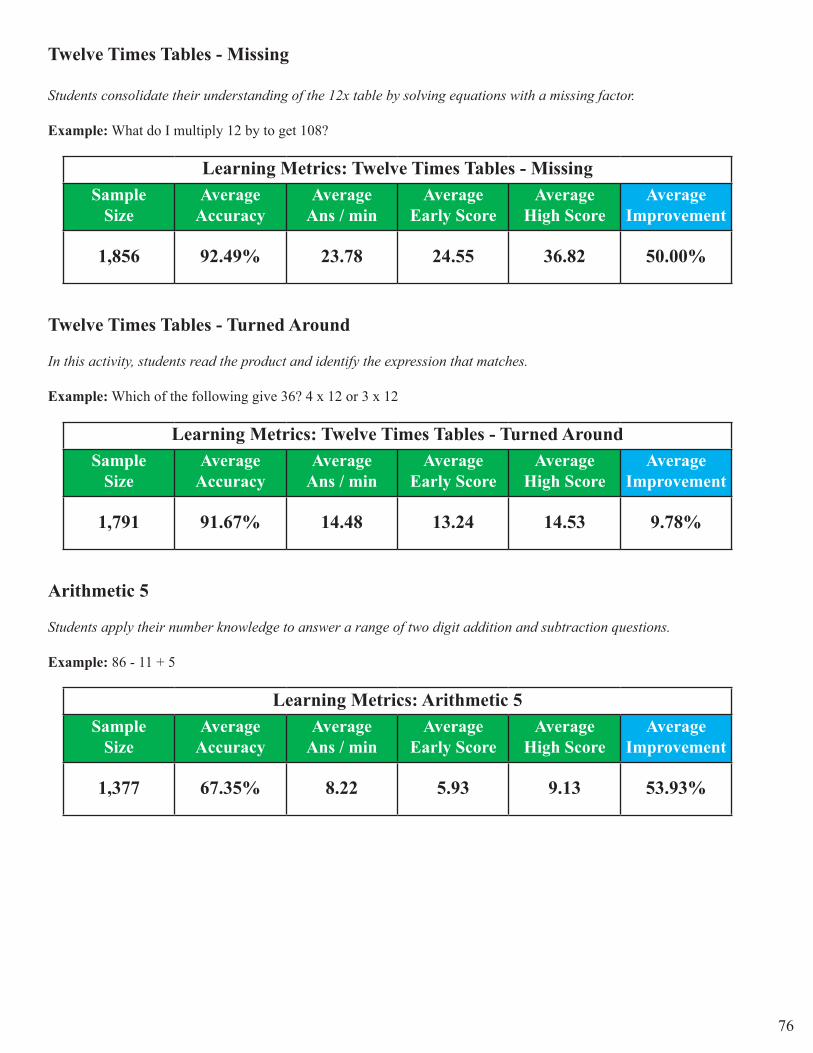
76
Twelve Times Tables - Missing
Students consolidate their understanding of the 12x table by solving equations with a missing factor.
Example: What do I multiply 12 by to get 108?
Learning Metrics: Twelve Times Tables - MissingSample
SizeAverage
AccuracyAverage
Ans / minAverage
Early ScoreAverage
High ScoreAverage
Improvement
1,856 92.49% 23.78 24.55 36.82 50.00%
Twelve Times Tables - Turned Around
In this activity, students read the product and identify the expression that matches.
Example: Which of the following give 36? 4 x 12 or 3 x 12
Learning Metrics: Twelve Times Tables - Turned AroundSample
SizeAverage
AccuracyAverage
Ans / minAverage
Early ScoreAverage
High ScoreAverage
Improvement
1,791 91.67% 14.48 13.24 14.53 9.78%
Arithmetic 5
Students apply their number knowledge to answer a range of two digit addition and subtraction questions.
Example: 86 - 11 + 5
Learning Metrics: Arithmetic 5Sample
SizeAverage
AccuracyAverage
Ans / minAverage
Early ScoreAverage
High ScoreAverage
Improvement
1,377 67.35% 8.22 5.93 9.13 53.93%
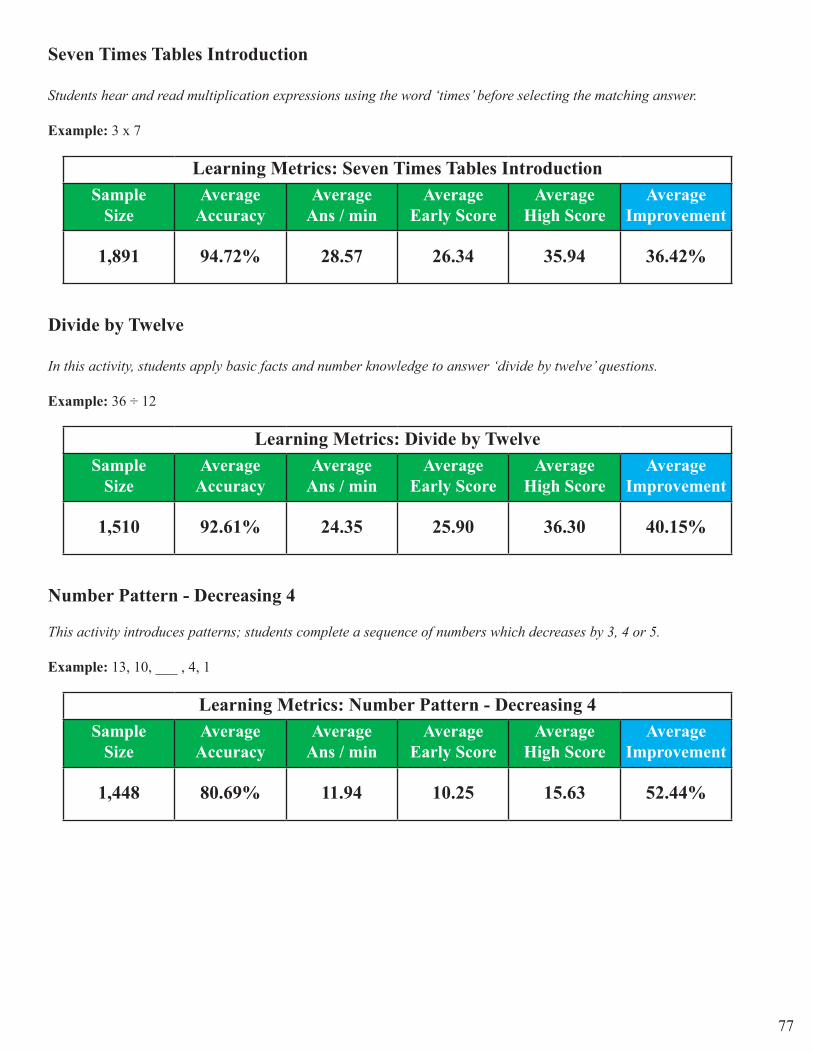
77
Seven Times Tables Introduction
Students hear and read multiplication expressions using the word ‘times’ before selecting the matching answer.
Example: 3 x 7
Learning Metrics: Seven Times Tables IntroductionSample
SizeAverage
AccuracyAverage
Ans / minAverage
Early ScoreAverage
High ScoreAverage
Improvement
1,891 94.72% 28.57 26.34 35.94 36.42%
Divide by Twelve
In this activity, students apply basic facts and number knowledge to answer ‘divide by twelve’ questions.
Example: 36 ÷ 12
Learning Metrics: Divide by TwelveSample
SizeAverage
AccuracyAverage
Ans / minAverage
Early ScoreAverage
High ScoreAverage
Improvement
1,510 92.61% 24.35 25.90 36.30 40.15%
Number Pattern - Decreasing 4
This activity introduces patterns; students complete a sequence of numbers which decreases by 3, 4 or 5.
Example: 13, 10, ___ , 4, 1
Learning Metrics: Number Pattern - Decreasing 4Sample
SizeAverage
AccuracyAverage
Ans / minAverage
Early ScoreAverage
High ScoreAverage
Improvement
1,448 80.69% 11.94 10.25 15.63 52.44%
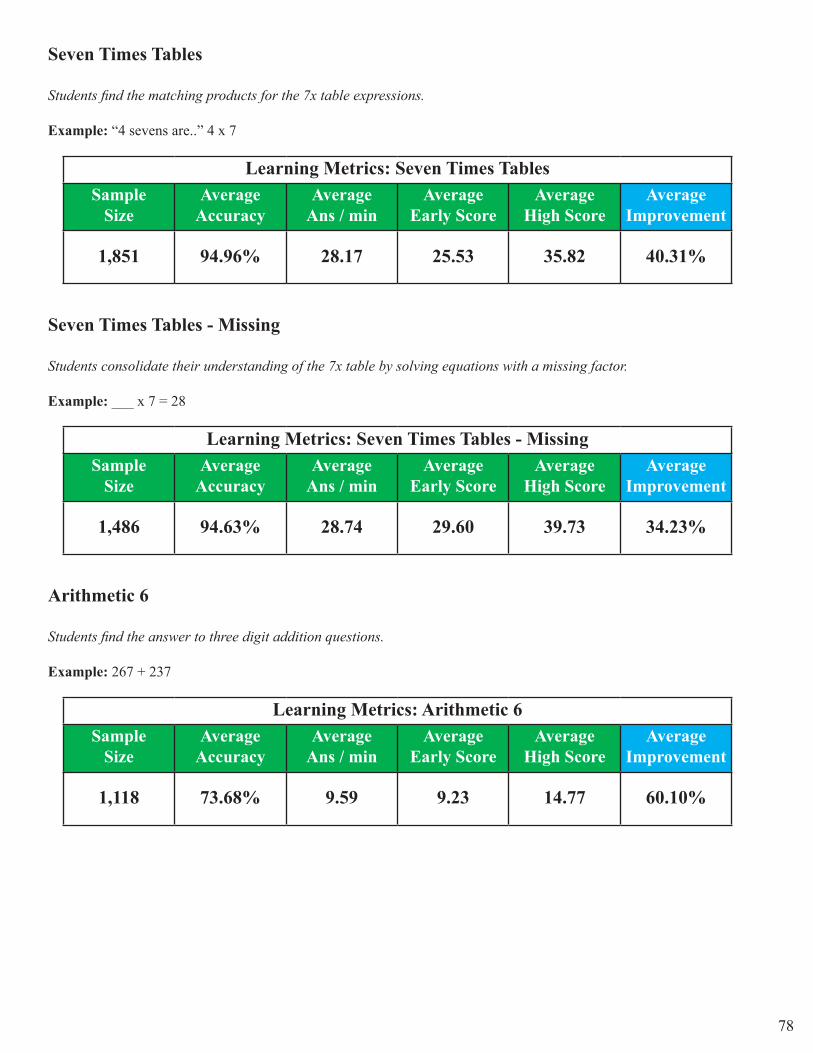
78
Seven Times Tables
Students find the matching products for the 7x table expressions.
Example: “4 sevens are..” 4 x 7
Learning Metrics: Seven Times TablesSample
SizeAverage
AccuracyAverage
Ans / minAverage
Early ScoreAverage
High ScoreAverage
Improvement
1,851 94.96% 28.17 25.53 35.82 40.31%
Seven Times Tables - Missing
Students consolidate their understanding of the 7x table by solving equations with a missing factor.
Example: ___ x 7 = 28
Learning Metrics: Seven Times Tables - MissingSample
SizeAverage
AccuracyAverage
Ans / minAverage
Early ScoreAverage
High ScoreAverage
Improvement
1,486 94.63% 28.74 29.60 39.73 34.23%
Arithmetic 6
Students find the answer to three digit addition questions.
Example: 267 + 237
Learning Metrics: Arithmetic 6Sample
SizeAverage
AccuracyAverage
Ans / minAverage
Early ScoreAverage
High ScoreAverage
Improvement
1,118 73.68% 9.59 9.23 14.77 60.10%
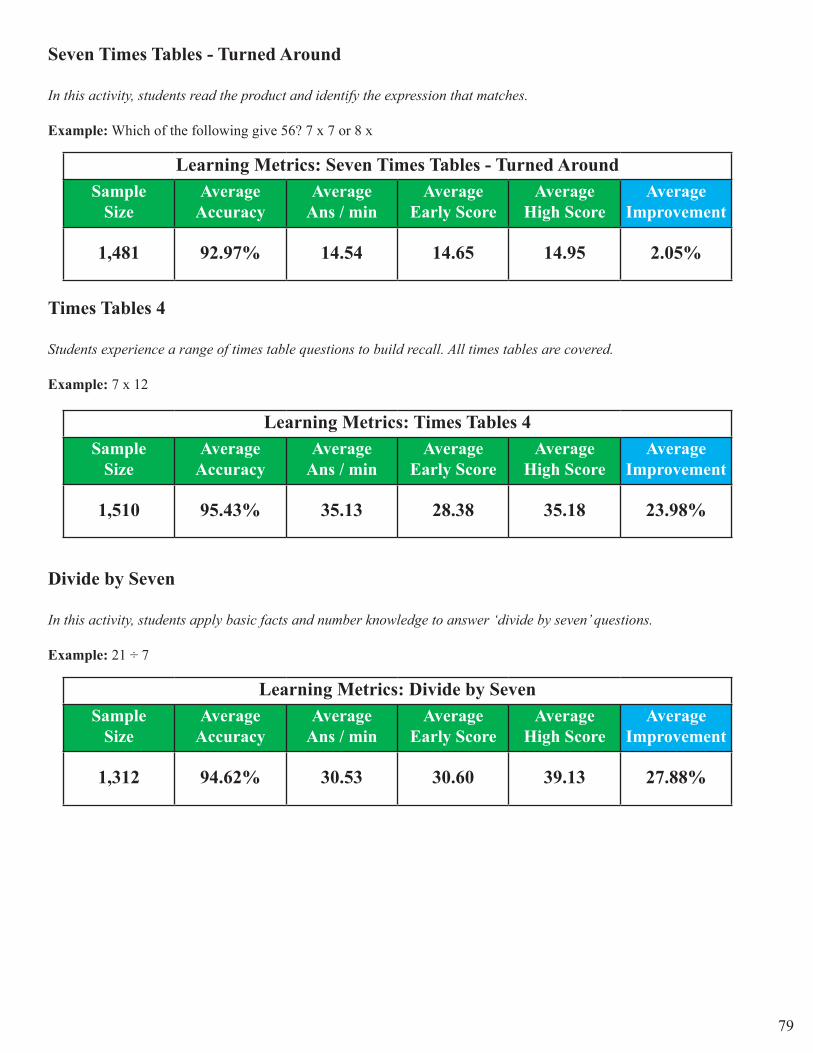
79
Seven Times Tables - Turned Around
In this activity, students read the product and identify the expression that matches.
Example: Which of the following give 56? 7 x 7 or 8 x
Learning Metrics: Seven Times Tables - Turned AroundSample
SizeAverage
AccuracyAverage
Ans / minAverage
Early ScoreAverage
High ScoreAverage
Improvement
1,481 92.97% 14.54 14.65 14.95 2.05%
Times Tables 4
Students experience a range of times table questions to build recall. All times tables are covered.
Example: 7 x 12
Learning Metrics: Times Tables 4Sample
SizeAverage
AccuracyAverage
Ans / minAverage
Early ScoreAverage
High ScoreAverage
Improvement
1,510 95.43% 35.13 28.38 35.18 23.98%
Divide by Seven
In this activity, students apply basic facts and number knowledge to answer ‘divide by seven’ questions.
Example: 21 ÷ 7
Learning Metrics: Divide by SevenSample
SizeAverage
AccuracyAverage
Ans / minAverage
Early ScoreAverage
High ScoreAverage
Improvement
1,312 94.62% 30.53 30.60 39.13 27.88%
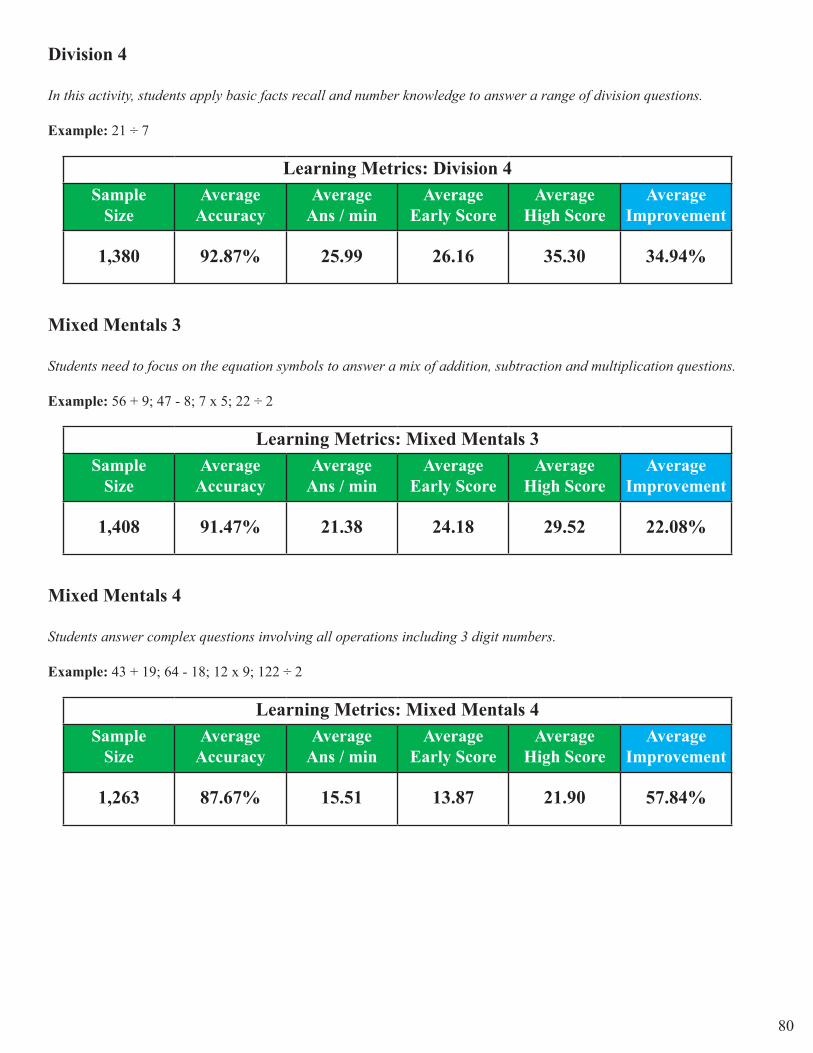
80
Division 4
In this activity, students apply basic facts recall and number knowledge to answer a range of division questions.
Example: 21 ÷ 7
Learning Metrics: Division 4Sample
SizeAverage
AccuracyAverage
Ans / minAverage
Early ScoreAverage
High ScoreAverage
Improvement
1,380 92.87% 25.99 26.16 35.30 34.94%
Mixed Mentals 3
Students need to focus on the equation symbols to answer a mix of addition, subtraction and multiplication questions.
Example: 56 + 9; 47 - 8; 7 x 5; 22 ÷ 2
Learning Metrics: Mixed Mentals 3Sample
SizeAverage
AccuracyAverage
Ans / minAverage
Early ScoreAverage
High ScoreAverage
Improvement
1,408 91.47% 21.38 24.18 29.52 22.08%
Mixed Mentals 4
Students answer complex questions involving all operations including 3 digit numbers.
Example: 43 + 19; 64 - 18; 12 x 9; 122 ÷ 2
Learning Metrics: Mixed Mentals 4Sample
SizeAverage
AccuracyAverage
Ans / minAverage
Early ScoreAverage
High ScoreAverage
Improvement
1,263 87.67% 15.51 13.87 21.90 57.84%
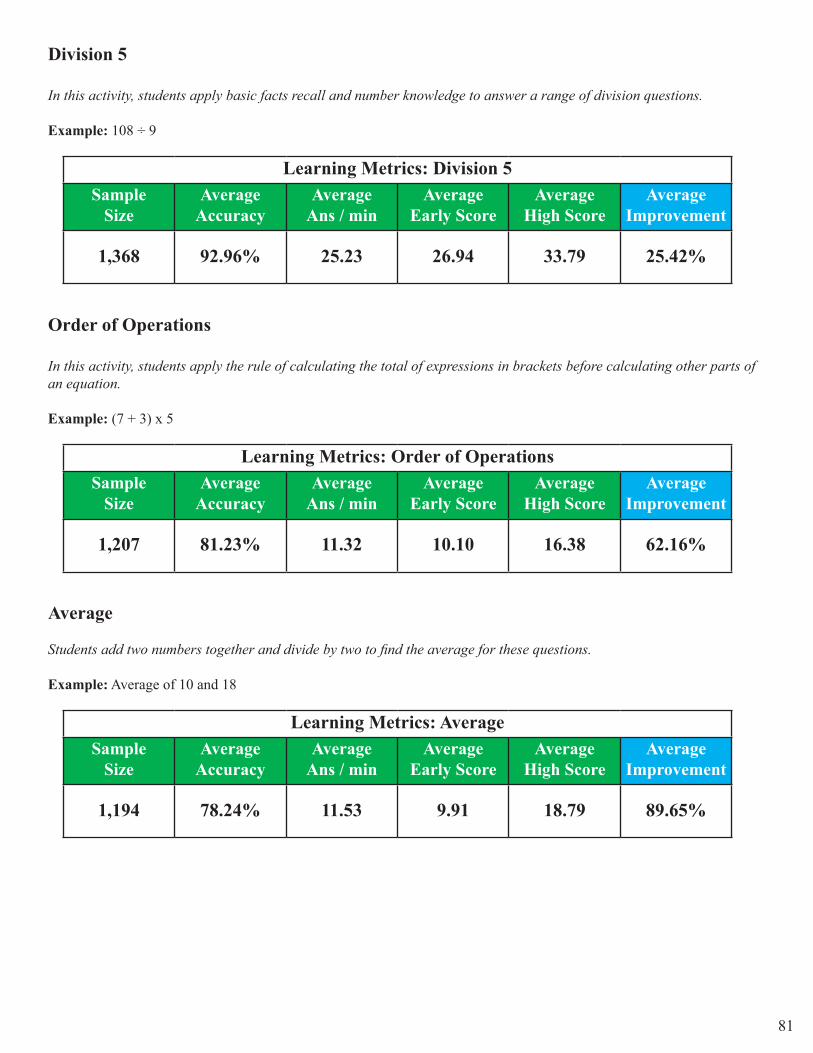
81
Division 5
In this activity, students apply basic facts recall and number knowledge to answer a range of division questions.
Example: 108 ÷ 9
Learning Metrics: Division 5Sample
SizeAverage
AccuracyAverage
Ans / minAverage
Early ScoreAverage
High ScoreAverage
Improvement
1,368 92.96% 25.23 26.94 33.79 25.42%
Order of Operations
In this activity, students apply the rule of calculating the total of expressions in brackets before calculating other parts of an equation.
Example: (7 + 3) x 5
Learning Metrics: Order of OperationsSample
SizeAverage
AccuracyAverage
Ans / minAverage
Early ScoreAverage
High ScoreAverage
Improvement
1,207 81.23% 11.32 10.10 16.38 62.16%
Average
Students add two numbers together and divide by two to find the average for these questions.
Example: Average of 10 and 18
Learning Metrics: AverageSample
SizeAverage
AccuracyAverage
Ans / minAverage
Early ScoreAverage
High ScoreAverage
Improvement
1,194 78.24% 11.53 9.91 18.79 89.65%
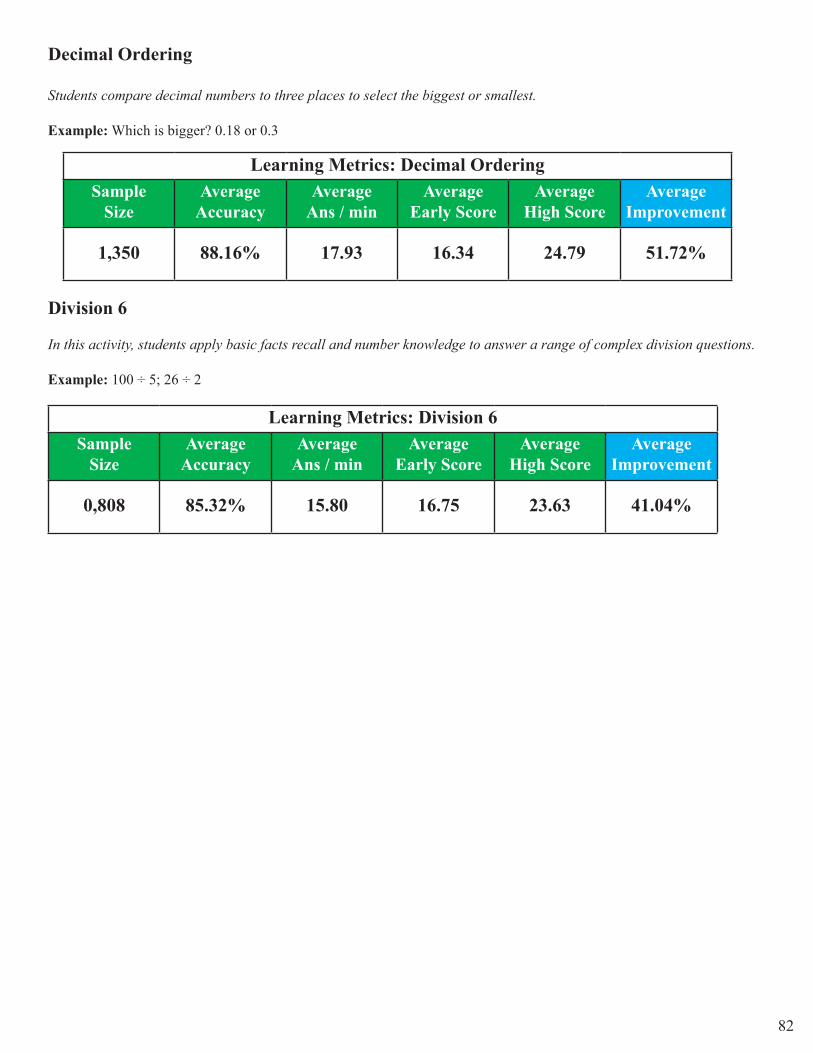
82
Decimal Ordering
Students compare decimal numbers to three places to select the biggest or smallest.
Example: Which is bigger? 0.18 or 0.3
Learning Metrics: Decimal OrderingSample
SizeAverage
AccuracyAverage
Ans / minAverage
Early ScoreAverage
High ScoreAverage
Improvement
1,350 88.16% 17.93 16.34 24.79 51.72%
Division 6
In this activity, students apply basic facts recall and number knowledge to answer a range of complex division questions.
Example: 100 ÷ 5; 26 ÷ 2
Learning Metrics: Division 6Sample
SizeAverage
AccuracyAverage
Ans / minAverage
Early ScoreAverage
High ScoreAverage
Improvement
0,808 85.32% 15.80 16.75 23.63 41.04%