Skip-YOLO: Domestic Garbage Detection Using Deep Learning ...
15
Skip-YOLO: Domestic Garbage Detection Using Deep Learning Method in Complex Multi-scenes Lun Zhao Institute of Intelligent Manufacturing Technology, Postdoctoral Innovation Practical base, Shenzhen Polytechnic; Shenzhen Institutes of Advanced Technology, Chinese Academy of Science, Shenzhen Yunlong Pan Faculty of Mechanical and Electrical Engineering, Kunming University of Science and Technology, Kunming Sen Wang ( [email protected] ) Kunming University of Science and Technology Liang Zhang Institute of Intelligent Manufacturing Technology, Postdoctoral Innovation Practical base, Shenzhen Polytechnic Md Shaヲqul Islam Department of Mechanical Engineering, Faculty of Engineering, Blekinge Institute of Technology, 37179 Karlskrona Research Keywords: Image Procession, Garbage Detection, Feature Mappings, Dense Convolution Block, YOLOv3 Posted Date: August 9th, 2021 DOI: https://doi.org/10.21203/rs.3.rs-757539/v1 License: This work is licensed under a Creative Commons Attribution 4.0 International License. Read Full License
Transcript of Skip-YOLO: Domestic Garbage Detection Using Deep Learning ...
Skip-YOLO: Domestic Garbage Detection UsingDeep Learning Method in Complex Multi-scenesLun Zhao
Institute of Intelligent Manufacturing Technology, Postdoctoral Innovation Practical base, ShenzhenPolytechnic; Shenzhen Institutes of Advanced Technology, Chinese Academy of Science, ShenzhenYunlong Pan
Faculty of Mechanical and Electrical Engineering, Kunming University of Science and Technology,KunmingSen Wang ( [email protected] )
Kunming University of Science and TechnologyLiang Zhang
Institute of Intelligent Manufacturing Technology, Postdoctoral Innovation Practical base, ShenzhenPolytechnicMd Sha�qul Islam
Department of Mechanical Engineering, Faculty of Engineering, Blekinge Institute of Technology, 37179Karlskrona
Research
Keywords: Image Procession, Garbage Detection, Feature Mappings, Dense Convolution Block, YOLOv3
Posted Date: August 9th, 2021
DOI: https://doi.org/10.21203/rs.3.rs-757539/v1
License: This work is licensed under a Creative Commons Attribution 4.0 International License. Read Full License
This document is the results of the research project funded by Postdoctoral Foundation Project of Shenzhen Polytechnic (6021330001K)
and the National Natural Science Foundation of China under Grant 52065035. Lun Zhao and Yunlong Pan contributed equally to this work.
[email protected] (L. Zhao); [email protected] (Y. Pan); [email protected] (S. Wang); [email protected] (L. Zhang);
[email protected] (M.S. Islam) ORCID(s): 0000-0001-8293-9094 (L. Zhao); 0000-0002-5194-6299 (Y. Pan); 0000-0003-1259-8030 (S.
Wang)
Skip-YOLO: domestic garbage detection using deep learning method in complex
multi-scenes
Lun Zhaoa,b, Yunlong Panc, Sen Wangc*,, Liang Zhanga*, and Md Shafiqul Islamd
a: Institute of Intelligent Manufacturing Technology, Postdoctoral Innovation Practical base, Shenzhen Pol-
ytechnic, Shenzhen, 518055, China
b: Shenzhen Institutes of Advanced Technology, Chinese Academy of Sciences, Shenzhen, 518055, China
c: Faculty of Mechanical and Electrical Engineering, Kunming University of Science and Technology, Kun-
ming 650500, China
d: Department of Mechanical Engineering, Faculty of Engineering, Blekinge Institute of Technology, 37179
Karlskrona, Sweden
Abstract: In In the field of garbage intelligent identification, similar garbage are difficult to be effectively de tected due to
different kinds of characteristics. This paper proposes a Skip-YOLO model for garbage detection in real life through the visual
analysis of feature mapping in different neural networks. First of all, the receptive field of the model is enlarged through the
large-size convolution kernel, which enhanced the shallow information of images. Secondly, the high-dimensional feature
mappings of garbage is extracted by dense convolutional blocks. The sensitivity of similar features in the same type of garbage
is enhanced by strengthening the sharing of shallow low semantics and deep high semantics information. Finally, the mul-
ti-scale high-dimensional feature mappings is integrated and sent to the YOLO layer to predict the type and location of garbage.
Experimental results show that compared with the YOLOv3, the overall detection precision is increased by 22.5%, and the av-
erage recall rate is increased by 18.6%. In qualitative comparison, it successfully detects domestic garbage in complex mul-
ti-scenes. In addition, our approach alleviates the overfitting problem of deep residual blocks. The application case of waste
sorting production line is used to further highlight the model generalization performance of our method.
Key words: Image Procession; Garbage Detection; Feature Mappings; Dense Convolution Block; YOLOv3
1 Introduction
The intelligent recycling of municipal solid
waste can not only bring economic benefits, but also
has research value in the fields of social research and
natural science [1][2]. The recycling system of do-
mestic garbage can be simply divided into four stag-
es: garbage collection, transportation, transfer and
recycling. A reasonable waste management process
can produce social and economic benefits. For ex-
ample, a survey of rural areas in developing coun-
tries calls for increased density of garbage collection
points, which can reduce environmental degradation
from the source [3]. It can reduce investment costs
and improve recycling efficiency by optimizing the
placement of garbage bins in urban communities [4].
The fineness and perceptibility of the trash can help
the correct collection and classification of waste [5].
Converting the collection and transportation of mu-
nicipal solid waste (MSW) into an integer program
can provide the best solution for waste collection and
transportation [6]. Multilevel solid waste collection
with operating stations and transportation system
with reliability framework can be used to manage the
uncertainty of multi-level SWM systems [7]. It will
help solid waste recycling by improving the harmless
treatment method of domestic waste or extracting
valuable organic matter from organic waste[8][9]. It
is important for domestic waste to process intelli-
gently, which can further coordinate urban develop-
ment and environmental protection [10]. The simula-
tion of various policies on MSW management from a

dynamic and complex perspective, which found that
economic policies have a great impact on the future
management of municipal solid waste [11]. Sen-
sor-based Internet of Things (IoT) can improve the
generation, collection, transportation and final dis-
posal of food waste [12]. Nonauto regression (NAR)
model can be used to predict the future generation of
MSW [13]. In general, many scholars are searching
for efficient waste disposal systems, which require
efficient waste sorting methods.
With the development of computer vision tech-
nology, deep learning methods have gradually at-
tracted the attention of some researchers. For exam-
ple, intelligent classification of glass and metal in
garbage bags by training convolutional neural net-
work (CNN) [14]. Optimize the fully connected layer
of CNN through genetic algorithm (GA) can improve
the performance of waste detection [15]. An intelli-
gent system of waste classification based on ResNet
[16] can achieve accurate waste classification [17].
An intelligent waste management system architecture
with IoT and CNN has achieved real-time monitoring
of digestible and indigestible waste [18]. In addition,
deep learning has been successfully applied in sepa-
ration and classification of waste electrical and elec-
tronic equipment (WEEE) batteries [19], E-waste
collection [20], construction solid waste classifica-
tion [21], and automatic detection of waste in water
[22]. The efficient and accurate detection of domestic
waste will help the intelligent development of waste
treatment. The garbage collection robot that uses
neural networks to identify garbage [23] and the
surface cleaning robot based on the YOLOv3 [24]
algorithm [25] can both replace manual garbage col-
lection. However, the number of garbage detected is
little and the background information is single. It is
different from real life. There is a challenge to object
detection performance, when the domestic waste is
diverse and existence scene is uncertain. For example,
disposable chopsticks and banana peels are
non-recyclable garbage, but their attributes are
greatly different.
In response to this problem, this paper proposes
a method that combines the YOLOv3 with densely
connected convolutional blocks [26]. This method
can be applied to domestic garbage detection in the
multiple natural scenes or different quantity distribu-
tion. First, we analyzed different types of neural
networks through the visualization of feature map-
pings during the process of network training. Sec-
ondly, a feature extractor is constructed using dense-
ly connected convolutional blocks to obtain
high-dimensional feature mappings. Finally, mul-
ti-scale high-dimensional feature mappings are
merged and three different YOLO layers are used to
predict various types of domestic waste. In addition,
we provide an application case in the experimental
part as a reference for intelligent waste management.
2 Deep Learning Methods
Various types of garbage are the objects which
need to detect, and usually need to train our model
before taking predictions. The deep learning model is
composed of four parts: Shallow network, Backbone
network, Neck and Head. Among these, the Shallow
network and the Backbone network are mainly re-
sponsible for extracting semantic information such as
the shape, color and location from the input feature
and converging them into high-dimensional feature
mappings. The Neck can optimize the extracted high
dimensional feature mappings, which helps the Head
to decode higher-quality feature.
2.1 Object Detection Algorithm
YOLOv3 is a one-stage anchor-based object
detection, which is mainly composed of the Darknet
architecture, three convolution sets and three YOLO
layers. The YOLOv3 algorithm is widely used in the
fields of construction [27], agriculture [28] and
transportation [29] etc. As shown in figure 1, Darknet
is mainly composed of five residual blocks and sev-
eral convolutional layers which are connected to the
residual blocks. Convolution set alternately uses
1×1×c and 3×3×2c convolutional layers (1×1×c
means the size of filter kernel is 1×1, and dimension
is c) to effectively extract and merge the mapping
information. Among them, 1×1×c convolutional lay-
ers can effectively compress the feature information
which expanded by the previous convolution layer.
3×3×2c convolutional layers can expand the feature
information and reduce the model calculation pa-
rameters without changing the scale of the input fea-
ture. The feature mapping will enter corresponding
residual block to achieve multi-scale feature extrac-
tion after each down sample. Finally, three groups of
high-dimension feature mappings with the scale of
52×52, 26×26 and 13×13 respectively will be the
output. YOLOv3 draws on the idea of multi-scale
feature fusion in FPN [30]. It is fused with the cor-
responding feature convolutions of two different
scales through up-sampling with 13×13 feature map-
pings. After multi-scale feature fusion, three YOLO
layers are used for prediction and regression at the
same time.

Figure 1: The structure of YOLOv3 algorithm.
2.2 Related Convolution Block
As shown in the black dashed box in Figure 2,
the residual block is composed of multiple residual
units for image feature extraction. Each residual unit
is composed of a 1×1 convolution kernel with k
channels and a 3×3 convolution kernel. The input
feature and the 3×3 convolution kernel are connected
by residuals, which can continuously overlay input
features of the same dimension. The calculation of
residual connection is as follows:
n 1( )n nX Y X (1)
In which, Xn represents the input feature of the n-th
layer, Yn represents the output feature of the (n-1)-th
layer. Therefore, each residual unit will be affected
by the output from the previous residual unit layer.
In contrast, the dense block is similar to an en-
hanced version of the residual block. As shown in the
red dashed box in Figure 2, each dense block consists
of several dense units. Each unit contains a 1×1
convolution kernel with k channels and a 3×3 con-
volution kernel with 4k channels. If the number of
channels input for each dense block is 0k . After n
times of convolution stacking, the feature mapping
with 0 +(n-1)k k channels is finally output. Among
them, the nonlinear function yn needs to be obtained
by the operation of batch normalization (BN) [31],
ReLu [32] activation function and 3×3 convolutional
layer in turn. The calculation between densely con-
nected convolutional blocks is as follows:
n 0 1 1([ , .., ])n nX Y X X X , (2)
In which, X0, X1, …, Xn-1 represents the input from
layer 0 to layer n-1. Xn represents the output of the
n-th layer; Yn represents the non-linear function of
the output. Therefore, the output of each dense block
layer is related to all previous input layers.
Figure 2: Illustration of different convolution blocks.
3 Methodology
3.1 Overview
The main work of this paper is shown in Figure 3. In
the stage 1, indoor and outdoor garbage images have
obtained in different scenarios, and divide all images
into two types: single-class and multi-class. Then, all
images are resized to 416×416, and randomly allo-
cate training dataset, validation dataset and test da-
taset. In the stage 2, we analyzed the parameter
transfer forms of three classic convolutional neural
networks. The same type of each domestic garbage
has quite different characteristic. This makes garbage
detection more difficult. Therefore, how to better
obtain the important pixels between similar charac-
teristic is the key of garbage detection. This paper
will ready to find a solution from the perspective of
feature mapping. In the stage 3, we combined the
analysis results of feature mapping to improve the
backbone network of the YOLOv3. We conducted
two different tests: one is based on the test dataset,
and the other is an application case that simulates a
waste sorting production line. In order to test wheth-
er the proposed model has sufficient generalization
ability, we replaced some untrained garbage in the
production line application case.

Figure 3: Illustration of our main work in this paper. In the stage 1, a domestic waste dataset is set, which contain simple and
complex garbage object. In the stage 2, high-quality feature mappings have more important pixels. However, the quality of
feature mapping is affected by the characteristics of the object itself. Therefore, we design a improved model for the featur e
extraction of domestic waste in stage 3. Finally, we evaluate the performance of our approach through the test dataset and
apply it to real scenarios
3.2 Analysis of Feature Mapping
In the training of the deep learning model, the
shallow network has rich feature information such as
edge contour, brightness and color etc. However, the
lack of sufficient receptive fields results in the limi-
tation of shallow feature extraction. The deep net-
work can not only express the global features of each
object in the image, but also recognize the detailed
information inside the object. With the deepening of
the network depth, it is easy to produce network
degradation. Because the useful features will gradu-
ally become saturated. For example, only simple
features such as rough outlines, colors, backgrounds
and shadows can be obtained when the shallow net-
work detects expired drugs. And the deep network
focuses on semantic and detailed features, such as
graphical information on the packaging.
The parameter transfer process of different
networks is shown in Figure 4. As shown by the
black dashed box, linear transmission can reduce the
impact of data fluctuations on the output with the
plane neural network (such as VGG16 [33]) learning
parameters. However, the continuous increase of

network depth will also lead to the gradual saturation
of useful features and gradually cause network deg-
radation. Therefore, some key pixels are missing in
the high-dimensional feature mapping. As shown by
the red dashed box, the output of the lower layer will
be impacted by the input of the upper layer, which
can generate more feature mapping in the residual
network. Therefore, the residual network is more
sensitive to data fluctuations. This ability to use the
features of the previous layer for identifying map-
ping solves the problem of network degradation.
However, the data description of the residual network
is prone to overfitting in the deep network, which
will eventually affect the detection accuracy. The
densely connected networks have been shown in the
green dashed box. The parameters of the upper layer
can jump to the next layer at will, so that each layer
of the densely connected network contains all the
previous layer information when learning the param-
eters. Compared with the residual network, although
both use the features of the previous layer for map-
ping learning, each layer of the densely connected
network only learns fewer features. Therefore, it can
be more flexible to choose the effective information
that needs to be learned when the data fluctuates.
This method can effectively alleviate deep network
overfitting while reducing network redundancy.
Figure 4: The parameter transfer process of different networks. The characteristics of input image for visualization ar e quite
different. The visualization image in the figure comes from a representative channel image in the feature mappings.
3.3 Improved Model
YOLOv3 is significantly better than other neu-
ral networks in animals or people detection with the
help of residual network structure and multi-scale
feature fusion. However, there is a large feature dif-
ference between the domestic garbage data set and
public data (such as ImageNet and PASCAL VOC
etc.), which leads to poor detection performance in
the real application. In addition, the household gar-
bage is arranged in a mess, and the same kind of
garbage contains many different objects. Therefore,

the feature of the same class garbage is quite differ-
ent, which produces a certain degree of data fluctua-
tion. This data fluctuation makes the network over-
fitting during the deep residual network learning. The
training results will lack sufficient generalization and
ultimately affect the average accuracy. In order to
solve the problem of over-fitting, we propose a
Skip-YOLO model for the domestic garbage detec-
tion. This model uses dense blocks to extract
high-dimensional feature maps and combines mul-
ti-feature fusion based on the YOLOv3 algorithm.
The Skip-YOLO model has been shown in Fig-
ure 5. First, a 7×7 convolution kernel is used to ex-
tract the original image information, which can en-
hance the receptive field of shallow feature. The
sensitivity of the shallow network to the same gar-
bage also can be improved. Secondly, the darknet
framework is improved by the jump feature of dense
blocks, which achieves the sharing of shallow and
deep high-level semantic information. In order to
improve the detailed information and the ability of
the model expression, a deeper dense block is con-
structed to extract deep detailed features at different
scales. Finally, the high-dimensional feature map-
pings of different scales are fused and sent to the
YOLO layer to achieve end-to-end regression. As-
suming that there are 4 convolution units in a dense
block, and each unit outputs m dimensional features,
then each dense block will output 4m dimensional
features. Among them, each layer of dense block
learned fewer garbage features and the output infor-
mation is relatively scattered. Therefore, the actual
dimension of output feature mappings is much larger
than the theoretical estimate. In order to make more
effective use of the features extracted by dense
blocks, this paper designs a CBL convolution block
to compress scattered convolution information in the
previous layer of the YOLO layer. CBL is consist of
one 3×3 convolution layer and the number of convo-
lution kernels is equal to the out-put feature convo-
lution dimension. The BN [31] operation and Leaky
activation function will be performed after convolu-
tion.
Figure 5: The structure of improved model.
4 Experiments Results and Discussion
4.1 Dataset
We shoot common domestic garbage images in
the grass, pavement, dormitory and other scenes us-
ing the Nikon D5300 camera. The original size of
each image is 3020×3020×3, and the color channel is
RGB. Among them, the outdoor background mainly
includes dark grass, light grass, mud, concrete and
streets, and the indoor background mainly includes
dormitory and black garbage bag. In addition, this
paper divides garbage into recyclable garbage,
non-recyclable garbage, harmful garbage and other
garbage. Therefore, our data set contains two or more
kinds of similar garbage. For example, harmful gar-
bage includes batteries and medicine bottles etc. In
order to better test the generalization ability of our
approach, the sample distribution of the dataset needs
to be complicated. So, our dataset contains 304 sin-
gle-class images and 914 multi-class images. The
results of the ablation experiment show that the
deeper backbone increases the complexity of deep
learn model, which helps to extract the characteris-
tics of the garbage in different backgrounds. Howev-
er, background information similar to garbage char-
acteristics can easily be misidentified. The ability to
distinguish background information and features can
be improved by a suitable K value.
4.2 Implement Details
All the experiments in this paper performed on a
laptop computer (Intel (R) Core (TM) i7-9700H CPU
@ 2.6GHz, GPU GeForce RTX 1660Ti (6G), 16GB
RAM, Windows10-64bit. Deep learning framework
is Darknet with CUDA10.1 version and cudnn7.6.4
neural network acceleration library). The size of all
images is resizing to 416×416 before training. The
training process uses multi-scale and iterative learn-
ing strategies. Among them, all experiments set the
initial learning rate to 0.001, the learning rate decay
coefficient to 0.1, the weight decay coefficient to
0.0005, and the momentum to 0.9.
4.3 Evaluation Metrics
In the field of object detection, common model
evaluation standards include accuracy (P), recall rate
(R), F1 score, average accuracy (AP, mAP, etc). The
calculation formula is as follows:
P 100%TP
TP FP
(3)
R 100%=(1- ) 100%TP FN
TP FN T
(4)
1 2
P RF
P R
(5)
in which, TP is the correct number of positive sam-
ples predicted; FP is the number negative samples
mistaken as positive samples; FN is the number of
positive samples mistaken as negative samples. Both
AP and mAP can represent the average accuracy of
the model. The difference is that AP can measure the
performance of the model in some category; while
mAP can measure the overall performance of the
model. In practical applications, AP50, AP75 and oth-
er indicators are commonly used to evaluate model
performance. For example, AP50 represents the de-
tection accuracy of the model when the IOU thresh-
old is 50%. The relationship between AP and mAP is
as follows:
1
1AP
n
i
i
m APn
( 1,2,..., )i n (6)
4.4 Ablation Study
This paper explores the performance of the
Skip-YOLO through the ablation experiments. The
backbone of Skip-YOLO consists of four different
dense blocks, which can set a different growth rate K.
In the same scale, the dense jump network can stack
the input features sequentially in the channel dimen-
sion, and the influence of the amount of information
contributed by different feature stacks on the model
can be further analyzed through the appropriate K
value. Therefore, the ablation experiment in this arti-
cle first obtains three different models by adjusting
the backbone depth. Secondly, based on the back-
bone with the best performance, other different mod-
els are obtained by adjusting the growth rate K. Fi-
nally, we analyzed the qualitative and quantitative
comparison results of the experiments.
The results of the quantitative comparison are
shown in Table 1 and Figure 6. It can be seen that the
Skip-YOLO-0 with the deepest layer has an AP50
slightly lower than the Skip-YOLO-4 by 0.26%. But
the mAP50 reached 90.38%, indicating that a deeper
backbone is good for fitting complex data in complex
background. From Figure 6 (a) and (c), it is found
that the average accuracy of the Skip-YOLO-0 is
steadily increasing and the loss function fluctuation
is small. It can be seen from Figure 6 (b) and (d) that
the change of accuracy curves after adjusting the K
value are not much different. When the K value is 32,
the change of the loss curve is the most stable. The K
value has a more significant impact on model com-
plexity compared with the depth of backbone.
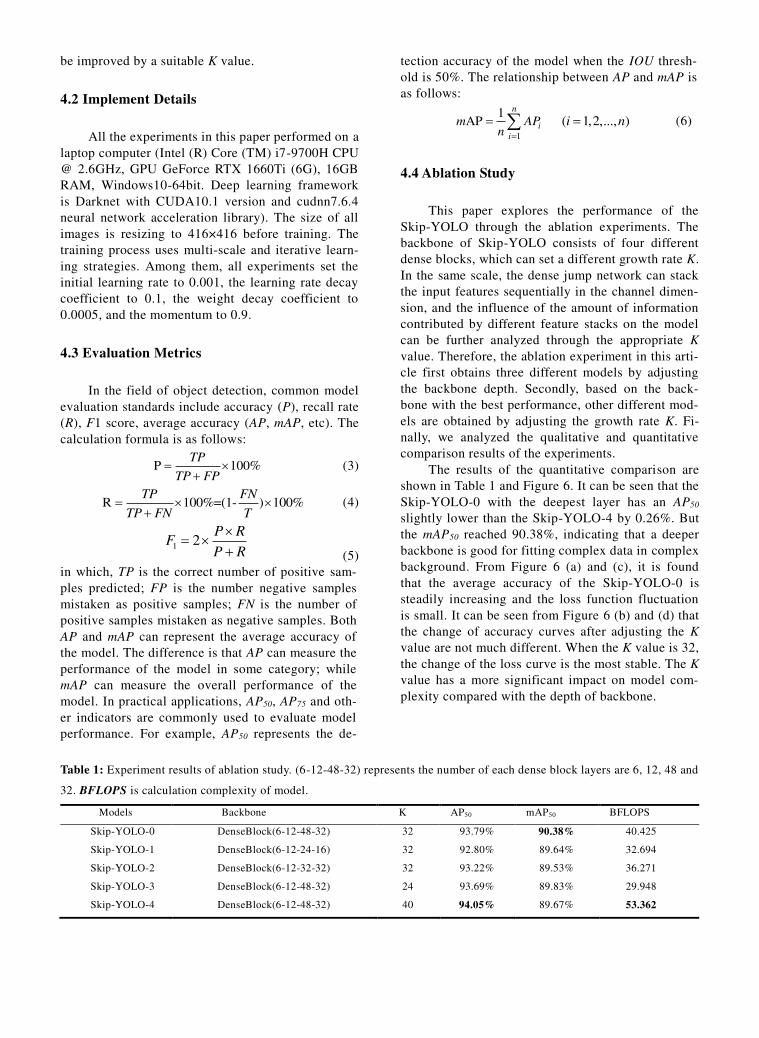
Table 1: Experiment results of ablation study. (6-12-48-32) represents the number of each dense block layers are 6, 12, 48 and
32. BFLOPS is calculation complexity of model.
Models Backbone K AP50 mAP50 BFLOPS
Skip-YOLO-0 DenseBlock(6-12-48-32) 32 93.79% 90.38% 40.425
Skip-YOLO-1 DenseBlock(6-12-24-16) 32 92.80% 89.64% 32.694
Skip-YOLO-2 DenseBlock(6-12-32-32) 32 93.22% 89.53% 36.271
Skip-YOLO-3 DenseBlock(6-12-48-32) 24 93.69% 89.83% 29.948
Skip-YOLO-4 DenseBlock(6-12-48-32) 40 94.05% 89.67% 53.362

Figure 6: Quantitative comparison of ablation study
As shown in the first row of Figure 7, the
Skip-YOLO-0 with the deepest network layer and the
Skip-YOLO-4 with the largest K value perform sin-
gle class detection, both of which incorrectly detect
the white lights background as recyclable garbage
and harmful garbage. And both types of garbage,
have some characteristic similar to white light.
Therefore, when the model has a deeper backbone or
a larger K value, its ability to express detailed infor-
mation will be strong. However, irrelevant back-
ground information may be mis detected as the ob-
ject. As the results shown in the third row of Figure 7,
when the Skip-YOLO-0, 1 and 2 models detect a
large single object, the shallower backbone has poor
regression performance. Among them, shallowest
network (Skip-YOLO-1) even has a false detection.
Comparing Skip-YOLO-0, 3 and 4, it can also be
found that when the K value decreases, the predicted
box becomes smaller, and when the K value increases,
the model can eventually learn more features. How-
ever, it is possible to mistake the redundant back-
ground as the feature of the detection object. As
shown in the second row of Figure 7, the false and
missed detection of Skip-YOLO-1 are obviously if
the object is centralized distribution. When the
number of network layers decreases, the probability
of false detection will be increased. However, the
Skip-YOLO-3 has the best detection effect because
the K value is the smallest. The fourth row of Figure
7 has evenly object distributed. Compared with
Skip-YOLO-0, 1 and 2, it can be found that the
Skip-YOLO-1 has no false detection. Comparing
Skip-YOLO-0, 3 and 4 can also find that reducing
the K value can effectively improve the detection
performance in the deep network.

Figure 7: Qualitative comparison of ablation study. From left to right: Skip-YOLO-0, Skip-YOLO-1, Skip-YOLO-2,
Skip-YOLO-3, Skip-YOLO-4. Harmful garbage, recyclable garbage, non-recyclable garbage and other garbage are marked by
green bounding boxes, purple bounding boxes, red bounding boxes and cyan-blue bounding boxes respectively.
4.5 Analysis of Different Model
As shown in Table 2, the average accuracy of
AP-N and AP-O is lower. The reason is that the
characteristics of similar garbage are very different,
which makes the data fluctuate greatly during the
training process, and ultimately affects the detection
accuracy of the model. In addition, the improved
model is much deeper than the YOLOv3, which
makes the detection more time-consuming, but the
detection accuracy is better. It can also be seen from
in Figure 8 that the classification and recognition
ability of our approach is significantly better than
YOLOv3. Comparing the first column and the sec-
ond column of Figure 9, it is found that the YOLOv3
mistakenly detects harmful garbage (expired drugs,
batteries, etc.) as other garbage in the single class
detection. When the object is small and the position
is relatively scattered, the redundant background will
be wrongly detected as the garbage. Comparing the
third column and the fourth column of Figure 9
shows that the YOLOv3 has serious missed detection.
Although our approach has some error detection, the
improvement of generalization performance makes
more targets successfully identified.
The comparison of generalization performance
has been shown in Figure 10. the detection effects of
YOLOv3 and our approach both perform relatively
well when the trained images are selected for testing.
But the YOLOv3 has different degrees of error or
missed detection when using untrained images for
the same testing. For example, in the second column,
other garbage is detected as recyclable garbage.
Based on the confusion matrix generated from the
untrained image, it can be seen that our approach has
a better recognition effect on various types of gar-
bage. Because dense block can selectively learn a
small amount of effective information when fitting a
data set, which can effectively alleviating data fluc-
tuations and improve the generalization performance.

Table 2: Quantitative comparison of different models. The recyclable garbage, non-recyclable garbage, harmful garbage and
other garbage are denoted by R, N, H, and O respectively. And average ac-curacy is represented by AP-R, AP-N, AP-H and
AP-O respectively.
Models AP-R AP-N AP-H AP-O mAP50 T/ms mRecall
YOLOv3 91.12% 56.32% 90.32% 54.93% 73.17% 163.85 75.73%
Skip-YOLO-0 96.07% 81.48% 95.20% 88.77% 90.38% 286.68 89.81%
Skip-YOLO-4 95.68% 79.49% 96.89% 86.61% 89.67% 303.41 88.72%
Figure 8: Quantitative comparison of different models. (a) is F1-Score curves. It is a common indicator for classification
problems. (b) is PR curves. The curve with good performance will completely cover the curve with poor performance.
Figure 9: Qualitative comparison of different models.

Figure 10: Generalization performance comparison of different models. From top to bottom: YOLOv3, Skip-YOLO.
5 Instance of Application
As shown in Figure 11, a common industrial
camera is used to detect the moving domestic waste
on the conveyor belt, which is used to simulate the
application in the waste sorting production line. Part
of the detection effect is shown in Figure 12. Alt-
hough some objects and the backgrounds have not
been trained, the deep learning method still has a
certain detection effect. Among them, YOLOv3 mis-
takes the background as other garbage, and the error
detection is more serious. In contrast, our method is
not affected by unfamiliar backgrounds although
there are some missed detections and false detections.
The main reason for false detection and missed de-
tection is that there are some untrained new objects
in the detection. Therefore, our approach needs to
retrain the new garbage targets that need to be de-
tected to reduce the interference caused by the new
targets in practical applications.
Figure 11: Simulation work bench.
Figure 12: Part of the test results. The first row is our
approach. The second row is YOLOv3.
6 Conclusion
Aiming at the problems of small similarity of
domestic waste characteristics and complex scenes,
this paper proposes a Skip-YOLO model for the in-
telligent detection of domestic waste. Firstly, this
paper visualizes the feature mappings in different
neural networks. Secondly, the backbone network has
been improved by dense blocks, which helps to ex-
tract high-quality high-dimensional feature mappings
and suppress deep network overfitting. Finally,
high-dimensional feature mappings of different
scales will be fused and garbage detection will be
completed through the YOLO layer. Through abla-
tion experiments, it is found that a deeper backbone
has stronger ability of feature expression. But there
is a risk of mis checking the redundant background at
the same time. Therefore, setting a reasonable growth
rate of dense blocks can prevent excessive learning
of background features and control the size of
bounding box. The experimental results show that
compared with the YOLOv3, our approach increases
mAP50 by 22.5%, and the average recall rate in-
creases by 18.6%. Among them, the precision of
non-recyclable garbage and other garbage reached
81.48% and 88.77% respectively. And our approach

performed well in qualitative experiments and the
waste sorting production line. Of course, the method
in this paper also has follow-up improvements. For
example, in view of the time-consuming problem of
densely connected networks, a lightweight network
can be tried to optimize the detection speed. In the
future, we will study the real-time detection method
of domestic waste. And further apply it to garbage
sorting production line.
Availability of data and materials
The dataset of this paper is available online, the
contact E-mail is [email protected]
Abbreviations
P: Precision. P is the accuracy of detection.
R: Recall Rate. R is the percentage of the num-
ber of correctly detected targets to the total number
of targets.
F1: F1 Score. F1 is a parameter to evaluate
model performance.
AP: Average Precision. AP is the average accu-
racy of the model.
IOU: Intersection over Union. IOU is the ratio
of the intersection of the predicted bounding box and
the ground true bounding box to the union.
AP50: AP50 indicated that the average accuracy
when the IOU threshold is 0.5.
AP75: AP75 indicated that the average accuracy
when the IOU threshold is 0.75.
AP-R: AP-R is the average accuracy of recy-
clable garbage.
AP-N: AP-N is the average accuracy of
non-recyclable garbage.
AP-H: AP-H is the average accuracy of harmful
garbage.
AP-O: AP-O is the average accuracy of other
garbage.
References
[1] H. Xiao, Z. Li, X. Jia et al, Chapter 2 - Waste to energy in a
circular economy approach for better sustainability: a compre-
hensive review and SWOT analysis [J], Waste-to-Energy, 2020,
23-43.
[2] S. B. Atitallah, M. Driss, W Boulila et al, Compliance with
household solid waste management in rural villages in develop-
ing countries [J], Computer Science Review, 2020, 38:100303.
[3] F. Wang, Z. Cheng, A. Reisner et al. Compliance with house-
hold solid waste management in rural villages in developing
countries [J], Journal of Cleaner Production, 2018, 202: 293-298.
[4] D. Gabriel, J. Toutouh, S. Nesmachnow. Exact and heuristic
approaches for multi-objective garbage accumulation points
loca-tion in real scenarios [J], 2020, 105:467-481.
[5] N. Leeabai, C. Areeprasert, C. Khaobang. The effects of color
preference and noticeability of trash bins on waste collection
performance and waste-sorting behaviors [J], Waste Management,
2021, 121:153-163.
[6] S. Das, B. Kr.Bhattacharyya. Optimization of municipal solid
waste collection and transportation routes [J], Waste Manage-
ment, 2015, 43:9-18.
[7] C. Cheng, R. Zhu, R. G.Thompson et al. Reliability analysis for
multiple-stage solid waste management systems [J], Waste Man-
agement, 2021, 120:650-658.
[8] H. Zhao, F. Liu, H. Liu et al. Comparative life cycle assessment
of two ceramsite production technologies for reusing municipal
solid waste incinerator fly ash in China [J], Waste Management,
2020, 113:447-455.
[9] L. Alibardi, T. F.Astrup, F. Fabiano et al. Organic waste biore-
fineries: Looking towards implementation [J], Waste Manage-
ment, 2020, 114:274-286.
[10] F. Xu, Q. Huang, H. Yue et al. Reexamining the relationship
between urbanization and pollutant emissions in China based on
the STIRPAT model [J], 2020, 273:111134.
[11] S. Xiao, H. Dong, Y. Geng et al. Policy impacts on Municipal
Solid Waste management in Shanghai: A system dynamics model
analysis [J], Journal of Cleaner Production, 2020, 262:121366.
[12] Z. Wen, S. Hu, et al. Design, implementation, and evaluation of
an Internet of Things (IoT) network system for restaurant food
waste management [J], Waste Management, 2018, 73:26-38.
[13] Sunayana, S.Kumar et al. Forecasting of municipal solid waste
generation using non-linear autoregressive (NAR) neural models
[J], 2021, 121:206-214.
[14] O. I. Funch, R. Marhaug, S. Kohtala et al. Detecting glass and
metal in consumer trash bags during waste collection using con-
volutional neural networks [J], Waste Management, 2021,
119:30-38.
[15] W. Mao, W. Chen, C. Wang et al. Recycling waste classifica-
tion using optimized convolutional neural network [J], Resources,
Conservation and Recycling, 2021, 105132.
[16] K. He, X. Zhang, S. Ren et al. "Deep Residual Learning for
Image Recognition," Conference on Computer Vision and Pattern
Recognition, Las Vegas, NV, 2016, pp. 770-778.
[17] O. Adedeji et al. Intelligent Waste Classification System Using
Deep Learning Convolutional Neural Network [J], Procedia
Manufacturing, 2019, 35:607-612.
[18] M.W Rahman, R. Islam, A. Hasan et al. Intelligent waste man-
agement system using deep learning with IoT [J], Journal of King
Saud University-Computer and Information Sciences, 2020.
[19] W. Sterkens, et al. Detection and recognition of batteries on
X-Ray images of waste electrical and electronic equipment using
deep learning [J], Resources, Conservation and Recycling, 2020,
105246.
[20] P. Nowakowski et al. Application of deep learning object clas-
sifier to improve e-waste collection planning [J], Waste Man-
agement, 2020, 109:1-9.
[21] P. Davis, F. Aziz, M. Tanvi et al. The classification of construc-
tion waste material using a deep convolutional neural network [J],
Automation in Construction, 2021, 122:103481.
[22] H. Panwar, et al. AquaVision: Automating the detection of
waste in water bodies using deep transfer learning [J], Case
Studies in Chemical and Environmental Engineering, 2020,

2:100026.
[23] J. Bai, S. Lian, Z. Liu et al. Deep Learning Based Robot for
Automatically Picking Up Garbage on the Grass [J], IEEE
Transactions on Consumer Electronics, 2018, 64:382-389.
[24] J Redmon, A Farhadi, Yolov3: An incremental improvement -
arXiv preprint arXiv:1804.02767, 2018
[25] S. Kong, M. Tian, C. Qiu et al. IWSCR: An Intelligent Water
Surface Cleaner Robot for Collecting Floating Garbage [J], IEEE
Transactions on Systems, Man, and Cybernetics: Systems, 2020,
1-11.
[26] G. Huang, Z. Liu, L. van der Maaten et al. Densely Connected
Convolutional Networks [J], Computer Vision and Pattern
Recognition, 2017, arXiv:1608.06993v5
[27] Y. Li, Y. Lu and J. Chen. A deep learning approach for real-time
rebar counting on the construction site based on YOLOv3 detec-
tor [J], Automation in Construction, 2021, 124:103602.
[28] D. Wu, Q. Wu, X. Yin et al. Lameness detection of dairy cows
based on the YOLOv3 deep learning algorithm and a relative
step size characteristic vector [J], Biosystems Engineering, 2020,
189:150-163.
[29] S. Jamiya, E. Rani P. LittleYOLO-SPP: A delicate real-time
vehicle detection algorithm [J], Optik, 2021, 225:165818.
[30] T. Lin, P. Dollar, R. Girshick et al. Feature Pyramid Networks
for Object Detection [J], Computer Vision and Pattern Recogni-
tion, 2016, arXiv:1612.03144v2
[31] S. Ioffe and C. Szegedy. Batch Normalization: Accelerating
Deep Network Training by Reducing Internal Covariate Shift [J],
Machine Learning (cs.LG), 2015, arXiv:1502.03167v3
[32] X. Glorot, A. Bordes, Y. Bengio. Deep Sparse Rectifier Neural
Networks[J]. Journal of Machine Learning Research, 2011,
15:315-323.
K.Simonyan et al. Very Deep Convolutional Networks for
Large-Scale Image Recognition [J], 2014, arXiv 1409.1556
Competing Interests
The authors declared that they have no conflicts
of interest to this work.
Funding
This document is the results of the research
project funded by Postdoctoral Foundation Project of
Shenzhen Polytechnic (6021330001K) and the Na-
tional Natural Science Foundation of China under
Grant 52065035.
Acknowledgement
The authors would like to thank several anony-
mous reviewers and the editor for their comments
and suggestions.
Contribution Statement
Lun Zhao and Yunlong Pan contributed equally
to this work.
Lun Zhao: Data curation, Methodology, Vali-
dation, Writing-Original draft preparation.
Yunlong Pan: Data curation, Methodology,
Validation, Writing-Original draft preparation.
Sen Wang: Conceptualization of this study,
Methodology.
Liang Zhang: Methodology, Validation and
Software.
Md Shafiqul Islam: Methodology and Con-
ceptualization of this study.
Authors Information
LUN ZHAO received the Ph.D. degree in Me-
chanical Design and Theory from Kunming Univer-
sity of Science and Technology, Kunming, China, in
2018. He is currently worked as a post-doctoral re-
searcher in Shenzhen Institutes of Advanced Tech-
nology, Chinese Academy of Sciences, Shenzhen,
China. His research interests cover new technol- ogy
of sheet joining, additive manufacturing and machine
learning.
YUN LONG PAN received his B.S. degree
from City College of Dongguan University of Sci-
ence and Technology in 2019. Now he is pursuing
his M.S degree in Kunming University of Science
and Technology. His main research interests include
machine vision detection and deep learning algo-
rithms.
SEN WANG received the Ph.D. degree in the
di- rection of mechanical and electronic engineering
from Kunming University of Science and Technol-
ogy, Kunming, China, in 2017. He is currently a lec-
turer with the Faculty of Mechanical and Electrical
Engineering, Kunming University of Science and
Technology. His research interests concentrate on
image processing, computer vision and deep learn-
ing.
LIANG ZHANG received the Ph.D. degree in
Materials Science and Engineering from Haerbin
Institute of Technology, Haerbin, China, in 2013. He
is an Associate Professor in Shenzhen Polytechnic,
Shenzhen, China. His research interests include ad-
ditive manufacturing and welding.
MD SHAFIQUL ISLAM received his Ph.D.
degree in mechanical engineering from Blekinge
Institute of Technology, Blekinge, Sweden, in 2019.
He is currently working as a postdoctoral researcher
at Faculty of Mechanical Engineering, Blekinge In-
stitute of Technology. His research interests cover
fracture mechanics, constitutive modelling and ma-
chine learning.

Supplementary Files
This is a list of supplementary �les associated with this preprint. Click to download.
testdemovideo.rar