Skills shortages and funding gaps skills...3. Positive economic benefits from acquiring medium skill...
34
Skills shortages and funding gaps An analysis of the costs of under-investment in skills May 2019
Transcript of Skills shortages and funding gaps skills...3. Positive economic benefits from acquiring medium skill...

Skills shortages
and funding gaps An analysis of the costs of
under-investment in skills May 2019

1
Content
INTRODUCTION 1
LOGIC CHAIN 3
FINDINGS AND RECOMMENDATIONS 4
FINDINGS 4
HEADLINE RECOMMENDATIONS 6
GROWING SKILLS SHORTAGES 7
AN ANALYSIS OF JOB OPENINGS 7
AN ANALYSIS OF JOB OPENINGS 10
JOB OPENINGS AND JOB POSTINGS 12
SKILLS SHORTAGES ACUTE FOR MANY INTERMEDIATE ROLES 13
LOWER UNEMPLOYMENT, MIGRATION AND HIGHER EDUCATION UNLIKELY TO
MEET DEMAND 16
LOWER UNEMPLOYMENT 16
MIGRATION 18
HIGHER EDUCATION: HIGH COSTS AND EXACERBATING ‘OVER-EDUCATION’ 19
CURRENT STUDY PROGRAMMES AND NEW T LEVELS ARE UNAFFORDABLE, EVEN
AT MAXIMUM EFFICIENCY 20
QUANTIFYING INCREASING SKILLS SHORTAGE – A FORECAST 26
QUANTIFYING THE RETURN ON INVESTMENT – A FORECAST 30
CONCLUSIONS 31
RECOMMENDATIONS 32

2
Introduction
A consensus has emerged in the last 18 months or so that we need to do more as a
country to improve education and skills if we are to have an inclusive and vibrant
economy. This paper takes that premise, sets out some of the evidence which supports
it, measures it up against the Government’s policy ambitions and shows, quite simply,
that current funding levels are inadequate. It then goes on to show the impact of that
lack of investment as a cost to our economy.
The Government’s Industrial Strategy aims to boost productivity across the whole
country by backing business to create good jobs and increase earning power via
investment in skills, industries and infrastructure. It does so in the context of stubbornly
low UK workforce productivity, falling investment in skills and growing skills shortages.
These will get worse as experienced people retire and because employers will not be
able to rely on the same flow of skilled workers from the rest of Europe in the 2020s nor
from young people entering the labour market.
The government’s education policies to tackle these issues include T Levels at Level 3,
Higher Technical Qualifications at Levels 4 and 5 and the National Retraining Scheme
for adults. This paper simply shows how the lack of funding will undermine the chances
of these succeeding.
We have looked specifically at Level 3 programmes for 16 to 19-year-olds in order to
make the case. In this area alone, our analysis suggests that there could be £3.3 billion
in lost output between 2019 and 2024 if funding issues are not addressed. £1.7 billion
of this lost output relates to STEM-relevant T Level routes of Engineering and
Manufacturing, Digital, Health and Science.
AoC will publish a 2019 spending review paper in June 2019 which identifies the wider
investment and policy actions required to tackle the issues identified here.1
One key recommendation we make here is for the base rate to increase by £1000 for all
study programmes. T Levels will be an important part of a broader programme that
includes A Levels, Apprenticeships, Higher Technical and sizable transition phase
programmes.
Critically, we will push for this even if a full spending review does not happen. At the
very least we will be urging the Chancellor to make it a ‘base-rate Budget’ in November
even if the wider considerations we believe in have to wait for a further year.
David Hughes, Chief Executive Officer, Association of Colleges
May 2019
The Association of Colleges (AoC) represents more than 90% of the 251 colleges in England incorporated under the
Further and Higher Education Act 1992.

3
Logic chain
RAB = Resource Accounting and Budgeting (the estimated cost to government of borrowing to
support the student finance system in loans not paid back), NPV = Net Present Value (gross).

4
Findings and recommendations
Findings
1. Growing skills shortages: Between 2011 and 2017, the Employer Skills
Survey has shown an increase in the density of vacancies employers find
hard to fill because of skills shortage, from 16% of all vacancies to 22%.2 In
part one of this report, we set out projections suggesting that jobs relevant
to T Level qualifications will have 2.5 million openings in the years to 2024,
simply to meet the needs of growth and replace exiting workers for jobs
requiring technical education to level 3 and above. The case for T Levels
was made in 2016 in the Sainsbury review of technical education.
Government endorsed this case in the Post-16 Skills Plan. Three years ago,
the labour market had significant slack3 but this is no longer the case. By
March 2019, the employment rate was 76.1% - a record high – while the
unemployment rate at 3.9% was the lowest in 44 years.4
2. Migration patterns and higher education are unlikely to fill demand: There
has been a tendency in recent years to fill jobs from a growing population
of EU nationals and from graduates, a tactic we will no longer be able to
rely upon. The government’s immigration plans are likely to hinder
international recruitment at intermediate skill levels but, even if there was
no change in the rules, there will be shifts. Poland, for example, already has
12% of its population living abroad and has seen a 40% improvement in
income per capita over 10 years resulting in less of an incentive to relocate
abroad.5 Meanwhile, availability of degree-qualified graduates is
constrained: DfE estimate a 5% fall in the volume of 18 to 24-year-olds
starting a degree between 2017/18 and 2021/22.6 At the same time, there
are already mismatches in the jobs that graduates fill. The Office for
National Statistics recently classified 16% of people as over-educated for
their role7. This could add pressure on the already-expensive 45% RAB
charge (Resource Accounting and Budgeting – the estimated cost to
government of borrowing to support the student finance system).
2 M Winterbotham et al (2018). Employer skills survey 2017. Research report. London: Department for education. 3 “… we have a serious shortage of technicians in industry at a time when over 400,000 16-24 year olds are unemployed.”
p.6, D Sainsbury et al (2016). Report of the Independent Panel on Technical Education. London: Gatsby Charitable
Foundation. 4 ONS (2019). Labour market overview, UK: March 2019. Newport: Office for National Statistics. 5 Data from UN Population Division for 2015 and Eurostat for 2008-2018, respectively. 6 DfE (2019). Student loan forecasts, England 2017-18. London: Department for Education. 7 ONS (2016). Analysis of the UK labour market - estimates of mismatch using measures of over and under education:
2015. Newport: Office for National Statistics.

5
3. Positive economic benefits from acquiring medium skill levels: The further
education system is a critical contributor to raising the life chances of
young people across England, and in meeting the needs of employers for
technically proficient workers. Economic evidence demonstrates high and
sustained returns to further education courses; estimates in 2013/14
suggest that for every Level 2 and 3 college-taught qualification started,
£66,000 - £68,000 of net present value is created. In the same year,
aggregating NPV (Net Present Value) across delivery volumes for these
qualifications resulted in a total of £41 billion, rising to £54 billion with the
inclusion of lower level qualifications including English and maths, and £79
billion with the inclusion of apprenticeships.8 Although the largest direct
return from technical education is in opening career opportunities, there
are wider benefits of learning. Longitudinal studies have demonstrated
concrete gains for learners in improved health, lower risk of
unemployment, and improved community participation.9
4. Government’s technical education reforms are at risk because of these
funding constraints: The technical education reforms have been designed
to improve the alignment of the further education system with labour
market demands, and to create a higher quality, more sustainable system.
The treasury allocated extra funds for these reforms in the autumn 2017
budget but T Levels will be more expensive to deliver because they will be
demanding and specialist. If government does not address the gap
between need and resources, the likelihood will be a drop in the positive
economic impact created by the FE system.
5. Current Level 3 study programmes and new T Levels are unaffordable,
even at maximum efficiency – We show in this report that funding levels for
existing Level 3 study programmes are unaffordable at current funding
rates. Specialist and technical provision is generally lossmaking for a
college. The more demanding, resource intensive and specialised T Levels
will add to delivery costs and result in even greater losses at the current
funding rate. As T Levels are introduced, colleges are likely to respond in
two ways:
• Limit their commitment to T Levels by putting a cap on student
numbers and/or specialisms to ensure programme viability. Colleges
have a social purpose but must also be financially responsible. They
can only cross-subsidise lossmaking provision within limits.
8 BIS (2015). Measuring the net present value of further education in England. Research Paper Number 228. London:
Department for Business Innovation & Skills. 9 T Schuller (2017). What are the wider benefits of learning across the life course? Foresight: Future of Skills & Lifelong
Learning. London: Government Office for Science.
6
• Focus delivery on cost-efficient courses. Colleges may be prompted to
focus on T Levels with lower costs or more generic skills outcomes
rather than STEM programmes which are more costly, speciaised and
have high-quality features.
The additional £500 million allocated to T Levels in the spring budget of
2017 will fund a 50% increase in programme hours and will bring the
English technical education system in line with other (overseas) successful
technical education systems in terms of contact hours. This will not address
the structural underfunding of further education as it is based on the
current base rate on per head and hour basis.
6. The economic impact of this gap could be £3.3 billion in lost output in the
next 5 years: Modelling on the basis of typical rates of job turnover against
projected demand from growth and replacement of exiting workers for
each T Level Route, and using skills shortage densities from the Employer
Skills Survey 2017, we calculate £3.3 billion in lost output between 2019 and
2024. We used conservative assumptions in reaching these figures, relating
them only to relevant occupations where level 3 or higher qualifications are
the norm. We assumed no worsening in the prevalence of skills shortages
impact in high value-added sectors. We estimate a £1.7 billion economic
impact in the STEM-relevant T Level Routes of Engineering and
Manufacturing, Digital and Health and Science.
Headline recommendations
1. The current base rate is insufficient and will undermine the important T
Level reform programme, the transition phase programme and ultimately
the industrial strategy. A 16-19 base rate increase of £1000 is needed to
ensure colleges can viably offer a range of programmes that meet the
needs of employers and local communities.
2. Programme cost weightings need immediate review for STEM based
programmes.
3. A new capital budget is needed to support these reforms.
4. Further research on the sufficiency and viability of apprenticeships, adult
education and college HE programmes needs to be undertaken.

7
Growing skills shortages
1. There is a high demand for skills covered by existing and future Level 3
technical qualifications.
An analysis of job openings
2. EMSI’s 10 labour market intelligence dataset contains estimates of jobs by
occupation, industry and location using time series regressions of past data
drawn from the following public sources:
• Business Register Employment Survey (jobs by industry by area)
• Annual Business Inquiry (jobs by industry by area before 2009)
• Labour Force Survey (staffing patterns, occupation demographics)
• Working Futures (occupation replacement rates)
• DEFRA statistics (jobs for the agricultural sector by area)
3. The dataset contains estimates of job numbers using job totals from the
Business Register and Employment Survey (defined using the Standard
Industrial Classification or SIC codes).Each industry’s jobs are allocated to
occupations using a staffing pattern matrix constructed from Labour Force
Survey data.11 Projections are based on past trends up to 2017, Workforce
Jobs data for 2018 and then extrapolated into the future to evaluate future
job demands.
4. For this analysis, we used a set of T Level occupational maps to map
occupations to T Level routes using Standard Occupational Codes (SOC).
the Gatsby Charitable Foundation12 produced the first versions of
occupational maps with SOC coding. The Institute for Apprenticeships and
Technical Education (IFATE)13 keeps the official England version of these
maps but without SOC codes. EMSI supplied codes which are used in this
10 EMSI is company that provides data analysis to organisations in the education, economic development and
employment sectors in the US, Canada, UK and Australia 11 All sources originally ONS. Data are estimated for England only. 12 Gatsby is a Charitable Foundation set up by David Sainsbury to achieve his charitable objectives. Gatsby’s work in
education is intended to strengthen science and engineering skills in the UK by developing innovative programmes and
informing national policy 13 The Institute for Apprenticeships and Technical Education is an employer led crown Non Departmental Public Body.
IFATE oversees the development, approval and publication of apprenticeship standards and assessment plans as well as
the occupational maps for T Levels and apprenticeships.

8
analysis; reflecting the move to focus T Levels on Level 3 qualifications, all
occupations where workers typically hold Level 2 or lower qualifications
have been removed from the analysis. Note T Levels are not available in all
routes (some are covered by apprenticeships) and policy decisions around
higher technical qualifications are still to be made.
5. The occupational maps include cases where the same SOC unit group is
found in more than one route. To account for this, we divide the number of
jobs in that occupation according to its industry composition, so for
example if the occupation was found in the Agriculture route and the
Management route, the share of relevant jobs in SIC section A would be
allocated to the Agriculture route, and the remainder to the Management
route. There are also cases where the same occupation can be split across
the two qualification levels used for the route mappings (Technical – Level
3, and Higher Technical – Level 4-5). To account for this, we use the existing
proportions of each occupation’s workforce up to Level 3 and above Level 3
to divide occupations where they appear at more than one qualification
level.
6. The result of this analysis is show in Chart 1 which reports the openings
over the years 2019 to 2024 for each of the T Level Routes, broken down
between Technical (RQF level 3) and Higher Technical (RQF level 4-5) levels.
7. There are a number of findings:
• In 2018, there are 9,155,000 jobs in England in occupations which
feature in a T Level route at either technical or higher technical level.
• There are likely to be 447,000 new openings in 2019 created by
industry growth and the replacement of workers leaving the
workforce.
• In the five years to 2024, the EMSI estimate is that there will be
2,482,000 job openings to be filled.
• 916,000 of these job openings are at Technical level and 1,567,000
job openings at Higher Technical level, showing the need for
progression between levels.
• The largest route is Health and Science, with 428,000 projected
openings, followed by the more general Business and
Administration, and Sales, Marketing and Procurement. Engineering
and Manufacturing and Digital come in fourth and fifth. Each route
has been designed to represent a domain of technical expertise, with

9
several constituent pathways to allow for career specialisations.
Specialist staff will need to be found and trained to deliver these
pathways.
8. Job openings as set out here are a conservative measure of labour
demand. They account strictly for the need to fill jobs created by an
industry’s expansion or to replace workers who are leaving the labour
market entirely; they do not account for workers moving to other
occupations, or for straightforward job turnover as workers move between
jobs and employers.
Chart One: Projected job openings 2019-2024 by T Level Route and Occupation Level

10
An analysis of job openings
9. While openings provide an idea of the underlying ‘pull’ of labour demand,
they are therefore some distance from the day-to-day reality of labour
demand as employers experience it. For this reason, it is also worth
exploring data from online job postings to see the volume of recruitment
activity associated with each T Level Route and how this has evolved over
recent years.
10. Online job postings are collected from thousands of job boards every
month, Emsi’s Job Posting Analytics are gathered by trawling the Internet
for job boards advertising positions in the UK. As boards are identified, they
are added to the list for checking each day, and every posting is subjected
to a deduplication process to allow for the high level of repeat posting of
online job opportunities. The de-duplicated set of job postings are then
categorised across a range of taxonomies:
• Occupation and role (down to SOC 4-digit and Emsi’s own job title
taxonomy)
• Location (down to town level)
• Skills (using Emsi’s own skills taxonomy)
• Company
11. EMSI also monitor further, job postings to count the duration in days from
initial appearance online to their disappearance, allowing a degree of
measurement of how long employers are waiting to fill their vacancy. Salary
data is also available for more than 60% of postings, a level fairly consistent
across the occupational hierarchy.
12. Job postings do not give a perfect representation of recruitment activity, as
some jobs are not openly advertised online, and others are advertised on a
one-to-many basis. But during the last few years, there are strong
indications that most externally recruited jobs are advertised online, and
the volumes of advertised jobs found though online postings (averaging
638,000 per calendar month in England, Scotland and Wales) is relatively
stable across time.14
13. Chart 2 reports job postings for every route across Great Britain in 2016,
2017 and 2018.
14 All job postings in the data source are tagged by location and job title, categorised to UK SOC occupations. For this analysis, they are then categorised from UK SOC occupations to the T Level Routes using occupational maps. This allows for analysis at the Route level. Postings data are for England only.

11
Chart Two: Online job postings by route, 2016-2018
14. There has been growth in postings for Level 3 and above jobs in most
routes apart from Care and Hospitality (-15%) and Hair and Beauty (-6%). All
others have grown, with the fastest growth in postings for Legal, Financial
and Accounting (41%); Engineering and Manufacturing (24%) and Health
and Science (21%).

12
15. While most growth was achieved in the 2016/2017 period, postings in 2018
have for the most part maintained the levels seen in 2017.
Job openings and job postings
16. A comparison of job openings and job postings helps identify areas with
high recruitment turnover and job mobility. Chart 3 compares openings
and postings for each route:
Chart Three: Online job postings vs job openings

13
17. The most technically intense labour markets – Digital; Legal, Financial and
Accounting; Engineering and Manufacturing – have a high level of postings
relative to projected job openings. In Digital, for example, there were
601,000 job postings in 2018, compared to a projected 243,000 job
openings in the years to 2024. This reflects the intensive recruitment
activity in Digital and similar fields relative to the underlying need – and
therefore the need to allocate skilled labour efficiently as a critical scarce
resource for those labour markets. Getting skills in the right places at the
right time is particularly critical in fields such as software production or
engineering and manufacturing.
Skills shortages acute for many intermediate roles
18. The next analysis combines data collected in government’s large annual
survey of employers with EMSI’s job posting analysis. The Employer Skills
Survey 201715 measures skills shortages in each occupational area. Chart 4
identifies the composite skills shortage vacancy density by T Level Route.
The data presented is a set of multiples of skills shortage densities by total
postings across the year, and then grouping them into the T Level
groupings created for the earlier analysis.
19. There are a number of findings:
• Density rates (that is, the%age of vacancies ‘hard to fill because of
skills shortages’) ranging from 7% for Protective Services at the
Higher Technical level, through to 43% for Engineering and
Manufacturing and 42% for Hair and Beauty, both at the Technical
level.
• Digital has a density rate of 37% at the Higher Technical level, and
30% at the Technical level.
• The data suggests that skills shortage apply at both levels of the T
Level Routes: overall, 31% of Technical level T Level Route vacancies
are hard to fill because of skills shortages, and 27% of Higher
Technical T Level Route vacancies.
15 See https://www.gov.uk/government/publications/employer-skills-survey-2017-uk-report; occupation level data
sources via the lmiforall API.

14
Chart Four: Skills shortage vacancy densities, by T Level Route and Level
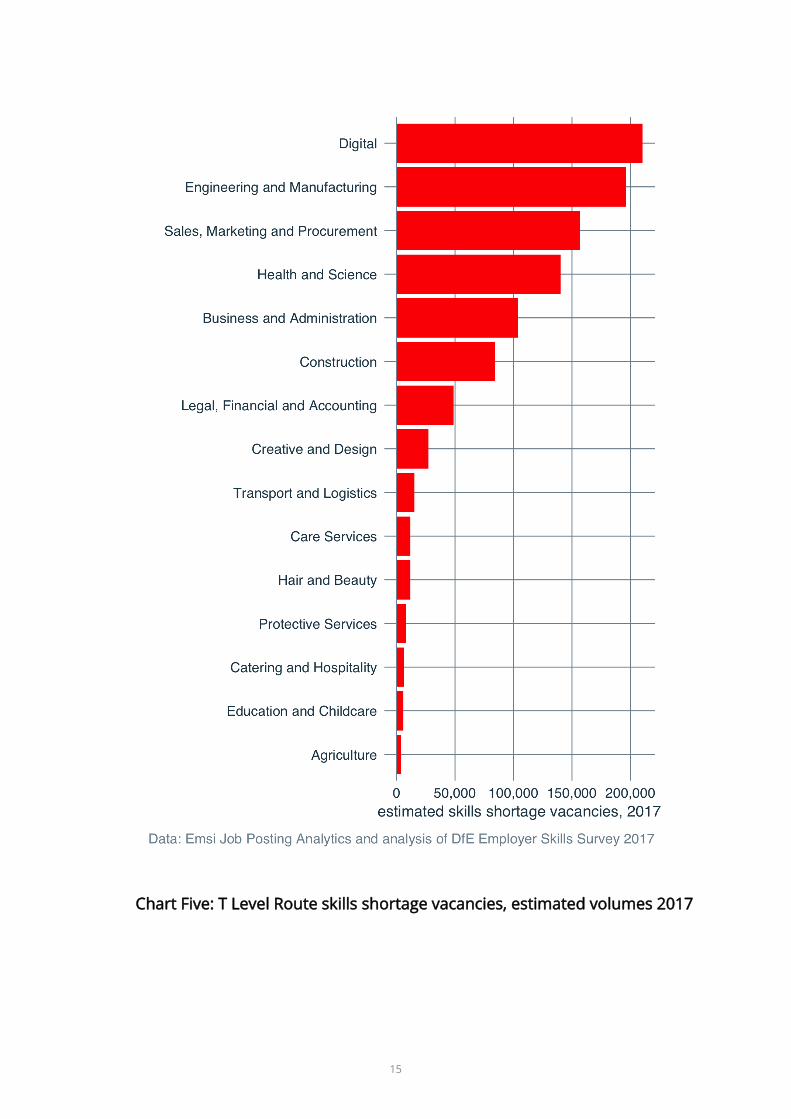
20. Chart 5 looks at the total number of vacancies for each T Level Route,
bringing the Employer Skills Survey skills shortage vacancy density rates
together with the Emsi UK Job Posting Analytics numbers of online
postings.
15
Chart Five: T Level Route skills shortage vacancies, estimated volumes 2017
16
21. In this analysis of recruitment challenges, despite their relatively lower
profile within the total number of job openings, many of the STEM fields
rise to much higher prominence: in 2017, Digital had an estimated 210,000
vacancies facing significant skills shortages, the largest number in any
route. Engineering and Manufacturing was second (196,000) and Health
and Science fourth (140,000).16
Lower unemployment, Migration and higher education
unlikely to meet demand
22. In the first section, we established that:
• the technical education labour market is substantial.
• this labour market is seeing sustained growth in underlying demand.
• As a result, there are skills shortages, which are most acute in the
STEM-intensive T Level Routes.
23. All of this could be a problem if the T Level channel of labour supply is
impeded either through colleges opting to lower their overall delivery
volumes or guiding students to less expensive and more generic course
choices. But it should be remembered that those leaving education are only
one source of labour supply, and so in this section we explore prospects for
other sources of supply. For example, the higher education system has
been an unintended supply for intermediate skills roles for a number of
years.
Lower unemployment
24. As of writing, the latest ONS (Office for National Statistics) Labour Market
Overview (March 2019) estimates a UK employment rate of 76.1%, the
highest on record, and an unemployment rate of 3.9%, the lowest since
January 1975. The labour market is as tight as the current workforce has
ever known it, with very little slack – while pay is only showing early signs of
response to the labour market’s tightness, non-pay measures of job quality
have seen more persistent improvement – e.g. the number reporting part-
time work because they couldn’t find full-time work has fallen from 1.4
million to 0.9 million over the last 5 years; and the number reporting
16 Possible because of the availability of monthly postings data, the volumes of skills shortage vacancies in this report are
estimated as a flow across the year 2017 and therefore differ to the stock approach of the Employer Skills Survey 2017.
17
temporary work because they couldn’t find permanent work has fallen
from 0.6 million to 0.4 million over the last 5 years.
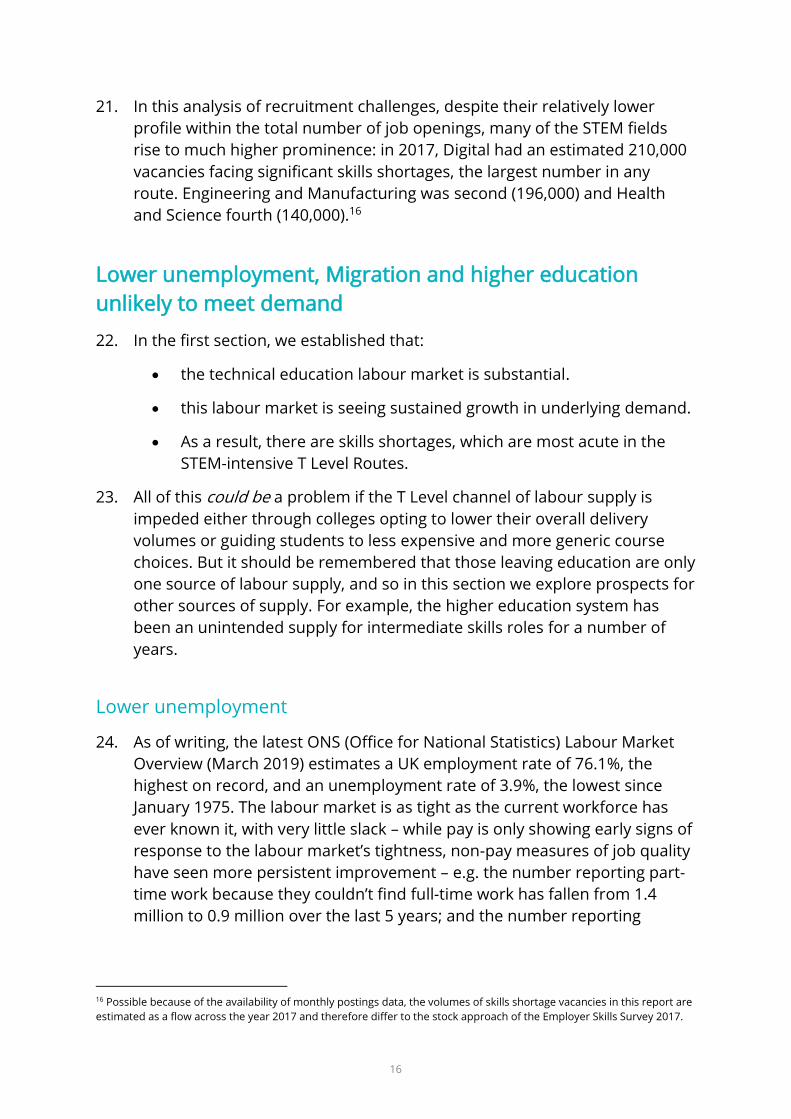
25. It is perhaps not surprising that this macroeconomic tightness translates
down to a sharp tightening of most local labour markets. Chart 6 uses data
from November in 2013 and 2018, shows the decline in the number of
jobseekers seeking work in occupations relevant to each T Level Route.17 In
all Routes there have been extremely sharp declines in the labour market
position over that five year period, meaning that there is no spare capacity
within the labour market to adjust to any positive shocks to demand.
Chart Six: Claimant count by route
17 Data are from the Nomis Jobseeker’s Allowance by occupation table, mapped from SOC 2000 to SOC 2010, and then
mapped over to T Level Routes.

18
Migration
26. Another potential source for filling T Level Route-relevant jobs is through
migrant workers. The UK has had a pronounced reliance on migrant labour
supply over the past decade, and especially since workers from EU
accession states were granted freedom of movement. From September
2008 to September 2018,18 the English labour market added into
employment a net increase of 1.05 million British nationals, 414,000 ‘A8’
nationals, 405,200 ‘Other EU15’ nationals, 301,000 ‘A2’ nationals, and then
72,000 from the rest of the world, moving from 92% British nationals in the
workforce to 88% British nationals in that time.
27. At the margin then, English employers have relied slightly more on foreign
national labour supply than domestic labour supply to meet expanding
labour demand over the past decade. But regardless of its value over that
decade, the signs are that migrant labour supply is likely to be constrained
in the years ahead, for a combination of reasons:
• The government’s immigration white paper sets out plans to end
freedom of movement from the EU and maintain controls on
migration.
• Brexit has already, through a combination of currency depreciation,
perception and prospective restrictions on residency, led to a fall in
the net inflow of EU workers19 .
• Limits to the potential EU migrant workforce, given cumulative
migration, especially from accession states20 and the rapid growth in
their own economies which will attract some migrants to return21.
28. The prospects are for external labour supply to play a smaller part than has
been the case over the past ten years, and so relying upon migration to
compensate for a shortfall in domestic skilled labour supply around
technical roles would seem ambitious.
29. Many have highlighted the impact Brexit could have on many forms of
foreign investment22, government will need to step-in and invest in skills
18 Analysis using the Nomis Annual Population Survey - regional - nationality table. 19 The ONS Long-Term International Migration statistics (down to 2009 levels, see ONS Migration Statistics Quarterly
Report, February 2019). 20 Trends in International Migrant Stock: Migrants by Destination and Origin, Table 16, UN Population Division
Department of Economic and Social Affairs estimates the are 4.5 million Poles living abroad (12 per cent of resident
population); 3.4 million Romanians (17 per cent); 1.2 million Bulgarians (17 per cent) 21 GDP per capita, euro per capita, chain linked volumes, via Eurostat sdg_08_10. Reports 40% growth in GDP per capita in
Poland over the last ten years; 30% growth in Romania and 27% in Bulgaria compared to 5.5% for the UK on the same
measure. 22 Dhingra et al (2016), The impact of Brexit on foreign investment in the UK,
https://cep.lse.ac.uk/pubs/download/brexit03.pdf

19
infrastructure to ameliorate impact that Brexit will have on the supply of
intermediate and higher technical skills.
Higher education: high costs and exacerbating ‘over-education’
30. The higher education system has been an unintended supply for
intermediate skills roles. At the the ‘higher technical’ level (levels 4 and 5 of
the Regulated Qualification Framework), there is a past pattern of using
degree-educated graduates (level 6 on the Regulated Qualifications
Framework) to meet many of these demands. A continued expansion in the
graduate supply could compensate for a shortfall in domestic skilled labour
supply around technical roles. Although graduates may not have skills
aligned to those roles, their higher levels of human capital may allow for
sufficient adaptability to perform in them. In practice, this argument fails
on the ground of feasibility, efficiency and efficacy.
31. On feasibility, HE participation has recovered well from its fall following the
move to the current tuition fee cap, reaching a new high 49.8% on the
2016/17 HE Initial Participation Rate.23 While further progress may be
achieved, it is unlikely that a substantial upward shift in participation is
achievable unless we have a substantial change to the financial regime. At
the same time, demographic trends over the coming years will not allow for
a substantial increase in the volume of participation; in fact, DfE forecasts
for OfS funded full-time HE undergraduate course entrants suggest a
decline over the years to 2022/23 driven primarily by declining cohort
population.24
32. In terms of efficiency, any increase in participation that could be achieved
would at the very least incur significant Exchequer costs given the current
estimated RAB charges. Current estimates from DfE is that students on full-
time HE courses will incur a 45% RAB charge25; this level has grown in
recent years, in part because of disappointing improvements in graduate
earnings since the end of the 2008-09 recession. This level of the RAB
charge means that although students pay a high cost through tuition fees,
the effective level of public subsidy also remains high as well.
23 HEIPR measures the likelihood of a young person participating in higher education by age 30. DfE Participation Rates in
Higher Education: Academic Years 2006/2007. 24 DfE Student loan forecasts, England 2017-18, “the number of 18-24 year olds [entering HE] is expected to fall by 5%
between 2017/18 and 2021/22”. 25 current level from student loan repayment model in DfE Student loan forecasts, England 2017-18.

20
33. Finally, in terms of efficacy, there is already substantial evidence that skills
mis-matches are frequent within the UK labour market.26 The latest
analysis by the ONS, comparing workers’ qualifications to their occupations,
has 16.1% of workers overeducated and 15.1% undereducated in 2015.27 As
we have already seen, technical roles already face high levels of employer-
reported skills shortage despite the perception of an ‘overeducated’
workforce28, casting doubt on the ‘adaptability’ thesis.
34. Leaving aside the contestable arguments of overeducation, an important
rationale for the technical education reforms is to create a labour market at
levels 4 to 5 (T Level ‘Higher Technical Level’), responding to a long-
identified need29 30 to develop this part of the English technical education
system31.
35. Institutes of Technology (IoTs) may help fill some of this gap, but more
needs to be done to support all colleges to expand their higher technical
offer. Revenue funding for colleges and IoTs needs to be put in place to
help develop a more substantial higher technical offer.
Current study programmes and new T Levels are
unaffordable, even at maximum efficiency
36. AoC carried out research into the costs of running study programmes and T
Levels in the following subject areas:
• Engineering
• Construction
• Science
• Digital
• Business Administration
37. This research is applicable to both technical, applied general and other
study programmes as they are funded by the same rate per hour and use
26 Work by OECD economists places Britain 10th out of 22 advanced economies for skills mismatch in 2011-12, primarily
driven by over-skilled workers. See M A McGowan and D Andrews (2015). Skills mismatch and public policy in OECD
countries, Economics Department Working Papers No.1210. Paris: OECD. 27 ONS (2016). Analysis of the UK labour market - estimates of mismatch using measures of over and under education:
2015. Newport: Office for National Statistics. 28 https://www.ifs.org.uk/publications/10531 29 Smith and White (2017) Where do all the STEM graduates go,
https://www2.le.ac.uk/departments/sociology/people/pwhite/TheemploymenttrajectoriesofSTEMgraduatesFINALREPORT
20180801.pdf 30 Dale-Harris (2019) https://www.hepi.ac.uk/2018/11/01/uk-far-behind-tertiary-education-enrolment/ 31 Espinoza and Speckesser (2019), A comparison of earnings related to higher level vocational/technical and academic
education’ http://cver.lse.ac.uk/textonly/cver/pubs/cverdp019.pdf

21
the same programme cost weighting factors. It will also apply to the
proposed transition phase programme which be an important pipeline in
to T Levels.
38. These subject areas were chosen to provide a wide range of assumed
delivery costs per programme.
There is no official guidance to colleges on budget setting, but work carried
out by McKinsey32 for HM Treasury in 2015 confirmed that the main drivers
of teaching costs are:
• Staffing mix.
• Teacher salaries.
• Teaching contact hours.
• Class or group size.
• Teaching hours per learner.
Our research collected the actual teaching costs by undertaking deep
dives in to a group of colleges from across England. Only direct delivery
costs (primarily teacher/technician pay plus direct non-pay costs) were
collected.
This model does not cover the full costs of running colleges. Colleges are
self-governing organisations and have full responsibility for the provision
of education and everything that supports it.
This means that college income needs to cover a range of non-teaching
costs including:
• the costs of running buildings (premises, maintenance and security).
• administrative services like finance and HR, IT, enrolment and
examination administration.
• support services to students including guidance, careers advice and
mental health services.
• catering and transport subsidies for lower income students where
these are not covered by grants.
• employer engagement and work experience co-ordination.
• enrichment courses.
• the revenue costs of keeping buildings and equipment up to date
(capital finance, depreciation).
32 BiS (2015), DFE and HMT Joint review of further education cost drivers.

22
• contributions to cover the costs of pension deficits.
• management costs.
These costs typically account for 50% of a college’s income which means
that courses need to make a minimum 50% contribution after teaching
costs to avoid a loss. This model is under pressure with recent pension
increases and on-going inflation.
39. We then created viability models using two sets of class size data:
• average class sizes from the research group.
• class size data collected in 2018 from a national class size survey.
The model used current staff utilisation data (98%) which shows that
colleges are already operating at capacity when it comes to deployment of
teaching staff.
This class size data identifies the average, maximum and reason for
maximum class size by level and subject sector area. In most cases the
reason for the maximum class size at level 3 (differentiated by subject) was
due to physical or health and safety restrictions in classrooms workshop
spaces. Class sizes and maximums are typically smaller for more ‘specialist’
provision such as engineering and larger for more general provision such
as business studies.
The results of this analysis are show in the following table. This shows that
all five programmes make a contribution below 50% which means that they
do not make an adequate contribution to central running costs and are
therefore loss-making but to varying amounts.
Key findings:
• Our small sample of colleges achieve an average class sizes of 17 in each
of the five learning areas. On current funding rates and cost weighting
factors and the new T Level formula, this produced contribution rates
ranging from 44.6% in digital to 31.6% in science.
• The national data for current class sizes for a wider range of colleges are
lower than our sample, ranging from 16 in digital to 12 in construction.
This reduces contribution rates to a range of 41.5% in digital to 19.3% in
science.

23
• A very small number of colleges in our national survey achieve higher
class sizes in the five areas, ranging from 18 in construction to 20 in
digital. The second table describes the sectors maximum class sizes. This
represents the maximum number of students that can be occupied, due
to health and safety or physical constraints.
• If these were achievable in all college across the country, then this would
secure a contribution rate just over 50% in two areas: business
administration and digital. The other three areas would still have
contribution rates well below that level, Construction and Science being
both below 40%.
Learning Area Actual Class Size (for the
research sample)
Contribution
Cost Weighting Factor
National Class Size
Contribution
Cost Weighting Factor
Engineering Class Size 17
41.4% contribution
CWF 1.3
Class Size 13
26.9% contribution
CWF 1.3
Construction Class Size 17
41.1% contribution
CWF 1.3
Class Size 12
21.9% contribution
CWF 1.3
Science Class Size 17
31.6% contribution
CWF 1.0
Class Size 14
19.3% contribution
CWF 1.0
Digital Class Size 17
44.6% contribution
CWF 1.2
Class Size 16
41.5% contribution
CWF 1.2
Business
Administration
Class Size 17
42.6% contribution
CWF 1.0
Class Size 15
36% contribution
CWF 1.0
Learning Area Maximum Class
Size PCWF
%age
Contribution
Engineering 19 1.3 46.4%
Construction 18 1.2 38.9%
Science 19 1 37.7%
Digital 20 1.2 52.1%
Business Administration 20 1 50.1%

24
40. A number of observations follow:
• It is highly unlikely that all colleges could achieve this maximum class size
because of physical constraints in buildings and because of the difficulties
associated with recruiting and retaining enough students on new
qualifications.
• On three different alternatives in terms of class size, the productivity
enhancing STEM subjects are unviable in terms of their contribution to
overall finances.
• In the short-term colleges, like other education organisations, cross-
subsidise different courses in their portfolio. This is just about sustainable
if a course covers a niche subject with a small proportion of total student
numbers and can also be done if other activities are generously funded.
The financial environment for colleges is no longer benign (if it ever was)
and the ambitions to attract more young people to take T Levels suggests
the qualifications will occupy more than a niche.
• It is within the capacity of government to adjust the funding rates to
ensure that T Levels and study programmes cover necessary costs. One
option for doing this would be to increase the cost weighting factors from
current levels. We calculate that the cost weighting for digital would need
to rise from 20% to 35% to secure a 50% contribution whereas
construction cost factors would need to rise from 30% to 100%. We think
that cost weightings would create unhelpful incentives for colleges and
other providers to run courses and would make the funding system
harder to administer. A better alternative would be to increase the core
funding rates and adjust upwards a number of STEM programmes.
• Our calculations suggest that the core 16 to 18 funding rate would need to
rise from £4000 to £5000 take account of pay trends, pension contribution
increases and inflation.
41. There are further issues which will constrain the uptake and viability of T
Levels:
• Exit requirements for English and maths will limit the number of
students able and willing to take courses due to the fact that
achievement and progression rates will be damaged if the student
does not pass.

25
• Placements – limited by the number of local employers regardless of
national or international demand for skills.
• Workshops and some classrooms have fixed maximum class sizes.
These limits are in place due to both space restrictions and health and
safety requirements.
• Colleges cannot currently afford to recruit or retain staff to deliver
more specialist areas, let alone to meet the needs of T Levels33.
42. The higher demands and greater specialisms of T Levels will add to delivery
costs and result in even greater losses at the current funding rate. As T
Levels are introduced, colleges are likely to respond in two ways:
• Limit their commitment to T Levels by putting a cap on student
numbers and/or specialisms to ensure viable groups. Colleges have a
social purpose but must also be financially responsible. They can only
cross-subsidise lossmaking provision within limits.
• Focus delivery on cost-efficient courses. Colleges will be prompted to
focus on those T Levels with lower cost or more generic skills
outcomes rather than STEM based programmes which are more
costly, technically specialist and have high-quality features.
43. Cost and unit price pressure may drive colleges and other providers away
from specialist provision as it will be deeply unviable. Without increases in
the base rate and programme cost weighting factors, colleges will not be
able to supply the range of programmes the economy needs which will
damage productivity and exacerbate skills gaps and shortages.
44. A typical engineering workshop will need to be equipped with lathes,
milling machines, grinding machines and CNC machines to meet the
requirements of industry. Significant capital funding for equipment will be
required to meet the needs of industry. The equipment will then need to be
maintained, staff will need to be trained, and accommodation adjusted to
continue to meet the on-going requirements of employers. Colleges
cannot rely on employers to subsidise equipment on a long-term basis.
33 https://www.et-foundation.co.uk/wp-content/uploads/2019/05/SIR26-Workforce-Data-report.pdf
26
Quantifying increasing skills shortage – a forecast
45. A shortfall in delivery of technical education will have substantial
consequences for labour market performance, impeding growth and
improvements in productivity. Financial constraints are likely to result in
colleges reducing delivery volumes and/or shifting delivery away from more
expensive, technically specialist provision. As we have seen in the previous
sections, the labour market has a high and sustained demand for roles
requiring intermediate technical education. This demand has increased in
recent years because the labour market has tightened. Previous reliance on
migration or higher education to provide supply is not a practicable way
forward in the years ahead.
46. The consequence of a shortfall in delivery therefore seems likely to be an
increase in the scale and degree of skills shortage in technical occupations.
47. In this section, we quantify the impact of increasing skills shortages caused
to business which result from shortfalls in the supply of new skilled
workers with technical education at levels 3 to 5. We model the problem as
an increased search cost to employers, representing a deadweight loss as
skills move more slowly to their most valuable use. In our model, the
deadweight cost to employers is the cost of time resulting from having to
wait longer or work harder to find the right workers than they do at
present. The components of the analysis are as follows:
• Opportunity costs are modelled on the basis of typical salaries for
each route and Level combination, on the assumption that if
employers are willing to pay that salary for that role, then they must
value its output by at least that much. We apply a 3% increase in
salary costs (2% to cover inflation plus 1% real change) for each year
from 2018.
• Those salary costs are applied for a ‘time penalty’ from failing to
recruit, which is modelled here as a one-quarter increase in the
typical time to recruit. Job Posting Analytics measure the median
number of days job postings are online, and this provides the
baseline for measuring the ‘time penalty’; salary costs are then
applied pro rata.
• These opportunity costs are then applied to a modelled estimate of
skills shortage vacancies over the period 2019 to 2024. To arrive at
this estimate, we use the ratio of job postings to job openings from

27
2018 and project this forward across openings for the period 2019 to
2024; we then apply the latest (2017) skills shortage densities to
arrive at annual estimates of skills shortage vacancies for each year.
48. We use vacancies rather than openings as the measure for this analysis,
acknowledging that the primary impact of skills shortages is allocative
rather than in aggregate: employers suffer skills shortages wherever they
have difficulty in filling new posts, whether these posts are entirely novel,
whether they are replacing workers exiting from the workforce, or they are
replacing workers moving to other employers.
49. We are not seeking to estimate the current cost of the level of skills
shortage, only the marginal increase caused by a deterioration in supply.
We assume the opportunity cost of skills shortage only applies to the share
of vacancies currently experiencing skills shortage, and do not assume any
increase in the skills shortage density. This is a conservative assumption,
especially given the densities date from 2017 and the labour market has
already tightened since then. Our task here is to quantify the potential
impact of a slowing of matching between skilled labour supply and
demand, and we leave aside any assumptions about matching challenges
becoming more widespread.
50. From this exercise, across the years 2019/2024 the modelled deadweight
cost is £3.3 billion; as noted, this is a conservative estimate reflecting a
modest increase in recruitment times for only the levels of skills shortage
currently reported. As the chart above shows, costs are highest for
Engineering and Manufacturing; Digital, and Sales, Marketing and
Procurement – each of these would face an impact of around £600 million
over the period. There is some variation in the skill levels affected, with
Sales, Marketing and Procurement and Digital seeing the largest impacts at
‘Higher Technical’ level, and Engineering and Manufacturing seeing the
largest impact at ‘Technical’ level; across all T Level Routes, £2.1 billion of
impact is at ‘Higher Technical’ level, and £1.2 billion at ‘Technical’ level.
Taken together as STEM categories, Engineering and Manufacturing, Digital
and Health and Science see £1.7 billion in estimated impact.
51. FE economic evidence base offers only limited insights on lifetime earnings
but HE research shows that degree returns by subject are skewed heavily in
favour of more technical skills, with e.g. medicine, economics, computing
and business seeing the greatest return and English, creative arts, language

28
and philosophy seeing low and even negative returns.34 It seems a
reasonable assumption that further education qualifiers see the same
pattern, and so a shift from specialist to generic provision will lower the
NPV achieved per qualification, representing substantially poorer returns to
the student in lower life chances, and to the taxpayer in future fiscal
payoffs to the investment in their education. The latest FE Longitudinal
Education Outcomes study give strong suggestive evidence in the same
direction, with Engineering and Manufacturing Technologies Level 3
qualifier earning a median £27,800 after five years, while the average Level
3 qualifier earns £18,200.35
34 See e.g. C Belfield et al (2018). The relative labour market returns to different degrees. Research report. London:
Department for Education. 35 DfE (2018). Further education outcome-based success measures: 2015 to 2016. London: Department for Education.

29
Chart Seven: Projected cost of increased skills shortage

30
Quantifying the return on investment – a forecast
52. The UK government’s Department for Business Investment and Skills (BIS)
published research in 2011 which quantified the economic returns
associated with different further education qualifications less direct and
opportunity costs. BIS updated this research in 2015, calculating that
£66,000-£68,000 of net present value is created for every level 3 college-
taught qualification started36. The BIS research also found that economic
returns for Level 3 apprenticeships was higher with a net present value of
£88,000 per aim started, approximately £20,000 more than college taught
Level 3 qualifications.
53. T Levels have been introduced in part to help align qualifications to the
industrial strategy, to fill skills gaps and shortages and to improve
productivity. A key feature of T Levels is a high-quality industrial placement
of between 45 and 60 days that are occupationally specific and focused on
developing the practical and technical skills required for entry into an
occupation.
54. It is clearly too early to assess the economic returns on T Levels, but It
seems reasonable to assume that due to the occupational focus of T Levels
the Net Present Value per aim will be greater than existing Level 3 college
taught qualifications. If T Levels generated an economic return halfway
between existing Level 3 college based courses and apprenticeships, for
example, this would create an additional £10,000 Net Present Value per
aim started.
55. The total long term economic benefits to the economy will increase as T
Levels are introduced across all routes and the number of learners taking T
Levels increases.
56. For illustration purposes, RCU (Responsive College Unit) have forecast the
number of students on T Level courses which are population adjusted
using the following datasets:
• Demograhic Trends - ONS National Population projections by single
year of age.
• Baseline learner numbers including learners by Technical Route –
AoC/MiDES ILR 2017/1837.
36 BIS (2015). Measuring the net present value of further education in England. Research Paper 37 AoC and RCU co-operate to collect and analyse Individual Learner Record data directly from colleges via the MIDES
service. This provides more up-to-date data than the official ESFA statistics

31
57. The analysis sets a minimum baseline of T Level volumes equal to learners
currently taking Level 3 core aims that are not Academic or Applied
General. This is based on the DfE Progress Measure Eligible Qualifications
for both year ending 2016 and 2017. In subsequent years this is scaled up
and down according to 16-year-old population changes.
58. In 2017/18, the proportion of starts on the ILR for Academic Aims was 30%
and Applied General was 38%. T Level number projections take into
account that the new qualifications will be phased in over several years. By
2024/25 the extra demand for T Level is set at 10%, this conservatively
anticipates de-funding of a third of applied general qualifications.
Chart Eight: Numbers of students on level 3 courses
59. Combining these participation projections with the net present value
premium for T Levels of £10,000 per aim started suggests an extra £1.7
billion in NPV for the economy in 2024/25 and each year onwards.

32
Conclusions
60. The government has a set of education policies in England designed to
support the UK industrial strategy and enhance productivity. These
include T Levels at Level 3, Higher Technical Qualifications at Levels 4 and
5 and the National Retraining Scheme for adults.
61. There is firm evidence to support the T Level programme in that there are
large, costly and growing skills shortages in key sectors. Technical
education is needed to fill current gaps and avoid future ones because
unemployment is already low, net skilled migration is likely to reduce and
higher education is not suitable as an alternative.
62. Government’s funding plans may undermine this programme because
funding levels are insufficient. Funding is insufficient now for all study
programmes and will be even more unworkable for T Levels. Specialist
technical education comes at a cost. It generally involves smaller groups
sizes, world class facilities and staff with up-to-date sector expertise who
have the passion and skill to teach.
Recommendations
63. The current base rate is insufficient and will undermine the important T
Level reform programme and industrial strategy. A 16-19 base rate
increase of £1000 is needed to ensure colleges can viably offer a range of
programmes that meet the needs of employers and local communities.
64. Programme cost weightings need immediate review for STEM based
programmes.
65. A new capital budget is needed to support these reforms.
66. Further research on the sufficiency and viability of apprenticeships, adult
education and college HE programmes needs to be undertaken.
In you have any questions about this publication, please e-mail David Corke,
Director of Policy at the Association of Colleges – [email protected].

33
www.aoc.co.uk Association of Colleges
2-5 Stedham Place, London WC1A 1HU
T: 020 7034 9900
@AoC_info
Association-of-Colleges