Skills for Computing December 2015 Sample Exam Marking Scheme · Skills for Computing December 2015...
12
Skills for Computing December 2015 Sample Exam Marking Scheme This marking scheme has been prepared as a guide only to markers. This is not a set of model answers, or the exclusive answers to the questions, and there will frequently be alternative responses which will provide a valid answer. Markers are advised that, unless a question specifies that an answer be provided in a particular form, then an answer that is correct (factually or in practical terms) must be given the available marks. If there is doubt as to the correctness of an answer, the relevant NCC Education materials should be the first authority. Throughout the marking, please credit any valid alternative point. Where markers award half marks in any part of a question, they should ensure that the total mark recorded for the question is rounded up to a whole mark.
Transcript of Skills for Computing December 2015 Sample Exam Marking Scheme · Skills for Computing December 2015...
Skills for Computing
December 2015
Sample Exam Marking Scheme
This marking scheme has been prepared as a guide only to markers. This is not a set of model answers, or the exclusive answers to the questions, and there will frequently be alternative responses which will provide a valid answer. Markers are advised that, unless a question specifies that an answer be provided in a particular form, then an answer that is correct (factually or in practical terms) must be given the available marks. If there is doubt as to the correctness of an answer, the relevant NCC Education materials should be the first authority.
Throughout the marking, please credit any valid alternative point.
Where markers award half marks in any part of a question, they should ensure that the total mark recorded for the question is rounded up to a whole mark.

Page 2 of 12
Skills for Computing © NCC Education Limited 2015
Answer ALL questions
Marks Question 1 A researcher is conducting a survey to investigate how much people spend in a local shop.
a) The researcher selects a random sample of nine shoppers and asks them how
much they have spent. The responses are:
£7.96 £2.82 £15.31 £13.18 £12.58 £6.32 £10.48 £9.85 £14.49
i) Is the data collected primary or secondary data? 1 Primary ii) Find the median of the sample. 2 First put the data into ascending order:
£2.82 £6.32 £7.96 £9.85 £10.48 £12.58 £13.18 £14.49 £15.31
There are nine values so the median is the fifth value which is £10.48 (Award 1 mark for workings, 1 mark for correct answer)
iii) State one advantage of using the median rather than the mean. 1 The median gives a more typical value, it is not affected by the more
extreme values. (Award 1 mark for valid comment)
b) To gain a more accurate result, the researcher decides to record the amount
spent in the local shop by a larger number of shoppers.100 shoppers, including the initial sample of nine, are selected at random. The mean amount of money spent is found to be £17.56 with a standard error of £5.79
i) State the range of the amount of money spent that would give a 95%
confidence interval. 1
From £5.98 to £29.14
Question 1 continues on next page

Page 3 of 12
Skills for Computing © NCC Education Limited 2015
ii) The initial sample of nine shoppers is included in the second larger sample. Was the initial sample representative? Explain your reasoning.
3
No. the initial sample was not representative (1 mark). 5 out of the 9 shoppers spent an amount which fell outside the range of one standard error from the mean (£17.56) (1 mark) 5/9 = 56% (to the nearest percent) and if the sample was representative there should be 30% of the sample within that range.(1 mark)
c) The survey is conducted again at a later date with 100 respondents. The mean
amount of money spent by shoppers was found to be £19.86 with a standard error of £6.13. Is there more variation in the results of the first or second survey? Explain your answer.
2
There is more variation in the results of the second survey (1 mark) since the standard error is greater (1 mark).
Total 10 Marks

Page 4 of 12
Skills for Computing © NCC Education Limited 2015
Marks Question 2 The height (in cm) and age (in months) of six small children is recorded in the table below:
Age in months (𝑥) 17 20 22 23 26 28
Height in cm (𝑦) 76 79 81 80 83 83
a) Calculate Pearson’s correlation coefficient for the set of data. 6
𝑹 = 𝒓 =𝒏𝜮𝒙𝒊𝒚𝒊 − 𝜮𝒙𝒊𝜮𝒚𝒊
√(𝒏𝜮𝒙𝒊𝟐 − (𝜮𝒙𝒊)𝟐)(𝒏𝜮𝒚𝒊
𝟐 − (𝜮𝒚𝒊)𝟐
𝒓 =(𝟔 × 𝟏𝟎𝟗𝟕𝟔) − (𝟏𝟑𝟔 × 𝟒𝟖𝟐)
√((𝟔 × 𝟑𝟏𝟔𝟐) − 𝟏𝟑𝟔𝟐 ) × ((𝟔 × 𝟑𝟖𝟕𝟓𝟔) − 𝟒𝟖𝟐𝟐)
=𝟑𝟎𝟒
√𝟏𝟎𝟎𝟗𝟏𝟐
Using
𝒙 𝒚 𝒙𝒚 𝒙𝟐 𝒚𝟐 17 76 1292 289 5776
20 79 1580 400 6241
22 81 1782 484 6561
23 80 1840 529 6400
26 83 2158 676 6889
28 83 2324 784 6889
𝜮𝒙 = 𝟏𝟑𝟔 𝜮𝒚 = 𝟒𝟖𝟐 𝜮𝒙𝒚 = 𝟏𝟎𝟗𝟕𝟔 𝜮𝒙𝟐 = 𝟑𝟏𝟔𝟐 𝜮𝒚𝟐 = 𝟑𝟖𝟕𝟓𝟔
= 𝟎. 𝟗𝟓𝟕 (to 3 d.p.) So the Pearson correlation coefficient is 0.957 (to 3 dp) Award up to 4 marks for correctly constructed table of values or other
appropriate workings. 1 mark for correct workings in calculation of 𝒓 and 1
mark for correct value of 𝒓. Maximum for a): 6 marks
Question 2 continues on next page
Page 5 of 12
Skills for Computing © NCC Education Limited 2015
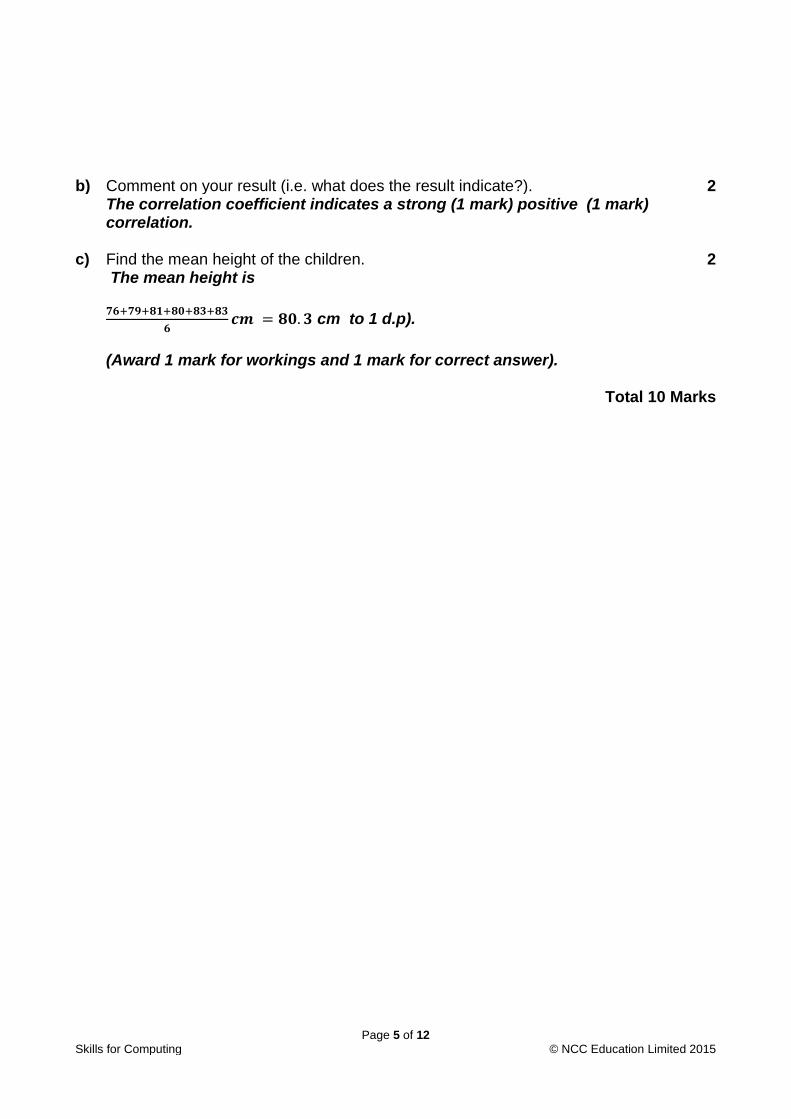
b) Comment on your result (i.e. what does the result indicate?). 2 The correlation coefficient indicates a strong (1 mark) positive (1 mark)
correlation.
c) Find the mean height of the children. 2 The mean height is
𝟕𝟔+𝟕𝟗+𝟖𝟏+𝟖𝟎+𝟖𝟑+𝟖𝟑
𝟔𝒄𝒎 = 𝟖𝟎. 𝟑 cm to 1 d.p).
(Award 1 mark for workings and 1 mark for correct answer).
Total 10 Marks
Page 6 of 12
Skills for Computing © NCC Education Limited 2015
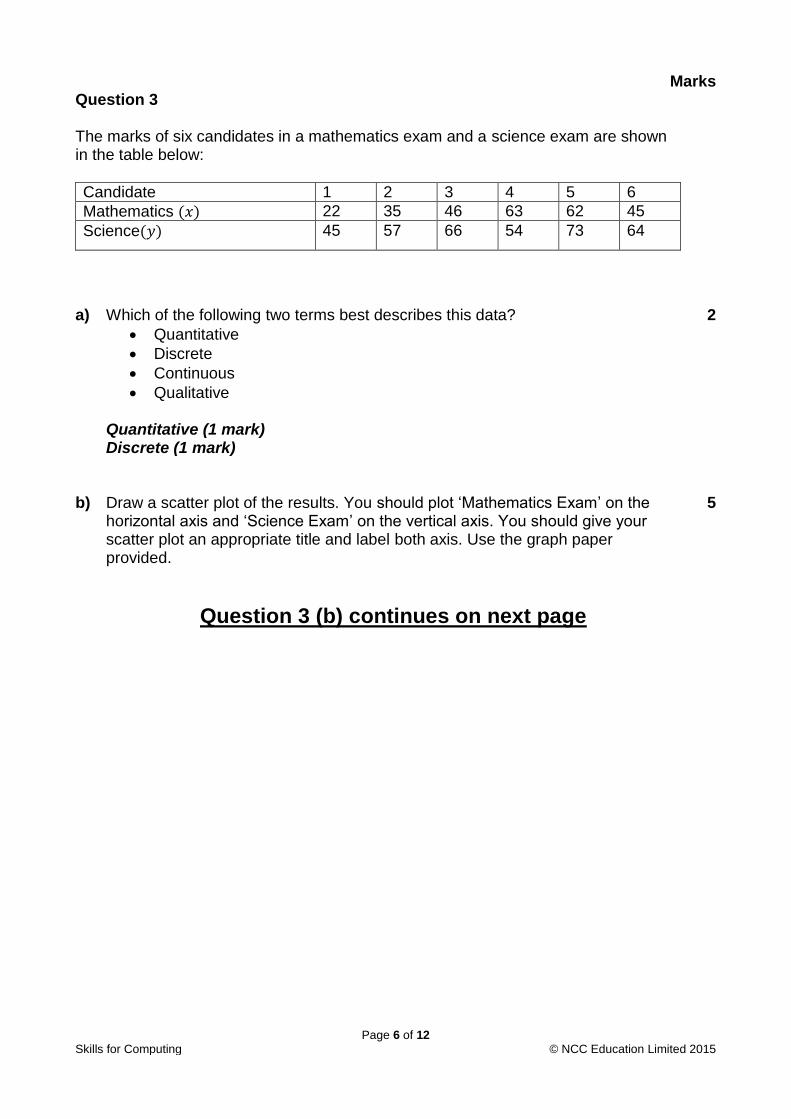
Marks Question 3 The marks of six candidates in a mathematics exam and a science exam are shown in the table below:
Candidate 1 2 3 4 5 6
Mathematics (𝑥) 22 35 46 63 62 45
Science(𝑦) 45 57 66 54 73 64
a) Which of the following two terms best describes this data?
Quantitative
Discrete
Continuous
Qualitative
2
Quantitative (1 mark) Discrete (1 mark)
b) Draw a scatter plot of the results. You should plot ‘Mathematics Exam’ on the
horizontal axis and ‘Science Exam’ on the vertical axis. You should give your scatter plot an appropriate title and label both axis. Use the graph paper provided.
Question 3 (b) continues on next page
5

Page 7 of 12
Skills for Computing © NCC Education Limited 2015
(Award 2 marks for a scatter plot with ‘Mathematics Exam’ on the horizontal axis and ‘Science Exam’ on the vertical axis and an appropriate title. Award 3 marks for accurate plotting of points - for each point plotted correctly award ½ mark.)
c) A student who achieved a result of 86 in the science exam wants to use the data
to estimate their result in the mathematics exam.
i) What is this type of estimate called? 1 Extrapolation ii) Comment on the accuracy of using the trend line on a scatter plot to estimate
this. 2
The estimate might not be reliable (1 mark) as it is outside the range of the data collected (1 mark).
Total 10 Marks
Page 8 of 12
Skills for Computing © NCC Education Limited 2015
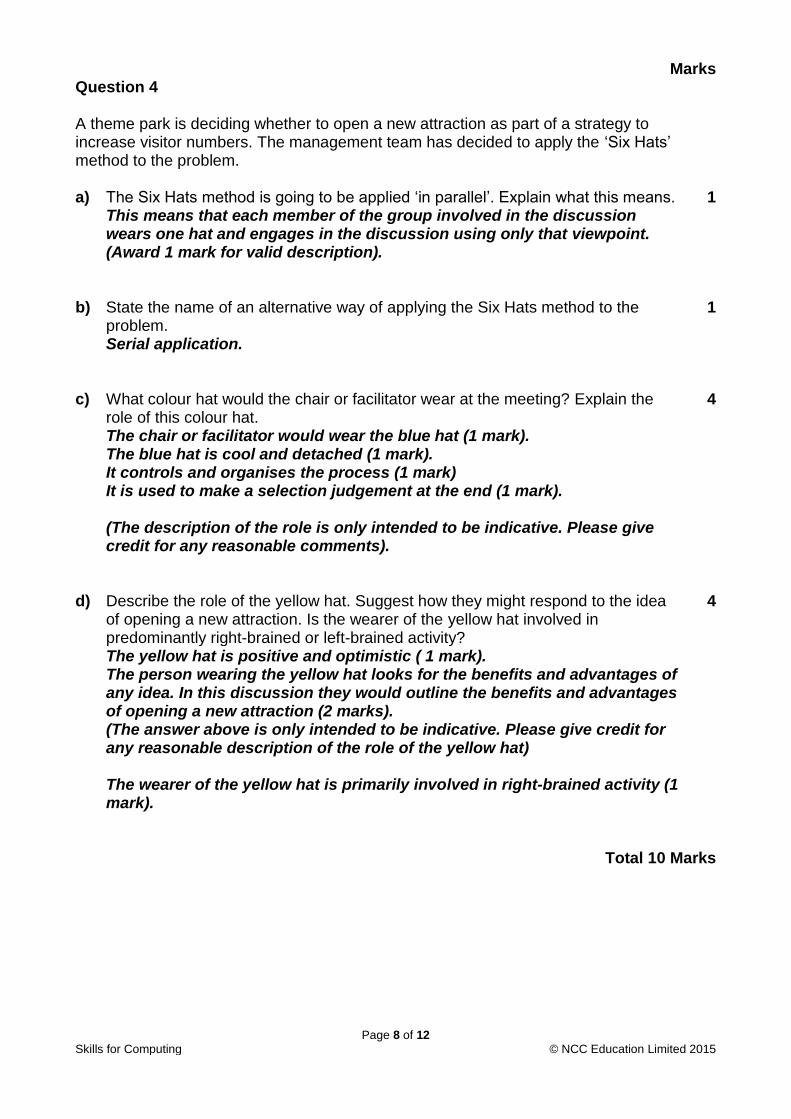
Marks Question 4 A theme park is deciding whether to open a new attraction as part of a strategy to increase visitor numbers. The management team has decided to apply the ‘Six Hats’ method to the problem.
a) The Six Hats method is going to be applied ‘in parallel’. Explain what this means. 1 This means that each member of the group involved in the discussion
wears one hat and engages in the discussion using only that viewpoint. (Award 1 mark for valid description).
b) State the name of an alternative way of applying the Six Hats method to the
problem. 1
Serial application. c) What colour hat would the chair or facilitator wear at the meeting? Explain the
role of this colour hat. 4
The chair or facilitator would wear the blue hat (1 mark). The blue hat is cool and detached (1 mark). It controls and organises the process (1 mark) It is used to make a selection judgement at the end (1 mark). (The description of the role is only intended to be indicative. Please give credit for any reasonable comments).
d) Describe the role of the yellow hat. Suggest how they might respond to the idea
of opening a new attraction. Is the wearer of the yellow hat involved in predominantly right-brained or left-brained activity?
4
The yellow hat is positive and optimistic ( 1 mark). The person wearing the yellow hat looks for the benefits and advantages of any idea. In this discussion they would outline the benefits and advantages of opening a new attraction (2 marks). (The answer above is only intended to be indicative. Please give credit for any reasonable description of the role of the yellow hat) The wearer of the yellow hat is primarily involved in right-brained activity (1 mark).
Total 10 Marks
Page 9 of 12
Skills for Computing © NCC Education Limited 2015
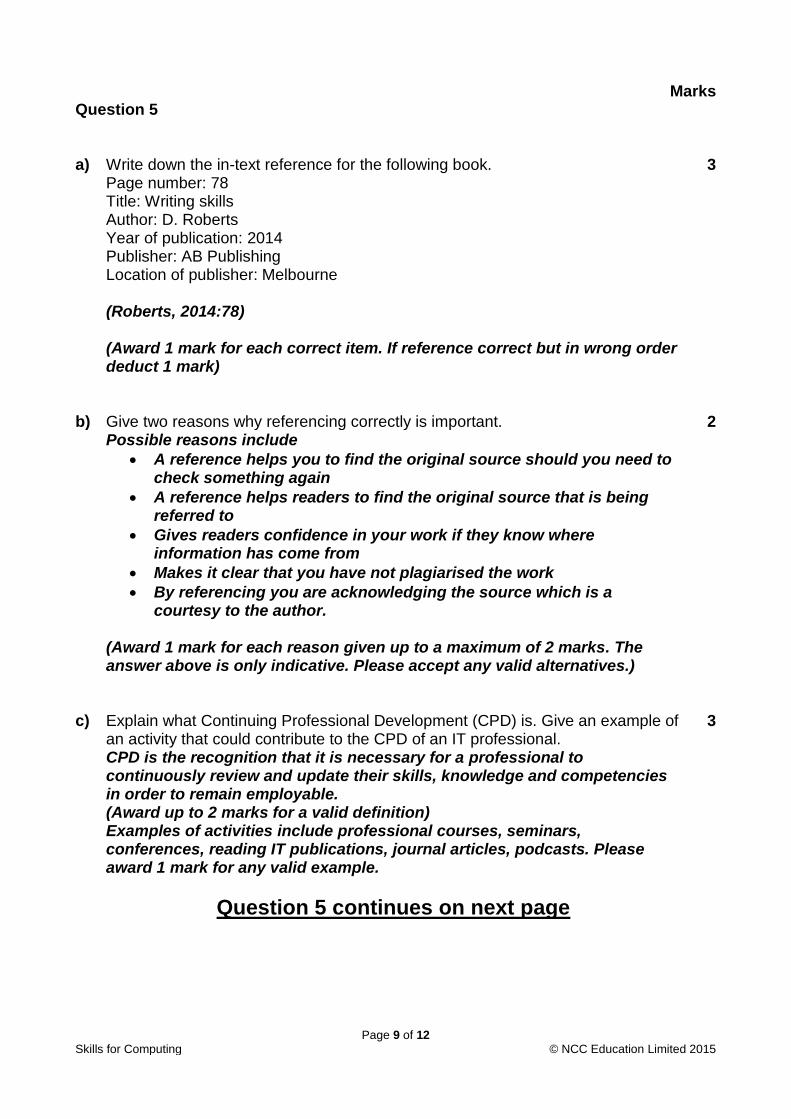
Marks Question 5 a) Write down the in-text reference for the following book.
Page number: 78 Title: Writing skills Author: D. Roberts Year of publication: 2014 Publisher: AB Publishing Location of publisher: Melbourne
3
(Roberts, 2014:78) (Award 1 mark for each correct item. If reference correct but in wrong order deduct 1 mark)
b) Give two reasons why referencing correctly is important. 2 Possible reasons include
A reference helps you to find the original source should you need to check something again
A reference helps readers to find the original source that is being referred to
Gives readers confidence in your work if they know where information has come from
Makes it clear that you have not plagiarised the work
By referencing you are acknowledging the source which is a courtesy to the author.
(Award 1 mark for each reason given up to a maximum of 2 marks. The answer above is only indicative. Please accept any valid alternatives.)
c) Explain what Continuing Professional Development (CPD) is. Give an example of
an activity that could contribute to the CPD of an IT professional. 3
CPD is the recognition that it is necessary for a professional to continuously review and update their skills, knowledge and competencies in order to remain employable. (Award up to 2 marks for a valid definition) Examples of activities include professional courses, seminars, conferences, reading IT publications, journal articles, podcasts. Please award 1 mark for any valid example.
Question 5 continues on next page
Page 10 of 12
Skills for Computing © NCC Education Limited 2015
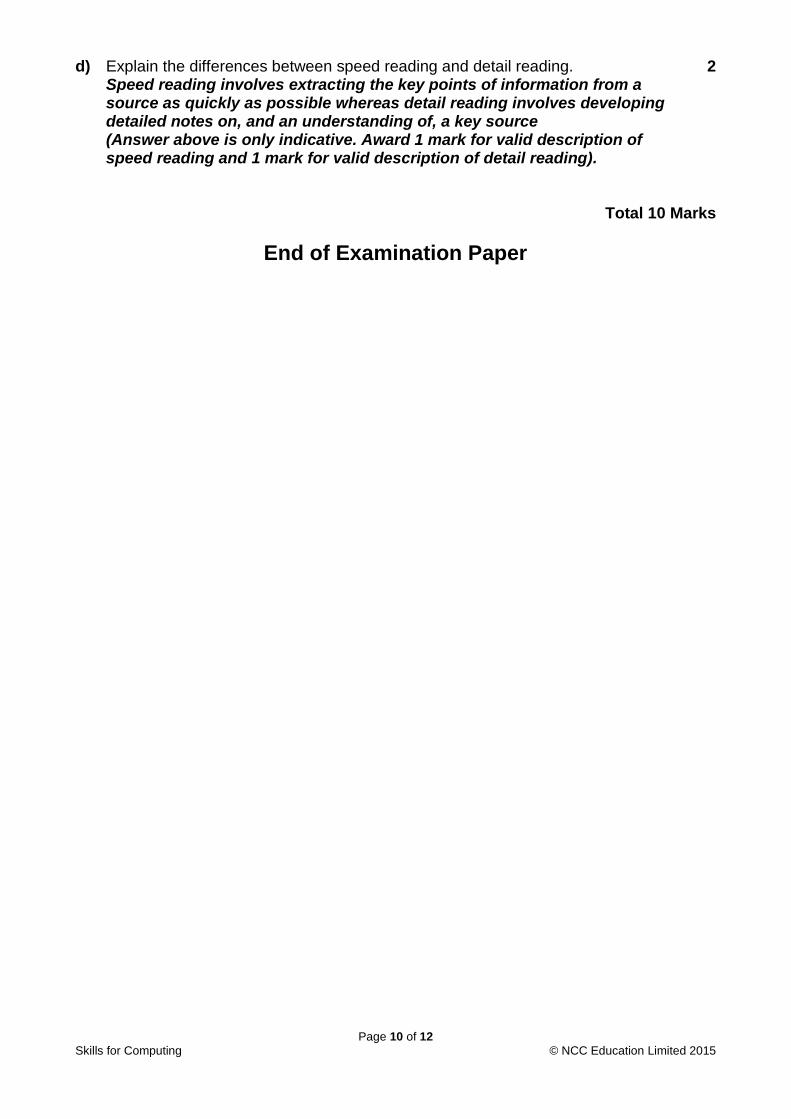
End of Examination Paper
d) Explain the differences between speed reading and detail reading. 2 Speed reading involves extracting the key points of information from a
source as quickly as possible whereas detail reading involves developing detailed notes on, and an understanding of, a key source (Answer above is only indicative. Award 1 mark for valid description of speed reading and 1 mark for valid description of detail reading).
Total 10 Marks
Page 11 of 12
Skills for Computing © NCC Education Limited 2015
Formula sheet
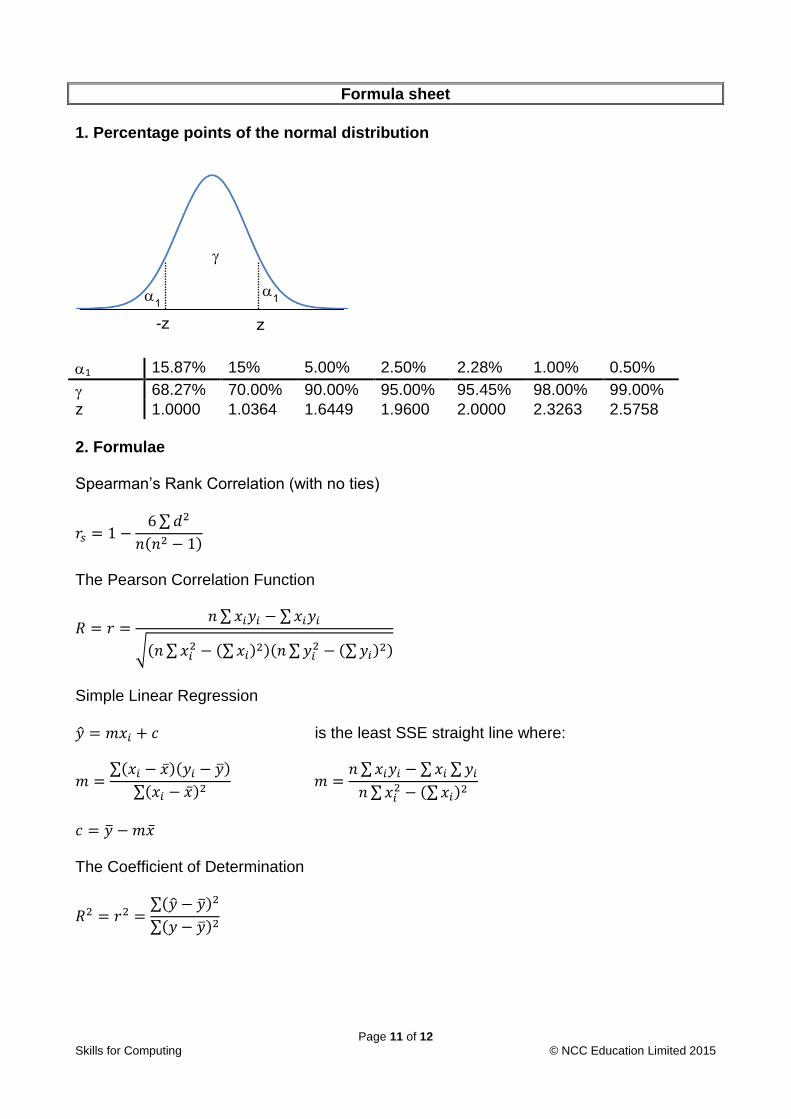
1. Percentage points of the normal distribution
1 15.87% 15% 5.00% 2.50% 2.28% 1.00% 0.50%
68.27% 70.00% 90.00% 95.00% 95.45% 98.00% 99.00%
z 1.0000 1.0364 1.6449 1.9600 2.0000 2.3263 2.5758
2. Formulae Spearman’s Rank Correlation (with no ties)
𝑟𝑠 = 1 −6 ∑ 𝑑2
𝑛(𝑛2 − 1)
The Pearson Correlation Function
𝑅 = 𝑟 =𝑛 ∑ 𝑥𝑖𝑦𝑖 − ∑ 𝑥𝑖𝑦𝑖
√(𝑛 ∑ 𝑥𝑖2 − (∑ 𝑥𝑖)2)(𝑛 ∑ 𝑦𝑖
2 − (∑ 𝑦𝑖)2)
Simple Linear Regression
�̂� = 𝑚𝑥𝑖 + 𝑐 is the least SSE straight line where:
𝑚 =∑(𝑥𝑖 − �̅�)(𝑦𝑖 − �̅�)
∑(𝑥𝑖 − �̅�)2 𝑚 =
𝑛 ∑ 𝑥𝑖𝑦𝑖 − ∑ 𝑥𝑖 ∑ 𝑦𝑖
𝑛 ∑ 𝑥𝑖2 − (∑ 𝑥𝑖)2
𝑐 = �̅� − 𝑚�̅� The Coefficient of Determination
𝑅2 = 𝑟2 =∑(�̂� − �̅�)2
∑(𝑦 − �̅�)2
z
1
1
-z
Page 12 of 12
Skills for Computing © NCC Education Limited 2015
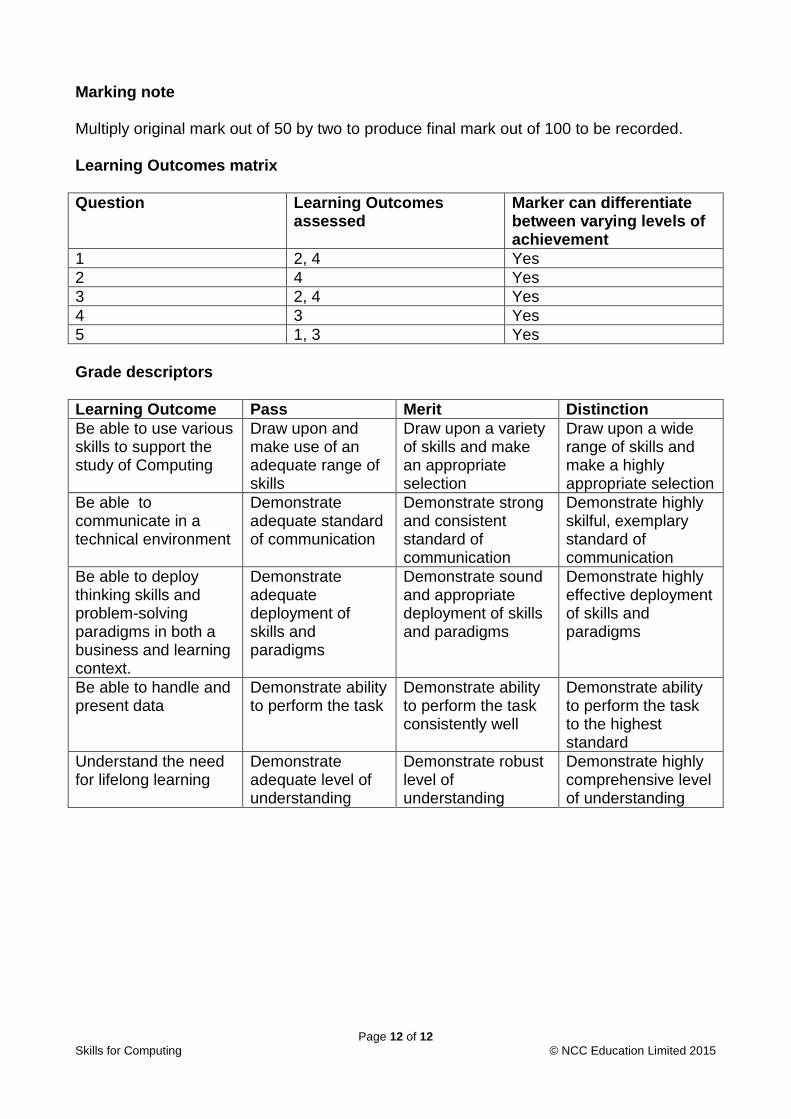
Marking note Multiply original mark out of 50 by two to produce final mark out of 100 to be recorded. Learning Outcomes matrix
Question Learning Outcomes assessed
Marker can differentiate between varying levels of achievement
1 2, 4 Yes
2 4 Yes
3 2, 4 Yes
4 3 Yes
5 1, 3 Yes
Grade descriptors
Learning Outcome Pass Merit Distinction
Be able to use various skills to support the study of Computing
Draw upon and make use of an adequate range of skills
Draw upon a variety of skills and make an appropriate selection
Draw upon a wide range of skills and make a highly appropriate selection
Be able to communicate in a technical environment
Demonstrate adequate standard of communication
Demonstrate strong and consistent standard of communication
Demonstrate highly skilful, exemplary standard of communication
Be able to deploy thinking skills and problem-solving paradigms in both a business and learning context.
Demonstrate adequate deployment of skills and paradigms
Demonstrate sound and appropriate deployment of skills and paradigms
Demonstrate highly effective deployment of skills and paradigms
Be able to handle and present data
Demonstrate ability to perform the task
Demonstrate ability to perform the task consistently well
Demonstrate ability to perform the task to the highest standard
Understand the need for lifelong learning
Demonstrate adequate level of understanding
Demonstrate robust level of understanding
Demonstrate highly comprehensive level of understanding


![[ASL] Marking Scheme](https://static.fdocuments.net/doc/165x107/55cf9d7e550346d033addb8a/asl-marking-scheme.jpg)