Skilled Shortage Sensible - gov.uk · Skilled Shortage Sensible Migration Advisory Committee...
276
Skilled Shortage Sensible Migration Advisory Committee February 2013 Full review of the recommended shortage occupation lists for the UK and Scotland, a sunset clause and the creative occupations
Transcript of Skilled Shortage Sensible - gov.uk · Skilled Shortage Sensible Migration Advisory Committee...

Skilled Shortage Sensible
Migration Advisory Committee
February 2013
Full review of the recommended shortage occupation lists for the UK and Scotland, a sunset clause and the creative occupations

Migration Advisory Committee, 2nd Floor, Fry Building, 2 Marsham Street, London, SW1P 4DF. www.ukba.homeoffice.gov.uk/mac email: [email protected]

Skilled Shortage Sensible
Full review of the recommended shortage occupation lists for the UK and Scotland, a sunset clause and the creative occupations
Migration Advisory Committee
February 2013

Contents
Chairman’s Foreword ......................................................................................... 1
The Migration Advisory Committee and secretariat ........................................ 3
Summary ............................................................................................................. 5
Context (Chapters 1 and 2) .......................................................................... 5
Sunset clause (Chapter 4) ............................................................................ 6
Creative occupations (Chapter 9) ................................................................. 7
Shortage occupation list for the UK (Chapter 3, 5 to 7 and 10) .................... 7
Shortage occupation list for Scotland (Chapter 8). ....................................... 9
Future updates to the shortage occupation list ............................................. 9
Chapter 1 Introduction.................................................................................. 11
1.1 Scope of this report ........................................................................... 11
1.2 What we did ...................................................................................... 12
1.3 Structure of the report ....................................................................... 16
1.4 Thank you ......................................................................................... 16
Chapter 2 Policy and Data Context ............................................................. 17
2.1 Introduction ....................................................................................... 17
2.2 Overview of the Points Based System and Tier 2 ............................. 17
2.3 Data context ...................................................................................... 20
Chapter 3 Our approach and methodology ................................................ 29
3.1 Introduction ....................................................................................... 29
3.2 Our conceptual approach .................................................................. 29
3.3 Skilled ............................................................................................... 33
3.4 Shortage ........................................................................................... 35
3.5 Sensible ............................................................................................ 39
3.6 Our sensible test and the sunset option ............................................ 43
3.7 Presenting the top-down results in this report ................................... 43
3.8 Conclusions ...................................................................................... 44
Contents
Skilled, Shortage, Sensible
Chapter 4 Sunset clause ............................................................................... 45
4.1 Introduction ........................................................................................ 45
4.2 Sunset clause: rationale .................................................................... 46
4.3 The shortage occupation list .............................................................. 46
4.4 Our current approach ........................................................................ 48
4.5 Sunset clause: partner evidence ....................................................... 58
4.6 Conclusions ....................................................................................... 79
Chapter 5 Health occupations ...................................................................... 83
5.1 Introduction ........................................................................................ 83
5.2 Evidence from our partners ............................................................... 83
5.3 Key issues and policies in the health sector ...................................... 84
5.4 Occupations we considered .............................................................. 85
5.5 Medical practitioners ......................................................................... 86
5.6 Biological scientists and biochemists ................................................ 94
5.7 Physical Scientists ............................................................................. 96
5.8 Nurses ............................................................................................... 98
5.9 Medical Radiographers.................................................................... 100
5.10 Other health sector job titles ........................................................ 101
Chapter 6 Engineering occupations .......................................................... 103
6.1 Introduction ...................................................................................... 103
6.2 Our approach .................................................................................. 103
6.3 Key issues in the engineering sector ............................................... 103
6.4 Chemical and process engineering ................................................. 104
6.5 Engineering in the construction sector ............................................ 106
6.6 Engineering in the energy sector ..................................................... 109
6.7 Engineering in the mining sector ..................................................... 120
6.8 Engineering in the aerospace industry ............................................ 122
6.9 Engineering in the railway industry .................................................. 125
6.10 Engineering in the automotive manufacturing and design industry 126
6.11 Engineering in the electronics systems industry .......................... 128
Contents
Chapter 7 Other Occupations .................................................................... 145
7.1 Introduction ..................................................................................... 145
7.2 Natural and social science professionals n.e.c. .............................. 146
7.3 Secondary education teaching professionals .................................. 150
7.4 Special needs education teaching professionals ............................ 153
7.5 Social workers ................................................................................. 155
7.6 Job titles within the visual effects and 2D/3D computer animation for film, television and video games ............................................................... 157
7.7 Chefs ............................................................................................... 167
7.8 High integrity pipe welders .............................................................. 170
7.9 Dancers and choreographers .......................................................... 172
7.10 Musicians .................................................................................... 174
7.11 Actuaries ..................................................................................... 176
7.12 Chick sexers ................................................................................ 178
7.13 High integrity pipe fitters .............................................................. 181
7.14 Citadel miniature designer ........................................................... 181
Chapter 8 Scotland ..................................................................................... 183
8.1 Introduction ..................................................................................... 183
8.2 The Scottish economy and labour market ....................................... 183
8.3 Corporate partner engagement in Scotland .................................... 188
8.4 Evidence received in response to our call for evidence. ................. 188
8.5 Occupations in the health sector ..................................................... 190
8.6 Our recommended shortage occupation list for Scotland. ............... 194
Chapter 9 Creative occupations ................................................................ 195
9.1 Introduction ..................................................................................... 195
9.2 Creative occupations in the context of the UK economy ................. 197
9.3 Immigration systems and the creative occupations ......................... 203
9.4 Options we considered for the creative occupations ....................... 209
9.5 Conclusions .................................................................................... 212
Chapter 10 Our recommended UK shortage occupation list ................. 213
10.1 Introduction .................................................................................. 213
10.2 The recommended UK shortage occupation list .......................... 213
Skilled, Shortage, Sensible
Annex A Consultation .................................................................................. 223
A.1 List of organisations that responded to the call for evidence ........... 223
A.2 Indicative list of organisations we met with/attended our forums ..... 226
Annex B List of occupations skilled at National Qualifications Framework level 6 and above............................................................................................. 231
Annex C Top-down shortage methodology ................................................ 235
C.1 Introduction ...................................................................................... 235
C.2 Data conversion .............................................................................. 235
C.3 Shortage .......................................................................................... 238
C.4 Results ............................................................................................ 241
Annex D List of job titles we recommend retaining on the shortage occupation lists for the UK and Scotland ..................................................... 247
Abbreviations .................................................................................................. 259
References ....................................................................................................... 263

1
This is the sixth iteration of the shortage occupation list under Tier 2 of the Points Based System for work immigration from outside the European Economic Area (EEA). Prior to the Migration Advisory Committee (MAC) recommending the shortage occupation list (initially in 2008), the list contained job titles and occupations employing around one million workers (employees, not just migrants). Since the involvement of the MAC, the skill level under Tier 2 has been ratcheted up from National Qualifications Framework level 3 (NQF3) (roughly a job requiring two „A‟ Levels) to NQF6 (degree level) and a far
more rigorous approach to defining labour shortage invoked. Consequently the number of workers now employed in jobs on this recommended shortage occupation list is approximately 180,000.
Under the Points Based System the shortage occupation list confers advantages for an employer. First, there is no need to advertise the job vacancy in the resident labour market. Second, should the migration limit under Tier 2 (General) (20,700 per year) be hit, priority is given to those migrants coming via the shortage occupation list.
It is important that the shortage occupation list is used as a signal by, for example, the Department for Business, Innovation & Skills (University sector), the UK Commission for Employment and Skills and individual companies when deciding their skills priorities. The MAC wishes to draw the attention of these funding bodies to the increase in the number of engineering job titles on the list in both this 2013 list and the previous 2011 list. By contrast, job titles in the health sector have consistently been removed from the shortage occupation list as the UK is able to supply the requisite skills thanks to the substantial investment in health training over the last decade.
In its commission to the MAC, the Government asked us to examine whether an occupation should automatically be removed from the shortage occupation list after a specified time (it suggested two years). We believe that immigration via the shortage occupation list should not be used as a substitute for investing in British human capital. But equally we conclude that an automatic sunset clause, particularly after a duration as short as two years on the shortage occupation list, would be a disproportionate response. There are a number of reasons for this MAC view.
Chairman’s Foreword
Skilled, Shortage, Sensible
2
First, it is important to emphasise that the shortage route under Tier 2 is now used by rather few migrants. Only 1,400 out-of-country Certificates of Sponsorship were issued in the twelve months to September 2012. Second, and more importantly, the MAC already operates a de facto sunset regime. In each of the six iterations of the shortage occupation list the MAC has added some occupations and job titles and removed others. While a few jobs have been on the list for four years, the vast majority, as shown in Chapter 4, are removed from the shortage occupation list quite quickly. Third, automatic removal could cause disproportionate problems to some organisations. These include teaching mathematics and physics, electricity distribution and classical ballet dancing – vital to the success of the British economy and our culture.
Our recommendation is therefore for the status quo. However, if the Government wishes to institute a sunset clause we suggest that the permitted duration on the shortage occupation list should be four rather than two years. Further, rather than an automatic guillotine at four years, we recommend that organisations be allowed to make their case for retention on the shortage occupation list. If such a case was deemed to be frivolous, the MAC would simply remove the job title from the shortage occupation list.
Some creative occupations no longer pass the skill threshold – as defined by the MAC – required for entry under Tier 2. In its commission the Government asked us to examine whether or not there should be a separate route under Tier 2 for these creative occupations. The MAC does not recommend a separate route. Rather we suggest maintaining the present system but simply exempting specified creative occupations from the requirement to pass the skill threshold.
It is unlikely that the recommendations contained in this report will influence the number of migrants very much. The inflow via the shortage occupation list only represents 0.26 per cent (i.e. about 1 in 400) of the total migrant inflow or around 1 in 20,000 UK jobs. However, the report raises important issues concerning the continuing need to upskill British workers, particularly in engineering, and the need to approach a sunset clause flexibly.
During this exercise most partners mentioned “consultation fatigue”. We have some sympathy with this view. Although this is, quite properly, a matter for the Government, we tentatively suggest that there should be an interval of two years before the shortage occupation list is completely revised again.
The Committee is again indebted to its small secretariat. Its economic and statistical analysis is excellent. And the interaction with stakeholders exemplary. Given the difficult climate for civil service workers, it is a pleasure to recognise the professionalism and commitment of our secretariat.
Professor David Metcalf CBE
The Migration Advisory Committee and secretariat
3
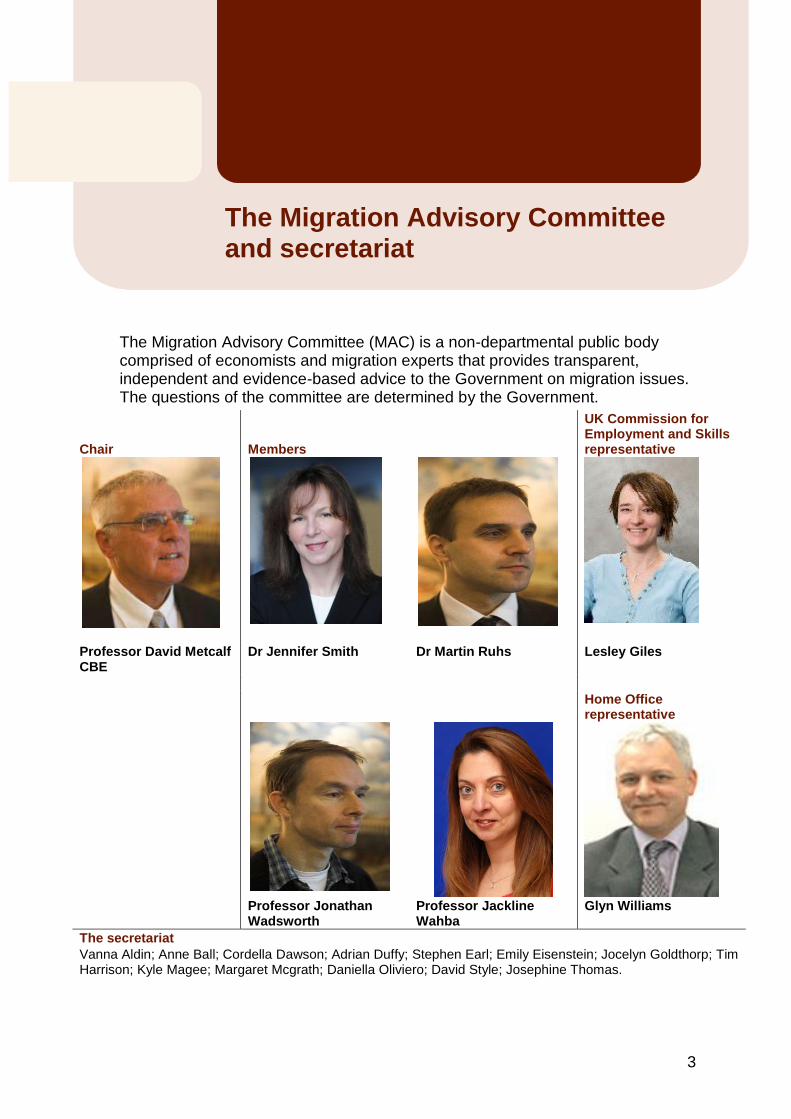
The Migration Advisory Committee (MAC) is a non-departmental public body comprised of economists and migration experts that provides transparent, independent and evidence-based advice to the Government on migration issues. The questions of the committee are determined by the Government.
Chair Members
UK Commission for Employment and Skills representative
Professor David Metcalf CBE
Dr Jennifer Smith Dr Martin Ruhs Lesley Giles
Home Office representative
Professor Jonathan
Wadsworth Professor Jackline
Wahba Glyn Williams
The secretariat
Vanna Aldin; Anne Ball; Cordella Dawson; Adrian Duffy; Stephen Earl; Emily Eisenstein; Jocelyn Goldthorp; Tim Harrison; Kyle Magee; Margaret Mcgrath; Daniella Oliviero; David Style; Josephine Thomas.
The Migration Advisory Committee and secretariat

5
Context (Chapters 1 and 2)
1. This is our sixth review of the shortage occupation lists since our first review in Autumn 2008. As well as updating the lists for both the UK and Scotland respectively, the Government asked us this time to consider two additional issues. The first related to how a sunset clause may be introduced to ensure the inclusion of occupations and job titles on the shortage occupation list as temporary relief only. The second asked us to consider how to treat creative occupations in the Tier 2 framework given that the majority of these occupations now fall below the National Qualifications Framework level 6 (NQF6) skill requirement required for Tier 2.
2. We received our commission from the Minister for Immigration on 20 August 2012 and the full wording is set out in Chapter 1. Following this, we sought the views of partners through, firstly, a call for evidence from 18 September to 30 November 2012, and secondly, a series of meetings and events held around the country during October and November, in some cases focusing on key sectors. We sent the call for evidence document to over 1,700 partners and received 90 written submissions from organisations and individuals.
3. Chapter 2 provides contextual background in terms of both recent policy changes as they affect Tier 2 and the degree of usage under the sub-routes. In terms of data what is of primary interest here are the annual inflows – effectively immigration - under the shortage occupation list. In the latest twelve months for which data are available there were just over 1,400 out-of-country Certificates of Sponsorship (CoS) used, which is relatively low compared to other routes under Tier 2, namely around 7,500 CoS for the Resident Market Labour Test (RLMT) route and 25,000 out-of-country CoS used for the intra-company transfers route. Furthermore one occupation – medical practitioners – accounts for the biggest share of the shortage occupation list usage (31 per cent), and all public sector occupations (other healthcare occupations plus secondary school teachers, special needs teachers and social workers) taken together account for over half of all CoS used.
Summary
Skilled, Shortage, Sensible
6
Sunset clause (Chapter 4)
4. We were asked to provide advice to the Government on a standard period after which removal from the shortage occupation list should become automatic. The commission suggested two years in principle. Fundamentally, the shortage occupation list is intended to provide temporary relief while measures are taken to mitigate shortages and it is clear that only a handful of occupations and job titles have been on the list since 2008. The risk is that the shortage occupation list is not used for its intended purpose and that employers may not be doing enough to up-skill domestic workers in order to reduce their reliance on skilled labour from outside of the European Economic Area (EEA).
5. Our approach to this part of our commission was driven very much by this ultimate objective. We looked first of all at how effective our existing methodology is for determining the composition of the list and how long occupations and job titles spend on it. Since our first list in 2008 we have recommended the removal of over 100 job titles using, in large part, evidence from partners to assess whether a shortage really exists and whether it is sensible to use non-EEA skilled migrants to fill the gap. Over time there has been an increasingly narrow focus of the shortage occupation list in terms of share of total employment. The number of workers (both British and migrant) employed in these jobs has fallen from over a million at the time prior to our first list to around 180,000 now.
6. There was also a significant response from partners on this issue. Although there was universal agreement on the principle of sunsetting occupations, in practice there was strong resistance to a one-size-fits-all approach generally and a two-year guillotine specifically. A number of good and well-evidenced arguments were put forward for this. It was considered that a sunset clause would take insufficient account either of the prevailing economic conditions facing individual sectors or the time required for domestic workers to train and acquire the necessary experience. It was also considered disproportionate – inflows under the shortage occupation list are currently just 0.26 per cent of total immigration. Finally, a sunset clause for the shortage occupation list would most likely lead to substitution into RLMT instead, thereby having little impact on upskilling in specific occupations or indeed on reducing net migration generally.
7. We recommend therefore that the current approach of regular reviews be retained instead of introducing a sunset clause. Furthermore, in future reviews for those occupations that have been on the list for a considerable period we would expect to see increasingly strong evidence that partners are making sufficient progress in tackling skill shortages in their sector. In this review we have seen good progress made in the health sector to alleviate shortages and reduce reliance on migrant labour. In other occupations, such as engineering, remedies have been slower to appear but initiatives are now emerging that seek to address what are more structural and systemic problems. These are only likely to bear fruit in the medium term and in future reviews we would be seeking strong evidence of the
Summary
7
effectiveness of more strategic, joined up efforts between Government and industry, especially in terms of high-end skills.
8. We recognise too that we were not tasked in this commission to consider the pros and cons of a sunset clause itself. Our recommendation here certainly does not advocate job titles remaining on the list indefinitely. Should the Government wish to pursue this option then we would recommend, firstly, that the suggestion of two years is too short. Instead, four years seems the practical minimum. Secondly, there should be scope for some flexibility at the end of this period for partners to appeal and to present the necessary evidence to argue for the retention of occupations and job titles on the list.
Creative occupations (Chapter 9)
9. Since June 2012 the minimum skill requirement for Tier 2 has been raised to NQF6+, broadly corresponding to bachelor‟s degree level. The Government announced, however, that exceptions would be made for five creative occupations – authors, artists, actors, dancers and designers - that fall below this skill level. In our commission we were asked to consider whether these occupations should be retained in Tier 2 and, if so, what the terms for this should be.
10. To address this we considered first of all how the creative occupations might be defined. We were made aware that work is underway elsewhere to better define what is a fast-evolving occupational area. Therefore, we were minded to restrict our current analysis to the existing five occupations only.
11. We took into account the economic value provided by these occupations, not least as it is an area of growing net exports for the UK. We also considered how other countries approach this, as well as options for how non-EEA migrants in the creative occupations might be subsumed within either an existing or indeed a new route under the Points Based System (PBS).
12. Having reviewed this evidence and taken into account the feedback from partners, we recommend that these occupations be retained under Tier 2 by exempting them from the skill requirement and by applying the current relevant Tier 2 codes of practice for creative occupations.
Shortage occupation list for the UK (Chapter 3, 5 to 7 and 10)
13. Chapter 3 sets out our methodological approach for determining which occupations and job titles should be included in the shortage occupation list. This is based on our skilled, shortage, sensible criteria used in previous reviews. We then consider occupations and job titles under three broad sectors; health-related occupations (Chapter 5), engineering-related occupations (Chapter 6) and other occupations (Chapter 7).
14. Chapter 5 discusses occupations and job titles in the health sector, which accounts for a significant proportion of the usage of the shortage occupation list route in the year to September 2012.

Skilled, Shortage, Sensible
8
15. During our review of the shortage occupation list, we had productive engagement with the Department for Health‟s Centre for Workforce Intelligence (CfWI). The evidence provided by the CfWI, and other partners, was more comprehensive than has been the case previously. We welcome this and hope that it continues during any future review we are asked to undertake.
16. In this review, we recommend that 15 occupations or job titles within the health sector remain on the UK shortage occupation list and that 2 job titles are added. We also recommend the removal of 19 occupations or job titles from the list. This latter recommendation suggests that the increased investment and focus by the Department of Health over recent times has gone some way to remedying the structural skill shortages that exist within the sector.
17. For the engineering-related occupations that we reviewed in Chapter 6, we recommend that the majority of the job titles on the current shortage occupation list be retained. Due to a lack of evidence we recommend that five job titles relevant to the mineral extraction and the aerospace industries be removed from the list. We also make recommendations for new job titles relevant to the aerospace, railway, electronics, mining, automotive manufacturing and design and the civil nuclear industries be added to the list.
18. We acknowledge in both our introduction to Chapter 4 and Chapter 6 that the increasing demand for specialist engineering skills continues to outstrip potential supply and that in our view there is insufficient joined up activity in this sector on the part of employers and relevant public bodies aimed at addressing its skills deficit.
19. Chapter 7 considered those job titles in occupations beyond health and engineering. In that chapter we consider evidence from a wide range of job titles, some of which we have discussed in previous reviews of the shortage occupation list, for example secondary school teachers in maths and science. We also reviewed several new job titles, namely: informaticians, bio-informaticians and games designers within the computer games industry.
20. In relation to skilled chefs we recommend that the minimum salary threshold be increased from £28,260 to £29,570 in line with wage increases across the whole of the UK economy.
21. We reviewed chick sexers, audio designers within the computer games industry and citadel miniature designers, but do not recommend that they are added to the shortage occupation list.
22. Our full recommended shortage occupation list for the UK is presented in Table 10.1 in Chapter 10. In this chapter we highlight those occupations and job titles that we recommend adding to the list, those we recommend retaining and those we recommend removing.
Summary
9
Shortage occupation list for Scotland (Chapter 8).
23. Scotland has an additional, separate shortage occupation list to reflect differing labour market needs compared to the rest of the UK. We received evidence from partners in Scotland and also held one general and one oil and gas sector-specific meeting in Scotland in Autumn 2012.
24. Scotland-specific evidence received came from three broad sectors; the care sector, secondary education and the health sector. For the first two of these the evidence submitted was not strong enough to merit inclusion on the list. In contrast, in the health sector we have recommended additions to the list in the areas of paediatrics, anaesthetics, obstetrics and gynaecology and diagnostics radiology. The full recommended shortage occupation list for Scotland is presented at the end of Chapter 8.
Future updates to the shortage occupation list
25. Numerous responses from partners to our call for evidence also requested a “breathing space” before the current list is reviewed again. Revisiting the list too frequently does not allow sufficient time to elapse for any real changes to take place, in terms of both shortage and seeing the results of mitigating actions. The timing and frequency of reviews needs to balance the benefits of gaining updated and significant information against the reporting burdens placed on business. We are sympathetic to these concerns and we would propose the next full review of the shortage occupation list in two years‟ time. At the same time this ought not to preclude other partial reviews in the interim to ensure sufficient flexibility in the operation of the shortage occupation list. We do recognise of course that this is a decision for the Government.

11
1.1 Scope of this report
1.1 This is our sixth review of the shortage occupation list since our first review in Autumn 2008. On this occasion, the Government have also asked us to consider two additional issues. Firstly, whether there should be a set time period after which an occupation or job title is removed from the list and, secondly, whether there is a case for the continued inclusion of certain creative occupations within Tier 2.
1.2 On 20 August 2012 the Minister for Immigration wrote to us asking that we undertake a review of the Tier 2 shortage occupation list and assess whether occupations should be removed from the list after a set period of time and whether creative occupations should continue to be included within Tier 2 of the Points Based System (PBS). The commission from the Government asked that we advise on the following questions:
1. “In which occupations or job titles skilled to at least NQF level 6 is there a shortage of labour that it would be sensible to fill using labour from outside the EEA and which therefore merit inclusion on the Shortage Occupation List (SOL)?
2. “The Government has indicated that it wishes to remove from the SOL all occupations that have been on it for more than a given period, in principle two years, regardless of shortages affecting the sectors concerned. This reflects the fact that inclusion on the SOL is intended to provide temporary relief while measures are taken to mitigate the shortages. MAC is asked to advise on:
i) A standard period after which removal from the SOL should become automatic and whether exceptions should be permitted.
ii) Whether a transitional period should be accorded to those occupations currently on the SOL and which have exceeded the advised standard period.
“In advising on 2 i) and ii) above, the MAC should have regard to time already spent on the SOL and mitigation measures taken, plans for further mitigation measures and the business impact of removal from the SOL.
Introduction Chapter 1

Skilled, Shortage, Sensible
12
3. “Tier 2 is now reserved for occupations skilled to at least NQF level 6 and in general the SOL should be aligned with that policy. However, for those job titles currently on the SOL which are not skilled to NQF level 6, is there a shortage of labour that it would be sensible to fill from outside the EEA and, therefore, a case for retaining them on the list?
“If so, which pay threshold should be applied in the relevant codes of practice for those job titles which the MAC recommends for inclusion on the SOL?
4. “The Government has retained within Tier 2 the following creative occupations in the arts and design fields which are not skilled to NQF level 6: artists, authors, actors, dancers and designers. Does the MAC see a case for continued inclusion of certain creative occupations in Tier 2 and, if so, on what terms?”
1.3 The Government asked for our advice by 31 January 2013.
1.2 What we did
Call for evidence
1.4 Alongside our analysis of quantitative data (as detailed in Chapter 3 and Annex C of this report), we carried out a call for evidence to collect the views and opinions of partners. In this report “corporate partners”, or just “partners”, refers to all parties with an interest in our work or its outcomes, so private and public sector employers, trade unions, representative bodies and private individuals are included within this term.
1.5 The call for evidence was launched on 18 September 2012 and closed on 30 November 2012. Our call for evidence document set out the Government‟s commission and identified those sub-questions on which we wished to receive corporate partners‟ views. The document was sent to over 1,700 partners and posted on our website.
1.6 We asked partners for evidence relevant to our skill, shortage and sensible criteria for any occupation or job title they wished to see included on the shortage occupation list. A detailed explanation of these criteria can be found in Chapter 3 of this report.
1.7 We did not seek evidence in relation to skill levels for those occupations that our top-down analysis had already identified as being skilled at National Qualifications Framework level 6 or above (NQF6+). This is because we reviewed the list of occupations skilled at NQF6+ in our recent report, Migration Advisory Committee (2012b), which is currently being considered by the Government. We only sought evidence in relation to skill levels for job titles within occupations not skilled at NQF6+ in order to determine that the job title was skilled to the relevant level when the occupation was not (apart from those job titles already on the shortage list, as per point 3 of the Government‟s commission to us). In these instances, we asked partners to provide information on:
Chapter 1: Introduction
13
typical earnings, or ranges of earnings, in the job title;
the proportion of individuals qualified at various levels (particularly at NQF6+);
minimum qualifications required (either informally or on a regulatory basis) to be a skilled practitioner in a particular job title;
any required or compulsory level or duration of on the job training or experience required to become a skilled practitioner;
any required innate ability, of a level or rarity which exceeds such requirements in a typical NQF6+ job title; and
opinion on the applicability of our skilled indicators to particular job titles.
1.8 Our call for evidence also asked for evidence of labour shortages in support of all proposals for occupations and job titles to be included on our recommended shortage occupation list. In particular, we asked for information on:
vacancy numbers, rates and typical durations;
typical earnings growth over recent months or years;
the extent to which newly qualified workers are being recruited and how this has changed over time;
the normal hours worked and how this has changed over time;
any growth in expenditure on training and recruitment by employers;
past or projected future trends in the demand for, and supply of, workers within an occupation;
opinion on the applicability of our shortage indicators to particular occupations or job titles; and
suggested additional shortage indicators for particular occupations or job titles, with an explanation of their relevance.
1.9 We also asked that partners provide evidence on whether it is sensible to employ migrants from outside the European Economic Area (EEA) as opposed to whatever alternative courses of action there may be. We asked partners to provide information on:
the use of alternatives to non-EEA migrant labour, including investment in technology and machinery, and efforts to recruit from within the EEA;
Skilled, Shortage, Sensible
14
current activity to train and up-skill the resident labour force, including timings, projected volumes of those who will exit such schemes and enter the occupation, and estimates of how this is likely to help meet demand;
whether migrants are likely to take jobs that would otherwise have been filled by resident workers or, conversely, whether employment of migrants will help to create employment conditions that allow the additional recruitment of resident workers; and
suggested additional sensible indicators for particular occupations or job titles, with an explanation of their relevance.
1.10 In addition, we sought information on minimum pay thresholds for those job titles skilled at NQF6+, but which fell within occupations not skilled to this level. We asked:
How different is the pay of the job title from the parent occupation?
Why is this?
What are the levels of pay within this job title for:
o new entrants; and
o experienced workers?
1.11 In relation to the part of the Government‟s commission asking about the removal of occupations from the shortage list after a given period of time, which we refer to in this report as the sunset clause, we asked partners for their views on:
whether the Government‟s indicated time period of two years is a reasonable amount of time to enable mitigating action to be put in place and to have effect before an occupation or job title is removed from the shortage occupation list;
whether there should be different time periods for different occupations and jobs, and what grounds might there be for awarding an extended time period;
the likely business impact of removing an occupation or job title from the shortage occupation list;
whether there should be a transitional period for occupations or job titles that are on the list and how long that period should be; and
mitigating measures already taken to alleviate shortages, whether these were effective and what further mitigating measures are planned.

Chapter 1: Introduction
15
1.12 Finally, we asked for partners‟ views on whether creative occupations should remain in Tier 2, the grounds on which they should remain, and any conditions or exemptions that should be applied to these occupations. Specifically, we asked partners the following questions:
are the skill levels for these occupations assessed appropriately?
how do the very specific creative skills exhibited in these occupations fit into the NQF framework?
how could the skills of individuals in these occupations be assessed and what evidence is available for this?
do individuals in these occupations have specific skills unique to these occupations that can be used to justify an alternative approach?
would these occupations be better served by an alternative, bespoke route within Tier 2 like the separate routes for ministers of religion or sportspersons, or would they fit better into another tier such as Tier 5?
what are the practical implications for employers of bringing in individuals from outside the EEA for these occupations that a new or existing route would have to address, including ensuring that vacancies are open to resident workers?
Meetings and events
1.13 During the course of October and November 2012, we hosted two public general information events in London to discuss our commission and held four sector specific meetings covering:
creative occupations;
health and social care;
education and science; and
engineering and construction.
1.14 We attended or hosted further events in Glasgow, Belfast and Nottingham. We also visited a number of workplaces during this period. During the call for evidence we met with representatives from over 70 different organisations. A full list of those we met with, and who have not requested anonymity, is provided in Annex A to this report.
1.15 We received 90 written submissions of evidence from organisations and individuals. All of the written and verbal evidence from partners was considered alongside our own data analysis. A list of those who supplied evidence, and who have not requested anonymity, is provided in Annex A of this report.
Skilled, Shortage, Sensible
16
1.3 Structure of the report
1.16 This report is structured as follows:
Chapter 2 of this report presents relevant policy and data context including an overview of the PBS and Tier 2 in particular.
Chapter 3 sets out our approach in considering the skilled, shortage and sensible criteria for inclusion of an occupation or job title on the shortage occupation list.
Chapter 4 sets out our approach to, and consideration of, the period of time for which each occupation or job title should remain on the shortage occupation list.
Chapter 5 discusses health and care sector occupations.
Chapter 6 discusses engineering and construction sector occupations.
Chapter 7 covers occupations outside the areas of health, engineering and construction.
Chapter 8 discusses occupations considered for inclusion on the Scotland shortage occupation list.
Chapter 9 considers whether creative occupations should continue to be included in Tier 2.
Chapter 10 presents the recommended changes to the UK shortage occupation list.
1.17 Annex A provides a list of organisations who responded to the call for evidence and those we met. Annex B provides a list of the occupations skilled at NQF6+. Annex C presents the top-down methodology. Annex D presents a list of those job titles and occupations which we recommend be retained on the shortage occupation lists, for both the UK and Scotland, under SOC 2010 and SOC 2000.
1.4 Thank you
1.18 We are grateful to all our partners who responded to our call for evidence and to those who engaged with us at meetings and events. We are particularly grateful to those partners who organised or hosted events on our behalf.
17
2.1 Introduction
2.1 This chapter presents a brief overview of the UK Points Based System (PBS) for immigration along with a more detailed look at the main elements of Tier 2 and in particular the shortage occupation list route. It also presents some key background data on the PBS and the wider immigration system.
2.2 Overview of the Points Based System and Tier 2
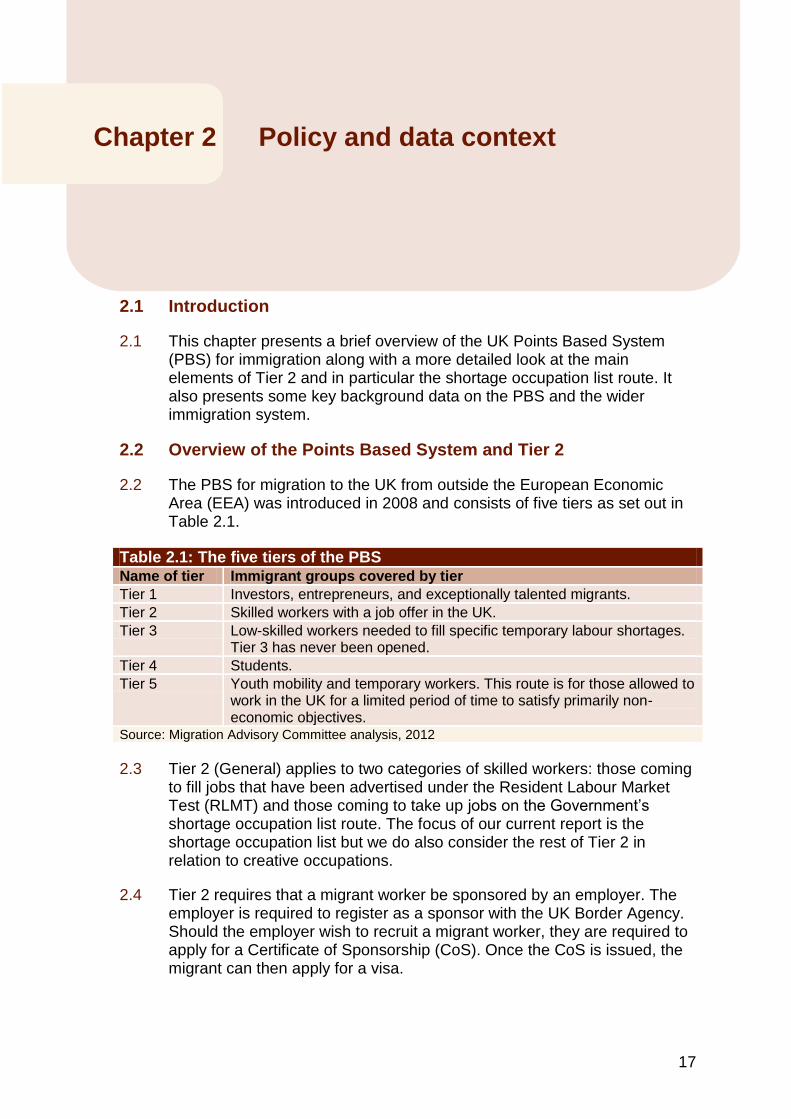
2.2 The PBS for migration to the UK from outside the European Economic Area (EEA) was introduced in 2008 and consists of five tiers as set out in Table 2.1.
Table 2.1: The five tiers of the PBS Name of tier Immigrant groups covered by tier
Tier 1 Investors, entrepreneurs, and exceptionally talented migrants.
Tier 2 Skilled workers with a job offer in the UK.
Tier 3 Low-skilled workers needed to fill specific temporary labour shortages. Tier 3 has never been opened.
Tier 4 Students.
Tier 5 Youth mobility and temporary workers. This route is for those allowed to work in the UK for a limited period of time to satisfy primarily non-economic objectives.
Source: Migration Advisory Committee analysis, 2012
2.3 Tier 2 (General) applies to two categories of skilled workers: those coming to fill jobs that have been advertised under the Resident Labour Market Test (RLMT) and those coming to take up jobs on the Government‟s shortage occupation list route. The focus of our current report is the shortage occupation list but we do also consider the rest of Tier 2 in relation to creative occupations.
2.4 Tier 2 requires that a migrant worker be sponsored by an employer. The employer is required to register as a sponsor with the UK Border Agency. Should the employer wish to recruit a migrant worker, they are required to apply for a Certificate of Sponsorship (CoS). Once the CoS is issued, the migrant can then apply for a visa.
Chapter 2 Policy and data context
Skilled, Shortage, Sensible
18
2.5 The RLMT route enables an employer to bring in a worker from outside the EEA if there is no suitably qualified worker within the UK or the EEA available to fill the specific skilled vacancy. Employers are required to advertise the relevant vacancy through Jobcentre Plus and at least one other medium for 28 calendar days or, for new graduate posts, by visiting at least three UK universities and advertising on a listed graduate recruitment website and at least one other medium. Additionally, following Government acceptance and implementation of our recommendations in Migration Advisory Committee (2012b), jobs that are paid more than £70,000 and specified PhD-level occupations do not have to be advertised through Jobcentre Plus.
2.6 Employers can apply to bring in workers from the outside of the EEA without going through the RLMT if the vacancy to be filled is in an occupation on the Tier 2 shortage occupation list. This details the occupations and job titles presently held to be experiencing a labour shortage that would be sensibly filled using non-EEA labour either across the UK as a whole or in Scotland only. The content of the list is recommended by the Migration Advisory Committee and those recommendations are revised periodically, most recently in September 2011 (Migration Advisory Committee, 2011a). The current Tier 2 shortage occupation list has been operational since November 2011.
2.7 For an occupation or job title to be recommended for inclusion on the shortage occupation list it must be:
Skilled to the required skill level for Tier 2 (currently NQF6+, which is broadly equivalent to degree level, with some exceptions);
Experiencing a national shortage of labour; and
Demonstrably sensible to fill these shortages using labour from outside the EEA.
2.8 Tier 2 is subject to a minimum pay threshold of £20,000 in the General route the one exception to this being nurses and midwives that are undergoing a period of learning or supervised practice to gain Nursing and Midwifery Council registration. Since 2010, Tier 2 (General) has been subject to an annual limit of 20,700.
2.9 Tier 2 also contains three other routes which are not subject to a limit: the intra-company transfer, ministers of religion and sportsperson routes.
2.10 The intra-company transfer route is for employees of multi-national companies being transferred to a UK-based branch of the same organisation either on a long-term or short-term basis. Additionally, organisations may use the intra-company transfer route for third-party contracting, bringing in labour from their own company to deliver a business outcome to a third party often in the form of a one-off project. The transferees may work at the third party‟s premises providing the multi-national organisation remains responsible for their work. Long-term staff

Chapter 2: Policy and Data Context
19
brought in under the intra-company transfer route must be paid £40,000 or above or the rate specified in the relevant codes of practice, whichever is higher. They are given permission to stay for up to three years, with the possibility of extending for a further two years. Short-term staff must be paid £24,000 or above or the rate specified in the relevant codes of practice, whichever is higher, and are allowed to work in the UK for a maximum of 12 months.
2.11 In November 2012, the UK Border Agency increased the maximum period of leave - from five to nine years - for senior staff brought in under the intra-company transfer route earning £150,000 or more. However, following the period of leave to remain, senior staff are subject to a 12 month cooling off period before they can return to the UK. In addition, such individuals are not eligible to apply for settlement or residency in the UK.
2.12 The ministers of religion route is for those who are offered employment or posts or roles within their faith community in the UK to undertake preaching and/or pastoral work, are missionaries or members of religious orders.
2.13 The sportsperson route is for elite sportspersons or coaches whose employment will make a significant contribution to the development of the relevant sport at the highest level. The UK Border Agency recognises governing bodies for each sport. It is the responsibility of the recognised governing body of the sport in question to agree and maintain the requirements under which they will consider and issue an endorsement to an organisation who wish to obtain a licence to become a sponsor, and consider and endorse, where appropriate, the issue of a certificate of sponsorship by a sponsor for each individual sportsperson applicant.
Recent changes to Tier 2
2.14 Since 6 April 2011, Tier 2 (General) has been subject to an annual limit of 20,700 places for main out-of-country applicants. In 2011/12 the limit was undersubscribed by 52 per cent. We were commissioned to assess this in early 2012 (Migration Advisory Committee, 2012a) and the Government accepted our recommendation to keep the limit at this level.
2.15 In June 2012 the skill level required to qualify under Tier 2 was increased to NQF6+, broadly corresponding to bachelor‟s degree level. 4-digit Standard Occupational Classification (SOC) occupations and job titles presently on the shortage occupation list but not skilled at NQF6+, plus certain creative occupations, do not have to comply with the NQF6+ requirement but must be skilled at NQF4+. Chapter 3 contains an explanation of the SOC.
2.16 Currently the following creative occupations (currently defined in SOC 2000) are permitted under Tier 2 even though they are not skilled to NQF6+: SOC 3411 artists, SOC 3412 authors, SOC 3413 actors, SOC 3414 dancers and choreographers and SOC 3422 product, clothing and related designers. We discuss this further in chapter nine.
Skilled, Shortage, Sensible
20
2.3 Data context
2.17 This section provides the data context to our analysis of the recommended shortage occupation lists for the UK and Scotland. It sets out the current state of the labour market and trends in migration statistics.
The UK labour market
2.18 Following the global recession of 2008-2009, the UK economy experienced subdued growth to 2011 Q3. The three quarters to 2012 Q2 were marked by declining output, followed by growth of 0.9 percent between 2012 Q2 and 2012 Q3, which was likely to be associated with one off events, namely, the Queen‟s Diamond Jubilee and the Olympics and Paralympics. By 2012 Q3 output remained almost 3 percentage points below its pre-recession peak.
2.19 In December 2012, the Office for Budget Responsibility (OBR) revised down its forecast for the UK economy for the coming years. Growth is likely to remain subdued in 2013, before returning to trend from 2014 onwards. Their central forecast is for the economy to grow by 1.2 per cent in 2013, 2 per cent in 2014, 2.3 per cent in 2015 and 2.7 per cent in 2016 (Office for Budget Responsibility, 2012).
2.20 By comparison the labour market has fared better. The rate of unemployment for the UK peaked at 8.4 per cent in the three months to November 2011, but has since fallen back to 7.7 per cent in the three months to November 2012 (Figure 2.1). The Office for Budget Responsibility has forecast that unemployment will peak at 8.3 per cent at the end of 2013, declining thereafter.
Chapter 2: Policy and Data Context
21
Figure 2.1: UK unemployment and claimant count rates, Aug - Oct 1994 to Aug - Oct 2012
Notes: Seasonally adjusted. The unemployment rates are those calculated in the three months to the date shown (inclusive). The claimant count consists of all people between the ages of 18 and State Pension age claiming Jobseeker‟s Allowance at Jobcentre Plus local offices. They must declare that they are out of work, capable of, available for and actively seeking work during the week in which their claim is made. The claimant count rate is the number of claimants expressed as a percentage of the sum of claimants and workforce jobs (mid-year estimates are used).The definition of unemployment is internationally agreed and recommended by the International Labour Organisation. Individuals are defined as unemployed if they are aged 16 and above and are without a job, want a job, have actively sought work in the last 4 weeks and are available to start work in the next 2 weeks; or are out of work, have found a job and are waiting to start it in the next 2 weeks. The unemployment rate is calculated from the Labour Force Survey and is given by the proportion of the economically active population (those who are in employment or unemployment) who are unemployed. Source: Office for National Statistics (2012a)
2.21 Having increased to 4.9 per cent and remaining constant throughout the first half of 2012, the claimant count has now decreased slightly to 4.8 per cent in October 2012.
2.22 Figure 2.2 displays trends in nominal and real earnings, including and excluding bonuses. Wages can act as a good indicator of „labour market slack‟. Prior to the recession, nominal wage growth stood at an average 4.0 percent per year. Since January 2008 nominal wage growth has averaged 2.6 percent per year. Above target rates of inflation, particularly during 2011, means that real earnings have been falling in the last four years.
0.0
1.0
2.0
3.0
4.0
5.0
6.0
7.0
8.0
9.0
10.0
1994 O
CT
1995 O
CT
1996 O
CT
1997 O
CT
1998 O
CT
1999 O
CT
2000 O
CT
2001 O
CT
2002 O
CT
2003 O
CT
2004 O
CT
2005 O
CT
2006 O
CT
2007 O
CT
2008 O
CT
2009 O
CT
2010 O
CT
2011 O
CT
2012 O
CT
Unemployment rate
Claimant count rate
Unem
plo
ym
ent ra
te/ C
laim
ant
count ra
te
Three months to
Skilled, Shortage, Sensible
22
Figure 2.2: Year on year growth in nominal and real earnings Year on year growth in total (including bonuses) and regular (excluding bonuses) earnings, Great Britain, December 2000 - September 2012
Year on year growth in real total (including bonuses) and regular (excluding bonuses) earnings, Great Britain, December 2000 - September 2012
Note: Nominal earnings have been seasonally adjusted. Average nominal earnings are calculated by dividing the total amount paid by the total number of employees paid in Great Britain. The growth rate is calculated as the percentage change between average nominal earnings in a given month and the same month the previous year. Real earnings have been estimated using data from the retail price index , which is not seasonally adjusted. Source: Office for National Statistics (2012b) and Office for National Statistics (2012c)
-8.0
-6.0
-4.0
-2.0
0.0
2.0
4.0
6.0
8.0
10.02001 J
AN
2001 N
OV
2002 S
EP
2003 J
UL
2004 M
AY
2005 M
AR
2006 J
AN
2006 N
OV
2007 S
EP
2008 J
UL
2009 M
AY
2010 M
AR
2011 J
AN
2011 N
OV
2012 S
EP
Nominal total earnings (including bonuses)
Nominal regular earnings (excluding bonuses)
Pe
rce
nta
ge c
ha
ng
e re
lative
to s
am
em
on
th p
revio
us y
ea
r
-8.0
-6.0
-4.0
-2.0
0.0
2.0
4.0
6.0
8.0
2001 J
AN
2001 N
OV
2002 S
EP
2003 J
UL
2004 M
AY
2005 M
AR
2006 J
AN
2006 N
OV
2007 S
EP
2008 J
UL
2009 M
AY
2010 M
AR
2011 J
AN
2011 N
OV
2012 S
EP
Total real earnings (including bonuses)
Total basic pay (excluding bonuses)
Pe
rce
nta
ge
cha
ng
e re
lative
to th
esa
me
mo
nth
pre
vio
us y
ea
r
Chapter 2: Policy and Data Context
23
2.23 The number of vacancies relative to unemployment (the V/U ratio) is an additional measure of the state of the labour market, presented in Table 2.2 below. A high, or rising, V/U ratio may suggest that it is difficult, or becoming more so, to fill vacancies as the number of vacancies to every claimant rises. The V/U ratio increased for every 1-digit SOC 2000 occupation (with the exception of sales and customer service occupations) between October 2010 and October 2012 but varies considerably, suggesting that any labour market slack is unevenly distributed among the sectors.
Table 2.2: Unfilled vacancies per claimant by occupation sought (V/U ratio), Great Britain Occupation October 2010 October 2011 October 2012
Managers and Senior Officials 0.20 0.25 0.28
Professional Occupations 0.20 0.20 0.33
Associate Professional and Technical Occupations
0.46 0.35 0.67
Administrative and Secretarial Occupations
0.12 0.07 0.14
Skilled Trades Occupations 0.16 0.22 0.26
Personal Service Occupations 0.51 0.48 0.66
Sales and Customer Service occupations
0.22 0.14 0.13
Process, Plant and Machine Operatives
0.40 0.47 0.66
Elementary Occupations 0.18 0.19 0.19 Note: Seasonally adjusted. Total vacancies are estimated from the monthly Vacancy Survey, which asks employers how many vacancies they have in total for which they are actively seeking recruits from outside their organisation. Vacancies do not include those in agriculture, forestry and fishing. The claimant count by occupation sought consists of all people between the age of 18 and state pension age claiming Jobseeker‟s Allowance. Source: Nomis (2012)
Migration stocks and flows
2.24 Figure 2.3 presents migrant flows from 1991-2011, defining migrants as those intending to change their place of residence for one year or more according to the international UN definition. Net migration has risen throughout this period, from 44,000 in 1991 to a peak of 252,000 in 2010. Net migration in 2011 was 215,000 and fell to 183,000 in the 12 months to March 2012.
2.25 Net migration of EU migrants was negligible until the expansion of the EU in 2004, peaking at 127,000 in 2008 and falling to 82,000 in 2011. Net migration of British nationals was -43,000 in 2010 and -70,000 in 2011. It is notable that net migration of British and EU nationals broadly „cancelled out‟ in 2011, meaning that total net migration was largely driven by migration from non-EU countries, which stood at 204,000.
Skilled, Shortage, Sensible
24
Figure 2.3: Flows of long-term migrants to and from the UK and net long-term migration by citizenship, 1991 - 2011
Inflows, outflows and balance of long-term migrants to and from the UK, 1991 - 2011
Net long-term migration by citizenship, 1991 - 2011
Notes: Long-term migrants are defined in the International Passenger Survey as those individuals who intend to change their place of residence for a year or more. This definition includes all nationalities, including British nationals. EU includes EU15, A8, A2, Malta and Cyprus. Source: Office for National Statistics (2012d)
-100
0
100
200
300
400
500
600
7001991
1992
1993
1994
1995
1996
1997
1998
1999
2000
2001
2002
2003
2004
2005
2006
2007
2008
2009
2010
2011
Net
Inflow
Outflow
Flo
ws
(000s)
-150
-100
-50
0
50
100
150
200
250
300
1991
1992
1993
1994
1995
1996
1997
1998
1999
2000
2001
2002
2003
2004
2005
2006
2007
2008
2009
2010
2011
Total net migration
Net British
Net non-EU
Net EU
Flo
ws (
000s)
Chapter 2: Policy and Data Context
25
2.26 Figure 2.4 presents the total number of entry clearance visas issued in each quarter to Tier 2 and work permit applicants by route. The shortage occupation and RLMT routes are together referred to as Tier 2 (General). The permanent annual limit on Tier 2 (General) of 20,700 was implemented in April 2011. Since its introduction, the limit has been consistently undersubscribed.
Figure 2.4: Entry clearance visas issued to Tier 2 and work permit main applicants by route by quarter, 2008 Q1 - 2012 Q3
Note: Tier 2 was launched on 28 November 2008. The work permit system was the predecessor to Tier 2. Tier 2 (General) includes the Resident Labour Market Test and shortage occupation routes. Operational procedures before and after the introduction of the Points Based System (PBS) were different, which may distort any comparison before and after this date. In particular, previously migrants would have had to apply first under the highly skilled migrant programme or for a work permit and then for a visa. In the PBS these processes take place at the same time. Source: Home Office (2012) („before entry‟ visa tables)
2.27 In contrast to visas issued, certificates of sponsorship (CoS) allow us to break Tier 2 down into its component routes – RLMT, shortage occupation and intra-company transfer, – by occupation and by whether the CoS was granted for an in- or out-of-country applicant. In-country certificates are issued for applicants already in the UK and covers extensions of stay and applicants who are switching into the route from another route. Out-of-country certificates are issued to applicants who are not yet in the UK and are a proxy for inflows. Table 2.3 below presents the top ten SOC 2000 occupations by CoS used for all routes, whilst Table 2.4 below presents the top five SOC 2000 occupations by CoS used for all routes. Both tables report data for SOC 2000 occupations, as eligible occupations under Tier 2 are currently defined using this classification.
2.28 As shown, around 33 percent of Tier 2 migrants apply under the SOC 2000 code 2132 software professionals, with the majority coming through the intra-company transfer route.
0
2000
4000
6000
8000
10000
12000
14000
16000
18000
2008 Q
1
2008 Q
2
2008 Q
3
2008 Q
4
2009 Q
1
2009 Q
2
2009 Q
3
2009 Q
4
2010 Q
1
2010 Q
2
2010 Q
3
2010 Q
4
2011 Q
1
2011 Q
2
2011 Q
3
2011 Q
4
2012 Q
1
2012 Q
2
2012 Q
3
Tier 2 - Intra Company Transfers (short & long term)
Tier 2 -Sportsperson
Tier 2 - Ministers of Religion
Tier 2 - General
Pre-PBS Work Permit Holders
Entr
yC
leara
nce V
isas I
ssued

Skilled, Shortage, Sensible
26
2.29 In the year ending September 2012, 1,427 out-of-country CoS were granted for use by applicants under the shortage occupation route. This compares to 7,482 and 24,809 out of country CoS granted for use by applicants under the RLMT and intra-company transfer routes respectively.
Chapter 2: Policy and Data Context
27
Table 2.3: Top 10 SOC 2000 occupations skilled at NQF6+ by out-of-country and in-country Resident Labour Market Test, shortage occupation and intra-company transfer main applicants, year to end September 2012
4-digit SOC
Occupation Shortage occupation
RLMT Intra-company transfer
Total
IC OOC IC OOC IC OOC 2132 Software professionals 27 16 1,184 873 2,107 12,488 16,695
2423 Management consultants, actuaries, economists and statisticians
5 15 613 483 214 1,642 2,972
1136 Information and communication technology managers
- - 144 154 468 1,678 2,444
1132 Marketing and sales managers
- - 367 424 371 1,253 2,415
2211 Medical practitioners 548 439 982 386 1 4 2,360
3534 Finance and investment analysts/advisers
- - 650 539 162 886 2,237
2131 IT strategy and planning professionals
- - 164 97 325 978 1,564
2329 Researchers n.e.c. - - 867 635 6 22 1,530
1112 Directors and chief executives of major organisations
2 2 84 427 297 539 1,351
3211 Nurses 122 37 641 541 - - 1,341
Total for top ten 1,213 10,255 23,441 34,909
Total for all Tier 2 occupations (subject to restrictions below)
3126 17805 30044 50,975
Note: Applicants are required to meet the criteria for Tier 2 from the point of the last major immigration rule change (14 June 2012) at the point of being allocated a certificate of sponsorship. Therefore, the data have therefore been filtered to exclude those individuals who would not meet the current visa rules. Therefore totals do not match published overall totals for Tier 2 CoS used published in Immigration Statistics April-June 2012, due to the following: first, a main applicant to the RLMT route has been excluded if the occupation is not skilled to National Qualifications Framework level 6 or above (NQF6+) (unless the occupation is one of the creative occupations exempt from this: 3411, 3412, 3413, 3414 and 3422) and/or earnings on the job are less than £20,000 per year and/or they are clergy (who would use the Tier 2 minister of religion route). Second, a main applicant to the shortage occupation route has been excluded if the occupation is not on the shortage occupation list as at 14 November 2011 and/or earnings in the job are less than £20,000 per year and/or they are chefs earning less than £28,260 per year. Third, a main applicant to the long-term intra-company transfer route has been excluded if their occupation is not skilled to NQF6+ (or is one of the creative occupations) and/or earnings in the job are less than £40,000 per year. Finally, a main applicant to the short-term intra-company route has been excluded if their occupation is not skilled to NQF6+ (or is one of the creative occupations) and/or earnings in the job are less than £24,000 per year. Further, data is excluded if the salary reported is not annual or we were unable to distinguish between in/out of country applicants. Not all the individuals using CoS may be granted visas since some may have their visa applications rejected. Furthermore, even when a visa is granted, a person might not travel to the UK and on arrival they might also not be admitted. All of the figures quoted are management information which have been subject to internal quality checks, but have not been quality assured to the same standard as National Statistics. As much of the input data (for example, salary levels) is self declared by the sponsor, UK Border Agency is not able to validate the quality of the source information, and we are advised by the UK Border Agency that data quality anomalies could impact on the findings. These data are provisional and subject to change. IC – “In-country”. OOC – “Out-of-country”. Source: UK Border Agency Management Information, year to 30 Sept. 2012
Skilled, Shortage, Sensible
28
Table 2.4: Top five SOC 2000 occupations by used Certificates of Sponsorship (CoS) for the RLMT, shortage occupation, short tem intra-company transfer and long term intra-company transfer routes, year to September 30 2012
Shortage occupation route
Occupation CoS used
In country
Out of country
Percentage of total
CoS used
Median annual pay (£)
2211 Medical practitioners 987 548 439 32% 47,000
5243 Lines repairers and cable jointers 258 13 245 8% 35,000
5434 Chefs, cooks 258 204 54 8% 29,000
2121 Civil engineers 211 92 119 7% 52,000
2314 Secondary education teaching professionals
191 133 58 6% 31,000
Total for all occupations 3,126 1,699 1,427 100% 37,000
RLMT route
Occupation CoS used
In country
Out of country
Percentage of total
CoS used
Median annual pay (£)
2132 Software professionals 2,057 1,184 873 12% 35,000
2329 Researchers n.e.c. 1,502 867 635 8% 30,000
2211 Medical practitioners 1,368 982 386 8% 46,000
3534 Finance and investment analysts 1,189 650 539 7% 45,000
3211 Nurses 1,182 641 541 7% 24,000
Total for all occupations 17,805 10,323 7,482 100% 36,000
Short term intra-company transfer route
Occupation CoS used
In country
Out of country
Percentage of total
CoS used
Median annual pay (£)
2132 Software professionals 9,933 419 9,514 70% 35,000
1136 Information and communication technology managers
723 22 701 5% 37,000
2423 Management consultants, actuaries, economists and statisticians
685 29 656 5% 71,000
2126 Design and development engineers
309 8 301 2% 38,000
3534 Finance and investment analysts 264 4 260 2% 64,000
Total for all occupations 14,094 598 13,496 100% 40,000
Long term intra-company transfer route
Occupation CoS used
In country
Out of country
Percentage of total
CoS used
Median annual pay (£)
2132 Software professionals 4,159 1,678 2,481 30% 47,000
1132 Marketing and sales managers 1,340 354 986 10% 55,000
1136 Information and communication technology managers
1,336 445 891 10% 72,000
2131 IT strategy and planning prof. 1,065 306 759 8% 80,000
2423 Management consultants, actuaries, economists and statisticians
792 182 610 6% 81,000
Total for all occupations 14,036 4,613 9,423 100% 65,000
Note: See notes in Table 2.3. Median annual pay rounded to the nearest thousand. Median annual salaries are calculated using both in and out-of-country CoS used and as such may double count some individuals. Source: UK Border Agency management information, year to September 30 2012
29
3.1 Introduction
3.1 For an occupation or job title to be placed on our recommended shortage occupation lists for the UK and Scotland it must pass three tests:
First, we consider whether individual occupations or job titles are sufficiently skilled to be included on the shortage occupation lists;
Second, we consider whether there is a shortage of labour within each skilled occupation or job title; and
Finally, we consider whether it is sensible for immigrant labour from outside the European Economic Area (EEA) to be used to fill these shortages.
3.2 In this chapter, we discuss how we compiled the recommended shortage occupation lists for the UK and Scotland. First, we introduce our conceptual approach, which combines top-down analysis of national-level data with bottom-up evidence relating to individual occupations and job titles. Next, we discuss our three tests of skill, shortage and sensible in turn, in each case discussing our top-down and bottom-up approaches. We then outline the way in which we present our top-down results for individual occupations in Chapters 5, 6 and 7 and provide a summary of our top-down results for all relevant occupations.
3.2 Our conceptual approach
3.3 In order to assess occupations and job titles against the three tests outlined above, we use a hybrid method that combines the consistency and comprehensive labour market coverage of top-down national data with more granulated bottom-up evidence submitted to us by our corporate partners.
3.4 We refer to the process of considering the top-down and bottom-up evidence in combination as dovetailing, and it is critical in determining the final recommended shortage occupation lists. We discuss this process at the end of this section.
Chapter 3 Our approach and methodology
Skilled, Shortage, Sensible
30
Occupations and job titles
3.5 We base our analysis on the Standard Occupational Classification (SOC) for the UK, which classifies occupations and job-title by similar skills and knowledge. The SOC is revised and updated approximately every ten years to reflect the changing composition of job roles in the UK economy. For this analysis we use the most recent version, SOC 2010. Previous iterations of the shortage methodology have used SOC 2000.
3.6 Both SOC 2000 and SOC 2010 use four levels of aggregation. The unit group (4-digit) level breaks down the labour market into 369 occupations. It is the most detailed and disaggregated occupational breakdown available in the top-down datasets used for our analysis. In this report, when we refer to an occupation we specifically mean a 4-digit SOC 2010 occupation unless otherwise stated.
3.7 Labour shortages often occur at the more detailed sub-occupational or job title level. In referring to job titles in this report we mean those job titles that are more specific than the SOC coding system provides for. National-level data are not available for individual job titles, meaning that bottom-up evidence is of particular importance in these cases.
3.8 Both individual job titles and whole occupations may be recommended for inclusion on the shortage occupation lists.
3.9 In June 2012 the minimum skill requirement for Tier 2 of the Points Based System (PBS) was raised to National Qualifications Framework level 6 and above (NQF6+), which broadly corresponds to bachelor‟s degree level. Individuals applying through Tier 2 must be sponsored to work in an occupation skilled at NQF6+, with the exception of a number of job titles on the shortage occupation list and certain creative occupations (see Chapter 9). For the purpose of this review, we invited evidence to demonstrate NQF6+ skill level for job titles embedded within occupations not skilled at this level. We received evidence of such in respect of job titles within the visual effects and 2D/3D computer animation for film, television and video games sector. We discuss this evidence in greater detail in Chapter 7.
3.10 The Government has also asked that we review evidence of shortage and sensible for job titles within occupations not skilled at NQF6+ currently on the shortage occupation list. These job titles are therefore eligible to remain on the list, subject to evidence of shortage. For clarity, occupations and job titles not skilled to NQF6+ and which are not on the current shortage list are not eligible for review.
Top-down
3.11 For our top-down approach we have analysed the most timely and relevant national-level labour market data available to us. The data sources used for our top-down analysis are the Labour Force Survey (LFS), the Annual Survey of Hours and Earning (ASHE), the National
Chapter 3: Our approach and methodology
31
Employers Skills Survey (NESS) and Jobcentre Plus (JCP) claimant count unemployment and vacancy data. In Migration Advisory Committee (2008) we set out in more detail the potential data sources available to us and these have not changed since that time.
3.12 We use these data sources to assess occupations and job titles against our tests of skill, shortage and sensible. For the skill and shortage tests, we set threshold values for our top-down indicators against which the occupational data are assessed. We do not use threshold values when interpreting our top-down indicators of sensible.
3.13 We published a list of 97 SOC 2010 occupations skilled at NQF6+ in Migration Advisory Committee (2012b). Therefore we did not carry out our top-down skills analysis in this review. We did carry out our shortage analysis for these 97 occupations.
Bottom-up
3.14 Bottom-up evidence comes from closer examination of individual occupations and job titles than national data allow. Crucially, this is informed by engagement with, and evidence provided by, a wide variety of corporate partners. The bottom-up evidence used in this report was collected by means of face-to-face meetings, written submissions of evidence and visits to workplaces.
3.15 Our approach to gathering bottom-up evidence has not fundamentally changed since we described it in Chapter 5 of Migration Advisory Committee (2008). For this review, a 10 week call for evidence was launched on our website in August 2012 accompanied by letters to over 1,700 corporate partners including Sector Skills Councils, officials in the Scottish Government, trade unions, trade bodies, employers and employer representatives. In addition, a letter was sent to all Permanent Secretaries of UK Government Departments informing them of the review and providing them with the opportunity to input.
3.16 We received 90 responses to our call for evidence. Much of it was highly useful. We acknowledge the widespread recognition of our skilled, shortage and sensible methodology and the need to tailor evidence to that. Where clarification was required, and where time allowed, we went back to those who submitted evidence.
3.17 We also took as many opportunities as possible to meet partners face-to-face and see people doing jobs at the ground level. A more detailed account of our engagement with corporate partners can be found in Chapter 1 of this report. The MAC Stakeholder Panel, made up of representatives from the Confederation of British Industry, Trades Union Congress, British Chamber of Commerce and the National Health Service Employers, also met to discuss the review.
Skilled, Shortage, Sensible
32
Dovetailing
3.18 Clearly, determining whether an occupation or job-title is in shortage will be most straightforward when the top-down and bottom-up data on any particular occupation or job title point to the same conclusion. However, there are reasons why this will not always be the case.
3.19 On some occasions, the top-down and bottom-up evidence will point to conflicting conclusions because evidence relates to different levels of disaggregation. There may be a shortage of workers with specific skills within an occupation (for example, a shortage of secondary school maths teachers) but not in the broader occupational group as a whole (for instance, no shortage of secondary school teachers in general). If the bottom-up evidence relates to a more specific job title than the top-down evidence then, even when the two sets of evidence point in different directions, they are not necessarily inconsistent with each other.
3.20 In addition, the usefulness of different indicators will sometimes vary between the top-down and bottom-up approaches. For instance, it may be difficult to obtain robust information on earnings growth (one of our indicators of shortage) within an occupation from sectoral or occupational bodies, whereas national-level data can provide this. In contrast, it is difficult to measure the level of on-the-job training (one of our indicators of skill) in some occupations using national-level data, whereas partner evidence can provide us with this information. These factors limit the extent to which we can corroborate top-down and bottom-up data against each other.
3.21 Broadly speaking, we look for indicators of skill, shortage and sensible in both the top-down and bottom-up evidence before making recommendations about the shortage occupation lists. Our approach distinguishes between cases where top-down data are highly relevant and where they are less so. Crudely, it can be categorised as follows:
In cases where top-down data are highly relevant, generally because the asserted shortage relates to the whole of the broad 4-digit occupation or a large part of it, we include occupations or relevant job titles on our recommended shortage occupation lists if, overall, there is a combination of good top-down and bottom-up evidence;
If the top-down data are not highly relevant, generally because the assertion of shortage relates to a narrow category within the relevant 4-digit occupation, we include the relevant job title on the list if there is sufficient bottom-up evidence.
3.22 We do not include occupations on the recommended shortage occupation lists where bottom-up evidence:
Does not satisfy our tests, in that the evidence indicates either that the occupation is not skilled to the appropriate level, or is not in shortage,
Chapter 3: Our approach and methodology
33
or that it is not sensible to fill any shortage through immigration, or any combination of these; or
Is non-existent, partial or not relevant, making it impossible to form a conclusion.
3.23 It follows from the above that we do not include occupations on our recommended shortage occupation lists on the basis of top-down evidence alone. We also have to use a degree of judgement in weighing strong top-down evidence against weak bottom-up evidence, or vice versa. In Chapters 5, 6 and 7, we set out explicitly where we have made such judgement.
The Scotland list
3.24 By definition, a UK list covers Scotland, meaning that the UK list will apply to Scotland as well as the rest of the UK. Our commission also requires that we produce a separate shortage occupation list for Scotland only, containing any additional occupations and/or job titles in Scotland that satisfy our three tests. This list is discussed in Chapter 8.
3.25 Because of Scotland‟s smaller population, the national-level data for Scotland are not based on a sufficient sample size for us to be able to use the same top-down methodology as for the rest of the UK. Although the Scotland list has been compiled primarily using bottom-up evidence, the new Employer Skills Survey (ESS) is available for Scotland at different levels of the SOC classification. We provide some analysis of these data in Chapter 8.
3.26 As part of our consideration of the Scotland list, we asked partners what efforts were being made to recruit people from elsewhere in the UK and the reasons why those efforts were not proving successful.
3.3 Skilled
3.27 There is no unique, objectively defined measure of skill. Our methodology examines factors that indicate whether an occupation is skilled at National Qualifications Framework (NQF) level 6 or above (NQF6+). This follows from the requirement that individual jobs under Tier 2 of the Points Based System (PBS) need to be skilled at NQF6+. Previously the required level was NQF level 3 or above (NQF3+) and later NQF level 4 or above (NQF4+).
3.28 Our methodology was initially developed in Migration Advisory Committee (2008). There are five main indicators that we believe are relevant to assessing skill, namely:
the skill level defined in the SOC hierarchy;
formal qualifications;
Skilled, Shortage, Sensible
34
earnings;
on-the-job training or experience required to carry out the job; and
the level of innate ability required.
3.29 The first three of these are assessed using top-down analysis.
Top-down
3.30 We produced a list of 97 occupations skilled at NQF6+ in Migration Advisory Committee (2012b). This list was produced using LFS and ASHE data for 2011 and is set out in Annex B. Given that this list was published recently the results are unlikely to have changed and so the analysis is not repeated for the purposes of this report. The methodology used to produce the list is detailed in Migration Advisory Committee (2012b) but for ease of reference is summarised below.
3.31 We determine which occupations pass the first three of these indicators using national-level data. Each of these top-down indicators is assessed against a threshold value, at or above which we consider the indicator to demonstrate skill at NQF6+. We consider an occupation to be skilled according to our top-down analysis if it passes the relevant threshold for at least two of the three top-down indicators.
3.32 Details of the three top-down indicators and their associated threshold values are given in Box 3.1. These are the same as those included in Migration Advisory Committee (2012b).
Box 3.1: Minimum threshold values used to identify occupations skilled at NQF6+
Earnings: We require median hourly earnings for full-time employees within an occupation to be £14.75 per hour or more. This is measured using the 2011 ASHE (SOC 2010).
Formal Qualifications: We require 36.4 per cent or more of the workforce within an occupation to be qualified to NQF6+. This is measured using the LFS covering the four quarters of Q1 2011 - Q4 2011.
SOC skill level: We require an occupation to be classified at level 4 in the SOC 2010 hierarchy.
An occupation must pass at least two of the three top-down indicators of skill to be considered skilled at NQF6+.
3.33 For the purposes of discussion in Chapters 5, 6 and 7 it is useful to convert the figure of £14.75 to an annual equivalent, in order to compare it to any partner evidence on annual pay. We can do this by multiplying hourly earnings by 2118, which is the ratio between mean annual pay of full-time employees (£32,659) and equivalent mean hourly pay (£15.42) in ASHE 2011 (in SOC 2010). The resulting annual equivalent figure is £31,241.
Chapter 3: Our approach and methodology
35
3.34 While we recognise that this ratio may vary across occupations, depending on the degree to which bonus payments contribute to annual remuneration, and variation in the average number of hours worked per year, we believe that this rule of thumb approach is appropriate to compare annual earnings data with our top-down threshold value.
Bottom-up
3.35 The top-down analysis is complemented by the use of partner evidence to assess earnings and qualifications. We also take into account partner evidence relating to two further indicators of skill: on-the-job training or experience; and innate ability, which cannot be measured using national-level data.
3.36 We acknowledge that certain job titles not within an occupation skilled at NQF6+ may nonetheless be skilled at NQF6+, although the lack of corroborating top-down evidence means that strong bottom-up evidence is required to demonstrate this. In relation to such job titles, we requested information on the typical skills, earnings and qualifications of the workforce on the basis that we could challenge the skill level of the job title in question if necessary.
3.37 In Migration Advisory Committee (2012b) we did not receive any partner evidence relating to the skill level of occupations or job-titles and so did not make any changes to the list produced by our top-down analysis. Given that we do not repeat our top-down analysis here, our analysis of skill for this review consists of considering job titles not within an occupation skilled at NQF6+.
3.38 This analysis is discussed in Chapters 5, 6 and 7. In our call for evidence we requested bottom-up information on as many of the following indicators of skill as possible:
Typical earnings, or ranges of earnings in the job title.
Information on the proportion of individuals qualified at various levels (particularly at NQF6+).
Minimum qualifications required (either informally or on a regulatory basis) to be a skilled practitioner in a particular job title.
Evidence of the required or compulsory level or duration of on-the-job training or experience to become a skilled practitioner.
Evidence that innate ability, of a level or rarity which exceeds such requirements in a typical NQF4+ job title, is required.
3.4 Shortage
3.39 As with skill, there is no single universal definition or measure of labour shortage. Various approaches are used across different countries. In our
Skilled, Shortage, Sensible
36
analysis of shortage, we use a range of top-down and bottom-up indicators.
3.40 To fully assess labour shortage it is necessary to look at various price indicators (wages), as well as volumes (vacancies, employment and unemployment) and employer feedback on shortage. In Migration Advisory Committee (2008) we identified a total of 12 indicators of labour shortage for our top-down analysis. The 12 top-down indicators fell into four broad categories:
employer-based indicators (e.g. reports of shortage);
price-based indicators (e.g. earnings growth);
volume-based indicators (e.g. employment or unemployment); and
other indicators of imbalance based on administrative data (e.g. vacancy duration or vacancy/unemployment ratios).
Top-down
3.41 A key issue to consider for the top-down shortage analysis in this report is that, in line with the list of occupations skilled to NQF6+ in Migration Advisory Committee (2012b), the analysis is carried out in SOC 2010 as opposed to SOC 2000. A large proportion of the data that is used for the top-down analysis has not yet been published in SOC 2010 or has not be published in this format retrospectively. These data therefore need to be converted to SOC 2010. Details of the data conversion and top-down methodology used to assess shortage are described in full in Annex C. The top-down methodology is summarised below.
3.42 The 12 top down indicators of shortage and the data used to calculate each are detailed in Table 3.1. As with the top-down indicators of skill, we assign each indicator of shortage a threshold value. However, unlike for the thresholds of skill, we adopt what we refer to as a benchmarking approach for assessing the top-down indicators of shortage. This involves fixing the passing threshold for an indicator to a point of historical stability in the labour market, which we define as having occurred at the end of 2008. This approach means that if there is, for example, a downward shift in wages in response to changes in economic conditions, then fewer occupations are identified as being in shortage. The threshold values are listed in Annex C.
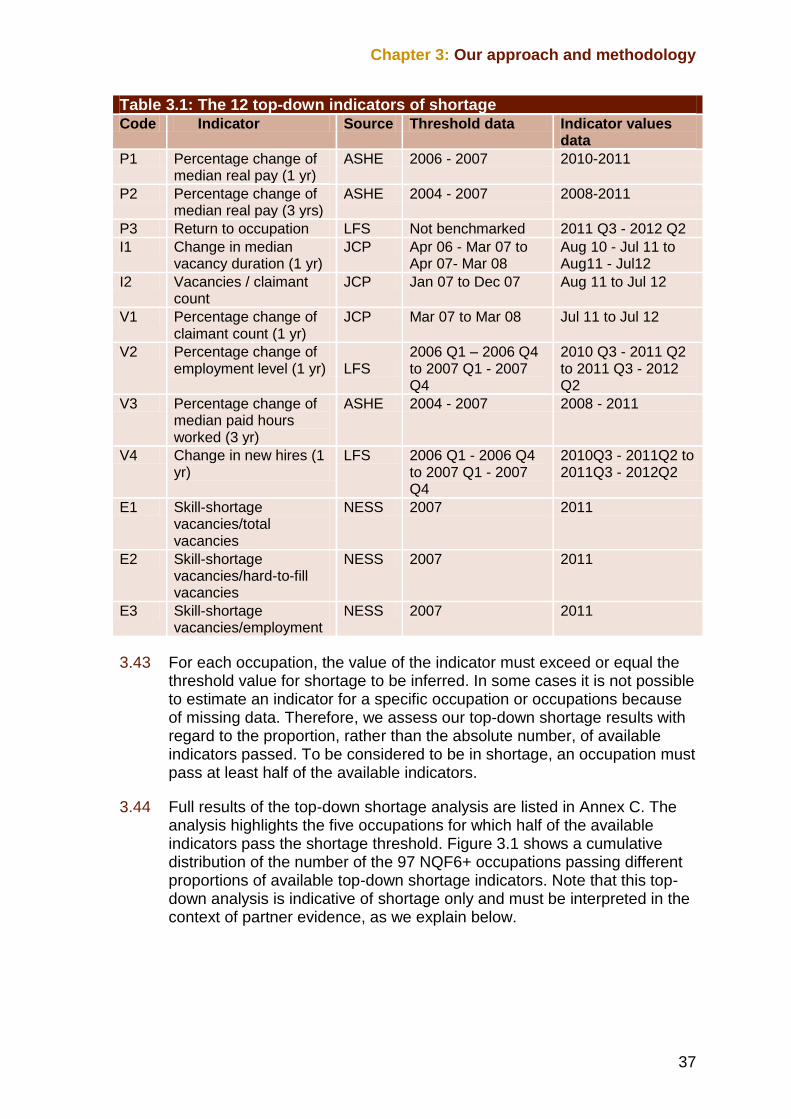
Chapter 3: Our approach and methodology
37
Table 3.1: The 12 top-down indicators of shortage Code Indicator Source Threshold data Indicator values
data
P1 Percentage change of median real pay (1 yr)
ASHE 2006 - 2007 2010-2011
P2 Percentage change of median real pay (3 yrs)
ASHE 2004 - 2007 2008-2011
P3 Return to occupation LFS Not benchmarked 2011 Q3 - 2012 Q2
I1 Change in median vacancy duration (1 yr)
JCP Apr 06 - Mar 07 to Apr 07- Mar 08
Aug 10 - Jul 11 to Aug11 - Jul12
I2 Vacancies / claimant count
JCP Jan 07 to Dec 07 Aug 11 to Jul 12
V1 Percentage change of claimant count (1 yr)
JCP Mar 07 to Mar 08 Jul 11 to Jul 12
V2 Percentage change of employment level (1 yr) LFS
2006 Q1 – 2006 Q4 to 2007 Q1 - 2007 Q4
2010 Q3 - 2011 Q2 to 2011 Q3 - 2012 Q2
V3 Percentage change of median paid hours worked (3 yr)
ASHE 2004 - 2007 2008 - 2011
V4 Change in new hires (1 yr)
LFS 2006 Q1 - 2006 Q4 to 2007 Q1 - 2007 Q4
2010Q3 - 2011Q2 to 2011Q3 - 2012Q2
E1 Skill-shortage vacancies/total vacancies
NESS 2007 2011
E2 Skill-shortage vacancies/hard-to-fill vacancies
NESS 2007 2011
E3 Skill-shortage vacancies/employment
NESS 2007 2011
3.43 For each occupation, the value of the indicator must exceed or equal the threshold value for shortage to be inferred. In some cases it is not possible to estimate an indicator for a specific occupation or occupations because of missing data. Therefore, we assess our top-down shortage results with regard to the proportion, rather than the absolute number, of available indicators passed. To be considered to be in shortage, an occupation must pass at least half of the available indicators.
3.44 Full results of the top-down shortage analysis are listed in Annex C. The analysis highlights the five occupations for which half of the available indicators pass the shortage threshold. Figure 3.1 shows a cumulative distribution of the number of the 97 NQF6+ occupations passing different proportions of available top-down shortage indicators. Note that this top-down analysis is indicative of shortage only and must be interpreted in the context of partner evidence, as we explain below.
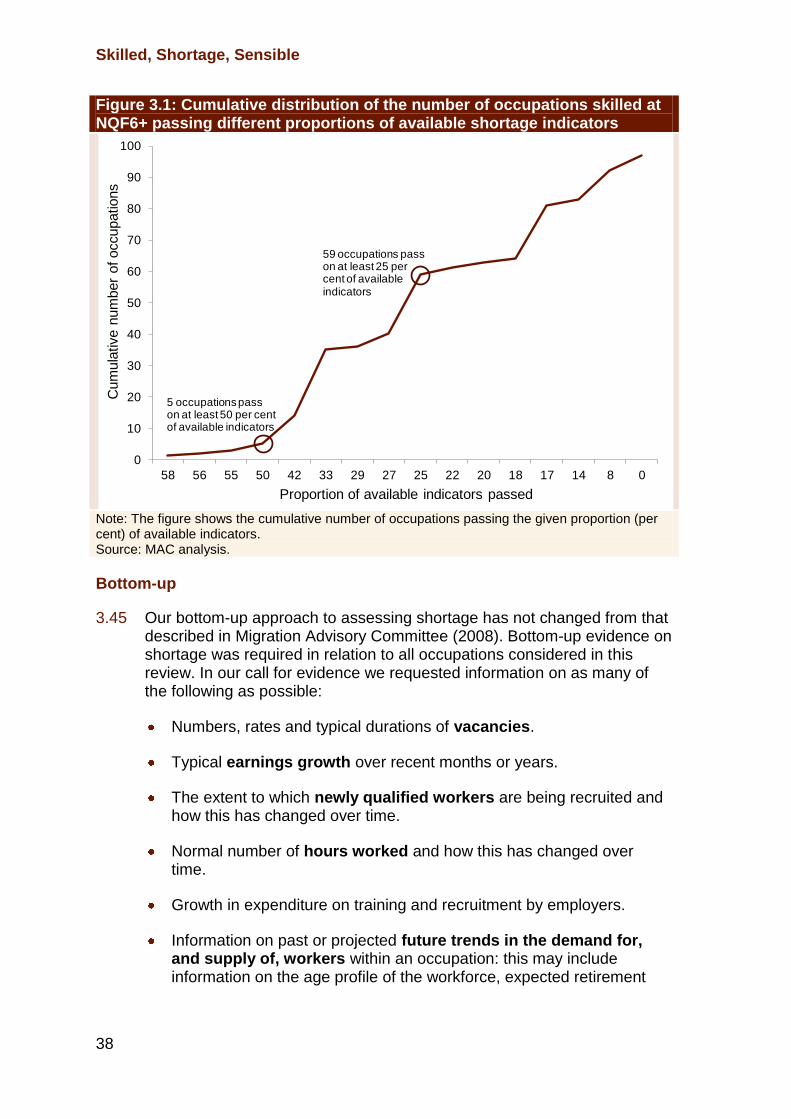
Skilled, Shortage, Sensible
38
Figure 3.1: Cumulative distribution of the number of occupations skilled at NQF6+ passing different proportions of available shortage indicators
Note: The figure shows the cumulative number of occupations passing the given proportion (per cent) of available indicators. Source: MAC analysis.
Bottom-up
3.45 Our bottom-up approach to assessing shortage has not changed from that described in Migration Advisory Committee (2008). Bottom-up evidence on shortage was required in relation to all occupations considered in this review. In our call for evidence we requested information on as many of the following as possible:
Numbers, rates and typical durations of vacancies.
Typical earnings growth over recent months or years.
The extent to which newly qualified workers are being recruited and how this has changed over time.
Normal number of hours worked and how this has changed over time.
Growth in expenditure on training and recruitment by employers.
Information on past or projected future trends in the demand for, and supply of, workers within an occupation: this may include information on the age profile of the workforce, expected retirement
0
10
20
30
40
50
60
70
80
90
100
58 56 55 50 42 33 29 27 25 22 20 18 17 14 8 0
Cum
ula
tive n
um
ber
of occupations
Proportion of available indicators passed
5 occupations pass on at least 50 per centof available indicators
59 occupations pass on at least 25 per cent of available indicators
Chapter 3: Our approach and methodology
39
patterns, and the number of newly qualified workers expected to come on stream.
3.46 However, as is the case when assessing bottom-up evidence of skill, we did not restrict ourselves to a pre-determined list of indicators. Instead, we considered any evidence from our partners potentially relevant to consideration of whether an occupation or job title is experiencing labour shortage.
3.5 Sensible
3.47 In our first review of the shortage occupation lists (Migration Advisory Committee, 2008) we said: “It is worth emphasising from the outset that „sensible‟ can be interpreted in many different ways based on a wide range of considerations. Clearly, any definition of what is sensible critically depends on the underlying objectives. The objectives of immigration policy are determined by the Government and not by this Committee. Therefore, to reconcile competing interests we need to look at government policies to identify how the Government balances and/or prioritises different interests”. We retain that view.
Our approach
3.48 Our approach since 2008 has been to consider the issue of sensible on a case-by-case basis with reference to four broad and inter-related lines of inquiry:
What are the alternatives to employing immigrants in response to perceived staff shortages, are these alternatives feasible, and have employers explored them fully? If not, what are the actual or perceived obstacles?
How would bringing in immigrants relate to skills acquisition of the UK workforce? Are there enough UK resident workers in training/education to fill shortages? Will bringing in immigrants reduce employers‟ incentives to invest in training and up-skilling of UK workers?
How will the employment of immigrants affect investment, innovation and productivity growth? Is there a particular case for employing immigrants to support and maintain the UK's international competitiveness in certain sectors?
How will our decision affect the wider UK labour market and economy? How, if at all, will access to immigrant labour affect employment opportunities and conditions of the UK workforce?
3.49 In Migration Advisory Committee (2011) we re-examined our sensible criteria and considered whether they accurately reflected the objectives of the current Government. We considered the coalition Programme for Government (Cabinet Office, 2010). We supplemented our consideration
Skilled, Shortage, Sensible
40
of the coalition agreement with examination of publications produced by relevant Government departments including HM Treasury, the Department for Business, Innovation and Skills and the Department for Work and Pensions. We also invited all Government departments to submit evidence to this review.
3.50 Overall, we concluded that the objectives of the current Government corresponded quite well with the MAC‟s sensible criteria. Some Government priorities in relation to the economy and labour market, such as raising the skills of UK workers, stimulating inward investment and promoting high levels of employment, link specifically to the MAC‟s lines of inquiry. Other priorities such as support for green growth and the creation of a more balanced economy could be accommodated within the MAC framework.
3.51 We concluded that our previous sensible criteria were sufficiently broad and flexible to capture the priorities of the current Government and retained all four lines of enquiry as described above.
Top-down indicators
3.52 There are a limited number of numerical indicators available that might provide context to our consideration of sensible:
The share of non-EEA immigrants already employed in an occupation gives an indication of the reliance of immigrant labour from outside the UK.
The percentage of the workforce in receipt of training within the last 13 weeks provides some measure of investment in training, although the LFS variable available provides only a crude measure of training activity.
The change in earnings provides an indication of whether employers have made efforts to respond to shortages by raising wages or, conversely, whether migrants may be being used as a cheaper substitute for domestic labour.
The proportion of unemployed workers associated with an occupation, or a rise in that proportion, gives an indication of the scope for increasing employment of UK resident workers as an alternative to employing migrants (but it does not capture inactive workers).
The change in hours worked for full-time employees provides an indication that employers may be increasing hours as an alternative to using immigration when vacancies cannot be filled, subject to practical and legal constraints on working hours.
3.53 These data are presented for individual occupations in Chapters 5, 6 and 7. The first two of these indicators are based on the last four quarters of the LFS for which data are available, covering 2011 Q3 - 2012 Q2
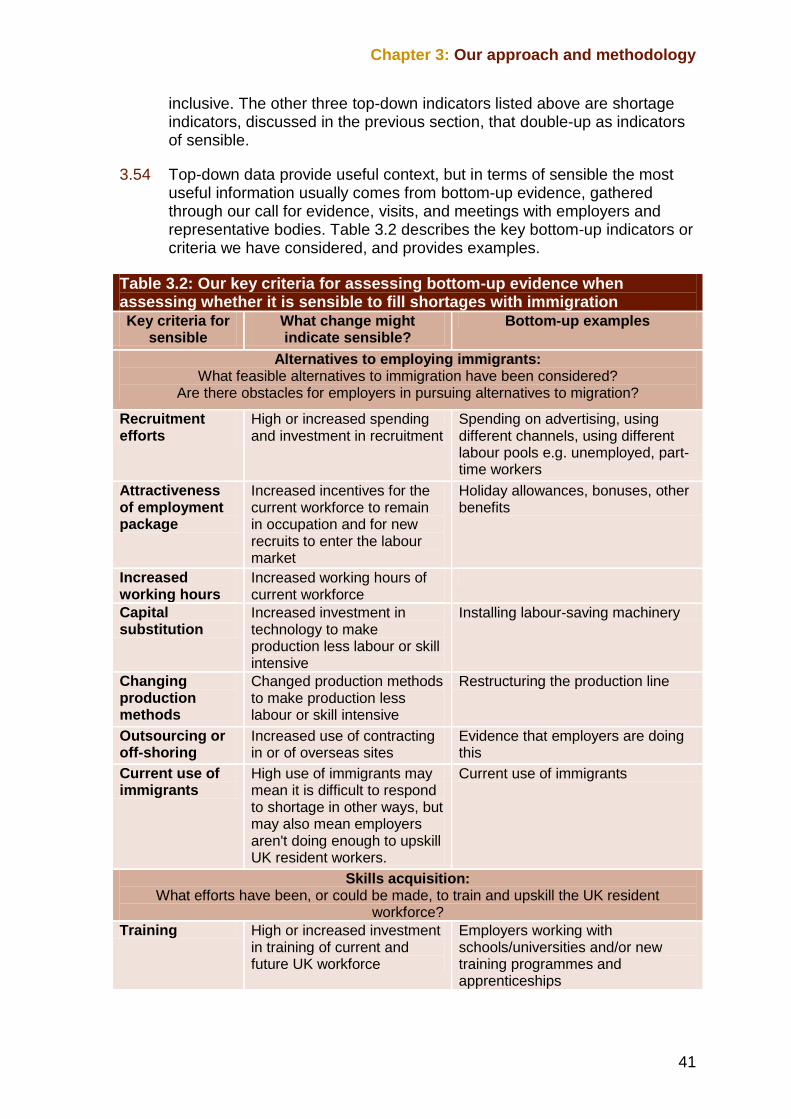
Chapter 3: Our approach and methodology
41
inclusive. The other three top-down indicators listed above are shortage indicators, discussed in the previous section, that double-up as indicators of sensible.
3.54 Top-down data provide useful context, but in terms of sensible the most useful information usually comes from bottom-up evidence, gathered through our call for evidence, visits, and meetings with employers and representative bodies. Table 3.2 describes the key bottom-up indicators or criteria we have considered, and provides examples.
Table 3.2: Our key criteria for assessing bottom-up evidence when assessing whether it is sensible to fill shortages with immigration Key criteria for
sensible What change might indicate sensible?
Bottom-up examples
Alternatives to employing immigrants: What feasible alternatives to immigration have been considered?
Are there obstacles for employers in pursuing alternatives to migration?
Recruitment efforts
High or increased spending and investment in recruitment
Spending on advertising, using different channels, using different labour pools e.g. unemployed, part-time workers
Attractiveness of employment package
Increased incentives for the current workforce to remain in occupation and for new recruits to enter the labour market
Holiday allowances, bonuses, other benefits
Increased working hours
Increased working hours of current workforce
Capital substitution
Increased investment in technology to make production less labour or skill intensive
Installing labour-saving machinery
Changing production methods
Changed production methods to make production less labour or skill intensive
Restructuring the production line
Outsourcing or off-shoring
Increased use of contracting in or of overseas sites
Evidence that employers are doing this
Current use of immigrants
High use of immigrants may mean it is difficult to respond to shortage in other ways, but may also mean employers aren't doing enough to upskill UK resident workers.
Current use of immigrants
Skills acquisition: What efforts have been, or could be made, to train and upskill the UK resident
workforce?
Training High or increased investment in training of current and future UK workforce
Employers working with schools/universities and/or new training programmes and apprenticeships
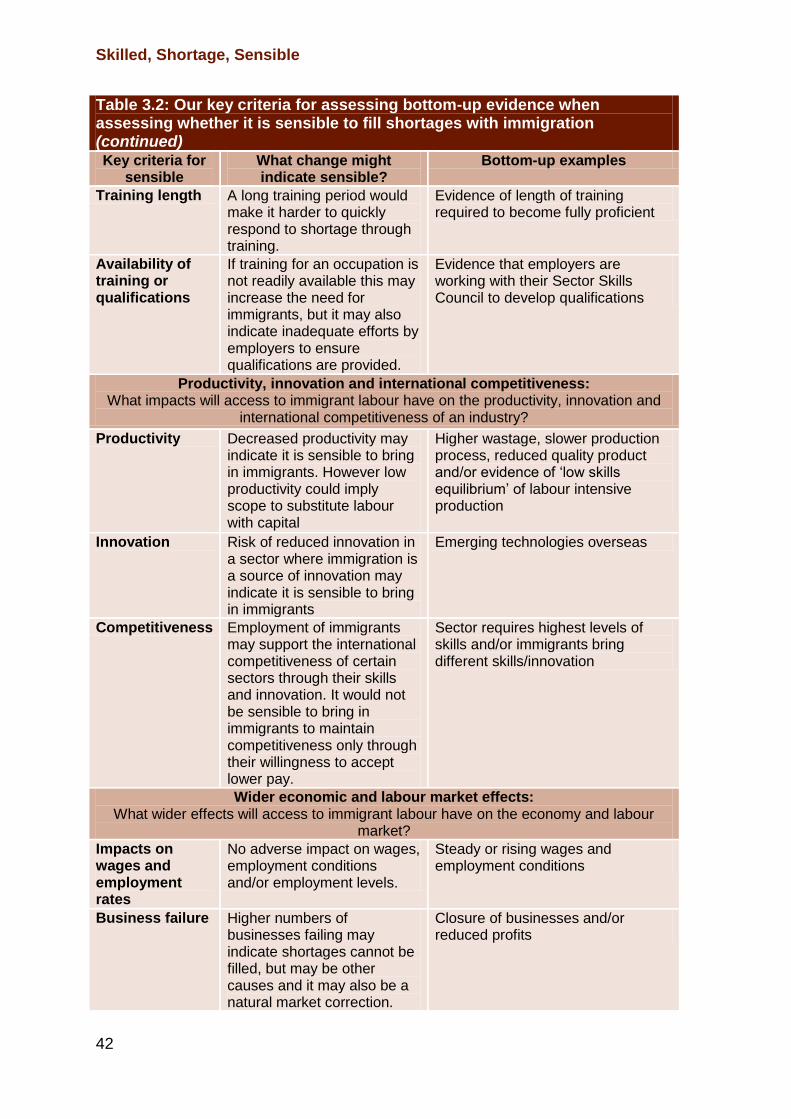
Skilled, Shortage, Sensible
42
Table 3.2: Our key criteria for assessing bottom-up evidence when assessing whether it is sensible to fill shortages with immigration (continued) Key criteria for
sensible What change might indicate sensible?
Bottom-up examples
Training length A long training period would make it harder to quickly respond to shortage through training.
Evidence of length of training required to become fully proficient
Availability of training or qualifications
If training for an occupation is not readily available this may increase the need for immigrants, but it may also indicate inadequate efforts by employers to ensure qualifications are provided.
Evidence that employers are working with their Sector Skills Council to develop qualifications
Productivity, innovation and international competitiveness: What impacts will access to immigrant labour have on the productivity, innovation and
international competitiveness of an industry?
Productivity Decreased productivity may indicate it is sensible to bring in immigrants. However low productivity could imply scope to substitute labour with capital
Higher wastage, slower production process, reduced quality product and/or evidence of „low skills equilibrium‟ of labour intensive production
Innovation Risk of reduced innovation in a sector where immigration is a source of innovation may indicate it is sensible to bring in immigrants
Emerging technologies overseas
Competitiveness Employment of immigrants may support the international competitiveness of certain sectors through their skills and innovation. It would not be sensible to bring in immigrants to maintain competitiveness only through their willingness to accept lower pay.
Sector requires highest levels of skills and/or immigrants bring different skills/innovation
Wider economic and labour market effects: What wider effects will access to immigrant labour have on the economy and labour
market?
Impacts on wages and employment rates
No adverse impact on wages, employment conditions and/or employment levels.
Steady or rising wages and employment conditions
Business failure Higher numbers of businesses failing may indicate shortages cannot be filled, but may be other causes and it may also be a natural market correction.
Closure of businesses and/or reduced profits
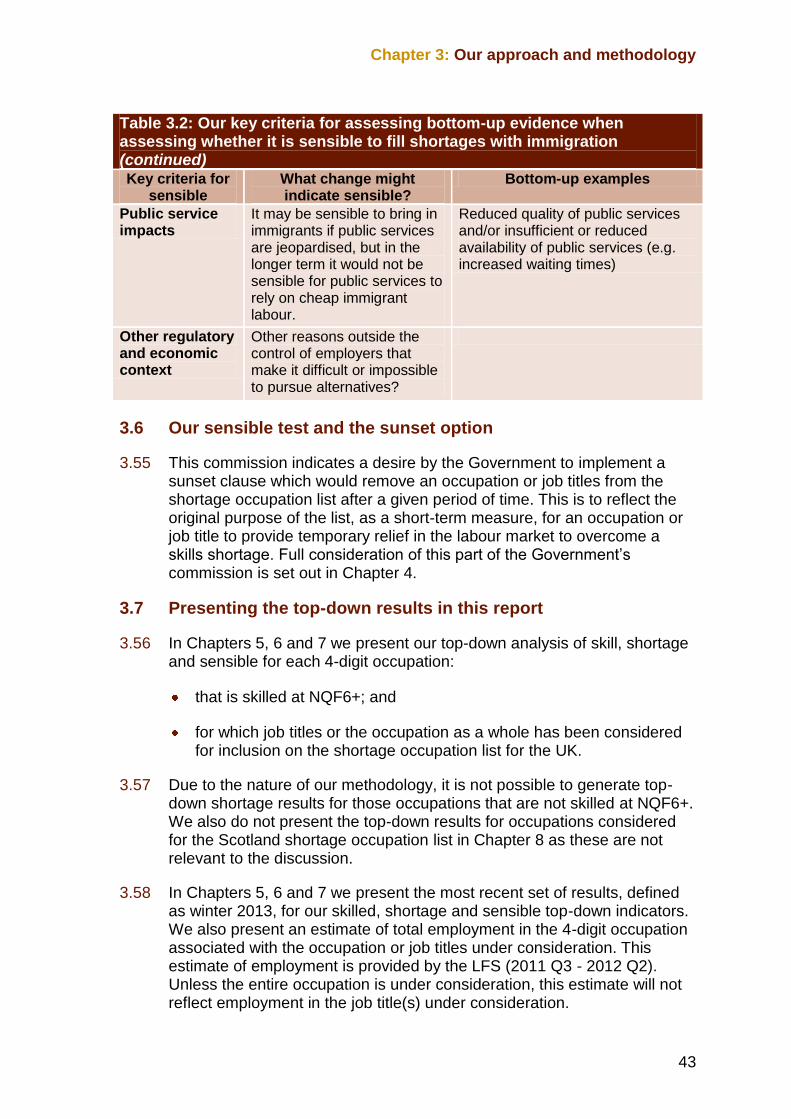
Chapter 3: Our approach and methodology
43
Table 3.2: Our key criteria for assessing bottom-up evidence when assessing whether it is sensible to fill shortages with immigration (continued) Key criteria for
sensible What change might indicate sensible?
Bottom-up examples
Public service impacts
It may be sensible to bring in immigrants if public services are jeopardised, but in the longer term it would not be sensible for public services to rely on cheap immigrant labour.
Reduced quality of public services and/or insufficient or reduced availability of public services (e.g. increased waiting times)
Other regulatory and economic context
Other reasons outside the control of employers that make it difficult or impossible to pursue alternatives?
3.6 Our sensible test and the sunset option
3.55 This commission indicates a desire by the Government to implement a sunset clause which would remove an occupation or job titles from the shortage occupation list after a given period of time. This is to reflect the original purpose of the list, as a short-term measure, for an occupation or job title to provide temporary relief in the labour market to overcome a skills shortage. Full consideration of this part of the Government‟s commission is set out in Chapter 4.
3.7 Presenting the top-down results in this report
3.56 In Chapters 5, 6 and 7 we present our top-down analysis of skill, shortage and sensible for each 4-digit occupation:
that is skilled at NQF6+; and
for which job titles or the occupation as a whole has been considered for inclusion on the shortage occupation list for the UK.
3.57 Due to the nature of our methodology, it is not possible to generate top-down shortage results for those occupations that are not skilled at NQF6+. We also do not present the top-down results for occupations considered for the Scotland shortage occupation list in Chapter 8 as these are not relevant to the discussion.
3.58 In Chapters 5, 6 and 7 we present the most recent set of results, defined as winter 2013, for our skilled, shortage and sensible top-down indicators. We also present an estimate of total employment in the 4-digit occupation associated with the occupation or job titles under consideration. This estimate of employment is provided by the LFS (2011 Q3 - 2012 Q2). Unless the entire occupation is under consideration, this estimate will not reflect employment in the job title(s) under consideration.
Skilled, Shortage, Sensible
44
3.59 When presenting our top-down results for shortage, we use a colour coded system to indicate whether the indicator passes or does not pass its associated threshold value. We define an indicator as passed and colour it green if it indicates shortage. If the indicator does not pass then we colour it red.
3.60 We do not use the colour coded system for our top-down indicators of sensible as they do not have associated threshold values. Three of our top-down indicators of skill double-up as top-down indicators of sensible. Therefore, in Chapters 5, 6 and 7 these indicators have a colour attached to them. In assessing sensible, these colours have no meaning.
3.8 Conclusions
3.61 Our broad approach to compiling the recommended shortage occupation lists for the UK and Scotland has not changed substantially from that which we first presented in Migration Advisory Committee (2008). Since that review, we have updated our top-down methodology for identifying skilled occupations both to reflect the increase in the skill level of Tier 2 from NQF3+ to NQF4+ and again to NQF6+ and as a result of the findings from our externally commissioned and internal research. Other than to reflect this increase in the skill level of Tier 2, our bottom-up approach has remained unchanged since autumn 2008.
3.62 Since Migration Advisory Committee (2008), we have also revised our methodology for assessing labour shortage using top-down data, again as a result of the findings of our externally commissioned and internal research. Some of these changes have been relatively minor; for example, increasing the length of time over which a particular indicator is estimated. Some have been more substantial; for example, the introduction of our benchmarking approach to defining the threshold values for our indicators. Our bottom-up framework has remained unchanged since autumn 2008.
3.63 Assessment of our sensible test has been heavily contingent on bottom-up, rather than top-down, evidence since Migration Advisory Committee (2008) and remains so. We have not made any changes to our top-down indicators of sensible since that review.
3.64 In the following chapters we assess job titles and occupations for inclusion on our updated recommended shortage occupation lists for the UK and Scotland. Where appropriate, we have presented our top-down results for skill, shortage and sensible. When discussing occupations as a whole, we consider our top-down results to be entirely relevant to the discussion. When discussing job titles, we have made a judgement as to how relevant we believe the top-down results to be.
Chapter 4: Sunset clause
45
4.1 Introduction
4.1 This chapter considers the following section in our commission from the Government:
“The Government has indicated that it wishes to remove from the SOL all occupations that have been on it for more than a given period, in principle two years, regardless of shortages affecting the sectors concerned. This reflects the fact that inclusion on the SOL is intended to provide temporary relief while measures are taken to mitigate the shortages. The MAC is asked to advise on:
A standard period after which removal from the SOL should become automatic and whether exceptions should be permitted.
Whether a transitional period should be accorded to those occupations currently on the SOL and which have exceeded the advised standard period.
In advising on 2 i) and ii), the MAC should have regard to time already spent on the SOL and mitigation measures taken, plans for further mitigation measures and the business impact of removal from the SOL.”
4.2 This chapter is structured as follows:
Section 4.2 considers the rationale for introducing a sunset clause;
Section 4.3 provides details as to the usage of the shortage occupation list;
Section 4.4 outlines our current approach to considering occupations and job titles for inclusion on, or removal from, the shortage occupation list;
Section 4.5 discusses the evidence we received from partners in respect of a sunset clause; and
our conclusions and recommendations are summarised in Section 4.6.
Sunset clause Chapter 4
Skilled, Shortage, Sensible
46
4.2 Sunset clause: rationale
4.3 As explained in Chapter 2, the objective of the shortage occupation list is to provide a route for employers to recruit non-EEA workers in occupations or job titles that are deemed to be experiencing a skill shortage.
4.4 The Government has said that it would like to enforce the temporary nature of inclusion on the shortage occupation list by removing occupations from the list after a given period. In this report, we refer to this process as a sunset clause. The rationale for taking occupations off the list after a specified period of time is to:
discourage complacency and over-reliance on migrant labour among employers;
motivate employers to train and up-skill resident workers; and
alert education providers and governing bodies to the efficacy of their attempts to address skill shortages.
4.3 The shortage occupation list
4.5 The numbers using the shortage occupation list as a route for entry under Tier 2 are relatively small. Only around 3,100 in- and out of country Certificates of Sponsorship (CoS) were issued under the shortage occupation list route in the year to end September 2012, compared with just under 51,000 CoS issued under Tier 2 (General) and the intra-company transfer route combined. (Figure 4.1).
4.6 The number of CoS issued in respect to the shortage occupation list route represent a small proportion of Tier 2 General usage, just 15 per cent. Similarly, the shortage occupation list route accounted for only 6 per cent of CoS issued for the whole of Tier 2.
4.7 Moreover, inflows under the shortage route were lower still at around 1,400. This is equivalent to just 0.26 per cent of total immigration to the UK each year and 0.005 per cent of total UK employment. Expressed differently, total current shortage occupation list inflows amount to one in every 400 immigrants and practically one in every 20,000 employed persons in the UK.
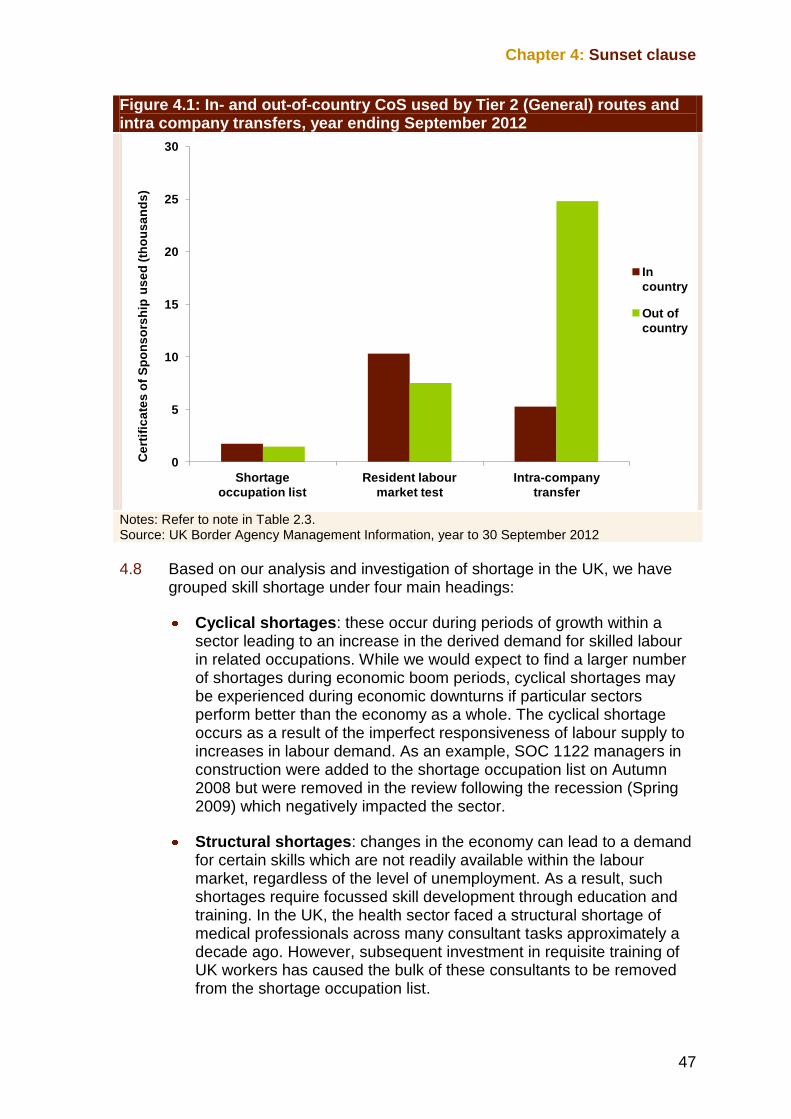
Chapter 4: Sunset clause
47
Figure 4.1: In- and out-of-country CoS used by Tier 2 (General) routes and intra company transfers, year ending September 2012
Notes: Refer to note in Table 2.3. Source: UK Border Agency Management Information, year to 30 September 2012
4.8 Based on our analysis and investigation of shortage in the UK, we have grouped skill shortage under four main headings:
Cyclical shortages: these occur during periods of growth within a sector leading to an increase in the derived demand for skilled labour in related occupations. While we would expect to find a larger number of shortages during economic boom periods, cyclical shortages may be experienced during economic downturns if particular sectors perform better than the economy as a whole. The cyclical shortage occurs as a result of the imperfect responsiveness of labour supply to increases in labour demand. As an example, SOC 1122 managers in construction were added to the shortage occupation list on Autumn 2008 but were removed in the review following the recession (Spring 2009) which negatively impacted the sector.
Structural shortages: changes in the economy can lead to a demand for certain skills which are not readily available within the labour market, regardless of the level of unemployment. As a result, such shortages require focussed skill development through education and training. In the UK, the health sector faced a structural shortage of medical professionals across many consultant tasks approximately a decade ago. However, subsequent investment in requisite training of UK workers has caused the bulk of these consultants to be removed from the shortage occupation list.
0
5
10
15
20
25
30
Shortage
occupation list
Resident labour
market test
Intra-company
transfer
Ce
rtif
ica
tes
of
Sp
on
so
rsh
ip u
se
d (
tho
us
an
ds
)
In
country
Out of
country
Skilled, Shortage, Sensible
48
Public sector pay: public sector (or primarily publicly funded) occupations are particularly affected by budgetary restrictions which hinder employers‟ ability to increase the attractiveness of jobs by raising pay. In the UK, an example of such a shortage in the public sector is amongst maths teachers.
Global talent: in some cases only a relatively small number of people have the skills, knowledge, talent or ability to do the job in question and employers have limited options to address the deficit in the supply of skilled workers when compared to the demand for the skills in the occupation. As an example, ballet dancers and engineers in the oil and gas industry operate in a mobile, world market and employers therefore require the ability to recruit these specialist skills internationally in order to remain competitive.
4.9 The shortage occupation list has provided relief to employers that have been facing different types of shortage, sometimes in very specific jobs and sectors only.
4.4 Our current approach
4.10 We conduct regular reviews of the shortage occupation list when commissioned to do so by the Government. To date, we have completed four full reviews of the shortage occupation list since 2008 and one revision of the skill level. Occupations or job titles are recommended for addition to, or retention on, the shortage occupation list if we are satisfied that the occupation or job title is skilled to the required level, that the occupation or job title is in shortage in the resident labour market and that it is sensible to use non-EEA labour to fill this shortage. Chapter 3 sets out how we go about determining whether an occupation or job title meets each of the three tests of skilled, shortage and sensible.
4.11 When we developed our skill, shortage, sensible methodology, we were keen that the shortage occupation list did not act as a disincentive for partners to invest in the training and up-skilling of resident workers. To ensure that the shortage occupation list provided temporary relief for skill shortages, we required that partners provide us with evidence that it was sensible to recruit migrant labour to mitigate the effects of shortage whilst a long term solution was put in place and took effect. In our reviews, we consider the issue of sensible on a case-by-case basis with reference to four broad and inter-related lines of inquiry:
What are the alternatives to employing immigrants in response to a perceived shortage in available labour?
How would the use of Tier 2 migration relate to the skills acquisition of the UK workforce?
How would the employment of non-EEA migrant workers affect investment, innovation and productivity growth?
Chapter 4: Sunset clause
49
How would our decision impact the wider UK labour market and economy?
4.12 Table 3.2 illustrates the factors we consider when determining whether our sensible test has been met. The table outlines the evidence we expect partners to provide to demonstrate that steps to address skill shortages are being taken. This forms the basis of our “sensible” criterion and is a significant part of our consideration as to whether to recommend the addition or retention of occupations or job titles on the shortage list.
4.13 At each review employers are required to provide relevant evidence, aligned with our methodology, to show that they are experiencing a national shortage in a skilled occupation or job title which can be sensibly addressed through inclusion on the shortage occupation list.
4.14 Since publication of our first shortage list in autumn 2008 we have carried out periodic reviews which have resulted in significant movement of occupations and job titles both on to and off the list. As is discussed below this has been due to the application of our shortage and sensible criteria and a change in the skill requirement over time.
4.15 In February 2011, the skill level requirement under Tier 2 of the Points Based System (PBS) increased from National Qualification Framework level 3 and above (NQF3+) to National Qualification Framework level 4 and above (NQF4+). This affected a small number of job titles as shown in Table 4.1 below. In February 2012, the skill threshold was increased once more, to NQF level 6 and above (NQF6+). The Home Office chose not to remove occupations or job titles from the shortage occupation list following this change.
4.16 Table 4.2 provides an overview of those job titles that were removed from the list during the four review periods because they failed to pass the shortage or the sensible test. The table also demonstrates the period of time during which each job title was on the shortage occupation list - the solid black squares indicate the period to which the job title was on the shortage occupation list, and the white indicates the period which the job title was not on the list.
4.17 Table 4.2 demonstrates that job titles can remain on the shortage occupation lists for differing periods of time, reflecting the differing nature of the shortage in question. For example, the job title dietician was added to the shortage occupation list in our Autumn 2008 review, but was removed when we next reviewed the list in Spring 2009, indicating a short-term shortage which was easily resolved. By contrast, the job title veterinary surgeon was added to the shortage occupation list in our Autumn 2008 review and was retained during subsequent reviews until removed from the list in our Autumn 2011 review, suggesting that efforts to alleviate such shortage were less immediate.
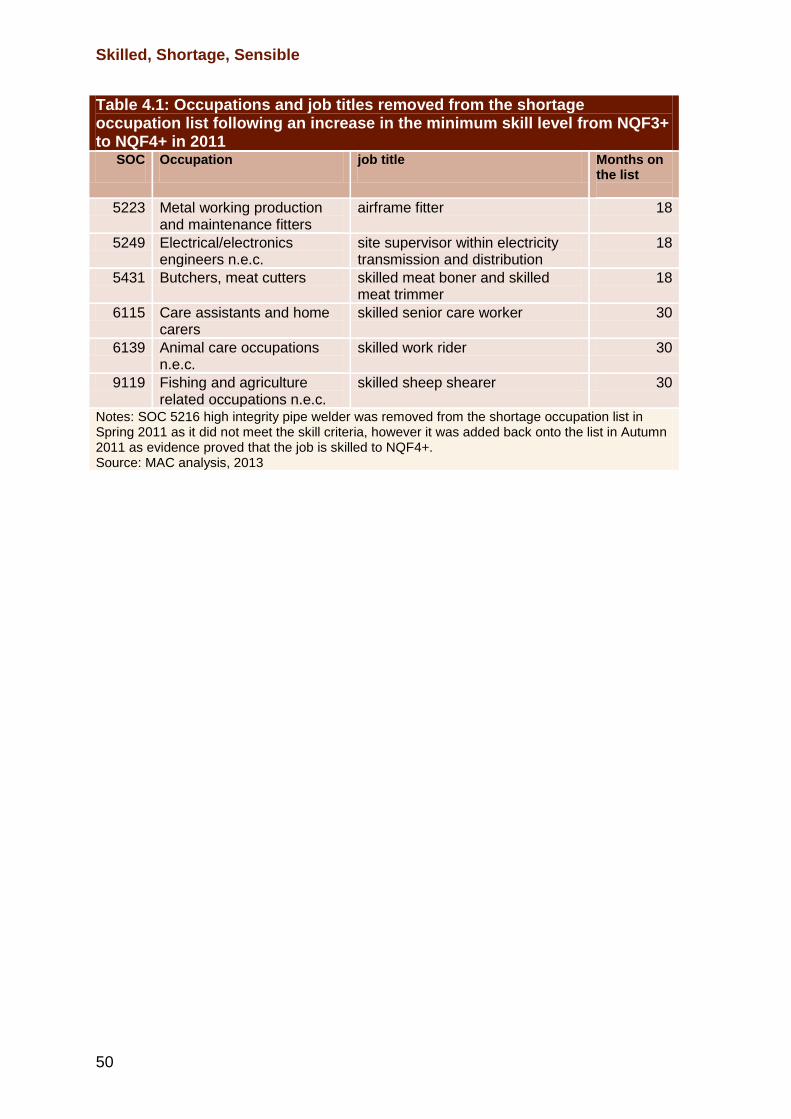
Skilled, Shortage, Sensible
50
Table 4.1: Occupations and job titles removed from the shortage occupation list following an increase in the minimum skill level from NQF3+ to NQF4+ in 2011
SOC
Occupation
job title
Months on the list
5223 Metal working production and maintenance fitters
airframe fitter 18
5249 Electrical/electronics engineers n.e.c.
site supervisor within electricity transmission and distribution
18
5431 Butchers, meat cutters skilled meat boner and skilled meat trimmer
18
6115 Care assistants and home carers
skilled senior care worker 30
6139 Animal care occupations n.e.c.
skilled work rider 30
9119 Fishing and agriculture related occupations n.e.c.
skilled sheep shearer 30
Notes: SOC 5216 high integrity pipe welder was removed from the shortage occupation list in Spring 2011 as it did not meet the skill criteria, however it was added back onto the list in Autumn 2011 as evidence proved that the job is skilled to NQF4+. Source: MAC analysis, 2013
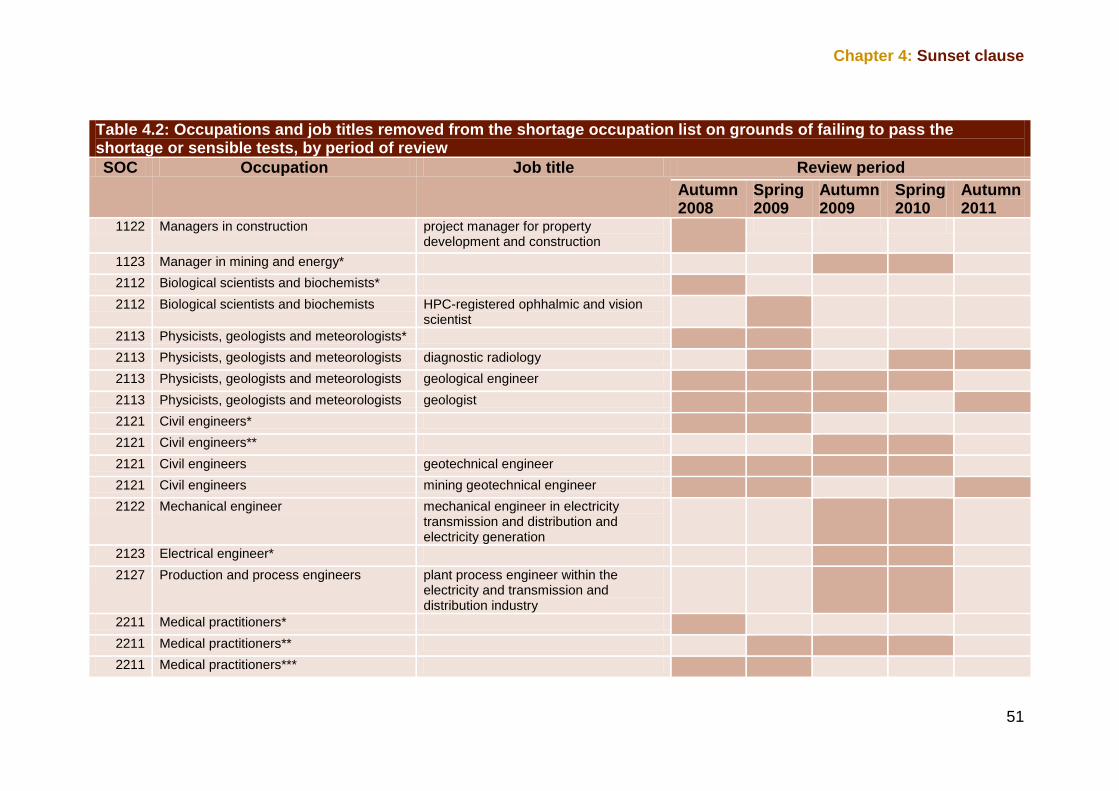
Chapter 4: Sunset clause
51
Table 4.2: Occupations and job titles removed from the shortage occupation list on grounds of failing to pass the shortage or sensible tests, by period of review
SOC Occupation Job title Review period
Autumn 2008
Spring 2009
Autumn 2009
Spring 2010
Autumn 2011
1122 Managers in construction project manager for property development and construction
1123 Manager in mining and energy*
2112 Biological scientists and biochemists*
2112 Biological scientists and biochemists HPC-registered ophhalmic and vision scientist
2113 Physicists, geologists and meteorologists*
2113 Physicists, geologists and meteorologists diagnostic radiology
2113 Physicists, geologists and meteorologists geological engineer
2113 Physicists, geologists and meteorologists geologist
2121 Civil engineers*
2121 Civil engineers**
2121 Civil engineers geotechnical engineer
2121 Civil engineers mining geotechnical engineer
2122 Mechanical engineer mechanical engineer in electricity transmission and distribution and electricity generation
2123 Electrical engineer*
2127 Production and process engineers plant process engineer within the electricity and transmission and distribution industry
2211 Medical practitioners*
2211 Medical practitioners**
2211 Medical practitioners***
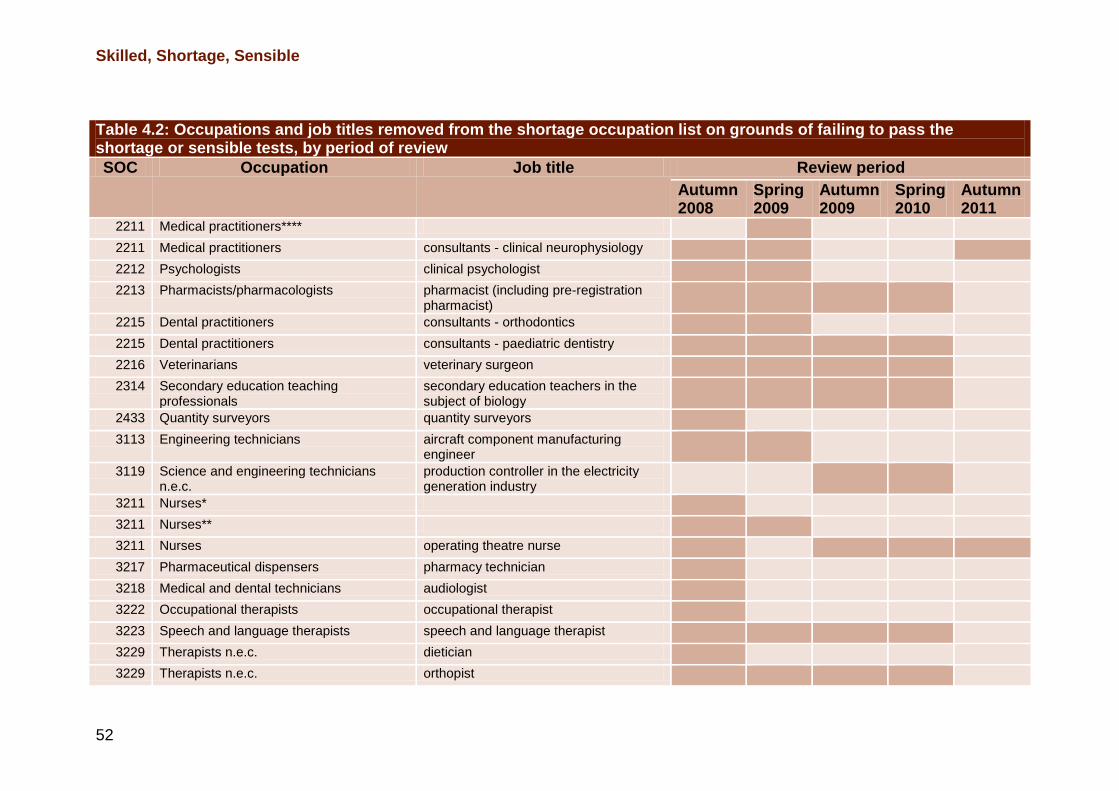
Skilled, Shortage, Sensible
52
Table 4.2: Occupations and job titles removed from the shortage occupation list on grounds of failing to pass the shortage or sensible tests, by period of review
SOC Occupation Job title Review period
Autumn 2008
Spring 2009
Autumn 2009
Spring 2010
Autumn 2011
2211 Medical practitioners****
2211 Medical practitioners consultants - clinical neurophysiology
2212 Psychologists clinical psychologist
2213 Pharmacists/pharmacologists pharmacist (including pre-registration pharmacist)
2215 Dental practitioners consultants - orthodontics
2215 Dental practitioners consultants - paediatric dentistry
2216 Veterinarians veterinary surgeon
2314 Secondary education teaching professionals
secondary education teachers in the subject of biology
2433 Quantity surveyors quantity surveyors
3113 Engineering technicians aircraft component manufacturing engineer
3119 Science and engineering technicians n.e.c.
production controller in the electricity generation industry
3211 Nurses*
3211 Nurses**
3211 Nurses operating theatre nurse
3217 Pharmaceutical dispensers pharmacy technician
3218 Medical and dental technicians audiologist
3222 Occupational therapists occupational therapist
3223 Speech and language therapists speech and language therapist
3229 Therapists n.e.c. dietician
3229 Therapists n.e.c. orthopist
Chapter 4: Sunset clause
53
Table 4.2: Occupations and job titles removed from the shortage occupation list on grounds of failing to pass the shortage or sensible tests, by period of review
SOC Occupation Job title Review period
Autumn 2008
Spring 2009
Autumn 2009
Spring 2010
Autumn 2011
3415 Musician Tutti (also known as rank and file) orchestral musician
3434 Photographers and AV equipment operators*
3513 Ship and hovercraft officers ship and hovercraft officers
Notes: Note: SOC 1123 manager in mining and energy* includes the job titles - shift/group leader within the electricity transmission and distribution industries, and station manager within electricity transmission and distribution; SOC 2112 biological scientists and biochemists* includes the job titles – audiological scientist, biomedical scientist, and scientist in cytogenetics; SOC 2113 physicists, geologists and meteorologists* include the job titles – contaminated land specialist, geoenvironmentalist, geological advisor, geological analyst, geological associate, geomechanics engineer, geosupport engineer, and landfill engineer; SOC 2121 civil engineers* includes the job titles – drainage engineer, marine engineer, mining engineer, public health engineer, rail engineer, structural engineer, and water engineer; SOC 2121 civil engineers** includes the job titles – planning drilling engineer, project civil engineer in the electrical generation industry, status resource engineer, and subsurface engineer; SOC 2123 electrical engineer* includes the job titles – assistant engineer, control and instrument engineer, electrical engineer within the electricity transmission and distribution industry, and project control engineer; SOC 2211 medical practitioners* includes the job titles – consultants (anaesthetics), consultants (clinical oncology), consultants (oral and maxilla-facial surgery), and consultants (psychiatry); SOC 2211 medical practitioners** includes the job titles – consultants (audiological medicine), consultants (medical microbiology and virology), consultants (nuclear medicine), consultants (obstetrics and gynaecology), and consultants (paediatric surgery); SOC 2211 medical practitioners*** includes the job titles – consultants (chemical pathology), consultants (dermatology), consultants (immunology), consultants (intensive care), consultants (paediatrics), consultants (plastic surgery), consultants (psychiatry – child and adolescent), and consultants (renal medicine); SOC 2211 medical practitioners**** includes the job titles – consultants (clinical pharmacology), and consultants (therapeutics); SOC 3211 nurses* includes the job titles – anaesthetic nurse, registered nurse, and scrub nurse; SOC 3211 nurses** includes the job titles – critical care nurse, and theatre nurse; SOC 3434 photographers and AV equipment operators* includes the job titles – 2D/3D animation (animation supervisor), 2D/3D animation (CG supervisor), 2D/3D animation (editor), 2D/3D animation (R&D software), 2D/3D animation (R&D tools), 2D/3D animation (rigging supervisor), and 2D/3D animation (software engineer). Source: MAC analysis, 2013
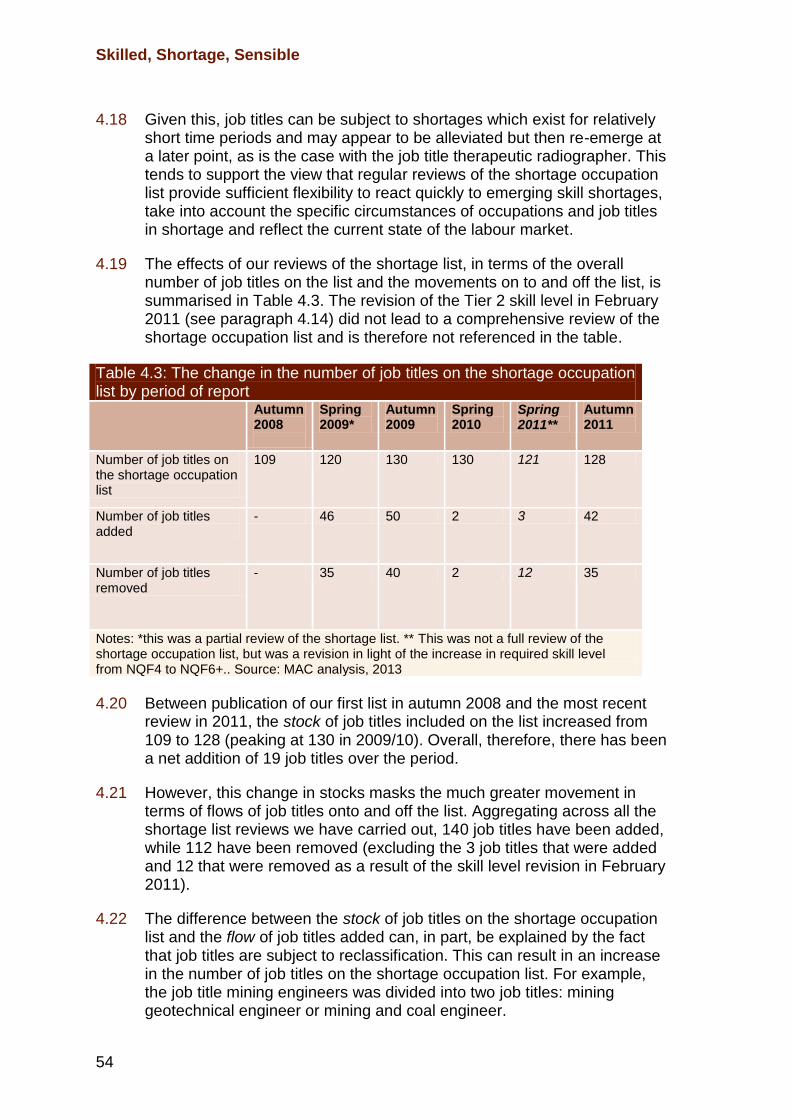
Skilled, Shortage, Sensible
54
4.18 Given this, job titles can be subject to shortages which exist for relatively short time periods and may appear to be alleviated but then re-emerge at a later point, as is the case with the job title therapeutic radiographer. This tends to support the view that regular reviews of the shortage occupation list provide sufficient flexibility to react quickly to emerging skill shortages, take into account the specific circumstances of occupations and job titles in shortage and reflect the current state of the labour market.
4.19 The effects of our reviews of the shortage list, in terms of the overall number of job titles on the list and the movements on to and off the list, is summarised in Table 4.3. The revision of the Tier 2 skill level in February 2011 (see paragraph 4.14) did not lead to a comprehensive review of the shortage occupation list and is therefore not referenced in the table.
Table 4.3: The change in the number of job titles on the shortage occupation list by period of report Autumn
2008
Spring 2009*
Autumn 2009
Spring 2010
Spring 2011**
Autumn 2011
Number of job titles on the shortage occupation list
109 120 130 130 121 128
Number of job titles added
- 46 50 2 3 42
Number of job titles removed
- 35 40 2 12 35
Notes: *this was a partial review of the shortage list. ** This was not a full review of the shortage occupation list, but was a revision in light of the increase in required skill level from NQF4 to NQF6+.. Source: MAC analysis, 2013
4.20 Between publication of our first list in autumn 2008 and the most recent review in 2011, the stock of job titles included on the list increased from 109 to 128 (peaking at 130 in 2009/10). Overall, therefore, there has been a net addition of 19 job titles over the period.
4.21 However, this change in stocks masks the much greater movement in terms of flows of job titles onto and off the list. Aggregating across all the shortage list reviews we have carried out, 140 job titles have been added, while 112 have been removed (excluding the 3 job titles that were added and 12 that were removed as a result of the skill level revision in February 2011).
4.22 The difference between the stock of job titles on the shortage occupation list and the flow of job titles added can, in part, be explained by the fact that job titles are subject to reclassification. This can result in an increase in the number of job titles on the shortage occupation list. For example, the job title mining engineers was divided into two job titles: mining geotechnical engineer or mining and coal engineer.
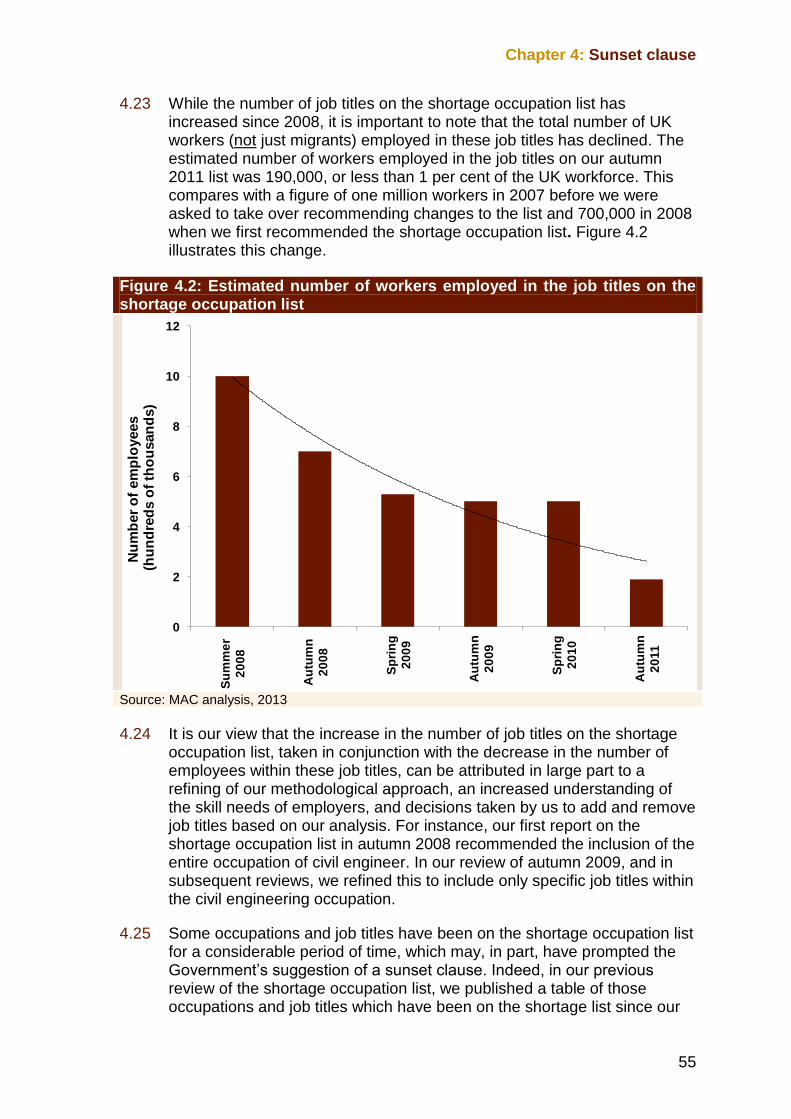
Chapter 4: Sunset clause
55
4.23 While the number of job titles on the shortage occupation list has increased since 2008, it is important to note that the total number of UK workers (not just migrants) employed in these job titles has declined. The estimated number of workers employed in the job titles on our autumn 2011 list was 190,000, or less than 1 per cent of the UK workforce. This compares with a figure of one million workers in 2007 before we were asked to take over recommending changes to the list and 700,000 in 2008 when we first recommended the shortage occupation list. Figure 4.2 illustrates this change.
Figure 4.2: Estimated number of workers employed in the job titles on the shortage occupation list
Source: MAC analysis, 2013
4.24 It is our view that the increase in the number of job titles on the shortage occupation list, taken in conjunction with the decrease in the number of employees within these job titles, can be attributed in large part to a refining of our methodological approach, an increased understanding of the skill needs of employers, and decisions taken by us to add and remove job titles based on our analysis. For instance, our first report on the shortage occupation list in autumn 2008 recommended the inclusion of the entire occupation of civil engineer. In our review of autumn 2009, and in subsequent reviews, we refined this to include only specific job titles within the civil engineering occupation.
4.25 Some occupations and job titles have been on the shortage occupation list for a considerable period of time, which may, in part, have prompted the Government‟s suggestion of a sunset clause. Indeed, in our previous review of the shortage occupation list, we published a table of those occupations and job titles which have been on the shortage list since our
0
2
4
6
8
10
12
Su
mm
er
20
08
Au
tum
n
20
08
Sp
rin
g
20
09
Au
tum
n
20
09
Sp
rin
g
20
10
Au
tum
n
20
11
Nu
mb
er
of
em
plo
yees
(hu
nd
red
s o
f th
ou
san
ds)
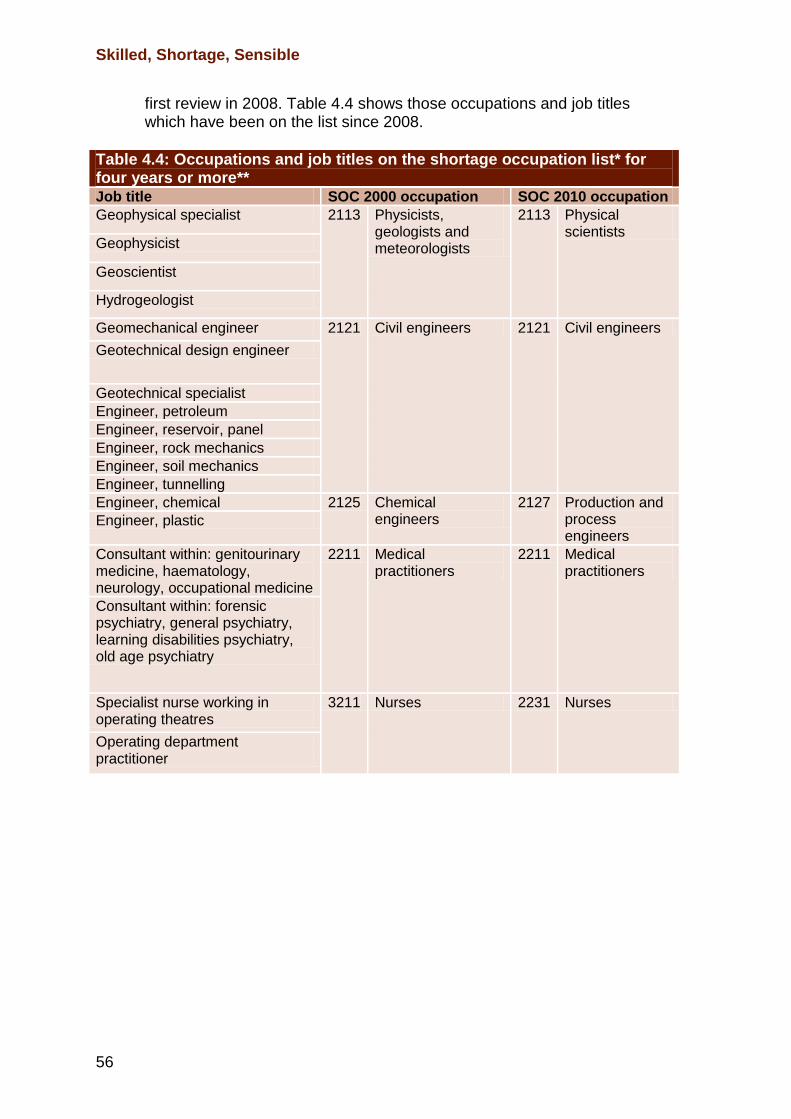
Skilled, Shortage, Sensible
56
first review in 2008. Table 4.4 shows those occupations and job titles which have been on the list since 2008.
Table 4.4: Occupations and job titles on the shortage occupation list* for four years or more** Job title SOC 2000 occupation SOC 2010 occupation
Geophysical specialist 2113 Physicists, geologists and meteorologists
2113 Physical scientists
Geophysicist
Geoscientist
Hydrogeologist
Geomechanical engineer 2121 Civil engineers 2121 Civil engineers
Geotechnical design engineer
Geotechnical specialist
Engineer, petroleum
Engineer, reservoir, panel
Engineer, rock mechanics
Engineer, soil mechanics
Engineer, tunnelling
Engineer, chemical 2125 Chemical engineers
2127 Production and process engineers
Engineer, plastic
Consultant within: genitourinary medicine, haematology, neurology, occupational medicine
2211 Medical practitioners
2211 Medical practitioners
Consultant within: forensic psychiatry, general psychiatry, learning disabilities psychiatry, old age psychiatry
Specialist nurse working in operating theatres
3211 Nurses 2231 Nurses
Operating department practitioner
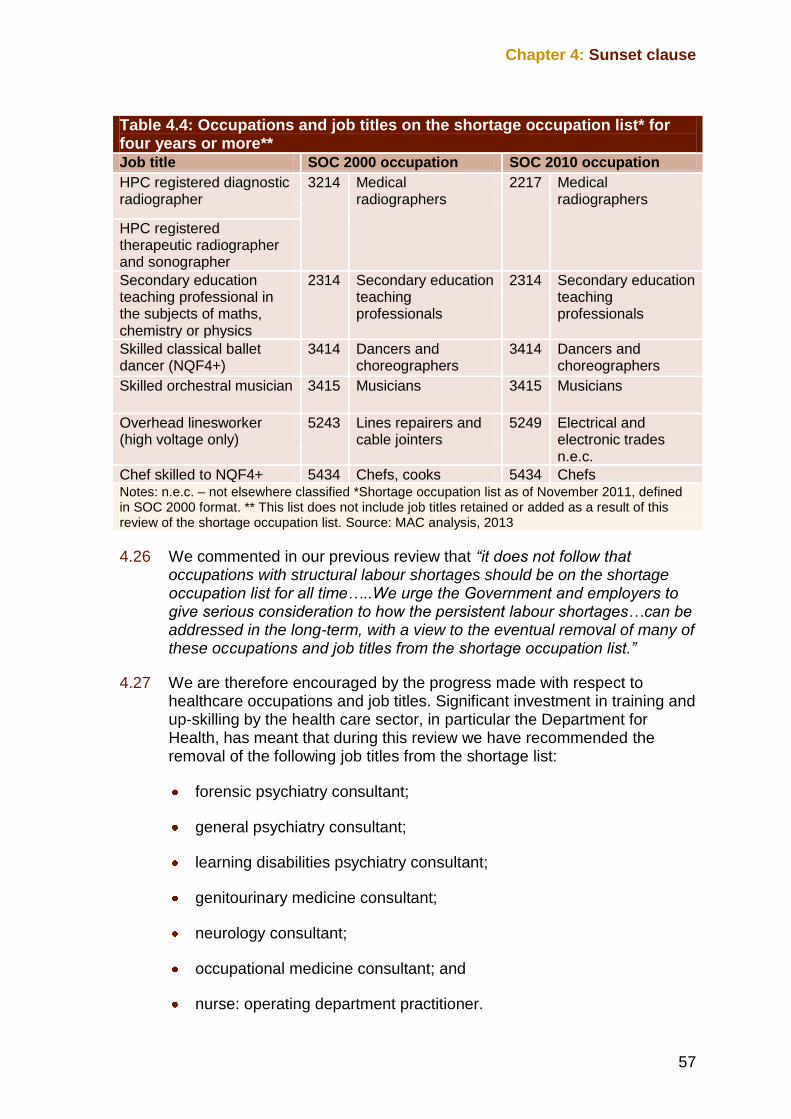
Chapter 4: Sunset clause
57
4.26 We commented in our previous review that “it does not follow that occupations with structural labour shortages should be on the shortage occupation list for all time…..We urge the Government and employers to give serious consideration to how the persistent labour shortages…can be addressed in the long-term, with a view to the eventual removal of many of these occupations and job titles from the shortage occupation list.”
4.27 We are therefore encouraged by the progress made with respect to healthcare occupations and job titles. Significant investment in training and up-skilling by the health care sector, in particular the Department for Health, has meant that during this review we have recommended the removal of the following job titles from the shortage list:
forensic psychiatry consultant;
general psychiatry consultant;
learning disabilities psychiatry consultant;
genitourinary medicine consultant;
neurology consultant;
occupational medicine consultant; and
nurse: operating department practitioner.
Table 4.4: Occupations and job titles on the shortage occupation list* for four years or more**
Job title SOC 2000 occupation SOC 2010 occupation
HPC registered diagnostic radiographer
3214 Medical radiographers
2217 Medical radiographers
HPC registered therapeutic radiographer and sonographer
Secondary education teaching professional in the subjects of maths, chemistry or physics
2314 Secondary education teaching professionals
2314 Secondary education teaching professionals
Skilled classical ballet dancer (NQF4+)
3414 Dancers and choreographers
3414 Dancers and choreographers
Skilled orchestral musician 3415 Musicians 3415 Musicians
Overhead linesworker (high voltage only)
5243 Lines repairers and cable jointers
5249 Electrical and electronic trades n.e.c.
Chef skilled to NQF4+ 5434 Chefs, cooks 5434 Chefs Notes: n.e.c. – not elsewhere classified *Shortage occupation list as of November 2011, defined in SOC 2000 format. ** This list does not include job titles retained or added as a result of this review of the shortage occupation list. Source: MAC analysis, 2013
Skilled, Shortage, Sensible
58
4.28 The alleviation of shortages in the aforementioned job titles resulted, in part, from a strategic focus on training and up-skilling, led by the Department of Health. However, as we discuss later in this chapter, for other occupations the evidence suggests that more needs to be done.
4.5 Sunset clause: partner evidence
4.29 The Government commissioned us to provide advice on a standard period after which removal from the shortage occupation list should become automatic and whether exceptions should be permitted and whether a transitional period should be accorded to those occupations currently on the shortage occupation list and which have exceeded the advised standard period. The Government suggested that the standard period after which removal from the shortage occupation list should become automatic should be two years.
4.30 Partners we met with and the written evidence we received expressed strong views on the sunset clause proposal. Here we set out first their general views before considering in more detail the response to the specific questions we asked in our call for evidence.
4.31 There was a broad recognition that the shortage occupation list represented a temporary relief for current shortages.
“Total appreciates that the SOL was brought in as a temporary measure to alleviate the shortage of skills faced by certain occupations in the UK, including in the oil and gas sector, and was never intended to be a long term solution.”
Total response to MAC call for evidence
“The BMA acknowledges that inclusion on the list is intended to provide temporary relief while measures are taken to mitigate shortages and recognises that the principle of reducing reliance on migrant workers and training and up-skilling UK resident workers to fill workforce gaps is entirely valid.”
British Medical Association response to MAC call for evidence
4.32 However, there was less enthusiasm for the introduction of a sunset clause. Of the total 90 responses received with respect to our call for evidence, 56 expressed a view on a prospective sunset clause, only two of which were supportive.
Chapter 4: Sunset clause
59
“the signal sent by sunsetting, that there is a demand for these skills and we wish to see it addressed domestically, is useful. Retaining occupations on the list inevitably acts as a disincentive – at some level – to employers and sectors in investing themselves, or engaging with the skills sector, to develop these skills in the UK workforce….. Where [employer-led domestic skills development schemes] are not adequate, sun-setting is an appropriate measure if implemented sensitively.”
Department for Business, Innovation and Skills response to MAC call for evidence
“We agree in principle with the removal of occupations from the Sol after a set period of time.”
Welsh Government Department for Education and Skills response to MAC call for evidence
4.33 Whilst most partners expressed absolute opposition to any form of sunset clause, some partners told us that, if a sunset clause were to be introduced, their own occupations and job titles that they were concerned with should be exempt.
“we are requesting that teachers be exempt from the sunset clause.”
Department for Education response to MAC call for evidence
“The shortage of highly skilled dancers is a worldwide issue….We therefore believe that the job titles of skilled classical ballet dancers should be exempt from any sunset clause.”
Society of London Theatre (SOLT) and the Theatre Management Association (TMA) response to MAC call for evidence
“As the Government believes that nuclear power is key to meeting its energy and climate change objectives in the UK, and considering that the nuclear industry has been in decline for some years with no new build projects for over 20 years, it would seem sensible that „nuclear‟ skilled occupations remain on the list for the foreseeable future and are not subjected to a sunset clause at the present time.”
Westinghouse response to MAC call for evidence
Skilled, Shortage, Sensible
60
4.34 However, the majority of responses expressed opposition among partners to the introduction of a sunset clause.
“The imposition of a sunset clause, of any duration, is regarded as totally unsuitable from a National Grid and wider industry perspective.”
National Grid response to MAC call for evidence
“Taking into account the difficulties manufacturers face recruiting the skilled workers they need, it will come as no surprise to the MAC that we are strongly against proposals to introduce a sunset clause for occupations on the shortage occupation list.”
EEF, The manufacturers‟ organisation response to MAC call for evidence
4.35 Partners gave a number of reasons for their strong opposition to the introduction of a sunset clause. As highlighted earlier in this chapter the number of migrants utilising this route is low relative to the number of CoS issued under the Tier 2 (General) and intra-company transfer routes. In addition, the estimated number of workers employed in the occupations and job titles on the shortage occupation list represents less than one per cent of the UK workforce. As such, partners argue that the impact of introducing a sunset clause would be a disproportionate response to the need to ensure that resident skill shortages are addressed and the reliance on migrant workers is reduced.
“we consider this approach to be very broad brush and, with respect, a disproportionate response to the challenge of keeping the shortage occupation list current and reflective of the labour market.”
Rolls Royce PLC response to MAC call for evidence
“We are not persuaded that an automatic mechanism of removal of a role after a set period is proportionate, necessary or helpful.”
Employment Lawyers Association (ELA) response to MAC call for evidence
4.36 Partners also told us that the introduction of a sunset clause would actually run counter to a number of wider Government objectives.
Chapter 4: Sunset clause
61
“Removing an occupation from the SOL when it still requires skills which are in short supply will result in the loss of business and investment in the UK, which will have a harmful effect on the country‟s growth prospects.”
PricewaterhouseCoopers Legal LLP response to MAC call for evidence
4.37 For example, the Government recently announced that the video games industry would receive support to encourage continued growth in this sector (Autumn Statement, 2012). However, the sector relies upon the ability to recruit workers via the shortage occupation list. Removal of some of the job titles currently on the shortage occupation list would, employers argued, render the sector unable to recruit migrant workers to fill vacancies as the job titles are not skilled at NQF6+ and so would not qualify under the RLMT route.
4.38 Similarly, partners told us that the introduction of a sunset clause could have detrimental effects on the renewable energy sector, with subsequent harmful consequences for the supply of energy within the UK.
“Prematurely removing occupations from the SOL will reduce the capacity for industry to fulfil government targets for 15 per cent of its energy to come from renewable by 2020, which is crucial for securing the UK‟s energy supply.”
Energy & Utility Skills response to MAC call for evidence
4.39 Finally, partners told us that the removal of occupations and job titles would have very little effect on the number of migrant workers that they employed. Partners told us that the number of migrants recruited through the shortage occupation list are low, and employers are likely to continue to sponsor migrants under the RLMT route. This would, we were told, serve only to increase the cost of recruitment to employers whilst having minimal impact on net migration.
“The Tier Two SOL route to sponsorship does not appear to be widely utilised by UK employers since only around 1500 individuals sponsored through this route this year. We therefore consider that limiting the amount of time that jobs can remain in the SOL will not result in a significant reduction in net migration. It will have a fairly minimal impact in terms of reducing net migration. However, at the same time it is likely to result in additional costs and administrative time for some employers who are faced with skills shortages.”
Employment Lawyers Association response to MAC call for evidence
4.40 During our call for evidence we asked partners for their views on five key questions:
Skilled, Shortage, Sensible
62
“(i) Whether the Government‟s indicated time period of two years is a reasonable amount of time to enable mitigating action to be put in place and to have effect before an occupation or job title is removed from the list.
(ii) Whether there should be different time periods for different occupations and jobs, and what grounds might there be for awarding an extended time period.
(iii) The likely business impact of removing an occupation or job from the shortage occupation list.
(iv) Whether there should be a transitional period for occupations or jobs that are on the list and how long that period should be.
(v) Mitigating measures already taken to alleviate occupation shortages and whether these were effective. What further mitigating measures are planned.”
4.41 Partners‟ responses to each of these questions are outlined in turn below along with some key issues that the Government may wish to consider if a sunset clause is to be introduced.
Whether the Government’s indicated time period of two years is a reasonable amount of time to enable mitigating action to be put in place and to have effect before an occupation or job title is removed from the list.
4.42 Partners told us that two years would not be a sufficient period of time in which to enable mitigating action to be put into place and take effect before an occupation or job title is removed from the shortage occupation list.
“The Government‟s proposed time period of two years is not a reasonable amount of time to enable mitigating action to be put in place…..There is no „quick-fix‟.”
EEF The manufacturers‟ organisation response to MAC call for evidence
“….a two-year time frame does not adequately take into account the length of time required to attract, educate and train a resident workforce for the highly skilled roles that the UK economy will need in the future.”
Science Council response to MAC call for evidence
Chapter 4: Sunset clause
63
“In the case of a highly skilled position, it can take many years for industry or the education sectors to react to a shortage and produce skilled labour, so a two year fixed period would not nearly be enough time to have any benefit.”
RenewableUK response to MAC call for evidence
4.43 Partners told us that, in many instances, the shortage of relevant skills was a structural problem which would take a considerable period of time to alleviate. For example, the engineering sector told us that they expect that there will be insufficient qualified, experienced British (or EEA) engineers for ten years or more.
“there is a permanent, systemic, un-resolvable shortage….the result of the recession in the early 1990‟s when graduates were not recruited to the industry; the recruitment of talented and numerate graduates to the financial services industry during the 1990‟s;and the unpopularity of engineering and science degrees until the mid 2000‟s.”
The Ground Forum response to MAC call for evidence
“The problem of skill shortages in the Science, Engineering and Technology sectors in the UK are widely known and documented. The actions taken by National Grid and other industry partners to address the low supply of these skills…..are long term and therefore it is likely to take in the region of 10-15 years for the results to come through to the workforce.”
National Grid response to MAC call for evidence
4.44 Similarly, the Department for Education told us that it is difficult for the sector to react quickly to changes in teaching supply and demand, which can be impacted by various factors such as the economic climate, changes in pupil numbers and graduate labour market changes. This makes it difficult to accurately forecast the demand for and supply of teachers in the short term.
“It….takes a minimum of two years from the modelling of teacher supply for a newly qualified teacher to enter a post in a school – longer for many trainees – so the ability of the Department to react to changes in the labour market (such as the potential withdrawal of SOL) is limited. Consequently, there is a need for schools to have…access to migrant teachers.”
Department for Education response to MAC call for evidence
Skilled, Shortage, Sensible
64
4.45 The Department for Education consider that the removal of teaching occupations and job titles from the shortage occupation list after a period of two years would be detrimental to their efforts to improve teaching standards.
4.46 In addition, partners told us that an arbitrary time period before a sunset clause took effect was not suitable as it failed to take into account the specific circumstances of each sector or occupation. We were told that this could significantly damage the sector and provide insufficient time for mitigating measures to be put in place and take effect.
“Arbitrary removal from the list before employers have time to see the impacts of their work on skills shortages could have serious impacts.”
Energy & Utility Skills response to MAC call for evidence
Whether there should be different time periods for different occupations and jobs, and what grounds might there be for awarding an extended time period.
4.47 Partners told us that, if a sunset clause was to be introduced, it would need to take into account the different circumstances of each sector. As such, partners strongly argued that there would need to be different time periods for different occupations and job titles.
“it would be difficult to pool…occupations together and suggest a standard period for their removal as it assumes all are homogeneous with respect to qualification, skills and experience requirements.”
Total response to MAC call for evidence
“a set sunset clause of two years should not be applied to all of the occupations stated on the shortage occupation list. It would be sensible to look at varying sunset clause and transition time periods depending on the occupation and the market data available to the UKBA on the skill shortages that the UK is still facing in these areas.”
Balfour Beatty UK response to MAC call for evidence
4.48 Partners told us that there was a need to ensure that the shortage of skills within the resident workforce was addressed before any sunset clause would take effect. This would require coordinated action by the Government, skills councils, education providers and employers to ensure that the provision of training was sufficient to up-skill resident workers.
Chapter 4: Sunset clause
65
“must the government find it necessary to put a transitional period in place for the removal of shortage occupations from the list, they need to take into consideration the time in which it will take to train a new workforce.…This will be an impossible task to fulfil especially without assistance from the government with training.”
Marshall Aerospace response to MAC call for evidence
4.49 Partners told us that the training point was crucial. We were told that a standard period of time after which a sunset clause would activate could not work in practice due to differing timescales involved in training and up-skilling the resident workforce across different sectors. For example, the Department for Education told us that, although they were committed to ensuring that the domestic supply of teachers met demand, this was a long term aspiration.
“In the case of teaching, the qualification period is long….it may take a generation to ameliorate the situation.”
Department for Education response to MAC call for evidence
4.50 The Department for Business, Innovation and Skills (BIS) told us that it would take a minimum of six years to alleviate skills shortages within the engineering sector.
“Given it takes typically six years from commencing study of A-levels to completing an engineering course, if we assume we could intervene to increase significantly the graduate pipeline, the minimum time it would take for this to have effect would be six years from August 2013. This assumes an idealised intervention and in reality we would expect it would take somewhat longer than six years.”
Department for Business, Innovation and Skills response to MAC call for evidence
4.51 The British Medical Association (BMA) also told us that a significant period of education and training is required in respect of the medical profession. Generally, it takes a skilled doctor between 10 and 15 years to complete the relevant specialty training pathway.
Skilled, Shortage, Sensible
66
“A UK medical student will typically spend five years as an undergraduate before undertaking the two-year Foundation programme, followed by a specialty training programme which varies in length from three years to eight years.”
British Medical Association response to MAC call for evidence
4.52 We also received evidence from the nuclear sector that there should be different time periods for different occupations and jobs.
“the estimated time that it takes to train a high integrity pipe welder to SQEP status is 8 years. An experienced craft worker would take up to 5 years (including the 3 year apprenticeship) and a graduate at least 3 years.”
Westinghouse response to MAC call for evidence
4.53 In the evidence we received, there was near consensus that there should be different time periods for different occupations and jobs, to reflect the differing training requirements between occupations and job titles. Rather than a fixed two year period, partners recommended that the Government work with sectors to agree a sunset clause specific to each sector.
“we would argue…that instead of a single sunset clause applying across the board, separate sunset clauses are applied to separate occupations or industries, providing those industries can submit supporting evidence to show the minimum amount of time it will take on average to train and up-skill new workers coming into the industry.”
Newland Chase response to MAC call for evidence
4.54 That said, partners did accept that this would add additional complexity and cost to the operation of the shortage occupation list, which would not necessarily be desirable.
“A sunset clause on a role-by-role level…will add complexity, uncertainty and risk.”
UK Screen Association response to MAC call for evidence
The likely business impact of removing an occupation or job from the shortage occupation list.
4.55 In several instances partners told us that the introduction of a sunset clause would have detrimental impacts on their business. We were told that the inability to access migrant labour via the shortage occupation list
Chapter 4: Sunset clause
67
would render some employers unable to adapt to new circumstances, resulting in the loss of orders or the need to move elements of their business out of the UK. We were also told that the impacts on business could have adverse consequences for the UK economy.
“If there is any question as to whether the UK VFX industry has the capacity and appropriate talent available to deliver these projects, we are immediately placed at a disadvantage against our competitors. The „Sunset Clause‟ imposes this element of doubt.”
British Film Commission response to MAC call for evidence
“Overseas economies are developing quickly and there are skills surplus of roles such as Design Engineers in other countries. If businesses are unable to bring this resource into the UK to meet the requirements of the projects in the UK, this resource may need to be outsourced to other countries taking a vital contribution to the UK economy away.”
Balfour Beatty Utility Solutions response to MAC call for evidence
“The likely business impact is significant. Projects will be cancelled and work will be sent overseas and both of these are likely to have major implications for the North Sea oil and gas industry but also for the UK economy.”
Apache Corporation response to MAC call for evidence
“The likely business impact will be the immediate stagnation and longer-term destruction of viable businesses….UK expansion will be unlikely to take place.”
British Hospitality Association response to MAC call for evidence
4.56 Furthermore, shortages exist in professions which provide the foundation for skills development of the domestic workforce. For example, in many schools maths is being taught by teachers who trained in other subjects potentially risking the quality of maths education provided.
4.57 Another example of the impact on critical infrastructure is the case of the National Grid. National Grid owns, operates and maintains critical national infrastructure for energy transmission and distribution. To provide these services the company heavily relies on a robust, skilled workforce, which in turn is partially reliant on non-EEA skilled labour recruited under the shortage occupation list route. We were told that any limitation to the
Skilled, Shortage, Sensible
68
ability to access non-EEA migrant skilled labour could effectively harm National Grid‟s ability to transmit and distribute energy to the UK.
4.58 Partners recognise that, for occupations skilled at NQF6+, there remains the option to recruit migrant labour through the RLMT route. However, we were told that this would add unnecessary cost, time and uncertainty to the recruitment process where they know in advance that skill shortages continue to exist such that they are unlikely to be able to recruit from the resident labour market.
“Requiring the company to go through the…RLMT process to fill a specialised vacancy from the resident labour market which is lacking in individuals with the necessary expertise has a significant detrimental impact on a given project and the business as a whole.”
Total response to MAC call for evidence
4.59 Difficult as it may be for partners in such circumstances, the situation would be exacerbated for those occupations not skilled at NQF6+. In such circumstances, partners would be unable to sponsor non-EEA migrants under Tier 2.
“If these roles were removed from Tier Two, there would be no alternative route available for employers to sponsor individuals from outside the EEA to work in the UK which would seem to reduce rather than increase opportunities for growth.”
Employment Lawyers Association response to MAC call for evidence
Whether there should be a transitional period for occupations or jobs that are on the list and how long that period should be.
4.60 There was broad consensus among partners that the introduction of a sunset clause would need to be accompanied by transitional arrangements. Partners told us that this would be required to provide employers with the time to amend current recruitment practices in line with the ability to utilise an updated shortage occupation list.
“There would need to be a transition period as it could cause delays if we have a role we haven‟t conducted a labour resident market test on, get to offer, and it‟s disappeared off the shortage list – adds at least 30 days to getting them on board.”
Atkins response to MAC call for evidence
Chapter 4: Sunset clause
69
“EDF Energy recommends a transitional phase for employers to adjust policy and guidance throughout their organisations. Communication methods need to be assessed to ensure the relevant parties are aware of any changes.”
EDF Energy response to MAC call for evidence
4.61 There was less consensus around what any transitional period should involve. Some partners argued that, given the structural nature of some skill shortages, a transitional period of up to ten years would be required.
“With current industry activity in mind, 8 – 10 years is proposed as a transitional period in order to implement a long term strategy to fill the skills shortage.”
Apache Corporation response to MAC call for evidence
4.62 However, other partners took the view that the length of transitional period would need to vary among sectors, to reflect the differing circumstances of each part of the economy. As was the case in relation to the time period for any sunset clause to take effect, it was the view of some partners that transitional periods should be tailored to individual sectors.
“there should be a transitional period whose length should be tailored to the needs of the industry in question. It should be a case of assessing the needs of the particular industry to smoothly transition them into a different system, using the RLMT, of hiring workers from abroad. If a sunset clause is introduced, the Government and industry will need to have an agreed, realistic and well constructed plan on how it would take effect.”
Total response to MAC call for evidence
4.63 Other partners expressed the view that, regardless of the length of time until a sunset clause took effect, there was a need to minimise the impact of the clause and provide certainty, particularly for those occupations and job titles which are currently on the list and had been so for some time.
“We would suggest that essentially the clock would be set to zero for occupations currently on the list with any applicable sunset clause only coming into play going forward from the date the changes are implemented.”
Newland Chase response to MAC call for evidence
Skilled, Shortage, Sensible
70
Mitigating measures already taken to alleviate occupation shortages and whether these were effective. What further mitigating measures are planned?
4.64 When we consider an occupation or job title for inclusion on the shortage occupation list, we pay close attention to whether it is sensible for employers to recruit non-EEA workers to fill shortages. Partners are asked to provide comprehensive evidence as to the measures they take to up-skill and train the resident labour force to reduce future reliance on migrant labour. Boxes 4.1 and 4.2 illustrate two examples of initiatives developed by employers to increase labour supply in occupations currently experiencing shortages.
Box 4.1: EDF Energy “Bright Future Programmes” EDF Energy has developed several programmes to develop the talent pool available within the UK:
Industrial placements – a 12 month sandwich placement for students currently on an undergraduate degree course. 29 students joined the EDF Energy Industrial placement programme in 2012 and there are plans to take on 56 for the 2013 programme.
Summer internships – a placement for students to intern over the summer. 75 students joined EDF Energy summer placement programme in 2012.
STEM Ambassador programme – the company has identified „STEM Ambassadors‟ who actively go out to schools and encourage students to see the value in continuing with studying STEM subjects. In February 2012, 179 STEM Ambassadors were active.
Graduate Schemes – in 2012, 87 graduates joined EDF Energy and the company are planning on taking 83 graduates for this programme in 2013.
The company also offers a range of apprenticeships in areas such as Engineering Craft, Energy Field Services and Business. Such initiatives are aimed at increasing local human capital however migrant labour is still required to fill shortages whilst this up-skilling occurs.
Chapter 4: Sunset clause
71
Box 4.2: Department of Health initiatives The Department of Health has initiatives in place to address the shortage within the medical profession as a whole and others which are specific to a certain practice within the profession. An example of an initiative to address the profession-wide shortage is the Modernising Scientific Careers (MSC) programme. The MSC programme began in 2008 to address the training and education needs of the healthcare science workforce, and aims to introduce flexibility, sustainability and new career pathways to meet the future needs of the National Health Service. As a result, new undergraduate Practitioner Training (PTP) and postgraduate Scientist Training (STP) degrees have been introduced, with the first PTPs due to graduate in 2016 and the first STP students in some specialisms are expected to graduate in 2014. The full impact of the STP degrees on workforce supply will not be known before 2014; for PTP, given an expected new intake in 2013, this impact will not be known until 2016. In the past the healthcare sector faced shortages among job titles within occupations such as consultants and nurses, which required their inclusion on the shortage occupation list. However, there was an increase in government funding to the healthcare sector in the early 2000s which translated into increased training of resident labour and ultimately fewer job titles on the shortage occupation list.
4.65 However, such initiatives do not necessarily result in sufficient numbers entering the sector. This can be due to a number of factors but is most commonly a result of students failing to complete their courses, moving into other sectors upon completion or graduates choosing to leave the UK upon completion of their studies or training programme.
“The number of students who leave nursing education without completing their course is one of the key determinants of the future supply of qualified staff. Across the UK in 2005 although 21,338 started their pre-registration courses, only 15,443 completed, representing an overall attrition rate of 27.6%......student numbers cannot therefore be used as a reliable determinant of the future supply of qualified staff.”
Northern Ireland Strategic Migration Partnership response to MAC call for evidence
“It remains the case that domestic graduates in mathematics in particular can command much higher salaries in alternative occupations to teaching.”
Association of School and College Leaders response to MAC call for evidence
Skilled, Shortage, Sensible
72
“After completing their university studies, some engineering graduates prefer to move to such places as Australia and Angola, for their more attractive climates, and Dubai, where salaries are free of tax. Graduates are also attracted to other careers, such as finance, which takes 5% of engineering graduates and offers a much higher graduate salary than engineering.”
Total response to MAC call for evidence
4.66 The shortage of those entering the profession is further exacerbated by issues with outflow. For example, a number of partners told us that a significant proportion of resident workers with the required skills choose to leave the United Kingdom to work overseas. Similarly, some sectors are concerned that the number of graduates will not replace current employees who are approaching retirement, let alone alleviate the current shortage.
“the UK games industry has suffered from a brain drain, with talented staff leaving the UK for Canada and the USA in particular. 41 per cent of the jobs lost to the UK games industry between 2009 and 2011 relocated overseas.”
TIGA response to MAC call for evidence
“Retirements continue to be the biggest forecast loss of resource from the existing workforce, presenting both a resource and knowledge risk. The ageing workforce profile is in line with the challenge for the nuclear industry as a whole.”
EDF Energy response to MAC call for evidence
4.67 Partners expressed concern that a sunset clause would further hinder efforts to up-skill the resident labour force. Partners told us that the shortage occupation list is generally used to bring in the more experienced worker who will be able to transfer his or her skills and knowledge to the existing workforce.

Chapter 4: Sunset clause
73
Box 4.3: An example of the dynamic effects of migration In our report Migration Advisory Committee (2012) we considered the labour market and social impacts of non-EEA migration and the impact on the provision and consumption of public services. One key factor we highlighted as highly relevant but difficulty to define, quantify or monetise, was the dynamic effect of migration on the UK labour market through specialisation and knowledge transfer. During our engagement with partners in the creative industry, we encountered an example of such dynamic effects in practice. One employer we met recruited a senior computer graphic artist from Canada to manage teams of UK resident computer graphics teams for the production of a film. The skills and techniques developed from the experience of working in the film industry abroad were being taught to, instilled in and developed by the junior UK resident employees. We were told that as the project was completed and staff rolled on to the next project, these skills would continue to be developed and passed on to the next cohort of recruits, further developing the UK skills-base. Furthermore, we were told that the new emerging techniques that are being transferred to the UK workforce were not yet being taught in the UK education system. Therefore, to recruit from non-EEA countries is the only way to introduce these skills into the workforce, thus ensuring that the UK creative industry remain competitive at an international level. The use of Tier 2 in this example was critical in developing the UK skills set.
4.68 The activation of a sunset clause could, we were told, lead to the premature removal of an occupation from the shortage list, which may hinder efforts to transfer knowledge between experienced and developing staff at a critical juncture.
“Problems in recruitment at the more senior end of the career path result in fewer „trainers‟ to educate and mentor the new intake….leading to a vicious circle of talent shortage.”
Medical Research Council response to MAC call for evidence
Further partner comments
4.69 As well as providing detailed responses to the five questions we posed on the sunset clause, several partners also told us that they consider our regular reviews of the shortage occupation list the most effective method of removing an occupation or job title from the list if these do not pass either the shortage and/or the sensible tests.
“It is right that the shortage occupation list is regularly reviewed to ensure it remains relevant but, …..this process is already taking place, rendering the sunset clause proposal unnecessary.”
CBI response to MAC call for evidence
Skilled, Shortage, Sensible
74
“In our view, the annual review of the SOL by the MAC is, in itself, an informal sunset clause whereby on an annual basis stakeholders and corporate partners are being required to submit evidence to ensure that occupations and job titles remain on the list. If this review processes continues, then we feel it can be argued that no formal sunset clause is required.”
Newland Chase response to MAC call for evidence
“We would like to suggest that a more flexible approach would be to assess each role via the MAC calls for evidence…thus ensuring the shortage occupation list reflects the current market.”
Rolls-Royce plc response to MAC call for evidence
4.70 Our review process also recognises that some occupations and job titles, for example secondary education teaching professionals in the subjects of mathematics, chemistry and physics, will continue to be in shortage for a considerable period of time owing to a combination of this being a structural shortage requiring investment in the teaching and take up of STEM subjects coupled with shortages due to public sector pay as discussed in paragraph 4.8.
4.71 Removing such occupations and job titles on the basis of a fixed timeframe would not guarantee that employers had sufficient time to effect alternative strategies to generate sufficient numbers across these job titles and would cause serious difficulties for the teaching of these subjects. In turn this would have a knock-on effect on efforts to alleviate shortages in occupations and job titles that are heavily reliant on a proficiency in these subjects, as recounted elsewhere in this report.
4.72 That said, the evidence we received both during this review and during our other reviews of the shortage list emphasise to us the need for a renewed focus on developing the skills of the resident workforce where we know those skills are in short supply, as evidenced by the presence of the relevant occupations and job titles on the shortage occupation list.
“The UK must take the responsibility of training the workers that are needed, with the skills system facilitating employer led responses.”
Department for Business, Innovation and Skills response to MAC call for evidence
4.73 To summarise, partner responses highlighted the following issues in relation to a sunset clause:
Chapter 4: Sunset clause
75
A time period of two years is not sufficiently long to allow mitigating measures to be put into place and take effect. Existing skill shortages are predominantly structural in nature, such that a lengthy period of time - at least four years and longer in many cases - would be required to ensure that the UK has the skilled workers needed. Partners mostly told us about shortages of experienced skilled workers. It is therefore not just a question of acquiring the necessary degree qualification, but getting sufficient on-the-job experience too.
Skill shortages vary in nature. A “one size fits all” approach would fail to recognise the differing circumstances faced by partners in alleviating skill shortages. Partners cautioned that, if the Government chose to implement a sunset clause, transitional arrangements be put in place to minimise the risk to business.
The imposition of a fixed term guillotine on job titles and occupations is too simplistic. It fails to take into account the lack of heterogeneity in relation to skill shortages across the workforce. The causes of skill shortages vary and action to ameliorate and eradicate such shortages will likewise vary.
If an occupation or job title is removed from the list as a result this raises a question of whether this should be temporary or permanent. Temporary removal itself requires some indication of the period of time before consideration of re-inclusion is possible. Partners warned that permanent exclusion could directly harm their business, and the UK economy, should measures to mitigate skill shortages prove unsuccessful in the longer term. Some partners suggested a complementary sunrise clause. This would allow a “cooling off period” before occupations or jobs be considered for a return to the list following the application of the sunset clause. Partners felt that this proposal would provide a safety net should skill shortages re-emerge.
Alleviating skill shortages
4.74 Overall, the evidence we received in respect of measures taken to alleviate skill shortages was mixed. Whilst some partners told us that they invest significant time and resource in training and up-skilling the resident workforce, it was clear that there is a need for a more strategic, joined up approach between the Government, employers, and education providers. A number of partners stated that they consider the role of the Government as being critical to alleviating skill shortages.
“Industry is not able to alleviate the skills shortages alone; the Government must help in dealing with the skills shortages and systemic issues.”
Total response to MAC call for evidence
Skilled, Shortage, Sensible
76
“The UK Government must ensure that the country has the workforce with the appropriate knowledge, skills and experience to enable it to compete internationally, and create an environment which helps businesses to flourish. This will require a long term commitment across government, to ensure that programmes are effective in addressing issues of recruitment, retention and training.”
Science Council response to MAC call for evidence
“The Government must work closely with Higher Education Institutions and businesses to bolster the skills pipeline.”
Recruitment & Employment Confederation Ltd response to MAC call for evidence
4.75 The Department for Business, Innovation and Skills recognises that there is much to do to address skill shortages within the resident workforce.
“The Government‟s economic policy objective is to achieve strong, sustainable and balanced growth, while extending social inclusion and mobility. To meet our economic objectives and address the gap in our international competitiveness, we must focus on providing our workforce with the skills necessary to drive this growth.”
Department for Business, Innovation and Skills (BIS) response to MAC call for evidence
4.76 In addition, the Secretary of State for Business, Innovation and Skills acknowledged that the engineering sector, in particular, is experiencing, and will continue to experience, significant skill shortages.
“The Royal Academy of Engineering has published estimates of long term demands for engineers, and there is no doubt that these are very challenging. My Department‟s Chief Scientific Adviser, Professor John Perkins – himself an eminent engineer – is working closely with the Academy and others to see what more might be done.”
Secretary of State for Business, Innovation and Skills speech to the CBI Conference: 19 November 2012.
4.77 Recent projections of demand for engineers by the Royal Academy of Engineering estimated that the UK economy will require in the region of 600,000 to 700,000 new professional engineers and 450,000 technicians by 2020. In the same report, the Royal Academy estimates that there the
Chapter 4: Sunset clause
77
current stock of engineering professionals is approximately 2.3 million. Therefore, the Academy estimates that almost half as many new skilled workers as the current stock will be required in order for the engineering sector to thrive. By comparison, the evidence we received indicates that progress has been slow in respect of encouraging more young people to study STEM subjects to degree level.
“At undergraduate level, in 2010-11 the number of UK-domiciled STEM entrants was up 1% compared to 2009/10.”
The Department for Business, Innovation and Skills response to MAC call for evidence
4.78 That said, we acknowledge that one year is a short period of time over which measures to attract engineering students will take effect. In addition, we understand the Perkins Review of engineering skills is due to report in the summer of 2013. This will feed into the Government‟s Industrial Strategy and the publication of a series of sector-based reports and initiatives during the course of this year. The review of engineering skills has six strategic aims: to change the perception of engineering as a profession; to address diversity issues such as the gender gap; to encourage sponsorships and strengthen industrial links to students; to help engineers who have left the profession to rejoin it and for others to convert to it; to provide appropriate education to support engineering careers; and to encourage and support more high quality engineering apprenticeships.
4.79 We understand that the Sector Skills Councils (SSCs) will also be an important contributor to the development of the Industrial Strategy. This being the case, we were somewhat surprised not to have received greater input from Skill Sector Councils (SSCs) in response to our call for evidence – only four of 20 provided a written response. In fact most of the evidence we received on this issue came from individual employers in the sector, plus BIS. Following further discussions with partners in this area we have tried to get a clearer picture of, firstly, the awareness of skills shortage in this area and, secondly, how the various actors are working together to address this.
4.80 At the same time we recognise that there have been broader changes to public financial support, moving away from grant-based funding towards competitive tendering, which ought to result in more efficient, market-driven outcomes. In its strategy for skills in 2010 (Skills for Sustainable Growth, 2010) the Government set out its objective of utilising public funding to help the lower skilled. For higher end skills, such as those required for engineering, more of the financial burden is expected to be borne by employers and individuals themselves.

Skilled, Shortage, Sensible
78
“We will prioritise funding support for learners with very low levels of skills or the disadvantaged, while there will be an expectation that learners and employers will co-invest alongside Government in meeting the costs of intermediate and higher level training courses from which they will derive private benefits.”
Skills for Sustainable Growth – Strategy Document, Department for Business Innovation and Skills, November 2010.
4.81 We are aware too of a number of initiatives involving either industry or Government or both which seek to help provide at least a partial solution to skill shortages in the short term. For example, the Employer Ownership Pilot scheme provides employers access to £340 million of funds for investment in vocational skills, and BIS has a commitment to fund, with employers, 500 masters degree places in aerospace engineering.
4.82 These measures are encouraging, but at the same time we question whether they will be sufficient on their own to address the structural shortages that exist in the resident labour market. There would appear to be a continued need for co-ordinated, concerted action by the Government - in particular the Department for Education, BIS, UKCES and SSCs - and employers will be required to encourage more young people to study relevant courses, such as Science, Technology, Engineering and Mathematics (STEM) subjects. Certainly the introduction of a new curriculum by DfE may help by ensuring students include maths and sciences in their studies. Once again though the benefits of this will only be realised in the medium-term.
“In many cases, intervention is required as early as pre A-Levels to enable young people to select the relevant further and higher education courses.”
Department for Business, Innovation and Skills (BIS) response to MAC call for evidence
4.83 It is important to distinguish between problems around recruitment and those to do with retention. So far we have focused on the recruitment issue and the feeder programmes to provide the necessary labour supply for the future. This is important not just to meet the increase in demand for these skills but to ensure also that the number of graduates entering a profession is sufficient to replace those leaving the profession through retirement. Retention, however, is a different issue. Improving supply would do little to ensure that such graduates are not recruited to other sectors, as is the case for a significant number of engineering graduates who are recruited by the financial sector. In this regard, the impact of Government intervention may be more limited save for helping employers to better understand the reasoning behind, and measures to mitigate, attrition of this kind. The industry itself set up a Talent and Skills Retention
Chapter 4: Sunset clause
79
web portal in July 2011 with the aim of providing an industry-led and sector-focused programme through which to facilitate the deployment and retention of key advanced manufacturing and engineering skills across the UK.
4.84 We recognise that both the Government and employers are aware of the need to alleviate skill shortages and are acting on this need. However, the evidence we received indicates that there is a need for an even more strategic, joined up approach in doing so. The evidence provided by partners from the health sector demonstrates that co-ordinated, concerted action can be effective in alleviating structural shortages over the medium to long term. That said, we do recognise that it is more straightforward to do so within the health sector because newly skilled workers are somewhat restricted to working within this sector. This is not the case for those workers with engineering skills, who are more easily able to work in other sectors, such as finance.
4.6 Conclusions
4.85 The Commission we received from the Government asked that we provide advice on a standard period after which removal from the shortage occupation list should become automatic – a sunset clause. Further, we were asked to consider whether, under such a system, exceptions should be permitted and whether a transitional period should be accorded to those occupations currently on the shortage list and which have exceeded the advised standard period.
4.86 We approached this part of the commission with particular care. We kept uppermost in our mind the ultimate objective of such a measure, namely a mechanism that balances the needs of business for skills in the short term against an incentive for domestic up-skilling for the medium and long-term. Both we and partners share the Government‟s view on the principle that the shortage list should act as a stop-gap only. However, we are not convinced that a sunset clause – irrespective of duration - provides the best means of achieving this.
4.87 In this chapter we considered first of all the impact of our methodological framework and how effective it has been at moving occupations or job titles both on to and off the list. Since publishing our first list in 2008 we have recommended removal of over 100 job titles, and have done so on a case-by-case basis using the evidence available to weigh up the often complex reasons for the underlying skills shortage in order to arrive at an informed decision. This approach would appear to work well and was endorsed by partners when we reviewed it in 2010.
4.88 A small number of occupations and job titles have now been on the list for over four years. Naturally, it is right to examine closely why this is the case and whether their continued inclusion is justified. The fact is that often these shortages are due to longer-term structural problems that will take longer than four years to remedy through training up UK workers. This does not mean we are advocating these job titles remain on the list in the
Skilled, Shortage, Sensible
80
long term – far from it. We recognise that at the moment there are good reasons for some job titles to remain on the list now, even if they have been on there for a number of years already. The longer these job titles remain on the list the more evidence should become available as to the measures being taken to address skill shortages, as well as some evaluation of their success. As such, we will place greater emphasis on seeking evidence to demonstrate that sufficient effort is being made either to up-skill or otherwise mitigate these shortages.
4.89 A good example of progress in this context has been in the health sector where we have been able, for this review, to remove a number of job titles from the list. However, for other occupations, while we did receive evidence of a number of different approaches and initiatives being instituted by employers and government agencies to tackle skills shortages, we did not receive evidence relating to an overall national strategy. We would have found it useful to receive evidence of co-ordinated approaches to these issues being made by the Sector Skills Councils (SSC), for instance.
4.90 We received written responses to our call for evidence from only four out of a total of 20 SSCs. We received evidence from many individual employers but only a small number of occupational representative bodies. We hope to see greater evidence reflecting a strategic, joined-up approach through co-ordinated responses during future reviews. As stated above, we will continue to require robust evidence to demonstrate that measures to alleviate skill shortages have been put into place and the extent to which these have been effective, in order to satisfy our sensible criteria.
4.91 Two-thirds of partners responding to our call for evidence provided significant and well-evidenced comments around the sunset clause. The majority of these partners were against a sunset clause. In the second half of this chapter we drew on this evidence to highlight the main problems identified. A sunset clause was seen as:
being disproportionate: the volume of skilled non-EEA workers entering the UK each year under the shortage list is around 1,400. Shortage occupation list usage is concentrated in a handful of occupations and volumes under other job titles are generally fewer than 20 each year. Usage may appear low but this also reflects the specialised nature of the skills in need.
taking insufficient account of specific needs by occupation and the time required to train domestic workers. Inevitably this will vary by occupation and a sunset clause would not provide sufficient flexibility.
failing to reflect the complexity of the economic conditions. Shortages arise in different occupations for different reasons. Again, flexibility of response would be hindered.
Chapter 4: Sunset clause
81
simply requiring employers to recruit migrants using the resident labour market test route, adding time, effort and expense to the process, where there is an acknowledged shortage of skills. As such a sunset clause for shortage occupations may end up just shifting the problem on to RLMT route. The net effect in terms of inflows of non-EEA skilled workers may therefore be negligible, while business would incur additional costs in the process.
4.92 Having considered our existing methodology and the views and evidence submitted by partners our preferred recommendation is that the current approach already meets, in a sensible way, the objective a sunset clause would seek to achieve. As such, we recommend that the Government retain the current approach of regular reviews. Such reviews should ideally take place on a bi-annual basis, to reflect the fact that a period of one year will not provide sufficient time for measures to alleviate skill shortages to take effect.
4.93 We recognise that, with the progression of time, efforts to alleviate skill shortages should begin to bear fruit. As such, we would place an increasing emphasis over time on evidence of efforts mitigate skills shortages to inform our sensible test criterion.
4.94 If, however, the Government still wishes to pursue a sunset clause, we suggest two key issues for further consideration:
If the Government opts for a sunset clause with automatic removal after a given period of time then two years is clearly too short. Instead, a minimum of four years should be considered. Business would argue for longer still but a balance would need to be struck in terms of the trade off between satisfying skills needs and the time needed to train.
Automatic removal in itself may be too blunt an instrument. Any perceived benefits may be outweighed by costs to business if their specific situations are not fully taken into account. In this case it would seem appropriate to allow a mechanism for appeal at the end of the sunsetting period to properly assess the continued need to import skills in the short term.
4.95 We now turn to our consideration of occupations and job titles for inclusion on the shortage occupation list. For the sake of completeness, we have conducted our review of occupations and job titles on the assumption that our preferred recommendation, that the current approach of regular reviews be retained, is accepted by the Government.


83
5.1 Introduction
5.1 This chapter discusses evidence in relation to occupations in the health sector. In the year to September 2012, occupations in the health sector accounted for 44 per cent of out-of-country Certificates of Sponsorship (CoS) issued under the shortage occupation route. There are currently 32 job titles related to the health sector on the shortage occupation list.
5.2 Evidence from our partners
The Centre for Workforce Intelligence (CfWI)
5.2 In previous reviews it was agreed that the NHS Workforce Review Team (WRT) was well placed to act as co-ordinator for gathering evidence within the health sector, and would utilise workforce information gathered as part of its annual assessment of workforce priorities carried out on behalf of the Department of Health (DH). NHS Employers (NHSE) previously provided input on workforce information from the employers‟ side, while Skills for Health (SfH) provided input from the devolved administrations and the independent sector.
5.3 In 2010 the WRT was merged into a new national authority on workforce planning and development for the health and social care sectors. The Centre for Workforce Intelligence (CfWI), as this authority became known, was established by DH to make an assessment of priority issues affecting the workforce in health and social care, based on policy and workforce needs. This includes modelling staff numbers based on various known drivers of demand and supply. The CfWI is, therefore, best placed to be able to offer evidence to this review. We very much value the work of, and our interaction with, the CfWI.
5.4 The CfWI applied our skilled, shortage and sensible methodology when assessing job titles and occupations, and, for each of these, provided a summary indicating the CfWI‟s view of whether the occupation or job title passes our criteria. The evidence we received was mainly related to health specialties and professions already on the shortage occupation list, although efforts were made to look for any further signs of shortage across the health sector. As with previous reviews, where we had queries we went back to the CfWI for clarification. In bringing together its evidence the
Chapter 5 Health occupations
Skilled, Shortage, Sensible
84
CfWI contacted a range of partners, including Royal Colleges and relevant professional bodies.
5.5 The CfWI also provided their estimate of the likely duration of shortage of a particular occupation or job title. The CfWI has stressed that the timescales provided are subject to review and dependent on mitigating measures being fully effective. As such, the estimates provided, while useful, are illustrative.
5.6 In Migration Advisory Committee 2011a, the CfWI provided data from the Health and Social Care Information Centre (HSCIC) census of March 2010. Unfortunately, census data have not been updated since then, meaning that the data are now over 2 years old. In this report, less weight is given to these data to reflect this fact.
Other evidence received
5.7 In addition, we also received evidence from Royal Colleges, specialty bodies, NHS trusts and the Welsh Government Department for Health, Social Services and Children, which was vital to counter the fact that the evidence provided by the CfWI related only to the situation in England. Where evidence related only to Scotland we include it in Chapter 8. Where this evidence mirrored the position for the UK, we have included it in this chapter.
5.3 Key issues and policies in the health sector
Government policy
5.8 Government policy can contribute to changes in both the supply of labour within the health sector and demand for health services. We discuss a few policies here which have had, or continue to have, impacts, but these are by no means exhaustive. These policies relate to England only.
5.9 The National Stroke Strategy: This strategy was launched in 2007 and sets a framework to secure improvements to stroke services. It therefore has an impact on a wide group of services and the jobs required to deliver them.
5.10 Improving outcomes: A strategy for cancer: This strategy was launched in 2011 and aims to deliver improved cancer outcomes. The strategy has an impact on how the reformed NHS will deliver cancer services and thus impacts upon those who deliver such services.
5.11 No health without mental health: A cross-government mental health outcomes strategy for people of all ages: This strategy was launched in 2011 and aims to secure improvements to mental health services and outcomes. This strategy aims to provide parity between mental health services and physical health services and, importantly for our purposes, will impact upon those who provide services.
Chapter 5 Healthcare occupations
85
Training
5.12 We appreciate that the length of training for the majority of health occupations is such that it is not possible to make rapid changes to the domestic workforce to respond to changes in demand. As such, measures taken by the NHS will often not realise results in the short to medium term.
5.13 CfWI highlighted that this is particularly the case where an occupation is not attractive to prospective recruits. Such occupations find it difficult to attract new workers whilst simultaneously facing problems with high attrition rates.
Innovation
5.14 Technical advancement can have major impacts on the health sector including a real impact on the desired composition of the workforce. For example, CfWI told us that interventional radiology techniques may go some way to replacing traditional surgical procedures, meaning that the skills mix will need to be altered to accommodate such changes.
Demographic need
5.15 CfWI told us that there were likely to be increased pressures on the NHS services as a result of demographic need. A significant proportion of patients accessing NHS treatment are expected to be older and, together with increasing incidence of chronic diseases, for example cancer, pressure on NHS services will increase. The skills mix of the NHS workforce needs to adapt to such changes if the NHS is to provide the level of service required.
5.4 Occupations we considered
5.16 In the sections that follow we discuss in more detail the occupations for which we received evidence.
5.17 We have linked each occupation and job title with the most appropriate Standard Occupational Classification (SOC) 2010 code. Unless otherwise stated, all of the occupations and job titles discussed pass our skilled criteria. We therefore focus mainly on the evidence in relation to our shortage and sensible criteria.
5.18 During the course of this chapter, we refer to medical grades. In this report, we focus on Specialty Training (ST) grades. Doctors at ST grades are undertaking training in a medical specialty (for example emergency medicine or paediatrics). In some specialties, the first two or three years (depending on specialty) of specialty training is referred to as Core Training (CT). We also refer to consultants, who have completed specialty training.
Skilled, Shortage, Sensible
86
5.19 Further information on the grades structure can be found at: http://www.nhscareers.nhs.uk/explore-by-career/doctors/training-to-become-a-doctor/.
5.5 Medical practitioners
Box 5.1: Medical practitioners 4-digit SOC 2010 Occupation:
2211 Medical practitioners
Only the following job titles within this occupation are included on our recommended shortage occupation list:
Consultants within the following specialities: emergency medicine, haematology and old age psychiatry. Non-consultant, non-training, medical staff posts in the following specialities: anaesthetics, general medicine specialities delivering acute care services (intensive care medicine, general internal medicine (acute)), emergency medicine (including specialist doctors working in accident and emergency), rehabilitation medicine and psychiatry.
Top-down data
Shortage Occupation passes 3 out of 12 available indicators
Winter 13 Winter 13
P1: Percentage change of median real pay (over 1 year)
-3.07 V2: Percentage change of employment level (over 1 year)
-6.93
P2: Percentage change of median real pay (over 3 years)
-2.19 V3: Percentage change of median paid hours worked (over 3 years)
0.00
P3: Return to occupation -0.01 V4: Change in new hires (over 1 year)
0.01
I1: Change in median vacancy duration (over 1 year)
-3.63 E1: Skill-shortage vacancies / total vacancies
21.77
I2: Vacancies / claimant count
1.98 E2: Skill-shortage vacancies / hard-to-fill vacancies
68.03
V1: Percentage change of claimant count (over 1 year)
-2.81 E3: Skill-shortage vacancies / employment
0.15
Sensible
Percentage of workforce born non-EEA
27.1 Percentage of workforce trained in past 13 weeks
65.2
Total employment in this 4-digit occupation is approximately 222000 (average, LFS, 2011Q3-2012Q2)
Partner evidence received from:
The Department of Health: the Centre for Workforce Intelligence; the Welsh Government Department of Health, Social Services and Children.
5.20 The occupation medical practitioners passes 3 out of 12 top-down shortage indicators, indicating little overall shortage. However, this occupation covers a wide range of medical job titles and, therefore, the top down data will not be highly relevant to any particular job title.
5.21 For each of the specialties that we considered for the shortage occupation list, we received evidence relating to most of our indicators. This included information on, where available, headcount numbers, vacancy rates, retirement predictions and levels of trainees.
Chapter 5 Healthcare occupations
87
Consultant roles
5.22 Consultants in the specialties discussed below were recommended by the CfWI for inclusion on the shortage occupation list.
5.23 Emergency medicine: This consultant speciality is currently on the shortage occupation list. The CfWI told us that there were 202 training posts in 2011, of which only 83 were filled. In 2012, only 94 out of 183 such posts were filled. As such, CfWI estimate that there is a national shortage of this consultant speciality of between 59 and 109 posts per annum.
5.24 The CfWI told us that the demand for emergency medical care had increased in recent years, particularly among men over the age of 65 and women aged in the age range 20 to 24 and those over 70 years of age. The CfWI also told us that the prime causes of shortage in emergency medicine were the low attractiveness and high attrition rate of the speciality. 2011 represented a low in terms of recruiting to training posts at ST4, with a fill rate (the number of training posts which are successfully recruited to) of only 41 per cent. There was a marginal increase to 44 per cent in 2012.
5.25 The CfWI estimate that future numbers of emergency medicine consultants will increase over the next decade. However, they do not consider that supply will meet demand before 2020. We recognise that these positions are vital to maintain frontline services. Thus, we recommend that consultants in emergency medicine remain on the shortage occupation list.
5.26 Haematology: This consultant speciality is currently on the shortage occupation list. The CfWI told us that there were 62 training posts in 2011, of which 58 were filled. In 2012, 54 out of 57 such posts were filled.
5.27 The CfWI told us that the Royal College of Pathologists estimates that there are as many as 60 vacant posts which are not being advertised as employers consider that they will not be able to fill vacancies. This represents a reduction from the 70 vacant posts reported in 2011. The fact that employers are unable to fill such posts at present may indicate that there is insufficient international supply of consultants in haematology.
5.28 The CfWI told us that the key issues contributing to a shortage of consultants in this profession were the high levels of failure in the pathology examination (around 50 per cent) and the laboratory component of studies. That said, as demonstrated by the data provided by the deaneries, fill rates for ST3 training posts are high, at around 95 per cent.
5.29 The CfWI supply estimates indicate a sharp increase in the future number of haematology consultants from 2014, although this may be offset by an expected peak in retirements. As such, we recommend that consultants in haematology be retained on the shortage occupation list. However, we will
Skilled, Shortage, Sensible
88
continue to monitor the situation, given that supply is expected to meet demand in the next two years.
5.30 Psychiatry of old age: This consultant speciality is currently on the shortage occupation list. In Migration Advisory Committee 2011a, we stated that we would carefully monitor vacancy rates for this job title as they were relatively low at that time.
5.31 The CfWI told us that the Royal College of Psychiatry (RCPsych) Census of 2011 reported that there were 22 vacant posts in the psychiatry of old age workforce in 2011, which represents a vacancy rate of four per cent. In addition, the CfWI told us that in 2012 only 30 per cent (12 out of 40) of ST3 training posts were filled compared to 68 percent (30 out of 44) in 2011. This might suggest that the shortage has exacerbated since we last reviewed the occupation.
5.32 To mitigate this, the RCPsych implemented a five year recruitment strategy in 2011, to last until 2016. This strategy has set recruitment targets of a 50 per cent increase in applications and a 95 per cent fill rate. In parallel, the Department of Health has agreed to increase the number of F1 and F2 posts in psychiatry to 7.5 per cent of all foundation posts. These activities should have a long term impact on shortage levels.
5.33 Thus, given the long-term measures put in place to address the shortage of consultants in this specialism, and recognising the importance of mental health medicine and the increasing demands placed on these services as a result of an ageing population, we recommend that consultants in the psychiatry of old age be retained on the shortage occupation list.
Non-Consultant, non-training medical roles
5.34 In our spring 2009 report (Migration Advisory Committee 2009a), we highlighted the problems faced by the health sector due to junior doctors having to comply with the Working Time Directive (WTD). This created particular issues of shortage in areas where round-the-clock cover is required for non-consultant, non-training staff. As such, the Department of Health asked that we recommend these 24-hour immediate patient care jobs be placed on the shortage occupation list. In subsequent reviews (Migration Advisory Committee 2009b and 2011a) we found these job titles still to be in shortage.
5.35 For this review, the CfWI set out four criteria to be met for them to put forward non-consultant, non-training occupations for inclusion on the shortage occupation list:
Chapter 5 Healthcare occupations
89
“the CfWI has only recommended specialty doctors at non-consultant, non-training (NCNT) grades for inclusion on the SOL if:
1. nationally, there is clear evidence that participation levels and working time issues contribute to significant service delivery issues
2. nationally, the speciality training programme is undersubscribed, such that the supply pipeline is inadequate to meet anticipated demand for trained doctors
3. a national taskforce has been established due to the severity of the shortage in the speciality
4. it is sensible to include the speciality on the SOL, as there is an international supply of appropriately qualified doctors.”
The Centre for Workforce Intelligence (CfWI), Department of Health response to MAC call for evidence
5.36 The CfWI provided evidence in relation to five specialties which they consider to be in shortage: anaesthetics, emergency medicine, and general medical specialties delivering acute care, which are currently on the shortage occupation list, and psychiatry and rehabilitation medicine, which are not.
5.37 Anaesthetics: The evidence we received in relation to non-consultant, non-training medical roles in anaesthetics was not strong. The CfWI told us that the Royal College of Anaesthetists (RCoA) reported that there were shortages of 236 specialty doctors in 2010 compared to 191 in 2007. However, there was no evidence provided to indicate that increasing levels of shortage had continued in the period since 2010.
5.38 We were also told that the RCoA estimated, in 2007, that 457 non-consultant, on-training specialists in anaesthetics were expected to retire by the end of 2012, whilst only 112 were expected to retire between 2012 and 2015, suggesting that retirement may be declining as a reason for shortage. Furthermore, fill rates for training posts at CT1 level were 95 per cent in 2011 and 100 per cent in 2012, whilst only 15 out of 316 posts were unfilled at ST3 level.
5.39 From the evidence provided, it appears that the main reason for any shortage relates to the adaptation to the WTD which restricts trainees to working a maximum of 48 hours per week. This has seen the number of hours worked reduce from 56 hours to 52 hours. As such, many trusts have found it difficult to provide 24 hour coverage.
5.40 However, in view of the fact that there is some evidence of shortage, particularly in relation to trusts‟ abilities to provide round-the-clock coverage, and in light of the crucial service provided by anaesthetists, we recommend that non-consultant, non-training medical roles in the specialty
Skilled, Shortage, Sensible
90
anaesthetics be retained on the shortage occupation list. We will expect to see stronger evidence of shortage before recommending this job title be included on the list in any future reviews.
5.41 General medical specialties delivering acute care services: The evidence provided to us in respect of this specialty was not strong, mainly due to the relative absence of recent data. The CfWI told us that the Royal College of Physicians (RCP) reported a vacancy rate for this specialty of 8.6 per cent in their 2009 census. In the same year, fill rates for training were 34 per cent. Fill rates have improved in recent years, to 79 per cent in 2010 and 84 per cent in 2011. In 2012, fill rates were at 88 per cent for the first round of recruitment, but reduced to only 30 per cent for the second round. We were told that it was difficult to fill such posts due to the specialty being regarded as unattractive; with workload and poor work-life balance the most commonly cited factors for this.
5.42 Therefore, although evidence of shortage is not strong, there do appear to be ongoing issues with regard to recruitment and retention. We recommend that non-consultant, non-training medical roles in general medical specialties delivering acute care services be retained on the shortage occupation list for the time being.
5.43 Rehabilitation medicine: We did not receive strong evidence in relation to vacancy rates for this specialty. However, the CfWI did tell us that the Specialty Committee for Rehabilitation Medicine (SCRM) reported significant difficulty in recruiting candidates into training programmes for this specialty, with fill-rates of only 32 per cent for both 2011 and 2012. SCRM told us that this is due to the fact that rehabilitation medicine receives extremely limited exposure in medical schools, the absence of a specific training pathway to produce middle-grade doctors and problems in recruiting from within the EEA.
5.44 On balance, we recognise that there is some evidence of shortage within the specialty. The profile of this specialty remains low, and measures are being considered to address the lack of interest among the medical profession. To allow time for partners to tackle the problems they face in recruiting workers to the specialty, we recommend the inclusion of non-consultant, non-training medical roles in rehabilitation medicine on the shortage occupation list for the time being. However, we wish to see stronger evidence of shortage in any future reviews we are asked to undertake.
5.45 In the specialties of emergency medicine (including specialist doctors working in Accident and Emergency) and psychiatry, the Department of Health has established task forces to address the underlying causes of shortage, which are expected to go some way to resolving shortage issues in the next five years. In addition, a review on the future shape of medical training is due to report in summer 2013 which will have implications for all medical and related health professionals, not least for non-consultant, non-training doctors in emergency medicine and psychiatry.
Chapter 5 Healthcare occupations
91
5.46 With regard to shortage in emergency medicine (including specialist doctors working in Accident and Emergency), the CfWI told us that the College of Emergency Medicine (CEM) conducted a survey of emergency departments in 2011. Indicative findings from this survey suggest that vacancy rates are as high as 15 per cent across all grades. Further, the CfWI told us that fill rates for training places in emergency medicine at ST4 level are currently very low at 44 per cent in 2012. By comparison, at CT1 level fill rates are significantly higher at 94 per cent in 2012. This suggests that any shortage exists predominantly at middle grades, likely due to high attrition rates.
5.47 We received evidence of shortage in the specialty psychiatry from the CfWI, who told us that the Royal College of Psychiatry‟s (RCPsych) Census 2011 reported significant vacancy rates for non-consultant, non-training grades in this speciality. Vacancy rates range from nine per cent for forensic psychiatry to 70 per cent for liaison psychiatry. We were also told that one trust has gone so far as to recommend that posts in the specialism of psychiatry be reclassified as consultant posts as a cost effective measure to alleviate shortage.
5.48 The evidence we received clearly indicated that there are still issues in filling posts at non-consultant, non-training level in emergency medicine, which are even more acute in respect of psychiatry. We do not wish to impact upon these very important service delivery areas. Therefore, for the time being, we recommend that non-consultant, non-training medical staff in emergency medicine (including specialist doctors working in accident and emergency) be retained on the shortage occupation list. We also recommend that non-consultant, non-training medical staff posts in the specialty of psychiatry be added to the shortage occupation list.
Medical practitioner roles recommended for removal from the shortage occupation list
5.49 During our review of the shortage occupation list, we had constructive engagement with the CfWI. We were pleased to discover that increased expenditure in the training of health professionals since 2000 has resulted in the alleviation of structural shortages, particularly in respect of consultants in some specialties. In this review, the CfWI told us that there now existed shortages in only a few specialties. Consultants in the specialties discussed below were recommended by the CfWI for removal from the shortage occupation list.
5.50 Clinical Neurophysiology: The CfWI told us that their workforce projections estimate that there will be 85 full time equivalent consultants in clinical neurophysiology by 2012. This represents less than 50 per cent of the required 180 FTE. However, they also told us that General Medical Council (GMC) data indicate that there have been no (0) non-EEA recruits into the job title since 2008, which might indicate a lack of international supply of such specialist consultants. In the absence of suitable international supply, the CfWI do not consider it sensible to retain this job title on the shortage occupation list.
Skilled, Shortage, Sensible
92
5.51 Forensic Psychiatry: The CfWI told us that Trusts continue to report difficulties in the retention of workers in this specialty. However, they also told us that their forecasts indicated that the UK-trained supply of candidates for such roles was expected to grow over the next eight years. In conjunction with limited international recruitment, due to the fact that knowledge of the law in relation to clinical practice is central to clinical psychiatry work, the CfWI do not consider it sensible to retain specialists in forensic psychiatry on the shortage occupation list.
5.52 General Psychiatry: The CfWI told us that they project an increase in headcount within this job title from 2,405 in 2011 to 2,855 in 2015. In addition, they also report that there was a three per cent vacancy rate as at 31 December 2011 – 56 vacancies out of 1,735 posts. As such, the CfWI consider there to be insufficient evidence of shortage and recommend that this job title be removed from the shortage occupation list.
5.53 We also received evidence from the Welsh Government Department of Health, Social Services and Children in relation to this specialty. They told us that six health boards in Wales had reported recruitment difficulties during 2012. However, as at September 2012, there were only two vacancies across Wales, therefore, we do not consider this to be sufficiently compelling evidence of shortage.
5.54 Genito-urinary Medicine: The CfWI reported that there was variable evidence of shortage within this job title. It is their view that any shortage relates to geographical variation rather than a national shortage. As such, they do not consider it sensible for this job title to be retained on the shortage occupation list.
5.55 Neurology: Again, the CfWI told us that any shortage within this specialty tended to be the result of geographical variation rather than a national shortage. With an increasing domestic supply and high training fill rates, the CfWI do not consider there to be sufficient evidence of a national shortage for this job title to be retained on the shortage occupation list.
5.56 Occupational Medicine: The CfWI, and NHS Employers, told us that there was insufficient evidence of a national shortage for them to support continued inclusion of this speciality on the shortage occupation list.
5.57 Psychiatry of learning disabilities: The CfWI told us that they estimate that the consultant workforce headcount for this specialty will increase from 268 in 2011 to 375 in 2020. In conjunction with limited international recruitment, the CfWI do not consider it sensible to retain this job title on the shortage occupation list.
5.58 Non-consultant, non-training medical roles in the specialties discussed below were not recommended by the CfWI for continued inclusion on the shortage occupation list.
Chapter 5 Healthcare occupations
93
5.59 General surgery: The CfWI told us that the Association of Surgeons for Great Britain and Ireland has requested the removal of this specialty from the shortage occupation list. This is due to their forecast of a surplus of trainees between 2013 and 2016 and an eventual surplus of between 58 and 90 consultant posts.
5.60 Obstetrics and gynaecology: The CfWI told us that there is limited evidence of continuing shortage in this specialty. Indeed, fill rates for ST1 and ST3 level training posts were at 100 per cent in 2012.
5.61 Paediatrics: The CfWI told us that some employers had reported difficulties in filling vacancies. However, they also told us that there is a 100 per cent fill rate for training posts at ST1 level. Furthermore, in 2011 the Royal College of Paediatrics and Child Health estimate that there were too many trainees for the number of projected consultancy vacancies. As such, the CfWI do not consider it sensible for this specialty to remain on the shortage occupation list.
5.62 We did receive evidence from the Welsh Government Department of Health, Social Services and Children in relation to this specialty. They told us that four health boards in Wales had reported recruitment difficulties during 2012. However, as at September 2012, there were only seven vacancies across Wales. As such, we do not consider this to be sufficiently compelling to demonstrate evidence of a UK wide shortage.
5.63 Trauma and orthopaedic surgery: The CfWI told us that the British Orthopaedic Association has requested the removal of this specialty from the shortage occupation list, due to training fill rates of 100 per cent at CT2/ST3 grades for both 2011 and 2012. Therefore, we recommend that this occupation is removed from the shortage occupation list.
5.64 We did receive limited evidence in relation to these job titles from partners other than the CfWI, predominantly from individual NHS trusts or deaneries. The evidence we received was not sufficient to make us think that the CfWI had erred in their recommendations, particularly given that CfWI told us that the mitigating measures put in place had, or would soon, have an impact. The CfWI also told us that changes to the skill mix meant that the workforce within the health sector was working at a more optimal level. As such, we recommend that the above job titles are removed from the shortage occupation list.
5.65 The Welsh Government Department of Health, Social Services and Children also provided us with evidence in relation to the job titles clinical radiology consultant and care of the elderly consultant. However, there was insufficient evidence to suggest that any shortage experienced in Wales reflected a UK wide shortage of such specialties. Rather, it is likely that such shortages are regional in nature. As such, we do not recommend that the job titles clinical radiology consultant and care of the elderly consultant be added to the shortage occupation list.
Skilled, Shortage, Sensible
94
5.66 We would be happy to work with the Welsh Government Department of Health, Social Services and Children during the course of any future reviews.
5.6 Biological scientists and biochemists
Box 5.2: Biological scientists and biochemists
4-digit SOC 2010 Occupation: 2112 Biological scientists and biochemists
Only the following job titles within this occupation are included on our recommended shortage occupation list:
Clinical neurophysiologist: practitioner and scientist grades.
Top-down data
Shortage Occupation passes 1 out of 12 available indicators
Winter 13 Winter 13
P1: Percentage change of median real pay (over 1 year)
-4.82 V2: Percentage change of employment level (over 1 year)
-16.11
P2: Percentage change of median real pay (over 3 years)
-1.11 V3: Percentage change of median paid hours worked (over 3 years)
-0.01
P3: Return to occupation -0.34 V4: Change in new hires (over 1 year)
-0.03
I1: Change in median vacancy duration (over 1 year)
26.30 E1: Skill-shortage vacancies / total vacancies
15.84
I2: Vacancies / claimant count
0.12 E2: Skill-shortage vacancies / hard-to-fill vacancies
90.41
V1: Percentage change of claimant count (over 1 year)
-4.95 E3: Skill-shortage vacancies / employment
0.20
Sensible
Percentage of workforce born non-EEA
13.1 Percentage of workforce trained in past 13 weeks
36.2
Total employment in this 4-digit occupation is approximately 73000 (average, LFS, 2011Q3-2012Q2)
Partner evidence received from:
The Department of Health: the Centre for Workforce Intelligence.
5.67 The occupation biological scientists and biochemists passes 1 out of 12 top-down indicators of shortage. However, the evidence we received only relates to a small sub-set of job titles within this occupation. The top-down data are, therefore, of limited relevance.
Clinical neurophysiologist: practitioner and scientist grades
5.68 This job title is currently on the shortage occupation list. The evidence we received from partners in respect of this job title was not strong. The evidence we received from the CfWI relied on the HSCIC Census of 2010 which indicated a 3 month vacancy rate of 0.7 per cent, compared to 0.4 per cent for health sciences as a whole.
5.69 However, the CfWI told us that this job title had been the victim of being perceived as relatively low profile with an unstructured training pathway. The Modernising Scientific Careers (MSC) Programme commenced in
Chapter 5 Healthcare occupations
95
2008 to address such issues. As a result, new undergraduate Practitioner Training (PTP) and postgraduate Scientist Training (STP) degrees have been introduced, with the first STP students expected to graduate in 2014. The CfWI told us that the Association of Neurophysiological Scientists estimate that around 25 students per annum for the PTP are required to maintain the current workforce. However, there will be no PTP enrolment until 2013.
5.70 Given that steps have been taken to alleviate shortages in this area, which ought to bear fruit in the near future, and increased demands on neurophysiology services resulting from an ageing population, we recommend that the job title Clinical Neurophysiologist be retained on the shortage occupation list on this occasion. We will look carefully at this job title in any future review to see whether there is a trend towards increased shortage or whether the job title could be removed from the shortage occupation list.
Clinical vascular scientist
5.71 This job title is currently on the shortage occupation list. The CfWI told us that the Society for Vascular Technology of Great Britain and Ireland (SVTGBI) estimate a UK wide shortage of around 20 posts, based on job advertisements and an assumption of demand of around six FTE per 500,000 population.
5.72 However, in 2011 the SVTGBI recorded 3,000 applications for 10 training places for Scientist Training Programmes (STPs) which, unsurprisingly, were filled. The SVTGBI also forecast 10 new clinical vascular scientists to enter the workforce in 2014 as a result of the MSC programmes. The CfWI told us that NHS South of England expect that the STP should deliver a workforce at the required level, so inclusion on the shortage occupation list was no longer required.
5.73 Therefore, we are content to accept the evidence provided by the CfWI and recommend that the job title Clinical Vascular Scientist be removed from the shortage occupation list.
Respiratory and sleep physiologists
5.74 In our previous review of the shortage occupation list (Migration Advisory Committee 2011a) we recommended that both the respiratory and sleep physiologist job titles should remain on the shortage occupation list. However, on this occasion, the CfWI have told us that the evidence of shortage is limited. The Association of Respiratory Technology and Physiology (ARTP) did report that there were 32 vacancies in 2010, 11 in 2011 and 16 in 2012. The ARTP also report that fill rates for vacancies were 43 per cent in 2007, 67 per cent in 2008, 62.5 per cent in 2009 and 44 per cent in 2012.
Skilled, Shortage, Sensible
96
5.75 Therefore, given the limited evidence of current shortage in these job titles, we recommend that the job titles respiratory and sleep physiologists be removed from the shortage occupation list.
5.7 Physical Scientists
Box 5.3: Physical scientists
4-digit SOC 2010 Occupation: 2113 Physical scientists
Only the following job titles within this occupation are included on our recommended shortage occupation list:
Nuclear medicine scientist and radiotherapy physicist.
Top-down data
Shortage Occupation passes 3 out of 11 available indicators
Winter 13 Winter 13
P1: Percentage change of median real pay (over 1 year)
-3.77 V2: Percentage change of employment level (over 1 year)
-1.00
P2: Percentage change of median real pay (over 3 years)
0.41 V3: Percentage change of median paid hours worked (over 3 years)
-0.27
P3: Return to occupation -0.45 V4: Change in new hires (over 1 year)
I1: Change in median vacancy duration (over 1 year)
11.27 E1: Skill-shortage vacancies / total vacancies
27.83
I2: Vacancies / claimant count
0.30 E2: Skill-shortage vacancies / hard-to-fill vacancies
64.44
V1: Percentage change of claimant count (over 1 year)
-27.02 E3: Skill-shortage vacancies / employment
0.57
Sensible
Percentage of workforce born non-EEA
8.8 Percentage of workforce trained in past 13 weeks
27.8
Total employment in this 4-digit occupation is approximately 19000 (average, LFS, 2011Q3-2012Q2)
Partner evidence received from:
The Department of Health: the Centre for Workforce Intelligence.
5.76 The occupation physical scientists passes 3 out of 11 top-down indicators, providing little indication of shortage. The job titles nuclear medicine scientist and radiotherapy physics scientist are currently on the shortage occupation list. Similarly, nuclear medicine technologists and radiotherapy technologists are currently on the shortage list. They all form a very small sub-section of this diverse occupation and therefore the top-down analysis is of little relevance.
5.77 The CfWI have argued that the above job titles be retained on the shortage occupation list. The CfWI told us that there remains a lack of detailed data regarding this workforce. However, they were able to advise that the Institute for Physics and Engineering in Medicine (IPEM) was in the process of establishing a workforce intelligence function for this sector, so the absence of granular data should be resolved in the medium term.
Chapter 5 Healthcare occupations
97
5.78 The CfWIl told us about a survey conducted by the Society of Radiographers (SCoR) in 2011. This revealed that 15 per cent (six) of responding departments (40) reported vacancies with 13 per cent (five) reporting three-month vacancies. The current vacancy rate, we were told, across all 40 responding departments stands at five per cent, with three-month vacancy rates of 2.1 per cent. In addition, a joint IPEM and SCoR survey in 2011 indicates that there was a 5.5 per cent vacancy rate across the whole radiotherapy workforce, including a 7.8 per cent rate for all clinical scientists.
5.79 Despite the limited evidence of shortage, the CfWI told us that the Department of Health‟s 2012 report Radiotherapy Services in England identified a shortage of physics resource as a key impediment to the expansion of advanced radiotherapy techniques such as intensity modulated radiation treatment. The CfWI told us that IPEM support this view, and were concerned that new technological developments in proton therapy and the Government‟s commitment of an additional £15 million for advanced radiotherapy equipment will create additional staffing requirements.
5.80 IPEM also reported that this situation will be exacerbated by the fact that a number of experienced staff are close to retirement, with obvious implications for knowledge sharing and the training of inexperienced staff. No actual figures of the scale of this problem were reported.
5.81 Given that there is some evidence of shortage and increased demand for the services provided by nuclear scientists and radiotherapy physics scientists, we recommend that the job titles nuclear medicine scientist, radiotherapy physics scientist, nuclear medicine technologist and radiotherapy technologist be retained on the shortage occupation list. We will look carefully at these job titles in any future review to see whether there is any trend towards increased shortage or whether the job titles could be removed from the list.
Staff working in diagnostic radiology (including magnetic resonance imaging).
5.82 This specialty is currently on the shortage occupation list. The CfWI told us that they are unable to provide sufficient evidence to support continuing shortage, mainly because the data held are not sufficiently granular. However, they were able to tell us that the IPEM reported sufficient applicant numbers for posts at Band 7 (team manager level). In addition, the CfWI told us that the Health and Social Care Information Centre report that only 13.5 per cent of the workforce is aged 55 years of age or more, indicating little risk from retirement issues in the next five years.
5.83 Therefore, the CfWI recommends that the job title staff working in diagnostic radiology (including magnetic resonance imaging) is removed from the shortage occupation list. In the absence of evidence of shortage, we agree and recommend the removal of this job title from the shortage
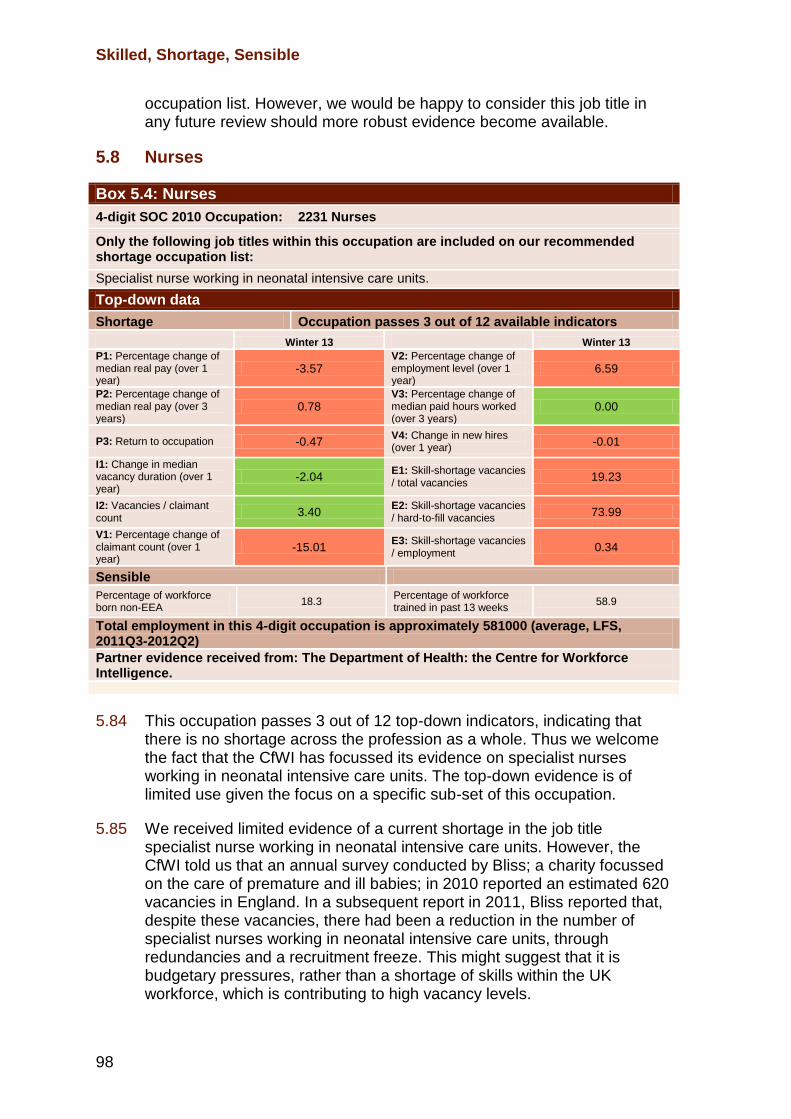
Skilled, Shortage, Sensible
98
occupation list. However, we would be happy to consider this job title in any future review should more robust evidence become available.
5.8 Nurses
Box 5.4: Nurses
4-digit SOC 2010 Occupation: 2231 Nurses
Only the following job titles within this occupation are included on our recommended shortage occupation list:
Specialist nurse working in neonatal intensive care units.
Top-down data
Shortage Occupation passes 3 out of 12 available indicators
Winter 13 Winter 13
P1: Percentage change of median real pay (over 1 year)
-3.57 V2: Percentage change of employment level (over 1 year)
6.59
P2: Percentage change of median real pay (over 3 years)
0.78 V3: Percentage change of median paid hours worked (over 3 years)
0.00
P3: Return to occupation -0.47 V4: Change in new hires (over 1 year)
-0.01
I1: Change in median vacancy duration (over 1 year)
-2.04 E1: Skill-shortage vacancies / total vacancies
19.23
I2: Vacancies / claimant count
3.40 E2: Skill-shortage vacancies / hard-to-fill vacancies
73.99
V1: Percentage change of claimant count (over 1 year)
-15.01 E3: Skill-shortage vacancies / employment
0.34
Sensible
Percentage of workforce born non-EEA
18.3 Percentage of workforce trained in past 13 weeks
58.9
Total employment in this 4-digit occupation is approximately 581000 (average, LFS, 2011Q3-2012Q2)
Partner evidence received from: The Department of Health: the Centre for Workforce Intelligence.
5.84 This occupation passes 3 out of 12 top-down indicators, indicating that there is no shortage across the profession as a whole. Thus we welcome the fact that the CfWI has focussed its evidence on specialist nurses working in neonatal intensive care units. The top-down evidence is of limited use given the focus on a specific sub-set of this occupation.
5.85 We received limited evidence of a current shortage in the job title specialist nurse working in neonatal intensive care units. However, the CfWI told us that an annual survey conducted by Bliss; a charity focussed on the care of premature and ill babies; in 2010 reported an estimated 620 vacancies in England. In a subsequent report in 2011, Bliss reported that, despite these vacancies, there had been a reduction in the number of specialist nurses working in neonatal intensive care units, through redundancies and a recruitment freeze. This might suggest that it is budgetary pressures, rather than a shortage of skills within the UK workforce, which is contributing to high vacancy levels.
Chapter 5 Healthcare occupations
99
5.86 The CfWI provided anecdotal evidence from the Royal College of Nursing (RCN), the Foundation Trust Network and the Independent Healthcare Advisory Service as to the existence of shortages in this specialty. The RCN, in particular, report a high incidence of staff working overtime to meet patient needs.
5.87 Notwithstanding the absence of specific data to illustrate shortage, it does appear that there is difficulty in recruiting specialist nurses in neonatal intensive care units. In light of this, and the crucial role such nurses have, we recommend that this job title remains on the shortage occupation list. However, we will want to see more detailed evidence of shortage in any future review we are asked to conduct.
5.88 The specialties Operating Department Practitioner (ODP) and specialist nurse working in theatres are currently on the shortage occupation list. The CfWI forecast rapid growth in the future supply of operating theatre staff from 2012 onward, at a level which would exceed demand based on population growth. The CfWI also told us that there is considerable overlap between specialist nurses working in operating theatres, operating department practitioners and potentially assistant practitioners who choose to work in operating theatres.
5.89 The CfWI consider that any current shortage is due to regional variations. For example, in 2010, 52 per cent of all three-month vacancies were in the East of England Strategic Health Authority area.
5.90 That said, there is a risk that any shortage will become more pronounced during the academic year 2014-15, with the introduction of a three year degree programme in 2012 to replace the current two year programme. There will be a one year restriction on domestic supply as the current two year programme comes to an end in 2014 whilst the first cohort of degree students will graduate in 2015.
5.91 However, as there is insufficient evidence of shortage of either ODPs or specialist nurses working in theatres, and as measures to extend the skill mix take effect, the CfWI do not recommend continued inclusion on the shortage occupation list. Therefore, we recommend that the job titles ODP and specialist nurse working in theatres be removed from the shortage occupation list.
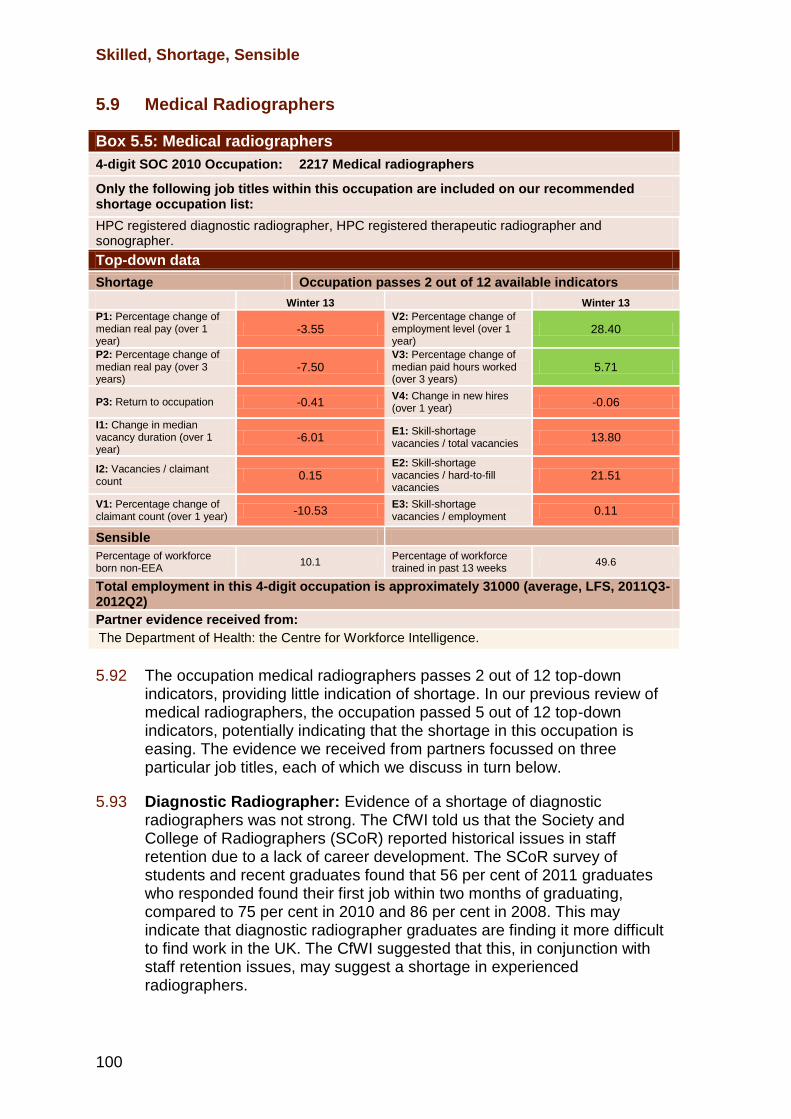
Skilled, Shortage, Sensible
100
5.9 Medical Radiographers
Box 5.5: Medical radiographers
4-digit SOC 2010 Occupation: 2217 Medical radiographers
Only the following job titles within this occupation are included on our recommended shortage occupation list:
HPC registered diagnostic radiographer, HPC registered therapeutic radiographer and sonographer.
Top-down data
Shortage Occupation passes 2 out of 12 available indicators
Winter 13 Winter 13
P1: Percentage change of median real pay (over 1 year)
-3.55 V2: Percentage change of employment level (over 1 year)
28.40
P2: Percentage change of median real pay (over 3 years)
-7.50 V3: Percentage change of median paid hours worked (over 3 years)
5.71
P3: Return to occupation -0.41 V4: Change in new hires (over 1 year)
-0.06
I1: Change in median vacancy duration (over 1 year)
-6.01 E1: Skill-shortage vacancies / total vacancies
13.80
I2: Vacancies / claimant count
0.15 E2: Skill-shortage vacancies / hard-to-fill vacancies
21.51
V1: Percentage change of claimant count (over 1 year)
-10.53 E3: Skill-shortage vacancies / employment
0.11
Sensible
Percentage of workforce born non-EEA
10.1 Percentage of workforce trained in past 13 weeks
49.6
Total employment in this 4-digit occupation is approximately 31000 (average, LFS, 2011Q3-2012Q2)
Partner evidence received from:
The Department of Health: the Centre for Workforce Intelligence.
5.92 The occupation medical radiographers passes 2 out of 12 top-down indicators, providing little indication of shortage. In our previous review of medical radiographers, the occupation passed 5 out of 12 top-down indicators, potentially indicating that the shortage in this occupation is easing. The evidence we received from partners focussed on three particular job titles, each of which we discuss in turn below.
5.93 Diagnostic Radiographer: Evidence of a shortage of diagnostic radiographers was not strong. The CfWI told us that the Society and College of Radiographers (SCoR) reported historical issues in staff retention due to a lack of career development. The SCoR survey of students and recent graduates found that 56 per cent of 2011 graduates who responded found their first job within two months of graduating, compared to 75 per cent in 2010 and 86 per cent in 2008. This may indicate that diagnostic radiographer graduates are finding it more difficult to find work in the UK. The CfWI suggested that this, in conjunction with staff retention issues, may suggest a shortage in experienced radiographers.
Chapter 5 Healthcare occupations
101
5.94 Therapeutic Radiographer: Evidence in relation to shortage among this job title was stronger than that for Diagnostic Radiographers. The CfWI told us that data held by SCoR indicated that the vacancy rate for qualified therapeutic radiographers was 7.6 per cent in 2012.
5.95 Sonographer: Again, there was stronger evidence of shortage for this job title. The SCoR Census of 2011 indicates a vacancy rate of 10.9 per cent, citing a lack of suitable applicants as the major reason for the vacancies.
5.96 There was conflicting evidence in respect of demand for the services provided by diagnostic and therapeutic radiographers. DH data indicate that there has been an annual increase in imaging activity, averaging three per cent annual growth. However, DH commissioning data indicate that the number of commissions are levelling off and starting to decrease in recent years. By contrast DH data indicate an annual increase in demand for the ultrasound activity conducted by sonographers of five per cent, and an overall increase of 124 per cent from 1995 to 2012.
5.97 At first view, we were minded to recommend retention of the job title sonographer on the shortage occupation list and the removal of the diagnostic and therapeutic radiography job titles from the list. However, the SCoR told us that the supply of diagnostic and therapeutic radiographers largely determines the future supply of sonographers. There is, as yet, no structured career path in sonography with the bulk of sonographers beginning their career as diagnostic and therapeutic radiologists. Indeed, the SCoR report that 80 per cent of sonographers on the voluntary register have a background in radiology. For that reason, we recommend the job titles diagnostic radiographer, therapeutic radiographer and sonographer be retained on the shortage occupation list. However, in any future review, we are strongly minded to remove the job titles diagnostic radiographers and therapeutic radiographers from the shortage occupation list in the absence of comprehensive evidence.
5.10 Other health sector job titles
5.98 Higher specialty training posts (ST4) in paediatrics: The CfWI told us that the Royal College of Paediatrics and Child Health (RCPCH) forecast an oversupply of trainees for the estimated future number of consultants. Indeed, the RCPCH recommend a decrease in the number of trainees from 2,929 to 1,720 FTE or 3,500 to 2,000 in headcount terms. Furthermore, according to the RCPCH, fill rates for training posts at ST1 level were 100 per cent in both 2011 and 2012. As such, the CfWI advise that there is no evidence of shortage within this specialty. Therefore, we recommend the removal of higher specialty training posts (ST4) in paediatrics from the shortage occupation list.
5.99 Cardiac Physiologists: This specialty is currently on the shortage occupation list. However, the CfWI have told us that the mitigating measures put in place are such that there is little difficulty in filling training programmes. In addition, the CfWI told us that with only 11 per cent of the current workforce aged over 55 years of age, they do not forecast any
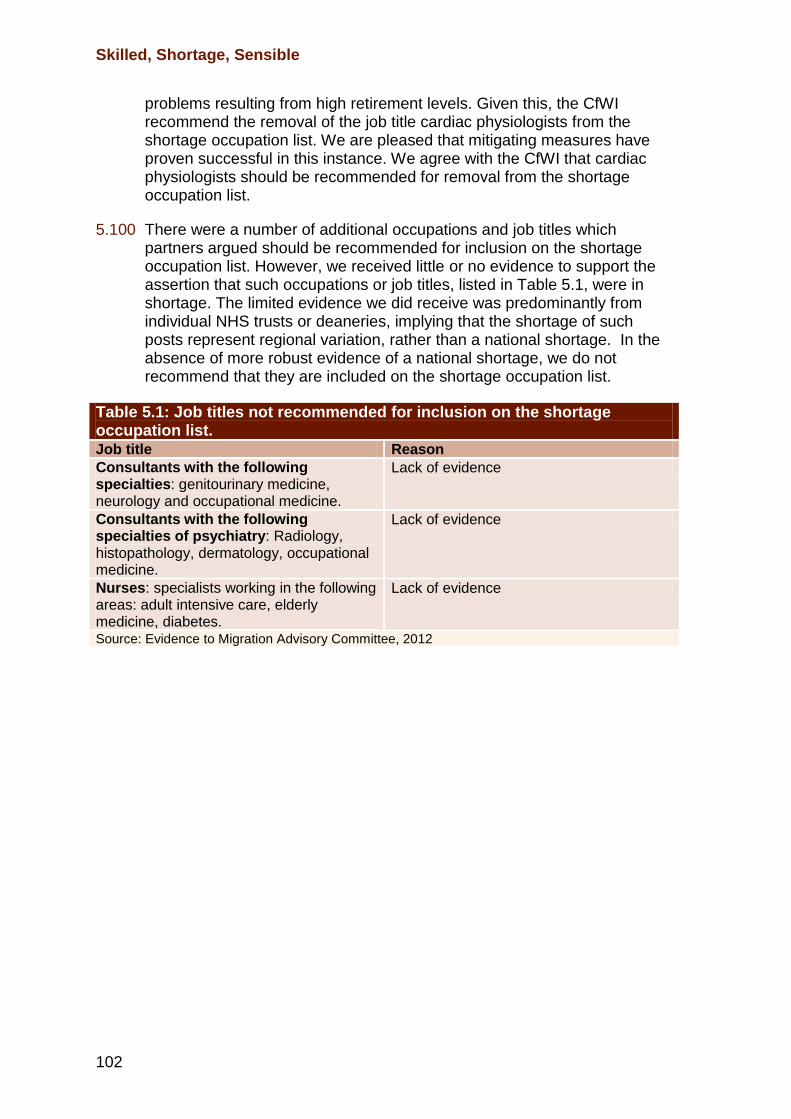
Skilled, Shortage, Sensible
102
problems resulting from high retirement levels. Given this, the CfWI recommend the removal of the job title cardiac physiologists from the shortage occupation list. We are pleased that mitigating measures have proven successful in this instance. We agree with the CfWI that cardiac physiologists should be recommended for removal from the shortage occupation list.
5.100 There were a number of additional occupations and job titles which partners argued should be recommended for inclusion on the shortage occupation list. However, we received little or no evidence to support the assertion that such occupations or job titles, listed in Table 5.1, were in shortage. The limited evidence we did receive was predominantly from individual NHS trusts or deaneries, implying that the shortage of such posts represent regional variation, rather than a national shortage. In the absence of more robust evidence of a national shortage, we do not recommend that they are included on the shortage occupation list.
Table 5.1: Job titles not recommended for inclusion on the shortage occupation list. Job title Reason
Consultants with the following specialties: genitourinary medicine, neurology and occupational medicine.
Lack of evidence
Consultants with the following specialties of psychiatry: Radiology, histopathology, dermatology, occupational medicine.
Lack of evidence
Nurses: specialists working in the following areas: adult intensive care, elderly medicine, diabetes.
Lack of evidence
Source: Evidence to Migration Advisory Committee, 2012
103
6.1 Introduction
6.1 Engineering occupations are very diverse. There are large numbers of specialisms and engineers are employed in a variety of jobs across a range of sectors. For the sake of convenience, we have considered all the engineering occupations in this one chapter.
6.2 Our approach
6.2 Our analytical approach to engineering occupations is consistent with that taken in other chapters in this report. Here, however, the material is ordered mostly by sector rather than by occupation. This is because many of the occupations under review cut across multiple sectors. In order to make the chapter easier to read, the top-down occupational evidence summary tables are provided at the end while the actual top-down evidence is discussed at appropriate points in the main text.
6.3 Key issues in the engineering sector
6.3 Our top-down analysis indicated that there were three engineering occupations experiencing shortages of skilled labour. The shortage indicators that were passed by each of these occupations varied and details are given in the relevant tables at the end of this chapter. However, as in previous reviews of the shortage occupation list, much of the evidence we received suggested that shortages were not across the entirety of occupations but were limited to particular areas and to specific job titles. For example, we saw that in sectors such as aerospace there is an ongoing need for high calibre manufacturing engineers with strong skills in, amongst other things, mechanical design and engineering but not an overall shortage of mechanical engineers.
6.4 The engineering sector has made a case for inclusion of a number of job titles on the shortage occupation list since we started reviewing the list in 2008. In this review partners repeated their concerns about the lack of relevant degree courses in specialist engineering subjects, which they cited as a reason for continuing shortages. This is compounded by an ageing workforce in engineering. In addition, the Department for Business, Innovation and Skills told us that the UK is currently facing a significant demand for engineering skills and that “it would benefit the economy to substantially increase the supply and quality of engineers entering the
Chapter 6 Engineering occupations

Skilled, Shortage, Sensible
104
labour market, ensuring they have the right mix of skills as sought by employers”. We discuss this issue elsewhere in this report (Chapter 4) where we acknowledge that the ongoing, increasing demand for specialist engineering skills continues to outstrip potential supply at least in the short to medium term. We believe that this is also exacerbated by the fact that there is insufficient joined-up activity in this sector on the part of employers and relevant public bodies aimed at addressing the skills deficit. We would therefore expect to see at future reviews more evidence of efforts and initiatives by the Department for Business, Innovation & Skills, the UK Commission for Employment and Skills, Sector Skills Councils and individual employers to minimise this long-term shortage, which would eventually lessen the sector‟s reliance on the shortage occupation list.
6.4 Chemical and process engineering
6.5 Under the Standard Occupational Classification (SOC) 2000, SOC 2125 chemical engineer has been on the shortage occupation list since 2008 and was the only entire occupation on the list. However, following the 2010 revision of the SOC, the former occupation of chemical engineer has now been reclassified under SOC 2127 production and process engineers.
6.6 Production and process engineers pass 5 out of 10 valid shortage indicators, suggesting that the occupation may be experiencing shortage. There was a substantial increase in the number of employees in the occupation over the year, while hours worked also increased. While this indicates rising demand for skilled workers in this occupation, it is necessary to assess the magnitude of excess demand for workers using partner evidence as Annual Survey of Hours and Earnings (ASHE) pay data are unavailable.
6.7 We received evidence from the Institution of Chemical Engineers (IChemE), EEF, the manufacturer‟s organisation, Oil & Gas UK, Total E&P UK Ltd, and BP PLC. It was explained to us that chemical engineers, who are also known as process engineers, are vital to many UK sectors including the energy, construction, manufacturing, and oil and gas sectors. IChemE explained that the energy and chemical industries operate within a global market. They said that any indication that the UK is becoming a less favourable place to hire, employ and retain those with the requisite skills could result in the UK experiencing a significant loss of current and future investment in these sectors.
“Inclusion of chemical engineers on the shortage occupation list has given an important signal to employers and to individuals that the UK is an attractive and successful place for investment … and a favoured place to locate centres of engineering and design excellence.”
Institution of Chemical Engineers response to MAC call for evidence
Chapter 6: Engineering occupations
105
6.8 We received evidence from the oil and gas industry that a chemical engineer‟s role may cover the design and optimal operation of oil and gas production facilities, oil refineries, and petrochemical plants. We were told that chemical process engineering applies to most oil and gas operations, and that all jobs within the industry are in shortage, because candidates with the relevant experience and background are in short supply.
“The oil and gas industry has a high number of vacancies for occupations on the SOL, which have remained unfilled for a significant period of time. Salaries and working hours are increasing and more is being spent on training and recruitment. There is higher demand than supply; these occupations therefore require skills which are in short supply in the local market and should remain on the SOL.”
Total E&P UK Ltd response to MAC call for evidence
6.9 In terms of our sensible criteria, we were informed that the sector is trying to increase the number of young people who study science and engineering in school. IChemE said they have supported events including the Big Bang Science and Engineering Fair, described as the UK‟s biggest single celebration of science and engineering for young people. In addition, IChemE explained that they run a campaign called “whynotchemeng” which has increased applications to chemical engineering courses at UK universities by 167 per cent. We were told that UK university chemical engineering courses were now fully subscribed but employers continued to report difficulties in hiring workers with five years‟ or more experience.
“… but companies continue to report very serious difficulties in recruiting and retaining fully qualified professionals, typically those with 5+ years‟ experience. It is exactly these people we must continue to be able to engage from outside the EU.”
Institute of Chemical Engineers response to MAC call for evidence
6.10 Some partners told us that the recruitment of non-EEA migrants creates employment conditions that allow additional recruitment of resident workers. The recruitment of non-EEA skilled workers helped deliver a number of high capital investment projects which resulted in a greater need for resident workers to fill complementary posts.
Skilled, Shortage, Sensible
106
“The industry supports more than 400,000 jobs throughout the supply chain in the UK supporting the exploration and production sector. The availability of skilled migrant workers is key to ensuring this wider UK employment is sustained.”
Oil & Gas response to MAC call for evidence
“Seven in ten companies are then being more proactive in addressing their skills needs, increasing their training spend, recruiting apprentices and engaging more with schools, colleges and universities. But this is not always enough - manufacturers need access to a wider talent pool that includes non-EEA labour.”
EEF, the manufacturers‟ organisation response to the MAC call for evidence
6.11 Taking account of the evidence we received we recommend that the job title chemical engineer be retained on the shortage occupation list. We note the full take-up of places on chemical engineering university courses and look forward to a time in the near future when this job title no longer features on the shortage occupation list. We note that some partners told us that even the numbers of chemical engineering graduates will be insufficient for employers‟ needs. In which case we will look to see what efforts are being made to increase capacity in the education sector to produce more such graduates.
6.5 Engineering in the construction sector
6.12 CITB-Construction Skills told us that the UK construction industry will not need to recruit workers from outside the European Economic Area (EEA) for at least 5 years.
“Having considered the evidence available CITB-Construction Skills concludes that there is unlikely to be any necessity for the UK construction industry to recruit workers, skilled to NQF 4 or above, from outside the European Economic Area for at least 5 years.”
CITB-Construction Skills response to MAC call for evidence
6.13 A recent report published by the UKCES noted a strong supply of construction graduates exiting the higher education sector in a range of disciplines, including architecture and surveying (UKCES, 2012).
6.14 While partner evidence suggests that there is no broad labour shortage in the construction industry, we consider below evidence relating to specific shortages in the ground engineering industry.
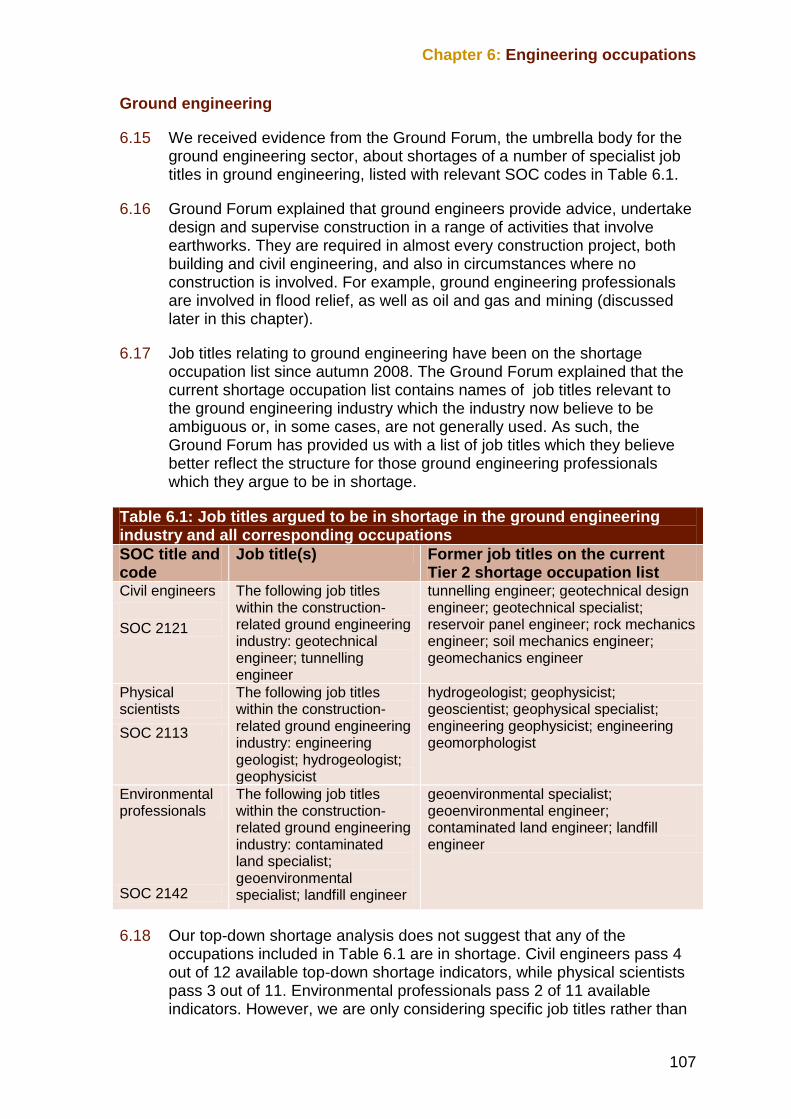
Chapter 6: Engineering occupations
107
Ground engineering
6.15 We received evidence from the Ground Forum, the umbrella body for the ground engineering sector, about shortages of a number of specialist job titles in ground engineering, listed with relevant SOC codes in Table 6.1.
6.16 Ground Forum explained that ground engineers provide advice, undertake design and supervise construction in a range of activities that involve earthworks. They are required in almost every construction project, both building and civil engineering, and also in circumstances where no construction is involved. For example, ground engineering professionals are involved in flood relief, as well as oil and gas and mining (discussed later in this chapter).
6.17 Job titles relating to ground engineering have been on the shortage occupation list since autumn 2008. The Ground Forum explained that the current shortage occupation list contains names of job titles relevant to the ground engineering industry which the industry now believe to be ambiguous or, in some cases, are not generally used. As such, the Ground Forum has provided us with a list of job titles which they believe better reflect the structure for those ground engineering professionals which they argue to be in shortage.
Table 6.1: Job titles argued to be in shortage in the ground engineering industry and all corresponding occupations
SOC title and code
Job title(s) Former job titles on the current Tier 2 shortage occupation list
Civil engineers The following job titles within the construction-related ground engineering industry: geotechnical engineer; tunnelling engineer
tunnelling engineer; geotechnical design engineer; geotechnical specialist; reservoir panel engineer; rock mechanics engineer; soil mechanics engineer; geomechanics engineer
SOC 2121
Physical scientists
The following job titles within the construction-related ground engineering industry: engineering geologist; hydrogeologist; geophysicist
hydrogeologist; geophysicist; geoscientist; geophysical specialist; engineering geophysicist; engineering geomorphologist
SOC 2113
Environmental professionals
The following job titles within the construction-related ground engineering industry: contaminated land specialist; geoenvironmental specialist; landfill engineer
geoenvironmental specialist; geoenvironmental engineer; contaminated land engineer; landfill engineer
SOC 2142
6.18 Our top-down shortage analysis does not suggest that any of the occupations included in Table 6.1 are in shortage. Civil engineers pass 4 out of 12 available top-down shortage indicators, while physical scientists pass 3 out of 11. Environmental professionals pass 2 of 11 available indicators. However, we are only considering specific job titles rather than
Skilled, Shortage, Sensible
108
whole occupations and, therefore, have placed more weight on bottom-up evidence.
6.19 Ground Forum said that the shortage of ground engineering professionals is confined to experienced and/or senior staff in construction or contaminated land works. We were told that, typically, there is a shortage of people with six to fifteen years‟ experience. The Geological Society of London and the Royal Astronomical Society, which amongst other things encourage and promote the study of geophysics and other closely related branches of science, provided joint evidence to us to support the claim that the shortage of engineers in this area is more prevalent for individuals with a significant number of years‟ experience.
6.20 We were told that in 2011 it was estimated that vacancy rates for ground engineers were running at four per cent. This figure fell to 2.3 per cent in 2012. This is much less than in 2008 when we were told the vacancy rate was 13 to 15 per cent.
“The recession has brought a temporary respite to the extreme shortage but only because the workload has become more erratic. As soon as workloads increase – and the Government is now actively promoting the role of infrastructure and construction as a route to economic growth – the position will become acute again – and in some disciplines (hydrogeology and tunnelling, are particular examples), it has never stopped being acute.”
The Ground Forum response to MAC call for evidence
6.21 Turning to sensible, we received evidence that fewer students are taking up relevant MSc courses. Ground Forum said that if all the available courses were full there would be 250 to 300 qualified ground engineers available each year but that in the last 12 months two courses had closed and others are under threat because of insufficient student numbers.
““There is widespread concern in industry that the future supply of MSc graduates is threatened by the withdrawal of government funding for MSc studentships, the increase in undergraduate student fees (meaning that those who might enter MSc programmes would do so with much greater levels of existing debt than previously), and the fact that Masters students do not have access to the student loan system or any other affordable source of credit…Furthermore, many MSc programmes (and even some departments) face the threat of closure. This is of particular concern in the geoscience sector, where taught applied Masters courses are particularly valued.”
The Geological Society of London and the Royal Astronomical Society response to the MAC call for evidence
6.22 The evidence we received from the Ground Forum, the Geological Society of London and the Royal Astronomical Society is sufficient enough for us
Chapter 6: Engineering occupations
109
to recommend that the following job titles within the construction-related ground engineering industry be retained on the shortage occupation list: geotechnical engineer; tunnelling engineer; engineering geologist; hydrogeologist; geophysicist; contaminated land specialist; geoenvironmental specialist; landfill engineer.
6.23 As discussed in paragraph 6.17, this list of job tiles has been rationalised to better reflect the ground engineering industry structure. We are not removing any job titles, but we are clarifying the list of relevant job titles concerned.
6.6 Engineering in the energy sector
6.24 The energy sector is comprised of all the industries involved in the production and sale of energy including: oil and gas production; electricity generation; transmission and distribution; nuclear; and renewables. A recent report published by the UKCES indicated that while overall the skills supply to the sector was not a concern, skills shortages had occurred in specific areas. It highlighted that this was partly due to graduates in STEM subjects seeking work outside STEM sectors.
“In some respects the skills supply to the sector is relatively healthy, with an overall growth in students studying relevant subjects at university level, growing number of apprentices in the energy and utilities sector, and above average levels of workplace training. However, there are some signs that parts of the sector and particular groups of staff experience skill deficiencies... Many STEM graduates find jobs outside STEM sectors, and energy and utility sectors may not be seen as particularly attractive graduate destinations.”
UKCES Sector Skills Insights: Energy
Job titles within the oil and gas industry
6.25 Job titles in the oil and gas industry have been on the shortage occupation list since 2009. They currently sit within SOC 2121 civil engineers, SOC 2113 physical scientists and SOC 2127 production and process engineers, which include job titles previously classified under SOC 2000 as SOC 2125 chemical engineers (discussed above).
6.26 For this review the oil and gas industry provided evidence to support retaining the job titles listed in Table 6.2 on the shortage occupation list. They also asked that we recommend all mechanical engineers under SOC 2122, which is skilled to NQF6+, employed in the oil and gas industry be added to the list.
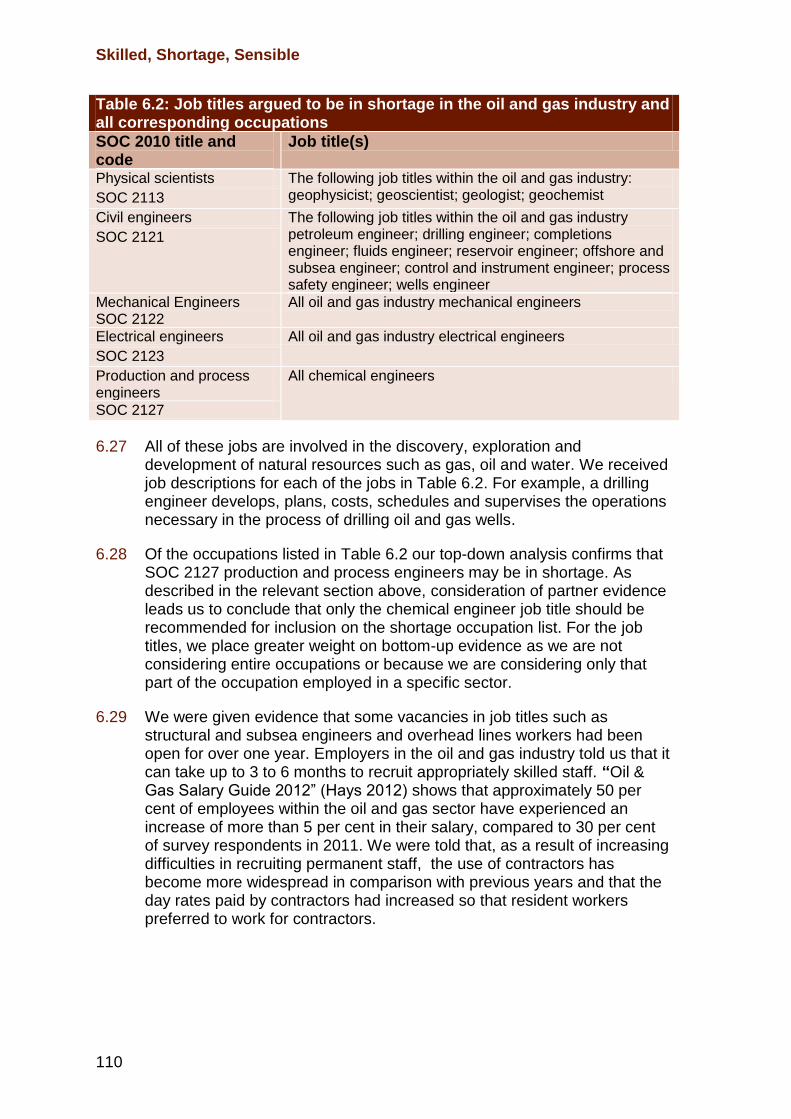
Skilled, Shortage, Sensible
110
Table 6.2: Job titles argued to be in shortage in the oil and gas industry and all corresponding occupations
SOC 2010 title and code
Job title(s)
Physical scientists The following job titles within the oil and gas industry: geophysicist; geoscientist; geologist; geochemist SOC 2113
Civil engineers The following job titles within the oil and gas industry petroleum engineer; drilling engineer; completions engineer; fluids engineer; reservoir engineer; offshore and subsea engineer; control and instrument engineer; process safety engineer; wells engineer
SOC 2121
Mechanical Engineers SOC 2122
All oil and gas industry mechanical engineers
Electrical engineers All oil and gas industry electrical engineers
SOC 2123
Production and process engineers
All chemical engineers
SOC 2127
6.27 All of these jobs are involved in the discovery, exploration and development of natural resources such as gas, oil and water. We received job descriptions for each of the jobs in Table 6.2. For example, a drilling engineer develops, plans, costs, schedules and supervises the operations necessary in the process of drilling oil and gas wells.
6.28 Of the occupations listed in Table 6.2 our top-down analysis confirms that SOC 2127 production and process engineers may be in shortage. As described in the relevant section above, consideration of partner evidence leads us to conclude that only the chemical engineer job title should be recommended for inclusion on the shortage occupation list. For the job titles, we place greater weight on bottom-up evidence as we are not considering entire occupations or because we are considering only that part of the occupation employed in a specific sector.
6.29 We were given evidence that some vacancies in job titles such as structural and subsea engineers and overhead lines workers had been open for over one year. Employers in the oil and gas industry told us that it can take up to 3 to 6 months to recruit appropriately skilled staff. “Oil & Gas Salary Guide 2012” (Hays 2012) shows that approximately 50 per cent of employees within the oil and gas sector have experienced an increase of more than 5 per cent in their salary, compared to 30 per cent of survey respondents in 2011. We were told that, as a result of increasing difficulties in recruiting permanent staff, the use of contractors has become more widespread in comparison with previous years and that the day rates paid by contractors had increased so that resident workers preferred to work for contractors.
Chapter 6: Engineering occupations
111
“We frequently compete with day rates of between £800 and £1400 [which] make contracting more attractive to settled workers with the result that it is becoming increasingly difficult for employers to attract and retain permanent members of staff. The earnings growth over the past year and expected growth over the next year can in part be attributed to the shortages in conjunction with a booming industry as a result of a strong oil price.”
BP PLC. response to MAC call for evidence
6.30 BP told us that an ageing workforce, a large proportion of which will reach retirement age over the next decade, will result in an increased shortage of skilled petroleum engineers. More generally, partners told us that a shortage of experienced mid-term employees cannot be met in the short term by training resident workers.
6.31 We received further evidence on shortage from CGG Veritas who told us that in order to alleviate the shortage of geoscientists they had to turn to graduates in other disciplines including mathematics, physics and engineering, where the acquired academic knowledge could be translated into a geoscientist‟s technical skills.
6.32 In terms of sensible, we received evidence of the efforts by the oil and gas industry to support and develop the UK resident labour market and to up-skill domestic workers. BP told us about their involvement in investment programmes that target young people from age 4 up to graduate level. They run a Schools Link Programme encouraging BP employees to work closely with schools to provide young children with an insight into the energy sector, and they offer a range of internships for those in further education. Other oil and gas companies have their own apprenticeship schemes.
6.33 It was explained to us that the industry-owned and funded skill body, OPITO, is involved in working with the education sector to provide STEM input to the school curriculum and links to universities. Oil & Gas UK explained that the industry has an apprenticeship scheme, run on its behalf by OPITO and the Engineering Construction Industry Training Board, which in 2012 took on 140 trainees.
6.34 We were told that it would not be possible for the oil and gas industry to become even more capital intensive as an alternative to employing migrant labour. It was also put to us that investment in technology in the sector tends to create demand for migrant labour as more highly specialised jobs are created as a result of technological innovation.
6.35 It was argued that if companies were unable to access migrant labour to fill some of its shortages, then costs will rise and productivity levels will be adversely affected with a concomitant impact on the future of the industry.
Skilled, Shortage, Sensible
112
“The UK is already one of the most expensive oil and gas provinces in the world; any further pressures on the supply of skilled personnel risk reducing the attractiveness of the province to larger multinationals and ultimately affecting the long term sustainability of the industry.”
Oil and Gas UK response to MAC call for evidence
6.36 Oil & Gas UK suggested that bringing in a migrant worker from outside the EEA is not a cheap option as, on average, it costs three times more to do so than to hire a resident worker. The oil and gas industry supports more than 400,000 jobs in the UK, and Oil & Gas UK told us that the availability of skilled workers is key to ensuring this wider UK employment is sustained.
6.37 On balance, we believe that the evidence we received continues to demonstrate that there is a labour shortage in certain job titles in the oil and gas industry. We therefore recommend that the following job titles be retained on the shortage occupation list: geophysicist; geoscientist; geologist; geochemist; petroleum engineer; drilling engineer; completions engineer; fluids engineer; reservoir engineer; offshore and subsea engineer; control and instrument engineer; process safety engineer; wells engineer; all electrical engineers in the oil and gas industry; and all chemical engineers.
6.38 In addition, we are satisfied that the evidence we received is sufficient for us to justify recommending that all mechanical engineers in the oil and gas industry be added to the shortage occupation list.
Job titles within the electricity transmission and distribution industry
6.39 We received evidence from Mott MacDonald, Siemens Transmission and Distribution Limited, National Grid, Balfour Beatty Utility Solutions, and joint evidence from Energy & Utility Skills and the National Skills Academy for Power.
6.40 Of the occupations listed in Table 6.3 below, our top-down analysis suggests that SOC 1123 production managers and directors in mining and energy and SOC 2126 design and development engineers may be in shortage. However, given that the table refers to specific job titles within each occupation, we place greater weight on bottom-up partner evidence.
6.41 The job titles commissioning engineer and substation electrical engineer fall within SOC 3113 (Engineering technician) and the job title overhead linesworker falls within SOC 5249 (Electrical and electronics trades n.e.c.) neither of which are skilled to NQF6+. However, these job titles are presently on the shortage occupation list and so, as per our remit, we have reviewed whether or not they are in shortage and it is still sensible to fill these shortages from outside the EEA.
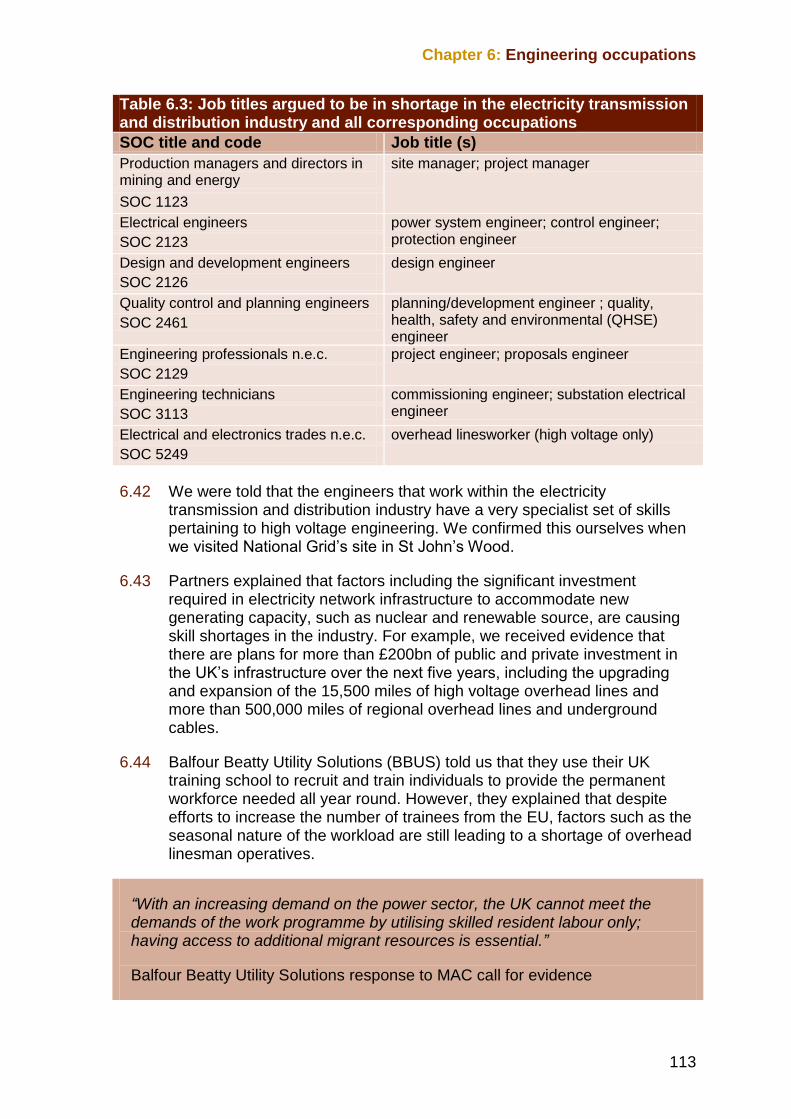
Chapter 6: Engineering occupations
113
Table 6.3: Job titles argued to be in shortage in the electricity transmission and distribution industry and all corresponding occupations
SOC title and code Job title (s)
Production managers and directors in mining and energy
site manager; project manager
SOC 1123
Electrical engineers power system engineer; control engineer; protection engineer SOC 2123
Design and development engineers design engineer
SOC 2126
Quality control and planning engineers planning/development engineer ; quality, health, safety and environmental (QHSE) engineer
SOC 2461
Engineering professionals n.e.c. project engineer; proposals engineer
SOC 2129
Engineering technicians commissioning engineer; substation electrical engineer SOC 3113
Electrical and electronics trades n.e.c. overhead linesworker (high voltage only)
SOC 5249
6.42 We were told that the engineers that work within the electricity transmission and distribution industry have a very specialist set of skills pertaining to high voltage engineering. We confirmed this ourselves when we visited National Grid‟s site in St John‟s Wood.
6.43 Partners explained that factors including the significant investment required in electricity network infrastructure to accommodate new generating capacity, such as nuclear and renewable source, are causing skill shortages in the industry. For example, we received evidence that there are plans for more than £200bn of public and private investment in the UK‟s infrastructure over the next five years, including the upgrading and expansion of the 15,500 miles of high voltage overhead lines and more than 500,000 miles of regional overhead lines and underground cables.
6.44 Balfour Beatty Utility Solutions (BBUS) told us that they use their UK training school to recruit and train individuals to provide the permanent workforce needed all year round. However, they explained that despite efforts to increase the number of trainees from the EU, factors such as the seasonal nature of the workload are still leading to a shortage of overhead linesman operatives.
“With an increasing demand on the power sector, the UK cannot meet the demands of the work programme by utilising skilled resident labour only; having access to additional migrant resources is essential.”
Balfour Beatty Utility Solutions response to MAC call for evidence

Skilled, Shortage, Sensible
114
6.45 National Grid told us that they have carried out workforce planning through to 2021 and have identified a resource gap of approximately 1,425 in electricity and transmission, 60 per cent of which are for critical jobs. They explained that this gap is partly due to an ageing workforce and also due to the need to support increased investment in the electricity network.
6.46 National Grid stated that repeated recruitment campaigns have consistently demonstrated that there are insufficient numbers from within the UK labour market and the EEA to fill critical jobs.
“In addition to the increasing competition for these limited skills in the UK, the global demand for key power engineering skills is also rising. Around the world, many other countries are also looking to upgrade and replace ageing infrastructure in addition to increasing use of new technologies and connections to renewable sources of energy while many developing nations are also looking to expand electrification programmes.”
National Grid response to MAC call for evidence
6.47 We also saw evidence that the time it takes to hire skilled labour has increased over time. National Grid said it can take between 5 to 7 months to recruit new skilled workers. EU Skills and the Skills Academy told us that the evidence for skills shortages can be seen in a persistent, sizable wage premium for people holding engineering degrees, which has grown over the last 20 years.
6.48 Turning to sensible, EU Skills and the Skills Academy told us that employers in the electricity and transmission industry have provided evidence of annual pay increases that are significantly higher than average. However, they said that with an overall shortage of supply of skilled engineers entering the labour market, higher premiums are unlikely to achieve anything more than a cycle of higher staff turnover leading to even higher wages. However, we note that some employers have engaged in collective pay bargaining to prevent such a wage spiral. BBUS told us about ways in which in the long-term they could reduce their reliance on migration. These include the use of innovative technologies. However, they explained that in the short-term it is essential that they are able to recruit skilled and experienced workers from outside of the EEA.
6.49 National Grid explained that they have refocused their resourcing strategies to optimise the potential candidates from the pools available. Greater emphasis has been placed on the use of development programmes as a pipeline for a number of key skilled jobs in the business which, according to National Grid, has resulted in increasing intakes at all levels over the last three years. National Grid also told us that over the last three years they have increased the amount they spend on training in relation to these schemes. Training spend for National Grid‟s Engineering Training Programme increased by 21 per cent to £934,000 in 2011/12 from £772,000 in 2009/10 whilst an additional £500,000 was also spent on

Chapter 6: Engineering occupations
115
further training initiatives across both the Engineering Training and Apprentice Programmes during the same period. This is evidence of a real effort to upskill British human capital.
6.50 When we visited National Grid they told us that they had to fill jobs with appointees with below the required level of skill and competence which resulted in an increase in the lead times for appointees to reach full competence in their role. They also explained that they are looking at ways in which they can retain the capabilities of their skilled and experienced workforce to support the training of new recruits and also to transfer their skills to the wider population in the business. Mott MacDonald also told us that they have structured their trainee programmes for their less experienced staff which aims to develop their skill set to consultant level.
6.51 We received evidence from EU Skills and the Skills Academy that activities such as planning and design are being farmed out to other countries which, they said, in the short-term is counterproductive in terms of developing the UK-resident workforce and in the longer-term could jeopardise the UK‟s reputation as being at the cutting edge of high-tech, high-value-adding, research and development.
6.52 Mott MacDonald told us that they partner universities to attract school leavers into relevant courses by offering sponsorships and industrial traineeships.
6.53 We believe we have received sufficient evidence of a continuing shortage of labour for certain job titles within the electricity transmission and distribution industry to recommend that the following job titles be retained on the shortage occupation list: project manager; site manager; power systems engineer; control engineer and protection engineer; design engineer; planning/development engineer; quality, health, safety and environment (QHSE) engineer; project engineer; proposals engineer; commissioning engineer; and overhead linesworker (high voltage only).
6.54 With regard to the job title overhead lines worker (high voltage), we did not receive evidence from partners in relation to which pay threshold should be applied in the relevant codes of practice. However, we understand that the UK Border Agency is currently in the process of reviewing the codes of practice for occupation and job titles skilled to NQF level 3 and 4 in order to incorporate the revised Standard Occupational Classification 2010 and uplift salary thresholds in line with inflation. As such, we expect these revised pay thresholds will apply to overhead linesworker (high voltage only) if our recommendation to retain this job title on the shortage occupation list is accepted by the Government.
Job titles within the nuclear industry
6.55 We received evidence from Rolls Royce, EDF Energy, Westinghouse Electric UK, Kingsley Napley LLP, Areva UK Ltd, Energy Solutions (ES) and Cogent, the Sector Skills Council (SSC) for the nuclear, chemical,

Skilled, Shortage, Sensible
116
pharmaceutical, petroleum, polymers and life science industries. The evidence we received concerns three areas of suggested shortages, which we discuss below.
The nuclear new build programme
6.56 We first considered job titles put to us by the nuclear industry in Migration Advisory Committee (2011a). At that time we received evidence that there would be a need to fill up to 30,000 new jobs created by the industry‟s new build programme and that the required skills were not available in the UK. However, although we recognised the possibility that the industry could face shortages once the new build programme had started, because we did not receive evidence of any immediate shortages we did not recommend the inclusion of any of the job titles put to us.
6.57 For this review, Westinghouse Electric UK told us that nuclear new build will be competing with the nuclear decommissioning and waste management programmes for resources and therefore job titles that are considered to be in short supply in the nuclear decommissioning and waste management industry (discussed below) will also be in shortage for new build. In addition, Westinghouse argued that job titles on the current shortage occupation list considered to be in short supply within the electricity transmission and distribution industry will be required for jobs needed for the nuclear new build programme. It would therefore be more useful to the UK nuclear industry if those job titles currently on the shortage occupation list for the electricity transmission and distribution industry were extended to also include those in the nuclear industry. .
6.58 However, Westinghouse also told us that their assessment of a shortage in respect of the new build programme is not based on any recruitment exercise. They said there has been a delay in instigating the programme which has resulted in no immediate need to recruit. Cogent told us that that there is continued uncertainty regarding nuclear new build and that this uncertainty will be on-going for several years.
6.59 We received evidence from EDF Energy about its activities in respect of new nuclear generation. For example, EDF Energy told us that it plans, with their partner Centrica, to build up to four nuclear plants, with two at Hinkley Point C and two at Sizewell. We also saw that EDF Energy has invested £850 million in a new 1.3GW combined-cycle gas turbine plant in Nottinghamshire. We noted that EDF Energy‟s final investment decisions for new nuclear generation are reliant on receiving the necessary consents and also on a robust investment framework being in place.
6.60 With regard to sensible, EDF Energy told us that they have expanded their £3.5 million nuclear academy in Gloucestershire, which trains 2,500 people annually. They also explained that are working closely with local communities, to build opportunities for the future. They said they are working with schools to encourage the take-up of STEM subjects and raise awareness of the wide variety of careers in the energy sector.
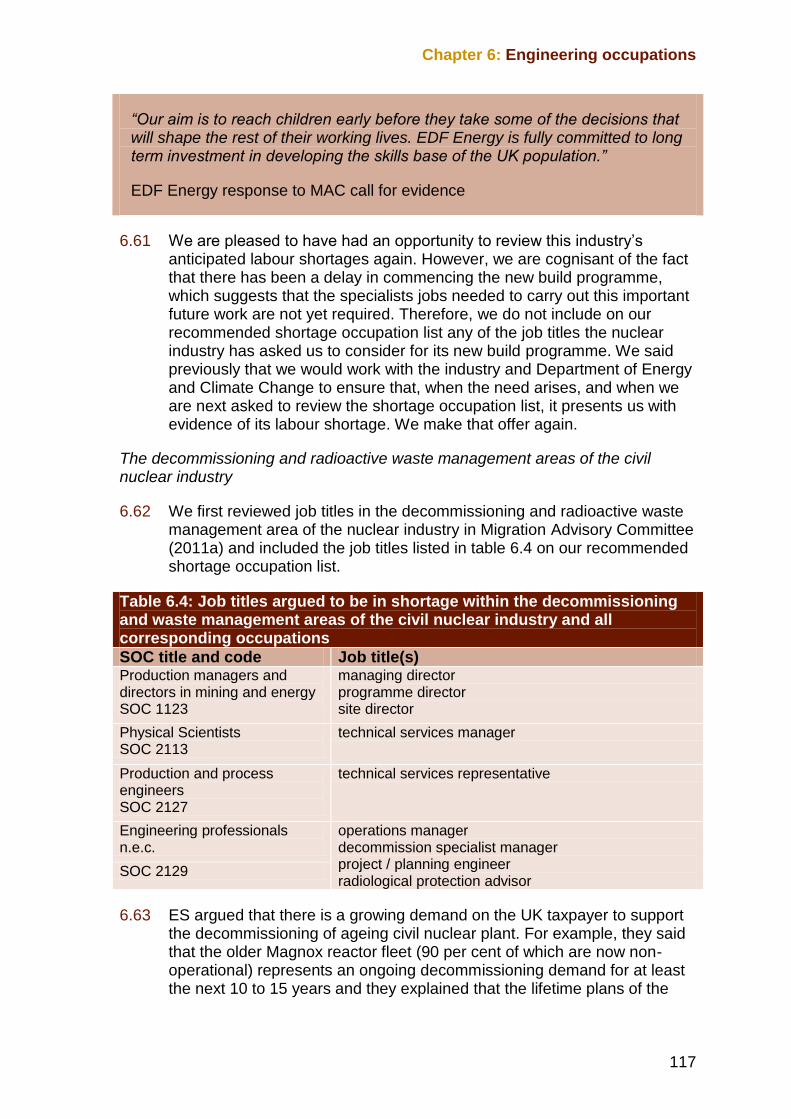
Chapter 6: Engineering occupations
117
“Our aim is to reach children early before they take some of the decisions that will shape the rest of their working lives. EDF Energy is fully committed to long term investment in developing the skills base of the UK population.”
EDF Energy response to MAC call for evidence
6.61 We are pleased to have had an opportunity to review this industry‟s anticipated labour shortages again. However, we are cognisant of the fact that there has been a delay in commencing the new build programme, which suggests that the specialists jobs needed to carry out this important future work are not yet required. Therefore, we do not include on our recommended shortage occupation list any of the job titles the nuclear industry has asked us to consider for its new build programme. We said previously that we would work with the industry and Department of Energy and Climate Change to ensure that, when the need arises, and when we are next asked to review the shortage occupation list, it presents us with evidence of its labour shortage. We make that offer again.
The decommissioning and radioactive waste management areas of the civil nuclear industry
6.62 We first reviewed job titles in the decommissioning and radioactive waste management area of the nuclear industry in Migration Advisory Committee (2011a) and included the job titles listed in table 6.4 on our recommended shortage occupation list.
Table 6.4: Job titles argued to be in shortage within the decommissioning and waste management areas of the civil nuclear industry and all corresponding occupations
SOC title and code Job title(s) Production managers and directors in mining and energy SOC 1123
managing director programme director site director
Physical Scientists SOC 2113
technical services manager
Production and process engineers SOC 2127
technical services representative
Engineering professionals n.e.c.
operations manager decommission specialist manager project / planning engineer radiological protection advisor
SOC 2129
6.63 ES argued that there is a growing demand on the UK taxpayer to support the decommissioning of ageing civil nuclear plant. For example, they said that the older Magnox reactor fleet (90 per cent of which are now non-operational) represents an ongoing decommissioning demand for at least the next 10 to 15 years and they explained that the lifetime plans of the

Skilled, Shortage, Sensible
118
Advanced Gas-cooled Reactor fleet will soon see the later generation of reactors move into decommissioning status.
6.64 ES said that to meet the Government‟s decommissioning obligations, the UK requires a significant upturn in the availability of suitably qualified and experienced nuclear workers. We were told that the labour shortages within this industry were being exacerbated by its ageing workforce.
“At the same time as this demand is escalating, the current civil nuclear workforce (approx 44,000) is ageing at a faster rate than the UK workforce as a whole, with an age profile which is sharply attenuated in comparison to the flatter profile for UK workers in general. There are severe retirement projections (particularly for senior and experienced employees) which are exacerbated by historical and contractual factors that see the civil nuclear industry having a much higher incidence of early retirement.”
Energy Solutions EU Ltd response to MAC call for evidence
6.65 We were told that the pressure the UK faces is not unique. ES said Europe accounts for nearly 69 per cent of the total global number of expected nuclear power reactor closures by 2030. ES argued that their experience during 2012 strongly suggests that Europe will be looking to the UK to provide decommissioning experience, particularly if nuclear closure plans become unexpectedly accelerated as in Germany.
6.66 ES explained that a key feature of meeting UK decommissioning demands is the ability to access experienced migrant workers from outside of the EEA, particularly from the United States (US) where the technical and scientific knowledge and experience are based.
6.67 Turning to sensible, we were told that an important benefit of accessing qualified and experienced migrant workers is the ability to transfer knowledge. For example, it was put to us that this allows the decommissioning process to continue whilst simultaneously facilitating the transfer of skills to the UK workforce. However, ES said the complexity of a nuclear decommissioning programme should not be underestimated, especially since the uniqueness of each major decommissioning project throws up new and unseen physical and technical challenges.
6.68 ES stated that skills transfer is a slow process, and whilst agencies in the UK such as the National Skills Academy Nuclear are developing the qualifications to produced skilled and qualified nuclear workers, these are still in their infancy and are generic nuclear rather than specific to decommissioning and radioactive waste management.
6.69 In conclusion, we accept there is an ongoing shortage of certain specialist jobs in the decommissioning and radioactive waste management area of the nuclear industry, and believe that it is sensible for these to continue to be recruited from outside the EEA. We therefore recommend that the
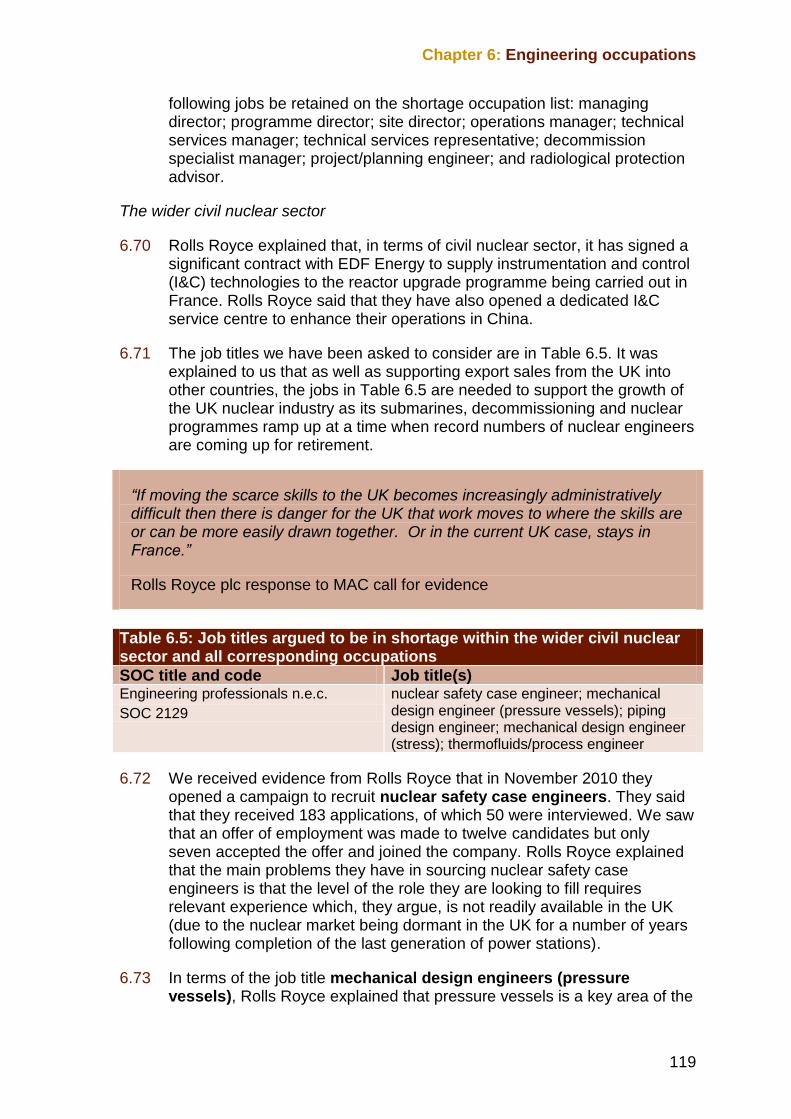
Chapter 6: Engineering occupations
119
following jobs be retained on the shortage occupation list: managing director; programme director; site director; operations manager; technical services manager; technical services representative; decommission specialist manager; project/planning engineer; and radiological protection advisor.
The wider civil nuclear sector
6.70 Rolls Royce explained that, in terms of civil nuclear sector, it has signed a significant contract with EDF Energy to supply instrumentation and control (I&C) technologies to the reactor upgrade programme being carried out in France. Rolls Royce said that they have also opened a dedicated I&C service centre to enhance their operations in China.
6.71 The job titles we have been asked to consider are in Table 6.5. It was explained to us that as well as supporting export sales from the UK into other countries, the jobs in Table 6.5 are needed to support the growth of the UK nuclear industry as its submarines, decommissioning and nuclear programmes ramp up at a time when record numbers of nuclear engineers are coming up for retirement.
“If moving the scarce skills to the UK becomes increasingly administratively difficult then there is danger for the UK that work moves to where the skills are or can be more easily drawn together. Or in the current UK case, stays in France.”
Rolls Royce plc response to MAC call for evidence
Table 6.5: Job titles argued to be in shortage within the wider civil nuclear sector and all corresponding occupations
SOC title and code Job title(s) Engineering professionals n.e.c. nuclear safety case engineer; mechanical
design engineer (pressure vessels); piping design engineer; mechanical design engineer (stress); thermofluids/process engineer
SOC 2129
6.72 We received evidence from Rolls Royce that in November 2010 they opened a campaign to recruit nuclear safety case engineers. They said that they received 183 applications, of which 50 were interviewed. We saw that an offer of employment was made to twelve candidates but only seven accepted the offer and joined the company. Rolls Royce explained that the main problems they have in sourcing nuclear safety case engineers is that the level of the role they are looking to fill requires relevant experience which, they argue, is not readily available in the UK (due to the nuclear market being dormant in the UK for a number of years following completion of the last generation of power stations).
6.73 In terms of the job title mechanical design engineers (pressure vessels), Rolls Royce explained that pressure vessels is a key area of the
Skilled, Shortage, Sensible
120
nuclear design capability and there is a lack of relevant UK experience. They said they have had two open vacancies since January 2012. Rolls Royce said they have received 146 applications for the jobs but have not made an appointment due to the lack of appropriate skills and experience.
6.74 In respect to the job title piping design engineer, Rolls Royce told us that these engineers are at a very high premium in the nuclear industry as well as within the petrochemical/oil and gas industries. They said they have had two open vacancies since 1 January 2012. Rolls Royce explained that they have received 92 applications for the vacancies but have not made an appointment.
6.75 Rolls Royce told us that the skills in the job title mechanical design engineer (stress) are at an absolute premium and that the candidates can demand high salaries (circa £75,000). Rolls Royce said, since January 2012, they have received 74 applications for one open vacancy. We saw that five applicants were considered for the role but no one has been hired. We also received similar evidence for the job title thermofluids/process engineer.
6.76 With regard to our sensible criteria, Rolls Royce told us that it has had an apprenticeship programme for over 100 years. They explained that in 2012 they recruited over 300 apprentices and that at any one time they have over 1,000 apprentices on their programmes around the world. We received evidence that Rolls Royce works actively with schools and universities to encourage diversity, including gender diversity in their workforce.
6.77 In conclusion, we believe that we have received sufficient evidence to justify recommending that the following job titles within the civil nuclear sector be added to the shortage occupation list: nuclear safety case engineer; mechanical design engineer (pressure vessels); piping design engineer; mechanical design engineer (stress); and thermofluids/process engineer.
6.7 Engineering in the mining sector
6.78 Our top-down analysis does not indicate that either SOC 2121 civil engineers or SOC 2113 physical scientists are in shortage. Nonetheless, it could be the case that specific job titles in the mining sector are in shortage. We use partner evidence to determine whether this is the case.
6.79 We reviewed job titles relating to the mining sector in Migration Advisory Committee (2011a). At the time, we received sufficient evidence from SRK (UK) to recommend that the job titles mining and coal engineer; environmental scientist; mining geotechnical engineer and metallurgical/mineral processing engineer, in the international mineral and extraction consulting industry be placed on the shortage occupation list.
6.80 For this review, we did not receive evidence from SRK (UK), or any other organisation, to support a continued shortage of the job titles listed above.
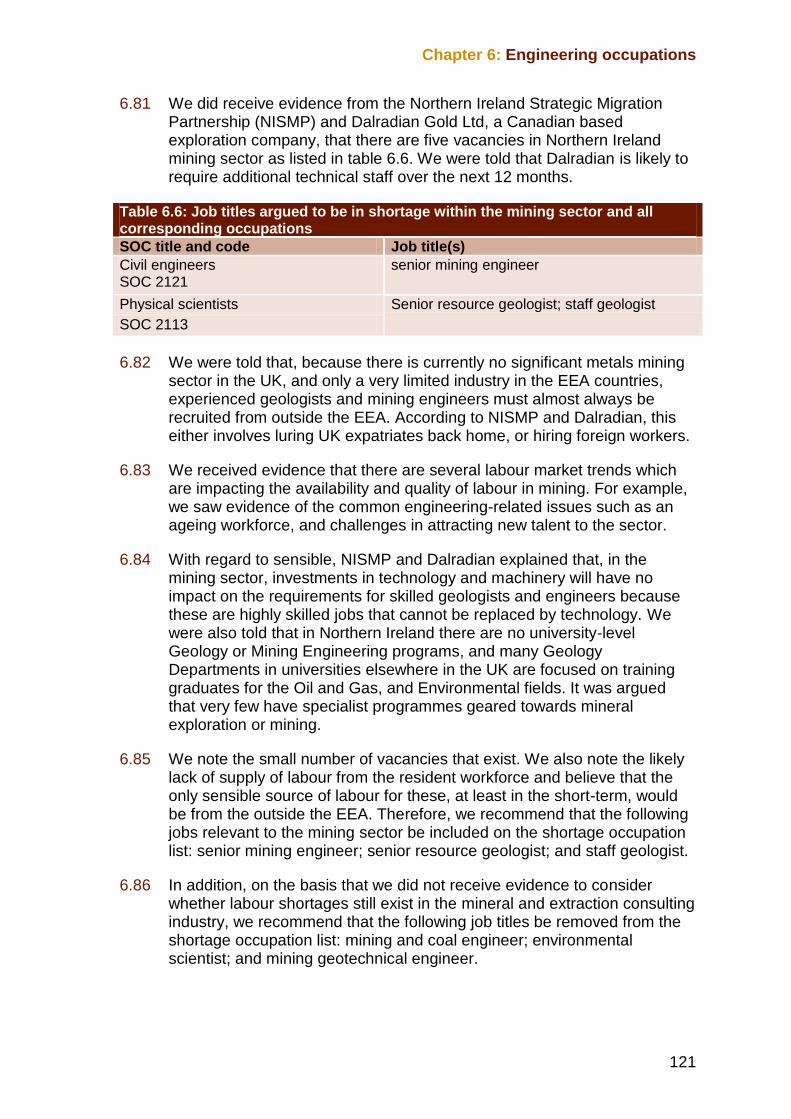
Chapter 6: Engineering occupations
121
6.81 We did receive evidence from the Northern Ireland Strategic Migration Partnership (NISMP) and Dalradian Gold Ltd, a Canadian based exploration company, that there are five vacancies in Northern Ireland mining sector as listed in table 6.6. We were told that Dalradian is likely to require additional technical staff over the next 12 months.
Table 6.6: Job titles argued to be in shortage within the mining sector and all corresponding occupations
SOC title and code Job title(s)
Civil engineers SOC 2121
senior mining engineer
Physical scientists Senior resource geologist; staff geologist
SOC 2113
6.82 We were told that, because there is currently no significant metals mining sector in the UK, and only a very limited industry in the EEA countries, experienced geologists and mining engineers must almost always be recruited from outside the EEA. According to NISMP and Dalradian, this either involves luring UK expatriates back home, or hiring foreign workers.
6.83 We received evidence that there are several labour market trends which are impacting the availability and quality of labour in mining. For example, we saw evidence of the common engineering-related issues such as an ageing workforce, and challenges in attracting new talent to the sector.
6.84 With regard to sensible, NISMP and Dalradian explained that, in the mining sector, investments in technology and machinery will have no impact on the requirements for skilled geologists and engineers because these are highly skilled jobs that cannot be replaced by technology. We were also told that in Northern Ireland there are no university-level Geology or Mining Engineering programs, and many Geology Departments in universities elsewhere in the UK are focused on training graduates for the Oil and Gas, and Environmental fields. It was argued that very few have specialist programmes geared towards mineral exploration or mining.
6.85 We note the small number of vacancies that exist. We also note the likely lack of supply of labour from the resident workforce and believe that the only sensible source of labour for these, at least in the short-term, would be from the outside the EEA. Therefore, we recommend that the following jobs relevant to the mining sector be included on the shortage occupation list: senior mining engineer; senior resource geologist; and staff geologist.
6.86 In addition, on the basis that we did not receive evidence to consider whether labour shortages still exist in the mineral and extraction consulting industry, we recommend that the following job titles be removed from the shortage occupation list: mining and coal engineer; environmental scientist; and mining geotechnical engineer.
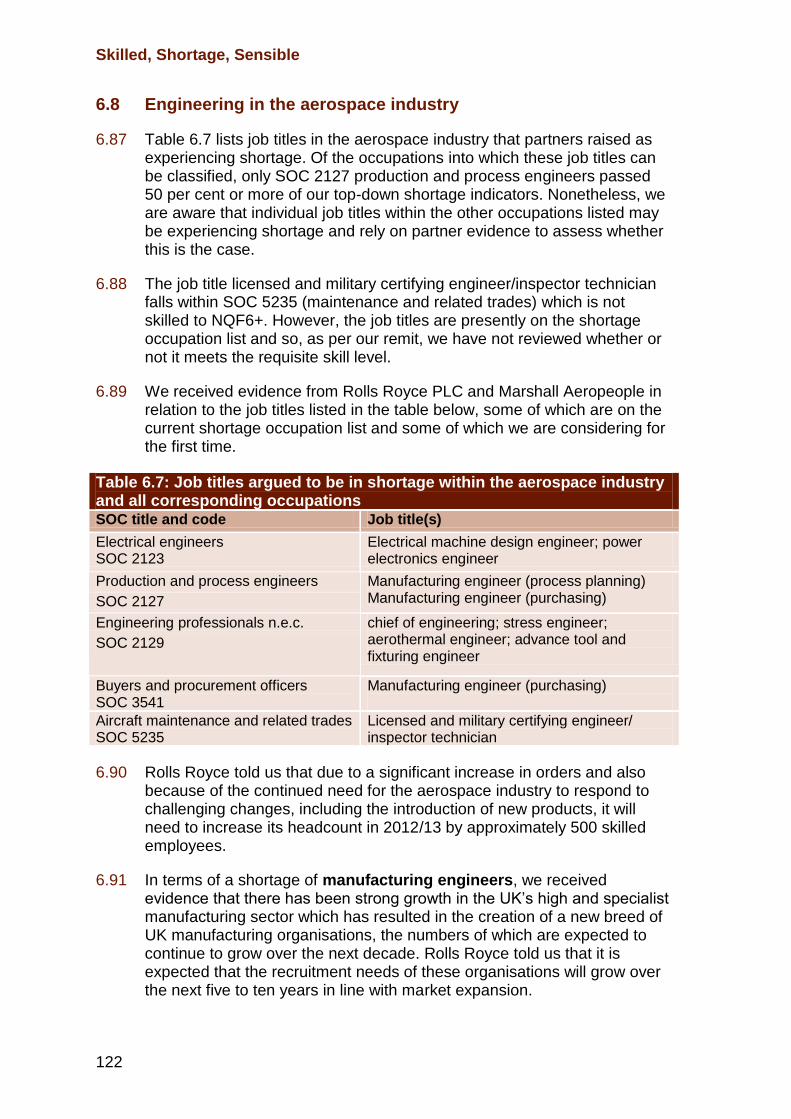
Skilled, Shortage, Sensible
122
6.8 Engineering in the aerospace industry
6.87 Table 6.7 lists job titles in the aerospace industry that partners raised as experiencing shortage. Of the occupations into which these job titles can be classified, only SOC 2127 production and process engineers passed 50 per cent or more of our top-down shortage indicators. Nonetheless, we are aware that individual job titles within the other occupations listed may be experiencing shortage and rely on partner evidence to assess whether this is the case.
6.88 The job title licensed and military certifying engineer/inspector technician falls within SOC 5235 (maintenance and related trades) which is not skilled to NQF6+. However, the job titles are presently on the shortage occupation list and so, as per our remit, we have not reviewed whether or not it meets the requisite skill level.
6.89 We received evidence from Rolls Royce PLC and Marshall Aeropeople in relation to the job titles listed in the table below, some of which are on the current shortage occupation list and some of which we are considering for the first time.
Table 6.7: Job titles argued to be in shortage within the aerospace industry and all corresponding occupations SOC title and code Job title(s)
Electrical engineers SOC 2123
Electrical machine design engineer; power electronics engineer
Production and process engineers Manufacturing engineer (process planning) Manufacturing engineer (purchasing) SOC 2127
Engineering professionals n.e.c. chief of engineering; stress engineer; aerothermal engineer; advance tool and fixturing engineer
SOC 2129
Buyers and procurement officers SOC 3541
Manufacturing engineer (purchasing)
Aircraft maintenance and related trades SOC 5235
Licensed and military certifying engineer/ inspector technician
6.90 Rolls Royce told us that due to a significant increase in orders and also because of the continued need for the aerospace industry to respond to challenging changes, including the introduction of new products, it will need to increase its headcount in 2012/13 by approximately 500 skilled employees.
6.91 In terms of a shortage of manufacturing engineers, we received evidence that there has been strong growth in the UK‟s high and specialist manufacturing sector which has resulted in the creation of a new breed of UK manufacturing organisations, the numbers of which are expected to continue to grow over the next decade. Rolls Royce told us that it is expected that the recruitment needs of these organisations will grow over the next five to ten years in line with market expansion.
Chapter 6: Engineering occupations
123
6.92 We were also told that a shortage of skills in manufacturing engineering has led to the recruitment and development of more apprentices and graduate engineers at a huge cost and lead time to the organisation. These shortages have also resulted, we were told, in an increase in outsourcing of work to other countries, such as India.
6.93 We received evidence of a small growth in manufacturing engineering student numbers. The Engineering UK 2012 report indicates that the number of accepted applicants onto first degree courses in production and manufacturing engineering decreased by 52 per cent, from 1,521 in 2001/2002 to 725 in 2009/2010. That said, there is some evidence that this trend may be in reverse. We saw that overall there was a 5.5 per cent increase in the number of graduates entering these courses from 2008/2009 to 2009/2010, with the number of UK graduates starting on these courses increasing by 17.7 per cent.
“We are hopeful that the small growth in manufacturing engineering student numbers will continue and that the efforts we have detailed … are bearing fruit. In the short term however the effects of the decline in manufacturing engineering graduates from 2001/2002 continues to be felt acutely.”
Rolls Royce response to MAC call for evidence
6.94 Rolls Royce reported that within the specialist area of Gas Turbine Supply Chain Design (GSTC) they continue to experience a shortage of stress engineers and aerothermal engineers. With regard to stress engineers, we received evidence that eight vacancies were posted in 2012. There were 47 candidates, of which one was an internal candidate, and the rest was supplied from outside the EEA. Rolls Royce said a non-resident worker was selected but the process took over six months to complete. They also told us that they have yet to fill the remaining seven stress engineer vacancies.
6.95 With respect to the shortage of aerothermal engineers Rolls Royce provided evidence that in May 2012 they placed an advert for one vacancy, which received 84 applications, of which over 80 per cent were from outside the EEA. Rolls Royce said that none of the candidates had the required skill set. We saw evidence of a similar outcome for vacancies advertised for power electrical engineers and electrical machine design engineers.
6.96 Marshall Aeropeople told us that they are still experiencing a shortage of licensed and military certifying engineers/inspector technicians (LMCE/IT), who work in the aerospace industry‟s modification, repair and overhaul (MRO) business. They said this is partially caused by the fact that in engineering there is a continued skill gap in technician jobs because of advancing technologies that accelerate the demand for professional and associate occupations. Marshall Aerospace also told us that there is a shortage of these workers in Europe and the USA which,
Skilled, Shortage, Sensible
124
they argued, demonstrates not only a UK-wide shortage but an issue that is affecting the global market.
6.97 We saw evidence that only 1,200 MRO licensed engineers are aged 22 to 30, compared with 3,500 aged over 50. This, we were told, will be exacerbated due to the reduced numbers of young people entering engineering careers. Marshall Aeropeople explained that within MRO-based organisations there are limited jobs into which newly-qualified graduates can be effectively placed, because they would require at least three years on-the-job training and supervision to become fully effective.
6.98 We received evidence that the current UK economic climate has caused the demand for non-EEA labour to decrease over the last three years. However, Marshall Aeropeople explained that it is becoming more difficult to recruit the skilled staff to meet the industry‟s manpower planning requirements and we saw that there are up to 450 vacancies in some MRO organisations.
“To maximise the opportunity to capture work, as we come out of recession, Aerospace need to retain its capacity which requires greater flexibility of labour supply, to be able to meet the demands of its contracts.”
Marshall Aerospace response to MAC call for evidence
6.99 In terms of sensible, we received evidence from Rolls Royce about its extensive work in the area of education, which aims to provide support to young people in cultivating the skills that Rolls Royce will need in employees of the future. For example, we saw that Rolls Royce has invested in the development of a number of resources, including the development STEM Careers, a digital toolkit for students and teachers. Rolls Royce also explained that it has invested heavily in graduate, internship and apprenticeship programmes, which includes the opening of its Apprentice Academy in 2012. Rolls Royce also told us that it provides a non-apprenticeship programme, which aims to eventually supply resource to key jobs within the manufacturing function by candidates who are recruited with good A Levels or equivalent and are helped to achieve first and second degrees.
6.100 Marshall Aeropeople told us that it takes up to 20 engineering apprentices a year and currently has 50 people going through the programme. However, they said, that due to the time it takes to complete the programme, these apprentices will not supply the industry‟s short-term needs.
6.101 We believe that we have sufficient evidence to justify recommending that the following job titles within the aerospace industry be retained on the shortage occupation list: licensed and military certifying engineer/inspection technician; chief of engineering; manufacturing engineer (process planning); manufacturing engineer (purchasing);
Chapter 6: Engineering occupations
125
advanced tooling and fixturing engineer; stress engineer; and aerothermal engineer.
6.102 With regard to the job titles licensed and military certifying engineer/inspection technician and manufacturing engineer (purchasing), we did not receive evidence from partners in relation to which pay threshold should be applied in the relevant codes of practice. However, we understand that the UK Border Agency is currently in the process of reviewing the codes of practice for occupations and job titles skilled to NQF level 3 and 4 in order to incorporate the revised Standard Occupational Classification 2010 and uplift salary threshold in line with inflation. As such, we expect these revised pay thresholds will apply to licensed and military certifying engineer/inspection technician and manufacturing engineer (purchasing) if our recommendation to retain these job titles on the shortage occupation list is accepted by the Government.
6.103 We also recommend that the following job titles within the aerospace industry be included on the shortage occupation list: electrical machine design engineer; and power electronics engineer.
6.104 We did not receive evidence in support of the continued shortage of the following job titles and therefore recommend that they be removed from the shortage occupation list: simulation engineer; and all mechanical engineers in the aerospace industry.
6.9 Engineering in the railway industry
6.105 Table 6.8 lists job titles in the railway industry in which partners stated they have experienced labour shortage. SOC 2124 passes only 4 of 12 top-down indicators of shortage and so we rely on bottom-up partner evidence to assess specific job titles.
6.106 Atkins told us that they are currently recruiting for signalling engineers across the UK, but there are still labour shortages in this area. They said that vacancies in the jobs listed in Table 6.8 have been open since August 2012.
6.107 It was explained to us that signalling design is a part of all major rail infrastructure upgrade and renewal projects. We saw that there has been approximately 25 per cent growth in signalling renewals (maintenance driven) since 2010 and 2013. In addition we were told that over the same period the UK is experiencing a 60 per cent increase in spending on enhancements, including the Crossrail project and the High Speed 2 project.
6.108 Atkins said that it is a requirement for any staff that undertake safety critical signalling design on the UK network to hold an Institution of Railway Signal Engineers (IRSE) licence, which is obtained according to the individual‟s level of experience. For example, we saw that to move from trainee signalling designer to signalling principal designer takes on
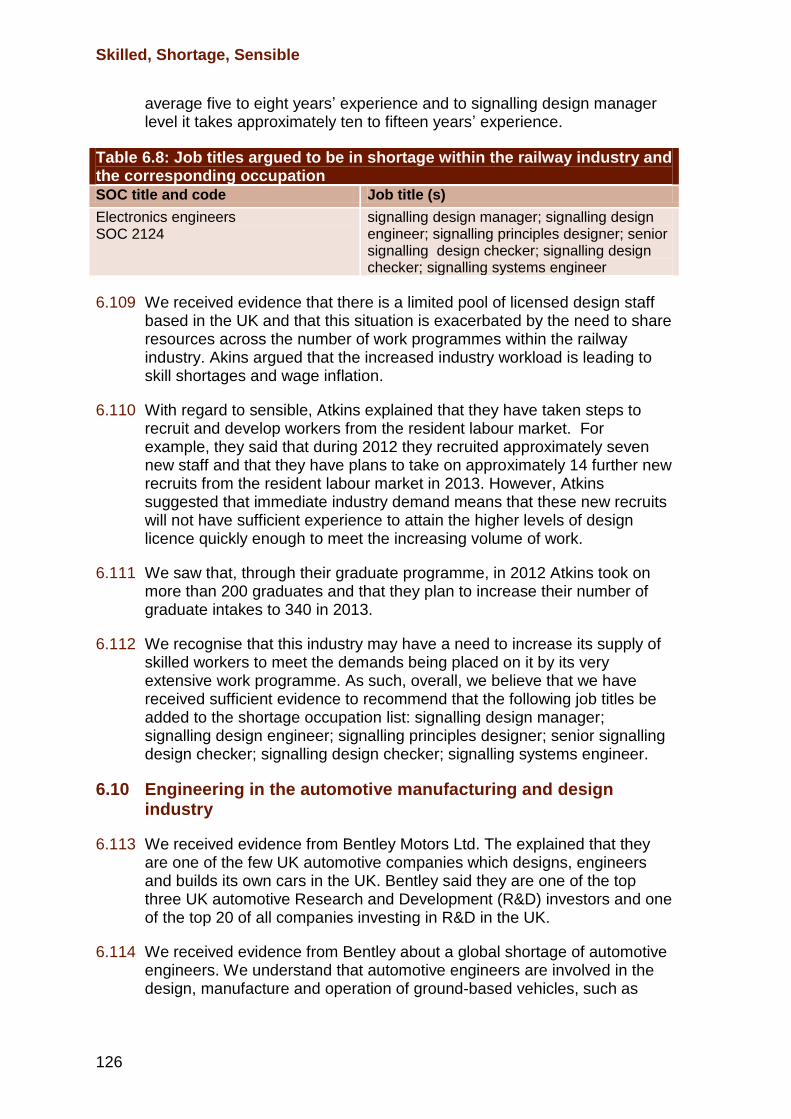
Skilled, Shortage, Sensible
126
average five to eight years‟ experience and to signalling design manager level it takes approximately ten to fifteen years‟ experience.
Table 6.8: Job titles argued to be in shortage within the railway industry and the corresponding occupation SOC title and code Job title (s)
Electronics engineers SOC 2124
signalling design manager; signalling design engineer; signalling principles designer; senior signalling design checker; signalling design checker; signalling systems engineer
6.109 We received evidence that there is a limited pool of licensed design staff based in the UK and that this situation is exacerbated by the need to share resources across the number of work programmes within the railway industry. Akins argued that the increased industry workload is leading to skill shortages and wage inflation.
6.110 With regard to sensible, Atkins explained that they have taken steps to recruit and develop workers from the resident labour market. For example, they said that during 2012 they recruited approximately seven new staff and that they have plans to take on approximately 14 further new recruits from the resident labour market in 2013. However, Atkins suggested that immediate industry demand means that these new recruits will not have sufficient experience to attain the higher levels of design licence quickly enough to meet the increasing volume of work.
6.111 We saw that, through their graduate programme, in 2012 Atkins took on more than 200 graduates and that they plan to increase their number of graduate intakes to 340 in 2013.
6.112 We recognise that this industry may have a need to increase its supply of skilled workers to meet the demands being placed on it by its very extensive work programme. As such, overall, we believe that we have received sufficient evidence to recommend that the following job titles be added to the shortage occupation list: signalling design manager; signalling design engineer; signalling principles designer; senior signalling design checker; signalling design checker; signalling systems engineer.
6.10 Engineering in the automotive manufacturing and design industry
6.113 We received evidence from Bentley Motors Ltd. The explained that they are one of the few UK automotive companies which designs, engineers and builds its own cars in the UK. Bentley said they are one of the top three UK automotive Research and Development (R&D) investors and one of the top 20 of all companies investing in R&D in the UK.
6.114 We received evidence from Bentley about a global shortage of automotive engineers. We understand that automotive engineers are involved in the design, manufacture and operation of ground-based vehicles, such as
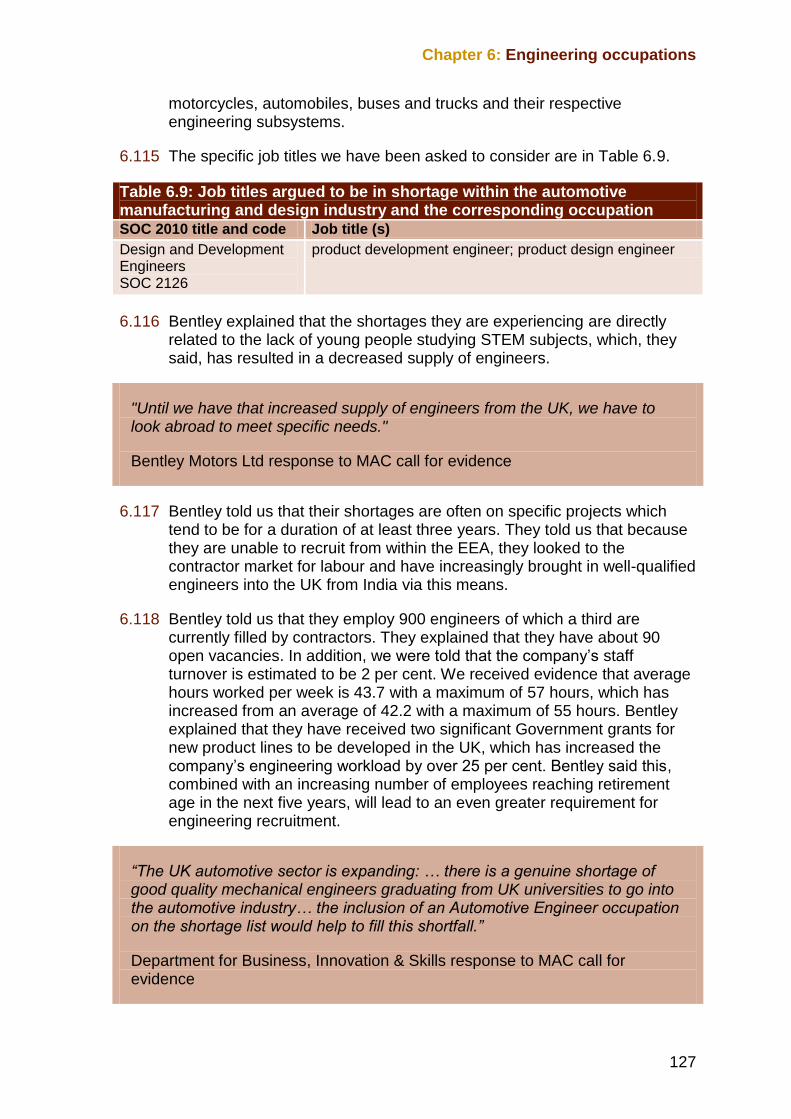
Chapter 6: Engineering occupations
127
motorcycles, automobiles, buses and trucks and their respective engineering subsystems.
6.115 The specific job titles we have been asked to consider are in Table 6.9.
Table 6.9: Job titles argued to be in shortage within the automotive manufacturing and design industry and the corresponding occupation SOC 2010 title and code Job title (s)
Design and Development Engineers SOC 2126
product development engineer; product design engineer
6.116 Bentley explained that the shortages they are experiencing are directly related to the lack of young people studying STEM subjects, which, they said, has resulted in a decreased supply of engineers.
"Until we have that increased supply of engineers from the UK, we have to look abroad to meet specific needs."
Bentley Motors Ltd response to MAC call for evidence
6.117 Bentley told us that their shortages are often on specific projects which tend to be for a duration of at least three years. They told us that because they are unable to recruit from within the EEA, they looked to the contractor market for labour and have increasingly brought in well-qualified engineers into the UK from India via this means.
6.118 Bentley told us that they employ 900 engineers of which a third are currently filled by contractors. They explained that they have about 90 open vacancies. In addition, we were told that the company‟s staff turnover is estimated to be 2 per cent. We received evidence that average hours worked per week is 43.7 with a maximum of 57 hours, which has increased from an average of 42.2 with a maximum of 55 hours. Bentley explained that they have received two significant Government grants for new product lines to be developed in the UK, which has increased the company‟s engineering workload by over 25 per cent. Bentley said this, combined with an increasing number of employees reaching retirement age in the next five years, will lead to an even greater requirement for engineering recruitment.
“The UK automotive sector is expanding: … there is a genuine shortage of good quality mechanical engineers graduating from UK universities to go into the automotive industry… the inclusion of an Automotive Engineer occupation on the shortage list would help to fill this shortfall.”
Department for Business, Innovation & Skills response to MAC call for evidence
Skilled, Shortage, Sensible
128
6.119 Turning to sensible, Bentley told us that they are spending significant amounts on training. They said that they have an extensive and well-recognised apprentice and graduate recruitment programme, but that these will not meet short-to-medium-term demand because on-the-job experience is required before full performance is delivered.
6.120 Bentley also explained that neither development engineers nor project managers can be replaced by technology or machines. They said their only alternative would be to recruit from other EU countries where labour costs and expenses are much higher. According to Bentley, to do so would make them less competitive and would cause them to lose out on new projects to rival countries, such as Slovakia.
"There are few other alternatives. Development engineers/project managers cannot yet be replaced by technology or machines! The only alternatives are the sourcing of engineers from other EU countries, whose labour rates and expenses are much higher and where domestic demand for their services is equally high, hence the higher pay rates."
Bentley Motors Ltd response to MAC call for evidence
"… it is uncompetitive for us to pay exorbitant sums to recruit from competitor countries."
Bentley Motors Ltd response to MAC call for evidence
6.121 Overall, we believe that we have received sufficient evidence of a shortage of labour for certain job titles within the automotive manufacturing and design industry that is sensible to address using non-EEA migrant labour. We therefore recommend that the following job titles be included on the shortage occupation list: product development engineer; product design engineer.
6.11 Engineering in the electronics systems industry
6.122 We received evidence from NMI, the trade association representing the UK Electronic Systems, Microelectronics and Semiconductor Communities. It was explained to us that the UK electronics systems industry employs approximately 500,000 people across engineering manufacturing, commercial and support disciplines. We were told that the industry has the potential to grow by over 20 per cent in the next two years, but that this growth is threatened by a severe skills shortage of the industry‟s most specialised occupations.
6.123 Specifically, we received evidence that there are shortages within integrated circuit (IC) engineering, embedded software engineering, and specialist electronics engineering. The specific job titles we have been asked to consider are listed in Table 6.10.
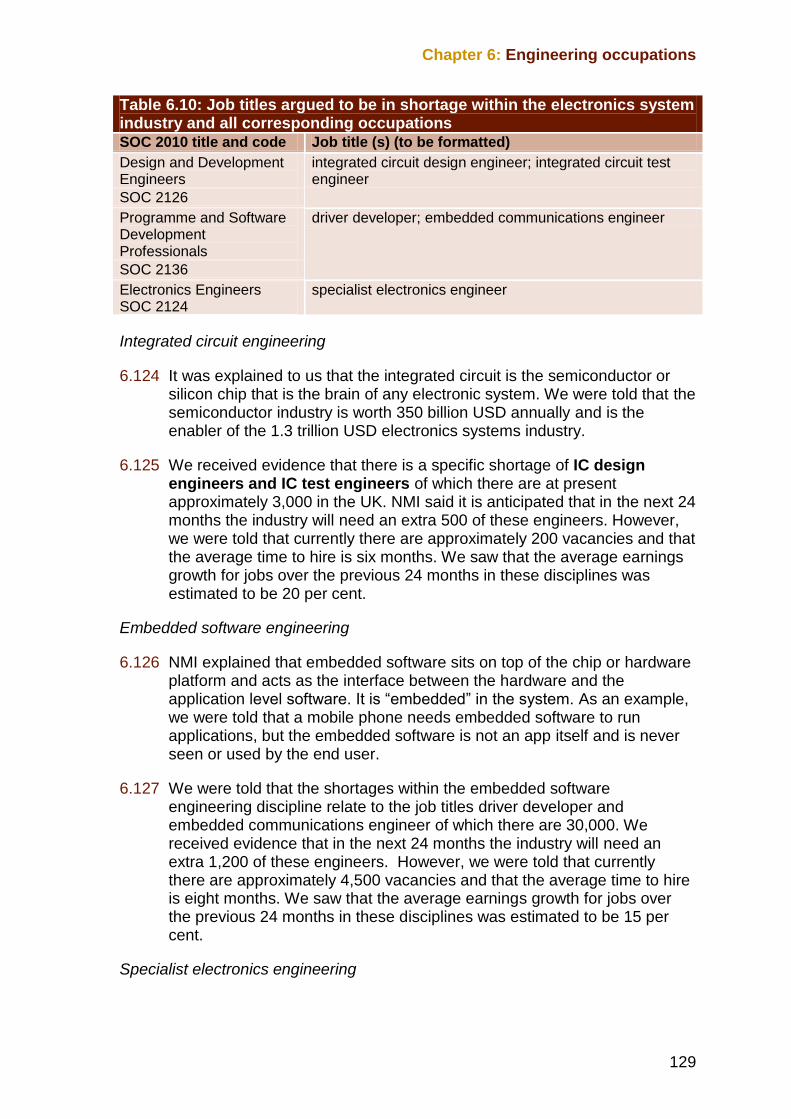
Chapter 6: Engineering occupations
129
Table 6.10: Job titles argued to be in shortage within the electronics system industry and all corresponding occupations SOC 2010 title and code Job title (s) (to be formatted)
Design and Development Engineers
integrated circuit design engineer; integrated circuit test engineer
SOC 2126
Programme and Software Development Professionals
driver developer; embedded communications engineer
SOC 2136
Electronics Engineers SOC 2124
specialist electronics engineer
Integrated circuit engineering
6.124 It was explained to us that the integrated circuit is the semiconductor or silicon chip that is the brain of any electronic system. We were told that the semiconductor industry is worth 350 billion USD annually and is the enabler of the 1.3 trillion USD electronics systems industry.
6.125 We received evidence that there is a specific shortage of IC design engineers and IC test engineers of which there are at present approximately 3,000 in the UK. NMI said it is anticipated that in the next 24 months the industry will need an extra 500 of these engineers. However, we were told that currently there are approximately 200 vacancies and that the average time to hire is six months. We saw that the average earnings growth for jobs over the previous 24 months in these disciplines was estimated to be 20 per cent.
Embedded software engineering
6.126 NMI explained that embedded software sits on top of the chip or hardware platform and acts as the interface between the hardware and the application level software. It is “embedded” in the system. As an example, we were told that a mobile phone needs embedded software to run applications, but the embedded software is not an app itself and is never seen or used by the end user.
6.127 We were told that the shortages within the embedded software engineering discipline relate to the job titles driver developer and embedded communications engineer of which there are 30,000. We received evidence that in the next 24 months the industry will need an extra 1,200 of these engineers. However, we were told that currently there are approximately 4,500 vacancies and that the average time to hire is eight months. We saw that the average earnings growth for jobs over the previous 24 months in these disciplines was estimated to be 15 per cent.
Specialist electronics engineering
Skilled, Shortage, Sensible
130
6.128 We received evidence about a shortage of specialist electronics engineers, of which there are currently 65,000. We received evidence that in the next 24 months the industry will need an extra 1,500 specialist electronics engineers. However, we were told that currently there are approximately 400 vacancies and that the average time to hire is eight months. We saw that the average earnings growth for jobs over the previous 24 months in these disciplines was estimated to be 20 per cent.
6.129 We also received evidence that the under-enrolment in electronics degrees over a number of years has led to a lower rate of inflow into the industry and that at the same time retirement rates are increasing. As such, NMI said the industry‟s shortages are greatest at graduate to senior engineer levels. It was also put to us that as careers progress a certain percentage of engineers move into management or commercial roles and this has exacerbated the situation at senior engineer level.
6.130 In terms of sensible, we were told that the only alternative to employing skilled migrant workers in the UK is to establish design centres outside of the UK.
“Companies would prefer that engineers were employed in the UK, but are setting up design teams outside the UK out of necessity or using design services companies, often located outside of the UK. Intra-company transfers are not a viable option, as once design centres are established remotely the employees stay in that remote location.”
NMI response to MAC call for evidence
6.131 We were told about the UK Electronics Skills Foundation (UKESF), a collaboration between industry, universities and the public sector, which works to connect employers with students in schools and universities; promote the electronics industry and its value to society and the economy; and raise awareness of the range of careers in electronics. NMI explained that since the initiative was set up in 2010 it has placed 75 scholars in participating companies. We were told that in 2012 it placed 65 scholars across 18 companies, with an industry target of placing 90 scholars in 2013.
6.132 We received evidence that the industry is backing the Raspberry Pi (a credit-card sized computer that plugs into a TV and a keyboard) initiative aimed at encouraging electronic design and programming in schools. NMI said the Raspberry Pi Foundation is entirely funded by the electronics system industry which aims to have distributed one million units by the end of year one.
6.133 NMI argued that migrant workers will not reduce employment opportunities or salaries for UK workers.
Chapter 6: Engineering occupations
131
“The ability to attract migrant workers will increase the probability of future UK resident workers being hired, because hiring migrant workers now will keep the Electronics Systems Infrastructure in the UK: it is currently in danger of moving overseas.”
NMI response to MAC call for evidence
6.134 In addition, NMI claimed that the closure of the Post-Study Work route, which enabled the UK to retain the most able international (non-European) graduates who have studied here, has the potential to have a detrimental impact on the electronics systems industry.
“Companies such as ARM, Imagination, Dialog and CSR have become billion-pound companies through attracting the best graduate talent over the last 15 years. The supply of skills has now been cut off, thus stymying growth, giving a competitive advantage to overseas competitors, and rendering it less likely that the next generation of successful start ups will be located in the UK.”
NMI response to MAC call for evidence
6.135 In conclusion, we are satisfied that the evidence we received demonstrates a shortage of labour for certain job titles within the electronics systems industry that is sensible to address using non-EEA migrant labour. We therefore recommend that the following job titles be included on the shortage occupation list: integrated circuit design engineer; integrated circuit test engineer; driver developer; embedded communications engineer; specialist electronics engineer.
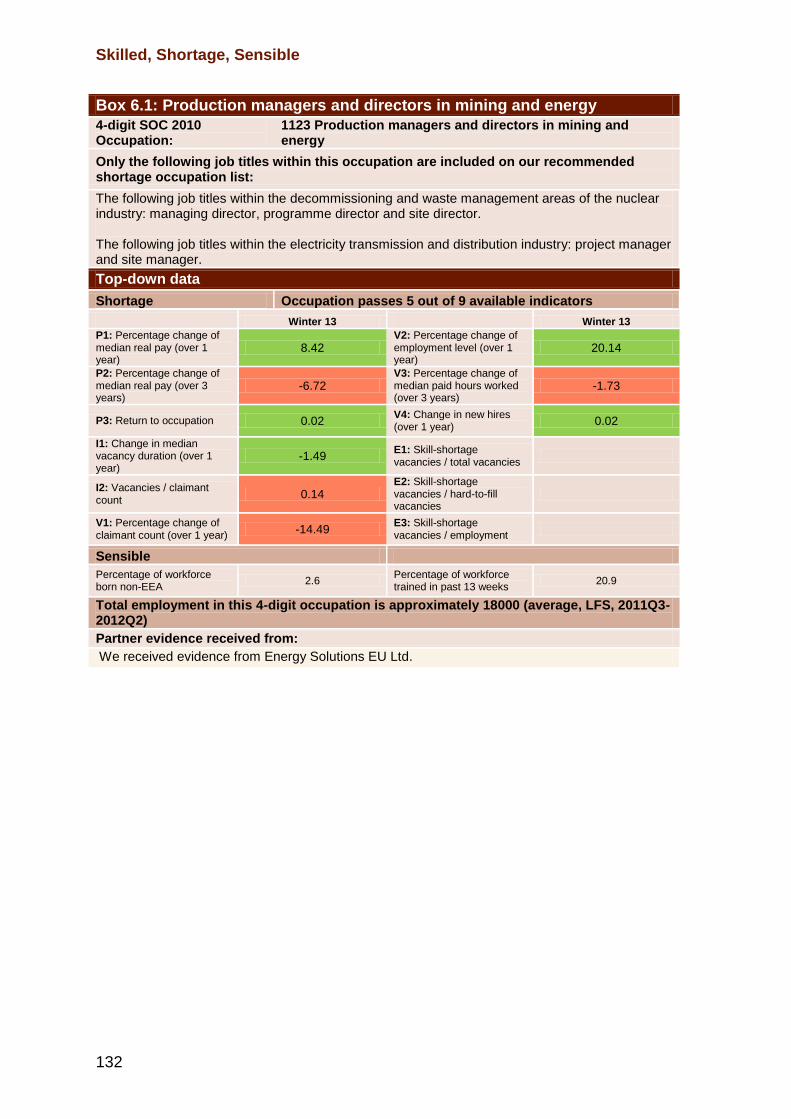
Skilled, Shortage, Sensible
132
Box 6.1: Production managers and directors in mining and energy
4-digit SOC 2010 Occupation:
1123 Production managers and directors in mining and energy
Only the following job titles within this occupation are included on our recommended shortage occupation list:
The following job titles within the decommissioning and waste management areas of the nuclear industry: managing director, programme director and site director. The following job titles within the electricity transmission and distribution industry: project manager and site manager.
Top-down data
Shortage Occupation passes 5 out of 9 available indicators
Winter 13 Winter 13
P1: Percentage change of median real pay (over 1 year)
8.42 V2: Percentage change of employment level (over 1 year)
20.14
P2: Percentage change of median real pay (over 3 years)
-6.72 V3: Percentage change of median paid hours worked (over 3 years)
-1.73
P3: Return to occupation 0.02 V4: Change in new hires (over 1 year)
0.02
I1: Change in median vacancy duration (over 1 year)
-1.49 E1: Skill-shortage vacancies / total vacancies
I2: Vacancies / claimant count
0.14 E2: Skill-shortage vacancies / hard-to-fill vacancies
V1: Percentage change of claimant count (over 1 year)
-14.49 E3: Skill-shortage vacancies / employment
Sensible
Percentage of workforce born non-EEA
2.6 Percentage of workforce trained in past 13 weeks
20.9
Total employment in this 4-digit occupation is approximately 18000 (average, LFS, 2011Q3-2012Q2)
Partner evidence received from:
We received evidence from Energy Solutions EU Ltd.
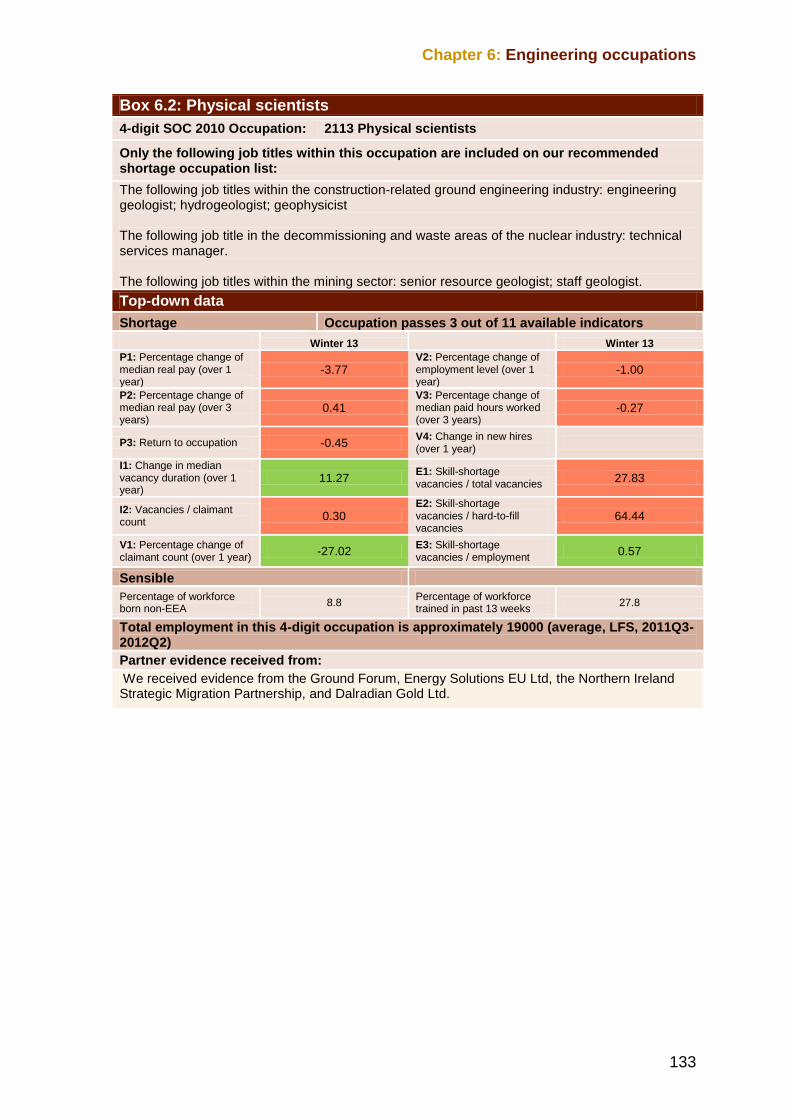
Chapter 6: Engineering occupations
133
Box 6.2: Physical scientists
4-digit SOC 2010 Occupation: 2113 Physical scientists
Only the following job titles within this occupation are included on our recommended shortage occupation list:
The following job titles within the construction-related ground engineering industry: engineering geologist; hydrogeologist; geophysicist The following job title in the decommissioning and waste areas of the nuclear industry: technical services manager. The following job titles within the mining sector: senior resource geologist; staff geologist.
Top-down data
Shortage Occupation passes 3 out of 11 available indicators
Winter 13 Winter 13
P1: Percentage change of median real pay (over 1 year)
-3.77 V2: Percentage change of employment level (over 1 year)
-1.00
P2: Percentage change of median real pay (over 3 years)
0.41 V3: Percentage change of median paid hours worked (over 3 years)
-0.27
P3: Return to occupation -0.45 V4: Change in new hires (over 1 year)
I1: Change in median vacancy duration (over 1 year)
11.27 E1: Skill-shortage vacancies / total vacancies
27.83
I2: Vacancies / claimant count
0.30 E2: Skill-shortage vacancies / hard-to-fill vacancies
64.44
V1: Percentage change of claimant count (over 1 year)
-27.02 E3: Skill-shortage vacancies / employment
0.57
Sensible
Percentage of workforce born non-EEA
8.8 Percentage of workforce trained in past 13 weeks
27.8
Total employment in this 4-digit occupation is approximately 19000 (average, LFS, 2011Q3-2012Q2)
Partner evidence received from:
We received evidence from the Ground Forum, Energy Solutions EU Ltd, the Northern Ireland Strategic Migration Partnership, and Dalradian Gold Ltd.
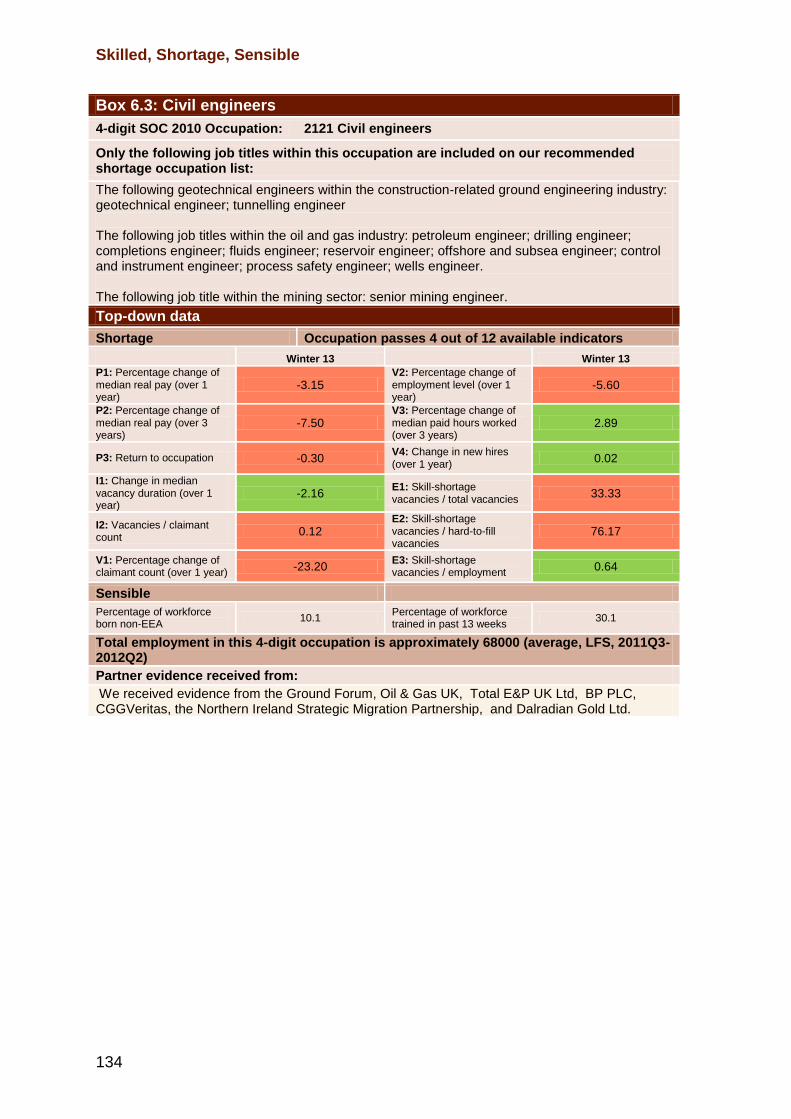
Skilled, Shortage, Sensible
134
Box 6.3: Civil engineers
4-digit SOC 2010 Occupation: 2121 Civil engineers
Only the following job titles within this occupation are included on our recommended shortage occupation list:
The following geotechnical engineers within the construction-related ground engineering industry: geotechnical engineer; tunnelling engineer The following job titles within the oil and gas industry: petroleum engineer; drilling engineer; completions engineer; fluids engineer; reservoir engineer; offshore and subsea engineer; control and instrument engineer; process safety engineer; wells engineer. The following job title within the mining sector: senior mining engineer.
Top-down data
Shortage Occupation passes 4 out of 12 available indicators
Winter 13 Winter 13
P1: Percentage change of median real pay (over 1 year)
-3.15 V2: Percentage change of employment level (over 1 year)
-5.60
P2: Percentage change of median real pay (over 3 years)
-7.50 V3: Percentage change of median paid hours worked (over 3 years)
2.89
P3: Return to occupation -0.30 V4: Change in new hires (over 1 year)
0.02
I1: Change in median vacancy duration (over 1 year)
-2.16 E1: Skill-shortage vacancies / total vacancies
33.33
I2: Vacancies / claimant count
0.12 E2: Skill-shortage vacancies / hard-to-fill vacancies
76.17
V1: Percentage change of claimant count (over 1 year)
-23.20 E3: Skill-shortage vacancies / employment
0.64
Sensible
Percentage of workforce born non-EEA
10.1 Percentage of workforce trained in past 13 weeks
30.1
Total employment in this 4-digit occupation is approximately 68000 (average, LFS, 2011Q3-2012Q2)
Partner evidence received from:
We received evidence from the Ground Forum, Oil & Gas UK, Total E&P UK Ltd, BP PLC, CGGVeritas, the Northern Ireland Strategic Migration Partnership, and Dalradian Gold Ltd.
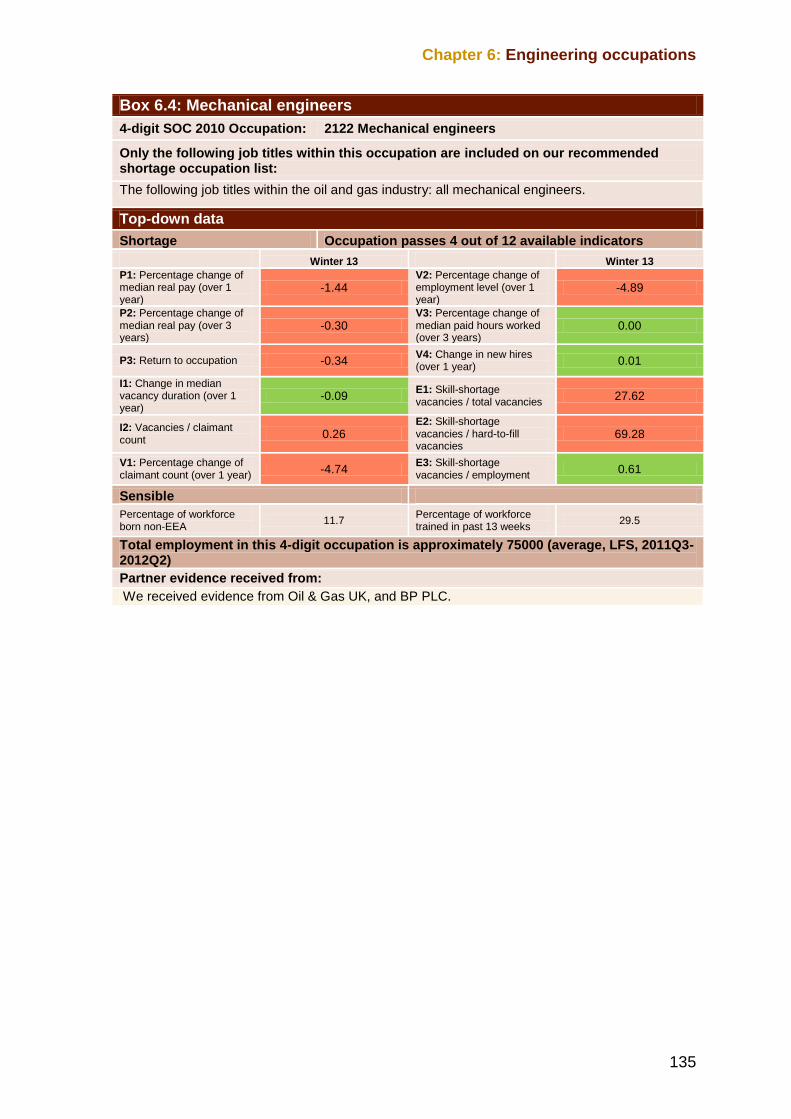
Chapter 6: Engineering occupations
135
Box 6.4: Mechanical engineers
4-digit SOC 2010 Occupation: 2122 Mechanical engineers
Only the following job titles within this occupation are included on our recommended shortage occupation list:
The following job titles within the oil and gas industry: all mechanical engineers.
Top-down data
Shortage Occupation passes 4 out of 12 available indicators
Winter 13 Winter 13
P1: Percentage change of median real pay (over 1 year)
-1.44 V2: Percentage change of employment level (over 1 year)
-4.89
P2: Percentage change of median real pay (over 3 years)
-0.30 V3: Percentage change of median paid hours worked (over 3 years)
0.00
P3: Return to occupation -0.34 V4: Change in new hires (over 1 year)
0.01
I1: Change in median vacancy duration (over 1 year)
-0.09 E1: Skill-shortage vacancies / total vacancies
27.62
I2: Vacancies / claimant count
0.26 E2: Skill-shortage vacancies / hard-to-fill vacancies
69.28
V1: Percentage change of claimant count (over 1 year)
-4.74 E3: Skill-shortage vacancies / employment
0.61
Sensible
Percentage of workforce born non-EEA
11.7 Percentage of workforce trained in past 13 weeks
29.5
Total employment in this 4-digit occupation is approximately 75000 (average, LFS, 2011Q3-2012Q2)
Partner evidence received from:
We received evidence from Oil & Gas UK, and BP PLC.
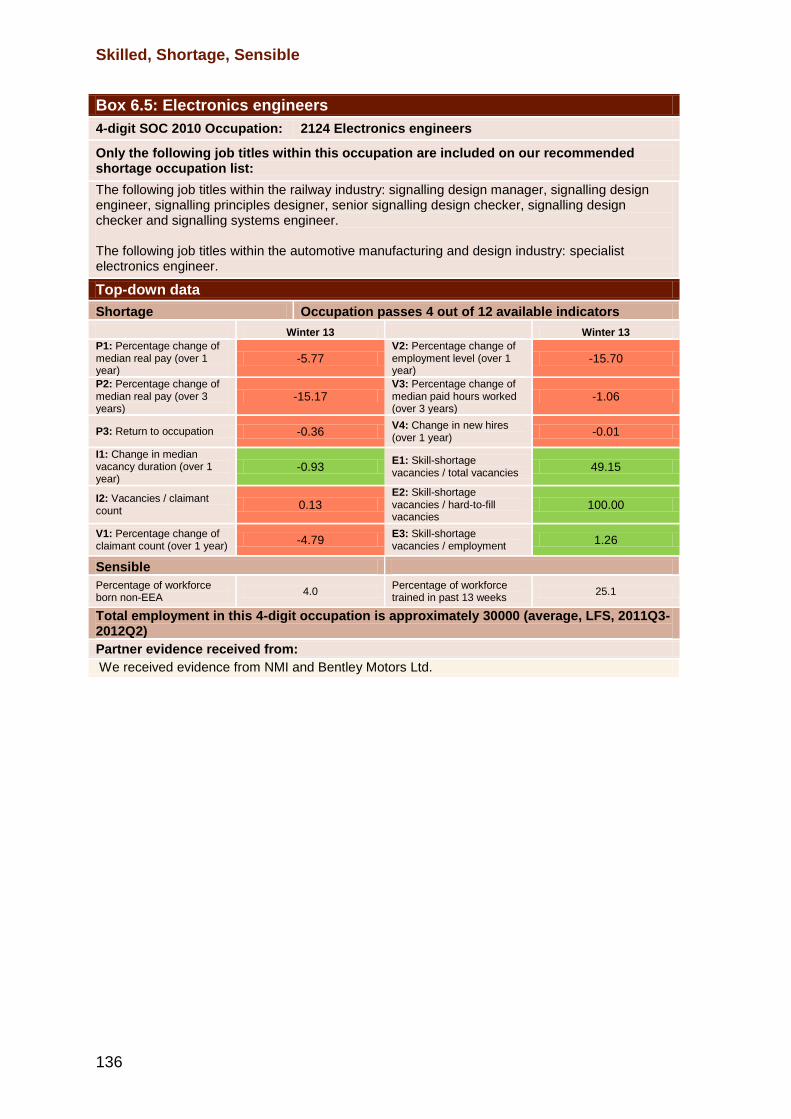
Skilled, Shortage, Sensible
136
Box 6.5: Electronics engineers
4-digit SOC 2010 Occupation: 2124 Electronics engineers
Only the following job titles within this occupation are included on our recommended shortage occupation list:
The following job titles within the railway industry: signalling design manager, signalling design engineer, signalling principles designer, senior signalling design checker, signalling design checker and signalling systems engineer. The following job titles within the automotive manufacturing and design industry: specialist electronics engineer.
Top-down data
Shortage Occupation passes 4 out of 12 available indicators
Winter 13 Winter 13
P1: Percentage change of median real pay (over 1 year)
-5.77 V2: Percentage change of employment level (over 1 year)
-15.70
P2: Percentage change of median real pay (over 3 years)
-15.17 V3: Percentage change of median paid hours worked (over 3 years)
-1.06
P3: Return to occupation -0.36 V4: Change in new hires (over 1 year)
-0.01
I1: Change in median vacancy duration (over 1 year)
-0.93 E1: Skill-shortage vacancies / total vacancies
49.15
I2: Vacancies / claimant count
0.13 E2: Skill-shortage vacancies / hard-to-fill vacancies
100.00
V1: Percentage change of claimant count (over 1 year)
-4.79 E3: Skill-shortage vacancies / employment
1.26
Sensible
Percentage of workforce born non-EEA
4.0 Percentage of workforce trained in past 13 weeks
25.1
Total employment in this 4-digit occupation is approximately 30000 (average, LFS, 2011Q3-2012Q2)
Partner evidence received from:
We received evidence from NMI and Bentley Motors Ltd.
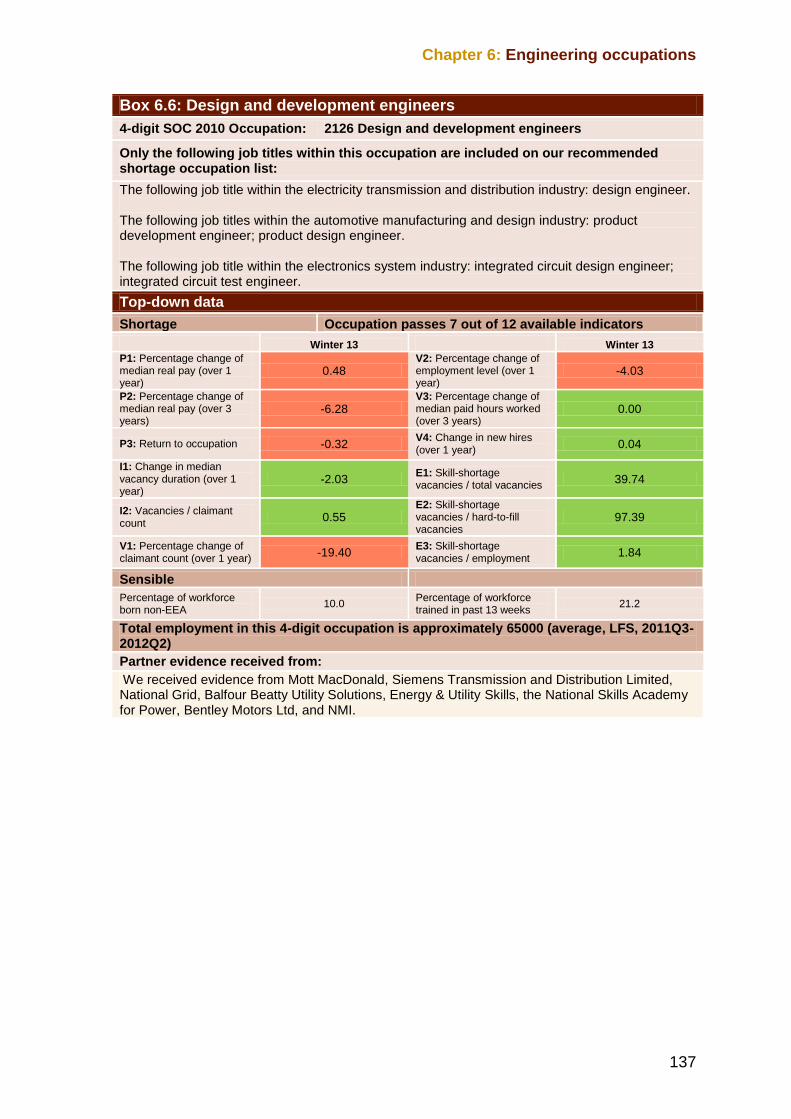
Chapter 6: Engineering occupations
137
Box 6.6: Design and development engineers
4-digit SOC 2010 Occupation: 2126 Design and development engineers
Only the following job titles within this occupation are included on our recommended shortage occupation list:
The following job title within the electricity transmission and distribution industry: design engineer. The following job titles within the automotive manufacturing and design industry: product development engineer; product design engineer. The following job title within the electronics system industry: integrated circuit design engineer; integrated circuit test engineer.
Top-down data
Shortage Occupation passes 7 out of 12 available indicators
Winter 13 Winter 13
P1: Percentage change of median real pay (over 1 year)
0.48 V2: Percentage change of employment level (over 1 year)
-4.03
P2: Percentage change of median real pay (over 3 years)
-6.28 V3: Percentage change of median paid hours worked (over 3 years)
0.00
P3: Return to occupation -0.32 V4: Change in new hires (over 1 year)
0.04
I1: Change in median vacancy duration (over 1 year)
-2.03 E1: Skill-shortage vacancies / total vacancies
39.74
I2: Vacancies / claimant count
0.55 E2: Skill-shortage vacancies / hard-to-fill vacancies
97.39
V1: Percentage change of claimant count (over 1 year)
-19.40 E3: Skill-shortage vacancies / employment
1.84
Sensible
Percentage of workforce born non-EEA
10.0 Percentage of workforce trained in past 13 weeks
21.2
Total employment in this 4-digit occupation is approximately 65000 (average, LFS, 2011Q3-2012Q2)
Partner evidence received from:
We received evidence from Mott MacDonald, Siemens Transmission and Distribution Limited, National Grid, Balfour Beatty Utility Solutions, Energy & Utility Skills, the National Skills Academy for Power, Bentley Motors Ltd, and NMI.
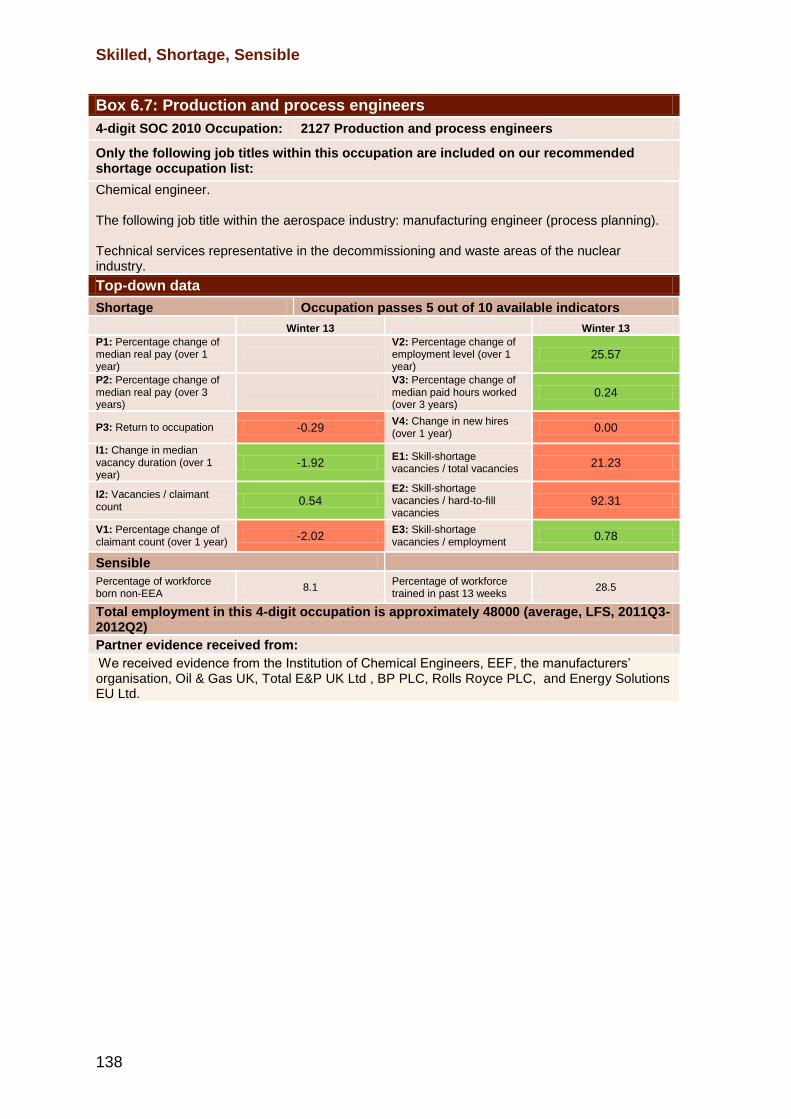
Skilled, Shortage, Sensible
138
Box 6.7: Production and process engineers
4-digit SOC 2010 Occupation: 2127 Production and process engineers
Only the following job titles within this occupation are included on our recommended shortage occupation list:
Chemical engineer. The following job title within the aerospace industry: manufacturing engineer (process planning). Technical services representative in the decommissioning and waste areas of the nuclear industry.
Top-down data
Shortage Occupation passes 5 out of 10 available indicators
Winter 13 Winter 13
P1: Percentage change of median real pay (over 1 year)
V2: Percentage change of employment level (over 1 year)
25.57
P2: Percentage change of median real pay (over 3 years)
V3: Percentage change of median paid hours worked (over 3 years)
0.24
P3: Return to occupation -0.29 V4: Change in new hires (over 1 year)
0.00
I1: Change in median vacancy duration (over 1 year)
-1.92 E1: Skill-shortage vacancies / total vacancies
21.23
I2: Vacancies / claimant count
0.54 E2: Skill-shortage vacancies / hard-to-fill vacancies
92.31
V1: Percentage change of claimant count (over 1 year)
-2.02 E3: Skill-shortage vacancies / employment
0.78
Sensible
Percentage of workforce born non-EEA
8.1 Percentage of workforce trained in past 13 weeks
28.5
Total employment in this 4-digit occupation is approximately 48000 (average, LFS, 2011Q3-2012Q2)
Partner evidence received from:
We received evidence from the Institution of Chemical Engineers, EEF, the manufacturers‟ organisation, Oil & Gas UK, Total E&P UK Ltd , BP PLC, Rolls Royce PLC, and Energy Solutions EU Ltd.
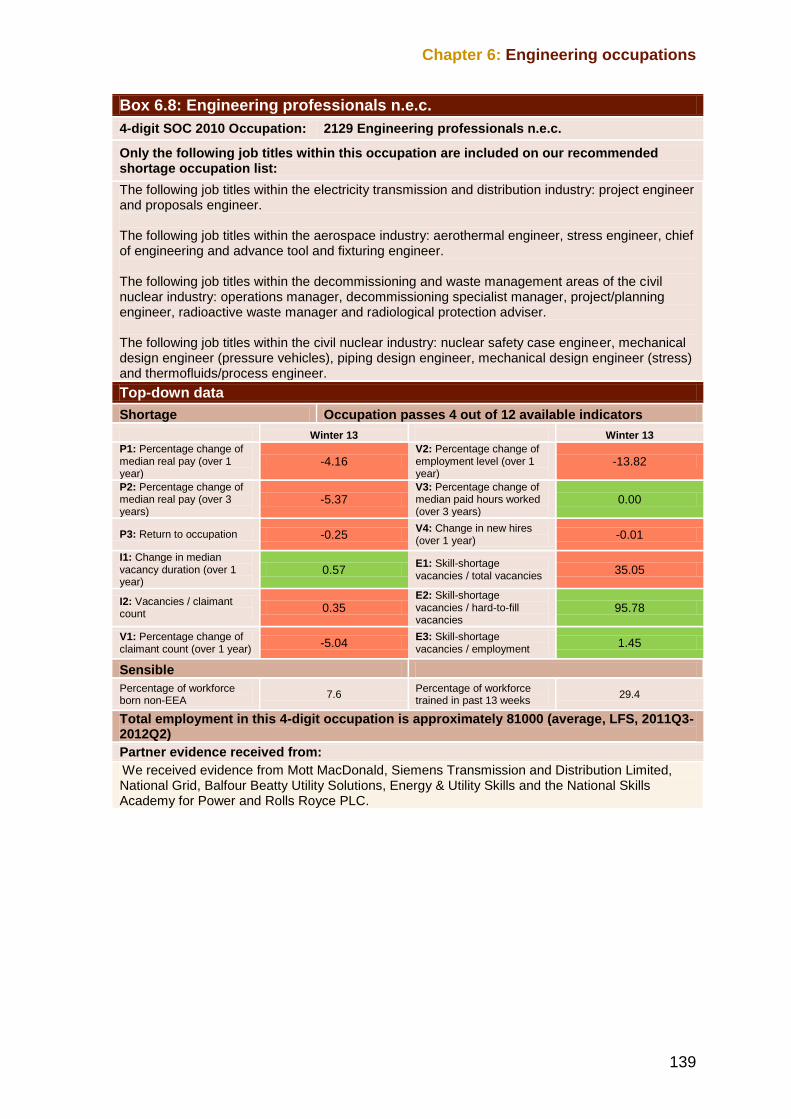
Chapter 6: Engineering occupations
139
Box 6.8: Engineering professionals n.e.c.
4-digit SOC 2010 Occupation: 2129 Engineering professionals n.e.c.
Only the following job titles within this occupation are included on our recommended shortage occupation list:
The following job titles within the electricity transmission and distribution industry: project engineer and proposals engineer. The following job titles within the aerospace industry: aerothermal engineer, stress engineer, chief of engineering and advance tool and fixturing engineer. The following job titles within the decommissioning and waste management areas of the civil nuclear industry: operations manager, decommissioning specialist manager, project/planning engineer, radioactive waste manager and radiological protection adviser. The following job titles within the civil nuclear industry: nuclear safety case engineer, mechanical design engineer (pressure vehicles), piping design engineer, mechanical design engineer (stress) and thermofluids/process engineer.
Top-down data
Shortage Occupation passes 4 out of 12 available indicators
Winter 13 Winter 13
P1: Percentage change of median real pay (over 1 year)
-4.16 V2: Percentage change of employment level (over 1 year)
-13.82
P2: Percentage change of median real pay (over 3 years)
-5.37 V3: Percentage change of median paid hours worked (over 3 years)
0.00
P3: Return to occupation -0.25 V4: Change in new hires (over 1 year)
-0.01
I1: Change in median vacancy duration (over 1 year)
0.57 E1: Skill-shortage vacancies / total vacancies
35.05
I2: Vacancies / claimant count
0.35 E2: Skill-shortage vacancies / hard-to-fill vacancies
95.78
V1: Percentage change of claimant count (over 1 year)
-5.04 E3: Skill-shortage vacancies / employment
1.45
Sensible
Percentage of workforce born non-EEA
7.6 Percentage of workforce trained in past 13 weeks
29.4
Total employment in this 4-digit occupation is approximately 81000 (average, LFS, 2011Q3-2012Q2)
Partner evidence received from:
We received evidence from Mott MacDonald, Siemens Transmission and Distribution Limited, National Grid, Balfour Beatty Utility Solutions, Energy & Utility Skills and the National Skills Academy for Power and Rolls Royce PLC.
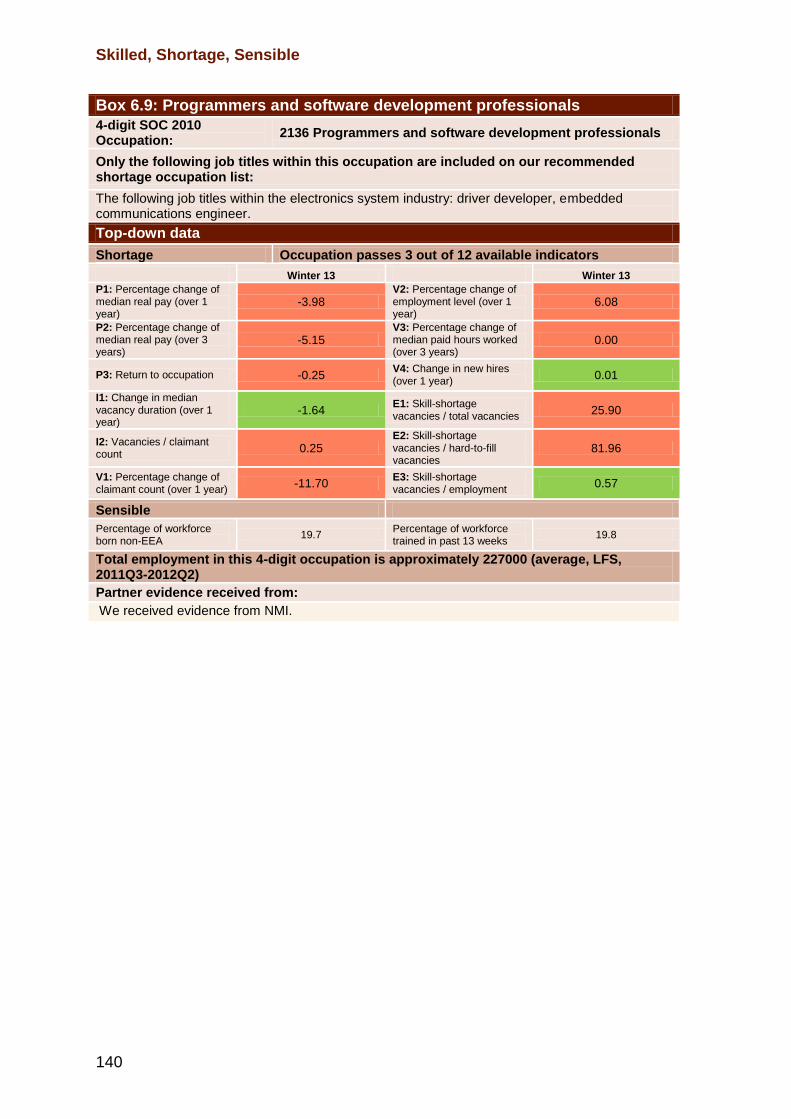
Skilled, Shortage, Sensible
140
Box 6.9: Programmers and software development professionals
4-digit SOC 2010 Occupation:
2136 Programmers and software development professionals
Only the following job titles within this occupation are included on our recommended shortage occupation list:
The following job titles within the electronics system industry: driver developer, embedded communications engineer.
Top-down data
Shortage Occupation passes 3 out of 12 available indicators
Winter 13 Winter 13
P1: Percentage change of median real pay (over 1 year)
-3.98 V2: Percentage change of employment level (over 1 year)
6.08
P2: Percentage change of median real pay (over 3 years)
-5.15 V3: Percentage change of median paid hours worked (over 3 years)
0.00
P3: Return to occupation -0.25 V4: Change in new hires (over 1 year)
0.01
I1: Change in median vacancy duration (over 1 year)
-1.64 E1: Skill-shortage vacancies / total vacancies
25.90
I2: Vacancies / claimant count
0.25 E2: Skill-shortage vacancies / hard-to-fill vacancies
81.96
V1: Percentage change of claimant count (over 1 year)
-11.70 E3: Skill-shortage vacancies / employment
0.57
Sensible
Percentage of workforce born non-EEA
19.7 Percentage of workforce trained in past 13 weeks
19.8
Total employment in this 4-digit occupation is approximately 227000 (average, LFS, 2011Q3-2012Q2)
Partner evidence received from:
We received evidence from NMI.
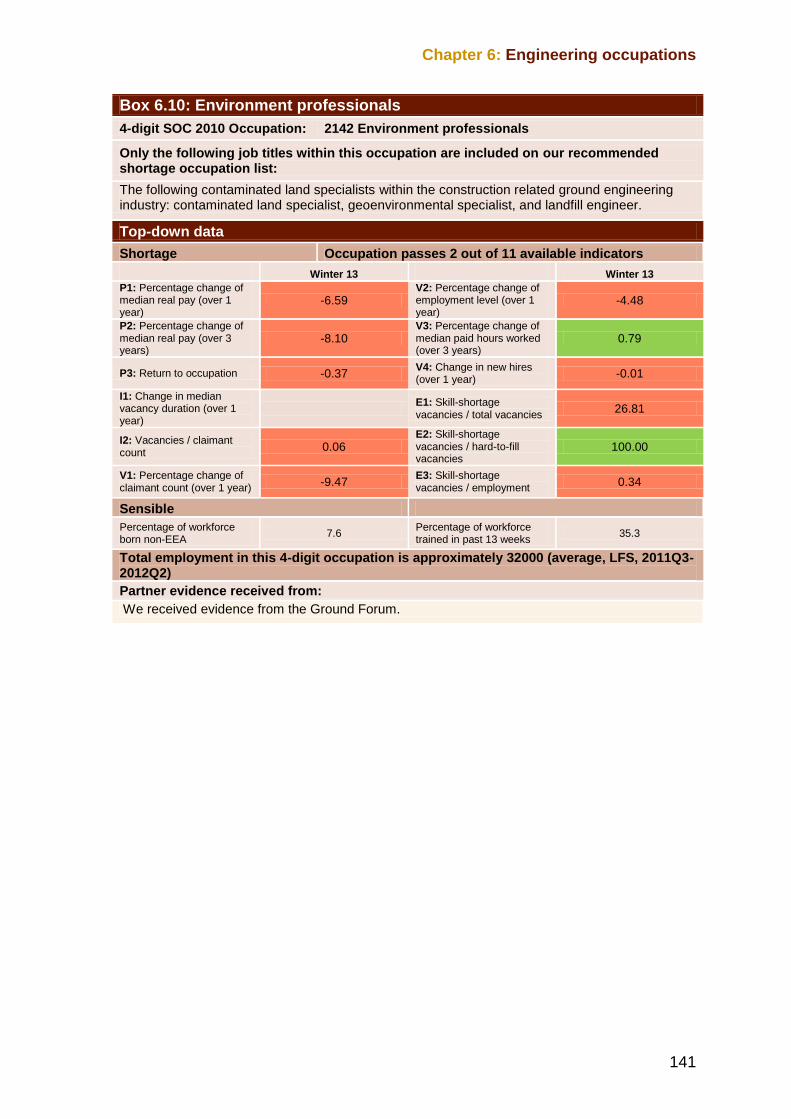
Chapter 6: Engineering occupations
141
Box 6.10: Environment professionals
4-digit SOC 2010 Occupation: 2142 Environment professionals
Only the following job titles within this occupation are included on our recommended shortage occupation list:
The following contaminated land specialists within the construction related ground engineering industry: contaminated land specialist, geoenvironmental specialist, and landfill engineer.
Top-down data
Shortage Occupation passes 2 out of 11 available indicators
Winter 13 Winter 13
P1: Percentage change of median real pay (over 1 year)
-6.59 V2: Percentage change of employment level (over 1 year)
-4.48
P2: Percentage change of median real pay (over 3 years)
-8.10 V3: Percentage change of median paid hours worked (over 3 years)
0.79
P3: Return to occupation -0.37 V4: Change in new hires (over 1 year)
-0.01
I1: Change in median vacancy duration (over 1 year)
E1: Skill-shortage vacancies / total vacancies
26.81
I2: Vacancies / claimant count
0.06 E2: Skill-shortage vacancies / hard-to-fill vacancies
100.00
V1: Percentage change of claimant count (over 1 year)
-9.47 E3: Skill-shortage vacancies / employment
0.34
Sensible
Percentage of workforce born non-EEA
7.6 Percentage of workforce trained in past 13 weeks
35.3
Total employment in this 4-digit occupation is approximately 32000 (average, LFS, 2011Q3-2012Q2)
Partner evidence received from:
We received evidence from the Ground Forum.
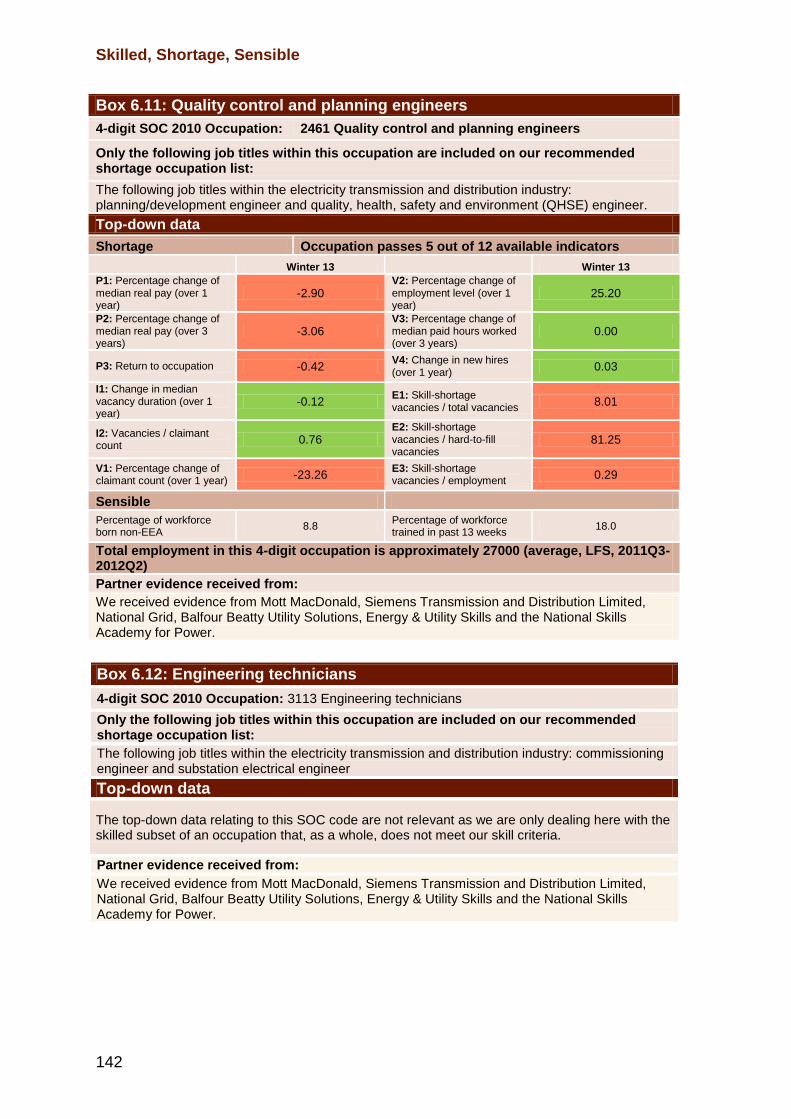
Skilled, Shortage, Sensible
142
Box 6.11: Quality control and planning engineers
4-digit SOC 2010 Occupation: 2461 Quality control and planning engineers
Only the following job titles within this occupation are included on our recommended shortage occupation list:
The following job titles within the electricity transmission and distribution industry: planning/development engineer and quality, health, safety and environment (QHSE) engineer.
Top-down data
Shortage Occupation passes 5 out of 12 available indicators
Winter 13 Winter 13
P1: Percentage change of median real pay (over 1 year)
-2.90 V2: Percentage change of employment level (over 1 year)
25.20
P2: Percentage change of median real pay (over 3 years)
-3.06 V3: Percentage change of median paid hours worked (over 3 years)
0.00
P3: Return to occupation -0.42 V4: Change in new hires (over 1 year)
0.03
I1: Change in median vacancy duration (over 1 year)
-0.12 E1: Skill-shortage vacancies / total vacancies
8.01
I2: Vacancies / claimant count
0.76 E2: Skill-shortage vacancies / hard-to-fill vacancies
81.25
V1: Percentage change of claimant count (over 1 year)
-23.26 E3: Skill-shortage vacancies / employment
0.29
Sensible
Percentage of workforce born non-EEA
8.8 Percentage of workforce trained in past 13 weeks
18.0
Total employment in this 4-digit occupation is approximately 27000 (average, LFS, 2011Q3-2012Q2)
Partner evidence received from:
We received evidence from Mott MacDonald, Siemens Transmission and Distribution Limited, National Grid, Balfour Beatty Utility Solutions, Energy & Utility Skills and the National Skills Academy for Power.
Box 6.12: Engineering technicians
4-digit SOC 2010 Occupation: 3113 Engineering technicians
Only the following job titles within this occupation are included on our recommended shortage occupation list:
The following job titles within the electricity transmission and distribution industry: commissioning engineer and substation electrical engineer
Top-down data
The top-down data relating to this SOC code are not relevant as we are only dealing here with the skilled subset of an occupation that, as a whole, does not meet our skill criteria.
Partner evidence received from:
We received evidence from Mott MacDonald, Siemens Transmission and Distribution Limited, National Grid, Balfour Beatty Utility Solutions, Energy & Utility Skills and the National Skills Academy for Power.
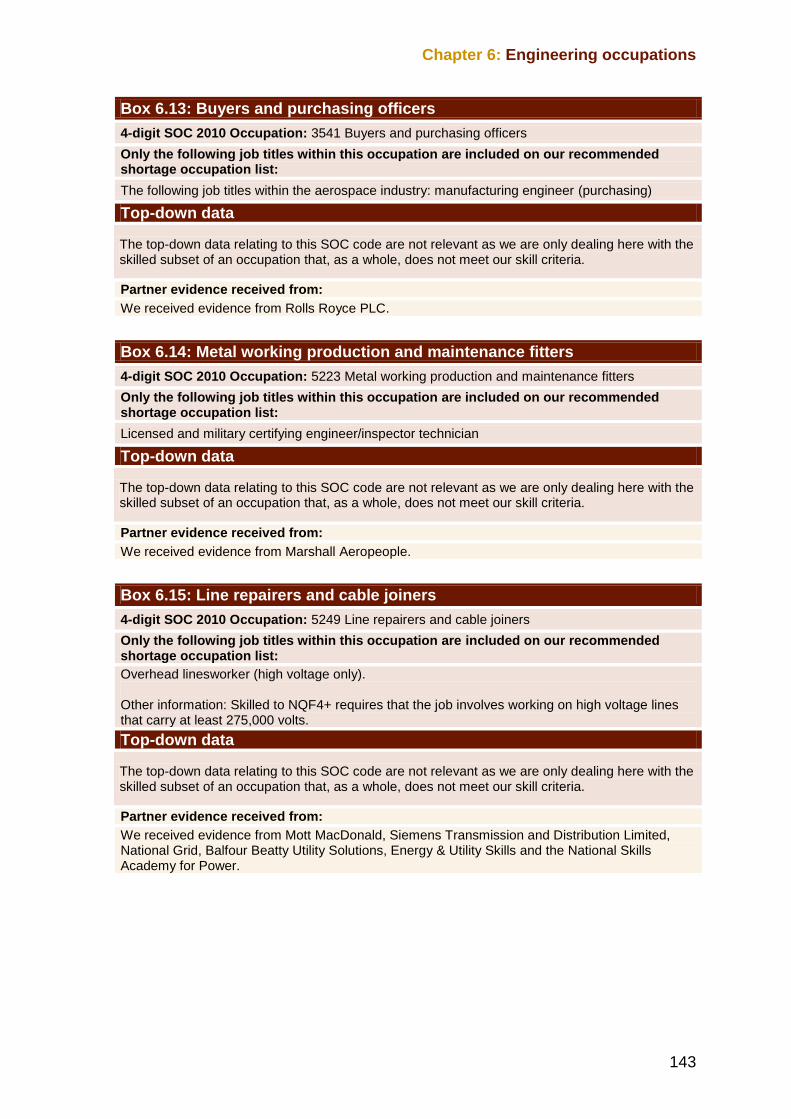
Chapter 6: Engineering occupations
143
Box 6.13: Buyers and purchasing officers
4-digit SOC 2010 Occupation: 3541 Buyers and purchasing officers
Only the following job titles within this occupation are included on our recommended shortage occupation list:
The following job titles within the aerospace industry: manufacturing engineer (purchasing)
Top-down data
The top-down data relating to this SOC code are not relevant as we are only dealing here with the skilled subset of an occupation that, as a whole, does not meet our skill criteria.
Partner evidence received from:
We received evidence from Rolls Royce PLC.
Box 6.14: Metal working production and maintenance fitters
4-digit SOC 2010 Occupation: 5223 Metal working production and maintenance fitters
Only the following job titles within this occupation are included on our recommended shortage occupation list:
Licensed and military certifying engineer/inspector technician
Top-down data
The top-down data relating to this SOC code are not relevant as we are only dealing here with the skilled subset of an occupation that, as a whole, does not meet our skill criteria.
Partner evidence received from:
We received evidence from Marshall Aeropeople.
Box 6.15: Line repairers and cable joiners
4-digit SOC 2010 Occupation: 5249 Line repairers and cable joiners
Only the following job titles within this occupation are included on our recommended shortage occupation list:
Overhead linesworker (high voltage only). Other information: Skilled to NQF4+ requires that the job involves working on high voltage lines that carry at least 275,000 volts.
Top-down data
The top-down data relating to this SOC code are not relevant as we are only dealing here with the skilled subset of an occupation that, as a whole, does not meet our skill criteria.
Partner evidence received from:
We received evidence from Mott MacDonald, Siemens Transmission and Distribution Limited, National Grid, Balfour Beatty Utility Solutions, Energy & Utility Skills and the National Skills Academy for Power.

145
7.1 Introduction
7.1 This chapter summarises the evidence and sets out our recommendations in relation to occupations outside the areas of health and engineering. Most of these occupations are presently represented on the UK shortage occupation list, but we also consider some occupations here for the first time.
7.2 The summaries of evidence and our consideration of it are grouped here in order of occupations and job titles we have not reviewed before, followed by occupations and job titles that we have reviewed before and are recommending for retention on the shortage list. We then review occupations and job titles that we are recommending for removal from the shortage occupation list and finally review those occupations and job titles for which we did not receive sufficiently strong evidence to recommend they be added to the list.
Chapter 7 Other occupations
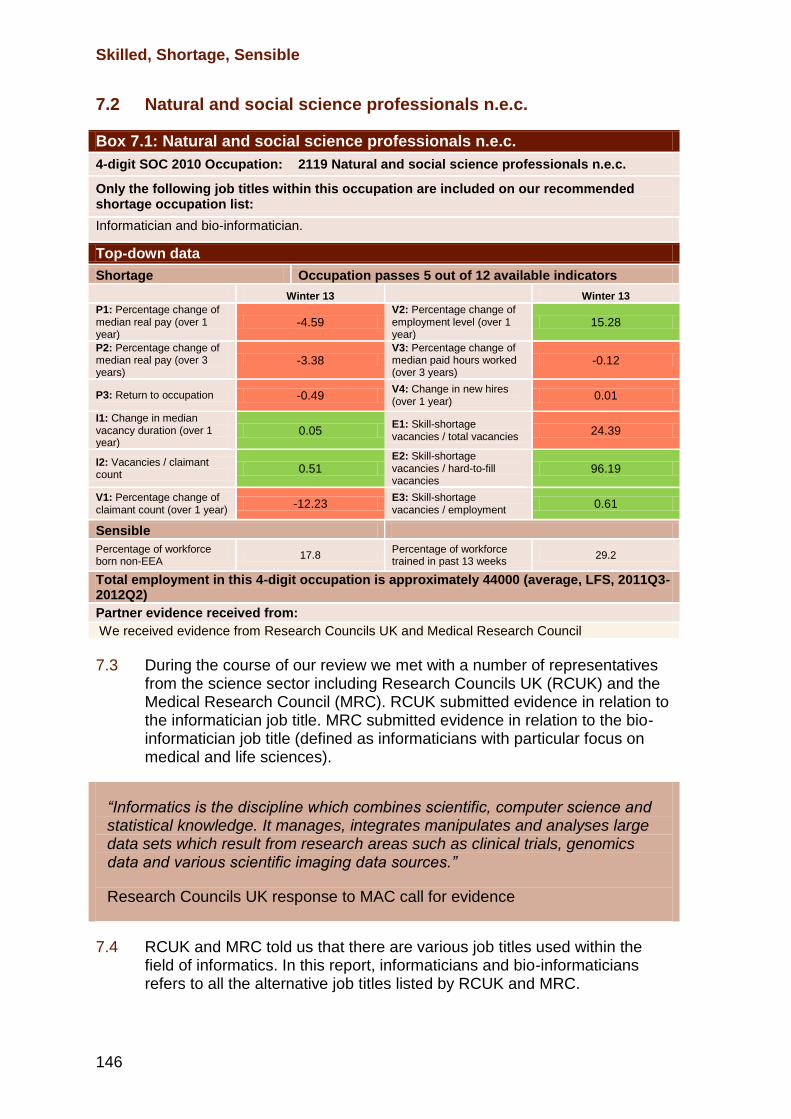
Skilled, Shortage, Sensible
146
7.2 Natural and social science professionals n.e.c.
Box 7.1: Natural and social science professionals n.e.c.
4-digit SOC 2010 Occupation: 2119 Natural and social science professionals n.e.c.
Only the following job titles within this occupation are included on our recommended shortage occupation list:
Informatician and bio-informatician.
Top-down data
Shortage Occupation passes 5 out of 12 available indicators
Winter 13 Winter 13
P1: Percentage change of median real pay (over 1 year)
-4.59 V2: Percentage change of employment level (over 1 year)
15.28
P2: Percentage change of median real pay (over 3 years)
-3.38 V3: Percentage change of median paid hours worked (over 3 years)
-0.12
P3: Return to occupation -0.49 V4: Change in new hires (over 1 year)
0.01
I1: Change in median vacancy duration (over 1 year)
0.05 E1: Skill-shortage vacancies / total vacancies
24.39
I2: Vacancies / claimant count
0.51 E2: Skill-shortage vacancies / hard-to-fill vacancies
96.19
V1: Percentage change of claimant count (over 1 year)
-12.23 E3: Skill-shortage vacancies / employment
0.61
Sensible
Percentage of workforce born non-EEA
17.8 Percentage of workforce trained in past 13 weeks
29.2
Total employment in this 4-digit occupation is approximately 44000 (average, LFS, 2011Q3-2012Q2)
Partner evidence received from:
We received evidence from Research Councils UK and Medical Research Council
7.3 During the course of our review we met with a number of representatives from the science sector including Research Councils UK (RCUK) and the Medical Research Council (MRC). RCUK submitted evidence in relation to the informatician job title. MRC submitted evidence in relation to the bio-informatician job title (defined as informaticians with particular focus on medical and life sciences).
“Informatics is the discipline which combines scientific, computer science and statistical knowledge. It manages, integrates manipulates and analyses large data sets which result from research areas such as clinical trials, genomics data and various scientific imaging data sources.”
Research Councils UK response to MAC call for evidence
7.4 RCUK and MRC told us that there are various job titles used within the field of informatics. In this report, informaticians and bio-informaticians refers to all the alternative job titles listed by RCUK and MRC.
Chapter 7: Other occupations
147
“Informatics is a developing field and there are various job titles used: informatician, computational scientist (including biologist, chemist, physicist, etc) sequencing data analyst, computer biologist, bio-statistician, scientific database curator, informatics engineer and lab information management system programmer.”
Research Councils UK response to MAC call for evidence
“Often used job titles are bio-informatician, statistical geneticist, neuroinformatician, health informatician, genome and next-generation sequencing data analyst, computer biologist, bio-statistician, scientific database curator, bio-informatics engineer, biosoftware support engineer, genome analyst and lab information management system programmer.”
Medical Research Council response to MAC call for evidence
7.5 RCUK and MRC told us that the job titles of informaticians and bio-informaticians best sit within the Standard Occupation Classification (SOC) occupation code 2119 natural and social science professionals not elsewhere classified (n.e.c.) which is skilled at National Qualifications Framework level 6 and above (NQF6+). Neither this occupation nor any of the job titles referred to by partners are currently on the shortage occupation list.
“…we believe that the most appropriate code of practice for the role is 2119 of the Office for National Statistics SOC 2010, with associated minimum salary levels for entry and experienced candidates linked to the standard salary within the occupation code.”
Research Councils UK response to MAC call for evidence
7.6 Our analysis of the top-down data indicates that natural and social science professionals n.e.c. pass 5 out of our 12 available indicators, suggesting that there is no overall shortage in this occupation. However, the evidence we received for this review primarily focussed on informaticians and bio-informaticians, which constitute only a small sub-set of workers employed in this occupation. Therefore, the top-down data relating to the entire occupation are only of limited use. Consequently, we gave greater weight to the bottom-up evidence we received from corporate partners.
7.7 RCUK provided evidence from a sample of 41 recruitment campaigns for informaticians held over the past 12 months.
Skilled, Shortage, Sensible
148
“..of these campaigns there were 10 unsuccessful campaigns, 7 migrant workers were recruited, and of the remainder there was an even split of UK and EEA nationals recruited into the roles. Overall a third of applicants were migrants.”
Research Councils UK response to MAC call for evidence
7.8 MRC also provided evidence from a sample of 24 recruitment campaigns for bio-informaticians since 2011. They reported that 10 recruitment campaigns had been unsuccessful. They further reported that only two migrant workers had successfully been recruited from these campaigns, which suggests that bio-informaticians are in short supply worldwide. Other evidence suggested that it might be at the more experienced end of this job title where supply is shortest. MRC told us that, for every early career stage (broadly speaking no more than three years post-PhD experience) post they advertise, they receive around 70 applications. However, when they advertise for later career stage posts (three years or more post-PhD) they receive only around 15 applications per advert, the majority of which come from non-European Economic Area (EEA) nationals. MRC argue that this indicates a shortage at the more senior levels of the profession which has long-term consequences.
“Problems in recruitment at the more senior end of the career path result in fewer „trainers‟ to educate and mentor the new intake of bio-informaticians, leading to a vicious circle of talent shortage.”
Medical Research Council response to MAC call for evidence
7.9 MRC told us that they were currently unable to fill three senior positions at their research institutes as there is strong competition among employers for such individuals, not only in the UK but globally. They said that the demand for bio-informaticians was forecast to increase over the next few years, creating further pressure on recruitment.
“By 2015 the Francis Crick Institute alone will need to recruit up to 100 bio-informaticians….at the same time….European Bioinformatics Institute will need to recruit in the order of 300 bio-informaticians..”
Medical Research Council response to MAC call for evidence
7.10 Turning to sensible, we were told that there are few conventional university programmes that teach informatics, save for a small number of master‟s courses. Despite this, RCUK and MRC told us that a number of programmes had been introduced to train resident workers in the skills required by the informatic sector. MRC in particular invest significant resources into this endeavour, for example by providing intense training in
Chapter 7: Other occupations
149
bio-informatics for up to 13 PhD students at any one time. Other bodies, such as the Wellcome Trust, the Biotechnological and Biological Sciences Research Council, and the Natural Environment Research Council, also invest significant resources into addressing the shortage of skills in this area.
7.11 Despite this investment, we were told that there remains a significant shortage in the area of informatics, and that such a shortage could not be alleviated in the short term. We were told that the need to acquire skilled informaticians and bio-informaticians was critical to the UK science sector‟s continued global competitiveness and success.
“The global scientific community is constantly creating and developing new techniques which RCUK, and the UK, also need to adopt to remain competitive and successful; this can only be done through collaborations and attracting international scientists to the UK.”
Research Councils UK response to MAC call for evidence
7.12 RCUK and MRC told us that the ability to recruit senior informaticians to educate and mentor those at the beginning of their career was crucial. A significant proportion of such individuals are non-EEA nationals.
“RCUK is committed to training and up-skilling resident workers…However, often the knowledge and skills required do not exist, or at least are not widely available, within the UK.”
Research Councils UK response to MAC call for evidence
7.13 We received some convincing evidence that there is a shortage of informaticians, although the evidence in relation to bio-informaticians was significantly stronger. Given the need for such senior informaticians, and the importance of the science sector to the UK more generally, we recommend that the job titles informatician and bio-informatician be included on the shortage occupation list.
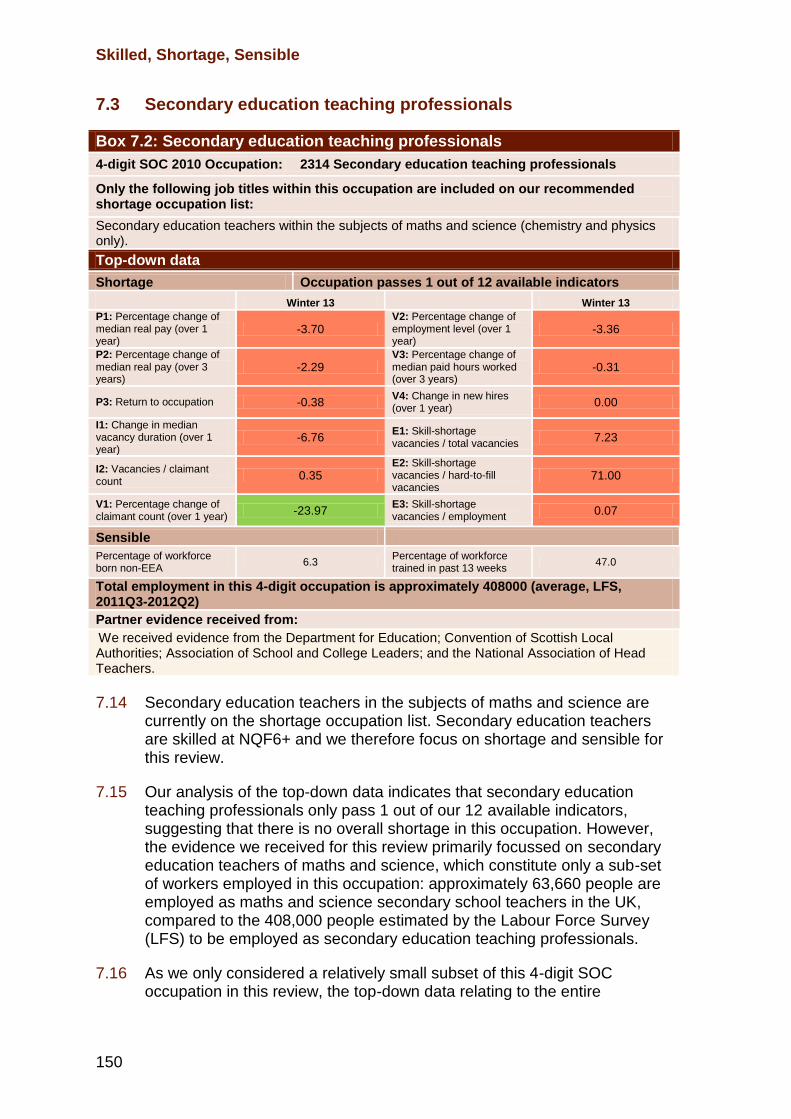
Skilled, Shortage, Sensible
150
7.3 Secondary education teaching professionals
Box 7.2: Secondary education teaching professionals
4-digit SOC 2010 Occupation: 2314 Secondary education teaching professionals
Only the following job titles within this occupation are included on our recommended shortage occupation list:
Secondary education teachers within the subjects of maths and science (chemistry and physics only).
Top-down data
Shortage Occupation passes 1 out of 12 available indicators
Winter 13 Winter 13
P1: Percentage change of median real pay (over 1 year)
-3.70 V2: Percentage change of employment level (over 1 year)
-3.36
P2: Percentage change of median real pay (over 3 years)
-2.29 V3: Percentage change of median paid hours worked (over 3 years)
-0.31
P3: Return to occupation -0.38 V4: Change in new hires (over 1 year)
0.00
I1: Change in median vacancy duration (over 1 year)
-6.76 E1: Skill-shortage vacancies / total vacancies
7.23
I2: Vacancies / claimant count
0.35 E2: Skill-shortage vacancies / hard-to-fill vacancies
71.00
V1: Percentage change of claimant count (over 1 year)
-23.97 E3: Skill-shortage vacancies / employment
0.07
Sensible
Percentage of workforce born non-EEA
6.3 Percentage of workforce trained in past 13 weeks
47.0
Total employment in this 4-digit occupation is approximately 408000 (average, LFS, 2011Q3-2012Q2)
Partner evidence received from:
We received evidence from the Department for Education; Convention of Scottish Local Authorities; Association of School and College Leaders; and the National Association of Head Teachers.
7.14 Secondary education teachers in the subjects of maths and science are currently on the shortage occupation list. Secondary education teachers are skilled at NQF6+ and we therefore focus on shortage and sensible for this review.
7.15 Our analysis of the top-down data indicates that secondary education teaching professionals only pass 1 out of our 12 available indicators, suggesting that there is no overall shortage in this occupation. However, the evidence we received for this review primarily focussed on secondary education teachers of maths and science, which constitute only a sub-set of workers employed in this occupation: approximately 63,660 people are employed as maths and science secondary school teachers in the UK, compared to the 408,000 people estimated by the Labour Force Survey (LFS) to be employed as secondary education teaching professionals.
7.16 As we only considered a relatively small subset of this 4-digit SOC occupation in this review, the top-down data relating to the entire
Chapter 7: Other occupations
151
occupation are of limited use. Consequently, we gave greater weight to the bottom-up evidence we received from corporate partners.
7.17 During the course of our review we met with a number of representatives from the education sector, including the Department for Education (DfE). We were told that there is not an overall shortage of teachers, but that there remains a shortage of secondary school teachers in the subjects of maths and science. In the subject of science, DfE confirmed that shortages exist in relation to the particular fields of chemistry and physics.
7.18 DfE told us that the November 2011 School Workforce Census showed that the full time vacancy rate in publicly-funded secondary schools and academies was 0.3 per cent. The majority of such vacancies were being filled by a teacher on a temporary contract of at least a term, but less than one year.
7.19 We were told that vacancy rates for maths teachers remain above average for all secondary subjects, at 0.5 per cent. In addition, we were told that the shortage of qualified maths teachers is greater than the vacancy rates suggest because a number of posts are being filled by teachers who do not have a maths specialism. DfE told us that almost 16 per cent of maths lessons were taught by teachers with no relevant qualifications.
“16% of total mathematics teaching time was by a teacher who did not hold a post A-level qualification in a relevant subject.”
Department for Education response to MAC call for evidence
7.20 DfE told us that the vacancy rate for science teachers was only slightly above that of the average for all secondary subjects, at 0.4 per cent. DfE also told us that teachers of physics and chemistry were less likely to hold a relevant qualification than teachers of other science subjects: around 24 per cent of physics lessons and around 18 per cent of chemistry lessons were taught by teachers with no relevant qualifications.
“33% of physics teachers and 25% of chemistry teachers did not hold a post A-level qualification in a relevant subject.”
Department for Education response to MAC call for evidence
7.21 DfE told us that projected pupil numbers are likely to exacerbate the demand for secondary school teachers in the subjects of maths and science. We were told that pupil numbers in maintained nursery and state-funded primary schools are projected to be 18 per cent higher in 2020 than in 2012. Although state-funded secondary school pupil numbers have been declining since 2004, it is expected that this situation will be reversed from 2015 as the increased primary school pupil numbers flow through into secondary schools.
Skilled, Shortage, Sensible
152
7.22 DfE also told us that there will also be increased demand for secondary school teachers in the subjects of maths and science due to policy changes. They told us that from September 2013, students between the ages of 16 and 19 will be required to study towards maths GCSE grades A* to C if they have not already achieved this by the age of 16. DfE told us that initial findings estimate that there would need to be an extra 1,300 maths teachers from September 2013 to meet this demand.
7.23 In addition, DfE told us that the Government intends to encourage those students who have obtained maths GCSE by the age of 16 to continue to study maths beyond the age of 16. Initial estimates by DfE are that 3,500 additional maths teachers would be required to meet this demand.
7.24 The National Association of Head Teachers support DfE‟s argument that the demand for teachers is likely to increase, particularly given the increase in the school leaving age to 18 and other policy changes.
“The fact that students will be required to study maths until they leave school will increase the pressure on recruitment in a subject area where there is a current shortage. In addition the English Baccalaureate will require the teaching of science as a discrete subject. Currently it is common practice in secondary schools for biology specialists to teach chemistry or physics.”
National Association of Head Teachers response to MAC call for evidence
7.25 DfE told us that they continuously monitor and model teacher demand to ascertain the number of teachers that are expected to be required in future years. From this modelling, DfE set targets for initial teacher training (ITT) recruitments. DfE told us that 2009/10 was the first year in which the maths ITT target was met. However, they argued that this was largely due to wider economic factors - the recession and relatively high graduate unemployment rates and would be difficult to sustain as the economy recovered.
“The Teaching Agency Trainee Number Census indicates that for entry to ITT 2012/13, all subjects are likely to reach or exceed their targets apart from mathematics (95%) and physics (97%).”
Department for Education response to MAC call for evidence
7.26 Turning to sensible, we understand that if a school is unable to appoint a suitably qualified teacher the vacancy is filled either by using teachers without a specialism in the subject they teach, or by using supply teachers to fill the post temporarily. DfE said these measures risk undermining the quality of education that pupils receive.
Chapter 7: Other occupations
153
7.27 The Association of School and College Leaders support this view, particularly with regard to the subjects of maths and science, which can have-long term ramifications.
“…there is a vicious cycle operating by which relatively poor teaching of these subjects can lead to a continuation of a poor supply of newly qualified teachers.”
Association of School and College Leaders response to MAC call for evidence
7.28 DfE told us that new programmes to attract talented graduates into teaching had been, or would soon be, introduced, with increased focus on, and funding for, teachers of shortage subjects. In addition, DfE is underpinning efforts to attract highly-qualified individuals from other professions into teaching, including those from the armed services.
7.29 Taking account of the importance of having the right teachers available in secondary schools, and the likelihood that demand for maths and science teachers will increase from summer 2013, together with the importance of ensuring effective teaching of science, technology, engineering and mathematics as highlighted by partners in other evidence to us, we are content that secondary education teaching professionals in the subjects of maths and science (chemistry and physics only) be recommended for retention on the shortage occupation list.
7.4 Special needs education teaching professionals
7.30 We reviewed this occupation in Migration Advisory Committee(2009a) and found the evidence we received to be strong enough for us to recommend that all teaching posts in special schools be included on the shortage occupation list. When we reviewed this occupation in Migration Advisory Committee (20011a) we found the evidence less compelling. Nevertheless, in light of the important service provided by special schools, we recommended that all teaching posts in special schools be retained on the shortage occupation list.
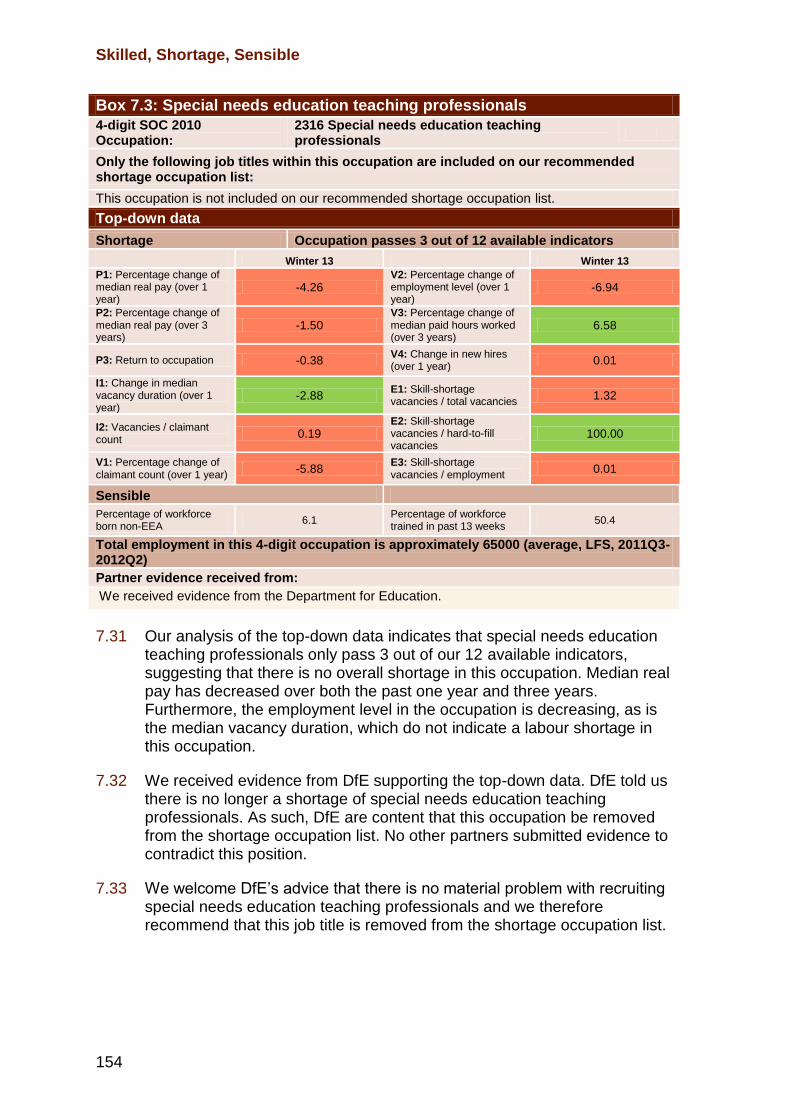
Skilled, Shortage, Sensible
154
Box 7.3: Special needs education teaching professionals
4-digit SOC 2010 Occupation:
2316 Special needs education teaching professionals
Only the following job titles within this occupation are included on our recommended shortage occupation list:
This occupation is not included on our recommended shortage occupation list.
Top-down data
Shortage Occupation passes 3 out of 12 available indicators
Winter 13 Winter 13
P1: Percentage change of median real pay (over 1 year)
-4.26 V2: Percentage change of employment level (over 1 year)
-6.94
P2: Percentage change of median real pay (over 3 years)
-1.50 V3: Percentage change of median paid hours worked (over 3 years)
6.58
P3: Return to occupation -0.38 V4: Change in new hires (over 1 year)
0.01
I1: Change in median vacancy duration (over 1 year)
-2.88 E1: Skill-shortage vacancies / total vacancies
1.32
I2: Vacancies / claimant count
0.19 E2: Skill-shortage vacancies / hard-to-fill vacancies
100.00
V1: Percentage change of claimant count (over 1 year)
-5.88 E3: Skill-shortage vacancies / employment
0.01
Sensible
Percentage of workforce born non-EEA
6.1 Percentage of workforce trained in past 13 weeks
50.4
Total employment in this 4-digit occupation is approximately 65000 (average, LFS, 2011Q3-2012Q2)
Partner evidence received from:
We received evidence from the Department for Education.
7.31 Our analysis of the top-down data indicates that special needs education teaching professionals only pass 3 out of our 12 available indicators, suggesting that there is no overall shortage in this occupation. Median real pay has decreased over both the past one year and three years. Furthermore, the employment level in the occupation is decreasing, as is the median vacancy duration, which do not indicate a labour shortage in this occupation.
7.32 We received evidence from DfE supporting the top-down data. DfE told us there is no longer a shortage of special needs education teaching professionals. As such, DfE are content that this occupation be removed from the shortage occupation list. No other partners submitted evidence to contradict this position.
7.33 We welcome DfE‟s advice that there is no material problem with recruiting special needs education teaching professionals and we therefore recommend that this job title is removed from the shortage occupation list.
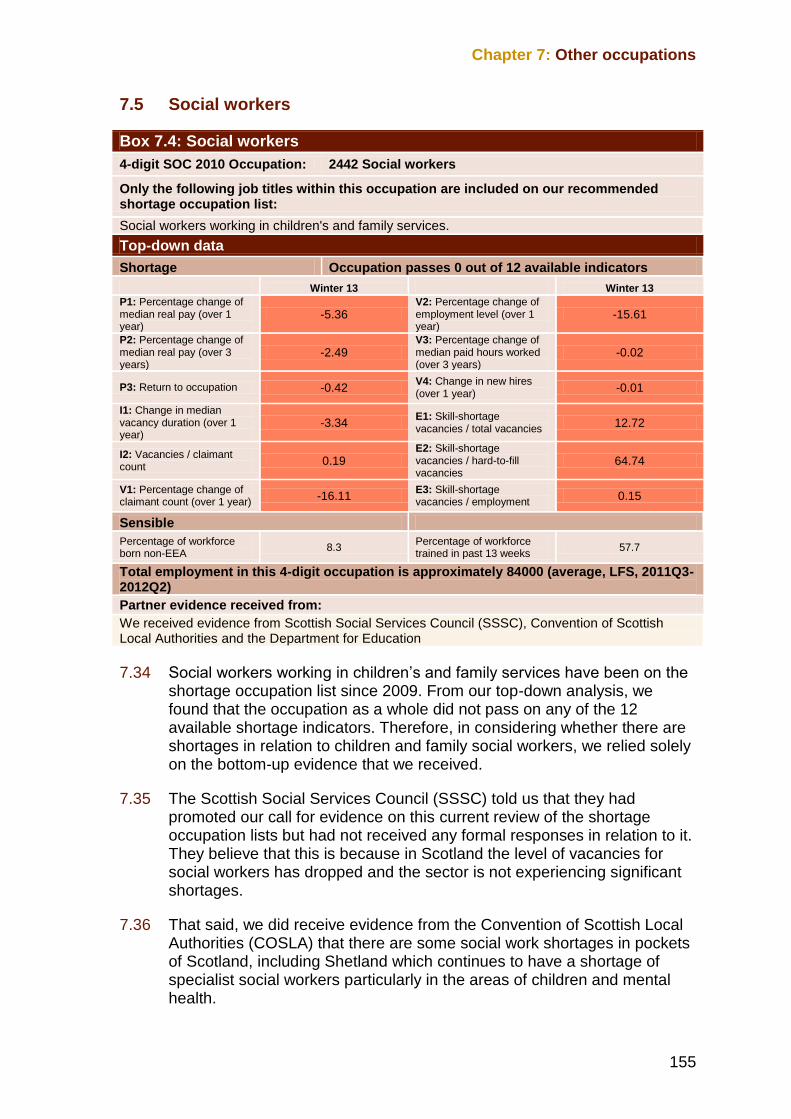
Chapter 7: Other occupations
155
7.5 Social workers
Box 7.4: Social workers
4-digit SOC 2010 Occupation: 2442 Social workers
Only the following job titles within this occupation are included on our recommended shortage occupation list:
Social workers working in children's and family services.
Top-down data
Shortage Occupation passes 0 out of 12 available indicators
Winter 13 Winter 13
P1: Percentage change of median real pay (over 1 year)
-5.36 V2: Percentage change of employment level (over 1 year)
-15.61
P2: Percentage change of median real pay (over 3 years)
-2.49 V3: Percentage change of median paid hours worked (over 3 years)
-0.02
P3: Return to occupation -0.42 V4: Change in new hires (over 1 year)
-0.01
I1: Change in median vacancy duration (over 1 year)
-3.34 E1: Skill-shortage vacancies / total vacancies
12.72
I2: Vacancies / claimant count
0.19 E2: Skill-shortage vacancies / hard-to-fill vacancies
64.74
V1: Percentage change of claimant count (over 1 year)
-16.11 E3: Skill-shortage vacancies / employment
0.15
Sensible
Percentage of workforce born non-EEA
8.3 Percentage of workforce trained in past 13 weeks
57.7
Total employment in this 4-digit occupation is approximately 84000 (average, LFS, 2011Q3-2012Q2)
Partner evidence received from:
We received evidence from Scottish Social Services Council (SSSC), Convention of Scottish Local Authorities and the Department for Education
7.34 Social workers working in children‟s and family services have been on the shortage occupation list since 2009. From our top-down analysis, we found that the occupation as a whole did not pass on any of the 12 available shortage indicators. Therefore, in considering whether there are shortages in relation to children and family social workers, we relied solely on the bottom-up evidence that we received.
7.35 The Scottish Social Services Council (SSSC) told us that they had promoted our call for evidence on this current review of the shortage occupation lists but had not received any formal responses in relation to it. They believe that this is because in Scotland the level of vacancies for social workers has dropped and the sector is not experiencing significant shortages.
7.36 That said, we did receive evidence from the Convention of Scottish Local Authorities (COSLA) that there are some social work shortages in pockets of Scotland, including Shetland which continues to have a shortage of specialist social workers particularly in the areas of children and mental health.
Skilled, Shortage, Sensible
156
7.37 We received evidence from DfE that there are approximately 85,000 social workers in England. We were told that 70 per cent of these are employed by local authorities, 6 per cent are employed in the independent sector, 6 per cent work for employment agencies, and a small number are employed by other bodies. DfE said there has been a reduction in the vacancy rate for children and family social workers, from about 10 per cent in 2010 to approximately 6 per cent in 2011. DfE explained that this reduction has been achieved despite an increase in the demand for children‟s services. We were told that in 2010/11 615,000 children were referred to children‟s social care, compared to 603,500 in 2009/10.
“This increase in demand continues to place significant pressure on recruitment activities. We need a reasonable supply of social workers now so that we can address the longer term challenges of developing a sufficient supply in the future in England.”
Department of Education response to MAC call for evidence
7.38 As in previous reviews, we were again told about an ageing workforce amongst children and family social workers. We received evidence that one in six social workers are over 55 and are therefore approaching retirement.
7.39 We saw that compulsory returns on the workforce are unlikely to be available until 2013 which means data are limited. The DfE said it relies on evidence offered, for example, from local authorities, which points to the need to retain children and family social workers on the MAC recommended shortage occupation list for least another two years. This, we were told, would allow time for the current cohort of newly qualified social workers to become sufficiently experienced to take on the requisite roles.
“Feedback from local authorities confirms that a larger pool of experienced workers needs to be developed and sustained until such time as structural reform encourages social workers to remain longer at the front line. Overall therefore the availability of experienced labour remain a preoccupation for employers.”
Department of Education response to MAC call for evidence
7.40 Turning to sensible, we received evidence about the work being done to increase the skills and capacity of the workforce, including part-time training for those who want to progress into social work. We were also told about the continued rise in the number of applicants to relevant degree courses. The DfE reported that employers and senior managers continue to support projects which have long-term aims of increasing both the quality and retention of staff. However, they emphasised that in the
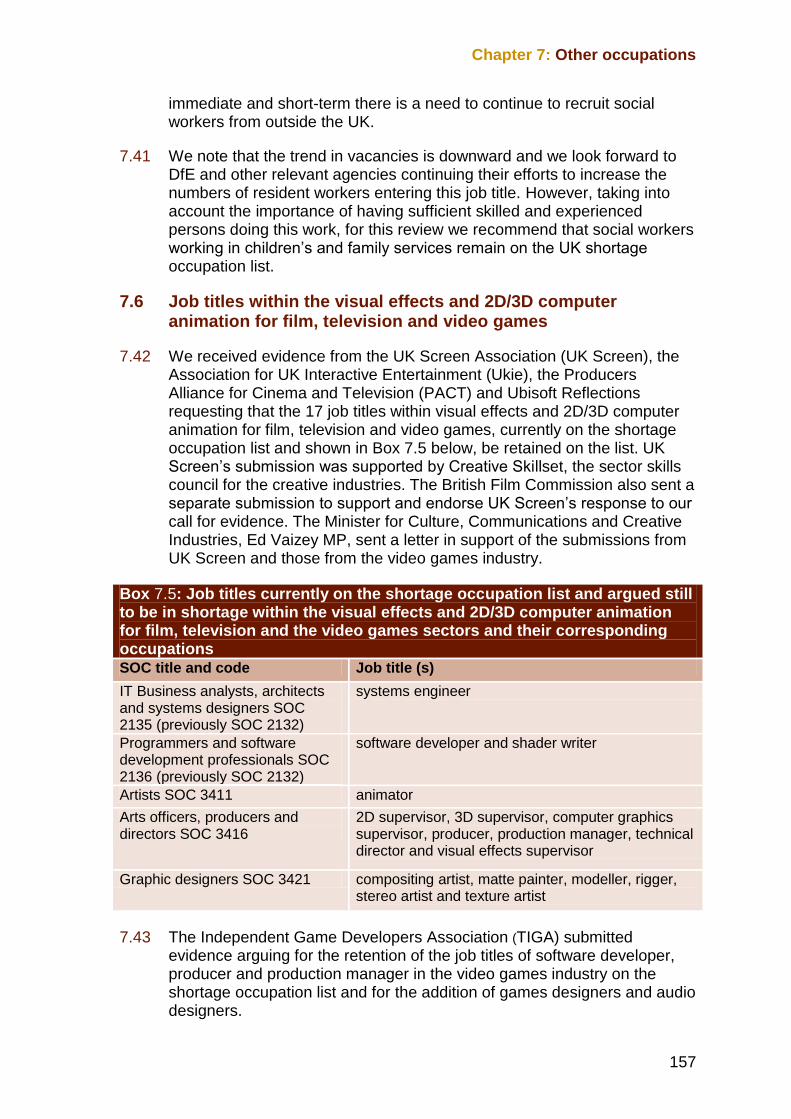
Chapter 7: Other occupations
157
immediate and short-term there is a need to continue to recruit social workers from outside the UK.
7.41 We note that the trend in vacancies is downward and we look forward to DfE and other relevant agencies continuing their efforts to increase the numbers of resident workers entering this job title. However, taking into account the importance of having sufficient skilled and experienced persons doing this work, for this review we recommend that social workers working in children‟s and family services remain on the UK shortage occupation list.
7.6 Job titles within the visual effects and 2D/3D computer animation for film, television and video games
7.42 We received evidence from the UK Screen Association (UK Screen), the Association for UK Interactive Entertainment (Ukie), the Producers Alliance for Cinema and Television (PACT) and Ubisoft Reflections requesting that the 17 job titles within visual effects and 2D/3D computer animation for film, television and video games, currently on the shortage occupation list and shown in Box 7.5 below, be retained on the list. UK Screen‟s submission was supported by Creative Skillset, the sector skills council for the creative industries. The British Film Commission also sent a separate submission to support and endorse UK Screen‟s response to our call for evidence. The Minister for Culture, Communications and Creative Industries, Ed Vaizey MP, sent a letter in support of the submissions from UK Screen and those from the video games industry.
Box 7.5: Job titles currently on the shortage occupation list and argued still to be in shortage within the visual effects and 2D/3D computer animation for film, television and the video games sectors and their corresponding occupations SOC title and code Job title (s)
IT Business analysts, architects and systems designers SOC 2135 (previously SOC 2132)
systems engineer
Programmers and software development professionals SOC 2136 (previously SOC 2132)
software developer and shader writer
Artists SOC 3411 animator
Arts officers, producers and directors SOC 3416
2D supervisor, 3D supervisor, computer graphics supervisor, producer, production manager, technical director and visual effects supervisor
Graphic designers SOC 3421 compositing artist, matte painter, modeller, rigger, stereo artist and texture artist
7.43 The Independent Game Developers Association (TIGA) submitted evidence arguing for the retention of the job titles of software developer, producer and production manager in the video games industry on the shortage occupation list and for the addition of games designers and audio designers.
Skilled, Shortage, Sensible
158
7.44 On skill, ten of the job titles put forward to be retained on the shortage occupation list are in occupations that are skilled at NQF6+. The job title of games designer which has been put forward to be added to the list is in occupation SOC 2136 programmers and software development professionals, which is also skilled at NQF6+.
7.45 Seven of the job titles, detailed in Box 7.5 above, fall within two separate occupations, SOC 3411 artists and SOC 3421 graphic designers, which are not skilled at NQF6+. However, as these job titles are already included on the shortage occupation list the issue of skill is not relevant, as per our commission from the Government.
7.46 We did receive some evidence from UK Screen and TIGA in support of these seven job titles being skilled to NQF6+ and discuss this evidence here.
7.47 UK Screen provided salary data from nine leading VFX companies, showing that the average minimum hourly rate paid for each of these seven job titles was higher than the pass mark for our threshold for NQF6+ occupations of £14.75 per hour.
7.48 We were told that five of the largest VFX companies are confident that between 85 per cent and 100 per cent of their current employees in these job titles are skilled to NQF6. TIGA told us that research they carried out based on surveys of UK games companies, showed that eighty per cent of all workers in the electronic games industry are qualified to degree level or above. The top-down data produced for Migration Advisory Committee (2012b) found the occupations of 3411 artists and 3421 graphic designers, as a whole, both pass the qualifications threshold for NQF6+, by having 74 and 52 per cent of workers respectively skilled at this level. However, this is the only skill indicator out of three MAC indicators that these two occupations pass.
7.49 Partners told us that innate ability is particularly important for these artistic roles and that during the recruitment process greater emphasis is often put on show reels and portfolio work rather than an individual‟s qualifications and CV. We met with representatives from the film industry to better understand the nature of the skills required and how these have developed over the period we have been reviewing the shortage list. We also visited Double Negative, a visual effects company, to watch relevant staff work on “Rush”, a film by Ron Howard. We saw how the artist needed to have not only artistic skills but also a working knowledge of physics. We saw a demonstration of how the visual effect of an explosion is created where it is crucial that the transition between filmed photography and simulation is seamless. An understanding of the physics of explosions, together with artistic interpretation and an ability to apply the technology was necessary to successfully execute the effect.
7.50 The evidence we received on skill was mainly in relation to the film and television industry. The information on pay was not comprehensive enough for us to determine a pay threshold which would define these job titles as
Chapter 7: Other occupations
159
skilled at NQF6+ across the whole sector. Therefore, for this review we consider the evidence on shortage and sensible in respect of these seven job titles as skilled at NQF4.
7.51 The job title of audio designer, put forward by TIGA for addition to the list, falls within SOC code 3417 photographers, audio-visual and broadcasting equipment operators which is only skilled at NQF3. We did not receive sufficient evidence on skill to convince us that this job title is skilled to NQF6+.
7.52 We now look at the issue of shortage. The top-down data on shortage for the three NQF6+ occupations are presented in boxes 7.6, 7.7 and 7.8 below. We do not have top-down data for the two occupations below NQF6 and identified in boxes 7.9 and 7.10 below.
Box 7.6: IT business analysts, architects and systems designers
4-digit SOC 2010 Occupation:
2135 IT business analysts, architects and systems designers
Only the following job titles within this occupation are included on our recommended shortage occupation list:
The following job title within visual effects and 2D/3D computer animation for film, television or video games sectors: systems engineer.
Top-down data
Shortage Occupation passes 3 out of 12 available indicators
Winter 13 Winter 13
P1: Percentage change of median real pay (over 1 year)
-4.67 V2: Percentage change of employment level (over 1 year)
-3.93
P2: Percentage change of median real pay (over 3 years)
-6.46 V3: Percentage change of median paid hours worked (over 3 years)
-0.11
P3: Return to occupation -0.17 V4: Change in new hires (over 1 year)
0.00
I1: Change in median vacancy duration (over 1 year)
-2.58 E1: Skill-shortage vacancies / total vacancies
30.93
I2: Vacancies / claimant count
0.21 E2: Skill-shortage vacancies / hard-to-fill vacancies
100.00
V1: Percentage change of claimant count (over 1 year)
-11.23 E3: Skill-shortage vacancies / employment
0.65
Sensible
Percentage of workforce born non-EEA
12.1 Percentage of workforce trained in past 13 weeks
23.4
Total employment in this 4-digit occupation is approximately 90000 (average, LFS, 2011Q3-2012Q2)
Partner evidence received from:
We received evidence from UK Screen Association (UK Screen), the Association for UK Interactive Entertainment (Ukie), The Independent Game Developers Association (TIGA), Ubisoft Reflections, the Producers Alliance for Cinema and Television (PACT), the British Film Commission and the Minister for Culture, Communications and Creative Industries, Ed Vaizey MP.
Skilled, Shortage, Sensible
160
Box 7.7: Programmers and software development professionals
4-digit SOC 2010 Occupation:
2136 Programmers and software development professionals
Only the following job titles within this occupation are included on our recommended shortage occupation list:
The following job titles within visual effects and 2D/3D computer animation for film, television or video games sectors: software developer, shader writer and games designer.
Top-down data
Shortage Occupation passes 3 out of 12 available indicators
Winter 13 Winter 13
P1: Percentage change of median real pay (over 1 year)
-3.98 V2: Percentage change of employment level (over 1 year)
6.08
P2: Percentage change of median real pay (over 3 years)
-5.15 V3: Percentage change of median paid hours worked (over 3 years)
0.00
P3: Return to occupation -0.25 V4: Change in new hires (over 1 year)
0.01
I1: Change in median vacancy duration (over 1 year)
-1.64 E1: Skill-shortage vacancies / total vacancies
25.90
I2: Vacancies / claimant count
0.25 E2: Skill-shortage vacancies / hard-to-fill vacancies
81.96
V1: Percentage change of claimant count (over 1 year)
-11.70 E3: Skill-shortage vacancies / employment
0.57
Sensible
Percentage of workforce born non-EEA
19.7 Percentage of workforce trained in past 13 weeks
19.8
Total employment in this 4-digit occupation is approximately 227000 (average, LFS, 2011Q3-2012Q2)
Partner evidence received from:
We received evidence from UK Screen Association (UK Screen), the Association for UK Interactive Entertainment (Ukie), The Independent Game Developers Association (TIGA), Ubisoft Reflections, the Producers Alliance for Cinema and Television (PACT), the British Film Commission and the Minister for Culture, Communications and Creative Industries, Ed Vaizey MP.
Chapter 7: Other occupations
161
Box 7.8: Arts officers, producers and directors
4-digit SOC 2010 Occupation: 3416 Arts officers, producers and directors
Only the following job titles within this occupation are included on our recommended shortage occupation list:
The following job titles within visual effects and 2D/3D computer animation for film, television or video games sectors: 2D supervisor, 3D supervisor, computer graphics supervisor, producer, production manager, technical director and visual effects supervisor.
Top-down data
Shortage Occupation passes 1 out of 12 available indicators
Winter 13 Winter 13
P1: Percentage change of median real pay (over 1 year)
-4.64 V2: Percentage change of employment level (over 1 year)
-13.95
P2: Percentage change of median real pay (over 3 years)
-6.94 V3: Percentage change of median paid hours worked (over 3 years)
-0.12
P3: Return to occupation -0.42 V4: Change in new hires (over 1 year)
-0.02
I1: Change in median vacancy duration (over 1 year)
-10.57 E1: Skill-shortage vacancies / total vacancies
11.23
I2: Vacancies / claimant count
0.02 E2: Skill-shortage vacancies / hard-to-fill vacancies
100.00
V1: Percentage change of claimant count (over 1 year)
-10.96 E3: Skill-shortage vacancies / employment
0.08
Sensible
Percentage of workforce born non-EEA
9.0 Percentage of workforce trained in past 13 weeks
11.1
Total employment in this 4-digit occupation is approximately 63000 (average, LFS, 2011Q3-2012Q2)
Partner evidence received from:
We received evidence from UK Screen Association (UK Screen), the Association for UK Interactive Entertainment (Ukie), The Independent Game Developers Association (TIGA), Ubisoft Reflections, the Producers Alliance for Cinema and Television (PACT), the British Film Commission and the Minister for Culture, Communications and Creative Industries, Ed Vaizey MP.
Skilled, Shortage, Sensible
162
Box 7.9: Artists
4-digit SOC 2010 Occupation: 3411 Artists
Only the following job titles within this occupation are included on our recommended shortage occupation list:
Animator within visual effects and 2D/3D computer animation for film, television and video games.
Top-down data
The top-down data relating to this SOC code are not relevant as we are only dealing here with the skilled subset of an occupation that, as a whole, does not meet our skill criteria.
Partner evidence received from:
We received evidence from UK Screen Association (UK Screen), the Association for UK Interactive Entertainment (Ukie), The Independent Game Developers Association (TIGA), Ubisoft Reflections, the Producers Alliance for Cinema and Television (PACT), the British Film Commission and the Minister for Culture, Communications and Creative Industries, Ed Vaizey MP.
Box 7.10: Graphic designers
4-digit SOC 2010 Occupation: 3421 Graphic designers
Only the following job titles within this occupation are included on our recommended shortage occupation list:
Compositing artist, matte painter, modeller, rigger, stereo artist and texture artist within visual effects and 2D/3D computer animation for film, television and video games.
Top-down data
The top-down data relating to this SOC code are not relevant as we are only dealing here with the skilled subset of an occupation that, as a whole, does not meet our skill criteria.
Partner evidence received from:
We received evidence from UK Screen Association (UK Screen), the Association for UK Interactive Entertainment (Ukie), The Independent Game Developers Association (TIGA), Ubisoft Reflections, the Producers Alliance for Cinema and Television (PACT), the British Film Commission and the Minister for Culture, Communications and Creative Industries, Ed Vaizey MP.
7.53 Information contained in tables 7.6, 7.7 and 7.8 above shows that two of the NQF6+ occupations only pass 3 out of our 12 shortage indicators and the other one only passes 1 out of the 12. However, all of the job titles we are reviewing in this section comprise only a part of their respective parent occupations. Consequently, our top-down indicators are of limited relevance. We therefore focus instead on the evidence received from partners.
7.54 UK Screen told us that visual effects (VFX) and graphic design is one of the fastest growing service elements of the UK‟s film and television industries. They explained that the UK is a recognised global centre of excellence and is acknowledged as one of the most important locations for the production of high-end, sophisticated VFX work that is increasingly being used in films, television and commercials. UK VFX companies have to compete with rival production companies around the world for high volumes of inward investment work. VFX is a relatively new industry which has experienced rapid increases in demand and because the technology
Chapter 7: Other occupations
163
required is continually being updated, VFX companies have to compete globally for a limited number of highly-skilled individuals to carry out this work. We were told that the shortage of experienced, skilled workers is also a global one.
“The explosive growth in world-wide demand for VFX means that UK companies are compelled to compete internationally to gain access to the very limited pool of intensively skilled and highly experienced labour necessary both to deliver large projects and train junior staff.”
UK Screen Association response to MAC call for evidence
7.55 UK Screen explained that the VFX industry is cyclical with large peaks and troughs. A large number of staff are recruited on a project-by-project basis on fixed-term contracts rather than being permanent staff. The ability to recruit the appropriately skilled staff quickly is vital to ensure the success of the project and to secure future work. Ukie told us that the video games sector relies on the technical and creative talent of the individuals employed and that therefore competition is fierce to secure the best individuals from around the world.
“If there is any question as to whether the UK VFX industry has the capacity and appropriate talent available to deliver these projects, we are immediately placed at a disadvantage against our competitors.”
British Film Commission responses to MAC call for evidence
7.56 The Chancellor announced in his Autumn Statement that the UK Government plans to introduce tax relief on computer games, high-end television production and animation from April 2013. The British Film Association, TIGA, Ubisoft Reflections and UK Screen all told us that this tax relief would facilitate the continued growth of visual effects in the film, television and computer games industries and therefore increase the demand for skilled labour to work in this sector. Ukie told us that, following the announcement of this tax relief, companies such as Activision, Microsoft and Sony all have plans to open new studios in the UK.
“Initial estimates suggest that a high-end television tax relief could bring in £350m per year of additional drama production spend – boosting the UK economy by around £1bn annually.”
UK Screen Association response to the MAC call for evidence
Skilled, Shortage, Sensible
164
“....if more games are to be developed in the UK .....further easing of availability of skilled workers, potentially from outside the EEA will be required to meet increased demand.”
Ubisoft Reflections response to the MAC call for evidence
7.57 Partners highlighted the findings of the Next Generation report (Livingstone and Hope, 2011) which said that UK university courses were not equipping graduates with the skills necessary for them to become immediately effective in the visual effects and computer games industries. The report emphasised the deficiencies in the current education and higher education systems, which it said did not adequately train graduates for careers in the industry. The inadequacy of UK university courses was cited as a contributory factor to skills shortages in the evidence received from TIGA, Ubisoft Reflections and UK Screen.
7.58 Both TIGA and Ubisoft Reflections stated that university courses designed to equip students to work in the games sector came into existence around six years ago so graduates with relevant skills have been entering the jobs market for the past three years. However, we were told that games designers need years of experience to contribute effectively. To work at senior or lead games designer level an individual would need around ten years‟ industry experience.
“Games degrees and education generally can only take an individual so far......Many triple AAA titles can take around 4 years to develop, so to experience a whole development cycle, it takes that long just to become familiar with the process of making games.”
The Independent Game Developers Association (TIGA) response to the MAC call for evidence
7.59 UK Screen also stressed the importance of experience in the industry. They told us that new graduates are not usually industry-ready and that individuals normally enter as runners to familiarise themselves with the industry. After a year as runners they move into junior VFX roles such as matchmove or roto artist and spend around two and a half years in this position before moving into a mid-level VFX role. Progression from mid to senior level roles will take a least another five years. We were told that VFX companies do recruit directly from universities and that in the last 12 months four of the leading VFX companies had taken on 137 graduates but that typically graduates make up less than ten per cent of the workforce. This is because the industry demands a high proportion of experienced, skilled workers to complete work to the high standards required. We were told that Tier 2 is not used to recruit staff into junior roles.
Chapter 7: Other occupations
165
7.60 UK Screen annual VFX salary survey data showed that, for three out of five of the leading VFX companies, average salaries for non-EEA workers were higher than for the rest of the workforce suggesting that migrant workers brought in via Tier 2 are more highly skilled than the resident workforce. Data from one company showed various salary increases of between seven and twenty-eight per cent between 2011 and 2012 for the job titles of animator, computer graphics supervisor, texture artist, shader writer, 2D supervisor, VFX supervisor, compositor and producer.
7.61 TIGA told us that shortages in the games sector had been exacerbated by talented staff leaving the UK and that 41 per cent of job losses in the UK games industry between 2009 and 2011 were due to staff relocating overseas to countries such as Canada and the United States.
7.62 A TIGA survey of 104 games businesses (out of a total of 550 in the UK) in 2011 showed that 36 studios had experienced difficulties in filling vacancies over the previous 12 months. Forty-four per cent of these businesses named games designers as one of these hard-to-fill positions.
7.63 Evidence from UK Screen showed increased levels of costs for both recruitment and training over the last few years. Three of the leading VFX companies had a collective increase of around £1.6 million in training costs and an increase of £1.2 million in recruitment costs between 2009 and 2011. We also saw evidence of high levels of overtime in all five leading VFX companies over the last three years, although only one company provided data specifically in relation to job titles on the shortage occupation list.
7.64 Turning to sensible, both Ukie and UK Screen pointed out that increased use of technology in the VFX industry had made jobs more complex and had actually increased the need for skilled labour rather than reduced it. PACT, TIGA, Ukie and UK Screen all emphasised the benefits of skills transference and enhancement of the resident workforce that can take place through the employment of a small number of highly-skilled migrant workers. TIGA and Ukie also stated that in the games industry the employment of a small number of migrant workers will often have a multiplier effect leading to the employment of larger teams of resident workers.
“In choosing to open a studio in the UK, therefore, a company will look to quickly source 200 new staff. Roughly twenty to thirty of these will be project leads or higher; if these roles are not filled then the rest of the teams will not be hired.”
The Association for UK Interactive Entertainment (Ukie) response to the MAC call for evidence
7.65 We were told by UK Screen and the British Film Commission that VFX companies are very aware of the need to invest in the training and
Skilled, Shortage, Sensible
166
development of their resident labour market in an effort to address current and future skills shortages.
“By working closely with accredited training academies and developing their own in-house training functions, the UK facilities are leading the field in bringing on home grown UK VFX talent. However, training to the standard required by Hollywood „blockbusters‟ takes many years .....”
British Film Commission response to MAC call for evidence
7.66 UK Screen told us that all the large VFX companies have close relationships with higher education institutions both in the UK and the rest of Europe and that they put time and effort into improving the quality of graduates through curriculum reviews, mentoring and university visits. Two of the leading five VFX companies run internship programmes which often lead to interns being employed by the company once they have completed their course.
7.67 The Government has signalled its support for the film, television and video games industries by accepting all the recommendations in Livingstone and Hope, 2011, by the planned introduction of further tax relief for this industry in April 2013 and also by pledging £6 million investment for training to be administered through the Creative Skillset‟s Investment Fund.
“I believe that the responses provide a compelling case for the continued support from Government for these growth industries which do so much for our economy.....For the foreseeable future, it is vital that the industry is able to access the best talent from around the world to ensure that the UK remains the global centre of excellence in creative production.”
Minister for Culture, Communications and Creative Industries, Ed Vaizey MP‟s response to MAC call for evidence
7.68 Overall, we felt that there was sufficient evidence to show that the UK VFX sector could not meet its recruitment needs solely from within the EEA given its need to draw from a global talent pool. The strength of support from the Government also indicated a desire for this sector to continue as a world leader and to continue to grow. We also took note of the fact that the recommendations in the Livingstone and Hope (2011) report, to improve the teaching of information technology in UK schools and to improve the teaching and subsequent employability of graduates, will take a number of years to have significant impact and that in the meanwhile the sector had a real requirement to recruit skilled, experienced staff. We therefore recommend that the 17 job titles currently on the shortage occupation list within the visual effects and 2D/3D computer animation for film, television and the video games sectors be retained on the shortage occupation list.
Chapter 7: Other occupations
167
7.69 We understand that the UK Border Agency is currently in the process of reviewing the codes of practice for occupations and job titles skilled to NQF level 3 and 4 in order to incorporate the revised Standard Occupational Classification 2010 and uplift salary threshold in line with inflation. As such, we expect these revised pay thresholds will apply to the following seven job titles; animator, compositing artist, matte painter, modeller, rigger, stereo artist and texture artist which fall within occupations skilled to NQF3 and 4, if our recommendation to retain these job titles on the shortage occupation list is accepted by the Government.
7.70 We also recommend that the job title of games designer under SOC 2136 programmers and software development professionals within the computer games industry is added to the shortage occupation list.
7.71 Due to insufficient evidence on skill and shortage we do not recommend audio designers within the computer games industry for inclusion on the shortage occupation list.
7.72 Both UK Screen and Ukie expressed concern that the Standard Occupational Classification does not accurately reflect the skill level of some visual effects roles, mainly because of the fast-changing nature of the industry and technology with which these roles engage. We suggest that they should work together with the Office for National Statistics to try to resolve this issue.
7.7 Chefs
7.73 We reviewed chefs in 2011 as part of our previous review of the shortage occupation list in Migration Advisory Committee, 2011a. We recommended that for a chef to be regarded as skilled at the requisite level they should be paid £28,260 per annum and have at least five years‟ relevant experience. In addition, the Government added various other criteria as outlined in Box 7.11. The job title of skilled chef is presently on the shortage occupation list and therefore, for this review, we have only concerned ourselves with shortage and sensible as per our commission from the Government.
Skilled, Shortage, Sensible
168
Box 7.11: Chefs
4-digit SOC 2010 Occupation: 5434 Chefs
Only the following job titles within this occupation are included on our recommended shortage occupation list:
Skilled chef where:
the pay is at least £29,570 per year after deductions for accommodation, meals etc;
the job requires five or more years‟ relevant experience in a role of at least equivalent status to the one they are entering; and
the job is not in either a fast food or standard fare outlet.
The UK Border Agency also require that the job is not in an establishment which provides a take-away service; and the job is in one of the following roles:
executive chef – limited to one per establishment
head chef – limited to one per establishment
sous chef – limited to one for every four kitchen staff per establishment
specialist chef – limited to one per speciality per establishment.
A fast food outlet is one where food is prepared in bulk for speed of service, rather than to individual order.
A standard fare outlet is one where the menu is designed centrally for outlets in a chain / franchise, rather than by a chef or chefs in the individual restaurant. Standard fare outlets also include those where dishes and / or cooking sauces are bought in ready-made, rather than prepared from fresh / raw ingredients.
Top-down data
The top-down data relating to this SOC code are not relevant as here we are only dealing with the skilled subset of an occupation that, as a whole, does not meet our skill criteria.
Partner evidence received from:
We received evidence from People 1st, the Embassy of Japan, Visalogic and the British Hospitality Association and individual employers.
7.74 With regard to shortage, People 1st told us that 5,800 hotel and restaurant employers reported carrying hard-to-fill vacancies, 39 per cent of which related to chefs. This represents a total of 2,700 chef positions which are vacant, of which 79 per cent are considered to be skill-shortage vacancies. People 1st also told us that difficulties in filling vacancies are more acute in the Asian and Oriental catering sector, although no figures were provided.
7.75 The British Hospitality Association and Visalogic provided evidence on behalf of a number of employers, telling us about their experience of recruiting. For example, one employer reported that they currently have four vacancies which they have not been able to fill, which has led them to put plans for expansion on hold. Another employer reported that they carried 12 vacancies across their restaurants whilst another told us that they had a vacancy for a Head Sushi Chef which had been open for over 12 months.
7.76 Turning to sensible, People 1st told us that their efforts to up-skill the resident labour force were continuing, but at an extremely slow pace. They
Chapter 7: Other occupations
169
said that they launched five Centres of Excellence in Asian and Oriental cuisine in March 2012. During the course of 2012, each Centre of Excellence ran pilot programmes to attract unemployed people onto a short pre-employment work experience programme, during which time applicants could continue to receive benefits. Upon successful completion of the programme, individuals were guaranteed an interview for a paid chef apprenticeship. However, due to the limited interest in this programme, the pilot period has been extended.
7.77 We were also told that employers were providing increasing opportunities for resident workers to develop their skills. One employer told us that they have been working with the Jamie Oliver Fifteen Programme over the past 24 months to place staff within their kitchen teams. The same employer also told us that they had established their own apprenticeship scheme, working in partnership with Hospitality Industry Trust Scotland.
7.78 However, there was a unanimous view that resident workers‟ interest in apprenticeship schemes had been limited. This was attributed, in part, to negative perceptions about the profession, with long hours and low levels of pay commonly cited as key factors in this. Although People 1st told us that recruitment of individuals to apprentice schemes has started to gain momentum, employers cautioned that it will take a minimum of two to three years before such recruits achieve proficiency in basic culinary requirements. We were told that to obtain full proficiency would, in some cases, require in excess of seven years.
7.79 Indeed, employers told us that apprenticeship schemes would not resolve the shortage of chefs with expertise in non-European cuisine. Apprentices could, in the medium to long term, provide a sufficient labour supply for non-authentic, non-specialised restaurants. However, for specialised, authentic restaurants, we were told that it was crucial to be able to employ chefs who were immersed in the culture of their cuisine, with a highly developed palate. Employers told us that it was almost impossible to recruit individuals with the required skills for these restaurants from within the resident labour market.
7.80 As for the recruitment of suitably skilled non-EEA chefs, we were told that employers are experiencing difficulties in recruitment. Part of the reason for this, we were told, is that demand for such chefs was increasing as the sector expanded. The Embassy of Japan told us that there were 346 Japanese restaurants in London alone in 2011, compared to 118 in 2002. Furthermore, an employer told us that the Asian and Oriental restaurant industry in the South East had grown by 22 per cent between 2009 and 2012.
7.81 The British Hospitality Association and Visalogic told us that some of the difficulty in recruiting non-EEA chefs resulted from the criteria for skilled chefs, outlined in Box 7.11 above. We were told that the requirement that applicants have five or more years‟ relevant experience in a role of at least equivalent status to the one they are entering was impractical. They told us that it would be rare for an individual to remain at the same level for a
Skilled, Shortage, Sensible
170
period of five years or more. Employers also told us that the level of English required by Tier 2 applicants was such that it was more difficult to recruit from outside the EEA as many potential chefs did not reach the required level. The Embassy of Japan asked that the level of the English language requirement be eased. However, it is not within our remit to review the level of the English language required by Tier 2 migrants.
7.82 In our previous review of the shortage occupation list (Migration Advisory Committee, 2011a) we set the pay threshold for skilled chefs at £28,260 based on earnings data for 2010. We reviewed the current threshold indexing it in line with the average earnings index between 1 April 2010 and 31 October 2012, which yields a revised threshold of £29,570. Certificate of Sponsorship data between 1 October 2011 and 30 September 2012 indicates that three quarters of Tier 2 chef applicants would have been refused had this higher pay threshold been in place. This suggests that non-EEA chefs are mainly paid at or near the Tier 2 pay threshold. With the uprated threshold of £29,570, it is plausible that this will result in an increase in skilled chefs‟ pay to this level.
7.83 In conclusion, although the evidence we received was not strong, we continue to recognise the need for the sector to recruit the very top chefs from outside the EEA. We therefore recommend that skilled chefs meeting the criteria in Box 7.11 be retained on the shortage occupation list. We also recommend that the pay threshold be uprated to £29,570.
7.8 High integrity pipe welders
Box 7.12: Welding trades
4-digit SOC 2010 Occupation: 5215 Welding trades
Only the following job titles within this occupation are included on our recommended shortage occupation list: High integrity pipe welders
Top-down data
The top-down data relating to this SOC code are not relevant as we are only dealing here with the skilled subset of an occupation that, as a whole, does not meet our skill criteria.
Partner evidence received from: We received evidence from Doosan Power Systems Ltd, Alstom Power, Westinghouse, EEF, Cogent.
7.84 We looked at this job title in detail in Migration Advisory Committee (2011a) having first considered it in 2008. This job, which falls within the occupation of welding trades, SOC code 5215, is presently on the shortage occupation list and so, as per our commission, we have not reviewed whether or not it meets the requisite skill level.
7.85 In our 2011 review we were told that high integrity pipe welders are involved in seasonal repair and maintenance shutdowns, outages and plant upgrade activities. We commented in our report that therefore we expected that the majority of non-EEA migrants coming through this route will be in the UK for only a limited period working on short-term contracts.
Chapter 7: Other occupations
171
7.86 As in 2011, Doosan Babcock provided us with evidence under their new name of Doosan Power Systems Ltd. They told us that the sector continues to experience significant seasonal variations in skills demand. In 2012 they recruited 14 high integrity pipe welders from the Philippines for what was expected to be only 4 to 5 weeks work, but these workers are still in the UK after over 16 weeks. They said that they hoped to fill this shortfall with resident workers moved from other projects coming to an end but that these resident workers refused to transfer and instead sought employment elsewhere. Doosan say that they also received 6 enquiries in 2012 from other organisations about the availability of high integrity pipe welders.
7.87 Doosan said that they have led a welding employer working group aimed at instituting a welding training programme and this has resulted in 24 new high integrity pipe welders coming into the sector. A submission for additional funding for this programme is presently being considered by the Department for Business, Innovation and Skills (BIS) and the Engineering Construction Industry Training Board. Doosan pointed out that the training programme will take between 6 to 10 years to develop the range of high integrity pipe welding skills. Combined with an ageing demographic in the existing workforce and a forecast acceleration of demand, this means that Doosan are predicting this job title will remain in shortage for a minimum of 8 years.
7.88 We also received evidence on this job title from Alstom Power, a repair and maintenance company performing critical welding applications on power plants. Alstom said that the more experienced welders were leaving at a rate of around 2 or 3 welders per year (which does not seem that excessive a rate of dissolution) and that it takes between 6 to 8 years for a new recruit to gain the requisite skills and knowledge taken from the time they end their apprenticeship. The relevant Sector Skills Council, Cogent, told us that none of the information they submitted in response to our previous call for evidence on the shortage list had changed, including that in relation to shortage of high integrity pipe welders.
7.89 Westinghouse sent us evidence stating that the estimated time that it takes to train a high integrity pipe welder to be a suitably qualified and experienced worker is 8 years. Westinghouse said that high integrity pipe welders should remain on the shortage occupation list as the safety of nuclear power plants is reliant on high quality welds. Westinghouse also provided some more detailed information about the seasonality of this work. A nuclear plant such as Sizewell B conducts a servicing outage every 18 months when the plant is taken off-line for 40 days. Specialist expertise is required to ensure that the servicing and start up is completed in a safe and effective manner with no detriment to the supply of power. Westinghouse say that it is not practical to transfer these skills in their entirety to the local workforce as the task is only required to be carried out every 18 months.
7.90 EEF, the manufacturers‟ organisation, listed a number of occupations currently on the shortage occupation list that they said would be of
Skilled, Shortage, Sensible
172
concern to their members if removed from the list. The EEF list of concern included welding trades but the rest of their evidence did not identify the high integrity pipe welders job title nor provide more detailed information.
7.91 We recognise that this job has been on the shortage list since 2008. However, we welcome the efforts initiated by Doosan and other employers, with the support of BIS, to train resident workers and we expect that in the medium to longer term, if more resources are made available, the sector will become less reliant on experienced non-EEA workers.
7.92 We are seized of the importance to a key national utility of having skilled, experienced workers carrying out servicing and inspection work. Overall we consider that it is sensible to recommend that the job title of high integrity pipe welder remains on the shortage occupation list.
7.9 Dancers and choreographers
Box 7.13: Dancers and choreographers
4-digit SOC 2010 Occupation: 3414 Dancers and choreographers
Only the following job titles within this occupation are included on our recommended shortage occupation list: Skilled ballet and skilled contemporary dancers
Top-down data
The top-down data relating to this SOC code are not relevant as we are only dealing here with the skilled subset of an occupation that, as a whole, does not meet our skill criteria.
Partner evidence received from:
We received evidence from the Royal Opera House, a joint submission from the Society of London Theatre, the Theatrical Management Association, the Independent Council, Dance UK and the National Campaign for the Arts.
7.93 The occupation SOC 3414 dancers and choreographers, is currently on the shortage occupation list in relation to the job title of skilled classical ballet dancer and skilled contemporary dancer. This occupation is not skilled to NQF6+ but as the relevant job titles are already on the shortage occupation list we have not reviewed skill, in line with our commission.
7.94 The Royal Opera House provided information on the pay of a dancer and on the skill level involved. Pay ranges from £26,000 to £41,000 but the Royal Opera House pointed out that pay may not be a good indicator of skill level in the arts sector. Training takes from between 5 to 8 years and level of skill is assessed through auditions rather than by NQF classification with any qualifications being secondary to demonstrated skill and innate ability. The Royal Opera House say that they typically anticipate up to 6 vacancies in any 12-month period ranging from first year artist to principal.
7.95 We also received a joint submission from the Society of London Theatre, the Theatrical Management Association, the Independent Council, Dance UK and the National Campaign for the Arts stating that skilled ballet

Chapter 7: Other occupations
173
dancers and skilled contemporary dancers remain in shortage and should be retained on the shortage occupation list at a minimum pay threshold of £20,000. The current codes of practice for ballet dancers and for dancers in forms other than ballet state that payment of dancers should be commensurate with industry standards and that agreed minimum salaries are set out in Equity‟s collective agreements.
7.96 On shortage we were told that there are only a limited number of dancers worldwide who have the combination of innate ability, training, aesthetics, skill and experience required to meet the standards of the leading dance companies. Limiting companies to recruit from within the EEA will deny them access to the best possible pool of potential recruits.
7.97 We were also asked to take account of the fact that a dancer‟s career is short (males tend to retire at between 28 and 32 years of age and females by their mid to late 30s) and can be made shorter through injury (80 per cent of dancers suffer one injury per year that stops them working) leading to a high turnover of talent. Choreographers will often look for a set of skills unique to their own choreography and some use techniques that are not taught, or are only just beginning to be taught, within the EEA. There is no typical duration for vacancies within companies. Some vacancies can take up to 9 months to be filled and appointments are only considered when suitable candidates are identified. Artistic standards are paramount and it is not uncommon for companies to operate under strength for long periods.
7.98 Low levels of pay do not deter skilled dancers from applying to work with top UK companies as this will enhance a dancer‟s profile and advance their career. Increasing pay will not increase the pool of available labour because there are so few dancers of the required standard and those who are not good enough will not be hired.
7.99 In May 2012 members of the Committee attended an Insight session with the Royal Ballet and in June 2012 we observed a company in class at the Rambert studios, followed by a dress rehearsal of the Royal Ballet in order to better understand the skill level of the dancers who are recruited from outside the EEA to take up jobs on the shortage occupation list.
7.100 Taking account of the evidence we received and saw for ourselves about the standards sought by leading companies as well as the likelihood that it will always be desirable for these companies to recruit from the brightest and best talent pool possible, we recommend that ballet dancers who meet the standard required by internationally recognised UK ballet companies (e.g. Birmingham Royal Ballet, English National Ballet, Northern Ballet Theatre, The Royal Ballet and Scottish Ballet) remain on the shortage occupation list. We also recommend that those who meet the standard required by internationally recognised UK contemporary dance companies (e.g. Shobana Jeyasingh Dance Company, Scottish Dance Theatre and Rambert Dance Company) remain on the shortage occupation list.
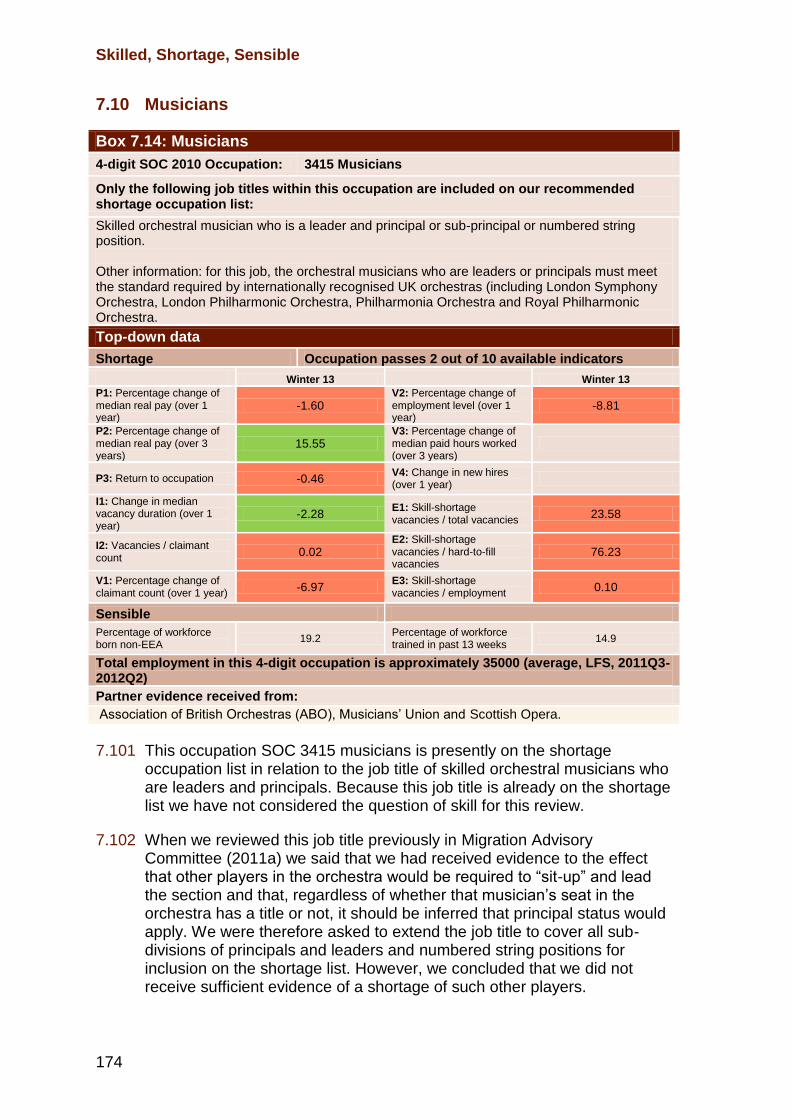
Skilled, Shortage, Sensible
174
7.10 Musicians
Box 7.14: Musicians
4-digit SOC 2010 Occupation: 3415 Musicians
Only the following job titles within this occupation are included on our recommended shortage occupation list:
Skilled orchestral musician who is a leader and principal or sub-principal or numbered string position. Other information: for this job, the orchestral musicians who are leaders or principals must meet the standard required by internationally recognised UK orchestras (including London Symphony Orchestra, London Philharmonic Orchestra, Philharmonia Orchestra and Royal Philharmonic Orchestra.
Top-down data
Shortage Occupation passes 2 out of 10 available indicators
Winter 13 Winter 13
P1: Percentage change of median real pay (over 1 year)
-1.60 V2: Percentage change of employment level (over 1 year)
-8.81
P2: Percentage change of median real pay (over 3 years)
15.55 V3: Percentage change of median paid hours worked (over 3 years)
P3: Return to occupation -0.46 V4: Change in new hires (over 1 year)
I1: Change in median vacancy duration (over 1 year)
-2.28 E1: Skill-shortage vacancies / total vacancies
23.58
I2: Vacancies / claimant count
0.02 E2: Skill-shortage vacancies / hard-to-fill vacancies
76.23
V1: Percentage change of claimant count (over 1 year)
-6.97 E3: Skill-shortage vacancies / employment
0.10
Sensible
Percentage of workforce born non-EEA
19.2 Percentage of workforce trained in past 13 weeks
14.9
Total employment in this 4-digit occupation is approximately 35000 (average, LFS, 2011Q3-2012Q2)
Partner evidence received from:
Association of British Orchestras (ABO), Musicians‟ Union and Scottish Opera.
7.101 This occupation SOC 3415 musicians is presently on the shortage occupation list in relation to the job title of skilled orchestral musicians who are leaders and principals. Because this job title is already on the shortage list we have not considered the question of skill for this review.
7.102 When we reviewed this job title previously in Migration Advisory Committee (2011a) we said that we had received evidence to the effect that other players in the orchestra would be required to “sit-up” and lead the section and that, regardless of whether that musician‟s seat in the orchestra has a title or not, it should be inferred that principal status would apply. We were therefore asked to extend the job title to cover all sub-divisions of principals and leaders and numbered string positions for inclusion on the shortage list. However, we concluded that we did not receive sufficient evidence of a shortage of such other players.
Chapter 7: Other occupations
175
7.103 In their evidence to us in this review of the shortage list the Association of British Orchestras (ABO) told us that there is no standard nomenclature used to identify the various orchestral positions and that the structure of each varied from orchestra to orchestra. Some will differentiate between section principal and overall principal and some will not. Some will title specific string seats (No.3, No. 4 etc.) as principal or sub-principal and some will not. We were told that the general practice is that if a seat is numbered then there is a contractual requirement for that player to “sit-up” and lead the section when required under the orchestra‟s rostering. This will necessitate some solo playing and therefore regardless of whether the seat is titled the inference is that the status of principal should apply.
7.104 This makes it difficult to separate out different categories of principal. However, the main distinction of any principal or sub-principal rank is that these roles will have the potential to have solo passages, will often be the only player on that part and may have management responsibility for other members of the section. Consequently there is a need to have players of the requisite talent and ability in all principal and sub-principal seats.
7.105 ABO also provided evidence of shortage within these job titles together with the length of time posts had been vacant. The most extreme example was that of a principal double bass position which had been vacant for 96 months. In part this is due to the lengthy recruitment process that orchestras engage in which will usually include a substantial audition period. We also received evidence from Scottish Opera who said that they had experienced an increase in the turnover of their orchestral musicians as well as an ageing demographic among them.
7.106 We consulted with the Musicians‟ Union and they confirmed that they are content with ABO‟s description of sub-principals and numbered string positions and understood that the Committee was being asked to extend the description of principal posts on the shortage occupation list to include these positions. The Musicians‟ Union did not submit any evidence formally to us.
7.107 As said in our previous reports, we believe that there is a need to ensure that UK orchestras are able to compete in the global market place for the very best orchestral musicians. We note that partners provided evidence that shortages in the identified job titles remain and that the different naming systems across different orchestras make it appropriate that the job title on the shortage list be extended to encompass sub-principals and numbered string positions. And we noted that the Musicians Union confirmed that they agreed.
7.108 We therefore recommend that the job title skilled orchestral musicians who are leaders and principals be retained on the shortage list and that this title be expanded to include sub-principals and numbered string positions.
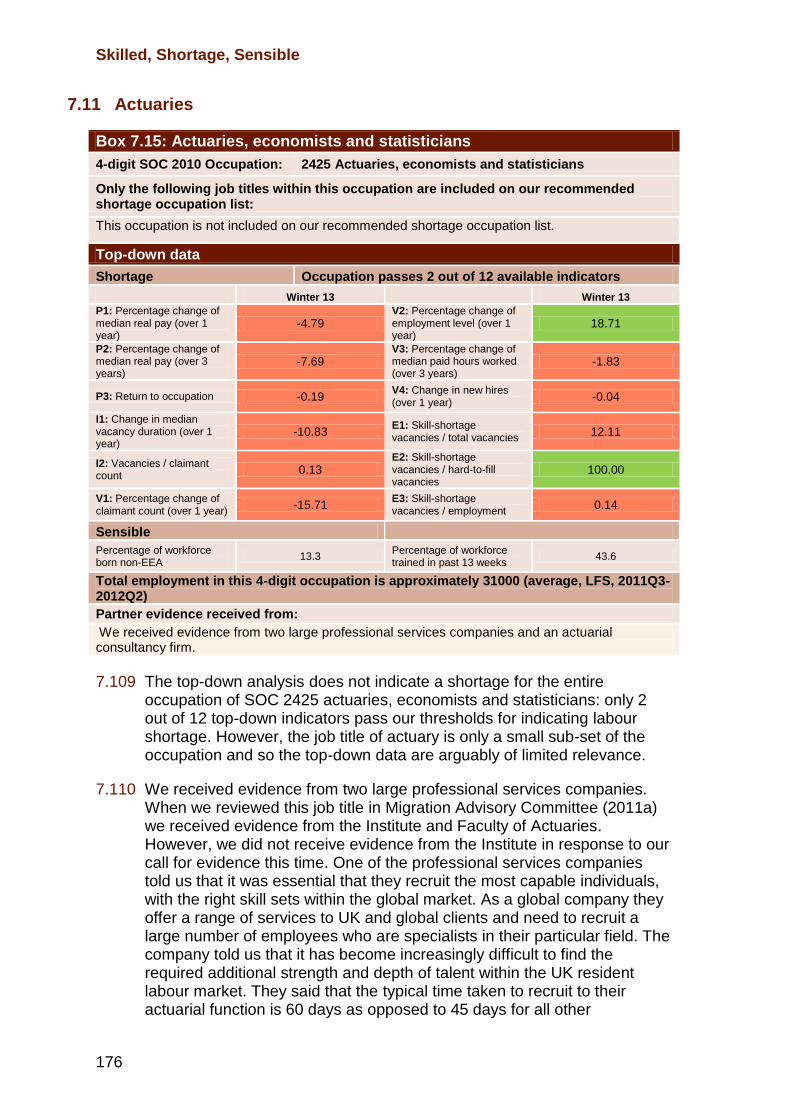
Skilled, Shortage, Sensible
176
7.11 Actuaries
Box 7.15: Actuaries, economists and statisticians
4-digit SOC 2010 Occupation: 2425 Actuaries, economists and statisticians
Only the following job titles within this occupation are included on our recommended shortage occupation list:
This occupation is not included on our recommended shortage occupation list.
Top-down data
Shortage Occupation passes 2 out of 12 available indicators
Winter 13 Winter 13
P1: Percentage change of median real pay (over 1 year)
-4.79 V2: Percentage change of employment level (over 1 year)
18.71
P2: Percentage change of median real pay (over 3 years)
-7.69 V3: Percentage change of median paid hours worked (over 3 years)
-1.83
P3: Return to occupation -0.19 V4: Change in new hires (over 1 year)
-0.04
I1: Change in median vacancy duration (over 1 year)
-10.83 E1: Skill-shortage vacancies / total vacancies
12.11
I2: Vacancies / claimant count
0.13 E2: Skill-shortage vacancies / hard-to-fill vacancies
100.00
V1: Percentage change of claimant count (over 1 year)
-15.71 E3: Skill-shortage vacancies / employment
0.14
Sensible
Percentage of workforce born non-EEA
13.3 Percentage of workforce trained in past 13 weeks
43.6
Total employment in this 4-digit occupation is approximately 31000 (average, LFS, 2011Q3-2012Q2)
Partner evidence received from:
We received evidence from two large professional services companies and an actuarial consultancy firm.
7.109 The top-down analysis does not indicate a shortage for the entire occupation of SOC 2425 actuaries, economists and statisticians: only 2 out of 12 top-down indicators pass our thresholds for indicating labour shortage. However, the job title of actuary is only a small sub-set of the occupation and so the top-down data are arguably of limited relevance.
7.110 We received evidence from two large professional services companies. When we reviewed this job title in Migration Advisory Committee (2011a) we received evidence from the Institute and Faculty of Actuaries. However, we did not receive evidence from the Institute in response to our call for evidence this time. One of the professional services companies told us that it was essential that they recruit the most capable individuals, with the right skill sets within the global market. As a global company they offer a range of services to UK and global clients and need to recruit a large number of employees who are specialists in their particular field. The company told us that it has become increasingly difficult to find the required additional strength and depth of talent within the UK resident labour market. They said that the typical time taken to recruit to their actuarial function is 60 days as opposed to 45 days for all other
Chapter 7: Other occupations
177
occupations across the company and that this additional time to hire is directly related to the scarcity of talent within the UK labour market. They told us that the right graduates are prime targets and are headhunted by other financial services employers resulting in high attrition rates. The company also included in their evidence to us some comments from specialist recruitment agencies. These agencies cited solvency II work as a reason for the increased demand for actuaries.
7.111 The professional services company cited its global mobility programme as an example of ways in which its staff undertake long or short-term appointments in the UK and overseas, with, in 2010, some 325 inbound assignments to the UK and 249 outbound assignments. They said that if they are no longer able to offer placements in the UK, it is likely that the number of overseas placements would also reduce with an adverse impact on the professional development of their UK employees. However, they also stated that 90 per cent of the non-EEA nationals who come to the UK through this global mobility programme come via the intra-company transfer route. Whether or not any particular occupation is on the shortage list will not impact on this route.
7.112 The other professional services company responded to our call for evidence in relation to actuaries on behalf of one of their clients. They told us that their client had one vacancy for a qualified actuary working in life assurance and one vacancy for a qualified actuary working in general assurance and that both vacancies have remained unfilled for more than five months. Average earnings have increased by 6 to 10 per cent in the last two years for qualified actuaries working in the life assurance, general assurance and health and case sectors for this client, and the average working hours for these job roles has increased 6 to 10 per cent in that period also.
7.113 Additionally, we received evidence from a small actuarial consultancy firm asking that we do not retain actuaries on the shortage occupation list. This firm argued that there was a lack of data demonstrating that actuaries were in national shortage and that what evidence there was had come from a relatively small number of sources. It also stated that the job title included on the shortage list did not pertain exclusively to the solvency II work but that it could relate to other more general actuarial work.
7.114 We took note of the fact that the pressure time for actuaries coming in to work on solvency II was at the end of 2012 and that the evidence citing solvency II was not substantial. We took particular note of the fact that the Institute and Faculty of Actuaries did not supply any evidence to us on this occasion. We therefore concluded that the pressure on the actuarial profession exerted by the solvency II work had subsided.
7.115 We looked at the evidence we received from the professional services companies. We note that what is stressed most in this evidence is the need to recruit the right staff with the right skill set for the particular need of that employer rather than evidence of an overall UK-wide shortage of actuaries.

Skilled, Shortage, Sensible
178
“It is becoming increasingly difficult to find the additional strength and depth of talent we require within the UK resident labour market”.
Professional services company response to MAC call for evidence
“Ultimately broadening our Talent Pool across the globe enables us to secure the best talent, continue to service our clients to the highest standards and win new business.”
Professional services company response to MAC call for evidence
7.116 While we consider it legitimate for employers to want to do this they do have a route open to them already to advertise a vacancy to the resident labour market and then to bring in an actuary from outside the EEA if it can be shown that there are no suitable resident or EEA candidates. The number of actual vacancies that was cited to us is very small and overall we were of the view that admission to the shortage list was being sought for actuaries in order to make it easier for employers to bring in their preferred candidates. Indeed, the evidence all but admitted as much.
“The speed of hire made possible by omitting the need to complete the Resident Labour Market test is key.”
Professional services company response to MAC call for evidence
7.117 As we have said, this may be a legitimate aim but it is not what the shortage occupation list is intended for. We do not consider that we received sufficient evidence of a national shortage of actuaries to justify the retention of this job title on the shortage occupation list and therefore recommend that it be removed.
7.12 Chick sexers
Box 7.16: Chick sexer
4-digit SOC 2010 Occupation: 9119 Fishing and other elementary agriculture occupations not elsewhere classified
This occupation is not included on our recommended shortage occupation list.
Top-down data
The top-down data relating to this SOC code are not relevant as we are only dealing here with the skilled subset of an occupation that, as a whole, does not meet our skill criteria.
Partner evidence received from:
We received evidence from Hy-Line UK Ltd and Stanley Wattam Ltd
7.118 We received evidence from an employer specialising in the segregation of poultry asking that we consider recommending adding the job title of chick
Chapter 7: Other occupations
179
sexer to the shortage occupation list. There are a very small number of employers in the UK who offer such a service. The employer was carrying a couple of vacancies for skilled chick sexers and has attempted to recruit within the EEA to fill these positions for the previous nine months without success.
7.119 The job title of chick sexer falls within the occupation of fishing and other elementary agriculture occupations not elsewhere classified, SOC code 9119. We are looking only at a job title within this occupation and therefore any top-down data are irrelevant. However, jobs within SOC code 9119 are assigned according to the Standard Occupation Classification to the skill level 1, which is the lowest of four skill levels within this classification.
7.120 We were told by the employer that chick sexers could expect to earn up to £36,000 per year which would put this job comfortably within the salary range for NQF6+ skilled jobs. A member of the Committee secretariat went to see chick sexers at work at a hatchery in Norfolk. Chick sexers undergo training of between two and three years duration before they are allowed to join a team working on filling an order. We saw at first hand employees segregating day old chicks by opening the cloacae of each chick to reveal the sexual organs (vent method). The difference in sexual organs between male and female chicks is very slight and differs for each batch of chicks being processed.
7.121 Standards are very high. The chicks need to be segregated at a rate of between 800 to 1200 per hour (or between 3 and 5 seconds per chick). The segregators we saw were if anything working at a faster rate than this. Accuracy rates must be maintained at between 97 to 99 per cent. This is insisted upon by customers who will not able to confirm the gender of chicks for a further 12 weeks. This level of output must be maintained for as long as it takes to fill the order, which could be up to 13 hours (with break periods). This requires high levels of concentration and hand and eye co-ordination. It was clear to us that this represented a very specific set of innate ability skills. Although the technique could be taught relatively quickly, the ability to maintain standards for such long periods at such a level of intensity had to be developed over a longer time.
7.122 The salary rates combined with the length of time taken to become fully proficient at this task do provide an indication of skill. However, on balance we were of the view that the skill involved did not equate to what we expect to see at a level equivalent to NQF6+.
7.123 We would have liked to receive evidence from more than one employer in relation to shortage. However, we were told that there are only a few firms in the UK offering this service so a small number of vacancies could have a proportionally great impact on employers. We were told that those employed as chick sexers tended to treat it as a profession and so remained in this job for the rest of their working lives. Although we were given to understand that employees will work all over the UK and are not tied to any particular geographical area, it remains the case that we only heard from one employer.
Skilled, Shortage, Sensible
180
7.124 Finally we considered whether it was more sensible for chick sexers to be brought in from outside the EEA than any alternatives. Chick sexing is vital to modern poultry farming. The ability to tell the sex of chicks at such a young age means that customers do not have to waste resources rearing chicks that they do not need and greatly improves the efficiency of the breeding process leading to an exponential increase in the number of chicks bred from those initially sexed at the hatchery. Many of the people employed further down the chain in the poultry sector are dependant upon the skills of the chick sexers for the growth in the poultry sector in modern times. Any diminution in this sector would also lead to higher prices being passed on to the consumer.
7.125 There is no alternative to segregating day old chicks by the hand and eye of a chick sexer other than waiting a number of weeks. This will represent a considerable increase in the inefficiencies in the poultry production chain. A continuing shortage of chick sexers in the UK could lead to poultry production moving outside of the UK with a concomitant loss of UK jobs. There are skilled chick sexers within the EEA but these are in demand across Europe. We were told that often UK resident chick sexers will work temporarily in Europe and that EEA based chick sexers will also work temporarily in the UK in order to take up a shortfall in available employees.
7.126 There is no facility in the UK which provides training in chick sexing. All training must be undertaken by the employer at their own expense. On our visit we did see a UK resident being trained. He was working in isolation from the other sexers at sexing otherwise expendable chicks (the chicks we saw cost £20 each) and endeavouring to attain the required level of accuracy, his work being checked by one of the experienced sexers. The employer confirmed that there was no reason why a facility could not be established in the UK to train UK resident chick sexers but that no such facility existed. There was such a facility in Korea and that was in part why this country was presently the favoured source for experienced sexers.
7.127 Overall, we consider that there is insufficient evidence of skill at a level equivalent to NQF6+ in order for this job title to be considered for the shortage occupation list. There are only a relatively small number of people at any one time who are trained and sufficiently experienced to do this job and the role of chick sexer is fundamental to modern poultry production. We encourage the Department for Business, Industry and Skills, the UK Commission for Employment and Skills and the relevant sector skills council (Lantra) to consider working with employers to set up formal training provisions to meet employers‟ requirements. In the meantime we recommend that chick sexer is not added to the shortage occupation list.

Chapter 7: Other occupations
181
7.13 High integrity pipe fitters
Box 7.17: Pipe fitters
4-digit SOC 2010 Occupation: 5216 Pipe fitters
This occupation is not included on our recommended shortage occupation list.
Top-down data
The top-down data relating to this SOC code are not relevant as we are only dealing here with the skilled subset of an occupation that, as a whole, does not meet our skill criteria.
Partner evidence received from:
We received evidence from Doosan Power Systems Ltd.
7.128 The job title high integrity pipe fitter is a specialist sub-set of the occupation SOC 5216 pipe fitters, which is not skilled at NQF4+. This job title is not on the current shortage occupation list.
7.129 Doosan Power Systems Ltd asked that high integrity pipe fitters be added to the shortage list but their evidence stated that they recognised that this job was skilled at NQF4. We did not receive any evidence to indicate that this job is skilled at NQF6+ and as such we are not able to recommend it for inclusion on the shortage list as it does not meet the Government‟s required skill level.
7.14 Citadel miniature designer
7.130 We received evidence from Paragon Law on behalf of Games Workshop, requesting the addition of the job title of Citadel Miniature Designer on the shortage occupation list. This job title falls with the occupational SOC code 3411 artists which is skilled at NQF4. We received this evidence four weeks after our deadline and it failed to provide enough evidence that the job title was skilled at NQF6+, a national shortage of such skills exist and that it would be sensible to use migrant labour. We are therefore unable to recommend that the job title of Citadel Miniature Designer be added to the shortage occupation list. We are happy to meet with Paragon Law and Games Workshop to discuss this job title and their evidence in more detail in the future.
7.131 Our recommendations on the UK shortage occupation list are summarised in Chapter 10. The next chapter will look at evidence and data in relation to Scotland.

183
8.1 Introduction
8.1 This chapter considers evidence and data relating to occupations and job titles in Scotland. Scotland has an additional, separate shortage occupation list to reflect differing labour market demand needs compared to the rest of the UK.
8.2 Therefore, this chapter is concerned with evidence and data received in relation to occupations and job titles experiencing a shortage only in Scotland.
8.2 The Scottish economy and labour market
8.3 In Scotland, like the UK as a whole, the three quarters to Q2 2012 were marked by declining output. Quarter on quarter growth to Q2 2012 across both the UK and in Scotland was -0.4 percent. At the time of writing, data for GDP at basic prices for Scotland in Q3 2012 are unavailable.
Chapter 8 Scotland
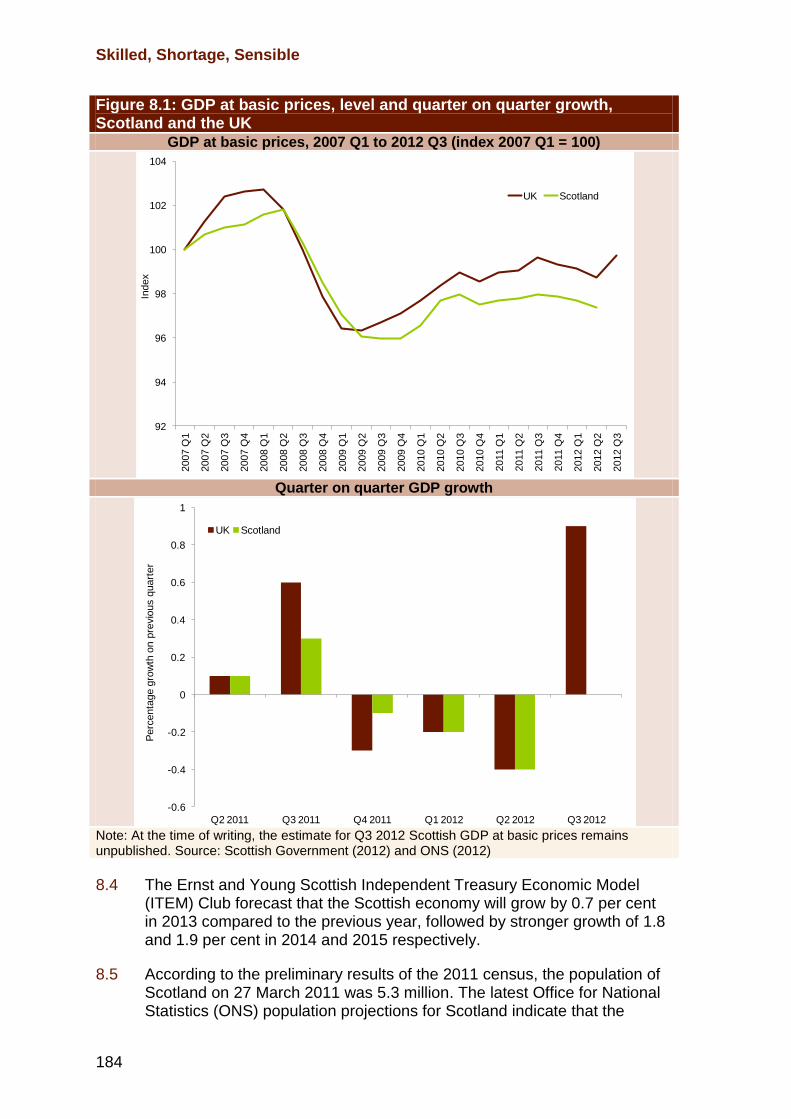
Skilled, Shortage, Sensible
184
Figure 8.1: GDP at basic prices, level and quarter on quarter growth, Scotland and the UK
GDP at basic prices, 2007 Q1 to 2012 Q3 (index 2007 Q1 = 100)
Quarter on quarter GDP growth
Note: At the time of writing, the estimate for Q3 2012 Scottish GDP at basic prices remains unpublished. Source: Scottish Government (2012) and ONS (2012)
8.4 The Ernst and Young Scottish Independent Treasury Economic Model (ITEM) Club forecast that the Scottish economy will grow by 0.7 per cent in 2013 compared to the previous year, followed by stronger growth of 1.8 and 1.9 per cent in 2014 and 2015 respectively.
8.5 According to the preliminary results of the 2011 census, the population of Scotland on 27 March 2011 was 5.3 million. The latest Office for National Statistics (ONS) population projections for Scotland indicate that the
92
94
96
98
100
102
104
2007 Q
1
2007 Q
2
2007 Q
3
2007 Q
4
2008 Q
1
2008 Q
2
2008 Q
3
2008 Q
4
2009 Q
1
2009 Q
2
2009 Q
3
2009 Q
4
2010 Q
1
2010 Q
2
2010 Q
3
2010 Q
4
2011 Q
1
2011 Q
2
2011 Q
3
2011 Q
4
2012 Q
1
2012 Q
2
2012 Q
3
UK Scotland
Index
-0.6
-0.4
-0.2
0
0.2
0.4
0.6
0.8
1
Q2 2011 Q3 2011 Q4 2011 Q1 2012 Q2 2012 Q3 2012
UK Scotland
Perc
enta
ge
gro
wth
on p
revio
us q
uart
er
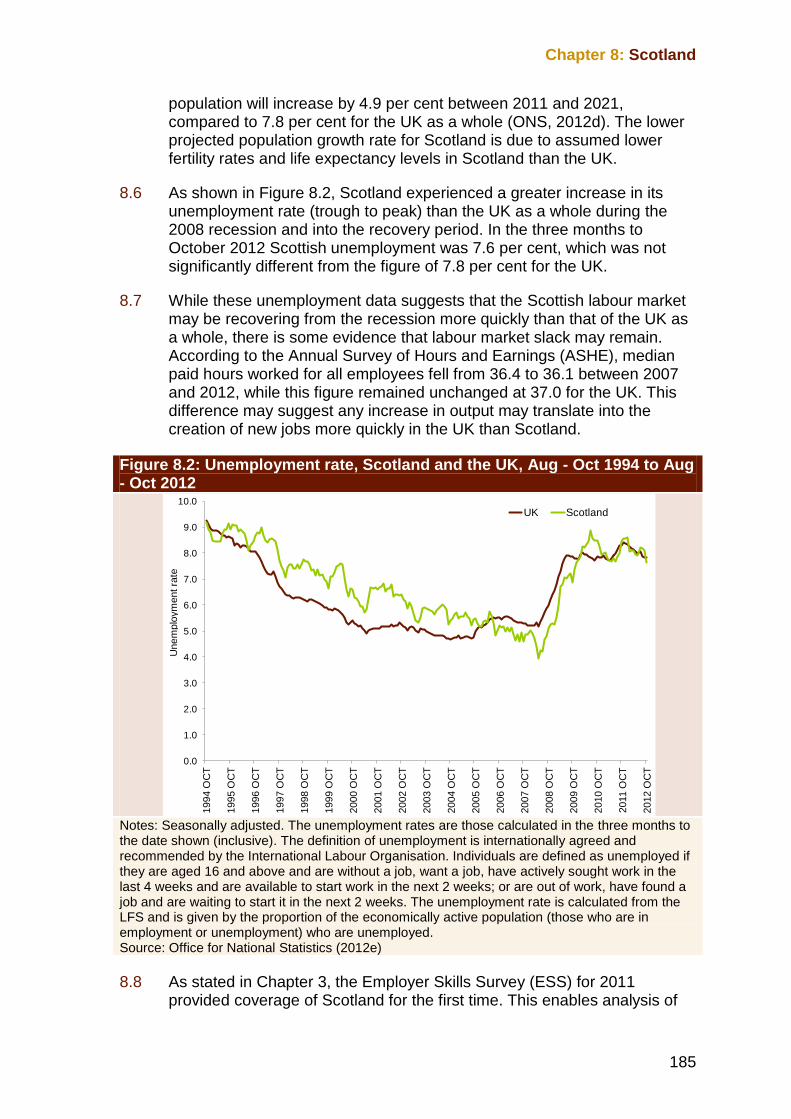
Chapter 8: Scotland
185
population will increase by 4.9 per cent between 2011 and 2021, compared to 7.8 per cent for the UK as a whole (ONS, 2012d). The lower projected population growth rate for Scotland is due to assumed lower fertility rates and life expectancy levels in Scotland than the UK.
8.6 As shown in Figure 8.2, Scotland experienced a greater increase in its unemployment rate (trough to peak) than the UK as a whole during the 2008 recession and into the recovery period. In the three months to October 2012 Scottish unemployment was 7.6 per cent, which was not significantly different from the figure of 7.8 per cent for the UK.
8.7 While these unemployment data suggests that the Scottish labour market may be recovering from the recession more quickly than that of the UK as a whole, there is some evidence that labour market slack may remain. According to the Annual Survey of Hours and Earnings (ASHE), median paid hours worked for all employees fell from 36.4 to 36.1 between 2007 and 2012, while this figure remained unchanged at 37.0 for the UK. This difference may suggest any increase in output may translate into the creation of new jobs more quickly in the UK than Scotland.
Figure 8.2: Unemployment rate, Scotland and the UK, Aug - Oct 1994 to Aug - Oct 2012
Notes: Seasonally adjusted. The unemployment rates are those calculated in the three months to the date shown (inclusive). The definition of unemployment is internationally agreed and recommended by the International Labour Organisation. Individuals are defined as unemployed if they are aged 16 and above and are without a job, want a job, have actively sought work in the last 4 weeks and are available to start work in the next 2 weeks; or are out of work, have found a job and are waiting to start it in the next 2 weeks. The unemployment rate is calculated from the LFS and is given by the proportion of the economically active population (those who are in employment or unemployment) who are unemployed. Source: Office for National Statistics (2012e)
8.8 As stated in Chapter 3, the Employer Skills Survey (ESS) for 2011 provided coverage of Scotland for the first time. This enables analysis of
0.0
1.0
2.0
3.0
4.0
5.0
6.0
7.0
8.0
9.0
10.0
1994 O
CT
1995 O
CT
1996 O
CT
1997 O
CT
1998 O
CT
1999 O
CT
2000 O
CT
2001 O
CT
2002 O
CT
2003 O
CT
2004 O
CT
2005 O
CT
2006 O
CT
2007 O
CT
2008 O
CT
2009 O
CT
2010 O
CT
2011 O
CT
2012 O
CT
UK Scotland
Unem
plo
ym
entra
te

Skilled, Shortage, Sensible
186
vacancy, hard-to-fill vacancy and skills shortage vacancy rates at the 2-digit SOC 2000 level for Scotland and direct comparison with equivalent figures for the UK.
8.9 Table 8.1 presents the numbers of vacancies, hard-to-fill vacancies and skill shortage vacancies as a percentage of employment for Scotland. On aggregate, these proportions were broadly similar between the UK and Scotland. According to this analysis, among 2-digit occupations incorporating 4-digit SOC occupations skilled at NQF6+, skill shortage vacancies as a percentage of employment were highest for health professionals. This contrasts to the UK as a whole, where this figure was highest for health and social care associate professionals at 1.0 per cent.
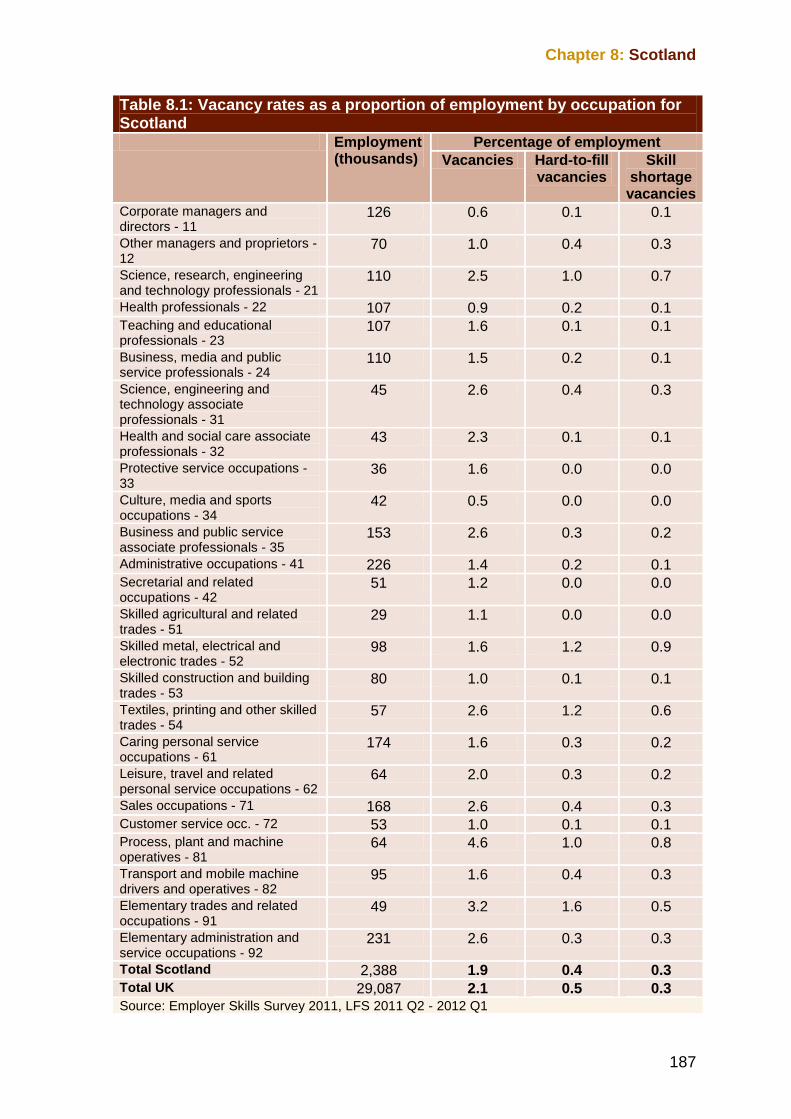
Chapter 8: Scotland
187
Table 8.1: Vacancy rates as a proportion of employment by occupation for Scotland Employment
(thousands) Percentage of employment
Vacancies Hard-to-fill vacancies
Skill shortage vacancies
Corporate managers and directors - 11
126 0.6 0.1 0.1
Other managers and proprietors - 12
70 1.0 0.4 0.3
Science, research, engineering and technology professionals - 21
110 2.5 1.0 0.7
Health professionals - 22 107 0.9 0.2 0.1 Teaching and educational professionals - 23
107 1.6 0.1 0.1
Business, media and public service professionals - 24
110 1.5 0.2 0.1
Science, engineering and technology associate professionals - 31
45 2.6 0.4 0.3
Health and social care associate professionals - 32
43 2.3 0.1 0.1
Protective service occupations - 33
36 1.6 0.0 0.0
Culture, media and sports occupations - 34
42 0.5 0.0 0.0
Business and public service associate professionals - 35
153 2.6 0.3 0.2
Administrative occupations - 41 226 1.4 0.2 0.1 Secretarial and related occupations - 42
51 1.2 0.0 0.0
Skilled agricultural and related trades - 51
29 1.1 0.0 0.0
Skilled metal, electrical and electronic trades - 52
98 1.6 1.2 0.9
Skilled construction and building trades - 53
80 1.0 0.1 0.1
Textiles, printing and other skilled trades - 54
57 2.6 1.2 0.6
Caring personal service occupations - 61
174 1.6 0.3 0.2
Leisure, travel and related personal service occupations - 62
64 2.0 0.3 0.2
Sales occupations - 71 168 2.6 0.4 0.3 Customer service occ. - 72 53 1.0 0.1 0.1 Process, plant and machine operatives - 81
64 4.6 1.0 0.8
Transport and mobile machine drivers and operatives - 82
95 1.6 0.4 0.3
Elementary trades and related occupations - 91
49 3.2 1.6 0.5
Elementary administration and service occupations - 92
231 2.6 0.3 0.3
Total Scotland 2,388 1.9 0.4 0.3 Total UK 29,087 2.1 0.5 0.3 Source: Employer Skills Survey 2011, LFS 2011 Q2 - 2012 Q1
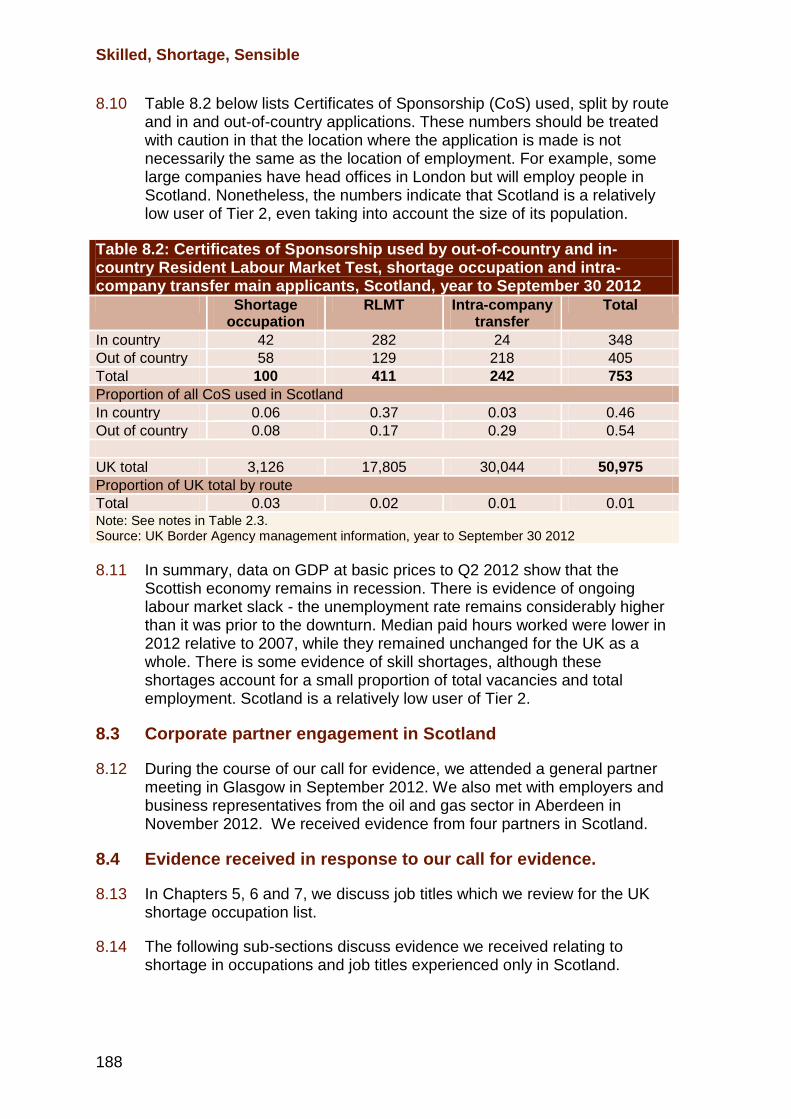
Skilled, Shortage, Sensible
188
8.10 Table 8.2 below lists Certificates of Sponsorship (CoS) used, split by route and in and out-of-country applications. These numbers should be treated with caution in that the location where the application is made is not necessarily the same as the location of employment. For example, some large companies have head offices in London but will employ people in Scotland. Nonetheless, the numbers indicate that Scotland is a relatively low user of Tier 2, even taking into account the size of its population.
Table 8.2: Certificates of Sponsorship used by out-of-country and in-country Resident Labour Market Test, shortage occupation and intra-company transfer main applicants, Scotland, year to September 30 2012 Shortage
occupation RLMT Intra-company
transfer Total
In country 42 282 24 348
Out of country 58 129 218 405
Total 100 411 242 753
Proportion of all CoS used in Scotland
In country 0.06 0.37 0.03 0.46
Out of country 0.08 0.17 0.29 0.54
UK total 3,126 17,805 30,044 50,975
Proportion of UK total by route
Total 0.03 0.02 0.01 0.01 Note: See notes in Table 2.3. Source: UK Border Agency management information, year to September 30 2012
8.11 In summary, data on GDP at basic prices to Q2 2012 show that the Scottish economy remains in recession. There is evidence of ongoing labour market slack - the unemployment rate remains considerably higher than it was prior to the downturn. Median paid hours worked were lower in 2012 relative to 2007, while they remained unchanged for the UK as a whole. There is some evidence of skill shortages, although these shortages account for a small proportion of total vacancies and total employment. Scotland is a relatively low user of Tier 2.
8.3 Corporate partner engagement in Scotland
8.12 During the course of our call for evidence, we attended a general partner meeting in Glasgow in September 2012. We also met with employers and business representatives from the oil and gas sector in Aberdeen in November 2012. We received evidence from four partners in Scotland.
8.4 Evidence received in response to our call for evidence.
8.13 In Chapters 5, 6 and 7, we discuss job titles which we review for the UK shortage occupation list.
8.14 The following sub-sections discuss evidence we received relating to shortage in occupations and job titles experienced only in Scotland.
Chapter 8: Scotland
189
Occupations in the care sector
8.15 The Scottish Social Services Council (SSSC) told us that the social services sector currently employs around 200,000 workers in Scotland. Staff are employed in a number of sub-sectors including care homes for adults, day care for children‟s services, care at home services and residential child care services. The SSSC also told us that the private sector had overtaken the public sector as the largest employer of social care staff in Scotland, supported by considerable input from the voluntary sector.
8.16 The SSSC also told us that they were in the process of assessing the extent to which migrants are employed in the care home, care at home and housing support sub-sectors, where it is thought that the vast majority of non-EEA migrants find employment. This will provide better data upon which to base future evidence to us. It is important to note that occupations and job titles must be skilled at NQF6+ to be recommended for inclusion on the shortage occupation list.
8.17 The SSSC worked closely with other partners in the sector in considering whether to recommend any occupations or job titles for inclusion on the shortage occupation list for Scotland. However, the SSSC reported little take-up in this from their partners, which the SSSC considered to be a result of minimal use of the Tier 2 shortage occupation list route within the sector.
8.18 The Convention of Scottish Local Authorities (COSLA) told us that, in general terms, recruitment levels are very low across care services, with few skill shortages being reported. The economic restrictions faced by local authorities, they told us, were resulting in low recruitment levels within the social work sector. Based on vacancies advertised by local authorities, vacancy rates had dropped from 12 per cent to four per cent in the past year.
8.19 COSLA did say that there were still shortages of social workers in pockets of Scotland. For example, Shetland reported a shortage of specialist social workers in the areas of children and mental health, whilst North Ayrshire reported recent shortages for social workers and team managers within the Family Placement Team.
8.20 The evidence we received was not detailed enough in terms of shortage or sensible criteria for us to consider adding such social work specialties to the Scotland shortage occupation list, nor was it evident that any shortages were a national rather than a local issue. Evidence relating to social workers dealing with children and families across the whole of the UK is discussed in Chapter 7.
Occupations in the secondary education teaching sector
8.21 COSLA told us that some local authorities in Scotland reported shortages in relation to secondary education teaching. Four out of the five
Skilled, Shortage, Sensible
190
respondents to a COSLA survey indicated that they had experienced difficulty in recruiting science, physics and chemistry teachers. In Chapter 7 we recommend that secondary teaching professionals in the subjects of maths, chemistry and physics be retained on the UK shortage occupation list.
8.22 Two local authorities told COSLA that they had experienced a shortage of both home economics teachers and special educational needs teachers. However, we did not receive sufficient further evidence to enable us to conclude that shortages in these areas are applicable to the whole of Scotland rather than just the responding authority areas. As such, we do not recommend that the job titles secondary education teaching in the subject of home economics and special educational needs teaching are added to the shortage occupation list for Scotland.
8.5 Occupations in the health sector
8.23 The Scottish Government Health and Social Care Directorate provided evidence in relation to five job titles for inclusion on the shortage occupation list for Scotland. In this sub-section, we discuss each in turn.
8.24 Specialist Doctor Accident and Emergency: We were provided with evidence in relation to a shortage of doctors in accident and emergency units throughout Scotland. However, we were advised that there was no material difference between this job title and that of Emergency Medicine non-consultant, non-training post, which we have recommended for inclusion on the UK shortage occupation list. For the sake of clarity, in our recommended UK shortage occupation list, we will amend the job title Emergency Medicine non-consultant, non-training post to read Emergency Medicine non-consultant, non-training post (including specialist doctors working in accident and emergency).
8.25 Paediatrics: In our previous review of the shortage occupation list for Scotland, Migration Advisory Committee (2011a), we recommended the addition of middle grade paediatric doctors (grade Specialist Trainee ST3, ST5 and ST6), Staff and Associate Specialists (SAS) staff doctor in paediatrics and consultant in paediatrics be added to the shortage occupation list for Scotland. Grade specialist trainee ST4 was added to the UK shortage occupation list.
8.26 The Scottish Government Health and Social Care Directorate provided evidence to us of continuing shortage in the specialty of paediatrics. The Scottish NHS Boards reported that they had vacancies within the paediatric fields, mainly due to high numbers of staff in these grades taking maternity leave, part-time working, sickness absence, resigning or retiring. We were told that the above-average level of staff on maternity leave meant that the eight-year training programme was presently taking an average of 11 years to complete. This meant that the supply of fully trained paediatric staff was taking longer than expected to realise.

Chapter 8: Scotland
191
8.27 The Scottish Government Health and Social Care Directorate also told us that the general shortage of paediatric specialists at all levels meant that it was increasingly difficult to cover rotas. The use of locums to address this was becoming less effective as an interim measure due to a lack of quality locums. In the 11 months to April 2011, 12 per cent of all requests for locum cover in Scotland were for paediatricians, despite paediatric services constituting only five per cent of the total health service workforce.
8.28 We were told that the inability to use locum cover to reduce the effect of the shortage of paediatric specialists has resulted in increasing numbers of Boards employing consultants to cover the roles usually provided by doctors of a lower grade. This has significantly increased the cost to Boards of providing paediatric services. Again, this is becoming less viable as an option due to shortages at consultant level. As at 31 March 2011, Scottish Health Boards reported vacancy rates among paediatric consultants of six per cent.
8.29 The Scottish Government Health and Social Care Directorate told us that they were working closely with other partners to address the issue of shortage within the field of paediatrics. As we discussed in Chapter 5, the Centre for Workforce Intelligence (CfWI) told us the number of paediatric trainees in England and Wales was projected to exceed demand over the next few years. Similarly, the Directorate told us that the intake of paediatric trainees in Scotland, between 2013 and 2015, is projected to be twice the projected demand for such trainees. We were also told that the Chief Nursing Officer for Scotland is working closely with NHS Boards to ensure that paediatric services become less reliant on doctors in training. Instead, there will be greater focus on developing a multi-disciplinary team approach, including increased use of advanced paediatric nurses to deliver services.
8.30 Therefore, in light of evidence of continuing shortage, and the importance of the services provided by paediatric medical professionals, we recommend that middle grade paediatric doctors (grade Specialist Trainee ST3, ST5 and ST6), SAS staff doctors in paediatrics and consultants in paediatrics be retained on the shortage occupation list for Scotland. In addition, in Chapter 5 we have recommended that ST4 grade paediatricians be removed from the UK shortage occupation list. Therefore, we recommend that this job title be added to the shortage occupation list for Scotland.
8.31 Obstetrics and Gynaecology: This job title is not currently on the shortage occupation list for Scotland. The job title obstetrics and gynaecology non-consultant, non-training posts is on the current Tier 2 shortage occupation list. However, in Chapter 5 we recommend that the job title be removed, due to an absence of evidence of continued shortage.
8.32 However, the Scottish Government Health and Social Care Directorate told us that Boards in Scotland continued to report difficulty in recruiting
Skilled, Shortage, Sensible
192
specialty doctors in obstetrics and gynaecology. The Information Services Division (ISD) Scotland (a unit of the National Services Scotland) reported a vacancy rate (vacancies as a per cent of establishment) of 7.8 per cent (17 vacancies) as at 30 September 2012, and a 1.4 per cent vacancy rate for posts vacant for six months or longer (three vacancies). We were also told that, as is the case in the specialty of paediatrics, the ability of Health Boards to provide sufficient coverage is impacted upon by relatively high levels of maternity leave, part-time working, sick leave, or resignations.
8.33 Turning to sensible, the evidence we received was limited. We were told that Boards are actively taking steps to mitigate the impacts of any shortage, including reviewing skills mix to reduce reliance on skilled doctors. That said, plans are less developed at this stage than for paediatric services.
8.34 Therefore, whilst evidence in relation to sensible is limited, there is some evidence of a shortage of specialist doctors (non-consultant, non-training posts) in obstetrics and gynaecology. As such, we recommend that the job title specialist doctor (non-consultant, non-training post) in obstetrics and gynaecology is added to the shortage occupation list for Scotland. However, we will continue to monitor the situation, and will expect to see stronger evidence in relation to sensible should we be asked to review this job title in future.
8.35 Anaesthetics: We received limited evidence in terms of shortage as regards anaesthetics. However, we are mindful of the fact that in Chapter 5 we discussed evidence received from the Centre for Workforce Intelligence (CfWI) and the Department of Health that convinced us to recommend that non-consultant, non-training anaesthetists be added to the UK shortage occupation list.
8.36 The Scottish Government Health and Social Care Directorate told us that similar shortages are evident in Scotland. Indeed, they told us that shortages are more acute in Scotland, with data provided by IDS Scotland indicating a vacancy rate of 0.6 per cent as at 30 September 2012.
8.37 We were also told that one Board (Grampian) had advertised a vacancy for over six months. This vacancy remains unfilled. By contrast, the Greater Glasgow and Clyde Health Board have recently recruited 24 anaesthetists of varying grades. This suggests that any shortage is due to regional variation rather than a national shortage. However, most other Health Boards in Scotland have expressed concern that this level of recruitment will exacerbate the problems they face in recruiting anaesthetists in the near future.
8.38 In view of the fact that there is some evidence of recruitment difficulty, and in light of the need for such critical services to be provided on a round-the-clock basis, we recommend that middle training grade anaesthetic doctor (grade Specialist Trainee ST3, ST4, ST5 and ST6), SAS staff doctor in anaesthetics, and consultant in anaesthetics be added to the shortage occupation list for Scotland.
Chapter 8: Scotland
193
8.39 Staff working in diagnostics radiology (including magnetic resonance imaging): The Scottish Government Health and Social Care Directorate provided evidence to support the retention of roles within the Medical Physics profession on the shortage occupation list. In 2011, Health Boards in Scotland participated in a Short Life Working Group on Staffing for Medical Physics in Scotland (SLWG), which reported in October 2011.
8.40 One of the key recommendations of this report was that medical physicist posts be retained on either the UK shortage occupation list or the shortage occupation list for Scotland. As at October 2011, the relevant job titles were: nuclear medicine scientist; radiotherapy physicist; staff working in diagnostics radiology (including magnetic resonance imaging); HPC registered diagnostic radiographer; HPC registered therapeutic radiographer; sonographer; nuclear medicine technologist; and radiotherapy technologist.
8.41 Of the job titles listed in paragraph 8.40, all are recommended to be retained on the UK shortage occupation, with the exception of staff working in diagnostics radiology (including magnetic resonance imaging). It is this job title we discuss in this section.
8.42 The Scottish Government Health and Social Care Directorate told us that whilst colleagues in England and Wales had little difficulty in recruiting staff working in diagnostics radiology (including magnetic resonance imaging), the same could not be said for Boards in Scotland. We were told that recruitment across all grades, but particularly at Band 7 and above, was difficult. In the West of Scotland, for example, efforts to recruit two Band 7 posts were unsuccessful for a period of two years, leading the Board to appoint staff who still needed to complete a significant proportion of their studies. Similarly, Lothian Health Board reported that they had advertised 3 senior vacancies over a period of 20 months, receiving only one suitable application.
8.43 In terms of sensible, we were told that the Short Life Working Group (SLWG) recommended that Boards make significant effort to mitigate the situation. Boards were asked to identify critical Medical Physics posts to ensure adequate succession planning and recruitment, including consideration of the use of fast track vacancy control. Boards were also asked to review the skill mix within departments, to optimise existing resources.
8.44 The SLWG also recommended that Boards consider measures to mitigate recruitment difficulties, for example, through the use of more appropriate job descriptions and banding, or the use of local recruitment and retention premiums. Boards were asked to report back on progress in the latter part of 2012. However, the review of progress is not sufficiently mature as to form part of the evidence submitted to us for the review of the shortage occupation list. We would expect to see the findings of the SLWG‟s review should evidence be provided in respect of medical physicists in any future review of the shortage occupation list.
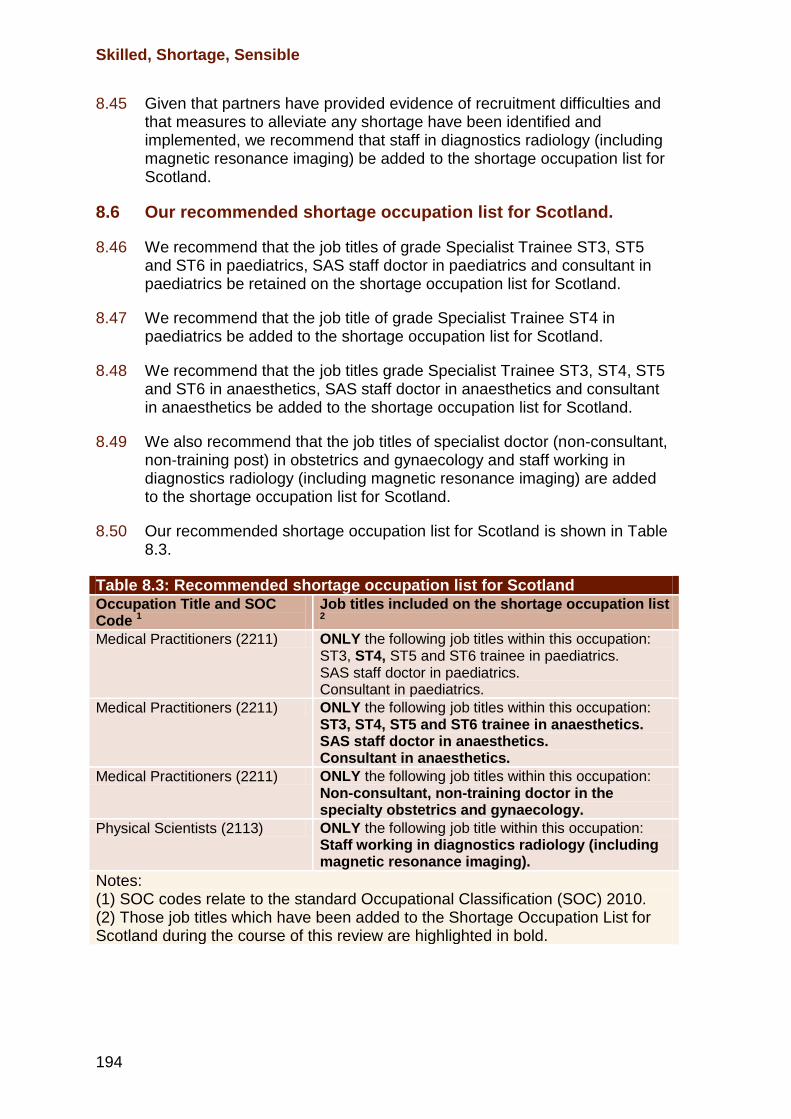
Skilled, Shortage, Sensible
194
8.45 Given that partners have provided evidence of recruitment difficulties and that measures to alleviate any shortage have been identified and implemented, we recommend that staff in diagnostics radiology (including magnetic resonance imaging) be added to the shortage occupation list for Scotland.
8.6 Our recommended shortage occupation list for Scotland.
8.46 We recommend that the job titles of grade Specialist Trainee ST3, ST5 and ST6 in paediatrics, SAS staff doctor in paediatrics and consultant in paediatrics be retained on the shortage occupation list for Scotland.
8.47 We recommend that the job title of grade Specialist Trainee ST4 in paediatrics be added to the shortage occupation list for Scotland.
8.48 We recommend that the job titles grade Specialist Trainee ST3, ST4, ST5 and ST6 in anaesthetics, SAS staff doctor in anaesthetics and consultant in anaesthetics be added to the shortage occupation list for Scotland.
8.49 We also recommend that the job titles of specialist doctor (non-consultant, non-training post) in obstetrics and gynaecology and staff working in diagnostics radiology (including magnetic resonance imaging) are added to the shortage occupation list for Scotland.
8.50 Our recommended shortage occupation list for Scotland is shown in Table 8.3.
Table 8.3: Recommended shortage occupation list for Scotland Occupation Title and SOC Code 1
Job titles included on the shortage occupation list 2
Medical Practitioners (2211) ONLY the following job titles within this occupation: ST3, ST4, ST5 and ST6 trainee in paediatrics. SAS staff doctor in paediatrics. Consultant in paediatrics.
Medical Practitioners (2211) ONLY the following job titles within this occupation: ST3, ST4, ST5 and ST6 trainee in anaesthetics. SAS staff doctor in anaesthetics. Consultant in anaesthetics.
Medical Practitioners (2211) ONLY the following job titles within this occupation: Non-consultant, non-training doctor in the specialty obstetrics and gynaecology.
Physical Scientists (2113) ONLY the following job title within this occupation: Staff working in diagnostics radiology (including magnetic resonance imaging).
Notes: (1) SOC codes relate to the standard Occupational Classification (SOC) 2010. (2) Those job titles which have been added to the Shortage Occupation List for Scotland during the course of this review are highlighted in bold.

195
9.1 Introduction
9.1 In this chapter we consider the following question we received in our commission from the Government:
“The Government has retained within Tier 2 the following creative occupations in the arts and design fields which are not skilled to NQF level 6: artists, authors, actors, dancers and designers. Does the MAC see a case for continued inclusion of certain creative occupations in Tier 2 and, if so, on what terms?”
9.2 This is a separate issue to the review of the shortage occupation list covered in Chapters 4 to 8.
What are the creative occupations?
9.3 In April 2012, the Government announced that it would be making changes to Tier 2 of the Points Based System (Home Office, 2012a). Among other things, the statement announced that the Government would increase the minimum skill level for Tier 2 occupations to National Qualifications Framework level 6 and above (NQF6+), but that there would be exceptions for the following creative occupations as defined by the Standard Occupational Classification (SOC) 2010 format:
3411 artists;
3412 authors, writers and translators;
3413 actors, entertainers and presenters;
3414 dancers and choreographers; and
3422 product, clothing and related designers.
9.4 We have considered our commission in the context of the five occupations that the Government has specified. Based on the discussion we present throughout this chapter, we propose that the creative occupations that Government has specified continue to be exempted from the skill requirement for Tier 2 and that the relevant existing codes of practice should apply.
Chapter 9 Creative occupations

Skilled, Shortage, Sensible
196
9.5 Should the Government wish to expand the list of identified creative occupations, the following options could be considered:
the Office for National Statistics (ONS) definition of creative occupations in the SOC. The 2-digit SOC code (34) culture, media and sport occupations covers the 3-digit codes (341) artistic, literary and media occupations, (342) design occupations and (344) sports and fitness occupations;
the ONS definition of the creative industries in the Standard Industrial Classification (SIC). Section R covers arts, entertainment and recreations, and within this division (90) creative, arts and entertainment activities could be used to define a creative industry;
the definition adopted by the sector skills councils, which includes creative media, entertainment and cultural industries as well as digital technologies; or
the definition of creative occupations used by the Department for Culture, Media and Sport (DCMS). This definition is based on the SIC 2007 and has evolved over time.
9.6 We were told by partners that there is an ongoing collaborative project, led by Creative Skillset and involving Creative and Cultural Skills, DCMS and the National Endowment of Science, Technology and the Arts (NESTA) to create a new definition of the creative sector. Specifically, we understand that although the current definition is well known and well regarded it is also believed that there are some issues with it, including:
the lack of a clear rationale for the broad sectors which are included;
issues of overlap between these broad sectors; and
issues arising from imperfect mapping from the broad sectors to SIC industries.
9.7 At the time of writing, the Creative Skillset project is ongoing. In due course, the Government may wish to consider the Creative Skillset definition of creative occupations in light of the findings of this project.
9.8 This chapter is structured as follows:
Section 9.2 considers various estimates of the value of creative occupations to the UK economy;
Section 9.3 describes the creative occupations in the context of the Points Based System and provides a comparison with approaches with other developed economies;
Section 9.4 outlines the options that we considered for the treatment of the creative occupations; and

Chapter 9: Creative occupations
197
Section 9.5 sets out our conclusions and recommendations.
9.2 Creative occupations in the context of the UK economy
9.9 This section considers the role of creative occupations in the wider UK economy, their impact on the UK labour market and their contribution to the balance of trade.
Box 9.1: Department for Culture, Media and Sport economic estimates for the creative industry* – key findings, 2011 Contribution to the economy – Gross Value Added - The Creative Industries accounted for 2.89 per cent of Gross Value Added1 (GVA) in
the UK in 2009. - Relative to the UK‟s total GVA, the Creative Industries GVA increased by 0.07 per
cent in 2009 (from 2.82 per cent in 2008), but in absolute terms the GVA reduced by 1 per cent from 2008 (£36.6 billion to £36.3 billion).
- Of the Creative Industries, publishing had the largest contribution to the UK‟s GVA, accounting for 0.92 per cent in 2009.
Exports of Services - The Creative Industries accounted for 10.6 per cent of the UK‟s exports by value in
2009. - Publishing and TV & Radio accounted for the highest exports of services (3.1 per
cent and 2.6 per cent of the UK‟s exports respectively). Employment - 1.5 million people were employed in either the Creative Industries or in a creative
role in another industry in 2010 (5.14 per cent of UK employment). This was a small increase on 2009 (1.44 million employed and 4.99 per cent of UK employment).
- Music & Visual and Performing Arts were the largest employers in the Creative Industries with 300,000 employed in 2010 (1 per cent of UK employment).
Number of Businesses - In 2011 there were 106,700 creative enterprises (5.13 per cent of UK employment)
and 108,820 creative local units (4.27 per cent of the UK creative units). - This represented an increase in both enterprises (4.9 per cent to 5.1 per cent) and
local units (4.2 per cent to 4.3 per cent) from 2009. - Music & Visual and Performing Arts accounted for the largest contribution to the
number of businesses (1.46 per cent of the UK for enterprises and 1.21 per cent of the UK for local units in 2011).
Note: * The creative industry as defined by DCMS includes advertising; architecture; art and antiques; crafts; design; designer fashion; film and video; interactive leisure software; music; the performing arts; publishing; software and computer services; and television and radio. Source: Department for Culture, Media and Sport (2011)
9.10 In 2011 total final household consumption expenditure on recreation and culture was approximately £99.6bn, or 6.9 per cent of total Gross
1 Gross Value Added is the value of output in the industry excluding taxes and subsidies. It is the
standard measure used in official statistics to measure the contribution of industries to the economy, and enables comparison across sectors/industries. It is calculated as follows: GVA + taxes on products – subsidies on products = Gross Domestic Product GDP and GVA are closely linked, but by accounting for taxes and subsidies directly applied to products, GVA provides a better measure of the contribution of Creative Industries to the economy.
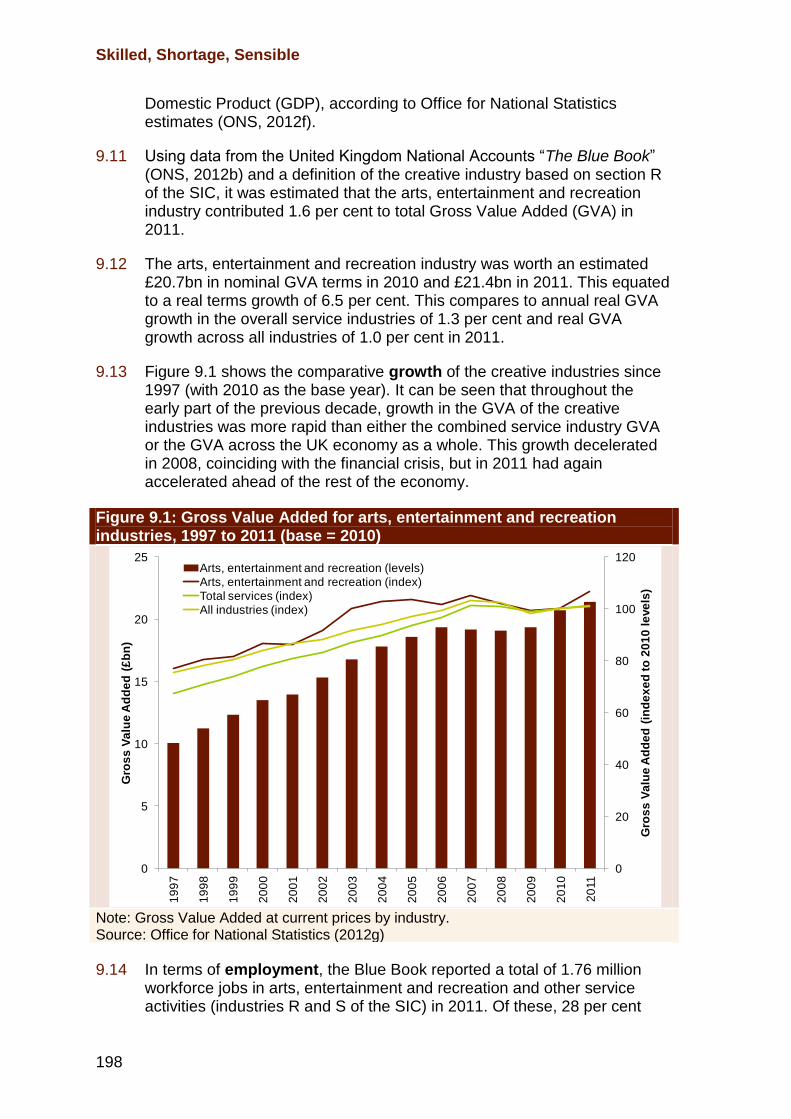
Skilled, Shortage, Sensible
198
Domestic Product (GDP), according to Office for National Statistics estimates (ONS, 2012f).
9.11 Using data from the United Kingdom National Accounts “The Blue Book” (ONS, 2012b) and a definition of the creative industry based on section R of the SIC, it was estimated that the arts, entertainment and recreation industry contributed 1.6 per cent to total Gross Value Added (GVA) in 2011.
9.12 The arts, entertainment and recreation industry was worth an estimated £20.7bn in nominal GVA terms in 2010 and £21.4bn in 2011. This equated to a real terms growth of 6.5 per cent. This compares to annual real GVA growth in the overall service industries of 1.3 per cent and real GVA growth across all industries of 1.0 per cent in 2011.
9.13 Figure 9.1 shows the comparative growth of the creative industries since 1997 (with 2010 as the base year). It can be seen that throughout the early part of the previous decade, growth in the GVA of the creative industries was more rapid than either the combined service industry GVA or the GVA across the UK economy as a whole. This growth decelerated in 2008, coinciding with the financial crisis, but in 2011 had again accelerated ahead of the rest of the economy.
Figure 9.1: Gross Value Added for arts, entertainment and recreation industries, 1997 to 2011 (base = 2010)
Note: Gross Value Added at current prices by industry. Source: Office for National Statistics (2012g)
9.14 In terms of employment, the Blue Book reported a total of 1.76 million workforce jobs in arts, entertainment and recreation and other service activities (industries R and S of the SIC) in 2011. Of these, 28 per cent
0
20
40
60
80
100
120
0
5
10
15
20
25
19
97
19
98
19
99
20
00
20
01
20
02
20
03
20
04
20
05
20
06
20
07
20
08
20
09
20
10
20
11
Gro
ss
Va
lue
Ad
de
d (
ind
ex
ed
to
20
10
le
ve
ls)
Gro
ss
Va
lue
Ad
de
d (
£b
n)
Arts, entertainment and recreation (levels)
Arts, entertainment and recreation (index)
Total services (index)
All industries (index)
Chapter 9: Creative occupations
199
were self-employed. The number of employees and government-sponsored trainees in the industry had increased from 1.03 million in 1997 to 1.27 million in 2011. Therefore, according to the Blue Book estimates, these industries account for approximately 5.6 per cent of total UK jobs.
“Key talent from around the world make an enormous contribution … and we therefore consider that it is extremely important that talented workers from outside the EEA are able to continue to come and work in the UK under the SOL and the Tier 2 system.”
Producers Alliance for Cinema and Television response to MAC call for evidence
9.15 Using the Annual Population Survey for the year to June 2012, it is possible to estimate employment in selected creative occupations. These estimates are shown in Table 9.1 and show that there are approximately 252,800 workers employed in the five occupations specified in our commission.
9.16 The table also shows the proportion of each occupation in full-time and part-time employment. In the three months to October 2012, the proportion of all employees working on a part-time basis nationally was approximately 27 per cent. By comparison, the selected creative occupations tend to be characterised by a higher proportion of part-time workers than the national average. The full-time versus part-time employment composition is important when examining the reasons why 5.6 per cent of workforce jobs accounted for approximately 1.6 per cent of GVA in 2011.
9.17 Partners in these occupations told us that in many cases the atypical nature of the work in this sector, where bursts of activity throughout the year are interspersed with periods of quiet, are a key reason why GVA in the industry is low relative to the size of the workforce. We should therefore interpret part-time working in this context, rather than in the sense of working fewer hours than a full-time equivalent working week.
Skilled, Shortage, Sensible
200
Table 9.1: Employment in selected creative occupations, year to June 2012 4-digit SOC
Occupation Proportion in full-time employment (%)
Proportion in part-time employment (%)
Employment
3411 Artists 64 36 43,100
3412 Authors, writers and translators
60 40 77,800
3413 Actors, entertainers and presenters
54 46 40,700
3414 Dancers and choreographers 44 56 17,800
3422 Product, clothing and related designers
86 14 73,500
Notes: Figures for employment are rounded to the nearest hundred. Source: Annual Population Survey, July 2011 to June 2012
“ … our reach extends beyond the theatre itself, this will continue to create demand across different digital platforms and create jobs in these related industries.”
Royal Opera House response to MAC call for evidence
9.18 In considering the growth of the sector, the contribution to the economy and to employment, it is important to consider the productivity of workers in these industries. Furthermore it will be important to distinguish between productivity per worker (affected by full-time and part-time working patterns), which is typically lower than the national average, and productivity per hour which is typically higher than the national average.
9.19 One estimate we can consider is the pay of workers in the occupations set out in our commission. Data from the Annual Survey of Hours and Earnings (ASHE) for 2011 can be used to specifically consider the pay of the employees in occupations classified by SOC as culture or media-related. The median annual full-time pay for SOC 341 artistic, literary or media occupations was £30,293 and for SOC 342 design occupations it was £25,830. Table 9.2 shows, where reliable data are available, median hourly and annual full-time pay for three of the five creative occupations specified in our commission.
Chapter 9: Creative occupations
201
Table 9.2: Median gross annual pay for full-time employees in selected creative occupations, 2011 4-digit SOC
Occupation Median hourly pay (£)
Median annual pay (£)
3411 Artists 12.19 25,162
3412 Authors, writers and translators 13.49 27,507
3413 Actors, entertainers and presenters x x
3414 Dancers and choreographers x x
3422 Product, clothing and related designers 13.56 29,321
All employees 12.64 26,095
Notes: x – data are unreliable due to small sample sizes. Source: Annual Survey of Hours and Earnings (2011)
9.20 Alternatively we can consider the GVA per workforce job. In 2011, GVA per workforce job was £22,409 in the arts and recreation and other service industries, as compared to £42,960 across all industries. As discussed earlier, the lower level of GVA per workforce job in the arts and recreation industries may be a consequence of the composition of part-time relative to full-time working patterns in these industries.
9.21 Despite the apparent low productivity, analysis by the UK Commission for Employment and Skills (UKCES, 2012c) estimated that over 40 per cent of the digital and creative sectors‟2 workforce (a wider definition of creative occupations than set out in Section 9.1) are qualified to at least first degree level or equivalent and 15 per cent have a post graduate qualification. Their analysis estimates that 37 per cent of workers are in firms with fewer than 25 employees and 17 per cent in firms with 500 or more employees.
9.22 The UK is a net exporter of personal, cultural and recreational services, and although accounting for a small proportion of UK output, it positively contributes to the UK balance of trade. The United Kingdom Balance of Payments (ONS, 2012h) - “The Pink Book” - estimated the value of net exports of this industry to be £2.2bn in 2011 (shown in Figure 9.2). When describing the international standing of the UK creative sector (separated from the digital sector), UKCES (2012c) argues that:
“The UK is the largest producer of TV and radio content in Europe, with only the US generating more value from TV exports. It has the largest publishing industry in Europe, and the third largest filmed entertainment market globally … Exports from across the creative industries are
2 The digital and creative sector, as defined by the UKCES, covers the following Standard
Industrial Classification codes: 61 telecommunications; 62 computer programming; 63 information service activities; 95 repair of computers and other goods; 58 publishing; 59 motion pictures; 60 programming and broadcasting; 73 advertising and market research; 74 other professional scientific and technical activities; 90 creative arts and entertainment; and 91 libraries, archives, and museums.
Skilled, Shortage, Sensible
202
estimated to be worth £8.9 billion annually to the UK economy, 10.6 per cent of all service sector exports.”
9.23 Figure 9.2 shows the increase in net exports (driven by rising exports) of personal, cultural and recreational services between 1997 and 2011. It can be seen that the impact on the UK balance of payments is positive and increasing over recent years.
Figure 9.2: UK trade of personal, cultural and recreational services, 1997 to 2011
Notes: Figures for 2011 are provisional. Source: Office for National Statistics (2012h)
9.24 The Government‟s report “Plan for Growth” (HM Treasury, 2011) identified the creative industry as one of the industries where the UK can become a world leader and gave an undertaking to improve skills in this area: “The Digital and Creative Industries (D&CI) have the potential to drive significant growth in the UK. Their exports are third only to advanced engineering and financial and professional services …Skills shortages in the industry have a detrimental impact on growth … The Government will improve the stock of skills in the digital and creative industries” (HMT, 2011).
“ … the ability to recruit these roles under Tier Two may make a significant contribution to the UK economy.”
Employment Lawyer Association response to MAC call for evidence
0.0
0.5
1.0
1.5
2.0
2.5
3.0
3.5
19
97
19
98
19
99
20
00
20
01
20
02
20
03
20
04
20
05
20
06
20
07
20
08
20
09
20
10
20
11
Imp
ort
s, e
xp
ort
s a
nd
ne
t tr
ad
e (
£ b
illi
on
)
Net
Exports
Imports
Chapter 9: Creative occupations
203
9.25 The evidence from partners combined with our analysis of the recent and projected growth in the industry, plus the encouraging statements from the Government, make the case for facilitating further growth in the industry.
“Creative occupations are an important component of social and cultural life, and contribute to the economy. “
Department of Education and Skills Welsh Government response to MAC call for evidence
9.3 Immigration systems and the creative occupations
9.26 This section provides a summary of the various routes available through the Points Based System (PBS) for workers in the creative occupations in the UK. It then considers the approaches taken in other developed countries for creative occupations and considers the extent to which these are permanent or temporary in nature and the degree to which they align with the UK‟s approach.
9.27 As set out in Chapter 2, Tier 2 of the PBS comprises several routes, of which the most relevant for the creative occupations are Tier 2 (General) and Tier 2 (intra-company transfer). Applicants via the Tier 2 (General) route can apply to come to the UK to do a skilled job which has either passed the Resident Labour Market Test (RLMT) or is on the shortage occupation list.
9.28 The UK Border Agency uses codes of practice to detail further conditions that must be met by migrants and their sponsors for applications under Tier 2. The codes of practice list:
the occupations and some job titles for which sponsors can issue a Certificate of Sponsorship (CoS), although this is not a comprehensive list;
the minimum appropriate pay for occupations and some job titles; and
the advertising requirements that employers need to fulfil in order to show that there is no suitably qualified worker from within the UK or the European Economic Area (EEA) available to fill a specific skilled vacancy.
9.29 Separate codes of practice have been agreed by the UK Border Agency with the creative sector for workers in dance, theatre, film and television. In order to sponsor migrants to the UK in these occupations under Tier 2, the employer needs to comply with the relevant Section R (Arts, entertainment and recreation) of the Tier 2 code of practice and the relevant creative occupation code for ballet dancers; dancers (other than ballet); performers in theatre and opera; performers in film and television; or workers in film and television.
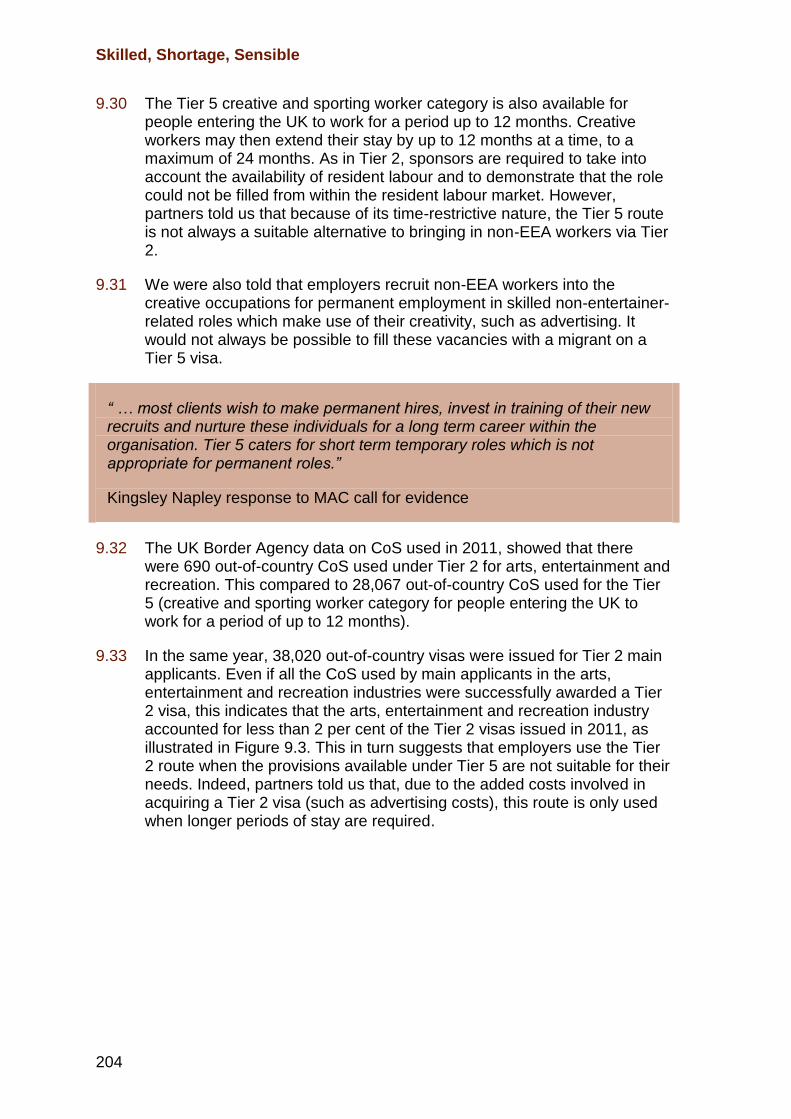
Skilled, Shortage, Sensible
204
9.30 The Tier 5 creative and sporting worker category is also available for people entering the UK to work for a period up to 12 months. Creative workers may then extend their stay by up to 12 months at a time, to a maximum of 24 months. As in Tier 2, sponsors are required to take into account the availability of resident labour and to demonstrate that the role could not be filled from within the resident labour market. However, partners told us that because of its time-restrictive nature, the Tier 5 route is not always a suitable alternative to bringing in non-EEA workers via Tier 2.
9.31 We were also told that employers recruit non-EEA workers into the creative occupations for permanent employment in skilled non-entertainer-related roles which make use of their creativity, such as advertising. It would not always be possible to fill these vacancies with a migrant on a Tier 5 visa.
“ … most clients wish to make permanent hires, invest in training of their new recruits and nurture these individuals for a long term career within the organisation. Tier 5 caters for short term temporary roles which is not appropriate for permanent roles.”
Kingsley Napley response to MAC call for evidence
9.32 The UK Border Agency data on CoS used in 2011, showed that there were 690 out-of-country CoS used under Tier 2 for arts, entertainment and recreation. This compared to 28,067 out-of-country CoS used for the Tier 5 (creative and sporting worker category for people entering the UK to work for a period of up to 12 months).
9.33 In the same year, 38,020 out-of-country visas were issued for Tier 2 main applicants. Even if all the CoS used by main applicants in the arts, entertainment and recreation industries were successfully awarded a Tier 2 visa, this indicates that the arts, entertainment and recreation industry accounted for less than 2 per cent of the Tier 2 visas issued in 2011, as illustrated in Figure 9.3. This in turn suggests that employers use the Tier 2 route when the provisions available under Tier 5 are not suitable for their needs. Indeed, partners told us that, due to the added costs involved in acquiring a Tier 2 visa (such as advertising costs), this route is only used when longer periods of stay are required.
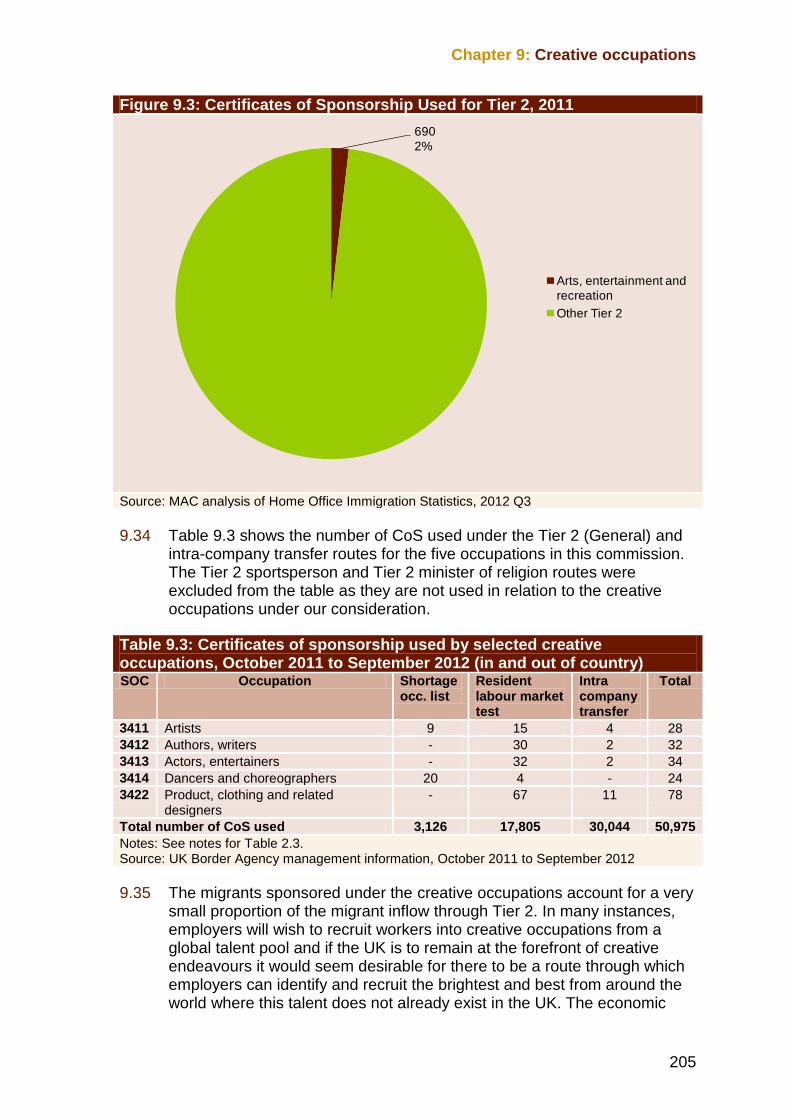
Chapter 9: Creative occupations
205
Figure 9.3: Certificates of Sponsorship Used for Tier 2, 2011
Source: MAC analysis of Home Office Immigration Statistics, 2012 Q3
9.34 Table 9.3 shows the number of CoS used under the Tier 2 (General) and intra-company transfer routes for the five occupations in this commission. The Tier 2 sportsperson and Tier 2 minister of religion routes were excluded from the table as they are not used in relation to the creative occupations under our consideration.
Table 9.3: Certificates of sponsorship used by selected creative occupations, October 2011 to September 2012 (in and out of country) SOC Occupation Shortage
occ. list Resident labour market test
Intra company transfer
Total
3411 Artists 9 15 4 28
3412 Authors, writers - 30 2 32
3413 Actors, entertainers - 32 2 34
3414 Dancers and choreographers 20 4 - 24
3422 Product, clothing and related designers
- 67 11 78
Total number of CoS used 3,126 17,805 30,044 50,975
Notes: See notes for Table 2.3. Source: UK Border Agency management information, October 2011 to September 2012
9.35 The migrants sponsored under the creative occupations account for a very small proportion of the migrant inflow through Tier 2. In many instances, employers will wish to recruit workers into creative occupations from a global talent pool and if the UK is to remain at the forefront of creative endeavours it would seem desirable for there to be a route through which employers can identify and recruit the brightest and best from around the world where this talent does not already exist in the UK. The economic
690
2%
Arts, entertainment and
recreation
Other Tier 2
Skilled, Shortage, Sensible
206
contribution to the UK balance of trade of those employed in creative occupations, combined with statements by the Government recognising the significance of this, similarly point to the same conclusion.
9.36 We looked to see whether other countries have put in place specific measures to benefit their creative sectors. Box 9.2 considers the approaches by the immigration authorities in the United States, New Zealand, Canada, Australia, Italy and Norway towards creative occupations. Of particular interest is the extent to which these approaches are comparable to the current arrangements in the PBS.
Box 9.2: Migration policies for creative occupations in selected countries
In the United States there are four main ways to recruit a migrant to work, on a temporary basis, in the creative arts field:
The O-1 non-immigrant visa route is available for an individual who possesses extraordinary ability in areas such as the arts, which has been demonstrated by sustained national or international acclaim. This route also accommodates those who have a demonstrated record of extraordinary achievement in the motion picture or television industry and have been recognised nationally or internationally for those achievements. The requirements in this category are similar to those provided under the Exceptional Talent visa route within the UK PBS. However, unlike in the United States, where the route is temporary, in the UK the Exceptional Talent route can lead to permanent residency after a period of five years continuous stay.
The United States also allows for members of an internationally recognized entertainment group to enter the country temporarily to perform by way of the P-1B visa route.
The P-2 visa route is for performers under an exchange programme between an organisation in the United States and an organisation in another country for a period up to one year.
The P-3 visa route is for those who wish to temporarily enter the United States to perform, teach or coach as artists or entertainers, individually or as part of a group, under a program that is culturally unique.
New Zealand offers those seeking work in the field of arts, culture and sports, the opportunity to enter the country via the Talent (Arts, Culture and Sports) visa route, which allows migrants to work in New Zealand for up to 30 months. After two years of active engagement in their field of talent, the migrant can apply for residency. This route has similarities with the UK‟s Exceptional Talent route. Additionally, temporary workers in the entertainment, music, film and television industries who intend to be in New Zealand for a specific purpose or event (such as an acting or production role in film or television) need to apply for a work visa under the Specific Purpose or Event immigration instructions. This category has similarities with the requirements under Tier 5 (Temporary Worker – creative and sporting) of the PBS. However, unlike in the UK the New Zealand work visa is not restricted to 12 months. In Canada, employers must seek approval from Human Resources and Skills Development Canada or a Service Canada Labour Market Opinion before hiring most foreign workers in film and entertainment. This prior approval is intended to ensure that the employment of foreign workers supports economic growth and helps create more opportunities for all Canadians. Workers who intend to work temporarily in Australia in the entertainment industry can
Chapter 9: Creative occupations
207
Box 9.2: Migration policies for creative occupations in selected countries apply for an Entertainment Visa, also known as subclass 420. This visa allows the applicant to undertake work in film, television or live productions in either a performance or behind-the scenes role. The applicant must:
be sponsored by an approved entertainment sponsor;
have been nominated by a sponsor to fill a position;
have experience or skill which match those required for the nominated position.
The visa allows an individual or groups to stay and work in the entertainment industry in Australia for the period specified in the nomination, but no longer than two years. Again, the requirements in this category are similar to those provided under Tier 5 (Temporary Worker – creative and sporting) of the PBS. In Italy, a visa is required for what is described as subordinate employment and covers workers migrating to Italy for employment as sports personnel, athletes and entertainment industry personnel. It also covers a wide range of other employment including domestic workers, highly-skilled labourers, university lecturers and professors, and nurses. Migrants in performing arts work are required to provide proof of contract between the artist and the contracting organisation, whether this is an Italian or foreign employer or an Italian contractor. For internationally recognised or qualified artists and for artists or musical groups engaged by well-known theatres it is sufficient to submit the agreed contract or proof that the contract has been drawn along with information concerning the performance. Norway requires that the potential migrant must have an offer of employment as a performer, musician or artist, or be part of the necessary accompanying support staff in order to be granted a residence permit. The purpose of the work must be to present culture, for example through music, dance, theatre or circus performances. Importantly, it is required that the migrant is employed on a full-time basis and pay and working conditions cannot be poorer than the applicable collective industry agreement (or normal pay and conditions for the occupation and pace of work). If the artist/performers assignment is for a period of less than 14 days, then Norway does not require a residence permit. Source: Migration Advisory Committee
9.37 The international comparisons in Box 9.2, suggest that other countries provide for persons working in creative occupations to come and work on both a temporary and a permanent basis and often link decisions about whether to grant visas to a consideration of the impact on the domestic labour force. Some countries take account of extraordinary achievement while others look more directly at the wider cultural impact of the imported creative talent. To this extent, there appears to be to some extent a match-up with the UK‟s PBS provisions for creative occupations through Tier 1 Exceptional Talent, Tier 2 and Tier 5 indicating that the UK is not out of step with the international community in how it facilitates immigration to work in creative occupations.
The skill level of creative occupations
9.38 In February 2012, we recommended the list of occupations that we considered as skilled at NQF6+ under the SOC 2000 format. We reviewed
Skilled, Shortage, Sensible
208
this list again in October 2012 under the new SOC 2010 format. We discuss our current methodology for defining skilled occupations in Chapter 3.
9.39 With the exception of certain job-titles listed under the shortage occupation list, only individuals seeking employment in occupations skilled at NQF6+ have access to Tier 2. That said, our current methodology does allow for identifying skilled jobs within non-skilled occupations.
9.40 Partners have questioned whether it is appropriate to consider creative occupations, including those listed in the Government‟s exemptions to the Tier 2 minimum skill level, as insufficiently skilled occupations to pass the NQF6+ requirements. Dance companies, in particular, have strongly argued that bottom-up criteria were most relevant for roles in the 3414 dancers and choreographers occupation.
“So far not enough attention has been given to the „bottom up‟ criteria in relation to dancers ...”
Royal Opera House response to MAC call for evidence
9.41 Academic qualifications, they argue, are not relevant to the practicalities of being a professional dancer and greater emphasis should be placed on non-academic skills.
“ … it is evident that a person‟s skill and ability in these occupations might not traditionally be measured by qualifications held and instead quite often relates to an “innate ability” which of course is far more difficult to quantify.”
Newland Chase response to MAC call for evidence
9.42 In November 2010, we commissioned research (Frontier Economics, 2010) to assess our top-down methodology for defining occupations (at the time NQF3+). The research concluded that our broad approach, given the data available, was valid pointing out that “using formal qualifications on their own … might not accurately reflect skills as required by occupations … the problem could be mitigated by combining this measure with other measures of skills.”
9.43 The report also noted that “while in some cases it is relatively straightforward to distinguish between skilled and unskilled occupations, for a significant number of occupations this is not so clear-cut. It is critical that the approach adopted by the MAC is consistent and robust in dealing with these „grey areas‟.”
9.44 It is not immediately clear to us what additional, consistent and objective adjustment could be used to robustly capture the non-academic element
Chapter 9: Creative occupations
209
of the skill level of an occupation, beyond the indicators currently used in our analysis.
9.45 When we reviewed the skill level of occupations under Tier 2 in Migration Advisory Committee (2012a), we said that “it is clear that the characteristics of artistic and creative industries mean that top-down indicators of skill do not necessarily give an accurate reflection of the skill required for these roles. There may therefore be merit in considering whether they require separate treatment within the PBS, whether this be within Tier 2 or a separate route.”
9.4 Options we considered for the creative occupations
9.46 This section considers two potential options which the Government might consider for treatment of creative occupations under the PBS, namely maintaining the status quo and creating a new route just for these occupations.
9.47 We have considered these options in the context of the five occupations specified in our commission. We expect that the Government will consider this discussion in the context of its own definition of creative occupations.
Maintain the current arrangements
9.48 The first option we considered is to make no change to the treatment of creative occupations (as defined by the Government) and to acknowledge instead that they are an exceptional case which requires exceptional treatment in terms of the skills requirement for Tier 2.
9.49 We consider that there is a case for including creative occupations within Tier 2. However, our methodology for identifying skill at graduate level will not fully cover non-academic skill sets, thus putting creative occupations at a disadvantage compared to more academic occupations. Relatively low pay across the creative occupations can exacerbate this.
“Pact strongly urges the MAC to retain the current position for Tier 2 creative roles and creative roles listed on the SOL.”
Producers Alliance for Cinema and Television response to MAC call for evidence
“ELA considers that it is appropriate for certain creative sector jobs to be included in Tier Two even if they are not skilled to NQF Level 6 or above.”
Employment Lawyer Association response to MAC call for evidence
9.50 A policy response would be to exempt the creative occupations from the skill requirement as currently under Tier 2 of the PBS. This is what the
Skilled, Shortage, Sensible
210
Government have chosen to do currently on a temporary basis. We did not receive any evidence to indicate that maintaining the current arrangements would adversely impact on partners.
A new creative route
9.51 A second option for the treatment of creative occupations is to establish a new route specifically for these occupations (however defined by the Government).
9.52 As discussed in Box 9.2, other countries make separate provision in their immigration systems for creative occupations.
9.53 Tier 2 of the PBS already has special provision for ministers of religion and sportspersons and there are also separate codes of practice for some creative occupations. These points towards the fact that there is already an acceptance of the principle of separate treatment for selected creative occupations.
9.54 The UK also already has provision within Tier 1 for people who are internationally recognised as world leaders or potential world-leading talent in the arts. A new creative route within Tier 2 would distinguish creative occupations from other occupations in providing them with separate treatment. If the Government wished to impose additional requirements on immigrants coming to work in creative occupations they could do this more easily if there was a separate route just for these occupations.
9.55 We suggest that any new route should be under Tier 2 rather than Tier 5 as the former provides for migration to the UK for a longer period. Tier 5 will remain the preferred route for employment in the UK on a short-term basis.
9.56 A new route within Tier 2 would potentially allow:
the economic benefits of migrant workers in creative occupations, both in terms of economic output and knowledge transfer, to be accrued to the UK for a period of time longer than currently possible under Tier 2;
the integrity of the skill level for Tier 2 (General), as currently defined, to be maintained; and
the potential for a more consistent and widespread use of the codes of practice for workers and performers in dance, opera, theatre, film and television.
9.57 However, partners were concerned that any new route should not prevent the occupation from making a case to add a job title to the shortage occupation list during times of labour shortage. For the most part, partners were in favour of a new route for creative occupations in the eventuality
Chapter 9: Creative occupations
211
that their job titles could no longer be added to the shortage occupation list.
9.58 In some occupations, particularly SOC 3413 actors, entertainers and presenters, we were told that potential access to the shortage occupation list not only allowed for timely entry to the UK to engage with, often large, film and television productions, it also provided certainty to financiers that cast members and crew with the right set of skills would be available to work on the project. Given that the financial backing for a project in the film and tv industry is often conditional on securing specific individuals in specific roles, we were told this can be a deciding factor in whether a production (and associated economic benefits) are realised or not.
“the … job titles should certainly be retained within Tier 2 and, should at any point they cease to be on the shortage occupation list, an alternative, bespoke route within Tier 2 would be appropriate.”
Society of London Theatre, the Theatrical Management Association , the Independent Theatre Council, Dance UK, and the National Campaign for the Arts joint response to MAC call for evidence
“UK Screen and Creative Skillset … do not, as present, see a simple solution to a creative route that would cover roles as varied as ballet dancer and software developer, actor and compositor, author and VFX supervisor.”
UK Screen Association response to MAC call for evidence
Other issues raised by partners in relation to the creative occupations
9.59 Performers and workers in some creative occupations, notably dancers, and performers and workers in film and television are covered by separate codes of practice. These codes of practice identify a number of key categories, such as workers in senior creative positions, workers required for production continuity and highly specialist roles which are exempt from the Resident Labour Market Test (RLMT).
“If at any point, they ceased to be in shortage, they would still need a reliable Tier 2 route. We think that, in those circumstances, a bespoke route …would be appropriate. This could either take the form of a stand-alone route …or a wider creative route. “
Society of London Theatre, the Theatrical Management Association , the Independent Theatre Council , Dance UK, and the National Campaign for the Arts joint response to MAC call for evidence
Skilled, Shortage, Sensible
212
9.60 Several partners told us that for creative occupations not covered by these separate code of practice, the requirement to advertise vacancies for the purpose of satisfying the RLMT was inefficient as, due to the attractiveness of the industry, it was not uncommon for many employers to receive a steady stream of CVs and unsolicited applications from applicants. However even if this is the case, we do not consider that this undermines the principle of requiring employers to test against the resident labour market when they do have a vacancy.
9.61 We also received concerns from partners that a potential gap may exist in the codes of practice for Tier 2 and Tier 5 for the support staff of workers and performers in creative occupations. At our meetings with the industry we encouraged partners to engage with the Government on these issues to clarify the provisions within the existing Tier 2 and Tier 5 codes of practice.
9.5 Conclusions
9.62 On the basis of our consideration as reflected in this chapter, we recommend maintaining the current arrangements for the creative occupations. We find that there is a case for maintaining artists, authors, actors, dancers and designers under Tier 2 of the PBS by:
exempting them from them from the skill requirement; and
applying the current Tier 2 codes of practice for creative occupations.
9.63 We also believe that there is a case for:
allowing creative occupations and/or selected job titles within these occupations to be added to the shortage occupation lists if they pass our three tests (skill, shortage and sensible); and
job titles in creative occupations which are skilled at NQF4+ but not at NQF6+ and currently in the UK shortage occupation list be retained if they pass our shortage and sensible tests.
9.64 We expect the Government will update the Tier 2 codes of practice relevant to the codes of practice to reflect SOC 2010 and the existing salary guidance. The following chapter will set out our conclusions and recommendations from this review.
213
10.1 Introduction
10.1 We are grateful to partners who have contributed to the evidence base of this review. This represents our sixth review of the shortage occupation lists since our first report in autumn 2008.
10.2 We estimate that the job titles and occupations on our recommended list employ approximately 180,000 people in the UK, accounting for under 1 per cent of total employment in the UK. This estimate relates to the number of people (migrant and non-migrants) currently working in those occupations and job titles. Our recommended shortage occupation list for the UK is set out in Table 10.1.
10.3 The shortage occupation list for Scotland only is presented in Table 8.2 (Chapter 8).
10.4 The following section summarises our recommendations for the UK shortage occupation list.
10.5 Several of our partners mentioned to us a consultation fatigue. Although it is a matter for the Government to decide our next full review of the shortage occupation list, we would suggest that the list is carried out following an interval of two years.
10.2 The recommended UK shortage occupation list
10.6 Before providing the full recommended UK shortage occupation list, drawing together the reviews of individual occupations and job titles covered in Chapters 5, 6 and 7, we outline all additions to and removals from the current list. In Annex D we list the occupations and job titles we recommend retaining in the shortage occupation list under both the Standard Occupational Classification (SOC) 2000 and SOC 2010.
10.7 As mentioned in Chapter 6, we were told by the Ground Forum that the names of some job titles in the construction-related ground engineering industry currently on the Tier 2 shortage occupation list are ambiguous or not generally used. The Ground Forum has provided a list of job titles which they believe better reflect the structure of the industry, and it is these job titles that are included in Table 10.1 and Table D.1 (Annex D). Full details are presented in Table 6.1(Chapter 6).
Chapter 10 Our recommended UK shortage occupation list

Skilled, Shortage, Sensible
214
10.8 We recommend that the following occupations and job titles be added to the UK shortage occupation list:
non-consultant, non-training medical staff post in:
o rehabilitation medicine – SOC 2231
o psychiatry – SOC 2231
all mechanical engineers within the oil and gas industry – SOC 2122;
nuclear safety case engineer – SOC 2129;
mechanical design engineer (stress) – SOC 2129;
piping design engineer- SOC 2129;
thermofluid/process engineer – SOC 2129;
senior mining engineer – SOC 2121;
senior resource geologist – SOC 2113;
staff geologist – SOC 2113;
electrical machine design engineer – SOC 2123;
power electronics engineer - SOC 2123;
signalling design manager – SOC 2124;
signalling design engineer - SOC 2124;
signalling principles designer – SOC 2124;
senior signalling design checker – SOC 2124;
signalling design checker – SOC 2124;
signalling systems engineer – SOC 2124;
product development engineer – SOC 2126
product design engineer – SOC 2126
integrated circuit design engineer – SOC 2126
integrated circuit test engineer – SOC 2126
driver developer – SOC 2136
embedded communications engineer – SOC 2136
Chapter 10: Our recommended UK shortage occupation list
215
specialist electronics engineer – SOC 2124
informatician – SOC 2119;
bio-informatician – SOC 2119;
games designer within the computer games industry - SOC 2136.
10.9 We recommend that the following occupations and job titles are removed from the UK shortage occupation list:
consultant in:
o clinical neurophysiology - SOC 2211;
o forensic psychiatry - SOC 2211;
o general psychiatry - SOC 2211;
o genito-urinary medicine - SOC 2211;
o neurology - SOC 2211;
o occupational medicine - SOC 2211;
o psychiatry of learning disabilities – SOC 2211;
non-consultant, non-training medical staff post in:
o general surgery – SOC 2211;
o obstetrics and gynaecology – SOC 2211;
o paediatrics – SOC 2211;
o trauma and orthopaedic surgery – SOC 2211;
clinical vascular scientist – SOC 2112;
respiratory physiologist – SOC 2112;
sleep physiologist – SOC 2112;
staff working in diagnostic radiology (including magnetic resonance imaging) – SOC 2113;
operating department practitioner (ODP) – SOC 2231;
specialist nurse working in theatres – SOC 2231;
higher specialty training post (ST4) in paediatrics – SOC 2211;
cardiac physiologist – SOC 2112;
mining and coal engineer – SOC 2121 ;
environmental scientist – SOC 2142;

Skilled, Shortage, Sensible
216
mining geotechnical engineer – SOC 2121;
metallurgical/mineral processing engineer – SOC 2129;
simulation development engineer – SOC 2126;
all mechanical engineers in the aerospace industry – SOC 2122;
special needs education teaching professional – SOC 2316; and
actuary – SOC 2425.
Table 10.1: Recommended UK shortage occupation list for Tier 2 of the Points Based System, February 2013
Occupation title and SOC 2010 code 1 2 3
Job titles included on the shortage occupation list (and other information where applicable)
Production managers and directors in mining and energy (1123)
ONLY the following job titles within this occupation:
The following job titles within the decommissioning and waste management areas of the nuclear industry: managing director, programme director and site director.
The following job titles within the electricity transmission and distribution industry: project manager and site manager.
Biological scientists and biochemists (2112)
ONLY the following job titles within this occupation:
clinical neurophysiologist.
Physical Scientists (2113)
ONLY the following job title within this occupation:
The following job titles within the construction-related ground engineering industry: engineering geologist, hydrogeologist and geophysicist.
The following job titles within the oil and gas industry: geophysicist, geoscientist, geologist and geochemist.
The following job title in the decommissioning and waste areas of the nuclear industry: technical services manager.
The following job title in the health sector: Nuclear medicine scientist and radiotherapy physicist.
The following job titles within the mining sector: senior resource geologist and staff geologists.
Natural and social science professionals n.e.c. (2119)
ONLY the following job titles within this occupation:
informatician and bio-informatician.
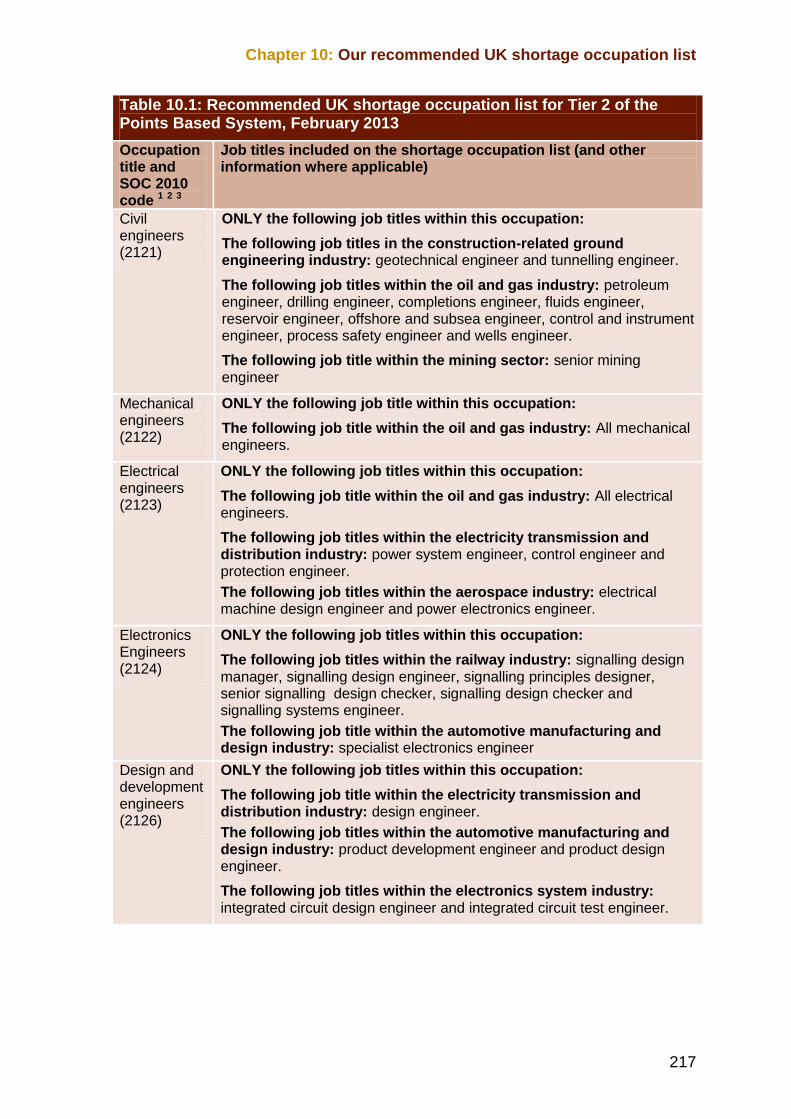
Chapter 10: Our recommended UK shortage occupation list
217
Table 10.1: Recommended UK shortage occupation list for Tier 2 of the Points Based System, February 2013
Occupation title and SOC 2010 code 1 2 3
Job titles included on the shortage occupation list (and other information where applicable)
Civil engineers (2121)
ONLY the following job titles within this occupation:
The following job titles in the construction-related ground engineering industry: geotechnical engineer and tunnelling engineer.
The following job titles within the oil and gas industry: petroleum engineer, drilling engineer, completions engineer, fluids engineer, reservoir engineer, offshore and subsea engineer, control and instrument engineer, process safety engineer and wells engineer.
The following job title within the mining sector: senior mining engineer
Mechanical engineers (2122)
ONLY the following job title within this occupation:
The following job title within the oil and gas industry: All mechanical engineers.
Electrical engineers (2123)
ONLY the following job titles within this occupation:
The following job title within the oil and gas industry: All electrical engineers.
The following job titles within the electricity transmission and distribution industry: power system engineer, control engineer and protection engineer.
The following job titles within the aerospace industry: electrical machine design engineer and power electronics engineer.
Electronics Engineers (2124)
ONLY the following job titles within this occupation:
The following job titles within the railway industry: signalling design manager, signalling design engineer, signalling principles designer, senior signalling design checker, signalling design checker and signalling systems engineer.
The following job title within the automotive manufacturing and design industry: specialist electronics engineer
Design and development engineers (2126)
ONLY the following job titles within this occupation:
The following job title within the electricity transmission and distribution industry: design engineer.
The following job titles within the automotive manufacturing and design industry: product development engineer and product design engineer.
The following job titles within the electronics system industry: integrated circuit design engineer and integrated circuit test engineer.
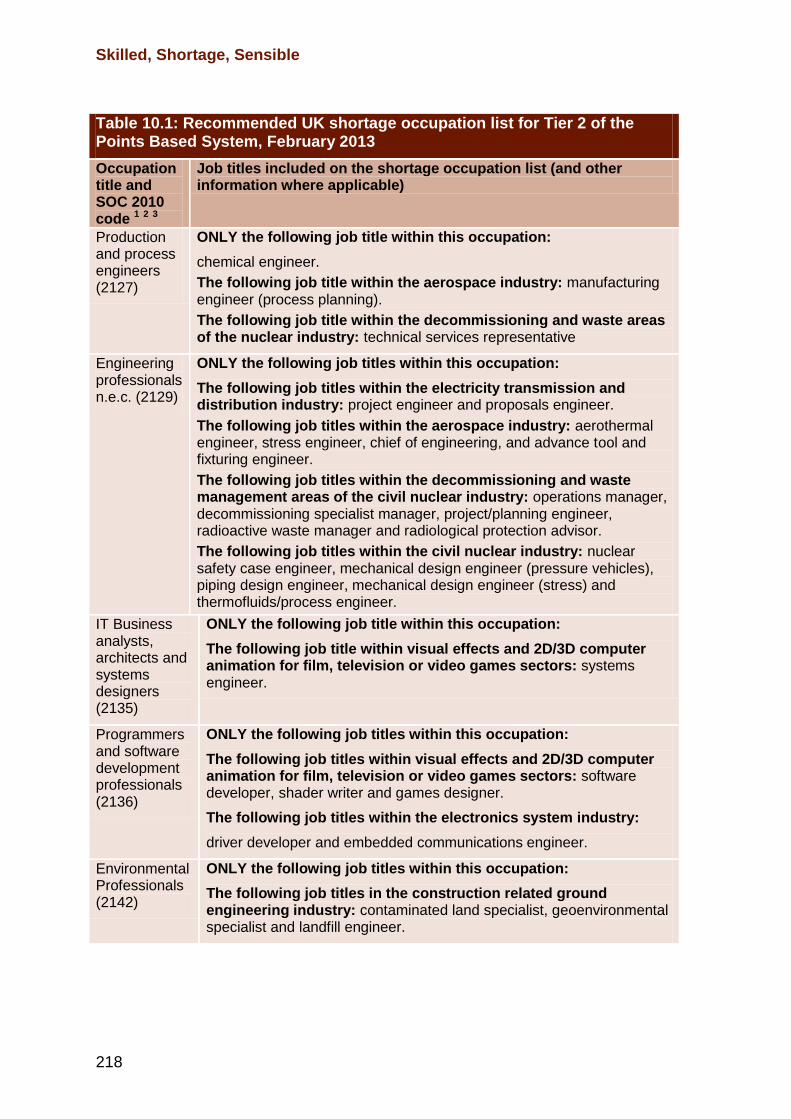
Skilled, Shortage, Sensible
218
Table 10.1: Recommended UK shortage occupation list for Tier 2 of the Points Based System, February 2013
Occupation title and SOC 2010 code 1 2 3
Job titles included on the shortage occupation list (and other information where applicable)
Production and process engineers (2127)
ONLY the following job title within this occupation:
chemical engineer.
The following job title within the aerospace industry: manufacturing engineer (process planning).
The following job title within the decommissioning and waste areas of the nuclear industry: technical services representative
Engineering professionals n.e.c. (2129)
ONLY the following job titles within this occupation:
The following job titles within the electricity transmission and distribution industry: project engineer and proposals engineer.
The following job titles within the aerospace industry: aerothermal engineer, stress engineer, chief of engineering, and advance tool and fixturing engineer.
The following job titles within the decommissioning and waste management areas of the civil nuclear industry: operations manager, decommissioning specialist manager, project/planning engineer, radioactive waste manager and radiological protection advisor.
The following job titles within the civil nuclear industry: nuclear safety case engineer, mechanical design engineer (pressure vehicles), piping design engineer, mechanical design engineer (stress) and thermofluids/process engineer.
IT Business analysts, architects and systems designers (2135)
ONLY the following job title within this occupation:
The following job title within visual effects and 2D/3D computer animation for film, television or video games sectors: systems engineer.
Programmers and software development professionals (2136)
ONLY the following job titles within this occupation:
The following job titles within visual effects and 2D/3D computer animation for film, television or video games sectors: software developer, shader writer and games designer.
The following job titles within the electronics system industry:
driver developer and embedded communications engineer.
Environmental Professionals (2142)
ONLY the following job titles within this occupation:
The following job titles in the construction related ground engineering industry: contaminated land specialist, geoenvironmental specialist and landfill engineer.

Chapter 10: Our recommended UK shortage occupation list
219
Table 10.1: Recommended UK shortage occupation list for Tier 2 of the Points Based System, February 2013
Occupation title and SOC 2010 code 1 2 3
Job titles included on the shortage occupation list (and other information where applicable)
Medical practitioners (2211)
ONLY the following job titles within this occupation:
Consultant within the following specialities: emergency medicine, haematology, and old age psychiatry.
Non-consultant, non-training, medical staff post in the following specialities: anaesthetics, general medicine specialities delivering acute care services (intensive care medicine, general internal medicine (acute)), emergency medicine (including specialist doctors working in accident and emergency)), rehabilitation medicine, and psychiatry.
Medical Radiographers (2217)
ONLY the following job titles within this occupation:
HPC registered diagnostic radiographer, HPC registered therapeutic radiographer and sonographer.
Nurses (2231) ONLY the following job title within this occupation:
specialist nurse working in neonatal intensive care units.
Secondary education teaching professionals (2314)
ONLY the following job title within this occupation:
secondary education teachers within the subjects of maths and science (chemistry and physics only).
Social workers (2442)
ONLY the following job title within this occupation:
social worker working in children‟s and family services.
Quality control and planning engineers (2461)
ONLY the following job titles within this occupation:
The following job titles within the electricity transmission and distribution industry: planning/development engineer and quality, health, safety and environment (QHSE) engineer.
Engineering technicians (3113)
ONLY the following job title within this occupation:
The following job titles in the electricity transmission and distribution industry: commissioning engineer and substation electrical engineer.
Medical and dental technicians (3218)
ONLY the following job titles within this occupation:
nuclear medicine technologist and radiotherapy technologist.
Artist (3411) ONLY the following job title within this occupation:
The following job title within visual effects and 2D/3D computer animation for film, television or video games sectors: animator.
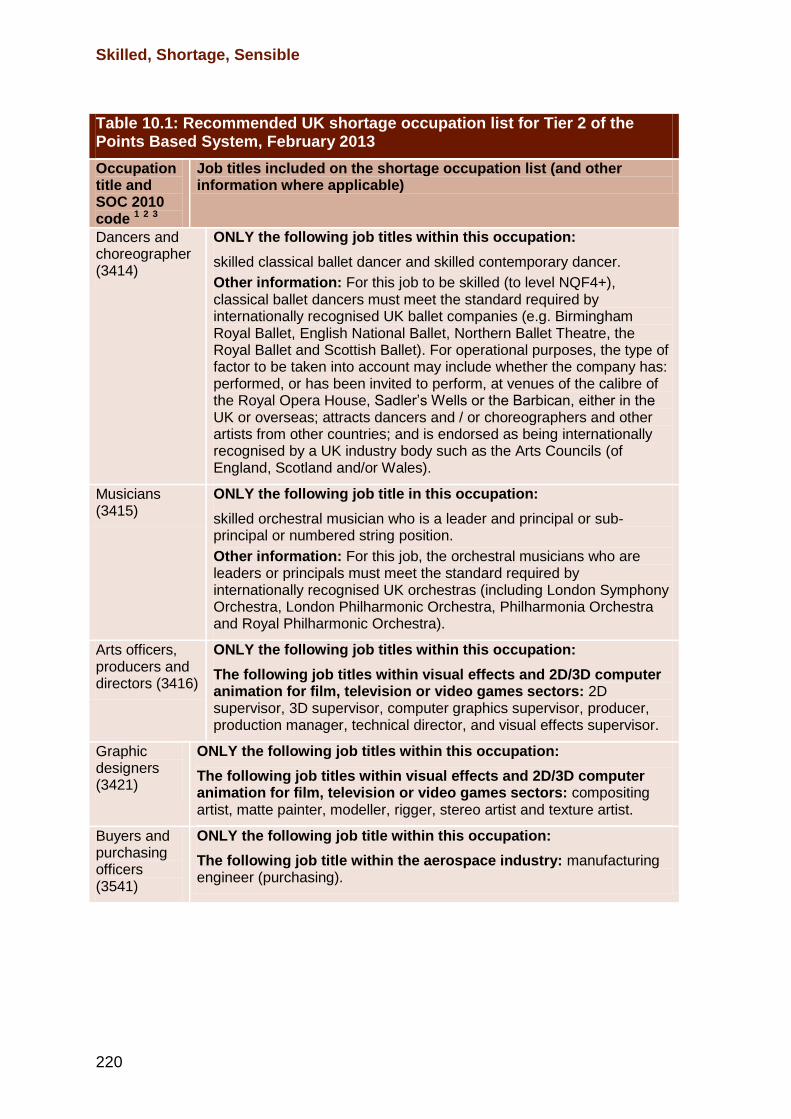
Skilled, Shortage, Sensible
220
Table 10.1: Recommended UK shortage occupation list for Tier 2 of the Points Based System, February 2013
Occupation title and SOC 2010 code 1 2 3
Job titles included on the shortage occupation list (and other information where applicable)
Dancers and choreographer (3414)
ONLY the following job titles within this occupation:
skilled classical ballet dancer and skilled contemporary dancer.
Other information: For this job to be skilled (to level NQF4+), classical ballet dancers must meet the standard required by internationally recognised UK ballet companies (e.g. Birmingham Royal Ballet, English National Ballet, Northern Ballet Theatre, the Royal Ballet and Scottish Ballet). For operational purposes, the type of factor to be taken into account may include whether the company has: performed, or has been invited to perform, at venues of the calibre of the Royal Opera House, Sadler‟s Wells or the Barbican, either in the UK or overseas; attracts dancers and / or choreographers and other artists from other countries; and is endorsed as being internationally recognised by a UK industry body such as the Arts Councils (of England, Scotland and/or Wales).
Musicians (3415)
ONLY the following job title in this occupation:
skilled orchestral musician who is a leader and principal or sub-principal or numbered string position.
Other information: For this job, the orchestral musicians who are leaders or principals must meet the standard required by internationally recognised UK orchestras (including London Symphony Orchestra, London Philharmonic Orchestra, Philharmonia Orchestra and Royal Philharmonic Orchestra).
Arts officers, producers and directors (3416)
ONLY the following job titles within this occupation:
The following job titles within visual effects and 2D/3D computer animation for film, television or video games sectors: 2D supervisor, 3D supervisor, computer graphics supervisor, producer, production manager, technical director, and visual effects supervisor.
Graphic designers (3421)
ONLY the following job titles within this occupation:
The following job titles within visual effects and 2D/3D computer animation for film, television or video games sectors: compositing artist, matte painter, modeller, rigger, stereo artist and texture artist.
Buyers and purchasing officers (3541)
ONLY the following job title within this occupation:
The following job title within the aerospace industry: manufacturing engineer (purchasing).
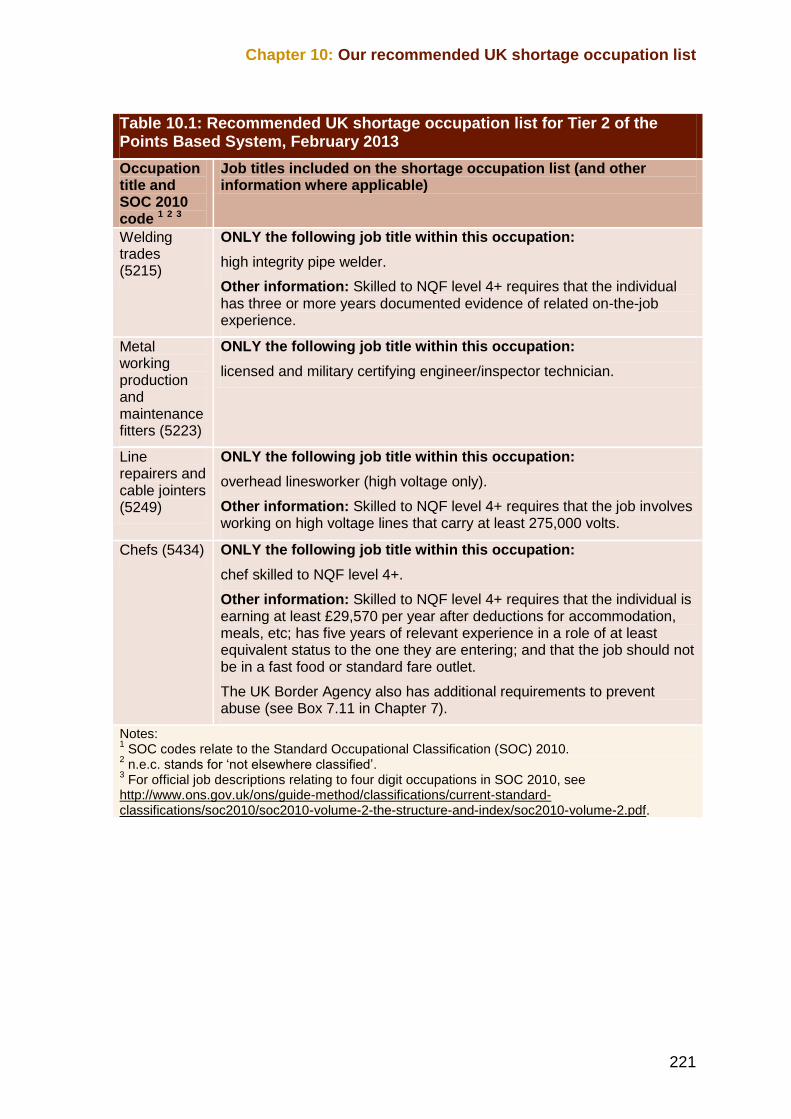
Chapter 10: Our recommended UK shortage occupation list
221
Table 10.1: Recommended UK shortage occupation list for Tier 2 of the Points Based System, February 2013
Occupation title and SOC 2010 code 1 2 3
Job titles included on the shortage occupation list (and other information where applicable)
Welding trades (5215)
ONLY the following job title within this occupation:
high integrity pipe welder.
Other information: Skilled to NQF level 4+ requires that the individual has three or more years documented evidence of related on-the-job experience.
Metal working production and maintenance fitters (5223)
ONLY the following job title within this occupation:
licensed and military certifying engineer/inspector technician.
Line repairers and cable jointers (5249)
ONLY the following job title within this occupation:
overhead linesworker (high voltage only).
Other information: Skilled to NQF level 4+ requires that the job involves working on high voltage lines that carry at least 275,000 volts.
Chefs (5434) ONLY the following job title within this occupation:
chef skilled to NQF level 4+.
Other information: Skilled to NQF level 4+ requires that the individual is earning at least £29,570 per year after deductions for accommodation, meals, etc; has five years of relevant experience in a role of at least equivalent status to the one they are entering; and that the job should not be in a fast food or standard fare outlet.
The UK Border Agency also has additional requirements to prevent abuse (see Box 7.11 in Chapter 7).
Notes: 1 SOC codes relate to the Standard Occupational Classification (SOC) 2010.
2 n.e.c. stands for „not elsewhere classified‟.
3 For official job descriptions relating to four digit occupations in SOC 2010, see
http://www.ons.gov.uk/ons/guide-method/classifications/current-standard-classifications/soc2010/soc2010-volume-2-the-structure-and-index/soc2010-volume-2.pdf.

223
A.1 List of organisations that responded to the call for evidence
1994 Group
AKQA (via Kingsley Napley)
ALSTOM Power Services
Apache
AREVA UK
Association of British Orchestras
Association of School and College Leaders
ATKINS
Balfour Beatty Utility Solutions
Bedford Hospital NHS Trust
Bentley
BP International Ltd
British Film Commission
British Hospitality Association and Visalogic (joint response)
British Medical Association
CGG Veritas
Cine Guilds of Great Britain
Cogent
Confederation of British Industry
Construction Industry Council
Annex A Consultation

Skilled, Shortage, Sensible
224
ConstructionSkills
Continental Travelnurse Ltd
Convention of Scottish Local Authorities
Dalradian
Definitive Immigration Services Ltd and ABB
Department for Business Innovation & Skills
Department for Education
Department of Health
Doosan Power Systems
East Midlands Deanery
EDF Energy
EEF
Embassy of Japan
Employment Lawyers Association
Energy Solutions (via Kingsley Napley)
Energy & Utility Skills and National Skills Academy Power (joint submission)
Geological Society and Royal Astronomical Society (joint submission)
Ground Forum
Imperial College Healthcare NHS Trust
Institution of Chemical Engineers
Kingsley Napley LLP
KPMG LLP
London Deanery
Marshall Aeropeople
Medical Research Council (combined submission)
Merlin ERD Ltd
Minister for Culture, Communications and the Creative Industries
Annex A: Consultation
225
Ministry of Defence
Mott MacDonald
Musicians‟ Union
National Association of Head Teachers
National Grid
National Leadership & Innovation Agency for Healthcare
Newland Chase
NHS Tayside
NMI
North Bristol NHS Trust
Northern Ireland Strategic Migration Partnership
North West Strategic Health Authority
Oil & Gas UK
Paragon Law for Games Workshop
People 1st
PricewaterhouseCoopers
Production Guild of Great Britain
Recruitment & Employment Confederation
Reflections
RenewableUK
Research Councils UK
Rolls-Royce plc
Royal Opera House
Royal Pharmaceutical Society
Science Council
Scottish Government Health and Social Care Directorate
Scottish Opera
Skilled, Shortage, Sensible
226
Scottish Social Services Council
Siemens
Society of London Theatre and Theatrical Management Association
Society of London Theatre, Theatrical Management Association, The Independent Theatre Council, Dance UK and National Campaign for the Arts (combined submission)
Stanley Wattam Limited
The College of Emergency Medicine
The Association for UK Interactive Entertainment (Ukie)
The Independent Game Developers Association (TIGA)
Total E&P UK
UK Screen Association
United Chiropractic Association
Universities UK, GuildHE and UCEA
Watson Farley & Williams
Wellcome Trust
Welsh Government
Westinghouse
and one anonymous response
A.2 Indicative list of organisations we met with/attended our forums
ACS International Schools
ADS
Aeropeople Ltd
Association of Graduate Careers Advisory Services
Atkins
Australian High Commission

Annex A: Consultation
227
Azumi Restaurants Limited t/a Zuma
Balfour Beatty Utility Solutions
Bangladeshi Caterers Association
Birmingham Royal Ballet
BP
Busaba Eathai Limited
Centre for Workforce Intelligence
Chesterfield Royal Hospital
COSLA
Creative & Cultural Skills
Creative Skillset
Definitive Immigration Services Ltd
Department for Business Innovation and Skills
Department for Culture, Media and Sport
Derby Hospitals Trust
Derbyshire Healthcare NHS Foundation Trust
Doosan Babcock
Double Negative
Dundas & Wilson LLP
EDF Energy
EEF
Energy & Utility Skills
Equity
Futze Limited
Ground Forum
Hakkasan Limited
Independent Theatre Council

Skilled, Shortage, Sensible
228
Institute of Cancer Research
Jeffery Green Russell
Kingsley Napley
London Deanery
Medical Research Council
MW Eat
National Association of Medical Personnel Specialists
National Association of Head Teachers
National Grid
Newland Chase
NHS Employers
Northampton General Hospital NHS Trust
North West Strategic Health Authority
Nottinghamshire Healthcare NHS Trust
Nottingham University Hospitals Trust
Offshore Contractors Association
Paragon Law
PricewaterhouseCoopers
Producers Alliance for Cinema and Television Ltd
Recruitment and Employment Confederation
Research Council UK Shared Service Centre Ltd
Robarta Restaurants Limited t/a Roka
Royal Astronomical Society & the British Geophysical Association
Royal Conservatoire of Scotland
Royal Opera House
Science Council
Scottish Ballet
Annex A: Consultation
229
Scottish Enterprise
Scottish Government
Scottish Opera
Semta
Society of London Theatre and Theatrical Management Association
The Royal College of Anaesthetists
The Association for UK Interactive Entertainment (Ukie)
UK Screen Association
University for the Creative Arts
University Hospitals of Leicester
Visalogic
Westinghouse

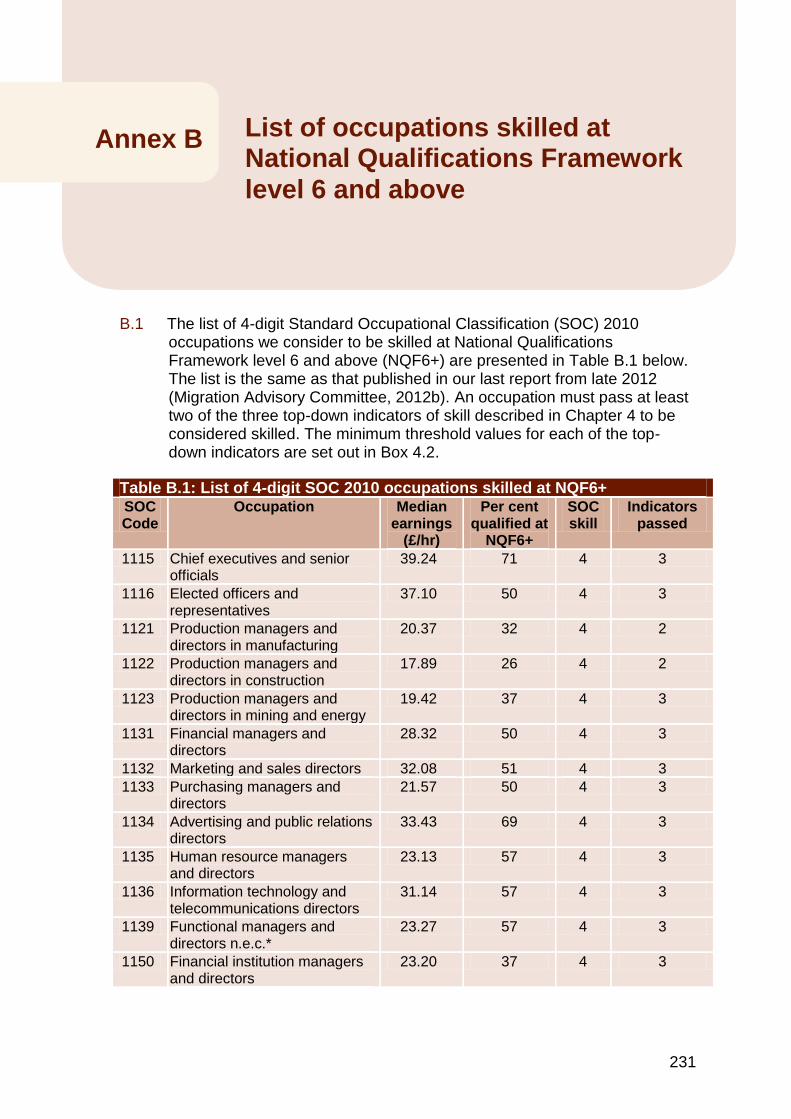
231
B.1 The list of 4-digit Standard Occupational Classification (SOC) 2010
occupations we consider to be skilled at National Qualifications Framework level 6 and above (NQF6+) are presented in Table B.1 below. The list is the same as that published in our last report from late 2012 (Migration Advisory Committee, 2012b). An occupation must pass at least two of the three top-down indicators of skill described in Chapter 4 to be considered skilled. The minimum threshold values for each of the top-down indicators are set out in Box 4.2.
Table B.1: List of 4-digit SOC 2010 occupations skilled at NQF6+ SOC Code
Occupation Median earnings
(£/hr)
Per cent qualified at
NQF6+
SOC skill
Indicators passed
1115 Chief executives and senior officials
39.24 71 4 3
1116 Elected officers and representatives
37.10 50 4 3
1121 Production managers and directors in manufacturing
20.37 32 4 2
1122 Production managers and directors in construction
17.89 26 4 2
1123 Production managers and directors in mining and energy
19.42 37 4 3
1131 Financial managers and directors
28.32 50 4 3
1132 Marketing and sales directors 32.08 51 4 3
1133 Purchasing managers and directors
21.57 50 4 3
1134 Advertising and public relations directors
33.43 69 4 3
1135 Human resource managers and directors
23.13 57 4 3
1136 Information technology and telecommunications directors
31.14 57 4 3
1139 Functional managers and directors n.e.c.*
23.27 57 4 3
1150 Financial institution managers and directors
23.20 37 4 3
Annex B List of occupations skilled at National Qualifications Framework
level 6 and above
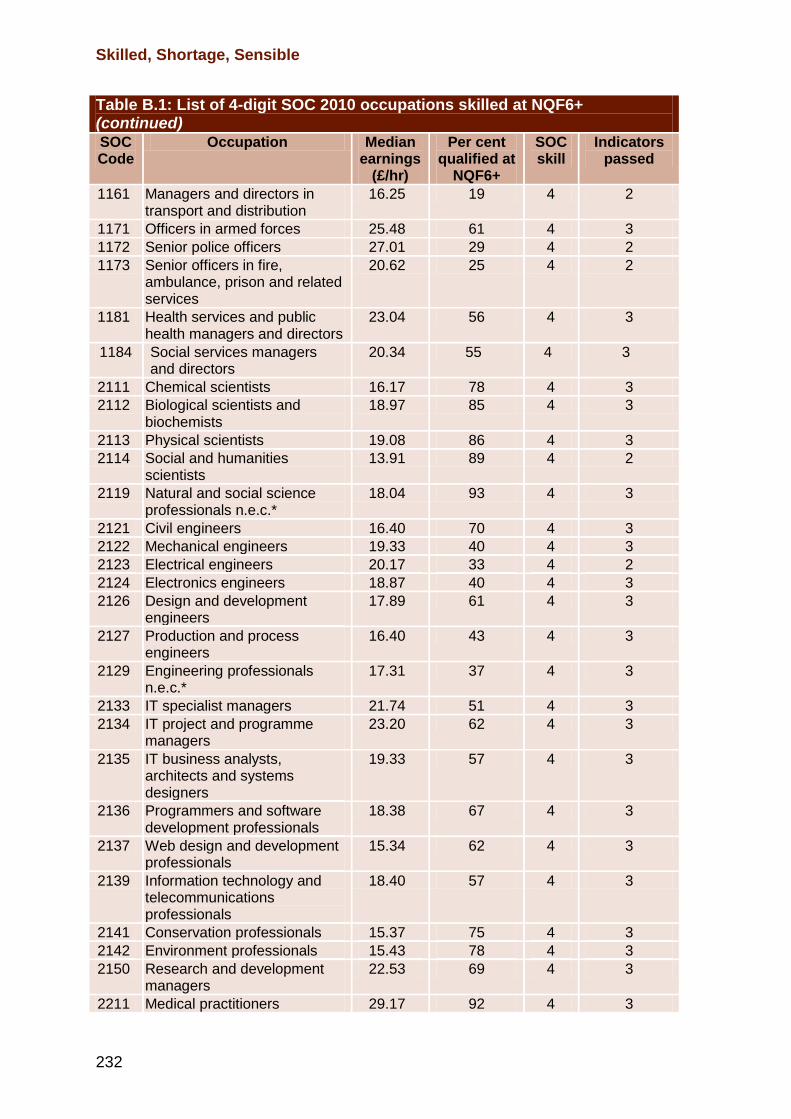
Skilled, Shortage, Sensible
232
Table B.1: List of 4-digit SOC 2010 occupations skilled at NQF6+ (continued) SOC Code
Occupation Median earnings
(£/hr)
Per cent qualified at
NQF6+
SOC skill
Indicators passed
1161 Managers and directors in transport and distribution
16.25 19 4 2
1171 Officers in armed forces 25.48 61 4 3
1172 Senior police officers 27.01 29 4 2
1173 Senior officers in fire, ambulance, prison and related services
20.62 25 4 2
1181 Health services and public health managers and directors
23.04 56 4 3
1184 Social services managers and directors
20.34 55 4 3
2111 Chemical scientists 16.17 78 4 3
2112 Biological scientists and biochemists
18.97 85 4 3
2113 Physical scientists 19.08 86 4 3
2114 Social and humanities scientists
13.91 89 4 2
2119 Natural and social science professionals n.e.c.*
18.04 93 4 3
2121 Civil engineers 16.40 70 4 3
2122 Mechanical engineers 19.33 40 4 3
2123 Electrical engineers 20.17 33 4 2
2124 Electronics engineers 18.87 40 4 3
2126 Design and development engineers
17.89 61 4 3
2127 Production and process engineers
16.40 43 4 3
2129 Engineering professionals n.e.c.*
17.31 37 4 3
2133 IT specialist managers 21.74 51 4 3
2134 IT project and programme managers
23.20 62 4 3
2135 IT business analysts, architects and systems designers
19.33 57 4 3
2136 Programmers and software development professionals
18.38 67 4 3
2137 Web design and development professionals
15.34 62 4 3
2139 Information technology and telecommunications professionals
18.40 57 4 3
2141 Conservation professionals 15.37 75 4 3
2142 Environment professionals 15.43 78 4 3
2150 Research and development managers
22.53 69 4 3
2211 Medical practitioners 29.17 92 4 3
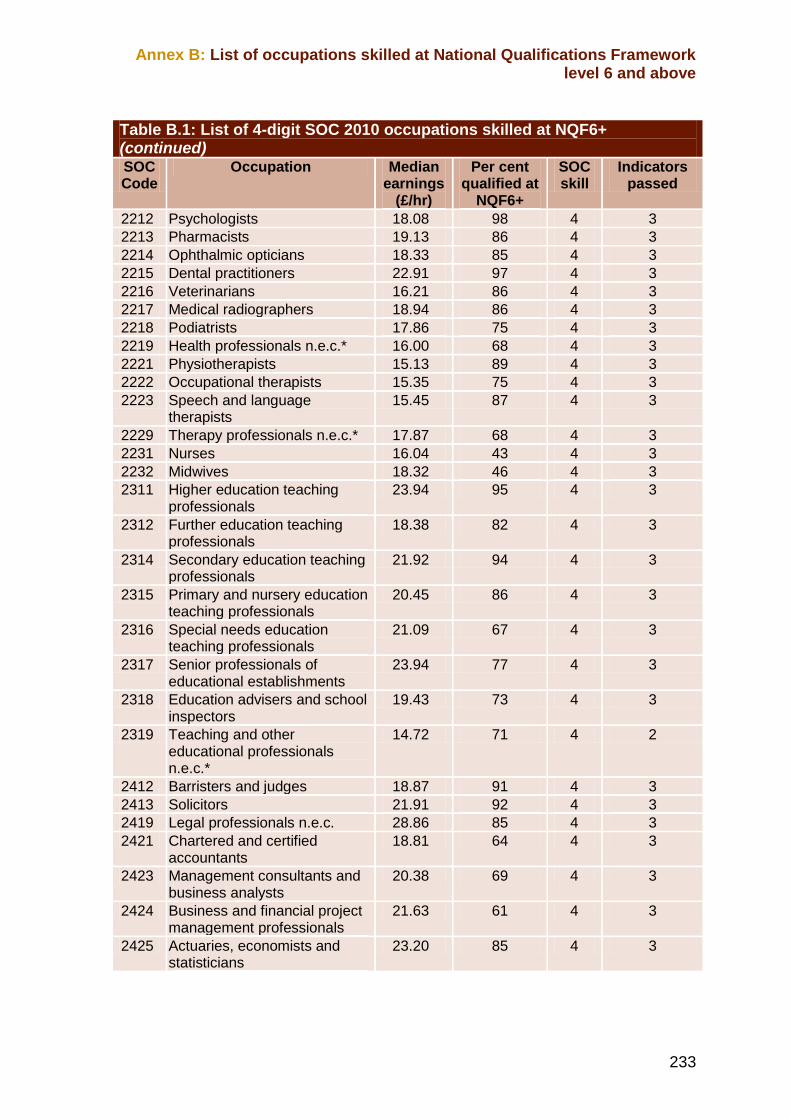
Annex B: List of occupations skilled at National Qualifications Framework level 6 and above
233
Table B.1: List of 4-digit SOC 2010 occupations skilled at NQF6+ (continued) SOC Code
Occupation Median earnings
(£/hr)
Per cent qualified at
NQF6+
SOC skill
Indicators passed
2212 Psychologists 18.08 98 4 3
2213 Pharmacists 19.13 86 4 3
2214 Ophthalmic opticians 18.33 85 4 3
2215 Dental practitioners 22.91 97 4 3
2216 Veterinarians 16.21 86 4 3
2217 Medical radiographers 18.94 86 4 3
2218 Podiatrists 17.86 75 4 3
2219 Health professionals n.e.c.* 16.00 68 4 3
2221 Physiotherapists 15.13 89 4 3
2222 Occupational therapists 15.35 75 4 3
2223 Speech and language therapists
15.45 87 4 3
2229 Therapy professionals n.e.c.* 17.87 68 4 3
2231 Nurses 16.04 43 4 3
2232 Midwives 18.32 46 4 3
2311 Higher education teaching professionals
23.94 95 4 3
2312 Further education teaching professionals
18.38 82 4 3
2314 Secondary education teaching professionals
21.92 94 4 3
2315 Primary and nursery education teaching professionals
20.45 86 4 3
2316 Special needs education teaching professionals
21.09 67 4 3
2317 Senior professionals of educational establishments
23.94 77 4 3
2318 Education advisers and school inspectors
19.43 73 4 3
2319 Teaching and other educational professionals n.e.c.*
14.72 71 4 2
2412 Barristers and judges 18.87 91 4 3
2413 Solicitors 21.91 92 4 3
2419 Legal professionals n.e.c. 28.86 85 4 3
2421 Chartered and certified accountants
18.81 64 4 3
2423 Management consultants and business analysts
20.38 69 4 3
2424 Business and financial project management professionals
21.63 61 4 3
2425 Actuaries, economists and statisticians
23.20 85 4 3
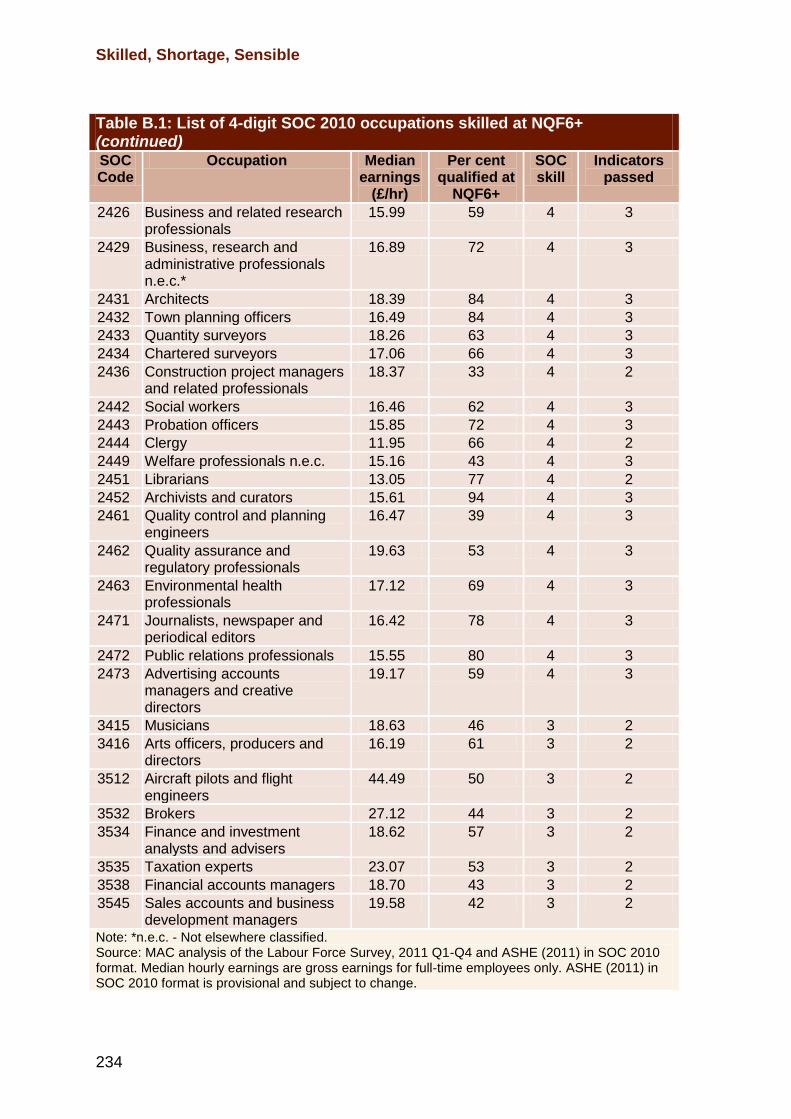
Skilled, Shortage, Sensible
234
Table B.1: List of 4-digit SOC 2010 occupations skilled at NQF6+ (continued) SOC Code
Occupation Median earnings
(£/hr)
Per cent qualified at
NQF6+
SOC skill
Indicators passed
2426 Business and related research professionals
15.99 59 4 3
2429 Business, research and administrative professionals n.e.c.*
16.89 72 4 3
2431 Architects 18.39 84 4 3
2432 Town planning officers 16.49 84 4 3
2433 Quantity surveyors 18.26 63 4 3
2434 Chartered surveyors 17.06 66 4 3
2436 Construction project managers and related professionals
18.37 33 4 2
2442 Social workers 16.46 62 4 3
2443 Probation officers 15.85 72 4 3
2444 Clergy 11.95 66 4 2
2449 Welfare professionals n.e.c. 15.16 43 4 3
2451 Librarians 13.05 77 4 2
2452 Archivists and curators 15.61 94 4 3
2461 Quality control and planning engineers
16.47 39 4 3
2462 Quality assurance and regulatory professionals
19.63 53 4 3
2463 Environmental health professionals
17.12 69 4 3
2471 Journalists, newspaper and periodical editors
16.42 78 4 3
2472 Public relations professionals 15.55 80 4 3
2473 Advertising accounts managers and creative directors
19.17 59 4 3
3415 Musicians 18.63 46 3 2
3416 Arts officers, producers and directors
16.19 61 3 2
3512 Aircraft pilots and flight engineers
44.49 50 3 2
3532 Brokers 27.12 44 3 2
3534 Finance and investment analysts and advisers
18.62 57 3 2
3535 Taxation experts 23.07 53 3 2
3538 Financial accounts managers 18.70 43 3 2
3545 Sales accounts and business development managers
19.58 42 3 2
Note: *n.e.c. - Not elsewhere classified. Source: MAC analysis of the Labour Force Survey, 2011 Q1-Q4 and ASHE (2011) in SOC 2010 format. Median hourly earnings are gross earnings for full-time employees only. ASHE (2011) in SOC 2010 format is provisional and subject to change.
235
C.1 Introduction
C.1 This annex describes in detail the methodology used to indicate which 4-digit Standard Occupation Classification (SOC) occupations may be considered to be in shortage according to top-down analysis of national level datasets. The results of this analysis should be considered as indicative of shortage only and interpreted in the context of partner evidence.
C.2 A key issue to consider in the analysis presented here is the revision of the SOC in 2010. The SOC classifies job titles into groups marked by similar skills and knowledge. It is periodically updated to reflect changes in the composition of jobs carried out in the UK and changes as new technologies are introduced at home and abroad. This revision is carried out approximately every ten years by the Office for National Statistics (ONS).
C.3 We first introduced the new classification in Migration Advisory Committee (2012b), where we recommended a list of 4-digit occupations skilled at National Qualifications Framework level 6 and above (NQF6+) in SOC 2010. In line with this, the shortage occupation list presented in this report is based on SOC 2010. Previous iterations of our top-down shortage analysis have been carried out using SOC 2000.
C.4 This raises some issues as a large proportion of the data that is used for the top-down analysis has not yet been published in SOC 2010 format, or has not been published in this format retrospectively. These data need to be converted to SOC 2010.
C.5 This annex proceeds in three sections. First, the method used to convert data to SOC 2010 is explained in detail. Second, it describes the top-down shortage methodology we have used for this review, highlighting any deviations from the methodology previously used. Finally, it lists the results of the top-down shortage methodology in full.
C.2 Data conversion
C.6 For our top-down approach, we analyse the most timely and relevant national level labour market datasets that are available to us. The data sources used for the top-down analysis are:
Annex C Top-down shortage methodology
Skilled, Shortage, Sensible
236
the Labour Force Survey (LFS);
the Annual Survey of Hours and Earnings (ASHE);
the Employer Skills Survey (ESS); and
Jobcentre Plus (JCP) vacancy claimant count data.
C.7 Table C.1 below lists the data periods that are used for the analysis and the volume to be converted.
Table C.1: Datasets used for the top-down shortage methodology Data source Periods required Period published in
SOC 2010 Conversion required
Annual Survey of Hours and Earnings (ASHE)
2004-2007, 2008-2011
2011 only*** 2004-2007, 2008-2010
Labour Force Survey (LFS)
2006Q1 to 2007Q4, 2010Q3 to 2012Q2
2011Q1 to 2012Q2 2006Q1 to 2007Q4, 2010Q3 to 2010Q4
Job Centre Plus (JCP) data*
Apr06 to Mar08, Aug10 to Jul12
None All
Employer Skills Survey (ESS)**
2007, 2011 2011 2007
Notes:* Sourced from Nomis. ** Previously known as the National Employer Skills Survey (NESS). The ESS covers the whole of the UK and all establishments except sole traders (businesses with a single employee but no working proprietor were included) whereas the NESS covered England and only businesses with a headcount of 2 employees or more. Moving to the larger sample size of the ESS offers better coverage of the UK as a whole, although we acknowledge that data in the ESS and NESS are not exactly comparable.*** Although ASHE 2011 is published in SOC 2010, we convert the SOC 2000 version to retain consistency with other years.
C.8 In line with the method first employed in Migration Advisory Committee (2011), we convert any LFS data relating to periods prior to 2011 using a probabilistic mapping technique provided to us by the ONS. This allowed us to construct a consistent time series of LFS data in SOC 2010 format.
C.9 ASHE, JCP and ESS data can be converted using a proportional mapping technique. This uses LFS data (for the period 2011 Q3 - 2012 Q2) coded in both classifications to define a relationship between the SOC 2000 and SOC 2010 codes.
C.10 For example, it is estimated that on average over this period, 4,700 individuals coded to SOC 2010 1115 could also be coded to SOC 2000 1111. Knowing the sum of individuals in a SOC 2000 code over the same period, we can calculate what proportion of a SOC 2000 code goes to a SOC 2010 code. Likewise, if we know the sum of individuals in a SOC 2010 code we can calculate the proportion that came from any SOC 2000 code.
C.11 Carrying out these calculations for every pair of SOC codes yields two matrixes that can be used to estimate the expected value of a SOC 2010 statistic or figure, given a SOC 2000 dataset.
Annex C: Top-down shortage methodology
237
C.12 Box C.1 explains how these two matrixes can be used to convert data. It highlights that statistics (such as pay or hours worked) are treated differently to absolute numbers (claimant count or vacancies).
C.13 This method of converting data does not yield actual SOC 2010 datasets. Rather, it provides an approximate estimate of the figures and allows us to minimise the number of changes to our existing methodology.
Box C.1: Data conversion examples - SOC 2010 2127 production and process engineers
Statistics
Using the came from grid, it is known that some proportion of SOC 2010 2127 production and process engineers came from five different SOC 2000 codes:
SOC 2000 SOC 2010
Code 2125 2126 2127 2128 2129 2127 Proportion 0.14 0.00 0.76 0.09 0.01 1.00
This informs the proportion of each SOC 2000 statistic that should go to a SOC 2010 equivalent. Using ASHE median paid hours worked for all employees:
SOC 2000 SOC 2010
2125 2126 2127 2128 2129 2127 Proportion (a) 0.14 0.00 0.76 0.09 0.01 1.00 Median paid hours worked
(b) 37.7 37.5 37.5 37.5 37.5 -
Expected value (a)x(b) 5.2 0.18 28.3 3.3 0.4 37.5
This technique yields an estimate that median paid hours work by all employees in SOC 2010 2127 should be approximately 37.5.
Absolute numbers
Absolute numbers, such as vacancy numbers or claimant count, require slightly different treatment. Here the go to grid is used:
SOC 2000 SOC 2010
Code 2125 2126 2127 2128 2129 2127 Proportion 0.97 0.00 0.91 0.12 0.01 n/a
This says that 97 per cent of SOC 2000 2125 goes to SOC 2010 2127. Clearly, using the equivalent came from statistic here would be inappropriate as it would dramatically underestimate the number of individuals moving between the two SOC codes. Using claimant count data for July 2012 as an example:
SOC 2000 SOC 2010
2125 2126 2127 2128 2129 2127 Proportion (a) 0.97 0.00 0.91 0.12 0.01 n/a Number (b) 140 540 555 230 990 Expected value (a)x(b) 136.5 1.9 506.3 27.5 8.3 681
Summing across the number of claimants in each SOC 2000 code that go to SOC 2010 2127 yields an estimate that there would have been approximately 681 claimants in this SOC code in July 2012, had the data been published in SOC 2010.
Note: Figures may not sum due to rounding. Source: LFS Q3 2011 - Q2 2012, ASHE (2011), NOMIS (2012).
Skilled, Shortage, Sensible
238
C.3 Shortage
C.14 In Migration Advisory Committee (2008) we identified a total of 12 indicators of labour shortage for our top-down analysis. These fall into four broad categories:
employer-based indicators (reports of hard-to-fill or skill-shortage vacancies);
price-based indicators (such as earnings growth);
volume-based indicators (e.g. employment or unemployment); and
other indicators of imbalance based on administrative data (e.g. vacancy duration or vacancy/unemployment ratios).
C.15 The 12 indicators of shortage used in the top-down methodology are listed in Table C.2 below. As with our top-down indicators of skill, we assign each indicator of shortage a threshold value. For each indicator, apart from the percentage change in claimant count (coded V1), the value of the indicator must exceed or equal the threshold for shortage to be inferred. To be considered to be in shortage according to the top-down methodology, an occupation must pass at least half of indicators available for that occupation. As we expect lower levels of unemployment to indicate shortage, this condition is inverted for indicator V1.
C.16 As discussed in Migration Advisory Committee (2010), we have decided to adopt what we refer to as a benchmarking approach for assessing our top-down indicators of shortage. This approach involves fixing the passing threshold for an indicator to its value at a point of historical stability in the labour market, which we have defined as having occurred at the end of 2008.
C.17 Under the benchmarking approach, if the distribution of indicator values for a specific indicator shifts downwards in response to changes in economic conditions then fewer occupations are identified as being in shortage, and vice versa. Benchmarking provides a method of setting an absolute threshold for each indicator over time and, as a result, provides them with an automatic stabiliser property. The benchmarking approach will be kept under review and may be abandoned in subsequent reviews of the shortage occupation list subject to an assessment of labour market stability.
C.18 There is one exception to the benchmarking approach described above. Due to the nature of the indicator that estimates the return to occupation (coded P3), it is not appropriate to benchmark the threshold value for this indicator. Specifically, were the threshold value of this indicator to be benchmarked as described above, the number of occupations being assessed as experiencing labour shortage according to this indicator would increase over time, even without an increase in actual labour shortage. This is because both nominal and real pay tend to increase over
Annex C: Top-down shortage methodology
239
time. Therefore, as in previous reports, we calculate the threshold value for this indicator based on the distribution of indicator values used in this report, rather than benchmarking to the end of 2008.
C.19 Table C.2 also outlines the specific data that are used to calculate the indicator values and benchmarked thresholds. The specification of the indicators of shortage remains unchanged in comparison with previous reviews, with two exceptions:
for the percentage change of median paid hours worked over 3 years (coded V3) ASHE data for all employees is used, as opposed to data for full-time employees. This better reflects the fact that the movement of employees from part-time to full-time work could indicate a relative shortage of labour in an occupation. Restricting the data to full-time employees only would not detect any increase in median paid hours worked because of increasing full-time employment in an occupation; and
data used to calculate the return to an occupation (coded P3) is restricted to those who work in skilled, NQF6+ occupations regardless of individual qualification level. Previously the sample was restricted to individuals employed in skilled NQF4+ occupations who held NQF4+ qualifications. This introduces a greater degree of consistency with our skill methodology, where we consider pay, on-the-job training and innate ability as indicators of skill, alongside qualification.
Table C.2: The 12 top-down indicators of shortage Code Indicator Source Threshold data Indicator values
data P1 Percentage change of
median real pay (1 yr) ASHE 2006 - 2007 2010-2011
P2 Percentage change of median real pay (3 yrs)
ASHE 2004 - 2007 2008-2011
P3 Return to occupation LFS N/A 2011Q3-2012Q2
I1 Change in median vacancy duration (1 yr)
JCP Apr 06 - Mar 07 to Apr 07- Mar 08
Aug10-Jul11 to Aug11-Jul12
I2 Vacancies/claimant count JCP Jan 07 to Dec 07 Aug11-Jul12
V1 Percentage change of claimant count (1 yr)
JCP Mar 07 to Mar 08 Jul11-Jul12
V2 Percentage change of employment level (1 yr)
LFS Q106 - Q406 to Q107 - Q407
2010Q3-2011Q2 to 2011Q3-2012Q2
V3 Percentage change of median paid hours worked (3 yr)
ASHE 2004 - 2007 2008-2011
V4 Change in new hires (1 yr) LFS Q106 - Q406 to Q107 - Q407
2010Q3-2011Q2 to 2011Q3-2012Q2
E1 Skill-shortage vacancies/total vacancies
NESS 2007 2011
E2 Skill-shortage/hard-to-fill vacancies
NESS 2007 2011
E3 Skill-shortage vacancies/employment
NESS 2007 2011
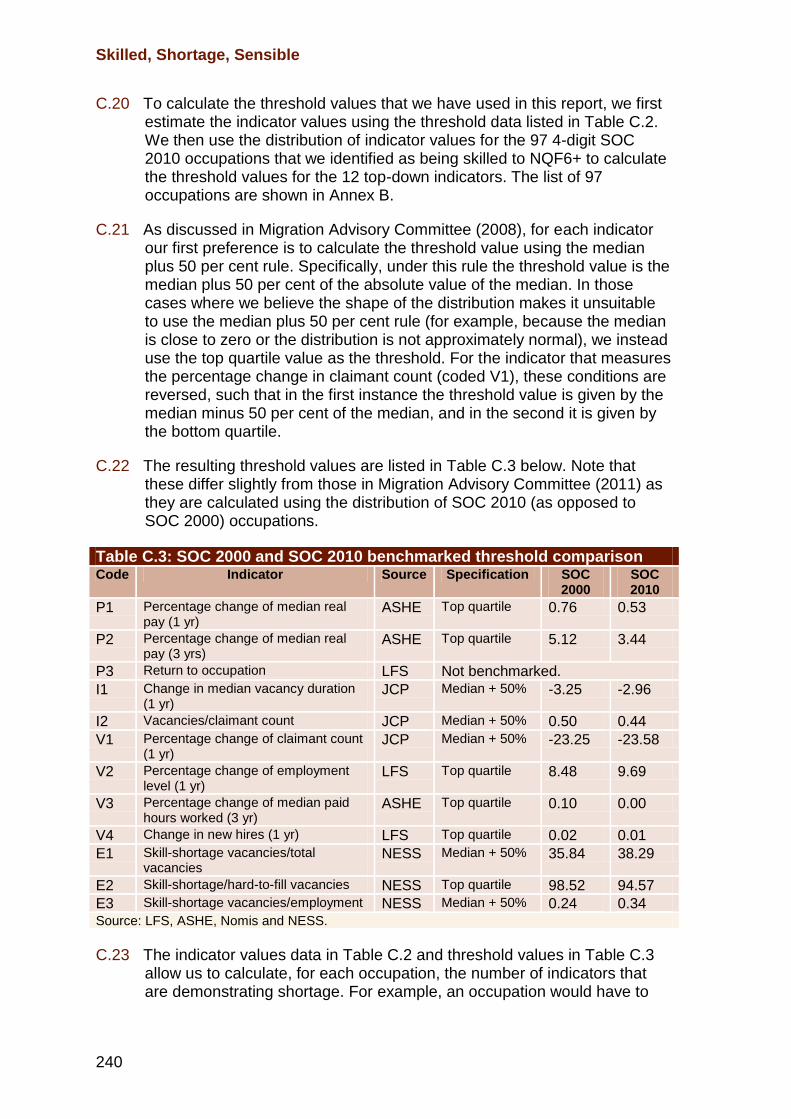
Skilled, Shortage, Sensible
240
C.20 To calculate the threshold values that we have used in this report, we first estimate the indicator values using the threshold data listed in Table C.2. We then use the distribution of indicator values for the 97 4-digit SOC 2010 occupations that we identified as being skilled to NQF6+ to calculate the threshold values for the 12 top-down indicators. The list of 97 occupations are shown in Annex B.
C.21 As discussed in Migration Advisory Committee (2008), for each indicator our first preference is to calculate the threshold value using the median plus 50 per cent rule. Specifically, under this rule the threshold value is the median plus 50 per cent of the absolute value of the median. In those cases where we believe the shape of the distribution makes it unsuitable to use the median plus 50 per cent rule (for example, because the median is close to zero or the distribution is not approximately normal), we instead use the top quartile value as the threshold. For the indicator that measures the percentage change in claimant count (coded V1), these conditions are reversed, such that in the first instance the threshold value is given by the median minus 50 per cent of the median, and in the second it is given by the bottom quartile.
C.22 The resulting threshold values are listed in Table C.3 below. Note that these differ slightly from those in Migration Advisory Committee (2011) as they are calculated using the distribution of SOC 2010 (as opposed to SOC 2000) occupations.
Table C.3: SOC 2000 and SOC 2010 benchmarked threshold comparison Code Indicator Source Specification SOC
2000 SOC 2010
P1 Percentage change of median real pay (1 yr)
ASHE Top quartile 0.76 0.53
P2 Percentage change of median real pay (3 yrs)
ASHE Top quartile 5.12 3.44
P3 Return to occupation LFS Not benchmarked.
I1 Change in median vacancy duration (1 yr)
JCP Median + 50% -3.25 -2.96
I2 Vacancies/claimant count JCP Median + 50% 0.50 0.44
V1 Percentage change of claimant count (1 yr)
JCP Median + 50% -23.25 -23.58
V2 Percentage change of employment level (1 yr)
LFS Top quartile 8.48 9.69
V3 Percentage change of median paid hours worked (3 yr)
ASHE Top quartile 0.10 0.00
V4 Change in new hires (1 yr) LFS Top quartile 0.02 0.01
E1 Skill-shortage vacancies/total vacancies
NESS Median + 50% 35.84 38.29
E2 Skill-shortage/hard-to-fill vacancies NESS Top quartile 98.52 94.57
E3 Skill-shortage vacancies/employment NESS Median + 50% 0.24 0.34 Source: LFS, ASHE, Nomis and NESS.
C.23 The indicator values data in Table C.2 and threshold values in Table C.3 allow us to calculate, for each occupation, the number of indicators that are demonstrating shortage. For example, an occupation would have to
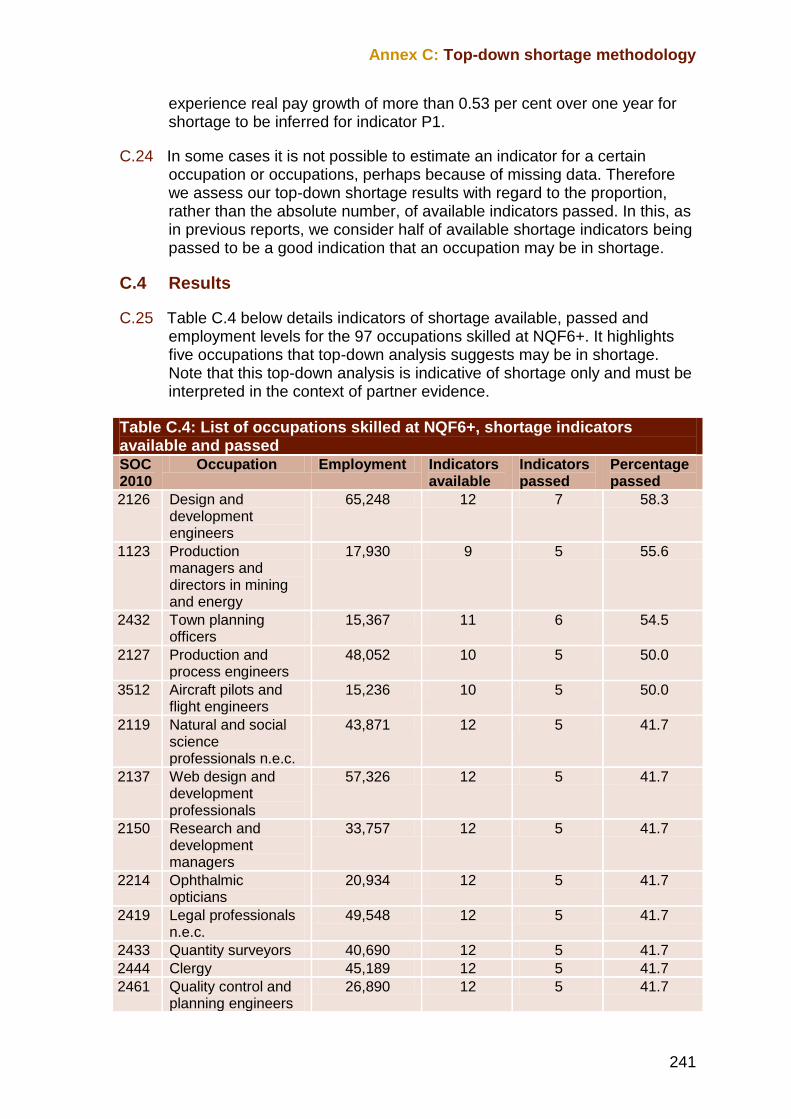
Annex C: Top-down shortage methodology
241
experience real pay growth of more than 0.53 per cent over one year for shortage to be inferred for indicator P1.
C.24 In some cases it is not possible to estimate an indicator for a certain occupation or occupations, perhaps because of missing data. Therefore we assess our top-down shortage results with regard to the proportion, rather than the absolute number, of available indicators passed. In this, as in previous reports, we consider half of available shortage indicators being passed to be a good indication that an occupation may be in shortage.
C.4 Results
C.25 Table C.4 below details indicators of shortage available, passed and employment levels for the 97 occupations skilled at NQF6+. It highlights five occupations that top-down analysis suggests may be in shortage. Note that this top-down analysis is indicative of shortage only and must be interpreted in the context of partner evidence.
Table C.4: List of occupations skilled at NQF6+, shortage indicators available and passed SOC 2010
Occupation Employment Indicators available
Indicators passed
Percentage passed
2126 Design and development engineers
65,248 12 7 58.3
1123 Production managers and directors in mining and energy
17,930 9 5 55.6
2432 Town planning officers
15,367 11 6 54.5
2127 Production and process engineers
48,052 10 5 50.0
3512 Aircraft pilots and flight engineers
15,236 10 5 50.0
2119 Natural and social science professionals n.e.c.
43,871 12 5 41.7
2137 Web design and development professionals
57,326 12 5 41.7
2150 Research and development managers
33,757 12 5 41.7
2214 Ophthalmic opticians
20,934 12 5 41.7
2419 Legal professionals n.e.c.
49,548 12 5 41.7
2433 Quantity surveyors 40,690 12 5 41.7
2444 Clergy 45,189 12 5 41.7
2461 Quality control and planning engineers
26,890 12 5 41.7
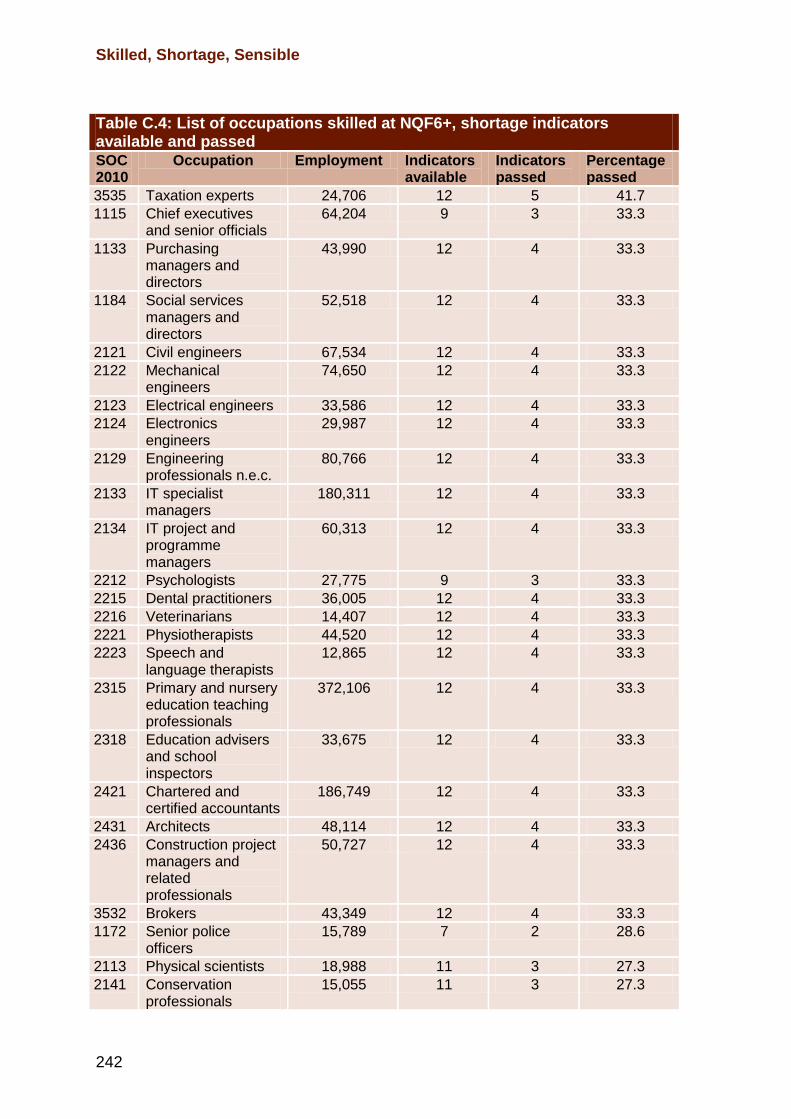
Skilled, Shortage, Sensible
242
Table C.4: List of occupations skilled at NQF6+, shortage indicators available and passed SOC 2010
Occupation Employment Indicators available
Indicators passed
Percentage passed
3535 Taxation experts 24,706 12 5 41.7
1115 Chief executives and senior officials
64,204 9 3 33.3
1133 Purchasing managers and directors
43,990 12 4 33.3
1184 Social services managers and directors
52,518 12 4 33.3
2121 Civil engineers 67,534 12 4 33.3
2122 Mechanical engineers
74,650 12 4 33.3
2123 Electrical engineers 33,586 12 4 33.3
2124 Electronics engineers
29,987 12 4 33.3
2129 Engineering professionals n.e.c.
80,766 12 4 33.3
2133 IT specialist managers
180,311 12 4 33.3
2134 IT project and programme managers
60,313 12 4 33.3
2212 Psychologists 27,775 9 3 33.3
2215 Dental practitioners 36,005 12 4 33.3
2216 Veterinarians 14,407 12 4 33.3
2221 Physiotherapists 44,520 12 4 33.3
2223 Speech and language therapists
12,865 12 4 33.3
2315 Primary and nursery education teaching professionals
372,106 12 4 33.3
2318 Education advisers and school inspectors
33,675 12 4 33.3
2421 Chartered and certified accountants
186,749 12 4 33.3
2431 Architects 48,114 12 4 33.3
2436 Construction project managers and related professionals
50,727 12 4 33.3
3532 Brokers 43,349 12 4 33.3
1172 Senior police officers
15,789 7 2 28.6
2113 Physical scientists 18,988 11 3 27.3
2141 Conservation professionals
15,055 11 3 27.3
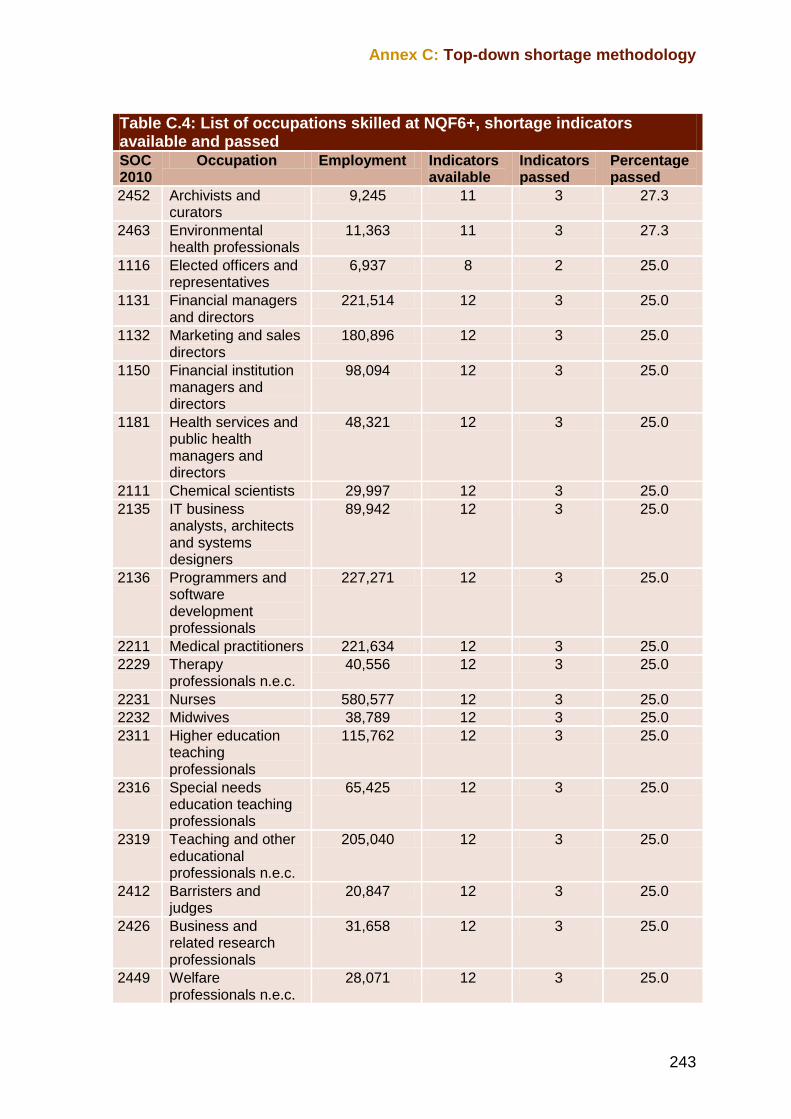
Annex C: Top-down shortage methodology
243
Table C.4: List of occupations skilled at NQF6+, shortage indicators available and passed SOC 2010
Occupation Employment Indicators available
Indicators passed
Percentage passed
2452 Archivists and curators
9,245 11 3 27.3
2463 Environmental health professionals
11,363 11 3 27.3
1116 Elected officers and representatives
6,937 8 2 25.0
1131 Financial managers and directors
221,514 12 3 25.0
1132 Marketing and sales directors
180,896 12 3 25.0
1150 Financial institution managers and directors
98,094 12 3 25.0
1181 Health services and public health managers and directors
48,321 12 3 25.0
2111 Chemical scientists 29,997 12 3 25.0
2135 IT business analysts, architects and systems designers
89,942 12 3 25.0
2136 Programmers and software development professionals
227,271 12 3 25.0
2211 Medical practitioners 221,634 12 3 25.0
2229 Therapy professionals n.e.c.
40,556 12 3 25.0
2231 Nurses 580,577 12 3 25.0
2232 Midwives 38,789 12 3 25.0
2311 Higher education teaching professionals
115,762 12 3 25.0
2316 Special needs education teaching professionals
65,425 12 3 25.0
2319 Teaching and other educational professionals n.e.c.
205,040 12 3 25.0
2412 Barristers and judges
20,847 12 3 25.0
2426 Business and related research professionals
31,658 12 3 25.0
2449 Welfare professionals n.e.c.
28,071 12 3 25.0
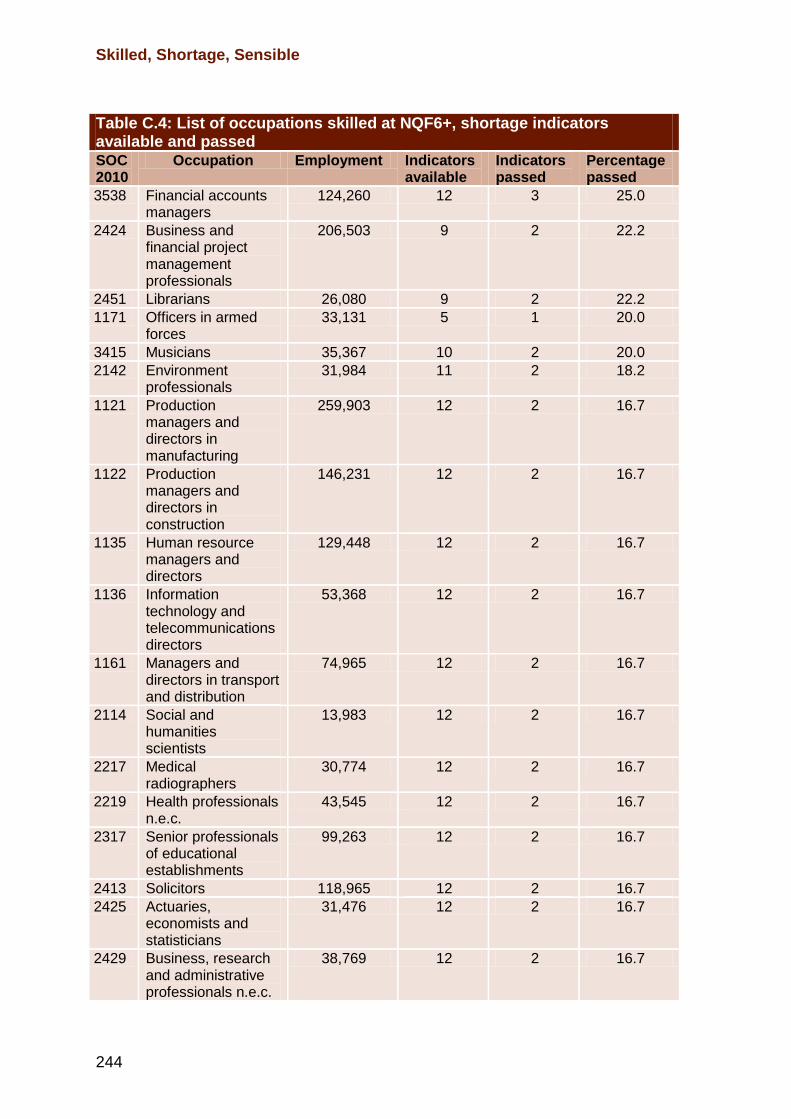
Skilled, Shortage, Sensible
244
Table C.4: List of occupations skilled at NQF6+, shortage indicators available and passed SOC 2010
Occupation Employment Indicators available
Indicators passed
Percentage passed
3538 Financial accounts managers
124,260 12 3 25.0
2424 Business and financial project management professionals
206,503 9 2 22.2
2451 Librarians 26,080 9 2 22.2
1171 Officers in armed forces
33,131 5 1 20.0
3415 Musicians 35,367 10 2 20.0
2142 Environment professionals
31,984 11 2 18.2
1121 Production managers and directors in manufacturing
259,903 12 2 16.7
1122 Production managers and directors in construction
146,231 12 2 16.7
1135 Human resource managers and directors
129,448 12 2 16.7
1136 Information technology and telecommunications directors
53,368 12 2 16.7
1161 Managers and directors in transport and distribution
74,965 12 2 16.7
2114 Social and humanities scientists
13,983 12 2 16.7
2217 Medical radiographers
30,774 12 2 16.7
2219 Health professionals n.e.c.
43,545 12 2 16.7
2317 Senior professionals of educational establishments
99,263 12 2 16.7
2413 Solicitors 118,965 12 2 16.7
2425 Actuaries, economists and statisticians
31,476 12 2 16.7
2429 Business, research and administrative professionals n.e.c.
38,769 12 2 16.7
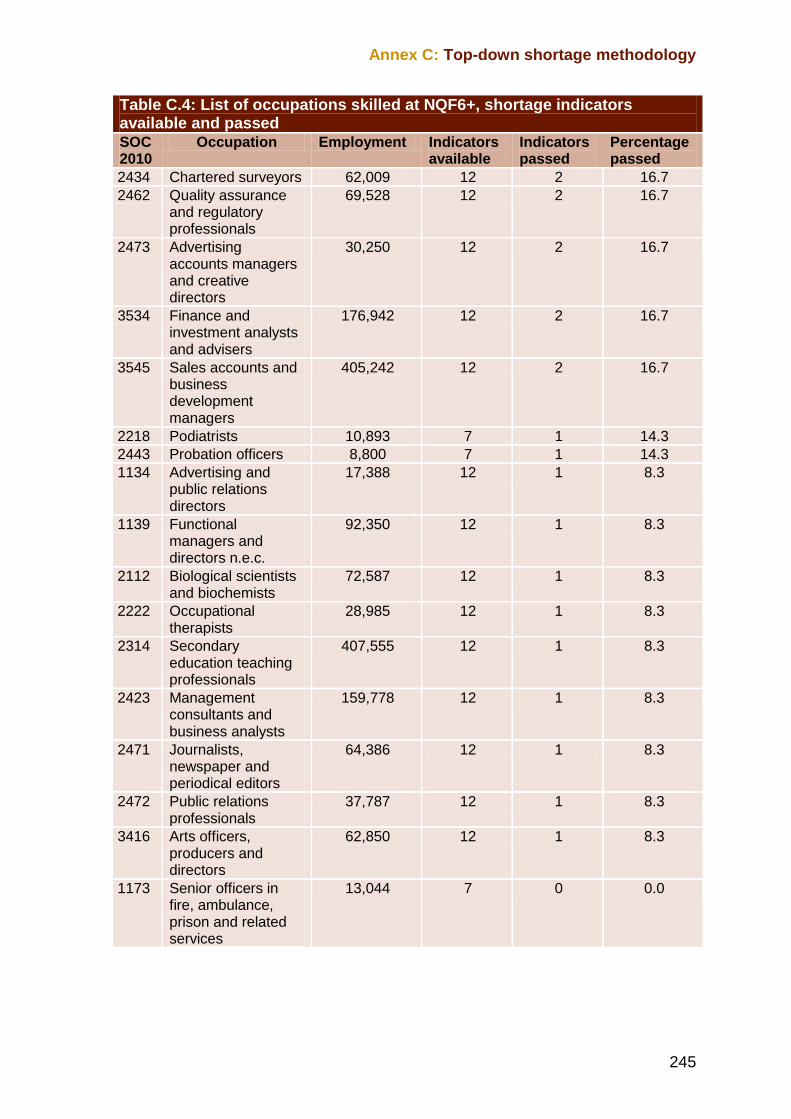
Annex C: Top-down shortage methodology
245
Table C.4: List of occupations skilled at NQF6+, shortage indicators available and passed SOC 2010
Occupation Employment Indicators available
Indicators passed
Percentage passed
2434 Chartered surveyors 62,009 12 2 16.7
2462 Quality assurance and regulatory professionals
69,528 12 2 16.7
2473 Advertising accounts managers and creative directors
30,250 12 2 16.7
3534 Finance and investment analysts and advisers
176,942 12 2 16.7
3545 Sales accounts and business development managers
405,242 12 2 16.7
2218 Podiatrists 10,893 7 1 14.3
2443 Probation officers 8,800 7 1 14.3
1134 Advertising and public relations directors
17,388 12 1 8.3
1139 Functional managers and directors n.e.c.
92,350 12 1 8.3
2112 Biological scientists and biochemists
72,587 12 1 8.3
2222 Occupational therapists
28,985 12 1 8.3
2314 Secondary education teaching professionals
407,555 12 1 8.3
2423 Management consultants and business analysts
159,778 12 1 8.3
2471 Journalists, newspaper and periodical editors
64,386 12 1 8.3
2472 Public relations professionals
37,787 12 1 8.3
3416 Arts officers, producers and directors
62,850 12 1 8.3
1173 Senior officers in fire, ambulance, prison and related services
13,044 7 0 0.0
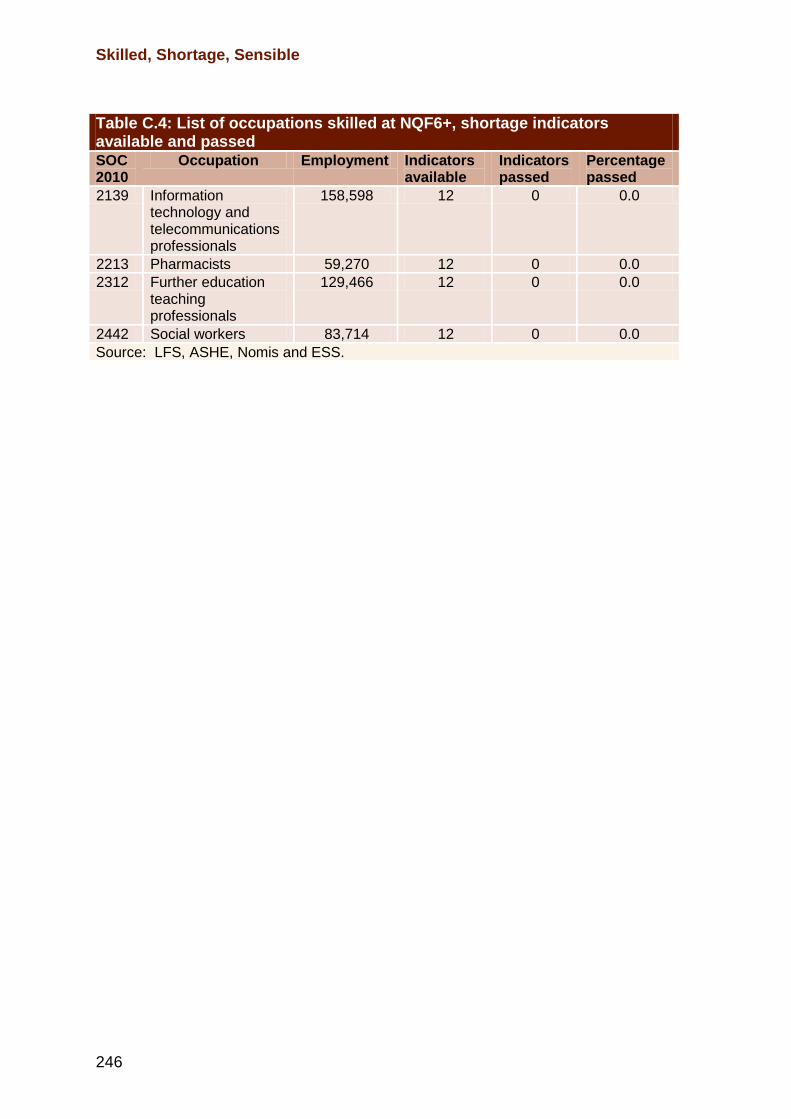
Skilled, Shortage, Sensible
246
Table C.4: List of occupations skilled at NQF6+, shortage indicators available and passed SOC 2010
Occupation Employment Indicators available
Indicators passed
Percentage passed
2139 Information technology and telecommunications professionals
158,598 12 0 0.0
2213 Pharmacists 59,270 12 0 0.0
2312 Further education teaching professionals
129,466 12 0 0.0
2442 Social workers 83,714 12 0 0.0
Source: LFS, ASHE, Nomis and ESS.
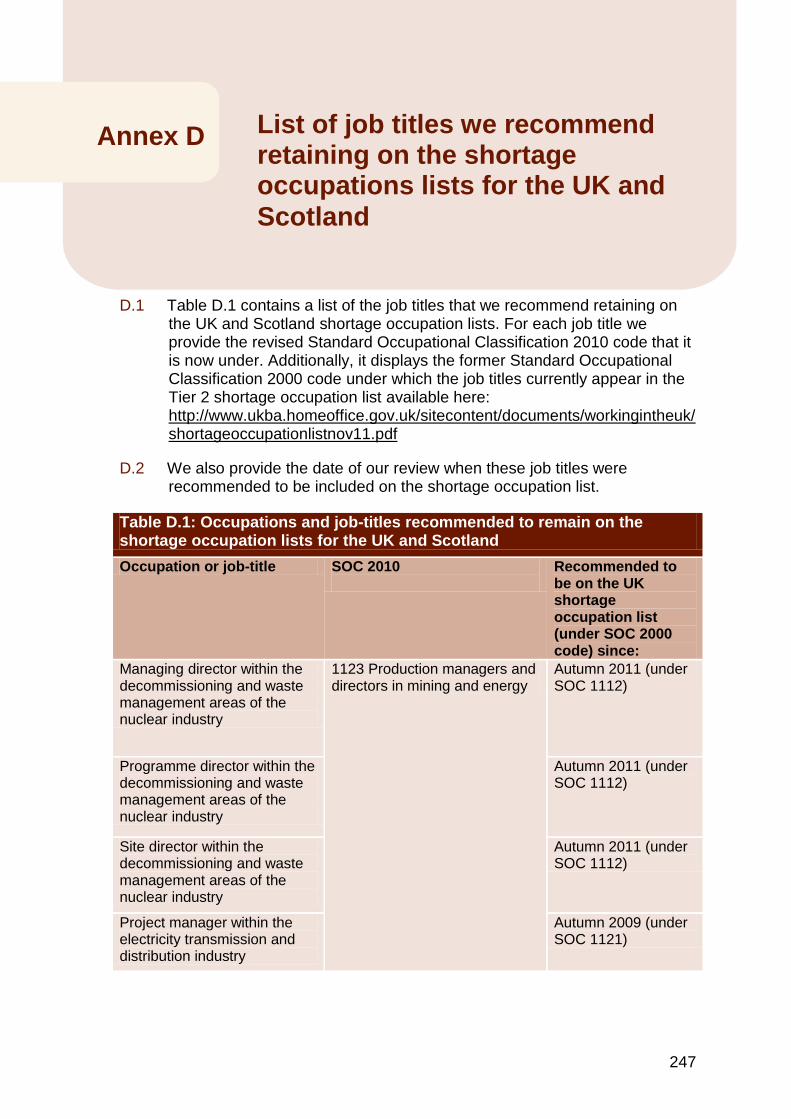
247
D.1 Table D.1 contains a list of the job titles that we recommend retaining on
the UK and Scotland shortage occupation lists. For each job title we provide the revised Standard Occupational Classification 2010 code that it is now under. Additionally, it displays the former Standard Occupational Classification 2000 code under which the job titles currently appear in the Tier 2 shortage occupation list available here: http://www.ukba.homeoffice.gov.uk/sitecontent/documents/workingintheuk/shortageoccupationlistnov11.pdf
D.2 We also provide the date of our review when these job titles were recommended to be included on the shortage occupation list.
Table D.1: Occupations and job-titles recommended to remain on the shortage occupation lists for the UK and Scotland
Occupation or job-title SOC 2010
Recommended to be on the UK shortage occupation list (under SOC 2000 code) since:
Managing director within the decommissioning and waste management areas of the nuclear industry
1123 Production managers and directors in mining and energy
Autumn 2011 (under SOC 1112)
Programme director within the decommissioning and waste management areas of the nuclear industry
Autumn 2011 (under SOC 1112)
Site director within the decommissioning and waste management areas of the nuclear industry
Autumn 2011 (under SOC 1112)
Project manager within the electricity transmission and distribution industry
Autumn 2009 (under SOC 1121)
Annex D List of job titles we recommend retaining on the shortage occupations lists for the UK and
Scotland
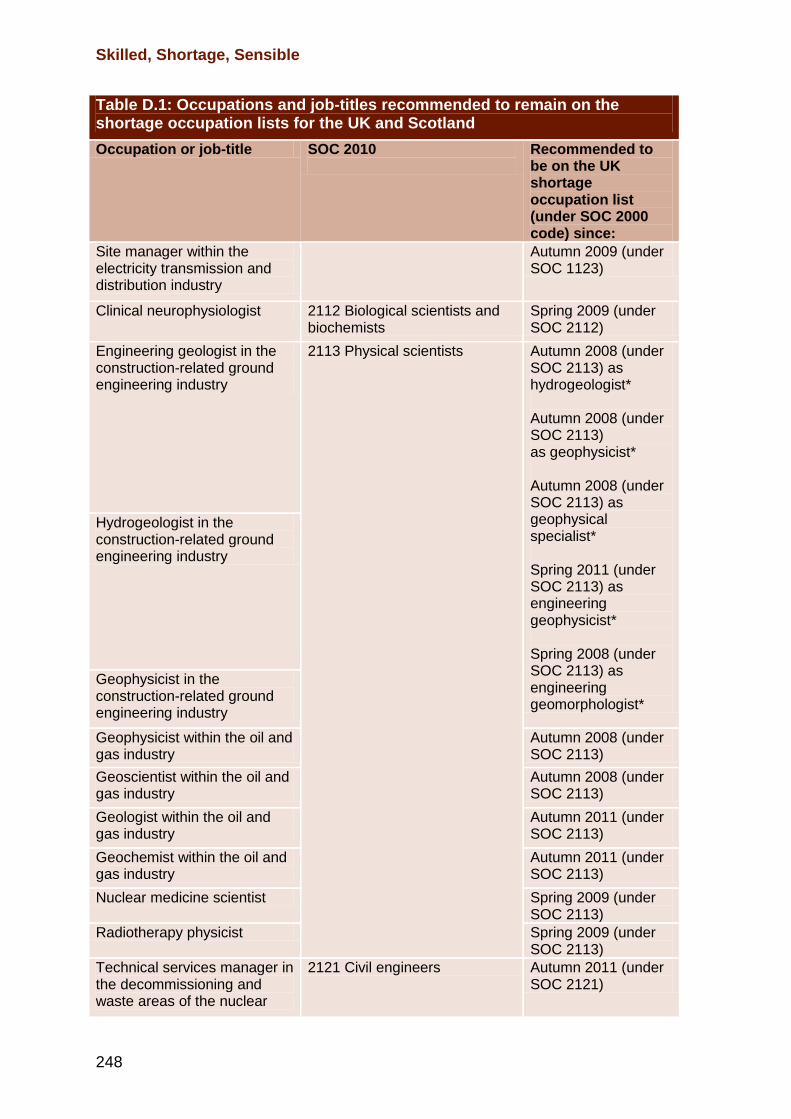
Skilled, Shortage, Sensible
248
Table D.1: Occupations and job-titles recommended to remain on the shortage occupation lists for the UK and Scotland
Occupation or job-title SOC 2010
Recommended to be on the UK shortage occupation list (under SOC 2000 code) since:
Site manager within the electricity transmission and distribution industry
Autumn 2009 (under SOC 1123)
Clinical neurophysiologist 2112 Biological scientists and biochemists
Spring 2009 (under SOC 2112)
Engineering geologist in the construction-related ground engineering industry
2113 Physical scientists Autumn 2008 (under SOC 2113) as hydrogeologist* Autumn 2008 (under SOC 2113) as geophysicist* Autumn 2008 (under SOC 2113) as geophysical specialist* Spring 2011 (under SOC 2113) as engineering geophysicist* Spring 2008 (under SOC 2113) as engineering geomorphologist*
Hydrogeologist in the construction-related ground engineering industry
Geophysicist in the construction-related ground engineering industry
Geophysicist within the oil and gas industry
Autumn 2008 (under SOC 2113)
Geoscientist within the oil and gas industry
Autumn 2008 (under SOC 2113)
Geologist within the oil and gas industry
Autumn 2011 (under SOC 2113)
Geochemist within the oil and gas industry
Autumn 2011 (under SOC 2113)
Nuclear medicine scientist Spring 2009 (under SOC 2113)
Radiotherapy physicist Spring 2009 (under SOC 2113)
Technical services manager in the decommissioning and waste areas of the nuclear
2121 Civil engineers Autumn 2011 (under SOC 2121)
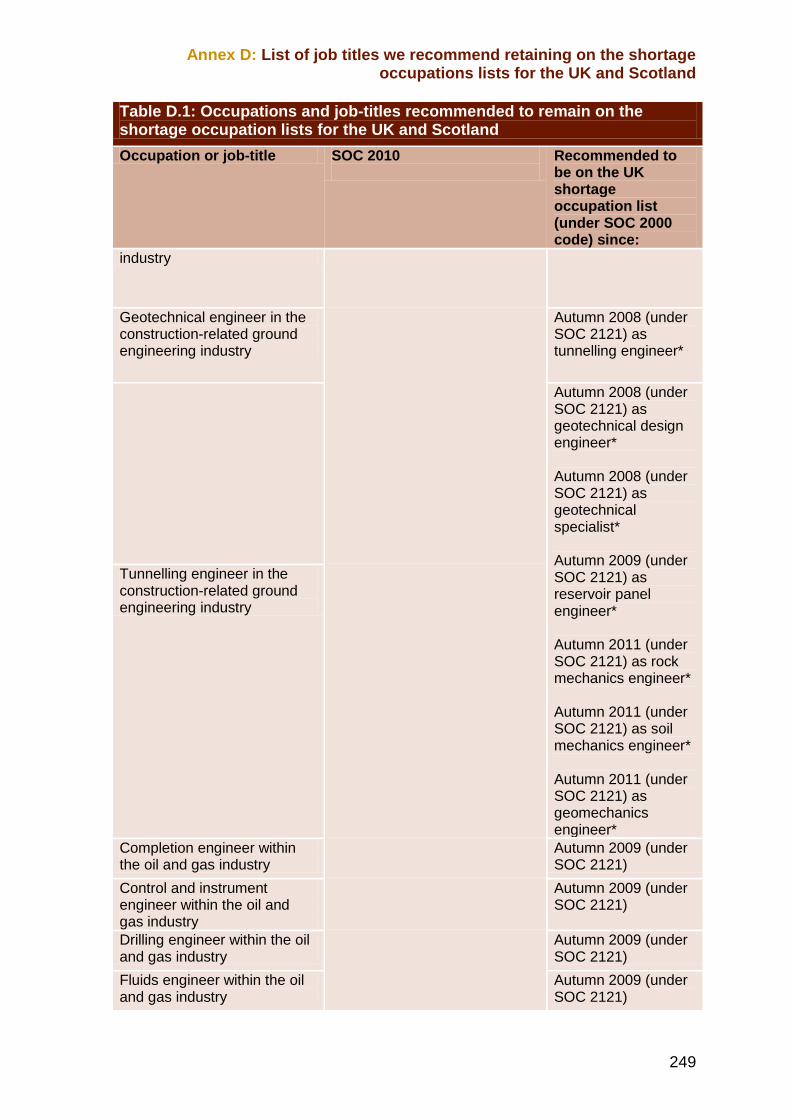
Annex D: List of job titles we recommend retaining on the shortage occupations lists for the UK and Scotland
249
Table D.1: Occupations and job-titles recommended to remain on the shortage occupation lists for the UK and Scotland
Occupation or job-title SOC 2010
Recommended to be on the UK shortage occupation list (under SOC 2000 code) since:
industry
Geotechnical engineer in the construction-related ground engineering industry
Autumn 2008 (under SOC 2121) as tunnelling engineer*
Autumn 2008 (under SOC 2121) as geotechnical design engineer* Autumn 2008 (under SOC 2121) as geotechnical specialist* Autumn 2009 (under SOC 2121) as reservoir panel engineer* Autumn 2011 (under SOC 2121) as rock mechanics engineer* Autumn 2011 (under SOC 2121) as soil mechanics engineer* Autumn 2011 (under SOC 2121) as geomechanics engineer*
Tunnelling engineer in the construction-related ground engineering industry
Completion engineer within the oil and gas industry
Autumn 2009 (under SOC 2121)
Control and instrument engineer within the oil and gas industry
Autumn 2009 (under SOC 2121)
Drilling engineer within the oil and gas industry
Autumn 2009 (under SOC 2121)
Fluids engineer within the oil and gas industry
Autumn 2009 (under SOC 2121)
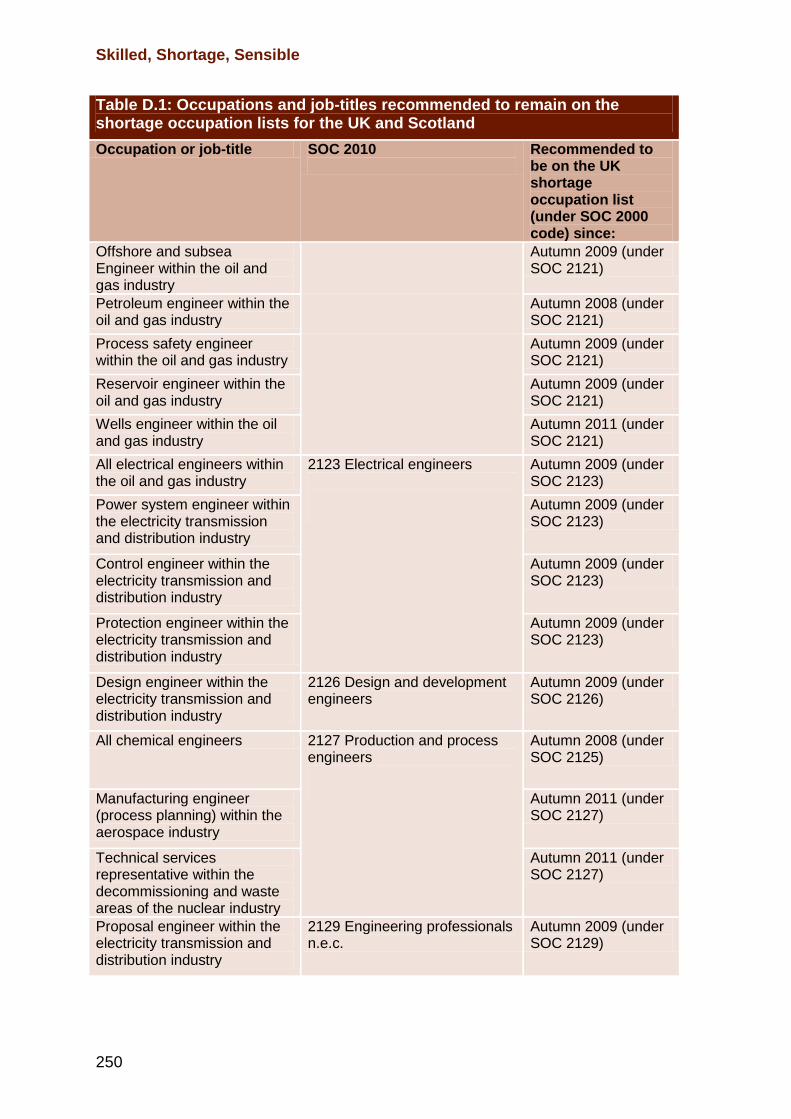
Skilled, Shortage, Sensible
250
Table D.1: Occupations and job-titles recommended to remain on the shortage occupation lists for the UK and Scotland
Occupation or job-title SOC 2010
Recommended to be on the UK shortage occupation list (under SOC 2000 code) since:
Offshore and subsea Engineer within the oil and gas industry
Autumn 2009 (under SOC 2121)
Petroleum engineer within the oil and gas industry
Autumn 2008 (under SOC 2121)
Process safety engineer within the oil and gas industry
Autumn 2009 (under SOC 2121)
Reservoir engineer within the oil and gas industry
Autumn 2009 (under SOC 2121)
Wells engineer within the oil and gas industry
Autumn 2011 (under SOC 2121)
All electrical engineers within the oil and gas industry
2123 Electrical engineers
Autumn 2009 (under SOC 2123)
Power system engineer within the electricity transmission and distribution industry
Autumn 2009 (under SOC 2123)
Control engineer within the electricity transmission and distribution industry
Autumn 2009 (under SOC 2123)
Protection engineer within the electricity transmission and distribution industry
Autumn 2009 (under SOC 2123)
Design engineer within the electricity transmission and distribution industry
2126 Design and development engineers
Autumn 2009 (under SOC 2126)
All chemical engineers 2127 Production and process engineers
Autumn 2008 (under SOC 2125)
Manufacturing engineer (process planning) within the aerospace industry
Autumn 2011 (under SOC 2127)
Technical services representative within the decommissioning and waste areas of the nuclear industry
Autumn 2011 (under SOC 2127)
Proposal engineer within the electricity transmission and distribution industry
2129 Engineering professionals n.e.c.
Autumn 2009 (under SOC 2129)
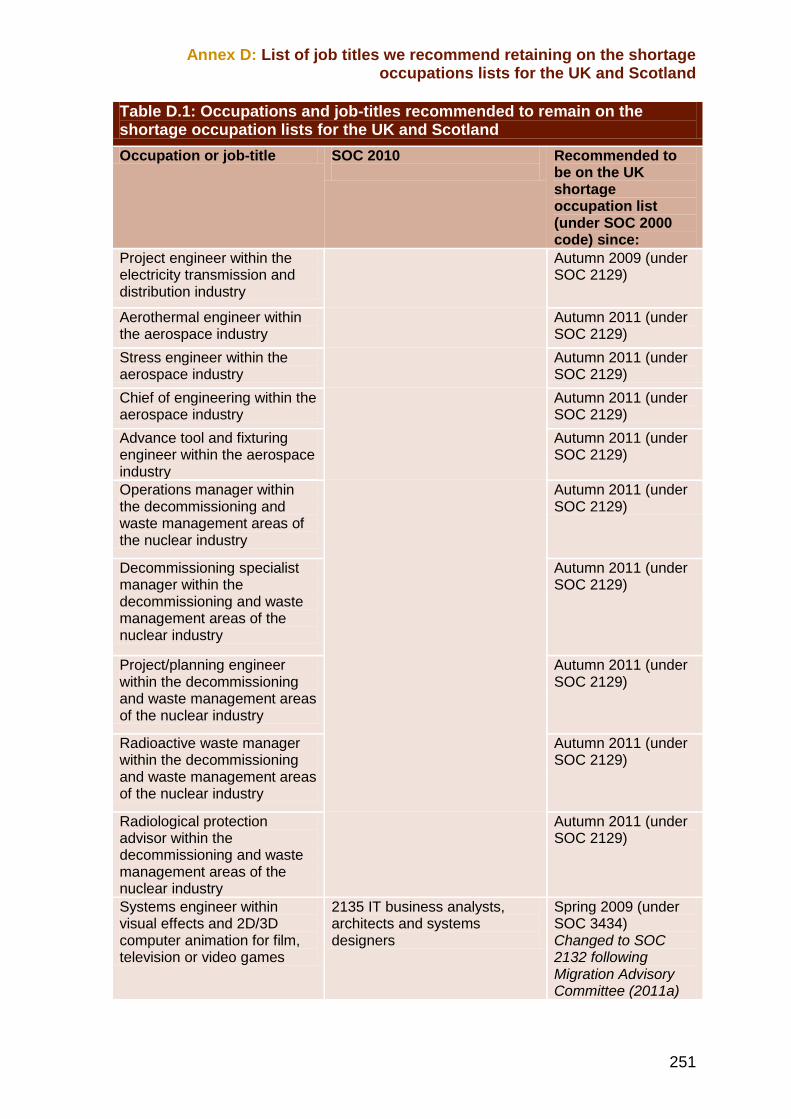
Annex D: List of job titles we recommend retaining on the shortage occupations lists for the UK and Scotland
251
Table D.1: Occupations and job-titles recommended to remain on the shortage occupation lists for the UK and Scotland
Occupation or job-title SOC 2010
Recommended to be on the UK shortage occupation list (under SOC 2000 code) since:
Project engineer within the electricity transmission and distribution industry
Autumn 2009 (under SOC 2129)
Aerothermal engineer within the aerospace industry
Autumn 2011 (under SOC 2129)
Stress engineer within the aerospace industry
Autumn 2011 (under SOC 2129)
Chief of engineering within the aerospace industry
Autumn 2011 (under SOC 2129)
Advance tool and fixturing engineer within the aerospace industry
Autumn 2011 (under SOC 2129)
Operations manager within the decommissioning and waste management areas of the nuclear industry
Autumn 2011 (under SOC 2129)
Decommissioning specialist manager within the decommissioning and waste management areas of the nuclear industry
Autumn 2011 (under SOC 2129)
Project/planning engineer within the decommissioning and waste management areas of the nuclear industry
Autumn 2011 (under SOC 2129)
Radioactive waste manager within the decommissioning and waste management areas of the nuclear industry
Autumn 2011 (under SOC 2129)
Radiological protection advisor within the decommissioning and waste management areas of the nuclear industry
Autumn 2011 (under SOC 2129)
Systems engineer within visual effects and 2D/3D computer animation for film, television or video games
2135 IT business analysts, architects and systems designers
Spring 2009 (under SOC 3434) Changed to SOC 2132 following Migration Advisory Committee (2011a)
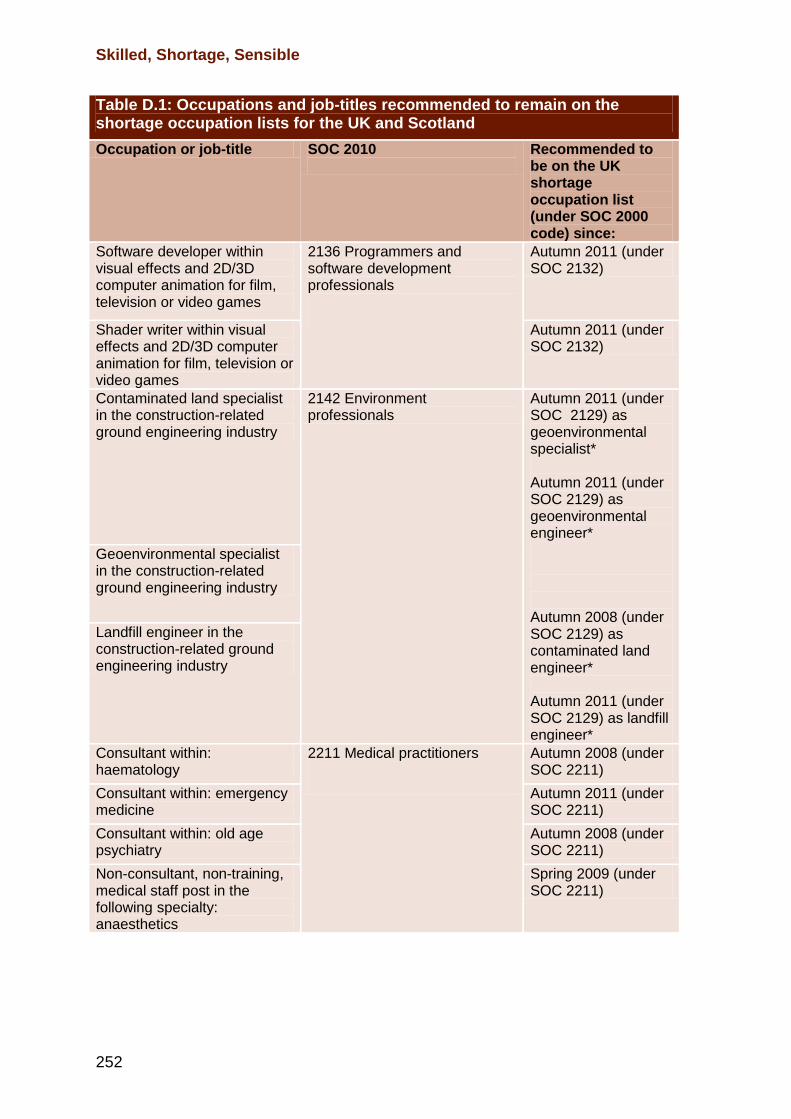
Skilled, Shortage, Sensible
252
Table D.1: Occupations and job-titles recommended to remain on the shortage occupation lists for the UK and Scotland
Occupation or job-title SOC 2010
Recommended to be on the UK shortage occupation list (under SOC 2000 code) since:
Software developer within visual effects and 2D/3D computer animation for film, television or video games
2136 Programmers and software development professionals
Autumn 2011 (under SOC 2132)
Shader writer within visual effects and 2D/3D computer animation for film, television or video games
Autumn 2011 (under SOC 2132)
Contaminated land specialist in the construction-related ground engineering industry
2142 Environment professionals
Autumn 2011 (under SOC 2129) as geoenvironmental specialist* Autumn 2011 (under SOC 2129) as geoenvironmental engineer* Autumn 2008 (under SOC 2129) as contaminated land engineer* Autumn 2011 (under SOC 2129) as landfill engineer*
Geoenvironmental specialist in the construction-related ground engineering industry
Landfill engineer in the construction-related ground engineering industry
Consultant within: haematology
2211 Medical practitioners
Autumn 2008 (under SOC 2211)
Consultant within: emergency medicine
Autumn 2011 (under SOC 2211)
Consultant within: old age psychiatry
Autumn 2008 (under SOC 2211)
Non-consultant, non-training, medical staff post in the following specialty: anaesthetics
Spring 2009 (under SOC 2211)
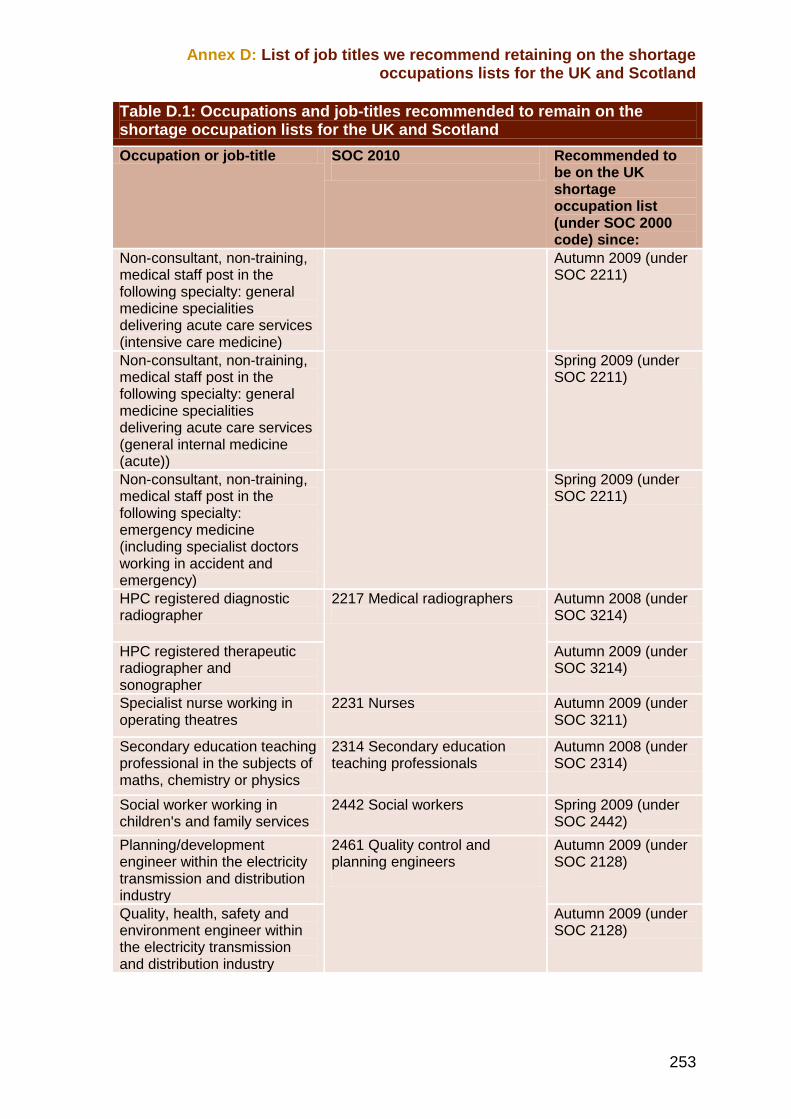
Annex D: List of job titles we recommend retaining on the shortage occupations lists for the UK and Scotland
253
Table D.1: Occupations and job-titles recommended to remain on the shortage occupation lists for the UK and Scotland
Occupation or job-title SOC 2010
Recommended to be on the UK shortage occupation list (under SOC 2000 code) since:
Non-consultant, non-training, medical staff post in the following specialty: general medicine specialities delivering acute care services (intensive care medicine)
Autumn 2009 (under SOC 2211)
Non-consultant, non-training, medical staff post in the following specialty: general medicine specialities delivering acute care services (general internal medicine (acute))
Spring 2009 (under SOC 2211)
Non-consultant, non-training, medical staff post in the following specialty: emergency medicine (including specialist doctors working in accident and emergency)
Spring 2009 (under SOC 2211)
HPC registered diagnostic radiographer
2217 Medical radiographers
Autumn 2008 (under SOC 3214)
HPC registered therapeutic radiographer and sonographer
Autumn 2009 (under SOC 3214)
Specialist nurse working in operating theatres
2231 Nurses Autumn 2009 (under SOC 3211)
Secondary education teaching professional in the subjects of maths, chemistry or physics
2314 Secondary education teaching professionals
Autumn 2008 (under SOC 2314)
Social worker working in children's and family services
2442 Social workers Spring 2009 (under SOC 2442)
Planning/development engineer within the electricity transmission and distribution industry
2461 Quality control and planning engineers
Autumn 2009 (under SOC 2128)
Quality, health, safety and environment engineer within the electricity transmission and distribution industry
Autumn 2009 (under SOC 2128)
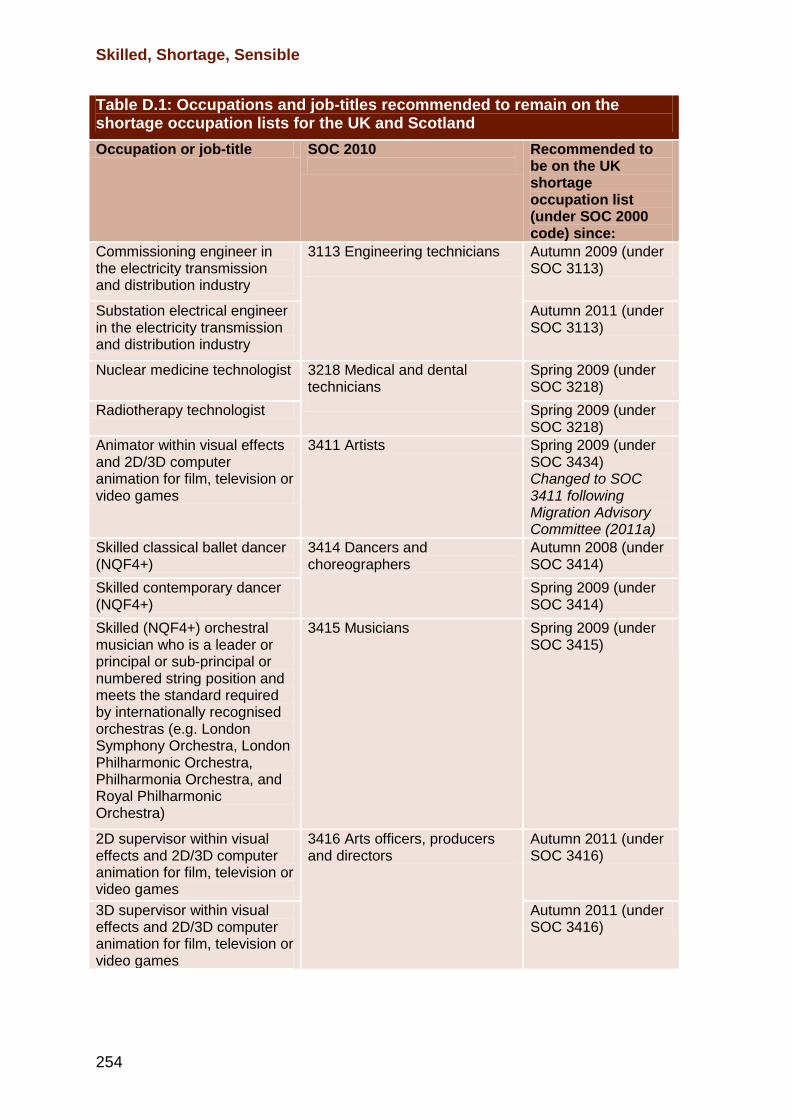
Skilled, Shortage, Sensible
254
Table D.1: Occupations and job-titles recommended to remain on the shortage occupation lists for the UK and Scotland
Occupation or job-title SOC 2010
Recommended to be on the UK shortage occupation list (under SOC 2000 code) since:
Commissioning engineer in the electricity transmission and distribution industry
3113 Engineering technicians
Autumn 2009 (under SOC 3113)
Substation electrical engineer in the electricity transmission and distribution industry
Autumn 2011 (under SOC 3113)
Nuclear medicine technologist 3218 Medical and dental technicians
Spring 2009 (under SOC 3218)
Radiotherapy technologist Spring 2009 (under SOC 3218)
Animator within visual effects and 2D/3D computer animation for film, television or video games
3411 Artists Spring 2009 (under SOC 3434) Changed to SOC 3411 following Migration Advisory Committee (2011a)
Skilled classical ballet dancer (NQF4+)
3414 Dancers and choreographers
Autumn 2008 (under SOC 3414)
Skilled contemporary dancer (NQF4+)
Spring 2009 (under SOC 3414)
Skilled (NQF4+) orchestral musician who is a leader or principal or sub-principal or numbered string position and meets the standard required by internationally recognised orchestras (e.g. London Symphony Orchestra, London Philharmonic Orchestra, Philharmonia Orchestra, and Royal Philharmonic Orchestra)
3415 Musicians Spring 2009 (under SOC 3415)
2D supervisor within visual effects and 2D/3D computer animation for film, television or video games
3416 Arts officers, producers and directors
Autumn 2011 (under SOC 3416)
3D supervisor within visual effects and 2D/3D computer animation for film, television or video games
Autumn 2011 (under SOC 3416)
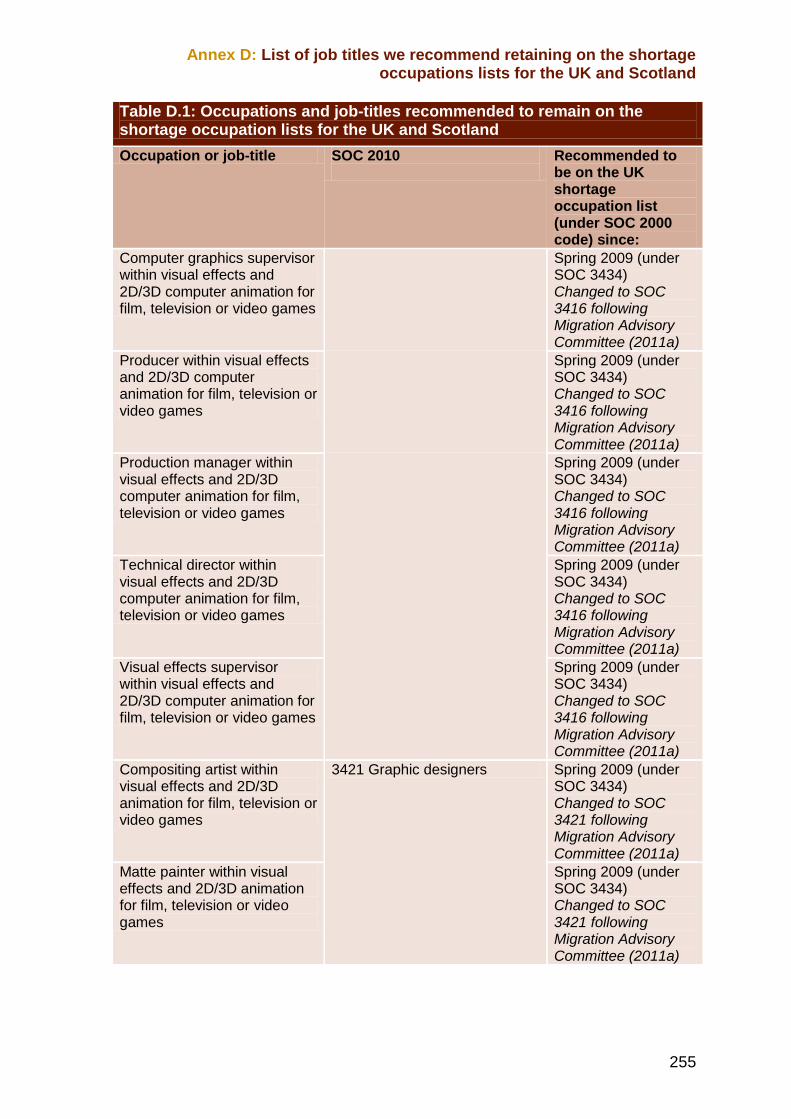
Annex D: List of job titles we recommend retaining on the shortage occupations lists for the UK and Scotland
255
Table D.1: Occupations and job-titles recommended to remain on the shortage occupation lists for the UK and Scotland
Occupation or job-title SOC 2010
Recommended to be on the UK shortage occupation list (under SOC 2000 code) since:
Computer graphics supervisor within visual effects and 2D/3D computer animation for film, television or video games
Spring 2009 (under SOC 3434) Changed to SOC 3416 following Migration Advisory Committee (2011a)
Producer within visual effects and 2D/3D computer animation for film, television or video games
Spring 2009 (under SOC 3434) Changed to SOC 3416 following Migration Advisory Committee (2011a)
Production manager within visual effects and 2D/3D computer animation for film, television or video games
Spring 2009 (under SOC 3434) Changed to SOC 3416 following Migration Advisory Committee (2011a)
Technical director within visual effects and 2D/3D computer animation for film, television or video games
Spring 2009 (under SOC 3434) Changed to SOC 3416 following Migration Advisory Committee (2011a)
Visual effects supervisor within visual effects and 2D/3D computer animation for film, television or video games
Spring 2009 (under SOC 3434) Changed to SOC 3416 following Migration Advisory Committee (2011a)
Compositing artist within visual effects and 2D/3D animation for film, television or video games
3421 Graphic designers Spring 2009 (under SOC 3434) Changed to SOC 3421 following Migration Advisory Committee (2011a)
Matte painter within visual effects and 2D/3D animation for film, television or video games
Spring 2009 (under SOC 3434) Changed to SOC 3421 following Migration Advisory Committee (2011a)
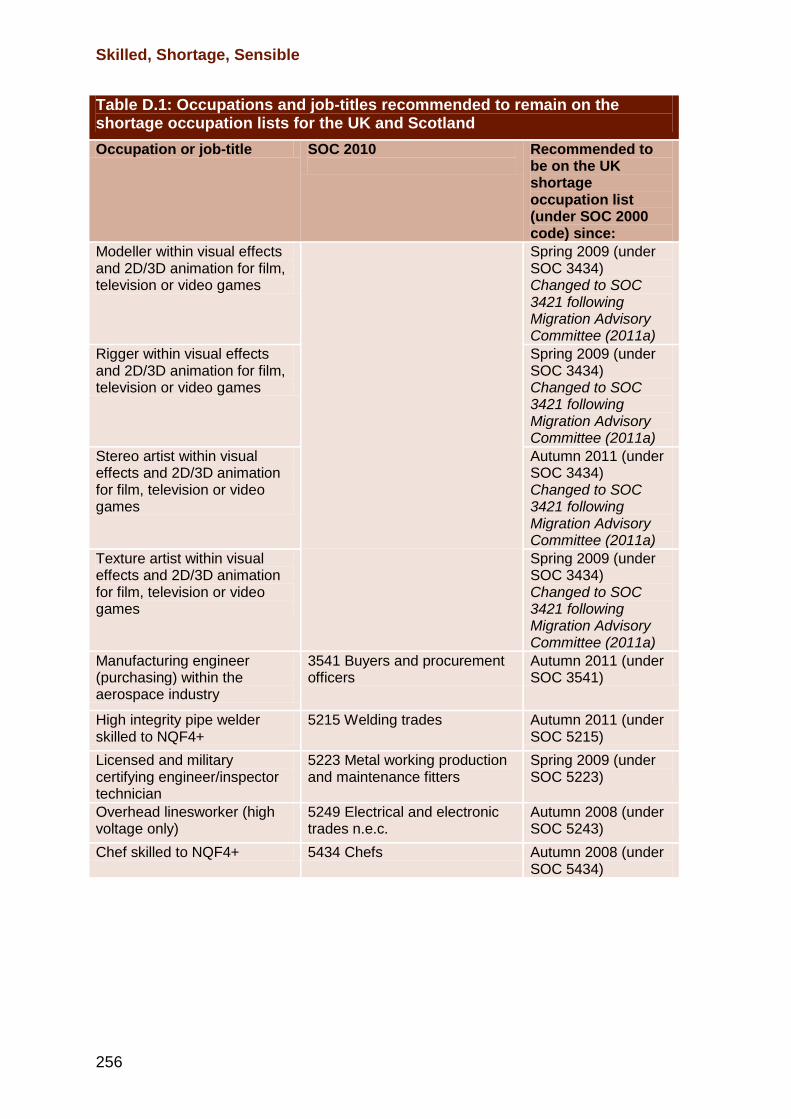
Skilled, Shortage, Sensible
256
Table D.1: Occupations and job-titles recommended to remain on the shortage occupation lists for the UK and Scotland
Occupation or job-title SOC 2010
Recommended to be on the UK shortage occupation list (under SOC 2000 code) since:
Modeller within visual effects and 2D/3D animation for film, television or video games
Spring 2009 (under SOC 3434) Changed to SOC 3421 following Migration Advisory Committee (2011a)
Rigger within visual effects and 2D/3D animation for film, television or video games
Spring 2009 (under SOC 3434) Changed to SOC 3421 following Migration Advisory Committee (2011a)
Stereo artist within visual effects and 2D/3D animation for film, television or video games
Autumn 2011 (under SOC 3434) Changed to SOC 3421 following Migration Advisory Committee (2011a)
Texture artist within visual effects and 2D/3D animation for film, television or video games
Spring 2009 (under SOC 3434) Changed to SOC 3421 following Migration Advisory Committee (2011a)
Manufacturing engineer (purchasing) within the aerospace industry
3541 Buyers and procurement officers
Autumn 2011 (under SOC 3541)
High integrity pipe welder skilled to NQF4+
5215 Welding trades Autumn 2011 (under SOC 5215)
Licensed and military certifying engineer/inspector technician
5223 Metal working production and maintenance fitters
Spring 2009 (under SOC 5223)
Overhead linesworker (high voltage only)
5249 Electrical and electronic trades n.e.c.
Autumn 2008 (under SOC 5243)
Chef skilled to NQF4+ 5434 Chefs Autumn 2008 (under SOC 5434)
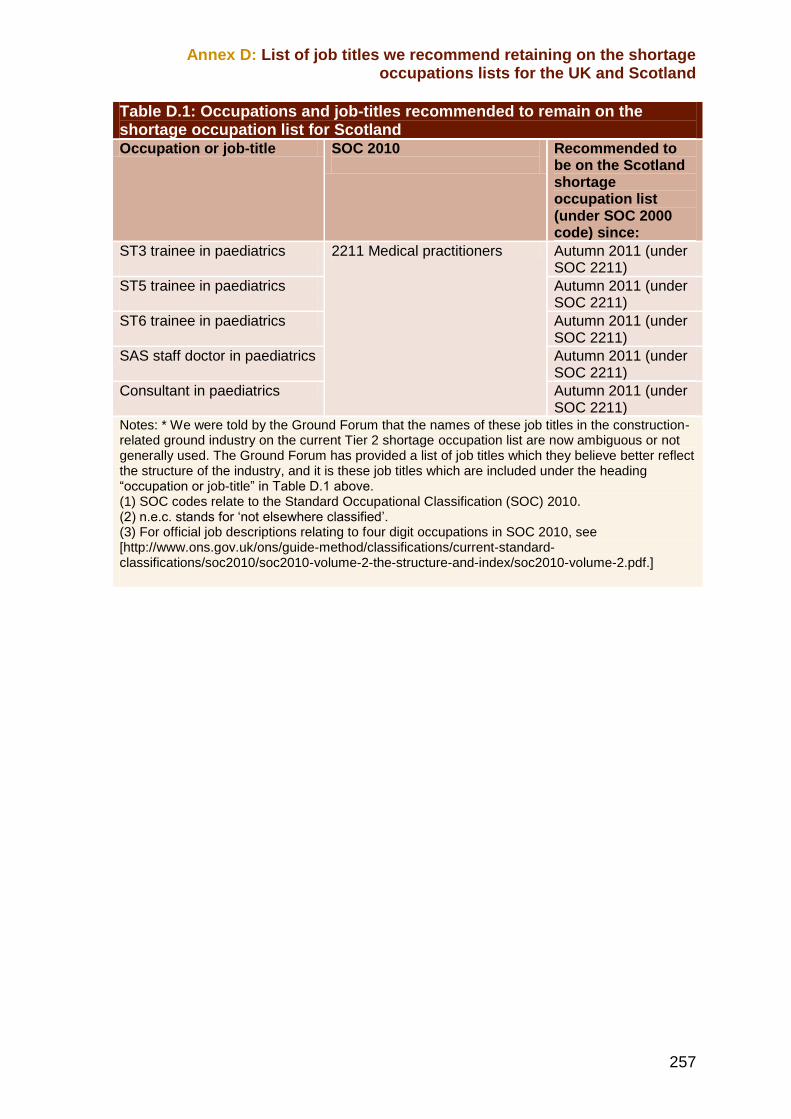
Annex D: List of job titles we recommend retaining on the shortage occupations lists for the UK and Scotland
257
Table D.1: Occupations and job-titles recommended to remain on the shortage occupation list for Scotland
Occupation or job-title SOC 2010
Recommended to be on the Scotland shortage occupation list (under SOC 2000 code) since:
ST3 trainee in paediatrics
2211 Medical practitioners Autumn 2011 (under SOC 2211)
ST5 trainee in paediatrics
Autumn 2011 (under SOC 2211)
ST6 trainee in paediatrics Autumn 2011 (under SOC 2211)
SAS staff doctor in paediatrics Autumn 2011 (under SOC 2211)
Consultant in paediatrics Autumn 2011 (under SOC 2211)
Notes: * We were told by the Ground Forum that the names of these job titles in the construction-related ground industry on the current Tier 2 shortage occupation list are now ambiguous or not generally used. The Ground Forum has provided a list of job titles which they believe better reflect the structure of the industry, and it is these job titles which are included under the heading “occupation or job-title” in Table D.1 above. (1) SOC codes relate to the Standard Occupational Classification (SOC) 2010. (2) n.e.c. stands for „not elsewhere classified‟. (3) For official job descriptions relating to four digit occupations in SOC 2010, see [http://www.ons.gov.uk/ons/guide-method/classifications/current-standard-classifications/soc2010/soc2010-volume-2-the-structure-and-index/soc2010-volume-2.pdf.]


259
ABO Association of British Orchestras
ANS Association of Neurophysiological Scientists
ARTP Association of Respiratory Technology and Physiology
ASGBI Association of Surgeons for Great Britain and Ireland
ASHE Annual Survey of Hours and Earnings
BIS Department for Business, Innovation and Skills
BBSU Balfour Beatty Solutions Utility
BMA British Medical Association
BOA British Orthopaedic Association
CBI Confederation of British Industry
CEM College of Emergency Medicine
CFWI Centre for Workforce Intelligence
CoS Certificates of Sponsorship
COSLA Convention of Scottish Local Authorities
CT Core Training Grade
DCMS Department for Culture, Media and Sport
D&CI Digital and Creative Industries
DfE Department for Education
DoH Department of Health
EEA European Economic Area
EEF Engineer Employers Federation
Abbreviations

Skilled, Shortage, Sensible
260
ELA Employment Lawyers Association
ES Energy Solutions
ESS Employers Skill Survey
EU European Union
EWTD European Working Time Directive
FTE Full Time Equivalent
FTN Foundation Trust Network
GMC General Medical Council
GVA Gross Value Added
GDP Gross Domestic Product
HMT Her Majesty‟s Treasury
HPC Health and Care Professions Council
HRSDC Human Resource and Skills Development Canada
HSCIC Health and Social Care Information Centre
IC Integrated Circuit
ICheme Institute of Chemical Engineers
ICT Information and Communications Technologies
IHAS Independent Health Care Advisory Services
IPEM Institute for Physics and Engineering in Medicine
IRMT Intensity Modulated Radiation Treatment
IRSE Institution of Railway Signal Engineers
ISD Information Services Division Scotland
ITT Initial Teacher Training
JCP Jobcentre Plus
LFS Labour Force Skills
LFS Labour Force Survey
LMO Labour Market Opinion

Abbreviations
261
MAC Migration Advisory Committee
MRC Medical Research Council
MRO Modification, Repair and Overhaul
MSCP Modernising Scientific Careers Programme
NCNT Non-Consultant Non-Training
NESS National Employers Skill Survey
NESTA National Endowment of Science Technology and the Arts
NHS National Health Service
NHSE National Health Service Employers
NISMP Northern Ireland Strategic Migration Partnership
NQF National Qualifications Framework
NQF6+ National Qualifications Framework level 6 and above
OBR Office for Budget Responsibility
ODP Operating Department Practitioner
ONS Office for National Statistics
OPITO Oil and gas Academy
PBS Points Based System
PLC Public Limited Company
PTP Practitioner Training Programme
PwC PricewaterhouseCoopers
QHSE Quality Health Safety Environment
RCN Royal College of Nursing
RD Research and Development
RCoA Royal College of Anaesthetists
RCPCH Royal College of Paediatrics and Child Health
RCoP Royal College of Psychiatry
RCP Royal College of Physicians

Skilled, Shortage, Sensible
262
RCUK Research Council UK
RLMT Resident Labour Market Test
SAS Staff and Associate Specialists
SSSC Scottish Social Services Council
SCoR Society of Radiographers
SCRM Special Committee for Rehabilitation Medicine
SfH Skills for Health
SOC Standard Occupational Classification
SIC Standard Industrial Classification
SLWG Short Life Working Group
SOL Shortage Occupation List
SOLT Society of London Theatre
SSC Sector Skill Council
STEM Science Technology Engineering and Mathematics
ST Specialist Training Grade
STP Scientists Training programme
SVTGBI Society for Vascular Technology of Great Britain and
Ireland
UK United Kingdom
UKESF United Kingdom Electronics Foundation Skills
UKCES Unite Kingdom Commission for Employment and Skills
VFX Visual Effects
WTD Working Time Directive
WTR Working Time Regulations
WRT Workforce Review Team
263
Annual Survey of Hours and Earnings (2011). ASHE 2011 (revised, based on SOC 2010) Table 14 - Occupation (4 digit SOC 2010). Table 14.5a and Table 14.7a. Available at: http://www.ons.gov.uk/ons/publications/re-reference-tables.html?edition=tcm%3A77-280145
Cabinet Office (2010). The Coalition: Our programme for Government. Available at: http://www.cabinetoffice.gov.uk/sites/default/files/resources/coalition_programme_for_government.pdf
Chancellor of the Exchequer (2012). Autumn statement 2012. Available at: http://www.hm-treasury.gov.uk/as2012_index.htm Department for Business Innovation and Skills (2010). Skills for sustainable growth: strategy document. Available at: https://www.gov.uk/government/uploads/system/uploads/attachment_data/file/32368/10-1274-skills-for-sustainable-growth-strategy.pdf
Department for Culture, Media and Sport (2011). Creative Industries Economic Estimates. 2011. Available at: http://www.culture.gov.uk/images/research/Creative-Industries-Economic-Estimates-Report-2011-update.pdf
Employer Skills Survey 2011 (2012). Available at: http://www.ukces.org.uk/publications/employer-skills-survey-2011
Frontier Economics (2010). Defining and measuring skill at the occupational and job level. A report prepared for the MAC. October 2010. Available at: http://www.ukba.homeoffice.gov.uk/sitecontent/documents/aboutus/workingwithus/mac/defining-measuring-skill/report.pdf?view=Binary
HM Treasury (2011). The Plan for Growth. March 2011. Available at: http://cdn.hm-treasury.gov.uk/2011budget_growth.pdf
Home Office (2012a). Statement of Intent and Transitional Measures: Tier 2 of the Points Based System. April 2012. Available at: http://www.homeoffice.gov.uk/publications/immigration/changes-tier-two/statment-of-intent-tier2?view=Binary
References
http://www.cabinetoffice.gov.uk/sites/default/files/resources/coalition_programme_for_government.pdf
Skilled, Shortage, Sensible
264
Home Office (2012b). Control of immigration statistics. Available at: http://www.homeoffice.gov.uk/publications/science-research-statistics/research-statistics/immigration-asylum-research/immigration-q3-2012/
Livingstone, I and Hope, A. (2011). Next Gen: Transforming the UK into the world‟s leading talent hub for the video games and visual effects industries. National Endowment for Science, Technology and the Arts (NESTA), London.
Migration Advisory Committee (2008). Skilled, Shortage, Sensible: The recommended shortage occupations lists for the UK and Scotland. Migration Advisory Committee, London. September 2008. Available at: http://www.ukba.homeoffice.gov.uk/sitecontent/documents/aboutus/workingwithus/mac/first-lists/
Migration Advisory Committee (2009a). Skilled, Shortage, Sensible: First Review of the Recommended Shortage Occupation Lists for the UK and Scotland. Migration Advisory Committee, London. Spring 2009. Available at: http://www.ukba.homeoffice.gov.uk/sitecontent/documents/aboutus/workingwithus/mac/first-review-lists/
Migration Advisory Committee (2009b). Skilled, Shortage, Sensible: Second Review of the Recommended Shortage Occupation Lists for the UK and Scotland. Migration Advisory Committee, London. Autumn 2009. Available at: http://www.ukba.homeoffice.gov.uk/sitecontent/documents/aboutus/workingwithus/mac/first-review-lists1/
Migration Advisory Committee (2010a). Skilled, Shortage, Sensible: Third Review of the Recommended Shortage Occupation Lists for the UK and Scotland. Migration Advisory Committee, London. Spring 2010. Available at: http://www.ukba.homeoffice.gov.uk/sitecontent/documents/aboutus/workingwithus/mac/third-review-lists/
Migration Advisory Committee (2010b). Skilled, Shortage, Sensible: Review of Methodology. Migration Advisory Committee, London. March 2010. Available at: http://www.ukba.homeoffice.gov.uk/sitecontent/documents/aboutus/workingwithus/mac/review-of-methodology/
Migration Advisory Committee (2011a). Skilled shortage sensible: Full review of the shortage occupation lists for the UK and Scotland. Migration Advisory Committee, London. September 2011. Available at: http://www.ukba.homeoffice.gov.uk/sitecontent/documents/aboutus/workingwithus/mac/skilled-shortage-sensible/
Migration Advisory Committee (2011b). Analysis of the Points Based System: Revised UK shortage occupation list for Tier 2 comprising jobs skilled to NQF level 4 and above. Migration Advisory Committee, London. March 2011. Available at: http://www.ukba.homeoffice.gov.uk/sitecontent/documents/aboutus/workingwithus/mac/mac-analysis-of-pbs/
References
265
Migration Advisory Committee (2012a). Limits on migration: Limit on Tier 2 (General) for 2012/13 and associated policies. Migration Advisory Committee, London. February 2012. Available at: http://www.ukba.homeoffice.gov.uk/sitecontent/documents/aboutus/workingwithus/mac/limit-tier2-settle/
Migration Advisory Committee (2012b). Analysis of the Points Based System List of occupations skilled at NQF level 6 and above and review of the Tier 2 codes of practice. Migration Advisory Committee, London. October 2012. Available at: http://www.ukba.homeoffice.gov.uk/sitecontent/documents/aboutus/workingwithus/mac/occupations-skilled/
National Records of Scotland (2012). 2011 Census: First Results on Population Estimates for Scotland - Release 1A. Available at: http://www.scotlandscensus.gov.uk/documents/censusresults/release1a/rel1asb.pdf
Office for Budget Responsibility (2012). Economic and Fiscal Outlook. Available at: http://budgetresponsibility.independent.gov.uk/economic-and-fiscal-outlook-december-2012/ Office for National Statistics (2010). Standard Occupational Classification 2010: Volume 2 - The Coding Index. Palgrave MacMillan, Basingstoke. 2010. Available at: http://www.ons.gov.uk/ons/guide-method/classifications/current-standard-classifications/soc2010/soc2010-volume-2-the-structure-and-index/soc2010-volume-2.pdf
Office for National Statistics (2012a). Labour market statistics. Available at: http://www.ons.gov.uk/ons/rel/lms/labour-market-statistics/november-2012/dataset--labour-market-statistics.html
Office for National Statistics (2012b). CPI and RPI reference tables. Available at: http://www.ons.gov.uk/ons/rel/cpi/consumer-price-indices/october-2012/cpi-and-rpi-reference-tables.xls
Office for National Statistics (2012c). LTIM country of birth. Available at: http://www.ons.gov.uk/ons/rel/migration1/long-term-international-migration/2011/2-03-ltim-country-of-birth--1991-2011.xls
Office for National Statistics (2012d). An Executive summary, 2010-based NPP Reference Volume. Available at: http://www.ons.gov.uk/ons/dcp171776_253890.pdf
Office for National Statistics (2012e). Regional Labour Market - Headline indicators for Scotland. December 2012. Available at: http://www.ons.gov.uk/ons/search/index.html?newquery=YCNN
Office for National Statistics (2012f). Quarterly National Accounts Data Tables, Q3 2012. ABMI and ADJV. December 2012. Available at: http://www.ons.gov.uk/ons/rel/naa2/quarterly-national-accounts/q3-2012/rft-data-reference-tables-qna-q3-2012.xls
Skilled, Shortage, Sensible
266
Office for National Statistics (2012g). United Kingdom National Accounts - The Blue Book. 2012. KKO5, L2PJ, L2NC, CGCE, KI5F, KI5G, KI5H, ABML and YEJZ. Available at: http://www.ons.gov.uk/ons/rel/naa1-rd/united-kingdom-national-accounts/the-blue-book--2012-edition/tsd---blue-book-2012-dataset.html
Office for National Statistics (2012h). United Kingdom Balance of Payments - The Pink Book. 2012. Table 3.10. FJPR, FJRL and FJTH. Available at: http://www.ons.gov.uk/ons/rel/bop/united-kingdom-balance-of-payments/2012/index.html
Royal Academy of Engineering (2012). Jobs and growth: the importance of engineering skills to the UK economy. Available at: http://www.raeng.org.uk/news/publications/list/reports/Jobs_and_Growth.pdf
Scottish Government (2012). Gross Domestic Product, 2nd Quarter 2012. Available at: http://www.scotland.gov.uk/Topics/Statistics/Browse/Economy/GDP2012Q2
Scottish ITEM Club (2012). Scottish ITEM Club forecast 2013. Published by Ernst and Young LLP. Available at: http://www.ey.com/Publication/vwLUAssets/Scottish_ITEM_Club_2013/$FILE/EY_ITEM_Club_Scotland_2013.pdf
Secretary of State for Business, Innovation and Skills (2012). Speech to the CBI Conference: 19 November 2012. Available at: http://news.bis.gov.uk/Press-Releases/Vince-Cable-Speech-CBI-conference-Grosvenor-House-London-19-November-2012-6838d.aspx Talent and Skills Retention (TRS) web portal. Available at: http://www.talentretention.biz/
UK Commission on Employment and Skills (2012a). Sector skills insights: construction. Available at: http://www.ukces.org.uk/assets/ukces/docs/publications/evidence-report-50-construction.pdf
UK Commission on Employment and Skills (2012b). Sector skills insights: energy. Available at: http://www.ukces.org.uk/assets/ukces/docs/publications/evidence-report-51-energy.pdf
UK Commission on Employment and Skills (2012c). Creative Media and Entertainment: Sector Skills Assessment 2012. Evidence Report 63. October 2012. Available at: http://www.ukces.org.uk/assets/ukces/docs/publications/evidence-report-63-creative.pdf


Migration Advisory Committee Report February 2013 www.ukba.homeoffice.gsi.gov.uk/mac © Crown copyright. ISBN: 978-1-78246-100-5