Skilled migration: Australia - Monash...
26
MONASH UNIVERSITY - ACER CENTRE FOR THE ECONOMICS OF EDUCATION AND TRAINING Skilled migration: Australia Chandra Shah WORKING PAPER NO. 60 Abstract Migration patterns to and from Australia are becoming complex with migration programmes increasingly targeted towards meeting the needs of the labour market and regional development. This paper provides an analysis of the permanent and temporary movements of people to and from Australia in the last three years and their impact on the skilled labour supply in Australia. The paper also provides an analysis of occupational mobility of permanent immigrants. The results are consistent with previously published results of initial downward occupational mobility among immigrants. The consequence of this is wastage of skills which the country can least afford in times of reported skills shortages. Skills wastage can be minimised by making available to newly arrived immigrants appropriate programmes for recognising qualifications and occupational licenses; updating occupation-specific skills; and providing up-to-date information on the labour market and its operation. In this respect, the TAFE system in Australia is uniquely placed to play a key role. CEET, Faculty of Education, Building 6, Monash University, Victoria 3800, Australia Telephone 61 3 9905 9157 Facsimile 61 3 9905 9184 Email [email protected] http://www.education.monash.edu.au/centres/ceet
Transcript of Skilled migration: Australia - Monash...

MONASH UNIVERSITY - ACER CENTRE FOR THE ECONOMICS OF EDUCATION AND TRAINING
Skilled migration: Australia
Chandra Shah
WORKING PAPER NO. 60
Abstract Migration patterns to and from Australia are becoming complex with migration programmes increasingly targeted towards meeting the needs of the labour market and regional development. This paper provides an analysis of the permanent and temporary movements of people to and from Australia in the last three years and their impact on the skilled labour supply in Australia. The paper also provides an analysis of occupational mobility of permanent immigrants. The results are consistent with previously published results of initial downward occupational mobility among immigrants. The consequence of this is wastage of skills which the country can least afford in times of reported skills shortages. Skills wastage can be minimised by making available to newly arrived immigrants appropriate programmes for recognising qualifications and occupational licenses; updating occupation-specific skills; and providing up-to-date information on the labour market and its operation. In this respect, the TAFE system in Australia is uniquely placed to play a key role.
CEET, Faculty of Education, Building 6, Monash University, Victoria 3800, Australia
Telephone 61 3 9905 9157 Facsimile 61 3 9905 9184 Email [email protected]
http://www.education.monash.edu.au/centres/ceet
MONASH UNIVERSITY - ACER
CENTRE FOR THE ECONOMICS OF EDUCATION AND TRAINING The Monash University-ACER Centre for the Economics of Education and Training (CEET) is a joint venture of Monash University’s Faculties of Education and Business & Economics and the Australian Council for Educational Research (ACER). Directors Gerald Burke (Professorial Fellow, Faculty of Education, Monash University, Executive Director); Phillip McKenzie (ACER—on leave—John Ainley ACER Deputy Director); and Chris Selby Smith (Professor, Department of Management, Faculty of Business & Economics, Monash University). Associates Peter Noonan (Consultant), Julian Teicher, (Head Department of Management Monash University, Leo Maglen (Professorial Fellow, University of Melbourne, International consultant) Research Staff Damon Anderson, Richard Cooney, Fran Ferrier, Michael Long, Chandra Shah and Paul White. Funding CEET receives its main funding from ANTA as a Key VET Research Centre and undertakes consultancies for a range of other authorities. Focus of Work CEET’s research focuses on the contribution of education and training to economic and social development. CEET’s recent work includes: • the costs of vocational programs in schools, in TAFE and in industry • models for assessing demand for training • labour turnover and the effect on jobs for entrants to the labour market • the impact of globalisation on the occupational structure • evaluation of 'user choice' for apprenticeship training • analysis of the efficiency and equity in the training market • policies to improve the transition of youth from education to work • the impact of VET research on policy and practice • equity and VET • models for analysing student flows in higher education and in vocational education, and • returns to investment in enterprise training.
CEET, Faculty of Education, Building 6, Monash University, Victoria 3800, Australia
Telephone 61 3 9905 9157 Facsimile 61 3 9905 9184 Email [email protected]
http://www.education.monash.edu.au/centres/ceet

Introduction Australia’s reliance on immigration for population and workforce growth has been substantial over the years. At the Census in 2001, 23 per cent of Australia’s population of 19 million was overseas-born. In contrast, Australian-born living overseas permanently or on a long-term basis were estimated at 860,000 in 2001 or equal to 4.4 per cent of the population (Hugo, Rudd and Harris 2003). In 2003-04 just under half the growth in Australia’s population was a result of immigration (DIMIA 2005).
The changing patterns of migration with the associated changes in the size and skill levels are important issues for labour market and vocational education and training (VET) sector which is a major source of skilled labour supply. If migrant skills are in areas of shortage then the inflows are likely to redress the balance between supply and demand without affecting local wages. If however the skills are in areas where an adequate supply already exists then there can be consequences on the numbers that need to be trained and also on wages and the unemployment rate.
As a major source of skilled workers, in terms of new entrants, up-skilling of those already employed and re-skilling of those whose current skills are no longer in demand, the VET sector can play a crucial role in providing training for immigrants whose skills are not quite aligned to the Australian labour market. Of particular importance are the issues of recognition, and upgrading if necessary, of skills that immigrants bring so that they are job-ready.
The VET sector already plays a significant role in providing English language classes to immigrants. The relatively low cost and the flexibility—modular delivery and hours of access—of the TAFE system can be attractive to immigrants who may have to juggle time between work and education and training, particularly now that many are ineligible for social security support for a period of time after arrival.
This paper first briefly reviews recent developments in Australia’s migration policies. It then discusses the factors, mainly economic, that affect the decision to immigrate and other labour market issues for both permanent and temporary immigrants. The paper then provides an analysis of recent movements of working age people to and from Australia. The aim here is estimate the net supply of labour to Australia through these movements. Next the paper includes an analysis of the pre- and post-migration occupational experience of permanent arrivals to Australia and shows that in spite of being more qualified than earlier arrivals, and even when the economy is buoyant as it has been since the mid-1990s, immigrants still experience downward occupational mobility in their first jobs. This leads to wastage of valuable skills that the labour market can ill afford at present. The paper argues for a bigger role for the VET sector in minimising this wastage.
Recent developments in migration policies Before World War II Australia competed with the traditional immigration countries—United States, Canada, New Zealand and South Africa—for immigrants mainly from the British Isles. After the war it extended its catchment first to other parts of Europe, mainly Southern Europe, and then in the last couple of decades to Asia as the numbers available from the traditional European sources began to shrink. The increased emphasis of Asia as a source has also partly coincided with a major increase in both scale and complexity of international population movements.
1

Opening the doors to immigration from Asia has resulted in a large pool of people wanting to come to Australia and instead of encouraging immigrants to come, Australia was now able to select whom they would like to let in.
Whereas just after World War II immigrant labour to Australia consisted of large numbers of unskilled or semi-skilled people1, some of whom were recruited to build infrastructure projects such as the Snowy Mountain Scheme, the trend since then has been for increasing numbers in professional occupations, such as teachers, nurses and doctors. The British Isles is still a major source of immigrants with trade skills in spite of an overall reduction in the proportion of immigrants with such skills.
Since the mid-1990s, immigration policy changes have increasingly focussed on ensuring the economic independence of new immigrants, and thus reducing their demands on publicly-supported social and welfare services and payments. The period before new immigrant arrivals (with the exception of those on Humanitarian visas) can access most social welfare payments has been increased from six months to two years.
An increased emphasis is placed on skilled immigration at the expense of immigration based on family reunion or for humanitarian reasons. The skilled immigration programme is closely aligned to the needs of the Australian labour market, with preference given to Australian qualification holders and those with high levels of English proficiency. Unlike before, immigrants now are therefore more likely to have a working knowledge of English before entering Australia.
Australia was once recognised, together with New Zealand, Canada and the United States, as a ‘traditional’ country of immigration in the sense that they all eschewed temporary immigration. Trends in the patterns of migration flows in the last decade in all these countries suggest policies have shifted to encourage increasing levels of temporary immigration (Khoo et al. 2003; Hugo 2004). These trends, according to Hugo (2004), are heralding a paradigm shift in international migration patterns.
Globalisation, including expansion in goods, capital and services, the development of an immigration industry and the revolutions in information and transportation with the associated proliferation of social networks, is considered one of the drivers of this shift. Some regard liberalisation of labour movements as the last frontier for globalisation. Multilateral agreement on the rules for temporary migration are being developed under Mode 4 of the General Agreement in Trades in Services (GATS) which explicitly relates to temporary, rather than permanent, movement of persons for the provision of cross-border services.
Australian migration policy is evolving and is becoming more sophisticated. Specific policies are being designed to achieve particular goals. For example, some policies aim to encourage immigrants to settle away from the large urban areas, particularly away from Sydney where population pressures on land and infrastructure are intense.
Another relatively recent development has been an increase in the onshore processing of permanent, as well as temporary, visa applications. Students currently studying in Australian institutions are now able to make onshore visa applications for permanent residency under the skilled migration programme.
1 Some people did have skills and qualifications but these were either not recognised in Australia or because of a lack of English language skills prevented their full utilisation in the labour market. Mutual recognition of qualifications agreement between Australia and some other countries (eg New Zealand) and the set up of the office of National Office of Overseas Skills Recognition (NOOSR) to oversee whether qualifications obtained overseas are equivalent to Australian qualifications or not have streamlined the procedures for skills recognition considerably since then. Where qualifications are not equivalent, the service provides advice on what needs to be done, in terms of additional training or work experience, to make them equivalent.
2
The global competition for permanent and temporary skilled and unskilled immigrants is likely to intensify over coming years. In the last few years a number of other developed countries, such as Japan, South Korea and Italy, with no substantial previous history of immigration but faced with ageing population and declining fertility rates, have begun developing programmes to supplement their workforces with workers from other, mainly developing, countries.
Motivation to migrate and other issues There are many factors, including economic, social and political, that motivate an individual to migrate. The economic rationale for permanent migration is based on the analysis of the expected increase in the present value of the immigrant’s expected earnings in the destination country relative to the origin country and the costs of migration. The real wage differences between countries imply that economic migrants generally flow from low wage to high wage countries (Chiswick, Lee and Miller 2002).
The costs of migration include the time and transport costs of the move, other costs of leaving the origin and re-establishing in the destination country and acquiring destination-specific information. Not an insignificant cost is the acquisition of additional skills required to enable immigrants to become fully productive in the destination country.
The immigrant’s skills, defined in a broad sense to include labour market information, destination language competency, occupational licenses, qualifications and other narrowly defined skills that are task-specific and acquired in the home country or elsewhere, may not be perfectly transferable across borders. Skills in certain occupations are less transferable across countries than skills in others. For example, while language and style of practice is important for an economist, for a medical doctor additional requirements include destination-specific license.
Since not all skills are immediately transferable across to the destination country, some immigrants will initially not be able to practise in the same occupation they practised in the country of origin. Chiswick, Lee and Miller describe the immigrants’ occupational mobility as a ‘U-shaped’ trajectory. The steepness of the sides of the ‘U’ and its depth will vary with the characteristics of the immigrant (eg economic, family or refugee) as well as the degree of transferability of skills acquired in the origin country to the destination country and the ease with which the immigrant picks up new skills. Skills transfer is likely to be easier where the economic and cultural backgrounds of the origin and destination countries are similar.
The institutions for qualifications recognition together with those offering skills bridging programmes in the destination country have a crucial role in ensuring immigrants are job-ready as soon as possible and that their skills are not wasted.
Temporary immigrants also take into account the difference between their expected earnings in the origin and destination countries and costs of migration, which may be large and underpin the decision to migrate. The time within which to make a return on investment is however much shorter.
Temporary immigrants are often sponsored by employers and are on contracts which serve to ensure a supply of labour to an employer which might otherwise have not been available or only at higher cost. The contracts protect the employer’s investment in the sponsorship from poaching by other employers.
Contracts reduce the job search cost in the destination country as well as the uncertainty with respect to the immigrant’s total net earnings in the destination country. As the temporary worker is recruited on the basis of a direct match between their current skills and the requirements of the employer the need for additional vocational-specific training before being fully productive is reduced.
3

Employer-sponsored contracts (or as Weinstein (2002) calls ‘tethered’ contracts2) places temporary immigrants in more or less quasi-ownership of the employer. Weinstein considers tethered contracts to have a significant risk of labour market failure, abuse of immigrants’ rights and undercutting of wages of local workers. While there may be an economic gain to the temporary migrant it will be less than if the migrant can respond to wage signals and conditions of employment. This is the central argument used in favour of international labour mobility.
Temporary immigrants are at a certain risk of being exploited by unscrupulous employers and recruitment agencies as their contracts disallow them to seek alternative employment without permission of the sponsoring employer. Hence their ‘company loyalty’ may be reduced to that of law and regulation. This means that the employer may not have the same expense to retain workers but against that may not be able to motivate them. Contracted immigrants who experience language problems and lack familiarity with host country infrastructure, which may reduce their productivity, might find it difficult to seek redress for reasonable grievances against employers.
Recent trends in migration to and from Australia People from overseas come to Australia under a number of programmes, reflecting permanent and temporary nature of the entry. These programmes are constantly evolving and reflect the economic, social and political environment of the times. The following analyses uses data from Department of Immigration, Multicultural and Indigenous Affairs (DIMIA) maintained Overseas Arrivals and Departures (OAD) database as well as other sources.
Australia runs separate Migration and Humanitarian programmes for people (excluding New Zealand citizens) who wish to permanently settle in Australia. In 2002, the Government announced an annual target of about 100,000 for the Migration Programme until 2005–06 (DIMIA 2004) but in 2005 the target was increased by 20,000, mainly in the skills migration program, to counter concerns of skills shortages.
A separate, and largely uncapped, programme is run for temporary immigrants whose conditions of visa allow them to undertake circumscribed employment while in the country. The programme includes employer sponsored skilled workers, students and working holiday makers but excludes tourists.
DIMIA categorises all movements of people to and from Australia according to the time they expect to remain in or be away from Australia (12 months is the cut-off point between long-term and short-term) and whether they are Australian residents or not. Permanent arrivals and departures are included in separate categories to those whose intention is to remain in or leave the country for a fixed time. The trends in the movements in each of these categories over the last three years are shown in Table 1.
In general, movements in all categories except long-term resident departures have been increasing, although short-term visitor arrivals and departures were down in 2002-3 from the previous year. In the last two years, net overseas migration increased over the previous year by 22 and 14 per cent, respectively.
2 Weinstein considers tethered contracts to have a significant risk of labour market failure, immigrants’ rights abuse and undercutting of wages of local workers. Economic gains are derived as a result of immigrants’ freedom to respond to wage signals and conditions of employment. This is the central argument used in favour of international labour mobility. However if immigrants are denied these freedoms then the efficiency arguments lose much of its appeal.
4

Table 1 All movements by category, 2001-02 to 2003-04 (‘000) Category of movement 2001-02 2002-03 2003-04 Permanent arrivals 66.2 69.7 81.3 Long-term resident returning 73.6 79.9 82.6 Long-term visitor arrivals 138.4 149.6 166.0 Short-term visitor arrivals 1215.5 1188.3 1306.3 Permanent departures 38.4 40.1 47.0 Long-term resident departures 79.0 74.7 72.9 Long-term visitor departures 66.9 69.8 79.1 Short-term visitor departures 1241.0 1219.9 1347.8 Net permanent arrivals 27.7 29.6 34.2 Net long-term resident arrivals -5.4 5.2 9.7 Net long-term visitor arrivals 71.5 79.8 86.9 Net overseas migrationb 93.8 114.6 130.8 Source:: Unpublished DIMIA OAD database.. The table includes only15-64 year-olds and excludes resident short-term and visitor movements. b Not corrected for ‘migration adjustments’ which correct for people who change categories after arriving in or departing from Australia, see ABS (2003b). After adjustments net overseas migration in 2003-04 was estimated to be 116,500 across all ages instead of 154,200 (DIMIA 2005).
Permanent movements—settlers
Settlers are those persons who arrive in Australia holding permanent visas without conditions attached on their length of stay in the country.3 They come under various programmes:
1. Family Stream—mainly for family reunification. The numbers allowed in this stream depend on the total size of the programme and the numbers that are allowed under the uncapped categories.
2. Skill Stream—this stream is specifically designed to target immigrants who have skills or outstanding abilities that will contribute to the Australian economy. In general, to gain entry under this scheme applicants must pass a points test that includes skills, age, work experience and English language ability. Additional points are gained on the basis of spouse skills and if the applicant’s intended occupation is listed in the Migration Occupations in Demand List (MODL). The applicant’s qualifications must also be assessed by an appropriate agency as being equivalent to those required in Australia to practice in the intended occupation. Applications for visas can be made offshore or onshore.
3. Others—include those coming under the special eligibility category.4 The numbers who are eligible to settle under this category are demand driven.
4. Humanitarian program—Australia, being a signatory to the United Nations 1951 Convention relating to the Status of Refugees and its 1967 Protocol, offers temporary and permanent re-settlement to a number of people on humanitarian grounds. Both onshore and offshore processing is conducted.
5. New Zealand citizens— New Zealand citizens coming to Australia permanently are outside Australia’s annual Migration Programme. Since 2001 the Australian and New Zealand Governments announced new bilateral social security arrangements under which New Zealand citizens are required to obtain formal Australian permanent residence status if they wish to access certain social security payments, obtain Australian citizenship or sponsor people for permanent residence, unless they are covered by special transitional provisions.
3 Category includes New Zealanders arriving to settle and others with eligibility to settle, eg overseas-born children of Australians. 4 Including Australian children born overseas to Australian citizens and persons granted Australian citizenship overseas.
5

Arrivals by visa subclass
Table 2 shows a 23 per cent jump in settler arrivals in the three years to 2003-04. Large increases were recorded in two of the three major categories—Family (26 per cent) and Skill (31 per cent). In the third major category—New Zealand citizens—arrivals have somewhat declined perhaps reflecting the new social security arrangements between the two countries and the current state of the labour market in New Zealand.
Table 2 Permanent arrivals by visa category, 2001-04 (‘000)Visa category 2001-02 2002-03 2003-04 Family 19.5 23.7 24.6 Skill stream 26.4 28.2 37.0 Humanitarian 4.4 6.0 6.2 NZ citizen 15.5 11.6 13.2 Others 0.3 0.3 0.3 All arrivals 66.2 69.7 81.3 Source: Unpublished DIMIA OAD database. The table includes only15-64 year-olds.
Arrivals by age and gender
The age and gender profiles of permanent arrivals and departures show little change over the last three years. Table 3 shows that overall a slightly higher proportion of all settler arrivals in 2003-04 are female (53 per cent). A slightly higher proportion of the skills stream is male but 67 per cent of the family stream is female.
Table 3 Gender profiles of permanent arrivals and departures by visa sub-category, 2003-04
Visa category Male Female All Family 37 63 100 Skill stream 52 48 100 Humanitarian 51 49 100 NZ citizen 50 50 100 Others 51 49 100 All permanent arrivals 47 53 100 All permanent departures 50 50 100 Source: Unpublished DIMIA OAD database. The table includes only15-64 year-olds.
Table 4 shows that the main difference in the age profiles is between those who arrive in and depart from Australia. In general, arrivals are younger. In 2003-04, 21 per cent of all arrivals were between 15 and 24 years of age but only 11 per cent of departures were in the same age group. On the other hand 26 per cent of all departures were aged 45-64 years compared to only 12 per cent of all arrivals. Some permanent departures include immigrants returning to their country of origin to retire. The bias of the skill stream towards prime working age workers is clear with 80 per cent in the programme aged between 25 and 44 years.
The total economic contribution of a person is a function of their expected time in the workforce. The relatively younger age of arrivals than departures means that the lifetime economic contribution of arrivals is expected to be greater than economic loss due to departures even if their numbers were equal.
6

Table 4 Age profiles of permanent arrivals and departures by visa category, 2003-04
Age (years) Visa category 15-19 20-24 25-34 35-44 45-64 All Family 8 18 43 17 14 100 Skill stream 6 5 47 33 9 100 Humanitarian 23 15 28 21 12 100 NZ citizen 12 18 31 21 18 100 Others 17 12 22 30 19 100 All permanent arrivals 9 12 41 26 12 100 All permanent departures 4 7 34 28 26 100 Source: Unpublished DIMIA OAD database. a Includes skill-matching, skilled independent and distinguished talent visa sub-classes
Country of citizenship of permanent arrivals
The arrival patterns by country of citizenship in Table 5 indicate the increasing importance of UK and Ireland as sources in the skill stream with a corresponding decline of South East Asia and Africa.
In all other streams, Eastern and Southern Europe has declined as a source, reflecting the reduction in tensions in the Balkans, but North Africa and the Middle East have become relatively larger sources.
Table 5 Country of citizenship of permanent arrivals by visa category, 2001-02 to 2003-04 (per cent)
Skill stream Other streamsb
Country of citizenship 2002a 2003 2004 2002 2003 2004 Oceaniac 2 2 2 3 3 3 UK & Ireland 17 25 29 11 11 12 N & W Europe 3 3 3 3 3 3 E & S Europe 3 2 2 13 9 7 N Africa & Middle-East 1 2 2 15 22 21 SE Asia 23 21 17 20 19 18 NE Asia 16 14 15 11 11 11 S & Central Asia 17 16 16 9 9 11 Americas 2 3 3 6 6 6 Africaed 15 12 11 6 5 5 Otherse 0 0 0 2 3 3 All 100 100 100 100 100 100 Source: Unpublished DIMIA OAD database. The table includes only15-64 year-olds. a Financial year ending 2002. b Includes Family and Humanitarian streams. c Includes a small number of New Zealand citizens. d The major source countries in Africa are South Africa, Zimbabwe and Kenya. e Includes children of Australian citizens who have not previously resided in Australia and stateless persons.
7

Arrivals and departures by occupation
The occupation information on the OAD cards is self-reported. Occupation of arrivals is most likely about the job they worked in the country of origin and may not necessarily be the occupation in which the arrivals will practise in Australia. For those departing the information is likely to be about the occupation of job they had most recently.
Table 6 shows that those arriving are more likely not to be in labour force than those departing. In general, the occupational distributions of arrivals and departures show little change over the last three years. Professionals are the highest proportion of both arrivals and departures, comprising about 40 per cent of each group. Associate professionals and tradespersons are relatively smaller proportions among arrivals but their numbers increased 50 per cent in three years.
On average, the net effect of settler movements, excluding those not in the labour force and those who described their occupation inadequately, is an annual increase of 13,100 in the labour supply for Australia in the last three years. This includes 8,000 managers and professionals, 400 associate professionals and 3700 tradespersons. In the last year the net increase was 16,200, including 10,100 managers and professionals, 700 associate professionals and 4,700 tradespersons.
Table 6 Permanent settler movements by occupation, 2001-02 to 2003-04, (‘000)
Arrivals Departures Occupation group 2002b 2003 2004 2002 2003 2004 Managers 5.2 5.1 5.4 5.6 5.7 6.6 Professionals 19.5 20.4 25.5 12.1 12.8 14.2 Associate professionals 3.1 3.3 4.5 2.9 3.1 3.8 Trades 4.7 5.8 7.2 2.0 2.1 2.5 Other occupational groupsc 8.5 8.5 10.1 7.3 7.5 9.4 Inadequately described 6.0 6.7 7.6 1.9 2.0 2.1 Not in the labour force 19.0 19.9 20.9 6.6 6.8 8.4 All 66.2 69.7 81.3 38.4 40.1 47.0 Source: Unpublished DIMIA OAD database. The table includes only15-64 year-olds. b Financial year ending 2002. c Includes advanced clerical & service; intermediate clerical, sales & service; intermediate production and transport; elementary clerical, sales and
service; and labourers’ occupations.
Onshore outcomes
The 2003-04 Migration programme included 36,700 persons granted permanent residency on the basis of onshore applications (DIMIA 2005). People making onshore applications could have arrived in Australia under any of a number of temporary resident visa categories, including student and temporary business visas. Many applicants may be already in the workforce at the time of onshore visa grant and therefore do not affect net additional labour supply even though the occupation distribution may change.
Long-term resident movements
Long-term resident movements are evenly divided between males and females. About two out of every three of them are aged between 25 and 44 years. About half of all residents who depart Australia on a long-term basis (12 months or more) do so for work or business. The majority stay away from Australia for between one and two years.
8

Departures and returns by occupation
The last three years data on long-term resident movements show more residents returning than leaving Australia (see Table 7). On average, 3,200 more returned to Australia each year than left the country. In the last year however the net inflow was about 10,000.
When those not in the labour force and those who described their occupation inadequately are excluded, net long-term resident movements result in annual outflow of 1,900, comprising net outflows of 1,100 managers and 1,600 professionals but net inflows of 700 associate professionals and 800 tradespersons. In the last year net inflows in the latter two groups were much higher than the average.
Table 7 Long-term movements of residents by occupation, 2001-02 to 2003-04, (‘000)
Departures Returns Occupation group 2002a 2003 2004 2002 2003 2004 Managers 9.0 8.2 8.0 6.9 7.5 7.6 Professionals 32.1 30.4 29.6 26.6 29.6 31.0 Associate professionals 5.1 4.9 5.1 5.3 5.6 6.2 Trades 4.0 3.8 3.8 4.2 4.8 5.0 Other occupational groupsb 14.7 13.7 13.8 12.8 13.4 13.9 Inadequately described 2.5 2.6 1.7 5.4 5.7 5.4 Not in the labour force 11.6 11.1 10.9 12.2 13.2 13.4 All 79.0 74.7 72.9 73.6 79.9 82.6 Source: Unpublished DIMIA OAD database. The table includes only15-64 year-olds. a Financial year ending 2002. b Includes advanced clerical & service; intermediate clerical, sales & service; intermediate production and transport; elementary clerical, sales and
service; and labourers’ occupations.
New Zealand citizens
New Zealand citizens have freedom to move to and from Australia without restriction for tourism, visiting family and friends, study and work under the Trans-Tasman Travel Arrangement. Most New Zealand citizen movements are classified as long- or short-term with a small number, as discussed earlier, included in settler movements. However, only long-term New Zealand citizen movements can be used to assess impact on the labour supply. This is because it is difficult to identify the likely participants among the short-term arrivals and departures. Furthermore occupational data on the short-term movements are not collected.
The buoyant New Zealand economy in recent years together with the changes in the social security arrangements has resulted in a drop in the stock of New Zealanders present in Australia. At June 30, 2004 their numbers were 445,000 compared to an average of about 460,000 in the previous three years. More than half (57 per cent) have been in Australia for 12 months or more (DIMIA 2005).
The OAD data show arrivals of New Zealanders under the Trans-Tasman Arrangement increased by 17 per cent in 2003-04 to 685,000 after remaining relatively constant over the previous two years. About 20 per cent of trips are business or employment related.
9

Long-term arrivals and departures by occupation
Excluding those not in the labour force those who described their occupation inadequately, New Zealand citizens increased net labour supply in Australia by 1,700 per year over the last three years. Most of the net inflow consists of managers, professionals and associate professionals.
Table 8 Long-term movements of New Zealand citizens by occupation, 2001-02 to 2003-04
Arrivals Departures Occupation 2002a 2003 2004 2002 2003 2004 Managers 570 455 550 197 237 238 Professionals 1516 1480 1554 507 532 560 Associate professionals 471 434 543 305 320 367 Trades 583 608 702 580 617 676 Other occupational groupsb 1645 1598 2042 1457 1425 1665 Inadequately described 357 309 353 456 428 461 Not in the labour force 951 965 1155 526 558 666 All 6093 5849 6899 4028 4117 4633 Source: Unpublished DIMIA OAD database. The table includes only15-64 year-olds. a Financial year ending 2002. b Includes advanced clerical & service; intermediate clerical, sales & service; intermediate production and transport; elementary clerical, sales and
service; and labourers’ occupations.
Temporary entry
This programme allows people to come to Australia on a temporary basis for specific purposes. Temporary entrants’ movements are also classified as either long-term or short-term. Temporary entrants are required to pay taxes on any income earned in Australia, they do not generally have access to social welfare benefits or Medicare and they must meet Australia’s health and character requirements. They come under one of the following categories:
1. Visitors—people who come mainly as tourists. They are not permitted to take up employment.
2. Overseas students—people who wish to undertake full-time study in registered courses in Australia. Applications can be made offshore or onshore. Since 2001 students can apply for permanent residency while onshore but they need to have obtained an Australian qualification and have to apply under the General Skilled Migration programme. Students can apply for a permit to work while in Australia but the hours per week they can work during term time are capped at 20. In April 2005, the Government announced a pilot scheme to allow students paying full fees to undertake traditional apprenticeships in regional Australia.
3. Working holiday makers (WHM)—young (18 to 30 years of age) people coming for a working holiday for up to a year from a selected number of countries with whom Australia has reciprocal arrangements. There are some restrictions on the time WHMs are permitted to work for any single employer. Changes to this program announced in April 2005 will allow some WHMs to apply for an extension of their visa for another year if they have done at least three months’ seasonal harvest work in regional Australia. This policy change is solely for addressing the needs of the labour market in Australia.
4. Business (long stay)—includes people who come under the 457 visa subclass with a primary purpose that is business-related and those who are recruited by Australian companies as skilled workers for up to four years. The latter group are ‘tethered’ to the sponsoring employer. If they do change employer then the new employer has to assume the
10
sponsorship. Applicants have to have minimum skill level and must be paid above a minimum gross salary. In 2003-04, the minimum was $37,720 for all except those in the information technology (IT) sector for whom the minimum was $46,620.
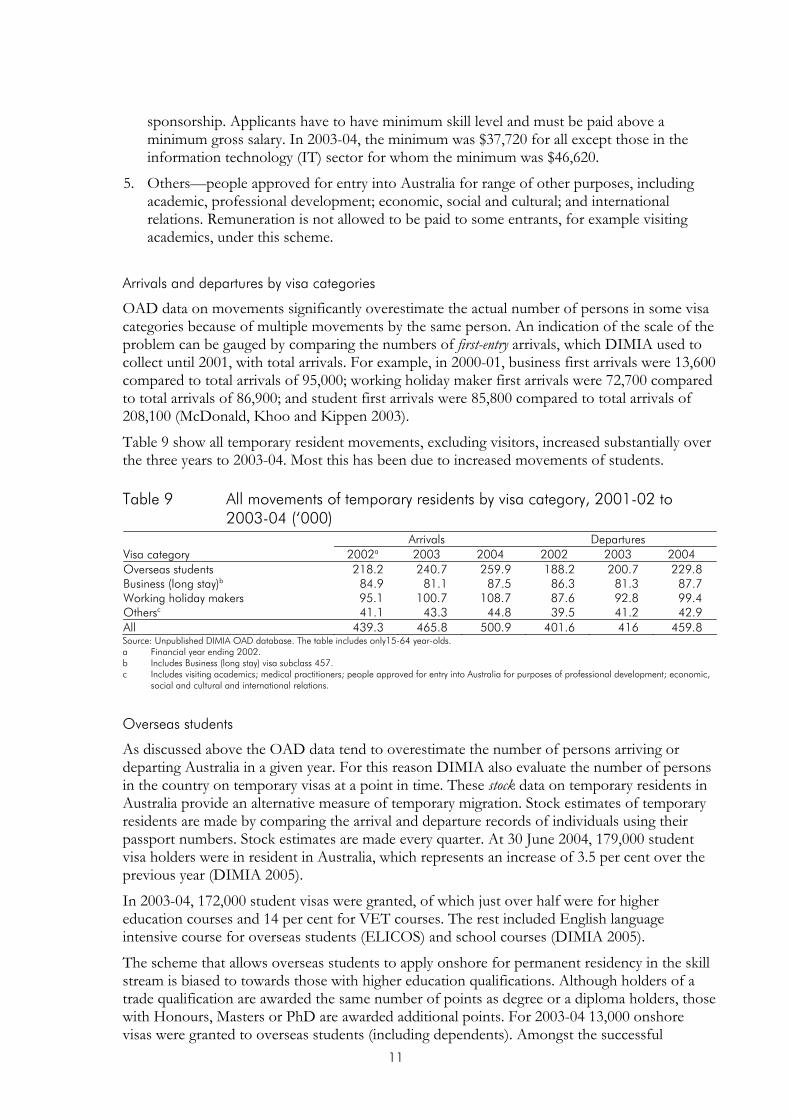
5. Others—people approved for entry into Australia for range of other purposes, including academic, professional development; economic, social and cultural; and international relations. Remuneration is not allowed to be paid to some entrants, for example visiting academics, under this scheme.
Arrivals and departures by visa categories
OAD data on movements significantly overestimate the actual number of persons in some visa categories because of multiple movements by the same person. An indication of the scale of the problem can be gauged by comparing the numbers of first-entry arrivals, which DIMIA used to collect until 2001, with total arrivals. For example, in 2000-01, business first arrivals were 13,600 compared to total arrivals of 95,000; working holiday maker first arrivals were 72,700 compared to total arrivals of 86,900; and student first arrivals were 85,800 compared to total arrivals of 208,100 (McDonald, Khoo and Kippen 2003).
Table 9 show all temporary resident movements, excluding visitors, increased substantially over the three years to 2003-04. Most this has been due to increased movements of students.
Table 9 All movements of temporary residents by visa category, 2001-02 to 2003-04 (‘000)
Arrivals Departures Visa category 2002a 2003 2004 2002 2003 2004 Overseas students 218.2 240.7 259.9 188.2 200.7 229.8 Business (long stay)b 84.9 81.1 87.5 86.3 81.3 87.7 Working holiday makers 95.1 100.7 108.7 87.6 92.8 99.4 Othersc 41.1 43.3 44.8 39.5 41.2 42.9 All 439.3 465.8 500.9 401.6 416 459.8 Source: Unpublished DIMIA OAD database. The table includes only15-64 year-olds. a Financial year ending 2002. b Includes Business (long stay) visa subclass 457. c Includes visiting academics; medical practitioners; people approved for entry into Australia for purposes of professional development; economic,
social and cultural and international relations.
Overseas students
As discussed above the OAD data tend to overestimate the number of persons arriving or departing Australia in a given year. For this reason DIMIA also evaluate the number of persons in the country on temporary visas at a point in time. These stock data on temporary residents in Australia provide an alternative measure of temporary migration. Stock estimates of temporary residents are made by comparing the arrival and departure records of individuals using their passport numbers. Stock estimates are made every quarter. At 30 June 2004, 179,000 student visa holders were in resident in Australia, which represents an increase of 3.5 per cent over the previous year (DIMIA 2005).
In 2003-04, 172,000 student visas were granted, of which just over half were for higher education courses and 14 per cent for VET courses. The rest included English language intensive course for overseas students (ELICOS) and school courses (DIMIA 2005).
The scheme that allows overseas students to apply onshore for permanent residency in the skill stream is biased to towards those with higher education qualifications. Although holders of a trade qualification are awarded the same number of points as degree or a diploma holders, those with Honours, Masters or PhD are awarded additional points. For 2003-04 13,000 onshore visas were granted to overseas students (including dependents). Amongst the successful
11

principal applicants for these visas, 45 per cent had qualifications in the information and communication technology filed, 24 per cent in accounting and 6 per cent in engineering (DIMIA 2005).
Studies of the patterns of work that students engage in while in Australia are non-existent. The lack of clarity with respect to who are Australian residents and the normal place of residence of the respondent in the Australian Bureau of Statistics (ABS) Labour Force surveys means that overseas students are sometimes included in the survey and at other times excluded. Even when they are included they are difficult to identify. Anecdotal evidence suggests most student contribution to labour supply is likely to be at the semi-skilled or unskilled level and at the professional level after completing their courses.
Business (long stay)—visa subclass 457
The 457 visa subclass provides an effective tool for employers seeking to fill skilled vacancies with overseas personnel. Its attractiveness is simplicity and speed of processing of applications which can be lodged electronically. In 2003-04, the processing time for visas was between 29 and 43 days for high risk cases and between 14 and 18 days for low risk cases (DIMIA 2005).
People arriving under the 457 visa subclass are a highly mobile group. They tend to operate in the global market and travel overseas frequently for vacations or business. Many 457 visa applications are made onshore. For example, 23,000 out of a total of 37,000 457 visa grants in 2000-01 were processed onshore (Khoo et al. 2003).
Figure 1 shows that the temporary skilled migration scheme expanded rapidly from its inception in 1996 until 2001, which is the time when significant softening in the labour market for ICT personnel occurred. Since then the stock of people under this visa category has remained relatively constant at just under 45,000 persons. Some increase in the stock is however noticeable in 2004 over the previous year.5 Leakage from the stock occurs not only because some people leave either at the end of their contract with the sponsor or at the end of the visa period, but also as a result of some changing their residency status from temporary to permanent. In 2003-04, 457 9,800 visa holders applied for permanent residence status (DIMIA 2005).
5 In 2003-04, Business (long stay) visas grants increased to 40,100, which represents 6 per cent increase over the previous year (DIMIA 2005).
12

Figure 1 Stock of temporary residents on business (long stay) visas in Australia, June 1997 to December 2004
10
20
30
40
5019
97.2
1997
.319
97.4
1998
.119
98.2
1998
.319
98.4
1999
.119
99.2
1999
.319
99.4
2000
.120
00.2
2000
.320
00.4
2001
.120
01.2
2001
.320
01.4
2002
.120
02.2
2002
.320
02.4
2003
.120
03.2
2003
.320
03.4
2004
.120
04.2
2004
.320
04.4
Quarter
Stoc
k ('0
00)
Source: Unpublished, DIMIA Stock data. The chart includes only those aged over 19 years.
Further analysis of stock data show about half of all 457 visa entrants are primary applicants and the rest are dependents. In 2004, 70 per cent of primary applicants were male and a similar percent were aged between 20 and 39 years. New South Wales was the preferred destination of a majority of 457 visa holders. Data on where they actually ended up working are unavailable.
Table 10 shows the UK and Ireland as major source countries for 457 visa holders and with their relative importance increasing since 1997. On the other hand North East Asia (mainly Korea and Japan) and the Americas (mainly North America) have declined in importance.
Table 10 Country of citizenship of temporary residents on business (long stay) visas in Australia (per cent)
Country of citizenship September, 30 1997 September, 30 2004
Oceaniaa 0 1 UK & Ireland 29 38 N & W Europe 11 9 E & S Europe 2 3 N Africa & Middle-East 1 2 SE Asia 5 8 NE Asia 23 16 S & Central Asia 3 8 Americas 19 10 Africab 5 6 Othersc 1 0 All 100 100 Source: Unpublished, DIMIA Stock data. The table includes only those aged over 19 years. a Excludes New Zealand citizens. b The major source countries in Africa are South Africa, Zimbabwe and Kenya. c Not fully identified.
The stock data do not include occupation information on 457 visa holders. The OAD data can however provide an indicative occupational profile of those among them who intend to stay 12
13

months or more. Table 11 shows that about two-thirds of all 457 arrivals are managers or professionals; and associate professionals and tradespersons make up another ten per cent. The percentage that is managers has declined over the last three years relative to all other occupations.
Table 11 Temporary resident arrivals on business (long stay) visas by occupation, 2001-02 to 2003-04, (per cent)
Long-term arrivals Occupation group 2002a 2003 2004 Managers 26.2 23.2 21.9 Professionals 38.4 40.9 42.5 Associate professionals 7.0 7.1 7.4 Trades 2.4 3.2 3.6 Other occupational groupsb 8.5 8.6 9.3 Inadequately described 6.2 5.8 5.0 Not in the labour force 11.4 11.3 10.4 All 100.0 100.0 100.0 Source: Unpublished DIMIA OAD database. The table includes only15-64 year-olds. a Financial year ending 2002. b Includes advanced clerical & service; intermediate clerical, sales & service; intermediate production and transport; elementary clerical, sales and
service; and labourers’ occupations.
Assuming 40,100 arrivals (based on visa grants in 2003-04) and 11,700 departures (long-term departures in 2003-04) in this visa category, the net inflow of 457 visa holders in 2003-04 is estimated to be 28,400. Excluding those who described their occupation inadequately or were not in the labour force, the expected addition to the labour supply from these movements is 24,000. These include 5,300 managers, 10,200 professionals, 1,800 associate professionals and 900 tradespersons.
Working holiday makers
Apart from providing cultural, social and tourism benefits to Australia, the working holiday makers’ programme provides economic benefits in terms of supplementing short-term labour requirements in some industry sectors such as agriculture and hospitality. Currently, Australia has reciprocal agreements with eighteen countries, most of which are Western and Southern European, but including Japan, South Korea, Taiwan and Hong Kong. Although there has been an agreement with Canada since 1975 no such agreements exist with the United States.
The number of WHMs arriving in Australia has been increasing steadily over the years as more countries join the programme and the programme’s popularity increases. In 2003-04, there were 109,000 arrivals, an increase of 14 per cent since 2001-02.
Table 12 shows the single largest source of WHMs arrivals is the UK even though its share declined from 47 to 39 per cent over the last three years. On the other hand, arrivals from Germany and South Korea are increasing with their combined share doubling over three years. Italy, France, Belgium and Taiwan joined the scheme in 2004 and the numbers arriving from these countries is expected to boost total arrivals in coming years.
14

Table 12 Working holiday makers by country of citizenship, 2001-02 to 2003-04 (per cent)
Country of citizenship 2001-02 2002-03 2003-04 UK 47 45 39 Ireland 13 12 14 Japan 12 12 11 Germany 6 8 10 South Korea 3 5 8 Canada 7 7 7 Nordic countries 4 6 6 The Netherlands 7 5 4 Othersa 0 0 1 Total 100 100 100 Total number (‘000) 95.1 100.7 108.6 Source: Unpublished DIMIA OAD database. a Includes France, Malta, Italy, Cyprus and Hong Kong and some non-participating countries.
Harding and Webster (2002) surveyed over 1000 WHMs about their labour market experience just before they departed Australia. The survey showed that WHMs are, in general, a highly qualified group with 46 per cent of them having attained a higher education qualification and with another 23 per cent having attained a diploma or Certificate III or IV.
While in Australia, 85 per cent of WHMs reported having engaged in paid work and on average holding 2.9 jobs during their stay. The average number of days worked in the first three jobs was between 39 and 48 days.
Despite being highly qualified Table 13 shows that over 60 per cent of WHMs worked in elementary or labouring occupations. The common impression of WHMs working in regional labour markets, particularly in agriculture and horticulture at harvest time, is unsustained as 69 per cent of the jobs performed were in main capital cities. Only 10 per cent of businesses that employed WHMs were in the agriculture, forestry or fishing industries.
In only 15 per cent of jobs were WHMs provided training by the employer. This is not surprising given the short time they are allowed to be employed by any one employer.
Table 13 Distribution of jobs of working holiday makers by occupation (per cent) Occupation Per cent Professional 10.9 Associate professional 0.5 Tradesperson 3.0 Advanced clerical & service 7.1 Intermediate clerical, sales & service 15.2 Intermediate transport and production 2.0 Elementary clerical, sales & service 24.3 Labourers 36.9 Total 100.0 Source: Working Holiday Makers survey 2000, Melbourne Institute, University of Melbourne.
Based on estimates in Harding and Webster (2002), 109,000 WHMs who arrived in 2003-04 are likely to have taken up 55,700 full-year jobs including 6,100 in professional, 300 in associate professional and 1,700 in trade occupations. Total expenditure by WHMs while in Australia has a potential to create 66,800 jobs.6
6 Therefore the net number of jobs created for Australians through the WHM scheme is estimated to be 11,100.
15

Summary
This section has provided analyses of recent trends in the movements of working age people to and from Australia. Estimating the total net contribution of migration to Australia’s labour supply is complex because of the multitude of programmes under which people enter the country and the difficulty in converting arrival and departure movements into actual numbers of persons and actual time they stay in the country.
If those not in the labour force and those who inadequately described their occupation are excluded, then the expected increase in Australia’s labour supply in 2003-04 will be:
• 16,200 from permanent movements;
• 3,400 from long-term resident movements;
• 1,900 from movements of New Zealand citizens (excluding permanent movements);
• 24,000 from movements of business (long stay)—visa subclass 457; and
• 55,700 from movements of working holiday makers.
The total addition to the supply is expected to be 102,000, including 39,300 managers and professionals, 4,400 associate professionals and 8,600 tradespersons. Students also add to the supply but their contribution is difficult to assess.
The number of completions of apprenticeships and traineeships in trade occupations in the twelve months to September 2004 were projected to be 30,600 of which 21,800 were in the traditional trades (NCVER 2004). Thus relative to the output of the Australian training system, migration makes a very significant contribution to the supply of qualified tradespersons.
Since the mid-1990s, Australian governments at all levels have recognised the need for a balanced migration program that contributes to the economic, social and demographic development of regional Australia. A number of visa categories, for both permanent and temporary stays, which collectively come under the State-Specific and Regional Migration Initiatives, have been introduced. These programmes are specifically targeted to promote settlement in regional areas. State and Territory governments play a strong role in the nomination process. Visa grants, as opposed to actual arrivals, under these initiatives increased more than three-fold to 12,700 in the three years to 2003-04. Victoria has been by far the largest beneficiary of the programme with about half of all visa grants in 2003-04 (DIMIA 2005).
Labour market experience of permanent immigrants Among the data sources used for analysis so far only the one-off Working Holiday Makers survey, conducted by the Melbourne Institute, has information on the labour market and educational experience of immigrants who are already in the country. This information is however available for permanent immigrants in the Longitudinal Survey of Immigrants to Australia (LSIA).
There are two LSIA surveys:
• LSIA 1 surveyed migrants who arrived in Australia between September 1993 and August 1995 (Cohort 1); and
• LSIA 2 surveyed migrants who arrived in Australia between September 1999 and August 2000 (Cohort 2).
While extensive analysis of LSIA has already been reported (Wooden and VandenHeuvel 1999; Richardson, Robertson and Ilsley 2001; Richardson et al. 2004; Cobb-Clark 2000; 2004), and some of these studies will be reviewed below, detailed analysis of occupational mobility of
16

immigrants and the relation between their acquired qualifications and occupations has attracted little attention.
After briefly reviewing some previous research, this section presents an analysis of pre- and post-migration occupations of permanent migrants7 included in Cohort 2.
Review of previous research based on LSIA
Recent employment rates of immigrants from main English speaking (MES) countries tend to be slightly higher and of those from non-English speaking (NES) countries slightly lower than of Australian-born (ABS 2003a). Richardson, Robertson and Ilsley (2001) using data from Cohorts 1 and 2 also conclude that, in general, against all measures—employment, unemployment and labour force participation—recent immigrant arrivals do better in the short term than those who arrived earlier.8
However the results have to be viewed in the context of the prevailing state of the Australian economy and the policy changes that occurred between the arrival of Cohort 1 and 2. The period saw declining unemployment in Australia and considerable migration policy changes. The main aim of the policy changes was to improve the economic independence of new immigrants and reduce their dependence on publicly-supported services and payments. Furthermore, the additional emphasis on skills and language competencies in the selection processes has resulted in higher qualified migrants, at least in the skill programme.
English language difficulties were reported as major problems in finding work by both cohorts although insufficient local experience was a problem for a higher proportion of individuals in Cohort 2. Not surprisingly given the strong growth in the Australian economy in the late 1990s, only half as many immigrants in Cohort 2 as in Cohort 1 indicated a lack of jobs as a reason for not getting work (Richardson et al. 2004).
The proportions of Cohort 1 and 2 who did not have any post-school qualification on arrival were 40 and 30 per cent, respectively. However amongst both cohorts approximately three out of every five persons with qualifications did not apply for their qualifications to be recognised. Of those who did apply, almost all had their qualification recognised in full or part.9 Immigrants who applied to have their qualifications recognised later than six months after arrival had a lower success rate in gaining full recognition and had a higher rate in terms of requiring additional training (Richardson et al. 2004).
Further results from Cohort 2
Pre-migration educational attainment
Table 14 shows the distributions of pre-migration educational attainment of males and females. It shows a much higher proportion of females than males without a post-school qualification. In particular, males are more likely than females to have postgraduate or trade qualifications.
7 Only the principal applicant and accompanying spouse, if any, are included. 8 In the long term, in general, the labour market position of all immigrants improve as they settle into life in Australia (Teicher, Shah and Griffin 2002). 9 Immigrants coming in the skills stream must have their qualifications recognised before being granted a visa.
17

Table 14 Highest pre-migration qualifications of permanent immigrants by sex (per cent)
Level of qualification Males Females Persons Postgraduate 24 14 19 Bachelor 23 25 24 Diploma/certificatea 20 23 21 Trade 11 2 6 No post-school/othersb 22 36 30 Total 100 (n=1963) 100 (n=2255) 100 (n=4181) Source: LSIA, Cohort 2 (arrived in Australia the year ending August 2000), Wave 1, principal applicant and migrating unit spouse. Percentages in the table are weighted estimates. n is the number of sample observations on which these estimates are based. Estimates based on a small number of sample observations may be subject large standard errors. a LSIA defines this category as technical/professional qualification at the diploma/certificate level. b Comprise about 3% of total.
Qualifications are only useful in the labour market if they are recognised. Australia has an internationally well known system for recognising overseas qualifications.10 Table 15 shows that 41 per cent of immigrants with non-Australian post-school qualifications had sought to have them recognised in the first 18 months of arrival. It also shows that immigrants with trade qualifications are more likely to seek recognition than others. Four out of every five immigrants who sought recognition were successful with almost all the rest requiring some additional training to complete all requirements.
Amongst the reasons given by those who had not sought to have their qualifications recognised, the most common was that they did not need to have their qualifications recognised. A significant number indicated difficulties with the English language as a reason for not seeking recognition and expressed a desire to become more fluent with the language before making an application. Some were awaiting original documentation from overseas before making an application.
Table 15 Outcomes of applications for recognition of qualifications by permanent immigrants (per cent)
Qualification level Qualification assessment Higher ed Dip/certa Trade All Recognition sought 42 33 57 41
Recognised 33 27 52 33 Conditionally recognised 8 5 3 7 Not recognised 1 1 2 1
Recognition not sought 58 67 43 59 Total 100 (n=1298) 100 (n=697) 100 (n=218) 100 (n=2213) Source: LSIA, Cohort 2 (arrived in Australia in the year ending August 2000), Wave 1 & 2, principal applicant and migrating unit spouse. The table excludes immigrants without post-school qualifications or qualifications gained in Australia. Percentages in the table are weighted estimates. n is the number of sample observations on which these estimates are based. Estimates based on a small number of sample observations may be subject large standard errors. a LSIA defines this category as technical/professional qualification at the diploma/certificate level.
Occupations of pre-migration job
Three out of every four immigrants had a job in the twelve months prior to migration. The occupational distribution of their last job is shown in Table 16. Half of all with jobs were employed in managers and administrators or professional occupations.
7 A number of agencies, including National Office of Overseas Skills Recognition (NOOSR), Trade Recognition Australia (TRA) and Vocational Education and Training Assessment Services (VETASSESS), are contracted by DIMIA to conduct pre-migration assessment of qualifications of applicants who come under the Skill Stream of the Migration Programme. Cully and Skladzien (2001) provide a comprehensive review and assessment of the system including a comparison with other international practice.
18

Significant differences exist between the occupation profiles of pre-migration jobs of males and females. While males were in higher proportions in managers and administrators and trades occupations, females were in higher proportions in professionals and clerical and sales occupations.
Table 16 Pre-migration jobs of permanent immigrants by occupation and sex (per cent)
Occupation group Males Females Persons Managers & administrators 16.6 8.1 12.6 Professionals 32.6 40.9 36.5 Associate professionals 14.5 11.3 13.0 Trades 19.8 2.3 11.7 Advanced clerical & service 0.3 10.0 4.8 Intermediate clerical, sales & service 7.4 16.8 11.8 Intermediate production & transport 4.0 1.9 3.0 Elementary clerical, sales & service 3.2 6.5 4.7 Labourers 1.7 2.2 1.9 All 100 (n=1471) 100 (n=1249) 100 (n=2720) Source: LSIA, Cohort 2 (arrived in Australia the year ending August 2000), Wave 1, principal applicant and migrating unit spouse. Percentages in the table are weighted estimates. n is the number of sample observations on which these estimates are based. Estimates based on a small number of sample observations may be subject large standard errors.
Table 17 shows the occupational profiles of permanent immigrants by their highest post-school qualifications. Most immigrants with higher education qualifications worked in either professional or associate professional occupations. Although most with trade qualifications also worked in trade occupations, a significant proportion worked in professional and associate professional occupations. The high proportion of diploma/certificate holders in professional occupations together with a high proportion of those without post-school qualifications who worked in high skilled occupations is perplexing and needs further investigation. One possible explanation could be the different meanings attached to the various levels of qualifications by the respondents in the survey, in particular at the diploma and certificate level.
Table 17 Pre-migration jobs by occupation and qualification (per cent) Highest post-school qualification Occupation group Higher ed Dip/certd Trade Nonee All Professionalsa 73 37 9 19 49 Associate professionals 10 17 10 16 13 Trades 2 15 64 13 12 Clerical & serviceb 12 21 9 24 17 Semi-skilled & unskilledc 3 9 8 28 10 All 100 (n=1244) 100 (n=645) 100 (n=185) 100 (n=646) 100 (n=2720) Source: LSIA, Cohort 2 (arrived in Australia the year ending August 2000), Wave 1, principal applicant and migrating unit spouse. Percentages in the table are weighted estimates. n is the number of sample observations on which these estimates are based. Estimates based on a small number of sample observations may be subject large standard errors. a Includes managers & administrators. b Includes advanced clerical & service; and intermediate clerical, sales & service. c Includes intermediate production & transport, elementary clerical sales & service; and labourers. d LSIA defines this category as technical/professional qualification at the diploma/certificate level. e Includes a small number of other non-specific qualifications.
Occupations of post-migration jobs—Wave 1
Just over half of the 42,300 permanent immigrants who arrived in Australia in the year ending August 2000 had had a job within six months of arrival. Altogether the group held 28,400 jobs as some of them went through more than one job during this period. The occupational distribution of these jobs is shown in Table 18.
19

Comparing the distributions in Tables 16 and 18 suggests considerable downward occupational movement for both sexes but particularly women. This result is consistent with findings reported in Chiswick, Lee and Miller (2002). While 62 per cent of pre-migration jobs were in managerial, professional or associate professional occupations, only 41 per cent of post-migration jobs were in these occupations. On the other hand only two per cent of pre-migration jobs were as labourers compared to 15 per cent of post-migration jobs. The proportions of pre- and post-migration jobs in trade occupations were almost the same.
Table 18 Post-migration jobs commenced in the first six months of arrival in Australia by occupation and sex (per cent)
Occupation group Males Females Persons Managers & administrators 8.6 3.2 6.4 Professionals 25.1 30.6 27.3 Associate professionals 8.0 7.2 7.7 Trades 19.2 1.1 11.9 Advanced clerical & service 1.2 4.7 2.6 Intermediate clerical, sales & service 9.4 27.9 16.8 Intermediate production & transport 7.4 3.0 5.6 Elementary clerical, sales & service 5.0 7.9 6.1 Labourers 16.1 14.3 15.4 All 100 (n=1353) 100 (n=861) 100 (n=2214) Source: LSIA, Cohort 2 (arrived in Australia the year ending August 2000), Wave 1. Jobs included are the main current, one other current and two most recent previous jobs of the principal applicant and migrating unit spouse at the first interview. Percentages in the table are weighted estimates. n is the number of sample observations on which these estimates are based. Estimates based on a small number of sample observations may be subject large standard errors.
The occupational distributions of post-migration jobs by qualification are shown in Table 19. In general, it suggests underutilisation of immigrants’ skills in the labour market. For instance, only 50 per cent of post-migration jobs commenced by those with higher education qualifications were in professional occupations compared to 73 per cent of pre-migration jobs. However the proportions of pre- and post-migration jobs held in trade occupations by those with trade qualifications are similar, even though higher proportions of post-migration jobs are in lower skilled occupations. It is also worth noting that once again many without post-school qualifications have jobs in high skilled occupations.
Table 19 Post-migration jobs commenced in the first six months of arrival in Australia by occupation and post-school qualification (per cent)
Highest post-school qualification Occupation group Higher ed Dip/certd Trade Nonee All Professionalsa 50 24 2 10 34 Associate professionals 8 9 4 7 8 Trades 2 16 67 10 12 Clerical & serviceb 21 24 5 17 19 Semi-skilled & unskilledc 19 26 22 55 27 All 100 (n=1133) 100 (n=483) 100 (n=171) 100 (n=427) 100 (n=2214) Source: LSIA, Cohort 2 (arrived in Australia the year ending August 2000), Wave 1. Jobs included are the two main current jobs and two most recent previous jobs at the time of the interview of the principal applicant and migrating unit spouse. Percentages in the table are weighted estimates. n is the number of sample observations on which these estimates are based. Estimates based on a small number of sample observations may be subject large standard errors. a Includes managers & administrators. b Includes advanced clerical & service; and intermediate clerical, sales & service. c Includes intermediate production & transport, elementary clerical sales & service; and labourers. d LSIA defines this category as technical/professional qualification at the diploma/certificate level. e Includes a small number of other non-specific qualifications.
20

Occupations of post migration jobs—Wave 2
Over time as immigrants become more familiar with the local labour market and settle into new life their labour market prospects improve. At the time of the second interview, that was conducted about 12 months after the first interview, about 60 per cent of immigrants were employed. This is a 10 percentage point increase from the time of the first interview. A further 19,700 new jobs were commenced since the first interview with increasing numbers by women. This suggests that initially, within immigrant family units, males are first to participate in the labour market and only later when the family has settled in that females begin to participate. The occupational distribution of these jobs presented in Table 20 shows an increasing proportion of the jobs commenced by women are in intermediate clerical, sales and service occupations.
Compared to jobs commenced in the first six months of arrival, smaller proportions of all jobs commenced since then are in high skill occupations of managers, administrators and professionals. This suggests some immigrants having difficulty finding jobs at skill levels that match the qualifications they possess even after 18 months of arrival in the country. Some then resort to accepting lower skill jobs in the interim because of financial necessity as social security assistance is limited to only some category of immigrants. These data suggest that the upward occupational mobility reported by Chiswick, Lee and Miller (2002) is perhaps a longer term phenomenon.
Table 20 Post-migration jobs commenced since first interview by occupation and sex (per cent)
Occupation group Males Females Persons Managers & administrators 9.1 2.2 5.9 Professionals 21.3 18.7 20.1 Associate professionals 14.4 7.3 11.1 Trades 16.8 2.2 10.0 Advanced clerical & service 1.3 5.0 3.0 Intermediate clerical, sales & service 10.2 35.4 21.9 Intermediate production & transport 7.7 2.7 5.4 Elementary clerical, sales & service 5.8 10.0 7.8 Labourers 13.3 16.5 14.8 All 100 (n=819) 100 (n=704) 100 (n=1523) Source: LSIA, Cohort 2 (arrived in Australia the year ending August 2000), Wave 2. Jobs included are the most recent three jobs commenced since the first interview by the principal applicant and migrating unit spouse. Percentages in the table are weighted estimates. n is the number of sample observations on which these estimates are based. Estimates based on a small number of sample observations may be subject large standard errors.
The occupational distributions of post-migration jobs commenced between six and eighteen months of arrival in Australia by qualification are shown in Table 21. It shows considerable downward occupational mobility among those holding trade qualifications—only 31 per cent commenced jobs in trade occupations and 36 per cent commenced jobs in semi-skilled or unskilled occupations.
21

Table 21 Post-migration jobs commenced since first interview by occupation and post-school qualification (per cent)
Highest post-school qualification Occupation group Higher ed Dip/certd Trade Nonee All Professionalsa 44 15 7 7 26 Associate professionals 12 12 13 9 11 Trades 2 12 31 17 10 Clerical & serviceb 24 40 12 15 25 Semi-skilled & unskilledc 19 21 36 52 28 All 100 (n=650) 100 (n=347) 100 (n=120) 100 (n=406) 100 (n=1523) Source: LSIA, Cohort 2 (arrived in Australia the year ending August 2000), Wave 2. Jobs included are the main current, one other current and two most recent previous jobs of the principal applicant and migrating unit spouse commenced since the first interview. Percentages in the table are weighted estimates. n is the number of sample observations on which these estimates are based. Estimates based on a small number of sample observations may be subject large standard errors. a Includes managers & administrators. b Includes advanced clerical & service; and intermediate clerical, sales & service. c Includes intermediate production & transport, elementary clerical sales & service; and labourers. d LSIA defines this category as technical/professional qualification at the diploma/certificate level. e Includes a small number of other non-specific qualifications.
Courses enrolled in since migration
About six months after arrival 11 per cent of immigrants had enrolled in a course other than English language course with more than half of them at a TAFE or another vocational educational institution. Women were more likely to enrol in at a TAFE or other VET institution than men. About half who were not studying at the time of the interview intended to study at a university or a vocational education institution in the future. About a year later, 18 per cent of the total had commenced at least one course during the year.
Summary
This section has provided an analysis of the labour market experience of permanent immigrants to Australia.
In general, recent arrivals are better qualified than the Australian population. Future immigrant cohorts are likely to be equally well, or even better, qualified as the emphasis of the Australian migration policy shifts further towards skill migration.
In spite of this a significantly higher proportion of them are jobless after arrival in Australia than before migration. Although their employment prospects improve over time many experience downward occupational mobility in their post-migration jobs. Higher education qualification holders are more likely to have this experience than those who hold trade qualifications. It seems that the eventual upward occupational mobility immigrants are expected to experience, as suggested in the literature, takes longer than 18 months.
Conclusion In Australia, immigration is often being used as a policy option to solve demographic and labour market problems. The total migration programme is complex and has a number of dimensions.
In 2003-04 migration was estimated to add 102,000 persons to labour supply in Australia, including 39,300 managers and professionals, 4,400 associate professionals and 8,600 tradespersons. International students also add to the supply but their contribution is difficult to estimate. Compared to the current output of traditional trade apprentice completions of 21,800, the contribution that migration makes in this area is substantial.
22

The general trend in the development of migration policy in Australia is towards increasing the skill component of the programme. In particular, skills acquired in Australia are being given priority via onshore processing. There is also a discernible shift towards temporary migration to meet short-term employer needs. Unskilled labour supply problems, especially in regional industries such as agriculture, are being addressed through the expansion of the working holiday maker programme in both size and scope.
In spite of recent immigrant arrivals being better qualified, they still seem to experience downward occupational mobility that does not show signs of reversing at least in the short term. This implies considerable wastage of skills and subsequent productivity loss. Research however suggests over time immigrants experience upward occupational mobility. Policies and programmes that can reduce the time before immigrants are fully productive in terms of using the skills they already possess can be beneficial not only to the immigrants but also to the Australian economy.
Rather than the specific vocational skills it is perhaps the broader skills, including those required to operate effectively in the labour market, that inhibit immigrants more from quickly realising their full occupational potential. The need for skills and information, particularly negotiations skills when their English language skills and understanding of industrial relations laws are limited, will increase if the current changes to industrial relations currently in the Federal parliament are to become law. Without the protection of awards and collective bargaining new immigrants may become even more vulnerable to exploitation from unscrupulous employers than the Australian-born.
The VET sector can play a bigger role than it currently does to minimise the skills wastage experienced by newly arrived immigrants. It has the capacity to assume a bigger role in getting newly arrived immigrants job ready commensurate with the skills they already possess in a cost-effective way. In this respect the changing patterns of migration with the associated changes in the size and skill levels are important issues for the sector.
References ABS 2003a, Labour Force Australia, August 2003, Cat. no. 6203.0, ABS, Canberra. ABS 2003b, 'Net Overseas Migration: Adjusting for Actual Duration of Stay or Absence',
Demography Working Paper 2003/05, ABS, Canberra. Chiswick, B, Lee, Y-L & Miller, P 2002, 'Longitudinal analysis of immigrant occupational
mobility: a test of the immigrant assimilation hypothesis', IZA Discussion Paper No. 452, IZA, Bonn.
Cully, M & Skladzien, T 2001, Assessment of Overseas Qualifications and Skills: a Comparative Analysis, Report to the Overseas Qualifications Board, National Institute of Labour Studies, Flinders University, Adelaide.
Cobb-Clark, D 2000, 'Do selection criteria make a difference? Visa category and the labor market status of immigrants to Australia', Economic Record, vol. 76, pp. 15-31.
Cobb-Clark, D 2004, 'Selection policy and the labour market outcomes of new immigrants', IZA DP No. 1380, IZA, Bonn.
DIMIA 2004, Population flows: immigration aspects (2002-03 edition), DIMIA, Canberra. DIMIA 2005, Population flows: immigration aspects (2003-04 edition), DIMIA, Canberra. Harding, G & Webster, E 2002, The working holiday maker scheme and the Australian labour market,
Report to the Department of Employment and Workplace Relations and DIMIA, Melbourne.
23
Hugo, G 2004, 'A new paradigm of international migration: implications for migration policy and planning in Australia', Research Paper No. 10 2003-04, Information and Research Services, Parliamentary Library, Canberra.
Hugo, G, Rudd, D & Harris, K 2003, Australia's Diaspora: its size, nature and policy implications, CEDA Information Paper No. 80.
Khoo, S-E, Voigt-Graf, C, Hugo, G & McDonald, P 2003, 'Temporary skilled migration to Australia: the 457 visa sub-class', People and Place, vol. 11, 4, pp. 27-40.
McDonald, P, Khoo, S-E & Kippen, R 2003, 'Alternative net migration estimates for Australia: exploding the myth of a rapid increase in numbers', Working Papers in Demography, No. 89, ANU Research School of Social Sciences.
National Centre for Vocational Education Research (NCVER) 2004, Australian Vocational Education and Training Statistics: Apprentices and trainees September quarter 2004, NCVER, Adelaide, SA.
Richardson, S, Robertson, F & Ilsley, D 2001, The Labour Force Experience of New Migrants, Report to DIMIA, National Institute of Labour Studies, Flinders University, viewed 25 April, <http://www.immi.gov.au/research/publications/labour_force/nilsreport.pdf>.
Richardson, S, Stack, S, Lester, L, Healy, J, Ilsley, D & Horrocks, J 2004, The Changing Labour Force Experience of New Migrants, Report to DIMIA, National Institute of Labour Studies, Flinders University, viewed 18 February, <http://www.immi.gov.au/research/publications/lsia/labour-forcev2.pdf>.
Teicher, J, Shah, C & Griffin, G 2002, 'Australian immigration: the triumph of economics over prejudice?' International Journal of Manpower, vol. 23, pp. 209-236.
Weinstein, E 2002, 'Migration for the benefit of all: Towards a new paradigm for economic immigration', International Labour Review, vol. 141, 3, pp. 225-252.
Wooden, M & VandenHeuvel, A 1999, New settlers have their say: how immigrants fare over the early years of settlement: an analysis of data from the three waves of the Longitudinal Survey of Immigrants to Australia, DIMIA, Canberra.
24