Skill Set for Engineers
32
WPS5640 Policy Research Working Paper 5640 Employability and Skill Set of Newly Graduated Engineers in India Andreas Blom Hiroshi Saeki The World Bank South Asia Region Education Team April 2011 Policy Research Working Paper 5640 Abstract Skill shortage remains one of the major constraints to taxonomy. In contrast, communicatio continued growth of the Indian economy. This employer smallest skill gap, but remains one survey seeks to address this knowledge-gap by answering skills by the employers. Although e three questions: (i) Which skills do employers consider asks for the same set of soft skill important when hiring new engineering graduates? (ii) differ for Professional Skills acro How satisfied are employers with the skills of engineering company sizes, and regions. These f graduates? and (iii) In which important skills are the engineering education institutions engineers falling short? The results confirm a widespread improve the skill set of graduates; dissatisfaction with the current graduates—64 percent importance of Soft Skills, (iii) re of employers hiring fresh engineering graduates are only teaching-learning process, and curr somewhat satisfied with the quality of the new hires or lower-order thinking skills, such worse. After classifying all skills by factor analysis, the understanding, toward higher-order authors find that employers perceive Soft Skills (Core analyzing and solving engineering p Employability Skills and Communication Skills) to be as creativity; and (iv) interact mo very important. Skill gaps are particularly severe in the understand the particular demand fo higher-order thinking skills ranked according to Bloom’s and sector. This paper is a product of the Education Team, South Asia Region. It is part of a larger effort by the World Bank to p open access to its research and make a contribution to development policy discussions around the world. Policy Researc Working Papers are also posted on the Web at http://econ.worldbank.org. The authors may be contacted at ablom@ worldbank.org and [email protected]. The Policy Research Working Paper Series disseminates the findings of work in progress to encourage the excha issues. An objective of the series is to get the findings out quickly, even if the presentations are less tha names of the authors and should be cited accordingly. T he findings, interpretations, and conclusions expresse of the authors. They do not necessarily represent the v iews of the International Bank for Reconstruction and D its affiliated organizations, or those of the Executive Directors of the World Bank or the governments they re Produced by the Research Support Team Employability and Skill Set of Newly Graduated Engineers in India1 Andreas Blom and Hiroshi Saeki2 JEL Classification: I23, I25, J23, J24, J28, O15 Keywords: Employability, Skills, Employer Survey, Satisfaction, Engineering, Higher Education, India 1 The authors would like to thank the Federation of Indian Chambers of Commerce and Industry (FICCI) for its technical and implementation‘s support of the survey. The authors would like to express their gratitude to National Project Implementation Unit under the Ministry of Human Resource Development for its administrative support of the survey. The employer survey was made possible thanks to the FICCI‘s member companies that kindly responded to the survey. We are also grateful for comments received at the FICCI Higher Education Summit 2009 and at World Bank presentations. We appreciate comments received from colleagues notably Patrick Terenzini and Amit Dar. 2 Andreas Blom (World Bank, [email protected]), Hiroshi Saeki (World Bank, [email protected]) 1. Introduction http://www-wds.worldbank.org/external/default/WDSContentServer/WD... 1 of 32 9/2/2011 7:22 PM
-
Upload
sathiya-kumar -
Category
Documents
-
view
221 -
download
0
Transcript of Skill Set for Engineers

7/27/2019 Skill Set for Engineers
http://slidepdf.com/reader/full/skill-set-for-engineers 1/32
WPS5640
Policy Research Working Paper 5640
Employability and Skill Set of NewlyGraduated Engineers in India
Andreas BlomHiroshi Saeki
The World BankSouth Asia RegionEducation TeamApril 2011Policy Research Working Paper 5640
AbstractSkill shortage remains one of the major constraints to taxonomy. In contrast, communicaticontinued growth of the Indian economy. This employer smallest skill gap, but remains onesurvey seeks to address this knowledge-gap by answering skills by the employers. Although three questions: (i) Which skills do employers consider asks for the same set of soft skilimportant when hiring new engineering graduates? (ii) differ for Professional Skills acroHow satisfied are employers with the skills of engineering company sizes, and regions. These graduates? and (iii) In which important skills are the engineering education institutionsengineers falling short? The results confirm a widespread improve the skill set of graduates
dissatisfaction with the current graduates—64 percent importance of Soft Skills, (iii) reof employers hiring fresh engineering graduates are only teaching-learning process, and cursomewhat satisfied with the quality of the new hires or lower-order thinking skills, suchworse. After classifying all skills by factor analysis, the understanding, toward higher-orderauthors find that employers perceive Soft Skills (Core analyzing and solving engineering pEmployability Skills and Communication Skills) to be as creativity; and (iv) interact movery important. Skill gaps are particularly severe in the understand the particular demand fohigher-order thinking skills ranked according to Bloom’s and sector.
This paper is a product of the Education Team, South Asia Region. It is part of a larger effort by the World Bank to popen access to its research and make a contribution to development policy discussions around the world. Policy ResearcWorking Papers are also posted on the Web at http://econ.worldbank.org. The authors may be contacted at [email protected] and [email protected].
The Policy Research Working Paper Series disseminates the findings of work in progress to encourage the exchaissues. An objective of the series is to get the findings out quickly, even if the presentations are less thanames of the authors and should be cited accordingly. The findings, interpretations, and conclusions expresseof the authors. They do not necessarily represent the views of the International Bank for Reconstruction and Dits affiliated organizations, or those of the Executive Directors of the World Bank or the governments they re
Produced by the Research Support TeamEmployability and Skill Set of Newly Graduated Engineers in India1
Andreas Blom and Hiroshi Saeki2
JEL Classification: I23, I25, J23, J24, J28, O15
Keywords: Employability, Skills, Employer Survey, Satisfaction, Engineering, Higher Education,India
1The authors would like to thank the Federation of Indian Chambers of Commerce and Industry (FICCI) for
its technical and implementation‘s support of the survey. The authors would like to express their gratitude toNational Project Implementation Unit under the Ministry of Human Resource Development for itsadministrative support of the survey. The employer survey was made possible thanks to the FICCI‘smember companies that kindly responded to the survey. We are also grateful for comments received at theFICCI Higher Education Summit 2009 and at World Bank presentations. We appreciate comments receivedfrom colleagues notably Patrick Terenzini and Amit Dar.2
Andreas Blom (World Bank, [email protected]), Hiroshi Saeki (World Bank, [email protected])1. Introduction
http://www-wds.worldbank.org/external/default/WDSContentServ
2 9/2/2011
7/27/2019 Skill Set for Engineers
http://slidepdf.com/reader/full/skill-set-for-engineers 2/32
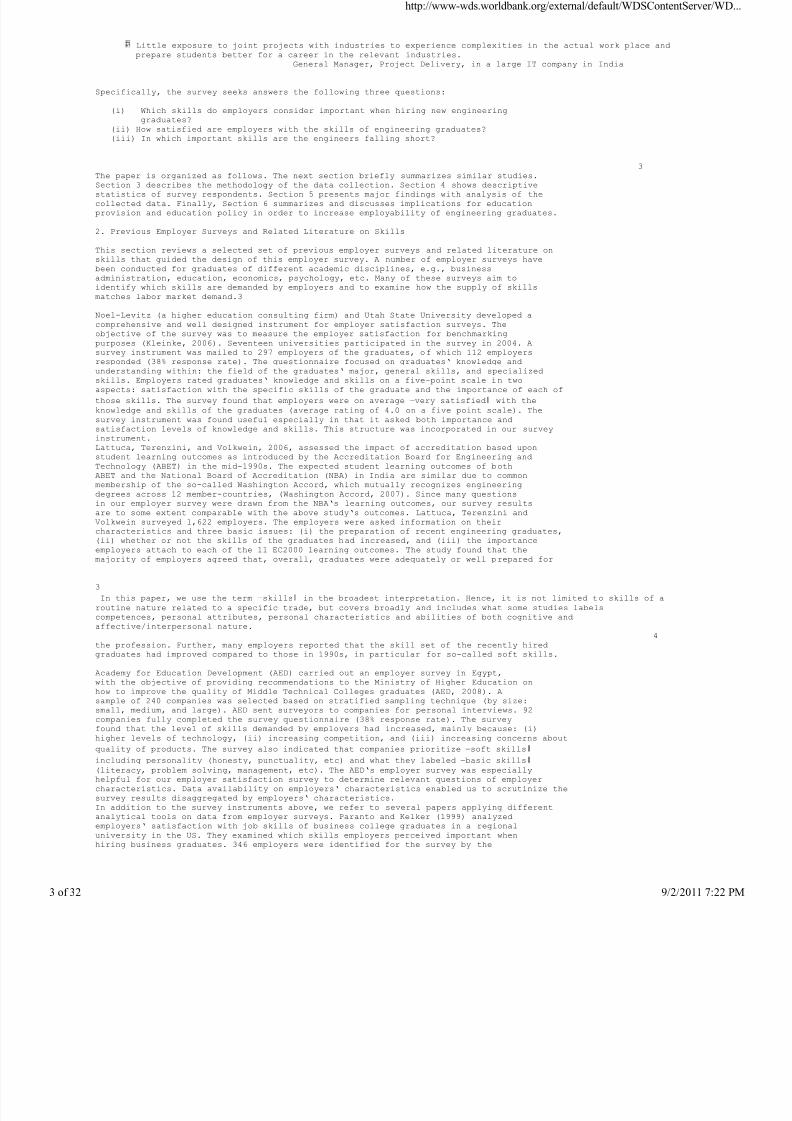
Insufficient supply of quality skills is one of the main impediments to further economicgrowth in India. The Indian economy grew more than 8% on average over the past 5 years,including the year of the unprecedented financial crisis in 2009. However, the skillshortage is still one of the major constraints in most industries in India (World Bank,2009b).
IT, infrastructure and power sectors where engineers play a critical role are particularly indifficult situations when it comes to unmet demand for skills. For instance, the exportingIT sector reported lack of skills as the most serious obstacle for growth, and salaries rose15% annually from 2003 to 2006 mainly due to the shortages of qualified workforce(World Bank, 2009). The road sector also faces severe shortages of qualified manpower.The sector needs to increase its hiring by at least 2-3 times of the 2008 level where 6,000 –7,000 fresh engineers and diploma holders joined the road sector workforce (World Bank,
2008). In the power sector, the focus is also on shortages of qualified engineers. The sectorneeds more skills and knowledge at all levels of the workforce, particularly consideringthe growing concerns over environmental degradation and depletion of conventionalenergy sources (Ministry of Power, 2007). According to the widely quoted report by theNational Association of Software and Services Companies (NASSCOM) and McKinsey in2005, only 25% of the engineering education graduates are employable by a multinationalcompany. Many employers give concrete examples on the lack of skills of the newlygraduated hires, which the employers link to shortcomings in the education system. Box 1provides one such case from a large ITES company.
The higher education system has responded to the increased demand for engineers bymassively expanding production of engineers. The number of students enrolled increased800 percent from 1998 to 2008, (MHRD, 2009). This quantitative expansion is widelyperceived to have led to an average decline in the quality of the students entering, theteaching and, consequently, the quality of the graduating engineers (Jha et al. 2009).
Despite the gravity of the situation, little research has been conducted to identify the kindsof skills demanded by employers and measure in which skills graduates meet employers‘
expectation. There is an increasing demand for such information from teachers,administrators, and policy makers. For example, Government of India is implementing aprogram with World Bank co-finance, to improve quality of engineering education andincrease learning outcomes of engineering education graduates. For this program and forother initiatives, it is critical to identify specific bottlenecks in skills demanded byemployers, and provide detailed information and practical suggestions to overcome theskill shortages.
With this aim, an Employer Satisfaction Survey was carried out from September toNovember 2009 as part of preparation of the Second Phase of Technical Education QualityImprovement Program (TEQIP-II) initiated by the Government of India and financiallysupported by the World Bank. The survey was implemented by a joint team of theNational Project Implementation Unit (NPIU), the Federation of Indian Chambers of
2Commerce and Industry (FICCI), and the World Bank in consultation with Ministry ofHuman Resource Development (MHRD), Government of India.
Box 1: A Typical Fresh Engineering Graduate Lacking Problem Solving Skill
To illustrate the typical skill gap we see in fresh engineers, let us take the case of Gopal, who aftercompleting his Bachelor‘s degree in Computer Science and Engineering with a good academic track record hasjust joined an IT Services organization. Specifically, this group works on product engineering for asemiconductor vendor who is developing highly integrated silicon and supporting software for mobile devices.Gopal has undergone about 2 months of refresher training by the organization on software engineering beforebeing assigned to the project.
The Project manager that he reports to is in charge of delivering the layer of platform software, whichcomprises of the Real Time Operating System and the Device Drivers for all the peripherals the mobile devicewill support, to the customer. The project manager assigns to Gopal the task of taking over the development of adevice driver for one of the simpler peripherals on the device and points him to all the relevant informationsources. The project manager expects Gopal to work quite independently on the same and complete it withminimal assistance given the fact that he has the necessary knowledge from his academic background, and thedevice driver is for the simplest peripheral on the chip.
On the job, however Gopal begins to flounder. He is first of all quite stymied by the amount ofinformation he has to digest in a short span of time. He did not have the skill to filter out and read what wasreally required for the job. The second challenge was his unfamiliarity with handling a large volume of code.His academic projects had been quite small, a few hundred lines at most. He did not have the skill to abstractout the entire system, and only focus on the interfaces for the device driver he had to develop. The nextchallenge was on the design of the module. He had to pick a design which was not only efficient in the time butalso efficient in use of system resources as the design is for a mobile device with typically limited memory.Last but not the least, the design had to be robust. When it was time to integrate and test the driver, he had toreally grasp the complexities of debugging an embedded system. Though his own module was quite simple, hehad to have the big picture of the system. He had to understand how to use the debugging tools and the featuresit provided, to probe the system at the appropriate level. He was once again felt wanting on the requiredproblem solving skills to move ahead on the problems encountered.
If we reflect on this case, it is clear that the academic curriculum had the following lacunae:Had not trained Gopal sufficiently on key design skills, especially handling conflicting criteria to bemet, and problem solving skills, and creative exploration for the same, andHad not trained him on handling complexity, and key abstraction skills required to handle it.
These problems can be traced to:Lack of imagination in the construction of laboratory experiments in the academic setting and alsoprobably in the evaluation patterns followed,Few problem sets (examinations) for students to test design oriented problems which would have givenstudents the chance to explore the design space and appreciate the challenges, and
http://www-wds.worldbank.org/external/default/WDSContentServ
2 9/2/2011
7/27/2019 Skill Set for Engineers
http://slidepdf.com/reader/full/skill-set-for-engineers 3/32
Little exposure to joint projects with industries to experience complexities in the actual work place andprepare students better for a career in the relevant industries.
General Manager, Project Delivery, in a large IT company in India
Specifically, the survey seeks answers the following three questions:
(i) Which skills do employers consider important when hiring new engineeringgraduates?
(ii) How satisfied are employers with the skills of engineering graduates?(iii) In which important skills are the engineers falling short?
3
The paper is organized as follows. The next section briefly summarizes similar studies.Section 3 describes the methodology of the data collection. Section 4 shows descriptivestatistics of survey respondents. Section 5 presents major findings with analysis of thecollected data. Finally, Section 6 summarizes and discusses implications for educationprovision and education policy in order to increase employability of engineering graduates.
2. Previous Employer Surveys and Related Literature on Skills
This section reviews a selected set of previous employer surveys and related literature onskills that guided the design of this employer survey. A number of employer surveys havebeen conducted for graduates of different academic disciplines, e.g., businessadministration, education, economics, psychology, etc. Many of these surveys aim toidentify which skills are demanded by employers and to examine how the supply of skillsmatches labor market demand.3
Noel-Levitz (a higher education consulting firm) and Utah State University developed acomprehensive and well designed instrument for employer satisfaction surveys. Theobjective of the survey was to measure the employer satisfaction for benchmarking
purposes (Kleinke, 2006). Seventeen universities participated in the survey in 2004. Asurvey instrument was mailed to 297 employers of the graduates, of which 112 employersresponded (38% response rate). The questionnaire focused on graduates‘ knowledge andunderstanding within: the field of the graduates‘ major, general skills, and specializedskills. Employers rated graduates‘ knowledge and skills on a five-point scale in twoaspects: satisfaction with the specific skills of the graduate and the importance of each of
those skills. The survey found that employers were on average ―very satisfied‖ with theknowledge and skills of the graduates (average rating of 4.0 on a five point scale). Thesurvey instrument was found useful especially in that it asked both importance andsatisfaction levels of knowledge and skills. This structure was incorporated in our surveyinstrument.Lattuca, Terenzini, and Volkwein, 2006, assessed the impact of accreditation based uponstudent learning outcomes as introduced by the Accreditation Board for Engineering andTechnology (ABET) in the mid-1990s. The expected student learning outcomes of bothABET and the National Board of Accreditation (NBA) in India are similar due to commonmembership of the so-called Washington Accord, which mutually recognizes engineeringdegrees across 12 member-countries, (Washington Accord, 2007). Since many questionsin our employer survey were drawn from the NBA‘s learning outcomes, our survey resultsare to some extent comparable with the above study‘s outcomes. Lattuca, Terenzini and
Volkwein surveyed 1,622 employers. The employers were asked information on theircharacteristics and three basic issues: (i) the preparation of recent engineering graduates,(ii) whether or not the skills of the graduates had increased, and (iii) the importanceemployers attach to each of the 11 EC2000 learning outcomes. The study found that themajority of employers agreed that, overall, graduates were adequately or well prepared for
3
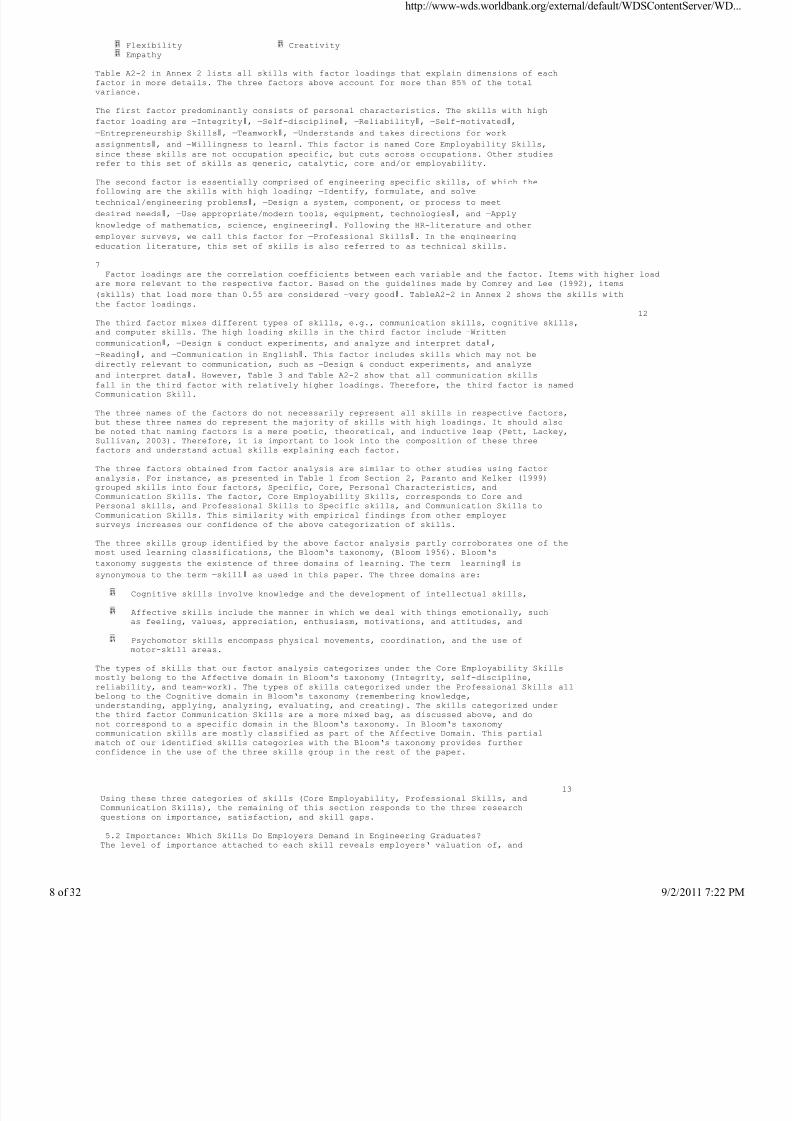
In this paper, we use the term ―skills‖ in the broadest interpretation. Hence, it is not limited to skills of aroutine nature related to a specific trade, but covers broadly and includes what some studies labelscompetences, personal attributes, personal characteristics and abilities of both cognitive andaffective/interpersonal nature.
4the profession. Further, many employers reported that the skill set of the recently hiredgraduates had improved compared to those in 1990s, in particular for so-called soft skills.
Academy for Education Development (AED) carried out an employer survey in Egypt,with the objective of providing recommendations to the Ministry of Higher Education on
how to improve the quality of Middle Technical Colleges graduates (AED, 2008). Asample of 240 companies was selected based on stratified sampling technique (by size:small, medium, and large). AED sent surveyors to companies for personal interviews. 92companies fully completed the survey questionnaire (38% response rate). The surveyfound that the level of skills demanded by employers had increased, mainly because: (i)higher levels of technology, (ii) increasing competition, and (iii) increasing concerns about
quality of products. The survey also indicated that companies prioritize ―soft skills‖
including personality (honesty, punctuality, etc) and what they labeled ―basic skills‖(literacy, problem solving, management, etc). The AED‘s employer survey was especiallyhelpful for our employer satisfaction survey to determine relevant questions of employercharacteristics. Data availability on employers‘ characteristics enabled us to scrutinize thesurvey results disaggregated by employers‘ characteristics.In addition to the survey instruments above, we refer to several papers applying differentanalytical tools on data from employer surveys. Paranto and Kelker (1999) analyzedemployers‘ satisfaction with job skills of business college graduates in a regionaluniversity in the US. They examined which skills employers perceived important whenhiring business graduates. 346 employers were identified for the survey by the
http://www-wds.worldbank.org/external/default/WDSContentServ
2 9/2/2011

7/27/2019 Skill Set for Engineers
http://slidepdf.com/reader/full/skill-set-for-engineers 4/32
university‘s placement office. They are mostly in rural areas in the upper Midwest of theUS, and hired business graduates during the 1990-94 period. 136 employers responded(39% response rates). By using factor analysis, 18 variables (skills) were reduced to fourmajor factors, namely specific skills, core skills, personal characteristics, andcommunication skills (See Table 1).
Table 1: Skills under Four FactorsSpecific Skills Core Skills Personal Communication Skills
CharacteristicsDatabase knowledge Self confidence Business ethics Listening skillsSpreadsheet Critical thinking Professionalism Speaking skillsknowledge Creative thinking WrittenWord processing Interpersonal skills communicationknowledge Leadership skills
Ability to adapt to Experience with realchanging technology world problemsTechnical skillsMathematical skills
A t-test revealed that the mean importance rating of the ―Core Skills‖ is statistically
significantly higher than that of ―Specific Skills‖. In addition, analysis of variance showed
that there is no statistically significant difference in the importance of ―core skills‖ amongemployers of different size and different economic sectors. Hence, the survey shows that
the importance of ―Core Skills‖ cuts across all participating firms. Paranto and Kelker
5recommended business schools that they should improve effectiveness of business
programs, by putting more emphasis on ―Core Skills‖.
Hill and Petty (1995) conducted a similar analysis but focused on occupational work ethics.
By using factor analysis, forty eight skills were grouped into four factors: interpersonalskills, initiative, being dependable, and ―reversed items on instrument‖ (See Table 2). Thelast factor was interpreted as negative perceptions, in which there are (lack of) skills suchas irresponsible, careless, selfish, etc. The study recommended that school curriculumshould address the four factors to make student skills more relevant to the workplace.
Table 2: Work Ethics under Four Factors
Factor 1: Interpersonal Skills Factor 2: Initiative Factor 3: Being Dependable Factor 4: Reversed ItemsCourteous perceptive following directions hostilefriendly productive following regulations rudecheerful resourceful dependable selfishconsiderate initiating reliable deviouspleasant ambitious careful irresponsiblecooperative efficient honest carelesshelpful effective punctual negligentlikeable enthusiastic depresseddevoted dedicated tardyloyal persistent apatheticwell groomed accuratepatient conscientiousappreciative independenthard working adaptablemodest perseveringemotionally stable orderlystubborn
These prior works guided us in developing the survey methodology analysis for thisemployer survey in India.
3. Survey Methodology
FICCI and World Bank conducted an on-line employer satisfaction survey fromSeptember to November, 2009. 157 employers across sectors and regions in India fullycompleted the questionnaire. The questionnaire (Annex 3) has a list of skills that
engineering graduates are typically expected to possess at graduation. Employers wererequested to rate on a scale from 1 (not at all) to 5 (extremely) how important each skill isfor an engineering graduate to be an effective employee, (Importance Level). The surveyalso asked employers to rate their satisfaction level with regard to each of the skills,(Satisfaction Level).
63.1 Sample Size and Sampling Strategy
Originally, a stratified random sampling from FICCI‘s member database of over 3,000firms was considered for the Employer Satisfaction Survey. Sample size was calculatedbased on the following formula.
z 2 pqn
e2
http://www-wds.worldbank.org/external/default/WDSContentServ
2 9/2/2011

7/27/2019 Skill Set for Engineers
http://slidepdf.com/reader/full/skill-set-for-engineers 5/32
where n is the sample size. A 90% confidence interval with margin of error 0.05 wasapplied. z is the abscissa of the normal curve that cuts off at a given significance level, i.e.,1.65, p (in this case 0.6) is the estimated proportion of an attribute that is present in thepopulation, q is 1-p, and e is the desired level of precision, i.e., 0.05. Using this formula,the originally estimated sample size was about 260, and it was further proportionatelyallocated to FICCI‘s classification of 17 economic sectors.
There were several difficulties in sampling. First, although the sampling method wasoriginally a stratified random sampling, some member companies were directly contactedto participate in the survey, due to a low response rate (convenience sampling). This mayhave introduced a bias in the representativeness of the sample. Second, the web-basedsurvey was opened in the last few weeks of the survey to all companies that registered.This slightly increased the sample size. This self-selection could also have caused a
selection bias. Third, the sample size was not large enough to meet a 90% confidenceinterval. Due to time constraints, it was reduced from 260 to 157 companies, i.e., an 80%confidence interval with a margin of error of 0.05.
Despite these shortcomings, the study brings value since it is the first of its kind in India.Further, the participation number of 157 is comparable to other employer satisfactionsurveys. The employer satisfaction survey is expected to be conducted every two years.Therefore, the sampling methodologies and the survey design are expected to improve infuture rounds, and the quality of the data will be further enhanced over time.
3.2 Survey Design (Preparation and Implementation of the Survey)NPIU, FICCI and World Bank held a series of interviews with employers. Suggestionsprovided by employers were incorporated into the questionnaire. As a result, the overallsurvey design and instrument were improved over the course of pilot surveys.
During the pilot surveys, the employers were asked four specific questions to improve thesurvey questionnaires and implementation. The four questions were:
First, ―Who will evaluate employer’s satisfaction”? (Human resource department,supervisors of newly hired, or a third person). Presumably, employers are in the bestposition to identify appropriate evaluator of the fresh engineering hires. Therefore, thesurvey invitation was sent to the human resource department which decided theresponsibility to complete the survey.
7Second, ―Who will be evaluated”? (A fresh class of graduates or those who have already afew years‘ experiences). Given the fact that many fresh engineers change jobs within ayear or so, external effects such as in-house training should be removed as much aspossible in order to assess learning outcomes at institutions. It was therefore decided thatthe target population would be the fresh graduates from technical and engineeringinstitutions for whom this was their first job. Hence, employers were asked not to considerengineers for whom this was not their first job after graduation.
Third, ―At what level should the employers evaluate? (At individual level, at institutionallevel such as Indian Institutes of Technology, National Institutes of Technology,
institutions that participated in the Technical Education Quality Improvement Program, etc,or by overall average of all fresh hires)‖. It was decided to send one single questionnaireto each company due to the administrative burden to deal with multiple questionnaires perdifferent graduate group. Employers then evaluated all first-time-employed engineershired over the previous four years together as one group.
Fourth, ―How will the questionnaires be distributed to companies? (Online survey, email
invitation, or paper-based questionnaire via physical mail)‖. The on-line survey was
finally selected as the survey method because it is easy to manage and organize the datacollected from employers. Further, on-line survey can be easily used again in the nextround of the employer satisfaction survey in two years. FICCI randomly selectedemployers who were provided with a username and password. After logging into thesurvey, employers were asked to complete the survey and provide company characteristics.
3.3 Survey InstrumentThe questionnaire design builds upon three sources: the expected learning outcomes usedfor accreditation by the National Board of Accreditation (NBA), previous employersurveys, and consultations with employers. The questionnaire is divided into three
sections; (i) Overall satisfaction level, (ii) Importance and Satisfaction of 26 differentskills, and (iii) Employer‘s characteristics. 4 Employers were asked to evaluate both theimportance and satisfaction levels of each of the 26 skills on a five point scale.
The NBA, India‘s only official accreditation body for engineering education, hasestablished 11 Program Outcomes. NBA is a provisional member of the WashingtonAccord—an international agreement between accreditation agencies for engineeringeducation for 18 countries. Therefore, NBA‘s program outcomes (expected learningoutcomes for graduates) are based upon the internationally agreed set of the skills andknowledge that graduates are expected to possess at the time of graduation.5 The NBAcriteria are:4
The survey questionnaire is attached in Annex 3. The questionnaire asks about importance and satisfactionfor 26 skills divided into two overall groups: General and Specific skills. The General skill referred mainly topersonal characteristics while Specific skills mainly referred to those skills directly related to technical andengineering professions as well as communication and computer skills. The categorization of skills intoGeneral and Specific Skills was conducted in an a-priori manner following consultations with governmentofficials, employers, and academia. Section 5 will go in detail more systematic and empirically-based
http://www-wds.worldbank.org/external/default/WDSContentServ
2 9/2/2011

7/27/2019 Skill Set for Engineers
http://slidepdf.com/reader/full/skill-set-for-engineers 6/32

7/27/2019 Skill Set for Engineers
http://slidepdf.com/reader/full/skill-set-for-engineers 7/32
engineering graduates. These sectors have the highest share of employers in the sample
after ―Other‖. One third of the companies answered that their sectors do not belong to any
of the listed sectors in the questionnaire and selected ―Other‖. This ―Other‖ is furtherdisaggregated into mining, other service activities, and professional, scientific andtechnical activities by using the responses from another question ―Please specify the major
economic activity of your firm‖.
Foreign Capital: Twenty percent of the responding firms were established with foreigncapital.
10
Respondents: Half of the respondents are a head/manager of a human resource department.About 18% are a manager of engineering graduates‘ department. Approximately 15% area business owner or partner. The large share of head/manager of human resourcedepartment could have been a potential problem if the survey evaluated individual skillsets. However, the survey rated a group of new hires across the company. Therefore, thehuman resources department would be best placed to assess skills of newly hired engineersas a group.
Consequently, the sample covered a wide range of employers across sectors, regions, sizeof companies, etc. This suggests that the results are relatively representative. However,the sample may not fully represent the true population, i.e., the total number of theemployers that hire engineering graduates in India. Since we do not have detailedenterprise level data on who hires engineers, we cannot compare our sample with the truepopulation.
5. Findings
This section presents the major findings. First the section presents the results of a factoranalysis of the 25 skills rated by the employers. 6 Based on the skill groups, detail analysisis further conducted to respond to the three research questions raised in the introduction:(i) How satisfied are employers with the skills of engineering graduates? (ii) Which skillsdo employers consider important when hiring new engineering graduates? and (iii) Inwhich important skills are the engineers falling short?
5.1 Grouping SkillsWe conduct a factor analysis of the 25 individual skills to group the individual skills into asmall number of skill groups (factors).
We group the skills because it is plausible that a common latent factor (skill/ability)partially drives the importance and satisfaction ratings of a group of individual abilities.
For instance, employers and HR-staff often talk about the importance of ―soft skills‖.There is hence a notion that a set of interpersonal skills are related into one group and that
this group of skills is important. However, ―soft skills‖ are often neither well defined norbacked-up by empirical evidence that the individual skills referred to as soft skills formone group. Factor analysis is one of the ways to test this notion of soft skills and
empirically define the individual skills that make up ―soft skills‖. Further, theidentification of a small number of factors allow us to identify commonalities in demandand supply for skills, and structures the findings and provides a limit set of overall findings.
Factor analysis fits exactly the above goal of reducing the number of variables into overallgroups. It is a statistical procedure to find the latent variables that explain attributes ofcommon variables in the observed variables. Factor analysis is widely used in socialscience, especially in psychological researches and business surveys. Psychologists, forinstance, conduct empirical researches on the relationship between personality traits andjob performance. They examine numerous personal traits and categorize them into five6
A skill, ―Accepts responsibility for consequences of actions‖ is dropped from the analysis since the skill is
quite similar to ―Reliability‖11
representative personal traits by using factor analysis. Those five personal traits are called
―Big Five‖ that represents an overall pattern of all personality traits and recent papers have
examined the link between these traits and income, (Borghans, Lex, Duckworth andHeckman 2008).
By using factor analysis, 26 skills listed in the questionnaire were grouped into threefactors using the importance ratings. Table 3 below presents the resulting groups (factors)of skills generated by factor analysis. Skills emboldened in Table 3 are those with morethan 0.55 of factor loadings.7
Table 3: Skills grouped into Three FactorsFactor 1 Factor 2 Factor 3
(Core Employability Skills) (Professional Skills) (Communication Skills)Integrity Identify, formulate, and solve Written communicationSelf-discipline technical/engineering problems Design & conduct experiments,Reliability Design a system, component, or and analyze and interpret dataSelf-motivated process to meet desired needs ReadingEntrepreneurship Skills Use appropriate/modern tools, Communication in EnglishTeamwork equipment, technologies Technical SkillsUnderstands and takes Apply knowledge of mathematics, Verbal communicationdirections for work science, engineering Basic computerassignments Customer Service Skills Advanced computerWillingness to learn Knowledge of contemporary issues
http://www-wds.worldbank.org/external/default/WDSContentServ
2 9/2/2011
7/27/2019 Skill Set for Engineers
http://slidepdf.com/reader/full/skill-set-for-engineers 8/32
Flexibility CreativityEmpathy
Table A2-2 in Annex 2 lists all skills with factor loadings that explain dimensions of eachfactor in more details. The three factors above account for more than 85% of the totalvariance.
The first factor predominantly consists of personal characteristics. The skills with high
factor loading are ―Integrity‖, ―Self-discipline‖, ―Reliability‖, ―Self-motivated‖,
―Entrepreneurship Skills‖, ―Teamwork‖, ―Understands and takes directions for work
assignments‖, and ―Willingness to learn‖. This factor is named Core Employability Skills,
since these skills are not occupation specific, but cuts across occupations. Other studiesrefer to this set of skills as generic, catalytic, core and/or employability.
The second factor is essentially comprised of engineering specific skills, of which thefollowing are the skills with high loading; ―Identify, formulate, and solve
technical/engineering problems‖, ―Design a system, component, or process to meet
desired needs‖, ―Use appropriate/modern tools, equipment, technologies‖, and ―Apply
knowledge of mathematics, science, engineering‖. Following the HR-literature and other
employer surveys, we call this factor for ―Professional Skills‖. In the engineeringeducation literature, this set of skills is also referred to as technical skills.
7Factor loadings are the correlation coefficients between each variable and the factor. Items with higher load
are more relevant to the respective factor. Based on the guidelines made by Comrey and Lee (1992), items
(skills) that load more than 0.55 are considered ―very good‖. TableA2-2 in Annex 2 shows the skills withthe factor loadings.
12The third factor mixes different types of skills, e.g., communication skills, cognitive skills,and computer skills. The high loading skills in the third factor include ―Written
communication‖, ―Design & conduct experiments, and analyze and interpret data
‖,
―Reading‖, and ―Communication in English‖. This factor includes skills which may not bedirectly relevant to communication, such as ―Design & conduct experiments, and analyze
and interpret data‖. However, Table 3 and Table A2-2 show that all communication skills
fall in the third factor with relatively higher loadings. Therefore, the third factor is namedCommunication Skill.
The three names of the factors do not necessarily represent all skills in respective factors,but these three names do represent the majority of skills with high loadings. It should alsobe noted that naming factors is a mere poetic, theoretical, and inductive leap (Pett, Lackey,Sullivan, 2003). Therefore, it is important to look into the composition of these threefactors and understand actual skills explaining each factor.
The three factors obtained from factor analysis are similar to other studies using factoranalysis. For instance, as presented in Table 1 from Section 2, Paranto and Kelker (1999)grouped skills into four factors, Specific, Core, Personal Characteristics, andCommunication Skills. The factor, Core Employability Skills, corresponds to Core andPersonal skills, and Professional Skills to Specific skills, and Communication Skills toCommunication Skills. This similarity with empirical findings from other employersurveys increases our confidence of the above categorization of skills.
The three skills group identified by the above factor analysis partly corroborates one of themost used learning classifications, the Bloom‘s taxonomy, (Bloom 1956). Bloom‘s
taxonomy suggests the existence of three domains of learning. The term ―learning‖ is
synonymous to the term ―skill‖ as used in this paper. The three domains are:
Cognitive skills involve knowledge and the development of intellectual skills,
Affective skills include the manner in which we deal with things emotionally, suchas feeling, values, appreciation, enthusiasm, motivations, and attitudes, and
Psychomotor skills encompass physical movements, coordination, and the use ofmotor-skill areas.
The types of skills that our factor analysis categorizes under the Core Employability Skillsmostly belong to the Affective domain in Bloom‘s taxonomy (Integrity, self-discipline,reliability, and team-work). The types of skills categorized under the Professional Skills all
belong to the Cognitive domain in Bloom‘s taxonomy (remembering knowledge,understanding, applying, analyzing, evaluating, and creating). The skills categorized underthe third factor Communication Skills are a more mixed bag, as discussed above, and donot correspond to a specific domain in the Bloom‘s taxonomy. In Bloom‘s taxonomycommunication skills are mostly classified as part of the Affective Domain. This partialmatch of our identified skills categories with the Bloom‘s taxonomy provides furtherconfidence in the use of the three skills group in the rest of the paper.
13Using these three categories of skills (Core Employability, Professional Skills, andCommunication Skills), the remaining of this section responds to the three researchquestions on importance, satisfaction, and skill gaps.
5.2 Importance: Which Skills Do Employers Demand in Engineering Graduates?The level of importance attached to each skill reveals employers‘ valuation of, and
http://www-wds.worldbank.org/external/default/WDSContentServ
2 9/2/2011
7/27/2019 Skill Set for Engineers
http://slidepdf.com/reader/full/skill-set-for-engineers 9/32
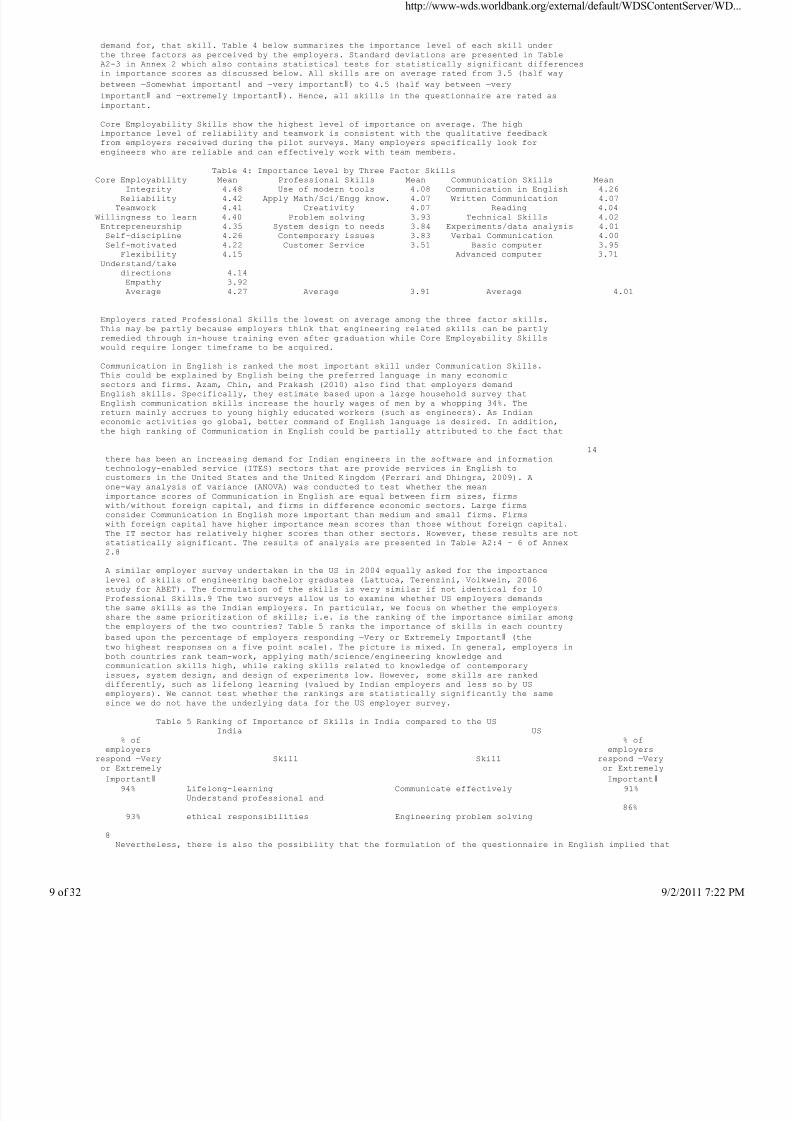
demand for, that skill. Table 4 below summarizes the importance level of each skill underthe three factors as perceived by the employers. Standard deviations are presented in TableA2-3 in Annex 2 which also contains statistical tests for statistically significant differencesin importance scores as discussed below. All skills are on average rated from 3.5 (half way
between ―Somewhat important‖ and ―very important‖) to 4.5 (half way between ―very
important‖ and ―extremely important‖). Hence, all skills in the questionnaire are rated asimportant.
Core Employability Skills show the highest level of importance on average. The highimportance level of reliability and teamwork is consistent with the qualitative feedbackfrom employers received during the pilot surveys. Many employers specifically look forengineers who are reliable and can effectively work with team members.
Table 4: Importance Level by Three Factor SkillsCore Employability Mean Professional Skills Mean Communication Skills MeanIntegrity 4.48 Use of modern tools 4.08 Communication in English 4.26
Reliability 4.42 Apply Math/Sci/Engg know. 4.07 Written Communication 4.07Teamwork 4.41 Creativity 4.07 Reading 4.04
Willingness to learn 4.40 Problem solving 3.93 Technical Skills 4.02Entrepreneurship 4.35 System design to needs 3.84 Experiments/data analysis 4.01Self-discipline 4.26 Contemporary issues 3.83 Verbal Communication 4.00Self-motivated 4.22 Customer Service 3.51 Basic computer 3.95
Flexibility 4.15 Advanced computer 3.71Understand/take
directions 4.14Empathy 3.92Average 4.27 Average 3.91 Average 4.01
Employers rated Professional Skills the lowest on average among the three factor skills.This may be partly because employers think that engineering related skills can be partlyremedied through in-house training even after graduation while Core Employability Skills
would require longer timeframe to be acquired.
Communication in English is ranked the most important skill under Communication Skills.This could be explained by English being the preferred language in many economicsectors and firms. Azam, Chin, and Prakash (2010) also find that employers demandEnglish skills. Specifically, they estimate based upon a large household survey thatEnglish communication skills increase the hourly wages of men by a whopping 34%. Thereturn mainly accrues to young highly educated workers (such as engineers). As Indianeconomic activities go global, better command of English language is desired. In addition,the high ranking of Communication in English could be partially attributed to the fact that
14there has been an increasing demand for Indian engineers in the software and informationtechnology-enabled service (ITES) sectors that are provide services in English tocustomers in the United States and the United Kingdom (Ferrari and Dhingra, 2009). Aone-way analysis of variance (ANOVA) was conducted to test whether the meanimportance scores of Communication in English are equal between firm sizes, firmswith/without foreign capital, and firms in difference economic sectors. Large firmsconsider Communication in English more important than medium and small firms. Firmswith foreign capital have higher importance mean scores than those without foreign capital.The IT sector has relatively higher scores than other sectors. However, these results are notstatistically significant. The results of analysis are presented in Table A2:4 - 6 of Annex2.8
A similar employer survey undertaken in the US in 2004 equally asked for the importancelevel of skills of engineering bachelor graduates (Lattuca, Terenzini, Volkwein, 2006study for ABET). The formulation of the skills is very similar if not identical for 10Professional Skills.9 The two surveys allow us to examine whether US employers demandsthe same skills as the Indian employers. In particular, we focus on whether the employersshare the same prioritization of skills; i.e. is the ranking of the importance similar amongthe employers of the two countries? Table 5 ranks the importance of skills in each country
based upon the percentage of employers responding ―Very or Extremely Important‖ (thetwo highest responses on a five point scale). The picture is mixed. In general, employers inboth countries rank team-work, applying math/science/engineering knowledge andcommunication skills high, while raking skills related to knowledge of contemporaryissues, system design, and design of experiments low. However, some skills are rankeddifferently, such as lifelong learning (valued by Indian employers and less so by US
employers). We cannot test whether the rankings are statistically significantly the samesince we do not have the underlying data for the US employer survey.
Table 5 Ranking of Importance of Skills in India compared to the USIndia US
% of % ofemployers employers
respond ―Very Skill Skill respond ―Veryor Extremely or Extremely
Important‖ Important‖94% Lifelong-learning Communicate effectively 91%
Understand professional and86%
93% ethical responsibilities Engineering problem solving
8Nevertheless, there is also the possibility that the formulation of the questionnaire in English implied that
http://www-wds.worldbank.org/external/default/WDSContentServ
2 9/2/2011
7/27/2019 Skill Set for Engineers
http://slidepdf.com/reader/full/skill-set-for-engineers 10/32
an English speaking person filled out the questionnaire. This could potentially have introduced a biastowards increased importance of English.9
There is a logical explanation why the two surveys asked feedback on a set of skills that were almostidentically formulated. The US survey sought feedback on the ABET EC2000 (a)-(k) criteria. These criteriaformed the basis for the formulation of the expected attributes and competences of an engineer graduate inthe Washington Accord. The NBA criteria used in this Indian employer survey were formulated to beconsistent with the Washington Accord.
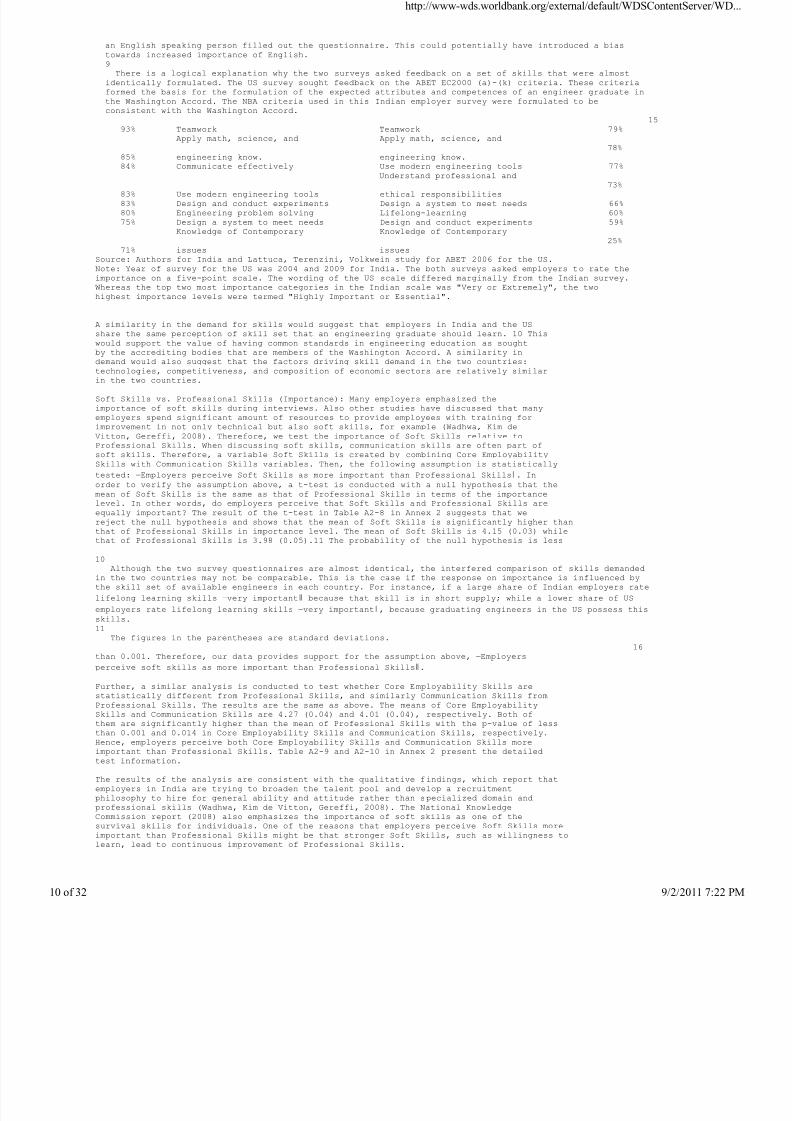
1593% Teamwork Teamwork 79%
Apply math, science, and Apply math, science, and78%
85% engineering know. engineering know.84% Communicate effectively Use modern engineering tools 77%
Understand professional and73%
83% Use modern engineering tools ethical responsibilities83% Design and conduct experiments Design a system to meet needs 66%80% Engineering problem solving Lifelong-learning 60%75% Design a system to meet needs Design and conduct experiments 59%
Knowledge of Contemporary Knowledge of Contemporary25%
71% issues issuesSource: Authors for India and Lattuca, Terenzini, Volkwein study for ABET 2006 for the US.Note: Year of survey for the US was 2004 and 2009 for India. The both surveys asked employers to rate theimportance on a five-point scale. The wording of the US scale differed marginally from the Indian survey.Whereas the top two most importance categories in the Indian scale was "Very or Extremely", the twohighest importance levels were termed "Highly Important or Essential".
A similarity in the demand for skills would suggest that employers in India and the USshare the same perception of skill set that an engineering graduate should learn. 10 This
would support the value of having common standards in engineering education as soughtby the accrediting bodies that are members of the Washington Accord. A similarity indemand would also suggest that the factors driving skill demand in the two countries:technologies, competitiveness, and composition of economic sectors are relatively similarin the two countries.
Soft Skills vs. Professional Skills (Importance): Many employers emphasized theimportance of soft skills during interviews. Also other studies have discussed that manyemployers spend significant amount of resources to provide employees with training forimprovement in not only technical but also soft skills, for example (Wadhwa, Kim deVitton, Gereffi, 2008). Therefore, we test the importance of Soft Skills relative toProfessional Skills. When discussing soft skills, communication skills are often part ofsoft skills. Therefore, a variable Soft Skills is created by combining Core EmployabilitySkills with Communication Skills variables. Then, the following assumption is statistically
tested: ―Employers perceive Soft Skills as more important than Professional Skills‖. Inorder to verify the assumption above, a t-test is conducted with a null hypothesis that themean of Soft Skills is the same as that of Professional Skills in terms of the importancelevel. In other words, do employers perceive that Soft Skills and Professional Skills areequally important? The result of the t-test in Table A2-8 in Annex 2 suggests that we
reject the null hypothesis and shows that the mean of Soft Skills is significantly higher thanthat of Professional Skills in importance level. The mean of Soft Skills is 4.15 (0.03) whilethat of Professional Skills is 3.98 (0.05).11 The probability of the null hypothesis is less
10Although the two survey questionnaires are almost identical, the interfered comparison of skills demanded
in the two countries may not be comparable. This is the case if the response on importance is influenced bythe skill set of available engineers in each country. For instance, if a large share of Indian employers rate
lifelong learning skills ―very important‖ because that skill is in short supply; while a lower share of US
employers rate lifelong learning skills ―very important‖, because graduating engineers in the US possess thisskills.11
The figures in the parentheses are standard deviations.16
than 0.001. Therefore, our data provides support for the assumption above, ―Employers
perceive soft skills as more important than Professional Skills‖.
Further, a similar analysis is conducted to test whether Core Employability Skills are
statistically different from Professional Skills, and similarly Communication Skills fromProfessional Skills. The results are the same as above. The means of Core EmployabilitySkills and Communication Skills are 4.27 (0.04) and 4.01 (0.04), respectively. Both ofthem are significantly higher than the mean of Professional Skills with the p-value of lessthan 0.001 and 0.014 in Core Employability Skills and Communication Skills, respectively.Hence, employers perceive both Core Employability Skills and Communication Skills moreimportant than Professional Skills. Table A2-9 and A2-10 in Annex 2 present the detailedtest information.
The results of the analysis are consistent with the qualitative findings, which report thatemployers in India are trying to broaden the talent pool and develop a recruitmentphilosophy to hire for general ability and attitude rather than specialized domain andprofessional skills (Wadhwa, Kim de Vitton, Gereffi, 2008). The National KnowledgeCommission report (2008) also emphasizes the importance of soft skills as one of thesurvival skills for individuals. One of the reasons that employers perceive Soft Skills moreimportant than Professional Skills might be that stronger Soft Skills, such as willingness tolearn, lead to continuous improvement of Professional Skills.
http://www-wds.worldbank.org/external/default/WDSContentServ
32 9/2/2011

7/27/2019 Skill Set for Engineers
http://slidepdf.com/reader/full/skill-set-for-engineers 11/32
There is a discussion to which extent institutions and teachers should aim for improvedCore Employability (Integrity, Reliability, Teamwork, Willingness to learn etc.) andCommunication Skills and to which extent that they can be held accountable for thegraduates‘ skills in these skill categories, given these are to a degree acquired prior tohigher education. Nevertheless, it is critical that engineering institutions recognize theimportance of Soft Skills. Based upon the importance of these skill sets, it is our view thateducation institutions should actively foster the learning of Soft Skills. This would add tothe professional skills of graduate and increase their employability and trainability.
Does demand for skills vary between Economic Sectors, Firm sizes, and regions?The analysis so far is conducted at national level. This section analyzes the datadisaggregated by sector, firm size and regional levels. In order to assess whether or notemployer‘s characteristics have an impact on their perceptions of the level of importance
in Soft and Professional Skills, the Kendall‘s rank correlation coefficient is used todetermine whether the orderings of importance level in skills differ across sectors, size,and regions.
The Kendall‘s rank correlation analysis is helpful when comparing the orderings of two ormore groups. It is a non-parametric measure assessing the degree of correspondencebetween sets of rakings. A pair of variables needs to transform one rank order into theother. Depending on the degree of correspondence between the set of rankings, theKendall‘s rank correlation coefficient lies between -1 and 1. If the value is 1, theagreement between two rankings is perfect (same orderings). If the value is -1, the rankingorder is completely reversed. If the value is 0, the ordering of the two variables areindependent. For our dataset, if the orderings of the importance level differ across sectors,
17sizes, and regions, then skill demand depends upon the employer‘s characteristics (sector,size, and region).
First, we test whether the orderings of importance level in soft and Professional Skills
differ across sectors. Because there are some sectors that do not have sufficient samplesize, the test takes into account only the following sectors, which have relatively largersamples; Automobiles, IT, Infrastructure, Mining, Oil & Gas, Other Service Sectors, andPower. The null hypothesis of the test is that the orderings of the importance level in skillsin sector X and Y are different (independent). In soft skills, 18 out of 28 sector pairs withasterisks indicate that orderings in the level of importance are not statistically differentfrom zero (Table A2-14 in Annex 2). In Professional Skills, only 4 sector pairs show thatthey are not different (Table A2-15 in Annex 2). In other words, most sectors have acommon perception about which soft skills are important, while they value different kindsof Professional Skills.
For instance, infrastructure sector, which is one of the sectors facing serious skill gaps,shows that the ordering of the importance level in Soft Skills does not differ from the othersectors, except from that of the Power sector. As for Professional Skills of Infrastructure,the ordering of the importance level statistically significantly differs from the ordering ofother sectors (with exception of the Power and Oil&Gas sectors). For example whileinfrastructure emphasizes the importance of knowledge of math/science/engineering andability to use modern tools, IT prioritizes creativity the highest. This result indicates thatthe Infrastructure sector tends to demand similar Soft Skills as other sectors. In contrast,
the priority in Professional Skills tends to be more unique to the sector.
Secondly, a similar test is conducted for firm size. The null hypothesis of the test is thatthe orderings of the importance level in skills are different by size of company. Table A2-16 in Annex 2 shows that the orderings of the importance level of Soft Skills do not differacross small, medium, and large firms. Therefore, like the analysis conducted acrosssectors, employers tend to consider the same Soft Skills important, irrespective of firm size.
However, the similar analysis for Professional Skills shows a different picture (Table A2-17 in Annex 2). Firm size matters when it comes to demand for Professional Skills. Largecompanies with more than 500 employees ask for different Professional Skills comparedto both medium and small firms. For instance, while large companies demand creativitythe most, small companies look for ability to use modern tools, knowledge ofmath/science/engineering, and problem solving skills. Small and medium companies seemto demand the same set of skills, since there is no statistically significant difference in theordering of importance level of Professional Skills.
Finally, another similar test was conducted by region. The results are similar to theanalyses above. The important Soft Skills are common to most regions while many regionstend to consider different priorities in Professional Skills. Table A2-18 in Annex 2 showsthat only one pair, Central and West, indicates that the order of importance level in SoftSkills are not the same. All the other pairs show that the regions tend to consider similarSoft Skills important. As for Professional Skills, the order of importance differs acrossregions (Table A2-19). For instance, problem solving skill in North is considered
18relatively more important than other Professional Skills (ranked 3rd among 7 ProfessionalSkills), but that in South problem-solving is only ranked 6th.
To summarize, we find that similar Soft Skills are considered important across sectors,regions, and firm sizes. The analysis also shows that employers tend to have differentpriorities in Professional Skills depending upon their characteristics.
5.3 Satisfaction: To What Extent Does the Skill Set of Engineering Graduates MeetDemand?
Overall, 64% of employers are only somewhat satisfied or worse with the quality of
http://www-wds.worldbank.org/external/default/WDSContentServ
32 9/2/2011

7/27/2019 Skill Set for Engineers
http://slidepdf.com/reader/full/skill-set-for-engineers 12/32
engineering graduates‘ skills. 3.9% of employers rate the skills as ―Not at all satisfied‖,
16.1% as ―Not very satisfied‖, and 43.9% as ―Somewhat satisfied‖. The average rating on
―overall are you satisfied with the newly graduated engineer that you have hired over the
last 4 years?‖ is only 3.15. That is slight above ―somewhat satisfied‖. The mean of theaverage satisfaction rating of each of the 26 skills is similar: 3.19, which indicates that theemployers have responded fairly consistently on the dis-satisfaction level for both theoverall level compared to each of the specific skills. It is noteworthy that none of the skills
listed in the questionnaire are on average rated above 4.0, ―Very Satisfied‖, which means
that no skill satisfies employers at the ―very‖ or ―extremely‖ level. Given that this is thefirst survey one cannot compare with either previous surveys to evaluate whethersatisfaction has decreased over the last decade as a consequence of the massive expansion(800% from 1998 to 2008). This (dis-)satisfaction level is corroborated by other studies onskills of the Indian engineering graduates. For instance, the NASSCOM and McKinseyreport (2005) finds that 75% of engineering graduates are not employable by multinationalcompanies.
Obviously, this (dis-)satisfaction level is an average. There is no doubt that India producesa large number of exceptionally bright engineers, as can be seen in the importance of high-tech entrepreneurs in the US that are of Indian origin, (Wadhwa, Rissing, Saxenian, andGereffi, 2007) and the share of international publications that come from Indianengineering education Institutions. Also, it could be that employers have unrealisticallyhigh expectations regarding the potential skill level of graduates. In the US survey of
engineering graduates, the average satisfaction rate was 4.01 equivalent to ―very satisfied‖.While the Indo-US difference is likely to reflect a difference in the quality of the graduates‘skills, it could also stem from more reasonable expectations from employers or a generallymore positive attitude of US employers. One should be cautious in directly comparingsubjective surveys internationally.12
12
Satisfaction level of employers toward graduates‘ skills is not always pessimistic, at least in othercountries. Several similar employer surveys in the US, for instance, show that employers are satisfied, insome cases very satisfied, with graduates‘ skills. The employer survey conducted by Noel-Levitz and UtahState University shows that employers are very satisfied with the graduates from Utah State University. Theyshow the interest to continue to hire the graduates. Another employer survey conducted by the University ofTexas-Pan American also shows that very few employers are dissatisfied with graduates‘ skills. Given thedifferent contexts between the US and India, satisfaction level cannot be simply comparable between the twocountries. However, employers do not always unrealistically evaluate their satisfaction level towardgraduates‘ skills.
19The dissatisfaction level of employers toward engineering graduates‘ skills confirms that asignificant share of graduating engineers does not meet employers‘ expected standards.Even if employers demanded unrealistically high skills from graduates, there is asubstantial quality gap between institutions (the producers) and employers (the consumers).This quality gap needs to be addressed.
Table 6 below presents the satisfaction level of each skill under the three factors. Thelevel of Core Employability Skills is relatively more satisfying than the other two skillfactors. It can be also seen that employers are most satisfied with Communication inEnglish. Further, knowledge of math/science/ engineering and basic computer are at thehighest level of satisfaction in Professional Skills. This intuitively makes sense as theseskills were some of the main vehicles for the initial success of the India‘s offshore ITbusiness.
In contract, satisfaction of higher-order thinking skills such as problem solving, systemdesign, and experiments/data analysis is at an alarming level—only ―somewhat satisfied”on average. This result reflects the views from many, if not most, firms. During a seriesof interviews, employers pointed out that most engineering graduates lack these higherorder thinking skills, especially problem solving. More detail information of satisfactionlevel is presented in Table A2-7 in Annex 2.
Table 6: Satisfaction Level by Three Factors
Core Employability Mean Professional Skills Mean Communication Skills MeanIntegrity 3.50 Apply Math/Sci/Engg know. 3.23 Communication in English 3.95
Teamwork 3.46 Use of modern tools 3.15 Basic computer 3.34Entrepreneurship 3.44 Creativity 3.08 Written Communication 3.22
Self-discipline 3.37 System design to needs 2.95 Verbal Communication 3.17Willingness to learn 3.37 Contemporary issues 2.95 Technical Skills 3.13Flexibility 3.29 Problem solving 2.87 Reading 3.08Reliability 3.20 Customer Service 2.65 Advanced computer 3.03Empathy 3.15 Experiments/data analysis 3.02
Self-motivated 3.12Understand/take
directions 3.12Average 3.30 Average 2.98 Average 3.24
We compare the satisfaction levels with findings from a US employer survey ofengineering graduates. The results of the two surveys should be interpreted with caution,for two main reasons: (i) The survey questionnaires differed slightly. The US employerswere asked to rate five combined types of skills on a three point scale, while the Indianemployers were rating using a five point scale on a series of individual skills (thesedifferences were not present for the importance questions analyzed above); (ii) satisfactionrates depend critically upon the respondent‘s expectations. For example, it may be that thecompetences of the Indian and the US graduates are identical, but the Indian employers
http://www-wds.worldbank.org/external/default/WDSContentServ
32 9/2/2011
7/27/2019 Skill Set for Engineers
http://slidepdf.com/reader/full/skill-set-for-engineers 13/32
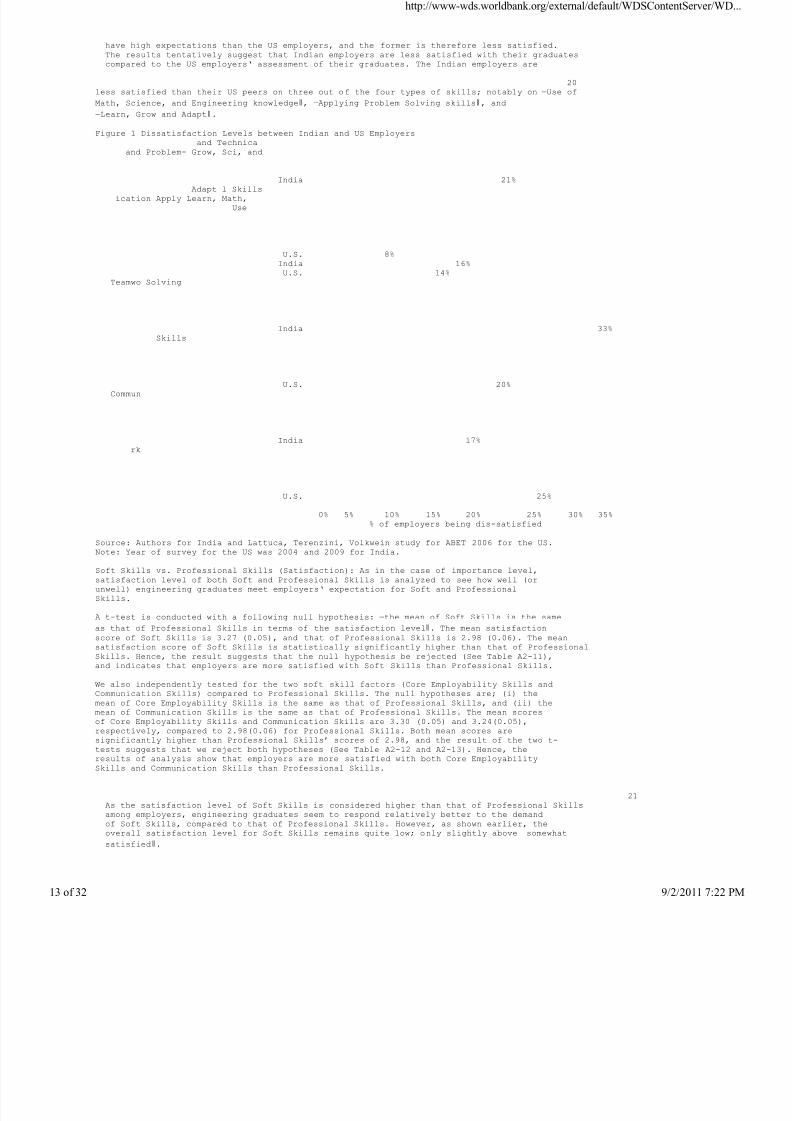
have high expectations than the US employers, and the former is therefore less satisfied.The results tentatively suggest that Indian employers are less satisfied with their graduatescompared to the US employers‘ assessment of their graduates. The Indian employers are
20less satisfied than their US peers on three out of the four types of skills; notably on ―Use of
Math, Science, and Engineering knowledge‖, ―Applying Problem Solving skills‖, and
―Learn, Grow and Adapt‖.
Figure 1 Dissatisfaction Levels between Indian and US Employersand Technica
and Problem- Grow, Sci, and
India 21%Adapt l Skills
ication Apply Learn, Math,Use
U.S. 8%India 16%U.S. 14%
Teamwo Solving
India 33%Skills
U.S. 20%Commun
India 17%rk
U.S. 25%
0% 5% 10% 15% 20% 25% 30% 35%% of employers being dis-satisfied
Source: Authors for India and Lattuca, Terenzini, Volkwein study for ABET 2006 for the US.Note: Year of survey for the US was 2004 and 2009 for India.
Soft Skills vs. Professional Skills (Satisfaction): As in the case of importance level,satisfaction level of both Soft and Professional Skills is analyzed to see how well (orunwell) engineering graduates meet employers‘ expectation for Soft and ProfessionalSkills.
A t-test is conducted with a following null hypothesis: ―the mean of Soft Skills is the same
as that of Professional Skills in terms of the satisfaction level‖. The mean satisfactionscore of Soft Skills is 3.27 (0.05), and that of Professional Skills is 2.98 (0.06). The meansatisfaction score of Soft Skills is statistically significantly higher than that of ProfessionalSkills. Hence, the result suggests that the null hypothesis be rejected (See Table A2-11),and indicates that employers are more satisfied with Soft Skills than Professional Skills.
We also independently tested for the two soft skill factors (Core Employability Skills and
Communication Skills) compared to Professional Skills. The null hypotheses are; (i) themean of Core Employability Skills is the same as that of Professional Skills, and (ii) themean of Communication Skills is the same as that of Professional Skills. The mean scoresof Core Employability Skills and Communication Skills are 3.30 (0.05) and 3.24(0.05),respectively, compared to 2.98(0.06) for Professional Skills. Both mean scores aresignificantly higher than Professional Skills’ scores of 2.98, and the result of the two t-tests suggests that we reject both hypotheses (See Table A2-12 and A2-13). Hence, theresults of analysis show that employers are more satisfied with both Core EmployabilitySkills and Communication Skills than Professional Skills.
21As the satisfaction level of Soft Skills is considered higher than that of Professional Skillsamong employers, engineering graduates seem to respond relatively better to the demandof Soft Skills, compared to that of Professional Skills. However, as shown earlier, theoverall satisfaction level for Soft Skills remains quite low; only slightly above ―somewhat
satisfied‖.
http://www-wds.worldbank.org/external/default/WDSContentServ
32 9/2/2011
7/27/2019 Skill Set for Engineers
http://slidepdf.com/reader/full/skill-set-for-engineers 14/32
5.4 Skill GapsThis section responds to the third question, ―In which important skills are the engineers
falling short?‖ This section combines the analysis of the importance ratings and the
satisfaction ratings to identify the specific skills that are in high demand (high importance),but satisfaction rates are low. These are the skills gaps that are most urgent to address.
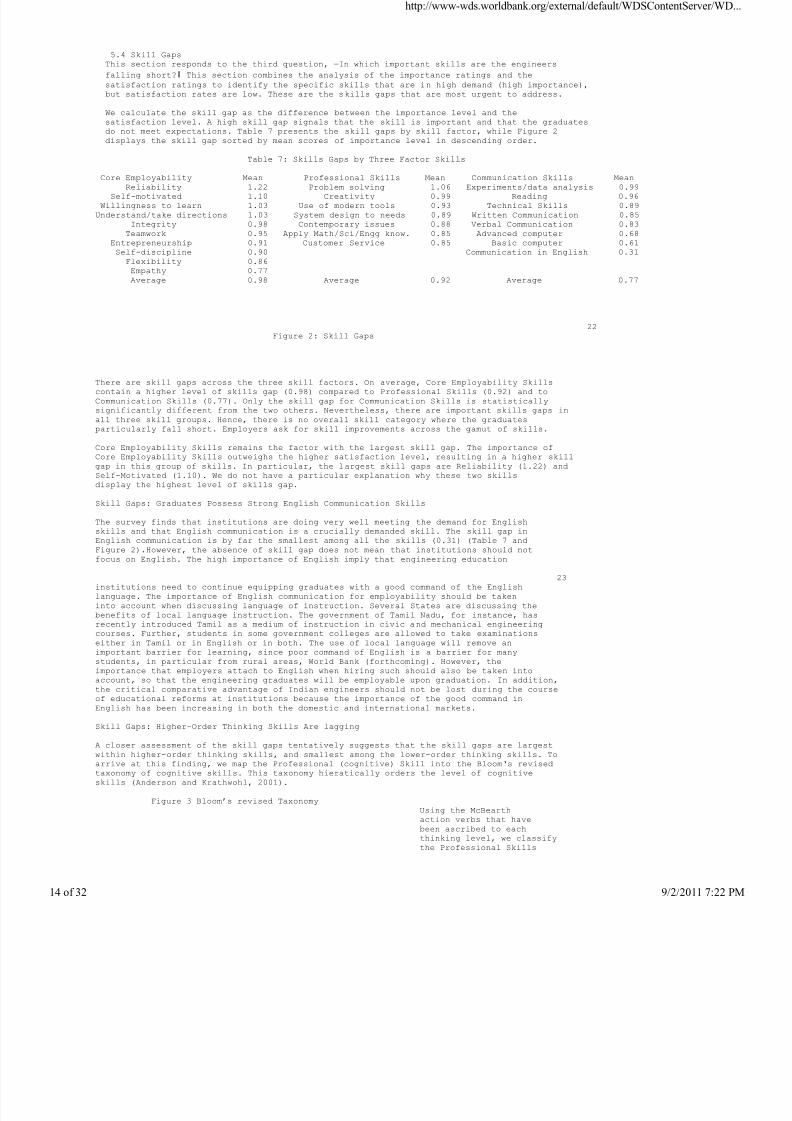
We calculate the skill gap as the difference between the importance level and thesatisfaction level. A high skill gap signals that the skill is important and that the graduatesdo not meet expectations. Table 7 presents the skill gaps by skill factor, while Figure 2displays the skill gap sorted by mean scores of importance level in descending order.
Table 7: Skills Gaps by Three Factor Skills
Core Employability Mean Professional Skills Mean Communication Skills MeanReliability 1.22 Problem solving 1.06 Experiments/data analysis 0.99
Self-motivated 1.10 Creativity 0.99 Reading 0.96Willingness to learn 1.03 Use of modern tools 0.93 Technical Skills 0.89
Understand/take directions 1.03 System design to needs 0.89 Written Communication 0.85Integrity 0.98 Contemporary issues 0.88 Verbal Communication 0.83
Teamwork 0.95 Apply Math/Sci/Engg know. 0.85 Advanced computer 0.68Entrepreneurship 0.91 Customer Service 0.85 Basic computer 0.61Self-discipline 0.90 Communication in English 0.31
Flexibility 0.86Empathy 0.77Average 0.98 Average 0.92 Average 0.77
22Figure 2: Skill Gaps
There are skill gaps across the three skill factors. On average, Core Employability Skillscontain a higher level of skills gap (0.98) compared to Professional Skills (0.92) and toCommunication Skills (0.77). Only the skill gap for Communication Skills is statisticallysignificantly different from the two others. Nevertheless, there are important skills gaps inall three skill groups. Hence, there is no overall skill category where the graduatesparticularly fall short. Employers ask for skill improvements across the gamut of skills.
Core Employability Skills remains the factor with the largest skill gap. The importance ofCore Employability Skills outweighs the higher satisfaction level, resulting in a higher skillgap in this group of skills. In particular, the largest skill gaps are Reliability (1.22) andSelf-Motivated (1.10). We do not have a particular explanation why these two skillsdisplay the highest level of skills gap.
Skill Gaps: Graduates Possess Strong English Communication Skills
The survey finds that institutions are doing very well meeting the demand for Englishskills and that English communication is a crucially demanded skill. The skill gap inEnglish communication is by far the smallest among all the skills (0.31) (Table 7 andFigure 2).However, the absence of skill gap does not mean that institutions should notfocus on English. The high importance of English imply that engineering education
23institutions need to continue equipping graduates with a good command of the Englishlanguage. The importance of English communication for employability should be takeninto account when discussing language of instruction. Several States are discussing thebenefits of local language instruction. The government of Tamil Nadu, for instance, hasrecently introduced Tamil as a medium of instruction in civic and mechanical engineeringcourses. Further, students in some government colleges are allowed to take examinationseither in Tamil or in English or in both. The use of local language will remove animportant barrier for learning, since poor command of English is a barrier for manystudents, in particular from rural areas, World Bank (forthcoming). However, theimportance that employers attach to English when hiring such should also be taken intoaccount, so that the engineering graduates will be employable upon graduation. In addition,
the critical comparative advantage of Indian engineers should not be lost during the courseof educational reforms at institutions because the importance of the good command inEnglish has been increasing in both the domestic and international markets.
Skill Gaps: Higher-Order Thinking Skills Are lagging
A closer assessment of the skill gaps tentatively suggests that the skill gaps are largestwithin higher-order thinking skills, and smallest among the lower-order thinking skills. Toarrive at this finding, we map the Professional (cognitive) Skill into the Bloom‘s revisedtaxonomy of cognitive skills. This taxonomy hieratically orders the level of cognitiveskills (Anderson and Krathwohl, 2001).
Figure 3 Bloom’s revised TaxonomyUsing the McBearthaction verbs that havebeen ascribed to eachthinking level, we classifythe Professional Skills
http://www-wds.worldbank.org/external/default/WDSContentServ
32 9/2/2011

7/27/2019 Skill Set for Engineers
http://slidepdf.com/reader/full/skill-set-for-engineers 15/32
Higher-order and the Engineering-Thinking Skills related skills that fit
poorly in theCommunication Skills-factor into either higher-order thinking skills (thetop three cognitive skills
Lower-order in the revised Bloom‘sThinking Skills taxonomy: analyzing,
evaluation, and creating)or the lower-orderthinking skills (thebottom-three cognitiveskills in the revised
Bloom‘s taxonomy:
24remembering, understanding and applying).13 Table 8 presents the classified skills and theimportance and the skill gap as revealed by the employers.
Table 8 Importance and Skill gap for Higher-Order and Lower-Order Thinking Skills
Higher-Order Skills Importance Skill GapIdentify, formulate, and solve technical/engineering problems 3.93 1.08Design a system, component, or process to meet desired needs 3.84 0.89Use appropriate/modern tools, equipment, technologies to the specific job 4.08 0.93Creativity 4.07 0.99Design & conduct experiments, and analyze and interpret data 4.01 0.99
Average Higher-Order Skills 3.98 0.97
Lower-Order skills Importance Skill GapApply knowledge of mathematics, science, engineering 4.07 0.85Knowledge of contemporary issues 3.83 0.88Technical Skills (e.g. programming) 4.02 0.89Basic computer (e.g. word processing) 3.95 0.68Advanced computer (e.g. spreadsheets and databases) 3.71 0.69
Average Lower-Order skills 3.90 0.77Source: authors‘ calculation
The average skill gap for higher-order thinking skills is substantially higher 0.97 comparedto 0.77 for lower-order skills, a statistically significant difference at the 1% level. Further,the importance level is higher 3.98 compared to 3.90 (also statistically significant at the1% level). This simple analysis shows that Indian employers demand higher-orderthinking skills. It also indicates that the graduates are better at meeting the demand forlower-order thinking skills, but they fall short in meeting the demand for higher-orderthinking skills. The reasons for demanding higher-order thinking skills are likely to be aresult of increased international and national competition, the pervasiveness oftechnologies in today‘s world, the focus on increased quality products and innovation. As
skills acquired in school and workplace become obsolete more quickly in the globalizationera, higher order thinking skills and an ability to learn new and more complex skills areindispensible to respond to accelerating technological change (Riboud and Tan, 2009).
While the above is only an indicative results, it is the first empirically-based evidence thatthe Engineering education institutions and system does an inadequate job of developinganalytical, evaluating and creative engineers. The above result highlights a crucial questionfor Indian engineering education; does the typical Indian engineering graduate sufficientlylearn higher-order thinking skills? Or does the education model (curriculum, teaching-learning process and assessment) predominantly build lower-order thinking skills, such as13
Besterfiled-Sacre et al, 2000, shows how each EC2000 criteria can be dissected into skill elements thatbelong to different levels of thinking orders. By using such a detailed mapping, a more detailedapproximation of the thinking-level of each required engineering skill could be established and the aboveanalysis would rest upon a more detailed analytical foundation. However, this dissection of each EC2000criteria goes beyond the scope of this paper.
25remembering and understanding? Answering these questions require a larger employersurvey and possibly a competence assessment of engineering graduates. 14
Summary Analysis of Skill Gaps: The previous sections show that employers are likely toperceive Soft Skills more important than Professional Skills. However, engineeringgraduates with limited and weak Professional Skills are undesirable for employers. Thesurvey results, for instance, show a clear signal to the Problem Solving that is underProfessional Skills. As shown earlier, Problem Solving has the largest gap in ProfessionalSkills and the second least satisfying skill of all skills.
Wide gaps can be observed among almost all skills. This is more obvious for higher orderskills, such as Problem Solving that falls in Professional Skills. Further, the mean scoresof skill gaps in Professional Skills are higher than those in Soft Skills, which are 0.91 and0.88 points, respectively. Therefore, the importance of Professional Skills should not bedisparaged.
6. Summary Findings and Policy ImplicationsEducating engineers with a comprehensive and deep set of skills that are in demand wouldbe of tremendous importance for the employability of individual engineers and for the
http://www-wds.worldbank.org/external/default/WDSContentServ
32 9/2/2011

7/27/2019 Skill Set for Engineers
http://slidepdf.com/reader/full/skill-set-for-engineers 16/32
country‘s development. Large economic sectors, such as IT, infrastructure, power andwater, rely critically upon engineering skills and technologies. This employer surveyprovides important new insight on which specific skills are important for employers andwhere the graduates currently fall short. In what follows, we present the main findings andthe policy implications that we draw from each finding. However, it is important to keepthree caveats in mind: (i) the quality improvements in education lie squarely within thescope of pedagogy, education policy and education management, which is outside of thescope of this paper; (ii) the engineers evaluated by employers should be seen as the endproduct of the entire education system, not just engineering education. The engineeringcolleges receive graduates from the secondary education system with a set of skills uponwhich they add. In particular, the Soft Skills are influenced by a prior schooling and thefamily setting; and (iii) although the sample size is fairly large compared to similarsurveys, it is relatively small compared to the large population of Indian firms. Further, thesurvey may be biased due to a small size of convenience sampling and a possible over-
sampling of large firms. Keeping these important caveats in mind, we limit therecommendations to a set of broad actions within engineering education to improve theskill set of future engineers.There is substantial dissatisfaction with the quality of graduates. 64% of employersare only somewhat satisfied or worse with the current engineering graduate skills. Thisconfirms the finding of a number of other surveys showing that the skills set of freshengineers is inadequate. Although, there are always caveats when comparing satisfactionsurveys internationally, we find that Indian employers are less satisfied with theirengineers compared to US employers. Obviously, the dissatisfaction suggests that renewed
14The same question should be posed as to graduates of other stream of higher education in India and to to
other levels of the education system. Clark, 2001 examines the culture of pedagogy in the primary andsecondary education system. She finds a pervasive focus of teaching and learning in India on lower orderthinking-typified by repetition and memorization-and the lack of attention given to the development ofhigher-order thinking.
26efforts are necessary to raise the skill set of engineering graduates in India through an
improvement in the quality of engineering education. We particularly recommend thateach engineering program explicitly states and measures the desired learning outcomes(the skill set of their graduate). The accreditation agency, NBA, in particular could have atremendously important impact if it increased the weight of graduates‘ learning outcomescompared to other input-oriented accreditation criteria (such as classroom and curricula).Also, while the results may appear gloomy, reforms and quality improvements programshave successfully taken place at individual state and institutional level. There are severalsuccess stories, see Annex 4 for the Technical Education Quality ImprovementProgramme. What is required is a scale-up of the reforms and investments at the nationallevel addressing the shortcomings in the skill set of engineers.
The skills set of engineers can be characterized by three overall skills factors:(i) Core Employability Skills (which cover generic attitudinal and affective skills,
such as reliability and team-work);(ii) Communication Skills (such as English skills, written and verbal
communication), and(iii) Professional Skills (which generally covers cognitive skills related to the
engineering professions, such as ability to apply engineering knowledge; aswell as design and conduct experiments and related data analyze and
interpretation).These skill factors are similar to findings from other employer surveys. CoreEmployability Skills and Communications Skills are often referred to as soft skills. Thefactors also have important similarities with theoretical skill domains developed in theeducational literature. These three skill factors are therefore appropriate to use for furtheranalysis.
All three skills factors are important- Core Employability Skills, Communication Skillsand Professional Skills are important. Engineers that are in high demand possess allthree skills sets. Engineering education programs therefore have to put in place acomprehensive quality upgrade of their programs.However, while Professional Skills remain important, employers consider Soft Skills(Core Employability Skills and Communication Skills) the most important skills.Employers look for engineering graduates who show integrity, are reliable, can work wellin teams and are willing to learn.Further, employers across India ask for a similar set of soft skills. Irrespective of thesize of the company, the economic sector, or the region, the above Soft Skills (integrity,reliability, teamwork and willingness to learn) remain the important ones.The policy implication is the need to improve the Soft Skills of graduates. This could comeabout by: (i) Colleges and teachers recognizing that Soft Skills are important and includesoft skills as part of the desired learning objectives that teachers should foster in theirstudents. Technical knowledge and applicability are fundamental to engineering education;however, they are not all. Student‘s soft skills need to be honed as well; (ii) The NationalAccreditation Board could enhance the importance given to soft skills in the Program
Outcomes; For example, NBA does not explicitly include ―team working skills‖ as an
expected skill for an engineering graduate; (iii) The teaching-learning process could be27
adjusted to include more project-work in teams and possibly received grades as a team;and (iv) Introduce or scale-up specific courses providing students with opportunities toenhance their English skills, communication skills or other forms of Soft Skills, forexample through finishing schools (courses for graduating students focusing on specificskills in high demand).The survey finds that colleges are doing very well meeting the demand for Englishskills, since the graduates are rated in English. The skill gap in English communicationis the smallest among all the skills. Yet English communication is rated as the mostimportant communication skill and higher than any technical skill. Although we
http://www-wds.worldbank.org/external/default/WDSContentServ
32 9/2/2011
7/27/2019 Skill Set for Engineers
http://slidepdf.com/reader/full/skill-set-for-engineers 17/32
understand the advantages of teaching in a local language, we recommend caution whenconsidering changing the language of instruction from English to a regional language,because the change may put graduates from local language programs at a significantdisadvantage at the job-interview.Graduates seem to lack higher-order thinking skills (analyzing, evaluating andcreating). The employers think that graduates are relatively strong in lower-order thinkingskills (knowledge and understanding), but fall short when it comes to the more complextasks such as application of appropriate tools to solve a problem, and analysis and
interpretation. Employers are less than ―Somewhat satisfied‖ with these skills. Further,these higher-order thinking skills are the most important Professional Skills. In short,memorizing textbooks for examinations is not a skill appreciated by the employers. Thisraises a question of fundamental importance, whether the Indian engineering educationsystem overly trains students to memorize science and engineering knowledge, withoutadequately emphasizing the applicability, analysis and out-of-the-box thinking thatemployers look for. The Indian engineering firms increasingly require more analytical,adaptive, and creative engineers to upgrade the country‘s infrastructure, to respond toclimate change and compete for higher value-added IT-orders on the global market.
Our recommendations to improve higher-order thinking skills are following. First of all,we recommend that the question be further examined and debated given the importance.Secondly, if the finding is true, which several qualitative studies suggest, major initiativesare required to reform the system: (i) reshape assessment methods, especially exams at thelarge affiliating universities, to assess higher-order thinking skills and not measurememorized knowledge. This would require institutions to focus on learning rather thanmemorization and mere understanding. In order to do so, curricula should be designed in away where students learn how to abstract out complex and practical issues within limitedtime; (ii) reform curricula to increase the share of tasks where the student or a team ofstudents lead their own problem identification, experimenting, and solving usingengineering knowledge and methodologies; (iii) promote teaching-learning sessions wherestudents are actively learning and developing their own analytical and evaluating skills ascompared to simply listing and taking notes. This would most likely require significantlyincreased academic autonomy of institutions, substantial professional development of the
teacher force and recruitment, and attention to instructional skills when recruiting teachers.
Employers ask for different Professional Skills depending upon their economicsectors, the firm size and the region. To illustrate, IT companies, in general, demandcreativity and strong system design skills while the knowledge of mathematics, science,and engineering are less important. On the other hand, the infrastructure firms prioritize
28graduates with strong ability to use modern tools and the knowledge of mathematics,science, and engineering, but focus less on creativity and system design skills.This leaves an important role for institutions to prepare their graduates to meet the demandfor skills from different sectors. Institutions therefore have to increase their interactionwith various kinds of employers. Hence, the institutions should customize programoutcomes to meet the specific demand. Further, extra-curriculum activities such asinternships and involvement of institutions with community would also help students todeepen the understanding of demanded skills and respond well to particular demandedskills.
29ReferencesAcademy For Educational Development, 2008. Middle Technical College Employer
Survey, AED, Washington DC, USA
Acock, Alan C., 2008, A Gentle Introduction to Stata, Second Edition, Stata Corp LP,Texas USA
Anderson, L. W., & Krathwohl, D. R. (Eds.). 2001. A taxonomy for learning, teaching andassessing: A revision of Bloom's Taxonomy of educational objectives. New York:Longman.
Azam, Mehtabul & Aimee Chin & Nishith Prakash, 2010. The Returns to English-Language Skills in India. CReAM Discussion Paper Series 1002, Centre forResearch and Analysis of Migration (CReAM), Department of Economics,University College London, UK.
Bertrand, Marianne and Sendhil Mullainathan, 2001. Do People Mean What They Say?Implications For Subjective Survey Data. American Economic Review, AmericanEconomic Association, Pennsylvania, USA.
Biswas, Gautam, K.L. Chopra, C.S. Jha and D.V. Singh, 2010. Profile of EngineeringEducation in India: Status, Concerns and Recommendations. Indian NationalAcademy of Engineering, Narosa Publishing House, New Delhi, Chennai, Mumbai,Kolkata
Bloom, B.S. (Ed.), Engelhart, M.D., Furst, E.J., Hill, W.H., & Krathwohl, D.R. 1956.Taxonomy of educational objectives: The classification of educational goals.Handbook 1: Cognitive domain. New York: David McKay.
Borghans, Lex, Angela Lee Duckworth, James J. Heckman, Bas ter Weel, 2008. TheEconomics And Psychology Of Personality Traits. Working Paper 13810, NationalBureau Of Economic Research, Massachusetts, USA.
Chen, Derek H. C., Kishore Gawande, 2007, Underlying Dimensions of Knowledge
http://www-wds.worldbank.org/external/default/WDSContentServ
32 9/2/2011

7/27/2019 Skill Set for Engineers
http://slidepdf.com/reader/full/skill-set-for-engineers 18/32
Assessment: Factor Analysis of the Knowledge Assessment Methodology Data,World Bank Policy Research Working Paper 4216, Washington DC, USA
Clark, Prema, 2001, Teaching and Learning, The Culture of Pedagogy, Sage PublicationsIndia Pvt Ltd, New Delhi, India
Gorsuch, Richard L., 1983, Factor Analysis (Second Edition), Lawrence ErlBaumAssociates, Inc. New Jersey, USA
Hatcher, Larry, 1994, A Step-by-Step Approach to Using SAS for Factor Analysis andStructural Equation Modeling, SAS Institute Inc., North Carolina, USA
30Hester, Yvette, 1996, Mathematical Models Underlying Common Factor Analysis: An
Introductory Primer, Educational Resources Information Center (ERIC), USA
Hill, Roger B. & Gregory C. Petty, 1995, A New Look at Selected Employability Skills: AFactor Analysis of the Occupational Work Ethic, Journal of Vocational EducationResearch; Vol. 20, No. 4, pp. 59-73
Jae-on, Kim, and Charles W. Muller, 1978. Factor Analysis: Statistical Methods andPractical Issues. Sage Publications, CA, USA.
_________, 1978. Introduction to Factor Analysis: What It is and How to Do It. SagePublications, CA, USA.
Kleinke, Joan, 2005. Noel-Levitz Employer Satisfaction Survey Utah University, Noel-Levitz Inc., Iowa, USA
Lattuca, Lisa R., Patrick T. Terenzini, J. Fredricks Volkwein, 2006. Engineering Change:
A Study of the Impact of EC2000. Center for the Study of Higher Education, ThePennsylvania State University, ABET, inc., Maryland, USA.
Lee, Denis M. S., Eileen M. Trauth, Douglas Farwell, 1995, Critical Skills and KnowledgeRequirements of IS Professionals: A Joint Academic/Industry Investigation, MISQuarterly, Vol. 19, No. 3, Management Information Systems Research Center,University of Minnesota
Lynch, Scott M., 2003. Multicollinearity (Soc 504). Available athttp://www.princeton.edu/~slynch/SOC_504/multicollinearity.pdf
MHRD, Ministry of Human Resource Development, 1998-2008. Annual Report. NewDelhi, India
Ministry of Power, Government of India, 2007. Agenda for the Seminar on Requirementand Availability of Highly Skilled Manpower for the Power Sector, New Delhi,India
NASSCOM and McKinsey, 2005. NASSCOM and McKinsey Report 2005: Extending
India‘s Leadership of the Global IT and BPO Industries, NASSCOM and McKinsey,New Delhi, India
National Board of Accreditation, 2009. Evaluation Guidelines for NBA Accreditation ofUndergraduate Engineering Programme. National Board of Accreditation, NewDelhi, India.
National Knowledge Commission, 2008. Report of Working Group on Higher Education.New Delhi, India
Paranto, Sharon R., Mayuresh Kelker, 1999. Employer Satisfaction with Job Skills ofBusiness College Graduates and Its Impact on Hiring Behavior. Journal of
31Marketing for Higher Education, Vol. 9(3), The Haworth Press, Inc., New York,USA.
Pett, Marjorie A., Nancy R. Lackey, John J. Sullivan, 2003. Making Sense of FactorAnalysis, The use of factor analysis for instrument development in health caresearch. Sage Publications, Inc., California, USA.
Riboue, Michelle, Hong Tan, 2009. Improving Skills for Competitiveness, (p204-245Accelerating Growth And Job Creation In South Asia), World Bank, WashingtonDC, USA.
Torres-Reyna, Oscar. Getting Started in Factor Analysis (using Stata). Available athttp://dss.princeton.edu/training/Factor.pdf
Thompson, Phyllis E., 2007. Central Ohio Technical College, Employer SatisfactionSurvey & Employer Interviews. Central Ohio Technical College, Office ofInstitutional Planning & Human Resource Development, Newark, Ohio. Availableat http://www.newarkcolleges.com/COTC/ResearchandPlanning/default.asp
Lujan, Sylvia S., Rios, Xavier ―Andy‖, 2001. Employer Satisfaction Survey, TheUniversity of Texas-Pan American, Office of Institutional Effectiveness, USA
Wadhwa, Vivek, Ben Rissing, AnnaLee Saxenian, Gary Gereffi, 2007. Education,
http://www-wds.worldbank.org/external/default/WDSContentServ
32 9/2/2011

7/27/2019 Skill Set for Engineers
http://slidepdf.com/reader/full/skill-set-for-engineers 19/32
Entrepreneurship and Immigration: America‘s New Immigrant Entrepreneurs, PartII. Ewing Marion Kauffman Foundation; Duke School of Engineering, UCBerkeley School of Information.
Wadhwa, Vivek, Una Kim de Vitton, Gary Gereffi, 2008. How The Discipline BecameThe Guru. School of Engineering at Duke University, Harvard Law School, TheKauffman Foundation, USA
Washington Accord, Sydney Accord, Dublin Accord, Engineer Mobility Forum,Engineering Technologists, Mobility, Graduate Attributes and ProfessionalCompetencies, Ver 1.1-13, June 2005
World Bank, 2008. Indian Road Construction Industry, Capacity Issues, Constraints &Recommendations. World Bank, Washington DC, USA.
_________, 2009. Implementation Completion and Results Report (IDA-37180) on ACredit for a Technical/Engineering Education Quality Improvement Project. WorldBank, Washington DC, USA
_________, 2009. India‘s Investment Climate, Voice of Indian Business, World Bank,Washington DC, USA.
_________, 2010. Project Appraisal Document: Second Technical/Engineering EducationQuality Improvement Project. World Bank, Washington DC, USA.
32_________, Forthcoming. Study on Strategies to Achieve Equity in Student Performance
in Engineering in Karnataka and Gujarat. Ed. Neera Burra. World Bank,Washington DC, USA.
33Annex 1: Procedures of Factor Analysis
1. IntroductionFactor analysis is a statistical procedure to find the latent variables (or factors) thatexplains attributes underlying common variables in the matrix. In other words, it is ―toidentify the interrelationships among a large set of observed variables and then, throughdata reduction, to group a smaller set of these variables into dimensions or factors thathave common characteristics (Nunnally & Bernstein, 1994)”.15 Therefore, it is sometimesused as a data reduction technique.
Factor analysis is widely used in social science, especially in psychological researches andbusiness surveys. For instance, it has been used by personality psychologists to find outmajor dimensions of people‘s personality that defines human personality. The most
prominent is probably the ―Big Five‖ personality inventory. The Big Five factors areOpenness, Conscientiousness, Extroversion, Agreeableness, and Neuroticism (OCEAN).The Big Five model has been developed over the past 50 years in personality psychology,and a strong consensus that these five factors represent an overall pattern of all personality
traits has emerged since early 1990s. Factor analysis is also extensively used in businesssurveys, from employee/employer satisfaction surveys to customer satisfaction surveys, tomarketing research, and to analysis of stock market.
There are basically two types of factor analysis: exploratory and confirmatory.Exploratory factor analysis ―is used when the researcher does not know how many factorsare necessary to explain the interrelationships among a set of characteristics, indicators,
or items (Gorsuch, 1983; Pedhazur & Schmelkin, 1991; Tabachnick & Fidell, 2001)‖16
Confirmatory factor analysis, on the other hand, is used when the researcher has a definedidea of the structure or the number of dimensions underlying a set of variables. Given thatemployer satisfaction survey is probably the first attempt in India, exploratory factoranalysis was applied for the data analysis. Since this paper discusses only exploratoryfactor analysis, it will henceforth simply be named factor analysis.
Factor analysis normally takes three basic steps, preparing the relevant covariance matrix,extracting initial factors, and rotating to a terminal solution (Kim and Mueller, 1978).Therefore, the rest of this annex proceeds in the following way. Section 2 examines thequality of correlation matrix and determines if it is factorable. Section 3 presents the
extraction method conducted. Section 4 discusses the selection of rotation methods of thefactor analysis. Section 5 briefly examines the internal consistency of the instrument byusing Cronbach‘s Coeeficient alpha. Section 6 discusses naming and interpreting thefactors and their limitations. Section 7 presents composition of factor scores.
2. Examine Correlation MatrixReviewing elementary characteristics of correlation matrices is critical for factor analysisbecause the quality of matrices determines whether or not the matrices are factorable.
15Marjorie A. Pett, Nancy R. Lackey, John J. Sullivan, 2003. Making Sense of Factor Analysis.
16Ibid
34Bartlett‘s Test of Sphericity and Kaiser-Meyer-Olkin Test (KMO) were used to evaluatethe strength of the liner association among 25 items in the correlation matrix.17
a) Bartlett’s Test of Sphericity: This is to test the null hypothesis that correlation
http://www-wds.worldbank.org/external/default/WDSContentServ
32 9/2/2011

7/27/2019 Skill Set for Engineers
http://slidepdf.com/reader/full/skill-set-for-engineers 20/32
matrix is an identity matrix. An identity matrix is a matrix with 0‘s on the off-diagonal and a completely noncollinear, which is not factorable. The formula ofthe test is following;
….. (1)
where
=calculated chi-square value for Bartlett‘s testN=sample sizek=number of items or variables in the matrix
=natural logarithm|R|=determinant of the correlation matrix
The outcome below suggests that we reject the hypothesis above and conclude thatour correlation matrix is not an identity matrix.
Bartlett test of sphericityChi-square = 1875.263Degrees of freedom = 300p-value = 0.000H0: variables are not intercorrelated
b) Kaiser-Meyer-Olkin Test (KMO): KMO is a measurement of sampling adequacythat compares the magnitudes of the observed correlation coefficients to themagnitudes of the partial correlation coefficients.
….. (2)
where
Kaiser-Meyer-Olkin Measure of Sampling AdequacyKMO = 0.860
Evaluation of the size of KMO is characterized by Kaizer, Meyer, and Olkin asfollowing:
17
A skill, ―Accepts responsibility for consequences of actions‖, is dropped from the correlation matrix before
factor analysis proceeds since the skill is quite similar to ―Reliability‖.35
Above .90 is ―Marvelous‖
In the .80s is ―Meritorious‖
In the .70s is ―Middling‖
In the .60s is ―Mediocre‖
In the .50s is ―Miserable‖
Less than .40s is ―Don‘t Factor‖
According to Bartlett‘s test, the test is significant ( ), whichindicates that the correlation matrix is not an identity matrix. The result of KMO statistics
(.86) is ―Meritorious‖ according to Kaizer‘s criteria, suggesting that we have a sufficientsample size relative to the number of items in our scale. Given the results of the two testsabove, the correlation matrix appears to be factorable.
3. Extraction Method and Selection of the Number of Factors to RetainThe main objective of the extraction in factor analysis is to determine the minimumnumber of common factors that would satisfactorily produce the correlations among theobserved variables (Kim and Mueller, 1978). There are about 7 extraction methods;Principal Component Analysis (PCA), Principal Axis Factoring (PAF), MaximumLikelihood Methods, Unweighted Least Squares, Generalized Least Squares, AlphaFactoring, Image Factoring, etc. The first two methods, PCA and PAF, are served as basemodels of factor analysis and most commonly used in factor analysis. Therefore, we will
focus on these two extraction methods, discuss differences of the two models, and thenfinally decide which method is appropriate for our analysis.
Both methods are based on assumption that initial factors to be extracted from thespecified matrix are orthogonal or uncorrelated with one another (Pett, Lackey, Sullivan,2003), and therefore they are a multivariate linear model.
The model of PCA is defined by the following equation:
….. (3)
where
= standardized observed variable for k= factor loadings (or standardized regression coefficient) of k on= jth common factors
The model of PAF is slightly different from PCA, and it is defined by the following
http://www-wds.worldbank.org/external/default/WDSContentServ
32 9/2/2011

7/27/2019 Skill Set for Engineers
http://slidepdf.com/reader/full/skill-set-for-engineers 21/32
equation:
….. (4)
where
= standardized observed variable for k36
= factor loadings (or standardized regression coefficient) of k on= jth common factors
= factor loading of k on its unique factor
As the formulas above show, the major difference between PCA and PAF is theirapproaches to deal with the variances. While PAF includes all variances; common
variance, specific variance, and error variance, PCA partitions variances into sharedvariance and unique variance, which is composed of specific and error variance.
There is no agreement among researches on which extraction method is better, andtherefore selection of extracting method in factor analysis is not easy. Both PCA and PAFhave advantages and disadvantages. While PCA is more commonly used by researchersand useful especially when reducing a number of variables with a smaller number ofcomponents (or factors), PAF provides a better estimate of correlations by separating outerror variances. (Pett, Lackey, and Sullivan, 2003) As a result, PCA tends to show theestimate of correlations slightly higher than that of PAF. Because we do not know howsignificant error of measurement from shared variance play a role in this exercise, it wouldbe safer to take into account (separate out) the error variance. Thus, PAF is selected asextraction method.18 Table A1-1 below shows the result of the extraction.
Table A1- 1: Factor loadings (pattern matrix) and unique variances (PAF)Factor Eigenvalue Difference Proportion CumulativeFactor1 8.059 5.610 0.577 0.577Factor2 2.449 1.069 0.175 0.753
Factor3 1.379 0.485 0.099 0.851Factor4 0.894 0.285 0.064 0.915Factor5 0.609 0.090 0.044 0.959Factor6 0.519 0.092 0.037 0.996Factor7 0.427 0.090 0.031 1.027Factor8 0.337 0.062 0.024 1.051Factor9 0.275 0.067 0.020 1.071Factor10 0.208 0.078 0.015 1.086Factor11 0.130 0.033 0.009 1.095Factor12 0.097 0.040 0.007 1.102Factor13 0.057 0.062 0.004 1.106Factor14 -0.004 0.009 0.000 1.106Factor15 -0.013 0.034 -0.001 1.105Factor16 -0.047 0.006 -0.003 1.101Factor17 -0.053 0.027 -0.004 1.098Factor18 -0.080 0.031 -0.006 1.092Factor19 -0.110 0.013 -0.008 1.084Factor20 -0.123 0.033 -0.009 1.075Factor21 -0.156 0.020 -0.011 1.064
Factor22 -0.176 0.004 -0.013 1.051Factor23 -0.180 0.079 -0.013 1.038Factor24 -0.260 0.016 -0.019 1.020Factor25 -0.276 . -0.020 1.000
Var Fctr1 Fctr2 Fctr3 Fctr4 Fctr5 Fctr6 Fctr7 Fctr8 Fctr9 Fctr10 Fctr11 Fctr12 Fgi21 0.524 -0.223 -0.160 0.125 -0.159 -0.034 0.035 -0.157 0.016 0.026 -0.137 0.146 gi22 0.678 -0.058 -0.188 0.201 -0.221 0.211 -0.016 -0.023 0.021 0.031 -0.158 -0.051 -
18PCA was also tried out. However, the factors extracted by PCA seemed mixing soft and Professional
Skills, and it was difficult to intuitively interpret the results, which is one of the important assessments of theextracted factors. gi23 0.635 -0.002 -0.072 0.299 -0.130 0.095 -0.210 -0.150 -0.041 0.092 0.088 -0.052 0gi24 0.598 -0.445 0.023 -0.217 -0.145 0.012 0.142 0.111 0.206 0.022 -0.001 0.023 -0gi25 0.596 -0.510 0.019 -0.105 -0.174 0.088 0.133 -0.053 0.016 0.085 0.073 -0.017 -0gi26 0.532 -0.486 0.170 -0.113 -0.093 -0.068 -0.103 0.135 0.200 -0.022 0.075 -0.039 0gi27 0.649 -0.398 -0.012 0.104 -0.007 -0.002 0.008 0.229 -0.201 0.050 -0.048 -0.028 0gi28 0.602 -0.062 -0.245 0.142 0.065 -0.201 -0.089 0.113 -0.131 0.153 0.059 0.111 -0gi29 0.685 -0.264 0.113 -0.013 0.165 0.091 -0.050 0.024 -0.016 -0.109 -0.067 -0.088 -0gi210 0.545 -0.298 -0.077 0.044 0.157 0.194 0.058 0.009 -0.145 -0.168 0.056 0.080 -0gi211 0.623 -0.266 -0.014 0.139 0.180 -0.238 0.067 -0.134 0.065 -0.022 0.111 0.008 -0si31 0.534 0.235 -0.323 -0.394 0.034 0.168 0.073 -0.093 -0.036 -0.003 0.020 -0.004 0si32 0.531 0.213 -0.394 -0.446 0.075 0.037 -0.105 0.000 -0.075 0.050 -0.011 -0.076 -0si33 0.561 0.341 -0.377 -0.119 0.106 -0.165 0.175 0.087 0.064 -0.025 0.006 0.026 0si34 0.609 0.415 -0.291 0.187 -0.071 0.109 -0.002 0.043 0.072 -0.045 0.055 -0.001 -0si35 0.642 0.259 0.378 -0.138 -0.238 -0.067 0.003 -0.035 -0.208 -0.039 0.078 -0.002 0si36 0.609 0.199 0.434 -0.152 -0.116 -0.196 -0.033 -0.079 -0.073 0.034 -0.035 -0.059 0si37 0.533 0.302 0.092 -0.064 0.125 0.083 -0.402 0.070 0.142 0.033 0.029 0.067 0si38 0.576 0.319 0.359 -0.112 -0.075 0.012 -0.016 0.133 -0.015 -0.161 -0.066 0.116 -0si39 0.263 0.193 0.404 -0.058 0.205 0.223 0.045 -0.045 0.081 0.208 -0.043 0.055 0si310 0.354 0.120 0.243 0.098 0.294 0.073 0.229 0.104 -0.046 0.158 -0.006 -0.033 -0si311 0.352 0.448 0.066 0.349 -0.035 0.176 0.127 0.130 0.061 -0.085 0.080 -0.049 0
http://www-wds.worldbank.org/external/default/WDSContentServ
32 9/2/2011
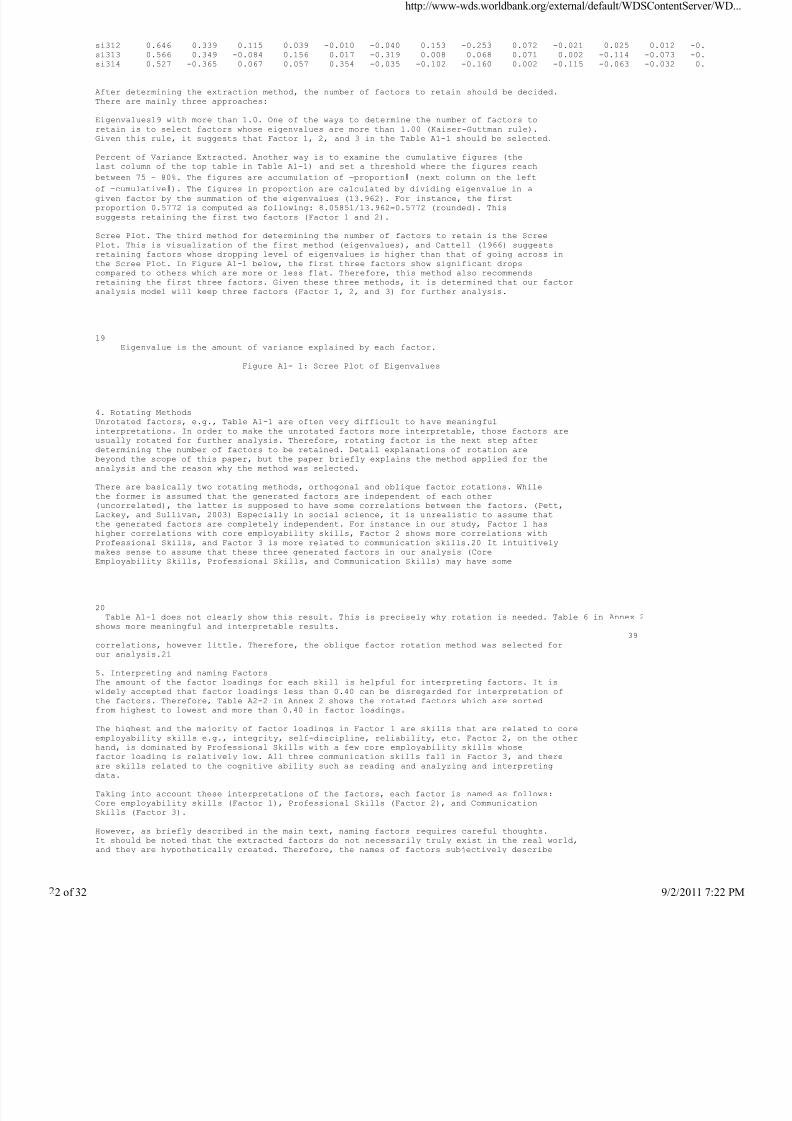
7/27/2019 Skill Set for Engineers
http://slidepdf.com/reader/full/skill-set-for-engineers 22/32
si312 0.646 0.339 0.115 0.039 -0.010 -0.040 0.153 -0.253 0.072 -0.021 0.025 0.012 -0si313 0.566 0.349 -0.084 0.156 0.017 -0.319 0.008 0.068 0.071 0.002 -0.114 -0.073 -0si314 0.527 -0.365 0.067 0.057 0.354 -0.035 -0.102 -0.160 0.002 -0.115 -0.063 -0.032 0
After determining the extraction method, the number of factors to retain should be decided.There are mainly three approaches:
Eigenvalues19 with more than 1.0. One of the ways to determine the number of factors toretain is to select factors whose eigenvalues are more than 1.00 (Kaiser-Guttman rule).Given this rule, it suggests that Factor 1, 2, and 3 in the Table A1-1 should be selected.
Percent of Variance Extracted. Another way is to examine the cumulative figures (thelast column of the top table in Table A1-1) and set a threshold where the figures reach
between 75 – 80%. The figures are accumulation of ―proportion‖ (next column on the left
of ―cumulative‖). The figures in proportion are calculated by dividing eigenvalue in agiven factor by the summation of the eigenvalues (13.962). For instance, the firstproportion 0.5772 is computed as following: 8.05851/13.962=0.5772 (rounded). Thissuggests retaining the first two factors (Factor 1 and 2).
Scree Plot. The third method for determining the number of factors to retain is the ScreePlot. This is visualization of the first method (eigenvalues), and Cattell (1966) suggestsretaining factors whose dropping level of eigenvalues is higher than that of going across inthe Scree Plot. In Figure A1-1 below, the first three factors show significant dropscompared to others which are more or less flat. Therefore, this method also recommendsretaining the first three factors. Given these three methods, it is determined that our factoranalysis model will keep three factors (Factor 1, 2, and 3) for further analysis.
19
Eigenvalue is the amount of variance explained by each factor.
Figure A1- 1: Scree Plot of Eigenvalues
4. Rotating MethodsUnrotated factors, e.g., Table A1-1 are often very difficult to have meaningfulinterpretations. In order to make the unrotated factors more interpretable, those factors areusually rotated for further analysis. Therefore, rotating factor is the next step afterdetermining the number of factors to be retained. Detail explanations of rotation arebeyond the scope of this paper, but the paper briefly explains the method applied for theanalysis and the reason why the method was selected.
There are basically two rotating methods, orthogonal and oblique factor rotations. Whilethe former is assumed that the generated factors are independent of each other(uncorrelated), the latter is supposed to have some correlations between the factors. (Pett,Lackey, and Sullivan, 2003) Especially in social science, it is unrealistic to assume thatthe generated factors are completely independent. For instance in our study, Factor 1 hashigher correlations with core employability skills, Factor 2 shows more correlations withProfessional Skills, and Factor 3 is more related to communication skills.20 It intuitivelymakes sense to assume that these three generated factors in our analysis (CoreEmployability Skills, Professional Skills, and Communication Skills) may have some
20Table A1-1 does not clearly show this result. This is precisely why rotation is needed. Table 6 in Annex 2
shows more meaningful and interpretable results.39
correlations, however little. Therefore, the oblique factor rotation method was selected forour analysis.21
5. Interpreting and naming FactorsThe amount of the factor loadings for each skill is helpful for interpreting factors. It is
widely accepted that factor loadings less than 0.40 can be disregarded for interpretation ofthe factors. Therefore, Table A2-2 in Annex 2 shows the rotated factors which are sortedfrom highest to lowest and more than 0.40 in factor loadings.
The highest and the majority of factor loadings in Factor 1 are skills that are related to coreemployability skills e.g., integrity, self-discipline, reliability, etc. Factor 2, on the otherhand, is dominated by Professional Skills with a few core employability skills whosefactor loading is relatively low. All three communication skills fall in Factor 3, and thereare skills related to the cognitive ability such as reading and analyzing and interpretingdata.
Taking into account these interpretations of the factors, each factor is named as follows:Core employability skills (Factor 1), Professional Skills (Factor 2), and CommunicationSkills (Factor 3).
However, as briefly described in the main text, naming factors requires careful thoughts.It should be noted that the extracted factors do not necessarily truly exist in the real world,and they are hypothetically created. Therefore, the names of factors subjectively describe
http://www-wds.worldbank.org/external/default/WDSContentServ
32 9/2/2011
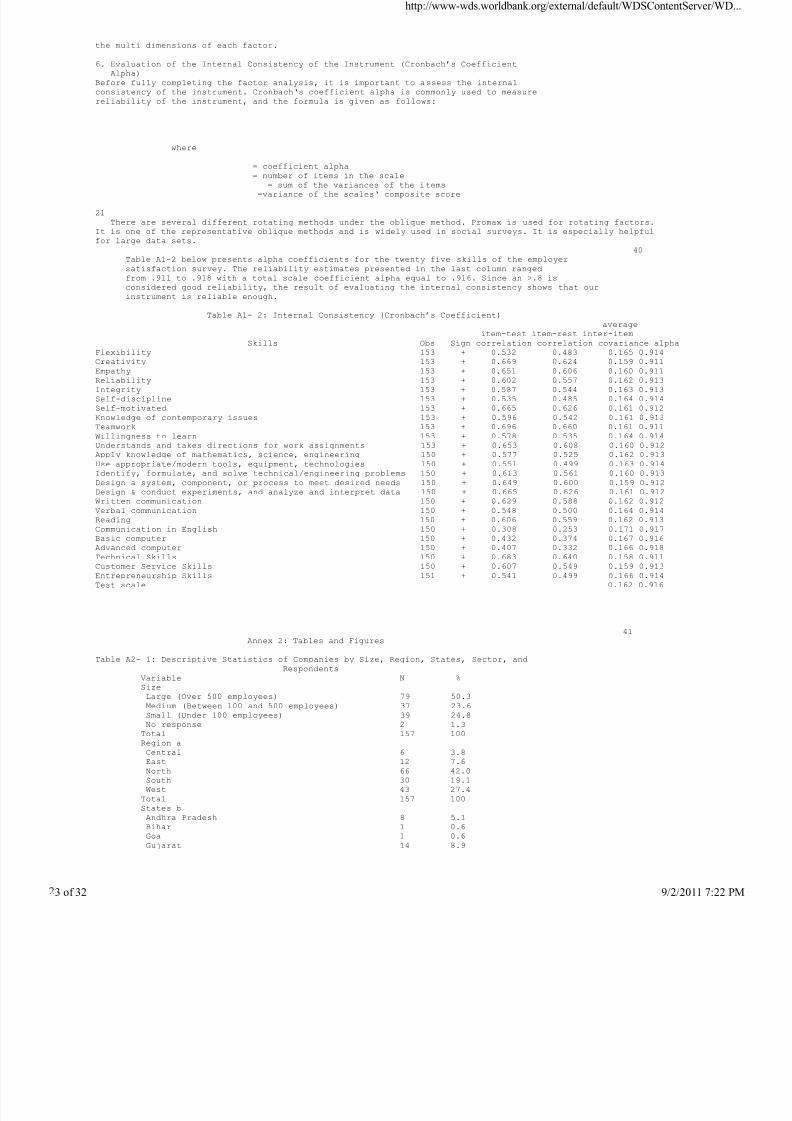
7/27/2019 Skill Set for Engineers
http://slidepdf.com/reader/full/skill-set-for-engineers 23/32
the multi dimensions of each factor.
6. Evaluation of the Internal Consistency of the Instrument (Cronbach’s CoefficientAlpha)
Before fully completing the factor analysis, it is important to assess the internalconsistency of the instrument. Cronbach‘s coefficient alpha is commonly used to measurereliability of the instrument, and the formula is given as follows:
where
= coefficient alpha
= number of items in the scale= sum of the variances of the items
=variance of the scales‘ composite score
21There are several different rotating methods under the oblique method. Promax is used for rotating factors.
It is one of the representative oblique methods and is widely used in social surveys. It is especially helpfulfor large data sets.
40Table A1-2 below presents alpha coefficients for the twenty five skills of the employersatisfaction survey. The reliability estimates presented in the last column rangedfrom .911 to .918 with a total scale coefficient alpha equal to .916. Since an >.8 isconsidered good reliability, the result of evaluating the internal consistency shows that ourinstrument is reliable enough.
Table A1- 2: Internal Consistency (Cronbach’s Coefficient)average
item-test item-rest inter-item
Skills Obs Sign correlation correlation covariance alphaFlexibility 153 + 0.532 0.483 0.165 0.914Creativity 153 + 0.669 0.624 0.159 0.911Empathy 153 + 0.651 0.606 0.160 0.911Reliability 153 + 0.602 0.557 0.162 0.913Integrity 153 + 0.587 0.544 0.163 0.913Self-discipline 153 + 0.535 0.485 0.164 0.914Self-motivated 153 + 0.665 0.626 0.161 0.912Knowledge of contemporary issues 153 + 0.596 0.542 0.161 0.913Teamwork 153 + 0.696 0.660 0.161 0.911Willingness to learn 153 + 0.578 0.535 0.164 0.914Understands and takes directions for work assignments 153 + 0.653 0.608 0.160 0.912Apply knowledge of mathematics, science, engineering 150 + 0.577 0.525 0.162 0.913Use appropriate/modern tools, equipment, technologies 150 + 0.551 0.499 0.163 0.914Identify, formulate, and solve technical/engineering problems 150 + 0.613 0.561 0.160 0.913Design a system, component, or process to meet desired needs 150 + 0.649 0.600 0.159 0.912Design & conduct experiments, and analyze and interpret data 150 + 0.665 0.626 0.161 0.912Written communication 150 + 0.629 0.588 0.162 0.912Verbal communication 150 + 0.548 0.500 0.164 0.914
Reading 150 + 0.606 0.559 0.162 0.913Communication in English 150 + 0.308 0.253 0.171 0.917Basic computer 150 + 0.432 0.374 0.167 0.916Advanced computer 150 + 0.407 0.332 0.166 0.918Technical Skills 150 + 0.683 0.640 0.158 0.911Customer Service Skills 150 + 0.607 0.549 0.159 0.913Entrepreneurship Skills 151 + 0.541 0.499 0.166 0.914Test scale 0.162 0.916
41Annex 2: Tables and Figures
Table A2- 1: Descriptive Statistics of Companies by Size, Region, States, Sector, andRespondents
Variable N %SizeLarge (Over 500 employees) 79 50.3Medium (Between 100 and 500 employees) 37 23.6Small (Under 100 employees) 39 24.8No response 2 1.3
Total 157 100Region aCentral 6 3.8East 12 7.6North 66 42.0South 30 19.1West 43 27.4
Total 157 100States bAndhra Pradesh 8 5.1Bihar 1 0.6Goa 1 0.6Gujarat 14 8.9
http://www-wds.worldbank.org/external/default/WDSContentServ
32 9/2/2011

7/27/2019 Skill Set for Engineers
http://slidepdf.com/reader/full/skill-set-for-engineers 24/32
Haryana 13 8.3Jharkhand 2 1.3Karnataka 11 7.0Maharashtra 29 18.5New Delhi 43 27.4Orissa 1 0.6Rajasthan 3 1.9Tamil Nadu 6 3.8Uttar Pradesh 14 8.9West Bengal 7 4.5No response 4 2.6
Total 157 100SectorAutomobiles 7 4.5
Biotech 4 2.6Cement 1 0.6Food Processing 6 3.8IT 16 10.2Industrial Electronics 6 3.8Infrastructure 11 7.0
42Irrigation, Diary, Fertilizer, Agriculture 2 1.3Oil & Gas 7 4.5Other 53 33.8Paper 3 1.9Pharmaceutical 3 1.9Power 20 12.7Real Estate 2 1.3Refinery, Chemicals 6 3.8Steel 5 3.2Telecom 3 1.9
Textile 2 1.3Total 157 100Firm Established with Foreign CapitalYes 31 19.8No 112 71.3Don‘t know 10 6.4No response 4 2.6Total 157 100
RespondentsBoard Member 5 3.2Business owner/partner 23 14.6Colleagues of graduate‘s department 1 0.6GM - communications 2 1.3Head/Manager of Human Resource departme 79 50.3Manger of graduate`s department 28 17.8President/V. President/Executives 13 8.3Other 2 1.3No response 4 2.5
Total 157 100a. Regions where headquarters locateb. States where headquarters locate
43Table A2- 2: Factor Pattern Matrix for Skills
CoreProfession Communic
Employabi 22Skills al Skills ation Uniqueness
lity Skills(Factor 2) (Factor 3)
(Factor 1)Integrity 0.83 0.38Self-discipline 0.78 0.45Reliability 0.76 0.44Self-motivated 0.74 0.42Entrepreneurship Skills 0.65 0.58Teamwork 0.63 0.45Understands and takes directions for work assignments 0.59 0.54Willingness to learn 0.58 0.61Flexibility 0.49 0.65Empathy 0.33 0.59Identify, formulate, and solve technical/engineering problems 0.80 0.43Design a system, component, or process to meet desired needs 0.77 0.37Use appropriate/modern tools, equipment, technologies 0.73 0.52Apply knowledge of mathematics, science, engineering 0.67 0.55Customer Service Skills 0.51 0.55Knowledge of contemporary issues 0.45 0.57Creativity 0.42 0.50Written communication 0.74 0.40Design & conduct experiments, and analyze and interpret data 0.73 0.38Reading 0.72 0.44
http://www-wds.worldbank.org/external/default/WDSContentServ
32 9/2/2011
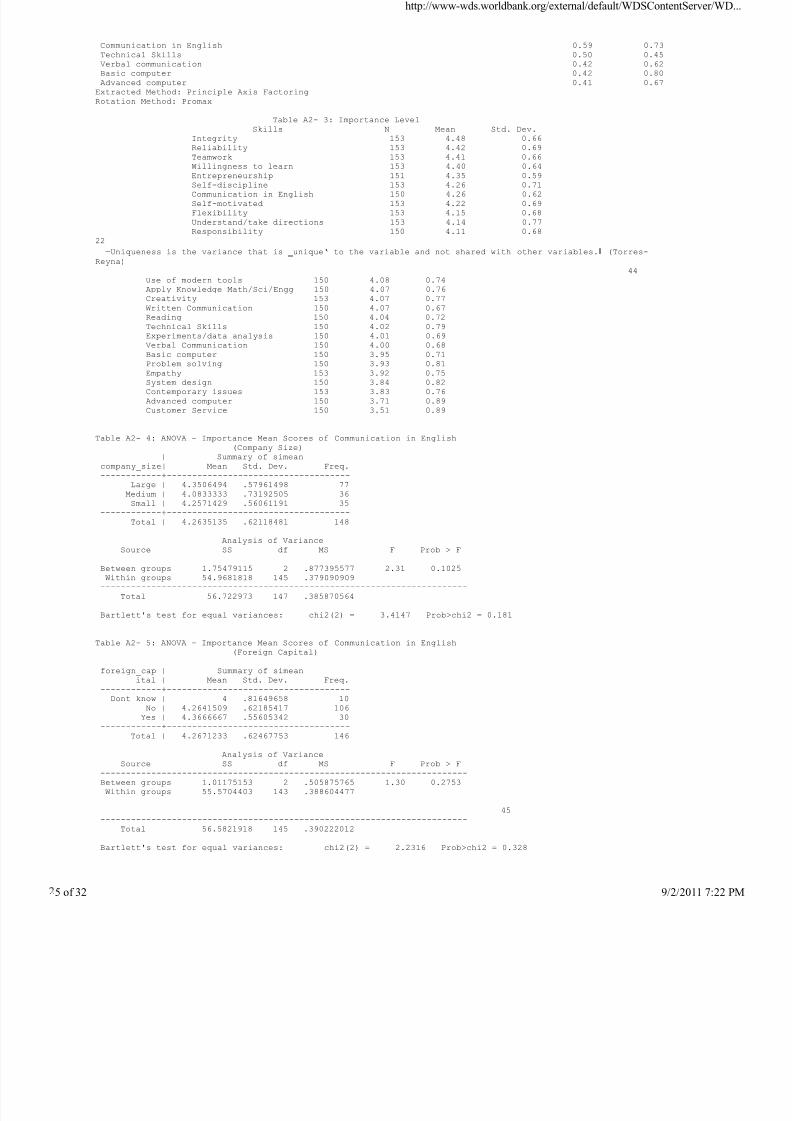
7/27/2019 Skill Set for Engineers
http://slidepdf.com/reader/full/skill-set-for-engineers 25/32
Communication in English 0.59 0.73Technical Skills 0.50 0.45Verbal communication 0.42 0.62Basic computer 0.42 0.80Advanced computer 0.41 0.67
Extracted Method: Principle Axis FactoringRotation Method: Promax
Table A2- 3: Importance LevelSkills N Mean Std. Dev.
Integrity 153 4.48 0.66Reliability 153 4.42 0.69Teamwork 153 4.41 0.66Willingness to learn 153 4.40 0.64
Entrepreneurship 151 4.35 0.59Self-discipline 153 4.26 0.71Communication in English 150 4.26 0.62Self-motivated 153 4.22 0.69Flexibility 153 4.15 0.68Understand/take directions 153 4.14 0.77Responsibility 150 4.11 0.68
22
―Uniqueness is the variance that is ‗ unique‘ to the variable and not shared with other variables.‖ (Torres-Reyna)
44Use of modern tools 150 4.08 0.74Apply Knowledge Math/Sci/Engg 150 4.07 0.76Creativity 153 4.07 0.77Written Communication 150 4.07 0.67Reading 150 4.04 0.72Technical Skills 150 4.02 0.79Experiments/data analysis 150 4.01 0.69
Verbal Communication 150 4.00 0.68Basic computer 150 3.95 0.71Problem solving 150 3.93 0.81Empathy 153 3.92 0.75System design 150 3.84 0.82Contemporary issues 153 3.83 0.76Advanced computer 150 3.71 0.89Customer Service 150 3.51 0.89
Table A2- 4: ANOVA – Importance Mean Scores of Communication in English(Company Size)
| Summary of simeancompany_size| Mean Std. Dev. Freq.------------+------------------------------------
Large | 4.3506494 .57961498 77Medium | 4.0833333 .73192505 36Small | 4.2571429 .56061191 35
------------+------------------------------------
Total | 4.2635135 .62118481 148
Analysis of VarianceSource SS df MS F Prob > F
------------------------------------------------------------------------Between groups 1.75479115 2 .877395577 2.31 0.1025Within groups 54.9681818 145 .379090909------------------------------------------------------------------------
Total 56.722973 147 .385870564
Bartlett's test for equal variances: chi2(2) = 3.4147 Prob>chi2 = 0.181
Table A2- 5: ANOVA – Importance Mean Scores of Communication in English(Foreign Capital)
foreign_cap | Summary of simeanital | Mean Std. Dev. Freq.
------------+------------------------------------Dont know | 4 .81649658 10No | 4.2641509 .62185417 106
Yes | 4.3666667 .55605342 30------------+------------------------------------
Total | 4.2671233 .62467753 146
Analysis of VarianceSource SS df MS F Prob > F
------------------------------------------------------------------------Between groups 1.01175153 2 .505875765 1.30 0.2753Within groups 55.5704403 143 .388604477
45------------------------------------------------------------------------
Total 56.5821918 145 .390222012
Bartlett's test for equal variances: chi2(2) = 2.2316 Prob>chi2 = 0.328
http://www-wds.worldbank.org/external/default/WDSContentServ
32 9/2/2011
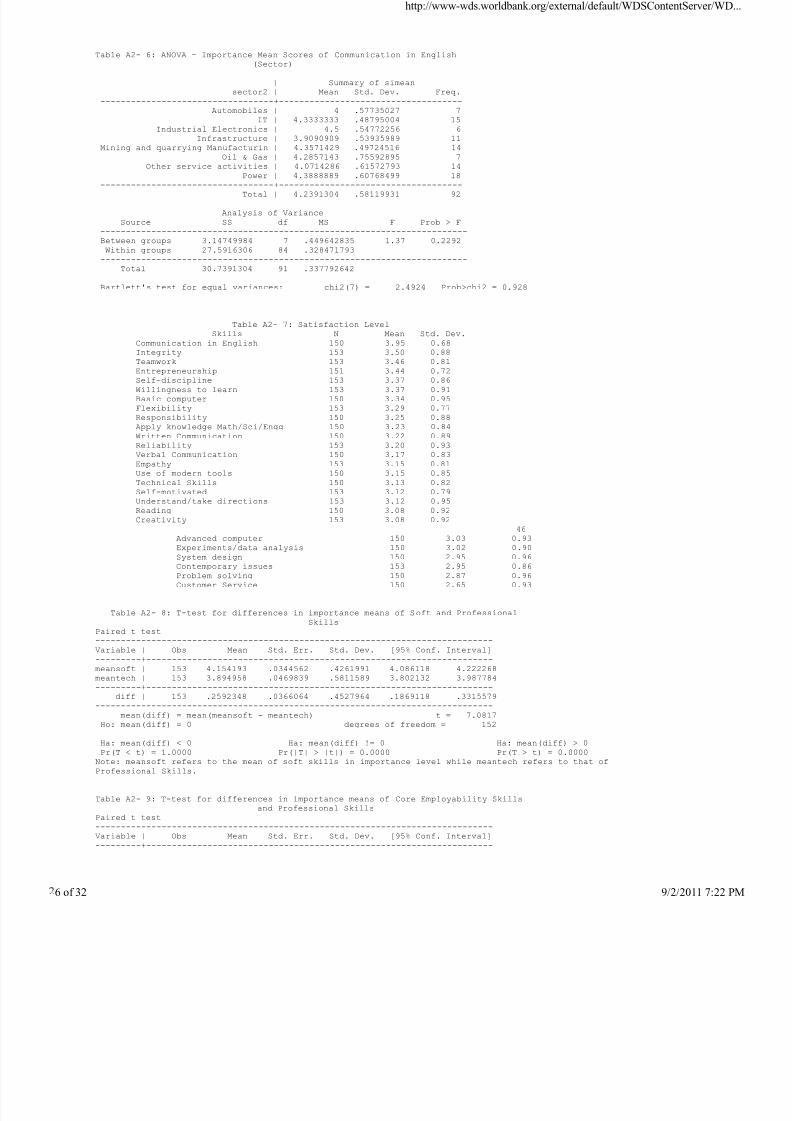
7/27/2019 Skill Set for Engineers
http://slidepdf.com/reader/full/skill-set-for-engineers 26/32
Table A2- 6: ANOVA – Importance Mean Scores of Communication in English(Sector)
| Summary of simeansector2 | Mean Std. Dev. Freq.
----------------------------------+------------------------------------Automobiles | 4 .57735027 7
IT | 4.3333333 .48795004 15Industrial Electronics | 4.5 .54772256 6
Infrastructure | 3.9090909 .53935989 11Mining and quarrying Manufacturin | 4.3571429 .49724516 14
Oil & Gas | 4.2857143 .75592895 7Other service activities | 4.0714286 .61572793 14
Power | 4.3888889 .60768499 18----------------------------------+------------------------------------
Total | 4.2391304 .58119931 92
Analysis of VarianceSource SS df MS F Prob > F
------------------------------------------------------------------------Between groups 3.14749984 7 .449642835 1.37 0.2292Within groups 27.5916306 84 .328471793------------------------------------------------------------------------
Total 30.7391304 91 .337792642
Bartlett's test for equal variances: chi2(7) = 2.4924 Prob>chi2 = 0.928
Table A2- 7: Satisfaction LevelSkills N Mean Std. Dev.
Communication in English 150 3.95 0.68Integrity 153 3.50 0.88Teamwork 153 3.46 0.81Entrepreneurship 151 3.44 0.72Self-discipline 153 3.37 0.86Willingness to learn 153 3.37 0.91Basic computer 150 3.34 0.95Flexibility 153 3.29 0.77Responsibility 150 3.25 0.88Apply knowledge Math/Sci/Engg 150 3.23 0.84Written Communication 150 3.22 0.89Reliability 153 3.20 0.93Verbal Communication 150 3.17 0.83Empathy 153 3.15 0.81Use of modern tools 150 3.15 0.85Technical Skills 150 3.13 0.82Self-motivated 153 3.12 0.79Understand/take directions 153 3.12 0.95Reading 150 3.08 0.92
Creativity 153 3.08 0.9246
Advanced computer 150 3.03 0.93Experiments/data analysis 150 3.02 0.90System design 150 2.95 0.96Contemporary issues 153 2.95 0.86Problem solving 150 2.87 0.96Customer Service 150 2.65 0.93
Table A2- 8: T-test for differences in importance means of Soft and ProfessionalSkills
Paired t test------------------------------------------------------------------------------Variable | Obs Mean Std. Err. Std. Dev. [95% Conf. Interval]---------+--------------------------------------------------------------------meansoft | 153 4.154193 .0344562 .4261991 4.086118 4.222268meantech | 153 3.894958 .0469839 .5811589 3.802132 3.987784---------+--------------------------------------------------------------------
diff | 153 .2592348 .0366064 .4527964 .1869118 .3315579------------------------------------------------------------------------------
mean(diff) = mean(meansoft - meantech) t = 7.0817Ho: mean(diff) = 0 degrees of freedom = 152
Ha: mean(diff) < 0 Ha: mean(diff) != 0 Ha: mean(diff) > 0Pr(T < t) = 1.0000 Pr(|T| > |t|) = 0.0000 Pr(T > t) = 0.0000
Note: meansoft refers to the mean of soft skills in importance level while meantech refers to that ofProfessional Skills.
Table A2- 9: T-test for differences in importance means of Core Employability Skillsand Professional Skills
Paired t test------------------------------------------------------------------------------Variable | Obs Mean Std. Err. Std. Dev. [95% Conf. Interval]---------+--------------------------------------------------------------------
http://www-wds.worldbank.org/external/default/WDSContentServ
32 9/2/2011

7/27/2019 Skill Set for Engineers
http://slidepdf.com/reader/full/skill-set-for-engineers 27/32
meancore | 153 4.274437 .0398547 .4929755 4.195696 4.353178meantech | 153 3.894958 .0469839 .5811589 3.802132 3.987784---------+--------------------------------------------------------------------
diff | 153 .3794792 .0423813 .5242274 .2957468 .4632116------------------------------------------------------------------------------
mean(diff) = mean(meancore - meantech1) t = 8.9539Ho: mean(diff) = 0 degrees of freedom = 152
Ha: mean(diff) < 0 Ha: mean(diff) != 0 Ha: mean(diff) > 0Pr(T < t) = 1.0000 Pr(|T| > |t|) = 0.0000 Pr(T > t) = 0.0000
Note: meancore refers to the mean of Core Employability Skills in importance level while meantech refers tothat of Professional Skills.
Table A2- 10: T-test for differences in importance means of Communication andProfessional Skills
Paired t test------------------------------------------------------------------------------Variable | Obs Mean Std. Err. Std. Dev. [95% Conf. Interval]---------+--------------------------------------------------------------------meancomm | 150 4.0075 .0394174 .4827629 3.929611 4.085389
47meantech | 150 3.909524 .0466064 .570809 3.817429 4.001619---------+--------------------------------------------------------------------
diff | 150 .0979762 .0396727 .485889 .0195825 .1763699------------------------------------------------------------------------------
mean(diff) = mean(meancomm - meantech1) t = 2.4696Ho: mean(diff) = 0 degrees of freedom = 149
Ha: mean(diff) < 0 Ha: mean(diff) != 0 Ha: mean(diff) > 0Pr(T < t) = 0.9927 Pr(|T| > |t|) = 0.0147 Pr(T > t) = 0.0073
Note: meancomm refers to the mean of Communication in importance level while meantech refers to that ofProfessional Skills.
Table A2- 11: T-test for differences in satisfaction means of Soft and ProfessionalSkills
Paired t test------------------------------------------------------------------------------Variable | Obs Mean Std. Err. Std. Dev. [95% Conf. Interval]---------+--------------------------------------------------------------------meansoft | 153 3.271729 .046479 .574914 3.1799 3.363557meantech | 153 2.980859 .057682 .7134867 2.866897 3.094821---------+--------------------------------------------------------------------
diff | 153 .2908698 .0299241 .3701408 .2317489 .3499907------------------------------------------------------------------------------
mean(diff) = mean(meansoft - meantech) t = 9.7202Ho: mean(diff) = 0 degrees of freedom = 152
Ha: mean(diff) < 0 Ha: mean(diff) != 0 Ha: mean(diff) > 0Pr(T < t) = 1.0000 Pr(|T| > |t|) = 0.0000 Pr(T > t) = 0.0000
Note: meansoft refers to the mean of soft skills in satisfaction level while meantech refers to that ofProfessional Skills.
Table A2- 12: T-test for differences in satisfaction means of Core EmployabilitySkills and Professional Skills
Paired t test------------------------------------------------------------------------------Variable | Obs Mean Std. Err. Std. Dev. [95% Conf. Interval]---------+--------------------------------------------------------------------meancore | 153 3.301017 .0495818 .6132927 3.203058 3.398975meantech | 153 2.980859 .057682 .7134867 2.866897 3.094821---------+--------------------------------------------------------------------
diff | 153 .3201577 .0331495 .410037 .2546644 .385651------------------------------------------------------------------------------
mean(diff) = mean(meancore - meantech) t = 9.6580Ho: mean(diff) = 0 degrees of freedom = 152
Ha: mean(diff) < 0 Ha: mean(diff) != 0 Ha: mean(diff) > 0Pr(T < t) = 1.0000 Pr(|T| > |t|) = 0.0000 Pr(T > t) = 0.0000
Note: meancore refers to the mean of Core Employability Skills in satisfaction level while meantech refers tothat of Professional Skills
Table A2- 13: T-test for differences in importance means of Communication andProfessional Skills
Paired t test------------------------------------------------------------------------------
48Variable | Obs Mean Std. Err. Std. Dev. [95% Conf. Interval]---------+--------------------------------------------------------------------meancomm | 150 3.241667 .0506069 .619805 3.141667 3.341667meantech | 150 2.98381 .0583687 .7148678 2.868472 3.099147
http://www-wds.worldbank.org/external/default/WDSContentServ
32 9/2/2011
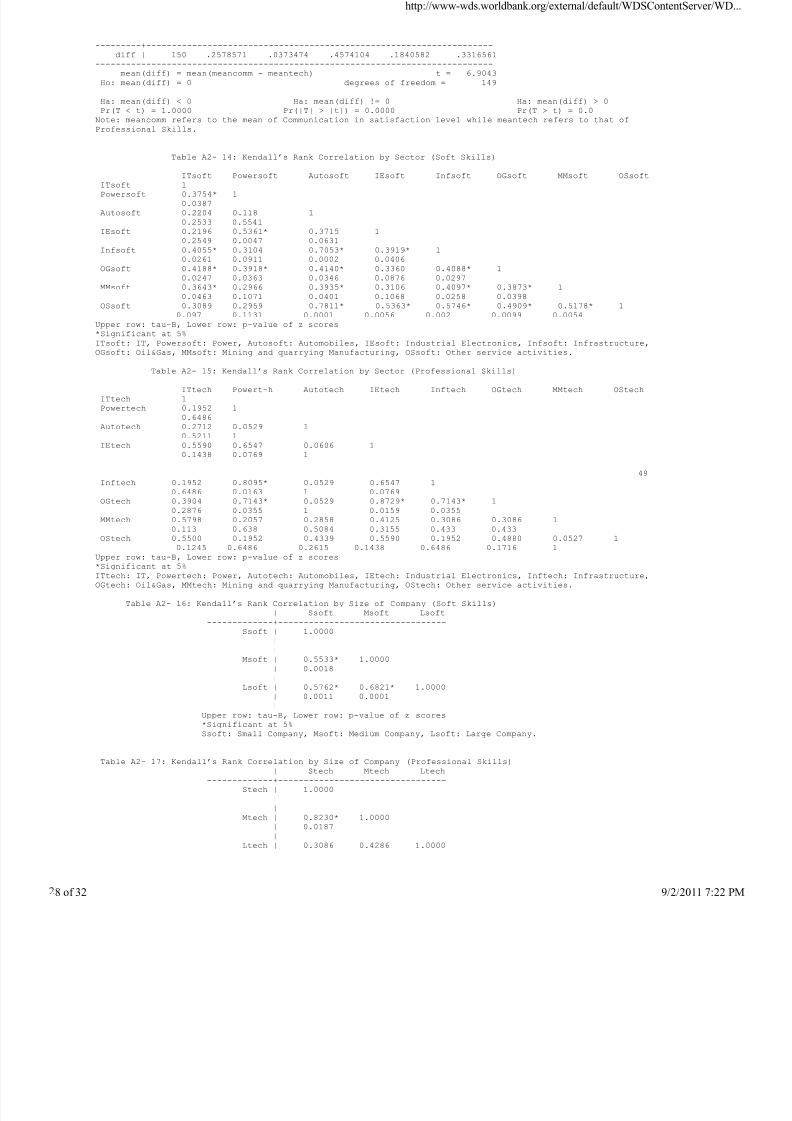
7/27/2019 Skill Set for Engineers
http://slidepdf.com/reader/full/skill-set-for-engineers 28/32
---------+--------------------------------------------------------------------diff | 150 .2578571 .0373474 .4574104 .1840582 .3316561
------------------------------------------------------------------------------mean(diff) = mean(meancomm - meantech) t = 6.9043
Ho: mean(diff) = 0 degrees of freedom = 149
Ha: mean(diff) < 0 Ha: mean(diff) != 0 Ha: mean(diff) > 0Pr(T < t) = 1.0000 Pr(|T| > |t|) = 0.0000 Pr(T > t) = 0.0
Note: meancomm refers to the mean of Communication in satisfaction level while meantech refers to that ofProfessional Skills.
Table A2- 14: Kendall’s Rank Correlation by Sector (Soft Skills)
ITsoft Powersoft Autosoft IEsoft Infsoft OGsoft MMsoft OSsoftITsoft 1Powersoft 0.3754* 1
0.0387Autosoft 0.2204 0.118 1
0.2533 0.5541IEsoft 0.2196 0.5361* 0.3715 1
0.2549 0.0047 0.0631Infsoft 0.4055* 0.3104 0.7053* 0.3919* 1
0.0261 0.0911 0.0002 0.0406OGsoft 0.4188* 0.3918* 0.4140* 0.3360 0.4088* 1
0.0247 0.0363 0.0346 0.0876 0.0297MMsoft 0.3643* 0.2966 0.3935* 0.3106 0.4097* 0.3873* 1
0.0463 0.1071 0.0401 0.1068 0.0258 0.0398OSsoft 0.3089 0.2959 0.7811* 0.5363* 0.5746* 0.4909* 0.5178* 1
0.097 0.1131 0.0001 0.0056 0.002 0.0099 0.0054Upper row: tau-B, Lower row: p-value of z scores*Significant at 5%
ITsoft: IT, Powersoft: Power, Autosoft: Automobiles, IEsoft: Industrial Electronics, Infsoft: Infrastructure,OGsoft: Oil&Gas, MMsoft: Mining and quarrying Manufacturing, OSsoft: Other service activities.
Table A2- 15: Kendall’s Rank Correlation by Sector (Professional Skills)
ITtech Powert~h Autotech IEtech Inftech OGtech MMtech OStechITtech 1Powertech 0.1952 1
0.6486Autotech 0.2712 0.0529 1
0.5211 1IEtech 0.5590 0.6547 0.0606 1
0.1438 0.0769 1
49Inftech 0.1952 0.8095* 0.0529 0.6547 1
0.6486 0.0163 1 0.0769OGtech 0.3904 0.7143* 0.0529 0.8729* 0.7143* 1
0.2876 0.0355 1 0.0159 0.0355
MMtech 0.5798 0.2057 0.2858 0.4125 0.3086 0.3086 10.113 0.638 0.5084 0.3155 0.433 0.433
OStech 0.5500 0.1952 0.4339 0.5590 0.1952 0.4880 0.0527 10.1245 0.6486 0.2615 0.1438 0.6486 0.1716 1
Upper row: tau-B, Lower row: p-value of z scores*Significant at 5%ITtech: IT, Powertech: Power, Autotech: Automobiles, IEtech: Industrial Electronics, Inftech: Infrastructure,OGtech: Oil&Gas, MMtech: Mining and quarrying Manufacturing, OStech: Other service activities.
Table A2- 16: Kendall’s Rank Correlation by Size of Company (Soft Skills)| Ssoft Msoft Lsoft
-------------+---------------------------------Ssoft | 1.0000
||
Msoft | 0.5533* 1.0000| 0.0018|
Lsoft | 0.5762* 0.6821* 1.0000| 0.0011 0.0001|
Upper row: tau-B, Lower row: p-value of z scores*Significant at 5%Ssoft: Small Company, Msoft: Medium Company, Lsoft: Large Company.
Table A2- 17: Kendall’s Rank Correlation by Size of Company (Professional Skills)| Stech Mtech Ltech
-------------+---------------------------------Stech | 1.0000
||
Mtech | 0.8230* 1.0000| 0.0187|
Ltech | 0.3086 0.4286 1.0000
http://www-wds.worldbank.org/external/default/WDSContentServ
32 9/2/2011
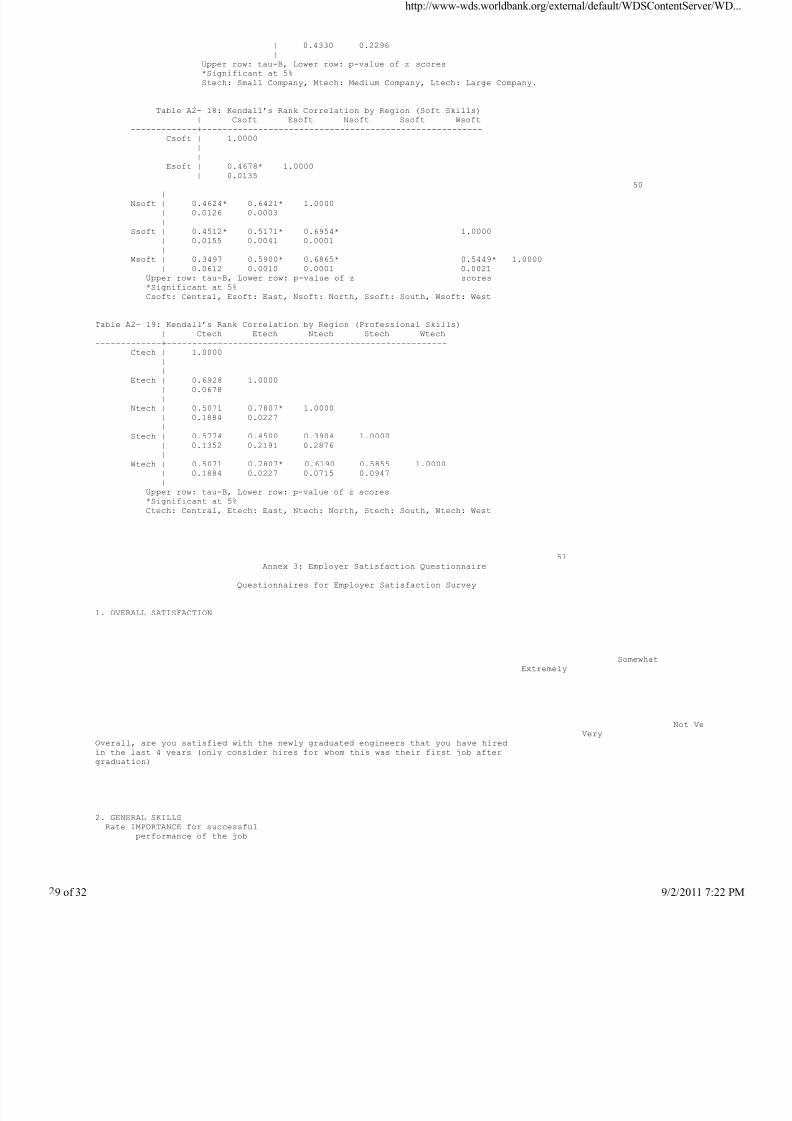
7/27/2019 Skill Set for Engineers
http://slidepdf.com/reader/full/skill-set-for-engineers 29/32
| 0.4330 0.2296|
Upper row: tau-B, Lower row: p-value of z scores*Significant at 5%Stech: Small Company, Mtech: Medium Company, Ltech: Large Company.
Table A2- 18: Kendall’s Rank Correlation by Region (Soft Skills)| Csoft Esoft Nsoft Ssoft Wsoft
-------------+-------------------------------------------------------Csoft | 1.0000
||
Esoft | 0.4678* 1.0000
| 0.013550
|Nsoft | 0.4624* 0.6421* 1.0000
| 0.0126 0.0003|
Ssoft | 0.4512* 0.5171* 0.6954* 1.0000| 0.0155 0.0041 0.0001|
Wsoft | 0.3497 0.5900* 0.6865* 0.5449* 1.0000| 0.0612 0.0010 0.0001 0.0021
Upper row: tau-B, Lower row: p-value of z scores*Significant at 5%Csoft: Central, Esoft: East, Nsoft: North, Ssoft: South, Wsoft: West
Table A2- 19: Kendall’s Rank Correlation by Region (Professional Skills)| Ctech Etech Ntech Stech Wtech
-------------+-------------------------------------------------------Ctech | 1.0000||
Etech | 0.6928 1.0000| 0.0678|
Ntech | 0.5071 0.7807* 1.0000| 0.1884 0.0227|
Stech | 0.5774 0.4500 0.3904 1.0000| 0.1352 0.2191 0.2876|
Wtech | 0.5071 0.7807* 0.6190 0.5855 1.0000| 0.1884 0.0227 0.0715 0.0947|
Upper row: tau-B, Lower row: p-value of z scores*Significant at 5%Ctech: Central, Etech: East, Ntech: North, Stech: South, Wtech: West
51Annex 3: Employer Satisfaction Questionnaire
Questionnaires for Employer Satisfaction Survey
1. OVERALL SATISFACTION
SomewhatExtremely
Not V
VeryOverall, are you satisfied with the newly graduated engineers that you have hiredin the last 4 years (only consider hires for whom this was their first job aftergraduation)
2. GENERAL SKILLS
Rate IMPORTANCE for successfulperformance of the job
http://www-wds.worldbank.org/external/default/WDSContentServ
32 9/2/2011

7/27/2019 Skill Set for Engineers
http://slidepdf.com/reader/full/skill-set-for-engineers 30/32
Somewhat
Extremely
CRITERIA
Not at all
Not Very
Very
Flexibility
(responds well to change)Creativity
(identifies new approaches to problems)Empathy
(understands the situations, feelings, or motives of othersReliability
(can be depended on to complete work assignments)Integrity
(understands/applies professional and ethical principles to deciSelf-discipline
(exhibits control of personal behavior)Self-motivated
Knowledge of contemporary issues
Teamwork(interpersonal relationships)
Willingness to learn(Life-long learning)
Understands and takes directions for work assignments
Accepts responsibility for consequences of actions
COMMENTS
3. SPECIFIC SKILLS
Rate IMPORTANCE for successfulperformance of the job
CRITERIASomewhat
Extremely
Not at all
http://www-wds.worldbank.org/external/default/WDSContentServ
32 9/2/2011

7/27/2019 Skill Set for Engineers
http://slidepdf.com/reader/full/skill-set-for-engineers 31/32
Not Very
Very
Ability to apply knowledge of mathematics, science, engineeringAbility to use appropriate and modern tools, equipment, and
technologies specific to their jobs(other than computers)
Ability to identify, formulate, and solve technical/engineerinproblems
Ability to design a system, component, or process to meetdesired needs
Ability to design and conduct experiments, as well as to analyzeand interpret data
Written communication
Verbal communication
Reading
Communication in EnglishBasic computer
(e.g., word-processing)Advanced computer(e.g., spreadsheets, databases)
Technical Skills(e.g., programming)
Customer Service Skills
Entrepreneurship Skills
COMMENTS
4. CHARACTERISTIC OF EMPLOYERA. What is the legal status of the firm? B. Was your firm established with C. What is the approximate size of
participation of foreign capital? company?1. Joint Stock Company2. Joint stock company with state 1. Yes 1. Large (over 500 employees)
participation 2. No 2. Medium (between 100 and 500 empl
3. Corporation represented in stock 3. Don’t know 3. Small (under 100 employees)exchange
4. Limited liability partnership LLP5. Production Cooperative6. Private entrepreneur/family business7. State enterprise (various types)8. Other (Specify)
E. What is your job title? F. How many employees were hired
1. Board member2. Manger of graduate’s department3. Supervisor of graduate’s department4. Colleagues of graduate’s department5. Head/Manager of Human Resource department6. Business owner/partner7. Other (please specify)
G. Please specify the major economic activity of your firm11. Real estate activities
1. Agriculture, forestry and fishing 12. Professional, scientific and te2. Mining and quarrying Manufacturing 13. Administrative and support serv3. Electricity, gas, steam and air conditioning supply 14. Public administration and defen4. Water supply; sewerage, waste management and remediation activities 15. Education5. Construction 16. Human health and social work ac6. Wholesale and retail trade; repair of motor vehicles and motorcycles 17. Arts, entertainment and recreat7. Transportation and storage 18. Other service activities8. Accommodation and food service activities 19. Activities of households as emp9. Information and communication producing activities of househo10. Financial and insurance activities 20. Activities of extraterritorial
http://www-wds.worldbank.org/external/default/WDSContentServ
32 9/2/2011

7/27/2019 Skill Set for Engineers
http://slidepdf.com/reader/full/skill-set-for-engineers 32/32
H. Which sector does your company belong to J. Which region does your company fall in
1. Oil & Gas 1. East2. Power 2. West3. Automobiles 3. Central4. Steel 4. North5. Pharma 5. South6. Industrial Electronics7. IT8. Infrastructure
9. Food Processing10. Cement11. Biotech12. Paper13. Real Estate14. Telecom15. Irrigation, Dairy16. Refinery, Chemicals17. Other
I. What is the annual turnover of your company in Rs crores?
1. Less than 100 cr2. Between 100-500 cr3. 500-1000 cr
56 | P a g eAnnex 4. TEQIP Institutions as Leaders in Technical Education
Some of the survey results may look gloomy. However, reforms and investment into quality,learning outcomes, and employability have been implemented successfully at the state andinstitutional level. One such example is the Technical Education Quality ImprovementProgram (TEQIP). This employer survey was conducted as part of the preparation process forthe second phase of TEQIP (TEQIP-II). The authors of this Working Paper are the TaskTeam Leader and a team member of TEQIP-II.TEQIP is a national program of the Government of India (GoI) with co-financing from theWorld Bank and a key part of the 11th Five-Year Plan of the GoI. It envisages a long-term(about 10-12 years) development of the technical education in the country and implements inthree phases for transformation of the technical education system.To spearhead a set of reforms and investments, Government of India competitively selected127 promising institutions as future leaders of the technical/engineering sector in the country,in addition to India Institutes of Technology. This first phase of TEQIP was successfullycompleted in 2009 with strong results in improved employability of students and quality ofeducation:a) More than 40 of the supported institution gained academic autonomy which allowed them
to continuously improve curriculum, teaching and assessment according to demand forskills and newest research,
b) Campus placement rates nearly doubled for undergraduate students from 41% to76% andmore than doubled from 25% to 56% for post-graduate students,
c) Course offerings were restructured, modernized and vastly expanded in line withemployer expectations.
d) Ninety-three percent of 811 Bachelor courses were accredited or in the process ofaccreditation
e) 220,000 students from disadvantaged backgrounds were assisted through provision of
remedial teaching, workshops and establishment of ―book banks.‖f) Enrolment in Master and PhD programs increased 50% and 69% respectively from 2002,g) 30,000 faculty and 13,000 staff underwent training and professional development.h) Professional publications increased from 3,800 to 6,328 per year,i) Patents obtained and applied for increased from 22 to 34 per year, and 86 per year,j) More than 1,887 programs were conducted to support the local community and workers
benefitting nearly 180,000 people and transferring 1,228 technologies to the community.Given the success, a second phase of TEQIP was launched in 2010 to scale-up reforms andinvestments. About 120 new institutions to the program will be competitively selected to
improve learning outcomes and employability of graduates taking into account the findings ofthis paper as well as feedback from local employers and strategic institutional developmentplans. Further, approximately 80 institutions will be competitively selected to scale-up post-graduate education and improving research, development, and innovation.
57 | P a g eWhen implemented broadly and consistently across the country, the above reforms and othergovernment initiatives will improve upon the skills gaps identified in this employer survey.Further, the TEQIP program will continue to monitor employer satisfaction in order to trackemployer satisfaction and ensure feedback into the engineering education system.
http://www-wds.worldbank.org/external/default/WDSContentServ