Skanska Q4 2011 FINAL EN · Skanska Year-end Report, January−December 2011 3/22 Order bookings...
22
Skanska AB Mail SE-169 83 Solna, Sweden Street Råsundavägen 2 Phone +46 10 448 8900 Fax +46 8 755 12 56 PRESS RELEASE February 8, 2012 8:00 a.m. CET Website www.skanska.com Reg. office Solna Corp. ID no. 556000-4615 Public company (publ) 1/22 Year-end Report, January-December 2011 Group highlights according to segment reporting Jan-Dec Jan-Dec Oct-Dec Oct-Dec SEK M 2 0 11 2 0 10 2011 2010 Revenue 122,534 121,663 36,559 32,665 of which revenue from divestments of properties in Commercial Property Development 5,025 3,942 3,001 320 Operating income 9,087 5,339 1,333 1,269 of which gains from divestments of properties in Commercial Property Development 1,402 871 773 84 Income after financial items 9,099 5,304 1,329 1,250 Profit for the period 8,129 3,940 1,046 980 Earnings for the period per share, SEK 1 19.72 9.54 2.53 2.37 Earnings for the period per share according to IFRSs, SEK 1 18.43 9.76 2.65 3.06 Return on equity according to segment reporting, % 41.5 21.1 Operating cash flow before taxes, financing operations and dividends 2,916 6,270 1,476 4,567 Interest-bearing net receivables 2, 3 2,929 9,914 Order bookings, SEK bn 4 123.6 130.3 41.0 29.0 Order backlog, SEK bn 2, 4 155.7 145.9 1 Earnings for the period attributable to equity holders divided by the average number of shares outstanding after repurchases and conversion 2 Refers to the end of each period 3 Excluding construction loans to cooperative housing associations and net interest-bearing pension liabilities and provisions amounted to SEK bn 9.5 12.2 4 Refers to Construction January-December 2011 compared to January-December 2010 Order bookings totaled SEK 123.6 (130.3) billion. Order bookings in the fourth quarter totaled SEK 41.0 (29.0) billion, an increase of 41 percent compared to the fourth quarter of 2010. Order bookings were 7 percent higher than revenue during the year. Order backlog increased 7 percent and amounted to SEK 155.7 (145.9) billion. This was equivalent to 16 (16) months of construction. Revenue amounted to SEK 122.5 (121.7) billion. Revenue in Construction amounted to SEK 115.0 (113,2) billion, an increase of 2 percent and an increase of 8 percent adjusted for currency rate effects. Operating income for the Group amounted to SEK 9,087 M (5,339). Currency rate effects reduced income by SEK 249 M. Operating income in Construction totaled SEK 3,467 M (4,388). Operating margin amounted to 3.0 (3.9) percent. Currency rate effects reduced income by SEK 255 M. Income after financial items amounted to SEK 9,099 M (5,304). Profit for the year totaled SEK 8,129 M (3,940). Earnings per share totaled SEK 19.72 (9.54) according to segment reporting and SEK 18.43 (9.76) according to IFRSs. Operating cash flow before taxes, financial activities and dividends amounted to SEK 2,916 M (6,270). Interest-bearing net cash position excluding construction loans to cooperative housing associations and interest-bearing pension liabilities totaled SEK 9.5 (12.2) billion. The Board of Directors proposes a regular dividend of SEK 6.00 (5.75) per share. For further information, please contact: Peter Wallin, Executive Vice President and CFO, Skanska AB, tel +46 10 448 1120 Pontus Winqvist, Senior Vice President, Investor Relations, Skanska AB, tel +46 10 448 8851 Katarina Grönwall, Senior Vice President, Communications, Skanska AB, tel +46 10 448 8877 Edvard Lind, Group Press Officer, Skanska AB, tel +46 10 448 8808 This report will also be presented at a press and telephone conference at 2:00 p.m. (14:00) CET on February 8 at the Scandic Anglais Hotel, Humlegårdsgatan 23, Stockholm, Sweden. The press and telephone conference will be webcast live at www.skanska.com/investors , where a video of the conference will be available later as well. To participate in the telephone conference, please dial +46 8 505 598 53, +44 203 043 2436, or +1 866 458 4087. This and previous releases can also be found at www.skanska.com/investors . Skanska AB may be required to disclose the information provided herein pursuant to the Securities Market Act.
Transcript of Skanska Q4 2011 FINAL EN · Skanska Year-end Report, January−December 2011 3/22 Order bookings...

Skanska AB
Mail SE-169 83 Solna, Sweden Street Råsundavägen 2 Phone +46 10 448 8900 Fax +46 8 755 12 56
PRESS RELEASE February 8, 2012
8:00 a.m. CET
Website www.skanska.com Reg. office Solna Corp. ID no. 556000-4615 Public company (publ)
1/22
Year-end Report, January−December 2011
Group highlights according to segment reporting Jan-D ec Jan-D ec Oct-D ec Oct -D ec
SE K M 2011 2010 2011 2010
Revenue 122,534 121,663 36,559 32,665
of which revenue from divestments of properties
in Commercial Property Development 5,025 3,942 3,001 320
Operating income 9,087 5,339 1,333 1,269
of which gains from divestments of properties
in Commercial Property Development 1,402 871 773 84
Income af ter financial items 9,099 5,304 1,329 1,250
Profit for the period 8,129 3,940 1,046 980
Earnings for the period per share, SEK 1 19.72 9.54 2.53 2.37
Earnings for the period per share according to IFRSs, SEK 1 18.43 9.76 2.65 3.06
Return on equity according to segment reporting, % 41.5 21.1
Operating cash f low before taxes, financing operations and dividends 2,916 6,270 1,476 4,567
Interest-bearing net receivables 2, 3 2,929 9,914
Order bookings, SEK bn 4 123.6 130.3 41.0 29.0
Order backlog, SEK bn 2, 4 155.7 145.9
1 Earnings for the period at t ributable to equity holders divided by the average
number of shares outstanding after repurchases and conversion
2 Refers to the end of each period
3 Excluding construct ion loans to cooperat ive housing associat ions and net interest-bearing pension liabilit ies and
provisions amounted to SEK bn 9.5 12.2
4 Refers to Construct ion
January−December 2011 compared to January−December 2010
� Order bookings totaled SEK 123.6 (130.3) billion. Order bookings in the fourth quarter totaled SEK 41.0 (29.0) billion, an increase of 41 percent compared to the fourth quarter of 2010.
� Order bookings were 7 percent higher than revenue during the year. Order backlog increased 7 percent and amounted to SEK 155.7 (145.9) billion. This was equivalent to 16 (16) months of construction.
� Revenue amounted to SEK 122.5 (121.7) billion.
� Revenue in Construction amounted to SEK 115.0 (113,2) billion, an increase of 2 percent and an increase of 8 percent adjusted for currency rate effects.
� Operating income for the Group amounted to SEK 9,087 M (5,339). Currency rate effects reduced income by SEK 249 M.
� Operating income in Construction totaled SEK 3,467 M (4,388). Operating margin amounted to 3.0 (3.9) percent. Currency rate effects reduced income by SEK 255 M.
� Income after financial items amounted to SEK 9,099 M (5,304).
� Profit for the year totaled SEK 8,129 M (3,940).
� Earnings per share totaled SEK 19.72 (9.54) according to segment reporting and SEK 18.43 (9.76) according to IFRSs.
� Operating cash flow before taxes, financial activities and dividends amounted to SEK 2,916 M (6,270).
� Interest-bearing net cash position excluding construction loans to cooperative housing associations and interest-bearing pension liabilities totaled SEK 9.5 (12.2) billion.
� The Board of Directors proposes a regular dividend of SEK 6.00 (5.75) per share.
For further information, please contact:
Peter Wallin, Executive Vice President and CFO, Skanska AB, tel +46 10 448 1120 Pontus Winqvist, Senior Vice President, Investor Relations, Skanska AB, tel +46 10 448 8851 Katarina Grönwall, Senior Vice President, Communications, Skanska AB, tel +46 10 448 8877 Edvard Lind, Group Press Officer, Skanska AB, tel +46 10 448 8808 This report will also be presented at a press and telephone conference at 2:00 p.m. (14:00) CET on February 8 at the Scandic Anglais Hotel, Humlegårdsgatan 23, Stockholm, Sweden. The press and telephone conference will be webcast live at www.skanska.com/investors, where a video of the conference will be available later as well. To participate in the telephone conference, please dial +46 8 505 598 53, +44 203 043 2436, or +1 866 458 4087. This and previous releases can also be found at www.skanska.com/investors.
Skanska AB may be required to disclose the information provided herein pursuant to the Securities Market Act.

Skanska Year-end Report, January−December 2011 2/22
Comments from Skanska’s President and CEO Johan Karlström:
− The positive trend in order bookings continued during the fourth quarter. Both in the full year 2011 and in the fourth quarter, Construction operations reported order bookings that were higher than revenue. The 2011 order bookings were 7 percent higher than revenue during the year. Despite the economic uncertainty surrounding us, we were successful due to our focused efforts and secured new assignments for our operations. To further strengthen and expand our Construction operations, we carried out three company acquisitions during the fourth quarter: U.S.-based Industrial Contractors Inc, Soraset Yhtiöt Oy in Finland and PUDiZ Group in Poland. The acquired companies will represent a total of more than SEK 5 billion in annualized revenue.
− Construction revenue increased, and Sweden, Poland, the United States and the United Kingdom continued to deliver good earnings and margins. However, profitability was lower than in 2010, mainly because our operations in Finland and Norway were adversely affected by further project writedowns and provisions. This was the result of an in-depth analysis of our operations and the project portfolio, in order to resolve current situation and improve profitability.
− In the prevailing uncertain market climate, our Residential Development operations started up and sold homes at the same level as in the fourth quarter of 2010 and also started up our first British residential project. The decrease in the operating margin compared to 2010 was mainly due to low profitability in certain projects in the Swedish market, write-downs in the value of land in Estonia and Slovakia and costs for establishing a presence in new markets. We will continue the task of adjusting our operations in order to create profitable Residential Development operation.
− During the fourth quarter, Commercial Property Development continued to sell a number of properties, with good capital gains and at attractive yield levels. We are also continuing to develop new projects in order to generate future realizable values, and during the fourth quarter we started up seven new projects. This means that at the end of 2011 we had 32 ongoing projects, with an investment commitment of about SEK 9 billion.
− During the fourth quarter, Infrastructure Development divested a school project in Scotland. Earlier in the year, Infrastructure Development also sold the Autopista Central highway project and 50 percent of the Antofagasta highway project in Chile. These divestments, as well as our divestments in Commercial Property Development, are a good example of Skanska's business model, where capital generated in Construction is invested in profitable development projects, which in turn generate construction assignments and future development gains and also make a stable dividend possible. The capital gain on the divestment of the Autopista Central enabled us to disburse an extra dividend of SEK 6.25 per share in May 2011.
Market outlook
Construction
The market in building construction remains stable. In the U.S., there is continued good demand in certain building construction sectors such as healthcare, the pharmaceutical industry and facilities for the information technology (IT) industry. The Nordic markets are generally having a stable development but the residential construction market in Sweden and Finland is characterized by some uncertainty. The Czech and U.K. markets remain weak.
The civil construction market remains stable in most of our markets. The number of bidders is still high, and we can see a large presence of international players in several of our markets, which means tight bidding margins. In the U.S., the Czech Republic and the U.K., the market is being affected by public sector austerity programs. In the U.S., increased private construction investments in the energy sector, for example, may partly offset the decline in public sector construction investments. In Latin America, the market for energy sector facilities is good.
Residential Development
The residential market is characterized by tighter lending from banks and by considerable uncertainty, especially in the Swedish and Finnish markets. In these markets, prices have begun to fall somewhat, and the number of days that new homes are for sale have increased. In Norway, demand is good and the price trend is stable. In the Czech Republic, the market trend remains weak.
Commercial Property Development
There is continued good demand for modern, efficient and green properties, resulting in attractive valuations for this property category. Vacancy rates for office space are stable in most of our U.S., Nordic and Central European cities, but due to the uncertain economic situation the mobility of potential tenants is decreasing.
In the Nordic countries, the U.S. and Central Europe, there is good potential to develop new office projects in our metropolitan regions. Our solid financial position enables us to be proactive and invest in new projects without being dependent on external financing.
Infrastructure Development
Due to the tightening of British public expenditures, there has been a general reduction in the supply of new public-private partnership (PPP) projects in the U.K, but the potential for this type of project appears likely to improve somewhat during 2012. In other European markets, the supply of projects is more limited, although interest in PPP solutions has increased in some markets. There is also good potential for new projects in the U.S. and Latin America, but the lead times for these is difficult to predict.

Skanska Year-end Report, January−December 2011 3/22
Order bookings and backlog, SEK bn
0.0
25.0
50.0
75.0
100.0
125.0
150.0
175.0
Q4 09 Q1 10 Q2 10 Q3 10 Q4 10 Q1 11 Q2 11 Q3 11 Q4 11
Order backlog Order bookings, rolling 12 month basis
Revenue, rolling 12 month basis Order bookings per quarter
Order bookings
Order bookings increased in the fourth quarter by 20 percent compared to the preceding quarter. The increase was 41 percent compared to the fourth quarter of 2010. During 2011 as a whole, order bookings decreased by 5 percent compared to the preceding year and totaled SEK 123.6 (130.3) billion. Adjusted for currency rate effects, order bookings increased by 1 percent. Order bookings were 7 percent higher than revenue during the year.
Presented below are some of the major projects included in order bookings during the fourth quarter.
In Latin America Skanska was awarded a contract by Petrobras to build a natural gas power plant in Rio de Janeiro, Brazil for about SEK 3.2 billion.
In USA Skanska was awarded numerous contracts. Skanska USA Building received among others the first construction phase of a state-of-the-art hospital complex, the University Medical Center in New Orleans, Louisiana, for about SEK 3 billion. Skanska USA Building also received a construction contract in the western United States worth about SEK 1.1 billion for a confidential customer and an assignment to expand and renovate St. Francis Hospital in Columbia, Georgia for about SEK 665 M. Skanska USA Civil received a design-build contract for a 16 km (10 mi.) extension of the Bay Area Rapid Transit (BART) system in northern California, worth SEK 2.2 billion, for the Santa Clara Valley Transportation Authority (VTA).
Skanska Norway secured an assignment from the Norwegian National Rail Administration worth about SEK 1.6 billion to build a double track railroad on the Vestfold Line, plus an assignment to construct a shopping mall and apartments for Vågsgaten 16 AS in Sandnes, Rogaland totaling about SEK 640 M.
Skanska UK was awarded a design-build contract for the new HMP Grampian prison in Aberdeen for the Scottish Prison Service (SPS), worth about SEK 590 M. Skanska also received an assignment to build a green commercial property in Bevis Marks, London for Bevis Marks Development, valued at about SEK 517 M.
Order backlog
Order backlog increased by 7 percent and totaled SEK 155.7 (145.9) billion at the end of the fourth quarter. Adjusted for currency rate effects, order backlog also increased by 7 percent. Order backlog was equivalent to about 16 (16) months of construction. The portion of order backlog that is planned for execution during 2012 was equivalent to 72 (69) percent of 2011 revenue.

Skanska Year-end Report, January−December 2011 4/22
Accounting principles For the Group, this interim report has been prepared in compliance with IAS 34, “Interim Financial Reporting,” the Annual Accounts Act and the Securities Market Act. For the Parent Company, the interim report has been prepared in compliance with the Annual Accounts Act and the Securities Market Act, which is pursuant to the Swedish Financial Reporting Board’s Recommendation RFR 2. Effective from 2011, segment reporting of joint ventures in Residential Development with ongoing projects is applying a new principle. The proportional method is being used for joint ventures that have an ongoing project begun after 2010 or that sold residential units after 2010. The change in principle is being applied only prospectively and has not been restated historically. The equity method will continue to be applied to other joint ventures. Otherwise the accounting principles and assessment methods presented in the Annual Report for 2010 have been applied.
Segment and IFRS reporting
Segment reporting
Skanska’s business streams − Construction, Residential Development, Commercial Development and Infrastructure Development − are reported as operating segments. Tables in this report that refer to segment reporting are shown with a shaded background. Construction includes both building construction and civil construction. Revenue and earnings are reported successively as a project accrues, in compliance with International Financial Reporting Standards (IFRSs). Residential Development develops residential projects for immediate sale. Homes are adapted to selected customer categories. The units in this segment are responsible for planning and selling their projects. The construction assignments are performed by construction units in the Construction segment in each respective market. Residential Development revenue and earnings are recognized when binding contracts are signed for the sale of homes. According to IFRSs, revenue and earnings are recognized when the purchaser takes possession of the home. Commercial Property Development initiates, develops, leases and divests commercial property projects. In most markets, construction assignments are performed by Skanska’s Construction segment. Commercial Development revenue and earnings are recognized when binding contracts are signed for the sale of properties. According to IFRSs, revenue and earnings are recognized when the purchaser takes possession of the property. Infrastructure Development specializes in identifying, developing and investing in privately financed infrastructure projects, such as highways, hospitals and power generating plants. The business stream focuses on creating new potential projects mainly in the markets where the Group has operations. Construction assignments are performed in most markets by Skanska’s Construction segment. Infrastructure Development revenue and earnings are recognized in compliance with IFRSs. Intra-Group pricing between operating segments occurs on market terms.
Skanska Year-end Report, January−December 2011 5/22
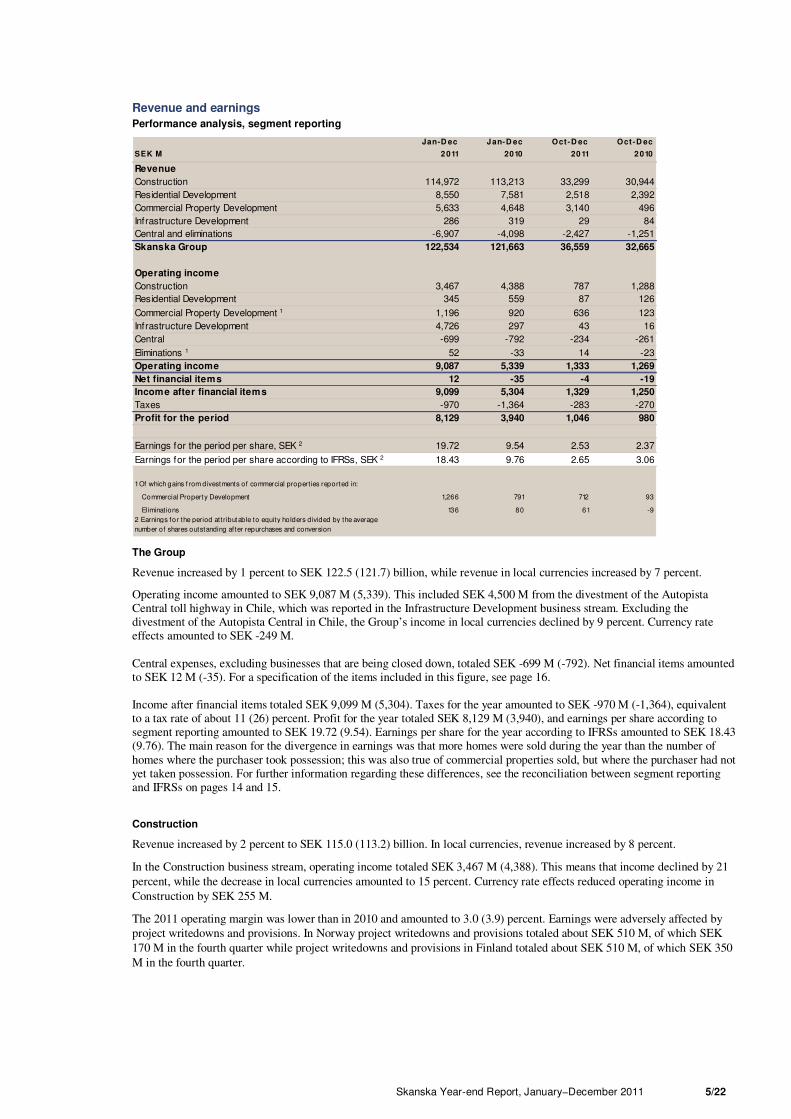
Revenue and earnings
Performance analysis, segment reporting
Jan-D ec J an-D ec Oct-D ec Oct-D ec
SEK M 2 011 2010 20 11 2 010
Revenue
Construction 114,972 113,213 33,299 30,944
Residential Development 8,550 7,581 2,518 2,392
Commercial Property Development 5,633 4,648 3,140 496
Infrastructure Development 286 319 29 84
Central and eliminations -6,907 -4,098 -2,427 -1,251
Skanska Group 122,534 121,663 36,559 32,665
Operating income
Construction 3,467 4,388 787 1,288
Residential Development 345 559 87 126
Commercial Property Development 1 1,196 920 636 123
Infrastructure Development 4,726 297 43 16
Central -699 -792 -234 -261
Eliminations 1 52 -33 14 -23
Operating income 9,087 5,339 1,333 1,269
Net financial items 12 -35 -4 -19
Income after financial items 9,099 5,304 1,329 1,250
Taxes -970 -1,364 -283 -270
Profit for the period 8,129 3,940 1,046 980
Earnings for the period per share, SEK 2 19.72 9.54 2.53 2.37
Earnings for the period per share according to IFRSs, SEK 2 18.43 9.76 2.65 3.06
1 Of which gains f rom divestments of commercial propert ies reported in:
Commercial Propert y Development 1,266 791 712 93
Eliminations 136 80 61 -9
2 Earnings for the period attributable to equity holders divided by the average
number of shares outstanding after repurchases and conversion
The Group
Revenue increased by 1 percent to SEK 122.5 (121.7) billion, while revenue in local currencies increased by 7 percent.
Operating income amounted to SEK 9,087 M (5,339). This included SEK 4,500 M from the divestment of the Autopista Central toll highway in Chile, which was reported in the Infrastructure Development business stream. Excluding the divestment of the Autopista Central in Chile, the Group’s income in local currencies declined by 9 percent. Currency rate effects amounted to SEK -249 M. Central expenses, excluding businesses that are being closed down, totaled SEK -699 M (-792). Net financial items amounted to SEK 12 M (-35). For a specification of the items included in this figure, see page 16. Income after financial items totaled SEK 9,099 M (5,304). Taxes for the year amounted to SEK -970 M (-1,364), equivalent to a tax rate of about 11 (26) percent. Profit for the year totaled SEK 8,129 M (3,940), and earnings per share according to segment reporting amounted to SEK 19.72 (9.54). Earnings per share for the year according to IFRSs amounted to SEK 18.43 (9.76). The main reason for the divergence in earnings was that more homes were sold during the year than the number of homes where the purchaser took possession; this was also true of commercial properties sold, but where the purchaser had not yet taken possession. For further information regarding these differences, see the reconciliation between segment reporting and IFRSs on pages 14 and 15.
Construction
Revenue increased by 2 percent to SEK 115.0 (113.2) billion. In local currencies, revenue increased by 8 percent.
In the Construction business stream, operating income totaled SEK 3,467 M (4,388). This means that income declined by 21 percent, while the decrease in local currencies amounted to 15 percent. Currency rate effects reduced operating income in Construction by SEK 255 M.
The 2011 operating margin was lower than in 2010 and amounted to 3.0 (3.9) percent. Earnings were adversely affected by project writedowns and provisions. In Norway project writedowns and provisions totaled about SEK 510 M, of which SEK 170 M in the fourth quarter while project writedowns and provisions in Finland totaled about SEK 510 M, of which SEK 350 M in the fourth quarter.
Skanska Year-end Report, January−December 2011 6/22
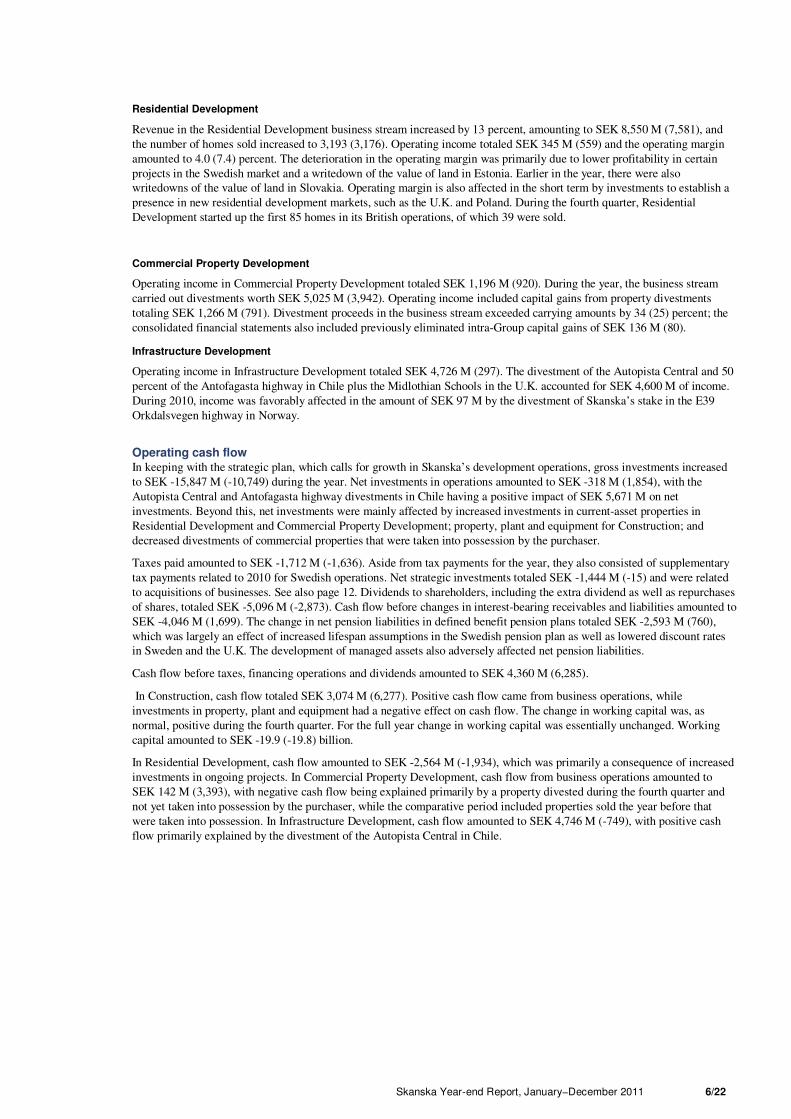
Residential Development
Revenue in the Residential Development business stream increased by 13 percent, amounting to SEK 8,550 M (7,581), and the number of homes sold increased to 3,193 (3,176). Operating income totaled SEK 345 M (559) and the operating margin amounted to 4.0 (7.4) percent. The deterioration in the operating margin was primarily due to lower profitability in certain projects in the Swedish market and a writedown of the value of land in Estonia. Earlier in the year, there were also writedowns of the value of land in Slovakia. Operating margin is also affected in the short term by investments to establish a presence in new residential development markets, such as the U.K. and Poland. During the fourth quarter, Residential Development started up the first 85 homes in its British operations, of which 39 were sold.
Commercial Property Development
Operating income in Commercial Property Development totaled SEK 1,196 M (920). During the year, the business stream carried out divestments worth SEK 5,025 M (3,942). Operating income included capital gains from property divestments totaling SEK 1,266 M (791). Divestment proceeds in the business stream exceeded carrying amounts by 34 (25) percent; the consolidated financial statements also included previously eliminated intra-Group capital gains of SEK 136 M (80).
Infrastructure Development
Operating income in Infrastructure Development totaled SEK 4,726 M (297). The divestment of the Autopista Central and 50 percent of the Antofagasta highway in Chile plus the Midlothian Schools in the U.K. accounted for SEK 4,600 M of income. During 2010, income was favorably affected in the amount of SEK 97 M by the divestment of Skanska’s stake in the E39 Orkdalsvegen highway in Norway.
Operating cash flow In keeping with the strategic plan, which calls for growth in Skanska’s development operations, gross investments increased to SEK -15,847 M (-10,749) during the year. Net investments in operations amounted to SEK -318 M (1,854), with the Autopista Central and Antofagasta highway divestments in Chile having a positive impact of SEK 5,671 M on net investments. Beyond this, net investments were mainly affected by increased investments in current-asset properties in Residential Development and Commercial Property Development; property, plant and equipment for Construction; and decreased divestments of commercial properties that were taken into possession by the purchaser.
Taxes paid amounted to SEK -1,712 M (-1,636). Aside from tax payments for the year, they also consisted of supplementary tax payments related to 2010 for Swedish operations. Net strategic investments totaled SEK -1,444 M (-15) and were related to acquisitions of businesses. See also page 12. Dividends to shareholders, including the extra dividend as well as repurchases of shares, totaled SEK -5,096 M (-2,873). Cash flow before changes in interest-bearing receivables and liabilities amounted to SEK -4,046 M (1,699). The change in net pension liabilities in defined benefit pension plans totaled SEK -2,593 M (760), which was largely an effect of increased lifespan assumptions in the Swedish pension plan as well as lowered discount rates in Sweden and the U.K. The development of managed assets also adversely affected net pension liabilities.
Cash flow before taxes, financing operations and dividends amounted to SEK 4,360 M (6,285).
In Construction, cash flow totaled SEK 3,074 M (6,277). Positive cash flow came from business operations, while investments in property, plant and equipment had a negative effect on cash flow. The change in working capital was, as normal, positive during the fourth quarter. For the full year change in working capital was essentially unchanged. Working capital amounted to SEK -19.9 (-19.8) billion.
In Residential Development, cash flow amounted to SEK -2,564 M (-1,934), which was primarily a consequence of increased investments in ongoing projects. In Commercial Property Development, cash flow from business operations amounted to SEK 142 M (3,393), with negative cash flow being explained primarily by a property divested during the fourth quarter and not yet taken into possession by the purchaser, while the comparative period included properties sold the year before that were taken into possession. In Infrastructure Development, cash flow amounted to SEK 4,746 M (-749), with positive cash flow primarily explained by the divestment of the Autopista Central in Chile.

Skanska Year-end Report, January−December 2011 7/22
Consolidated operating cash flow statement
J an-D ec Jan-D ec Oct -D ec Oc t-D ec
SEK M 20 11 2010 2011 2010
Cash flow before change in interest-bearing
receivables and liabilities -4,046 1,699 1,120 4,154
Change in interest-bearing receivables and liabilities 2,771 -4,199 934 -1,779
Cash flow for the period -1,275 -2,500 2,054 2,375
Cash and cash equivalents at the beginning of the period 6,654 9,409 3,234 4,248
Exchange rate differences in cash and cash equivalents -70 -255 21 31
Cash and cash equivalents at the end of the period 5,309 6,654 5,309 6,654
Summary cash flow statement
Jan-D ec Jan-D ec Oct-D ec Oct -D ec
SEK M 2011 2010 2011 2010
Cash flow from operating activities 245 6,238 3,319 4,848
Cash flow from investing activities 918 -3,850 -1,686 -486
Cash flow from financing activities -2,438 -4,888 421 -1,987
Cash flow for the period -1,275 -2,500 2,054 2,375

Skanska Year-end Report, January−December 2011 8/22
Operating cash flow and changes in interest-bearing net receivables
Jan-D ec Jan-D ec Oct-D ec Oct-D ec
SEK M 2011 2010 2011 2010
Construction
Cash f low from business operations 5,004 5,896 1,183 1,647
Change in w orking capital -19 1,459 1,881 1,951
Net investments -1,911 -1,079 -489 -355
Cash f low adjustment 0 1 0 1
Total Construction 3,074 6,277 2,575 3,244
Residential Development
Cash f low from business operations -756 -648 -198 -208
Change in w orking capital -179 -826 -184 141
Net investments -1,989 -281 -358 445
Cash f low adjustment 360 -179 -68 -188
Total Residential Development -2,564 -1,934 -808 190
Commercial Property Development
Cash f low from business operations -52 121 -77 4
Change in w orking capital -52 -170 -10 -149
Net investments 238 3,424 1,658 1,532
Cash f low adjustment 8 18 -44 148
Total Commercial Property Development 142 3,393 1,527 1,535
Infrastructure Development
Cash f low from business operations -177 -80 -44 -20
Change in w orking capital 103 -380 0 20
Net investments 4,820 -289 -268 -169
Cash f low adjustment 0 0 0 0
Total Infrastructure Development 4,746 -749 -312 -169
Central and eliminations
Cash f low from business operations -710 -761 -231 -205
Change in w orking capital -296 -35 -85 -57
Net investments -32 94 -15 44
Cash f low adjustment 0 0 0 0
Total central and eliminations -1,038 -702 -331 -218
Total cash f low from business operations 3,309 4,528 633 1,218
Total change in w orking capital -443 48 1,602 1,906
Total net investments 1,126 1,869 528 1,497
Total cash f low adjustment 368 -160 -112 -39
Total 4,360 6,285 2,651 4,582
Taxes paid in business operations -1,758 -1,655 -245 -331
Cash flow from business operations 2,602 4,630 2,406 4,251
Net interest items and other net f inancial items -154 -62 -116 -35
Taxes paid in f inancing operations 46 19 35 11
Cash flow from financing operations -108 -43 -81 -24
CASH FLOW FROM OPERATIONS 2,494 4,587 2,325 4,227
Net strategic investments -1,444 -15 -1,175 -15
Taxes paid on strategic divestments 0 0 0 0
Cash flow from strategic investments -1,444 -15 -1,175 -15
Dividend etc.1 -5,096 -2,873 -30 -58
CASH FLOW BEFORE CHANGE IN INTEREST-BEARING
RECEIVABLES AND LIABILITIES -4,046 1,699 1,120 4,154
Translation differences, net receivables/net debt -353 -726 30 -60
Change in pension liability -2,593 760 -254 1,420
Reclassif ication, interest-bearing net receivables/net debt 0 0 0 0
Interest-bearing liabilites acquired/divested 37 -4 -45 -4
Other changes, interest-bearing net receivables/net debt -30 94 13 19
CHANGE IN INTEREST-BEARING NET RECEIVABLES -6,985 1,823 864 5,529
1 of which repurchases of shares -184 -252 -63 -19

Skanska Year-end Report, January−December 2011 9/22
Summary statement of financial position
D ec 31 D ec 31
SEK M 2011 2010
ASSETS
Non-current assets
Property, plant and equipment 7,018 5,906
Goodw ill 5,012 3,917
Intangible assets 158 354
Investments in joint ventures and associated companies 2,526 1,775
Financial non-current assets 1 2,108 2,122
Deferred tax assets 1,671 1,472
Total non-current assets 18,493 15,546
Current assets
Current-asset properties 3 23,411 20,406
Inventories 1,014 926
Financial current assets 2 6,361 6,321
Tax assets 436 506
Gross amount due from customers for contract w ork 5,108 4,941
Trade and other receivables 22,638 21,304
Cash 5,309 6,654
Assets held for sale 0 1,108
Total current assets 64,277 62,166
TOTAL ASSETS 82,770 77,712
of which interest-bearing non-current assets 2,070 2,072
of which interest-bearing current assets 11,440 12,773
Total interest-bearing assets 13,510 14,845
EQUITY
Equity attributable to equity holders 19,413 20,670
Non-controlling interests 170 122
Total equity 19,583 20,792
LIABILITIES
Non-current liabilities
Financial non-current liabilities 1,335 1,107
Pensions 3,757 1,216
Deferred tax liabilities 927 1,637
Non-current provisions 17 28
Total non-current liabilities 6,036 3,988
Current liabilities
Financial current liabilities 2 5,563 2,786
Tax liabilities 263 1,003
Current provisions 5,930 5,037
Gross amount due to customers for contract w ork 16,827 16,937
Trade and other payables 28,568 27,169
Total current liabilities 57,151 52,932
TOTAL EQUITY AND LIABILITIES 82,770 77,712
of which interest-bearing financial liabilities 6,759 3,666
of which interest-bearing pensions and provisions 3,822 1,265
Total interest-bearing liabilities 10,581 4,931
1 of which shares 38 41
2 Items regarding non-interest-bearing unrealized changes in derivat ives/f inancial instruments are included in the following amounts:
Financial non-current assets 0 9
Financial current assets 230 202
Financial non-current liabilit ies 2 0
Financial current liabilit ies 137 227
3 Current -asset properties
Commercial Property Development 11,066 10,000
Residential Development 12,345 10,406
23,411 20,406
Note, contingent liabilities
Contingent liabilities amounted to SEK 18.9 bn on December 31, 2011 (Dec 31, 2010: 15.2). During the period, contingent
liabilities increased by SEK 3.7 bn.

Skanska Year-end Report, January−December 2011 10/22
Financial position
Reported in compliance with IFRSs
Skanska has a continued solid financial position, with interest-bearing net receivables of SEK 2.9 (9.9) billion, which excluding construction loans to cooperative housing associations and net interest-bearing pension liabilities amounted to SEK 9.5 (12.2) billion. Interest-bearing loans plus net interest-bearing pension liabilities and provisions totaled SEK 10.6 (4.9) billion. Skanska's unutilized long-term credit facility of SEK 6.7 billion that runs through June 2014, in combination with adjusted interest-bearing net receivables of SEK 9.5 (12.2) billion, gives a satisfactory level of capacity to support the Group and the business plan. Construction loans to cooperative housing associations amounted to SEK 3.0 (1.1) billion, and net interest-bearing pension liabilities and provisions amounted to SEK 3.8 (1.3) billion. At the end of the year, capital employed amounted to SEK 30.2 (25.7) billion. Return on capital employed amounted to 30.6 (21.6) percent. The equity of the Group totaled SEK 19.6 (20.8) billion. The net debt/equity ratio amounted to -0.1 (-0.5), and the equity/assets ratio was 23.7 (26.8) percent. Total assets in the consolidated statement of financial position amounted to SEK 82.8 (77.7) billion. Total assets rose due to increased net investments, and currency rate effects reduced total assets by SEK 0.6 billion. The carrying amount of current-asset properties totaled SEK 23.4 billion, of which Residential Development current-asset properties accounted for SEK 12.3 billion and Commercial Property Development current-asset properties accounted for SEK 11.1 billion.
Residential Development
Reported in compliance with IFRSs
R esident ial
SEK M D evelo pment
Completed projects 358
Ongoing projects 5,418
Undeveloped land and development properties 6,569
Total 12,345
Effective from January 1, 2011, holdings in joint ventures and associated companies are directly recognized in the Residential Development segment using the proportional method, which affects the number of homes. See also accounting principles, page 4.
At the end of the fourth quarter, there were 5,445 (4,534) homes under construction. Of these, 58 (59) percent were sold. The number of completed unsold homes totaled 184 (177), of which 95 (100) in the Czech Republic. During the year, construction started on 3,630 (4,113) homes. In the Nordic countries, the number of homes started was 3,131 (3,698), while in the Czech Republic and the U.K. they totaled 499 (415). The number of homes sold during the period was 3,193 (3,176). In the Nordic countries, the number of homes sold totaled 2,747 (2,761), while homes sold in the Czech Republic and the U.K. totaled 446 (415).
The carrying amount of current-asset properties in Residential Development totaled SEK 12.3 billion. A breakdown of the carrying amount can be seen in the table above. The carrying amount of undeveloped land and development properties was SEK 6.6 billion, with an estimated market value of about SEK 7.6 billion according to the appraisal carried out in conjunction with the annual financial statements as of December 31, 2011. This was equivalent to Skanska-owned building rights for about 23,100 homes and about 2,300 building rights in associated companies. In addition, the business stream was entitled to purchase about 11,000 more building rights under certain conditions.

Skanska Year-end Report, January−December 2011 11/22
Commercial Property Development
Reported in compliance with IFRSs
Breakdown of carrying amounts and market values, current-asset properties, December 31, 2011
SEK M
C arrying amo unt ,
end o f perio d
C arrying amo unt
upo n co mple tio n M arke t va lue 1
O ccupancy
rate , %
D egree o f
co mplet io n,
%
Completed projects 2,913 2,913 4,072 85 100
Completed projects 2011 468 468 604 100 100
Total completed projects 3,381 3,381 4,676 86
Undeveloped land and development properties 3,871 3,871 4,430
Subtotal 7,252 7,252 9,106
Ongoing projects 3,814 9,104 11,602 2 44 43
Total 11,066 16,356 20,708
of which completed projects sold according to segment reporting 1,001 1,001 1,247
of which ongoing projects sold according to segment reporting 57 101 117
2 Estimated market value at completion
1 M arket value accord ing to appraisal on December 31, 2011
Commercial Property Development had 32 ongoing projects, 16 of them in the Nordic countries. During the year, 16 new projects were started, with an estimated investment volume of SEK 4.2 billion. Ongoing projects represented leasable space of about 471,000 sq. m (5.07 million sq. ft.) and had a pre-leasing rate of 44 percent, measured in rent. At year-end, the carrying amount for ongoing projects was SEK 3.8 billion. Their carrying amount upon completion is expected to total SEK 9.1 billion, with an estimated market value of SEK 11.6 billion upon completion. The degree of completion in ongoing projects was about 43 percent. Of these ongoing projects, two were sold according to segment reporting. These projects were equivalent to a carrying amount upon completion of SEK 101 M, with a market value of SEK 117 M. The market value of completed projects was SEK 4.7 billion, which represented a surplus value of SEK 1.3 billion. The occupancy level measured in rent totaled 86 percent. Of these completed projects, the carrying amount of projects that were recognized as sold according to segment reporting amounted to SEK 1,001 M, with a market value of SEK 1,247 M. The carrying amount of undeveloped land and development properties (building rights) totaled about SEK 3.9 billion, with an estimated market value of about SEK 4.4 billion. Accumulated eliminations of intra-Group project gains amounted to SEK 246 M at year-end. These eliminations are reversed as each respective project is divested.
Infrastructure Development
Reported in compliance with IFRSs
Unrealized development gains, Infrastructure Development
D ec 31 Dec 31 1 Sep 30 Sep 30 1 D ec 31 2 Dec 31 1, 2
S EK bn 2011 2011 2011 2011 2010 2010
Present value of cash f low from projects 5.0 5.0 4.8 4.8 4.6 4.6
Present value of remaining investments -0.8 -0.8 -0.9 -0.9 -1.1 -1.1
Net present value of projects 4.2 4.2 3.9 3.9 3.5 3.5
Carrying amount before Cash f low hedge / Carrying amount -3.0 -1.7 -2.6 -1.4 -2.2 -1.7
Unrealized development gain 1.2 2.5 1.3 2.5 1.3 1.8
Cash f low hedge 1.6 0.3 1.4 0.2 0.5 0.0
Effect in unrealized Equity 3 2.8 2.8 2.7 2.7 1.8 1.8
1 According to previous layout
2 Autopista Cent ral excluded
3 Tax effects not included
At the end of 2011, the carrying amount of shares, participations, subordinated receivables and concessions in Infrastructure Development before cash flow hedge was about SEK 3.0 (2.2) billion. Remaining investment obligations related to ongoing Infrastructure Investment projects amounted to a present value of about SEK 0.8 (1.1) billion. At year-end, unrealized development gains totaled about SEK 1.2 (1.3) billion. During the year, the carrying amount was positively influenced by investments in new projects and by the time value effect when assessing future cash flows. The value of cash flow hedges, whose change in value is accounted for under “Other comprehensive income,” amounted to SEK 1.6 (0.5) billion.
Unrealized development gains according to the table above is described excluding the value of cash flow hedging, unlike the first and second quarters, when cash flow hedging was recognized as part of unrealized development gains. Upon divestment, the amount included in unrealized development gains will be recognized in the income statement as gains from joint ventures and associated companies, while the value of cash flow hedging will be recognized in “Other comprehensive income”. The table structure is intended to differentiate more clearly between the value change in unrealized development gains and does not have any impact on the accounting principles.
The divestment of the Autopista Central has been completed, and the purchaser has provided payment. The capital gain on the investment, which was carried out as a sale of shares, totaled SEK 4,500 M after taxes.

Skanska Year-end Report, January−December 2011 12/22
Equity
Reported in compliance with IFRSs
Summary statement of changes in equity
J an-D ec Jan-D ec Oct -D e c Oct -D e c
SEK M 2011 2010 2011 2 010
Opening balance 20,792 20,167 19,286 18,016
of which non-controlling interests 122 170 129 161
Dividend to shareholders -4,945 -2,582 0 0
Acquired non-controlling interest -29 0
Change in group composition 45 120
Dividend to non-controlling interests -2 -39 0 -36
Effects of equity-settled share-based payments 228 208 58 55
Repurchase of shares -184 -252 -63 -19
Other transfers of assets recognized directly in equity 0 0 0 0
Total comprehensive income attributable to
Equity holders 3,673 3,299 186 2,779
Non-controlling interests 5 -9 -4 -3
Closing balance 19,583 20,792 19,583 20,792
of which non-controlling interests 170 122 170 122
Equity and adjusted equity
Dec 31 Sep 30 Dec 31
SEK bn 2011 2010 2010
Equity attributable to equity holders 19.4 19.2 20.7
Unrealized surplus land value in Residential Development 1.0 1.0 1.0
Unrealized Commercial Property Development gains 1 4.4 4.1 3.5
Ef fect in unrealized equity in Infrastructure Development 2.8 2.7 6.8
Less standard corporate tax, 10% -0.8 -0.8 -0.6 2
Adjusted equity 26.8 26.2 31.4
Equity per share, SEK 3 47.17 46.53 50.27
Adjusted equity per share, SEK 4 65.10 63.58 76.30
1 M arkets value at complet ion
2 Excluding Autopista Central
3 Equity atributable to equity holders divided by the number of shares outstanding af ter repurchases and conversion
4 Adjusted equity divided by the number of shares outstanding af ter repurchases and conversion
Investments and divestments
Reported in compliance with IFRSs
In the Construction business stream, investments totaled SEK -3,689 M (-1,351). Of this, SEK -1,444 M (0) was related to acquisitions of businesses, which refers primarily to the acquisition of U.S.-based Industrial Contractors but also the acquisitions of Finland’s Soraset Yhtiöt Oy, Poland’s PUDiZ Group and companies in the Czech Republic, Norway and Sweden earlier in the year. Other investments mainly consisted of property, plant and equipment for Skanska’s own construction and manufacturing. Net investments in Construction totaled SEK -3,355 M (-1,079). During the year, depreciation of property, plant and equipment amounted to SEK -1,288 M (-1,206). In Residential Development, investments in current-asset properties amounted to SEK -7,288 M (-5,367) and total investments amounted to SEK -7,688 M (-5,562), including about SEK -1,346 M related to acquisitions of land equivalent to about 5,442 building rights. The business stream also acquired shares and participations in associated companies, such as Täby Galopp (owner of a racetrack property north of Stockholm), which represented investments of SEK 329 M and about 1,733 building rights. In Commercial Property Development, investments in current-asset property amounted to SEK -3,485 M (-3,125), and total investments amounted to SEK -3,493 M (-3,147), including SEK -1,027 M (-806) related to investments in land. Divestments of current-asset properties totaled SEK 3,822 M (6,589). Net investments in current-asset properties in Commercial Property Development amounted to SEK 337 M (3,464). Investments in Infrastructure Development amounted to SEK -988 M (-692), and divestments, which largely refer to the Autopista Central in Chile but also the Antofagasta highway in Chile and the Midlothian Schools in the U.K., totaled SEK 5,808 M (403). Net investments in Infrastructure Development were SEK 4,820 M (-289). The Group’s total investments amounted to SEK -15,847 M (-10,749). Divestments amounted to SEK 15,529 M (12,603), and the Group’s net investments totaled SEK -318 M (1,854).

Skanska Year-end Report, January−December 2011 13/22
Group net investments
Jan-D ec Jan-D ec Oct-D ec Oct -D ec
SEK M 2011 2010 2011 2010
OPERATIONS - INVESTMENTS
Intangible assets -70 -72 -20 -41
Property, plant and equipment -2,206 -1,338 -666 -383
Assets in Infrastructure Development -988 -692 -315 -202
Shares and participations -366 -155 -12 -77
Current-asset properties -10,773 -8,492 -3,549 -2,476
of which Residential Development -7,288 -5,367 -2,364 -1,194
of which Commercial Property Development -3,485 -3,125 -1,185 -1,282
Investments in operations -14,403 -10,749 -4,562 -3,179
STRATEGIC INVESTMENTS
Businesses -1,444 0 -1,175 0
Shares 0 0 0 0
Strategic investments -1,444 0 -1,175 0
Total Investments -15,847 -10,749 -5,737 -3,179
OPERATIONS - DIVESTMENTS
Intangible assets 1 4 0 -7
Property, plant and equipment 198 240 57 64
Assets in Infrastructure Development 5,808 403 47 33
Shares and participations 4 16 2 12
Current-asset properties 9,518 11,955 4,984 4,574
of which Residential Development 5,696 5,366 2,009 1,785
of which Commercial Property Development 3,822 6,589 2,975 2,789
Divestments in operation 15,529 12,618 5,090 4,6760
STRATEGIC DIVESTMENTS
Businesses 0 -15 0 -15
Strategic divestments 0 -15 0 -15
Total divestments 15,529 12,603 5,090 4,661
TOTAL NET INVESTMENTS1 -318 1,854 -647 1,482
Depreciation, non-current assets -1,393 -1,301 -391 -311
1 (+) divestments, (-) investments

Skanska Year-end Report, January−December 2011 14/22
Reconciliation between segment reporting and IFRSs
Jan-D e c J an-D ec Jan-D ec Jan-D ec Ja n-D ec Jan-D e c Jan-D ec Ja n-D ec
SEK M 20 11 2010 2011 2010 2011 20 10 2011 2010
Construction 108,137 1 108,923 1 6,835 4,290 114,972 113,213 3,467 4,388
Residential Development 8,550 7,462 0 119 8,550 7,581 345 559
Commercial Property Development 5,556 4,648 77 0 5,633 4,648 1,196 920
Infrastructure Development 277 319 9 0 286 319 4,726 297
Total operating segments 122,520 121,352 6,921 4,409 129,441 125,761 9,734 6,164
Central 14 310 342 266 356 576 -699 -792
Eliminations 0 1 -7,263 -4,675 -7,263 -4,674 52 -33
Total Group 122,534 121,663 0 0 122,534 121,663 9,087 5,339
Reconciliation to IFRSs -3,800 561 0 0 -3,800 561 -674 119
Total IFRSs 118,734 122,224 0 0 118,734 122,224 8,413 5,458
1 of w hich external revenue f rom joint ventures in Infrastructure Development SEK 8,554 M (7,153)
External revenue Intra-Gro up revenue T o tal revenue Operat ing inco me
S egm ent IF R S Segment IF R S Se gme nt IF R S S egme nt IF R S
J an-D ec Ja n-D e c Jan-D ec J an-D ec Oc t-D e c Oct- D ec O ct-D ec Oc t-D e c
SE K M 2 011 20 11 2010 2 010 20 11 2011 20 10 2010
Revenue
Construction 114,972 114,972 113,213 113,213 33,299 33,299 30,944 30,944
Residential Development 8,550 5,763 7,581 5,513 2,518 2,033 2,392 1,794
Commercial Property Development 5,633 4,339 4,648 7,277 3,140 3,018 496 2,970
Infrastructure Development 286 286 319 319 29 29 84 84
Central and eliminations -6,907 -6,626 -4,098 -4,098 -2,427 -2,321 -1,251 -1,251
Skanska Group 122,534 118,734 121,663 122,224 36,559 36,058 32,665 34,541
Operating income
Construction 3,467 3,467 4,388 4,388 787 787 1,288 1,288
Residential Development 345 -27 559 280 87 20 126 87
Commercial Property Development 1 1,196 930 920 1,301 636 747 123 485
Infrastructure Development 4,726 4,726 297 297 43 43 16 16
Central -699 -698 -792 -792 -234 -233 -261 -260
Eliminations 1 52 15 -33 -16 14 34 -23 36
Operating income 9,087 8,413 5,339 5,458 1,333 1,398 1,269 1,652
Net financial items 12 12 -35 -35 -4 -4 -19 -19
Income after financial items 9,099 8,425 5,304 5,423 1,329 1,394 1,250 1,633Taxes -970 -830 -1,364 -1,395 -283 -298 -270 -372
Profit for the period 8,129 7,595 3,940 4,028 1,046 1,096 980 1,261
Earnings for the period per share, SEK 2 19.72 9.54 2.53 2.37
Earnings for the period per share according to IFRSs, SEK 2 18.43 9.76 2.65 3.06
1 Of which gains from divestments of commercial propert ies reported in:
Commercial Property Development 1,266 1,042 791 1,177 712 861 93 464
Eliminations 136 114 80 97 61 74 -9 30
2 Earnings for the period attribut able to equit y holders divided by the average number of shares outstanding after repurchases and conversion
Residential Development
Jan-D ec Jan-D ec Oct-D ec Oct -D ec
SEK M 2011 2010 2011 2010
Revenue according to segment reporting - binding agreement 8,550 7,581 2,518 2,392
Plus properties sold before this period 5,018 3,160 0 287
Less properties not yet occupied by the buyer -6,813 -5,018 -253 -867
Proportional method for joint ventures -947 -83
Currency rate dif ferences -45 -210 -149 -18
Revenue according to IFRIC 15 - handover 5,763 5,513 2,033 1,794
Operating income according to segment reporting - binding
agreement 345 559 87 126
Plus properties sold before this period 686 489 0 151
Less properties not yet occupied by the buyer -890 -686 -36 -193
Adjustment income from joint ventures and associated companies -161 -55 -11 5
Currency rate dif ferences -7 -27 -20 -2
Operating income according to IFRIC 15 - handover -27 280 20 87
According to segment reporting, revenue for the period in Residential Development was SEK 8,550 M and operating income was SEK 345 M. To comply with IFRSs, add the revenue and earnings of the homes that were sold during prior periods but were handed over during the period. Then subtract the homes that were sold during the period but where the purchaser did not yet take possession. Also subtract revenue attributable to joint ventures as well as currency rate differences. According to IFRSs, revenue in Residential Development was SEK 5,763 M. According to IFRSs, operating income in Residential Development was SEK -27 M.
Skanska Year-end Report, January−December 2011 15/22
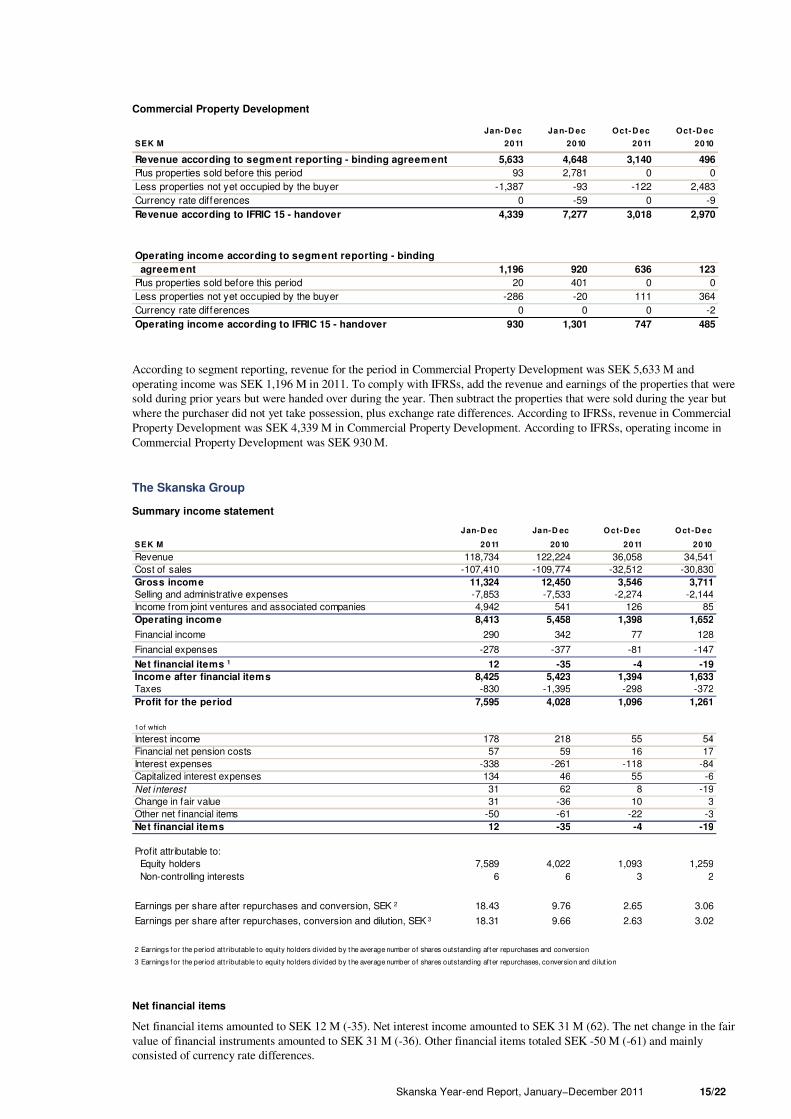
Commercial Property Development
Jan-D ec Ja n-D ec Oct-D ec Oct -D ec
SEK M 2011 2010 2011 2010
Revenue according to segment reporting - binding agreement 5,633 4,648 3,140 496
Plus properties sold before this period 93 2,781 0 0
Less properties not yet occupied by the buyer -1,387 -93 -122 2,483
Currency rate differences 0 -59 0 -9
Revenue according to IFRIC 15 - handover 4,339 7,277 3,018 2,970
Operating income according to segment reporting - binding
agreement 1,196 920 636 123
Plus properties sold before this period 20 401 0 0
Less properties not yet occupied by the buyer -286 -20 111 364
Currency rate differences 0 0 0 -2
Operating income according to IFRIC 15 - handover 930 1,301 747 485
According to segment reporting, revenue for the period in Commercial Property Development was SEK 5,633 M and operating income was SEK 1,196 M in 2011. To comply with IFRSs, add the revenue and earnings of the properties that were sold during prior years but were handed over during the year. Then subtract the properties that were sold during the year but where the purchaser did not yet take possession, plus exchange rate differences. According to IFRSs, revenue in Commercial Property Development was SEK 4,339 M in Commercial Property Development. According to IFRSs, operating income in Commercial Property Development was SEK 930 M.
The Skanska Group
Summary income statement
Jan-D ec Jan-D ec Oct-D ec Oct -D ec
SEK M 2011 2010 2011 2010
Revenue 118,734 122,224 36,058 34,541
Cost of sales -107,410 -109,774 -32,512 -30,830
Gross income 11,324 12,450 3,546 3,711
Selling and administrative expenses -7,853 -7,533 -2,274 -2,144
Income from joint ventures and associated companies 4,942 541 126 85
Operating income 8,413 5,458 1,398 1,652
Financial income 290 342 77 128
Financial expenses -278 -377 -81 -147
Net financial items 1 12 -35 -4 -19
Income after financial items 8,425 5,423 1,394 1,633
Taxes -830 -1,395 -298 -372
Profit for the period 7,595 4,028 1,096 1,261
1 of which
Interest income 178 218 55 54
Financial net pension costs 57 59 16 17
Interest expenses -338 -261 -118 -84
Capitalized interest expenses 134 46 55 -6
Net interest 31 62 8 -19
Change in fair value 31 -36 10 3
Other net f inancial items -50 -61 -22 -3
Net financial items 12 -35 -4 -19
Profit attributable to:
Equity holders 7,589 4,022 1,093 1,259
Non-controlling interests 6 6 3 2
Earnings per share after repurchases and conversion, SEK 2 18.43 9.76 2.65 3.06
Earnings per share after repurchases, conversion and dilution, SEK 3 18.31 9.66 2.63 3.02
2 Earnings for the period att ributable to equity holders divided by the average number of shares outstanding after repurchases and conversion
3 Earnings for the period att ributable to equity holders divided by the average number of shares outstanding after repurchases, conversion and dilut ion
Net financial items
Net financial items amounted to SEK 12 M (-35). Net interest income amounted to SEK 31 M (62). The net change in the fair value of financial instruments amounted to SEK 31 M (-36). Other financial items totaled SEK -50 M (-61) and mainly consisted of currency rate differences.

Skanska Year-end Report, January−December 2011 16/22
Summary statement of comprehensive income
Summary statement of comprehensive income
Jan-D ec Jan-D ec Oct-Dec Oct-Dec
SEK M 2011 2010 2011 2010
Profit for the period 7,595 4,028 1,096 1,261
Other comprehensive income
Translation differences attributable to equity holders -458 -1,809 -585 -108
Translation differences attributable to non-controlling interests -1 -15 -7 -5
Hedging of exchange rate risk in foreign operations 106 363 161 -12
Effects of actuarial gains and losses on pensions 3 -3,106 889 -440 1,673
Effects of cash flow hedges 1 -1,326 127 -144 433
Tax attributable to other comprehensive income 2, 3 868 -293 101 -466
Other comprehensive income for the period -3,917 -738 -914 1,515
Total comprehensive income for the period 3,678 3,290 182 2,776
Total comprehensive income attributable to
Equity holders 3,673 3,299 186 2,779
Non-controlling interests 5 -9 -4 -3
1 of which t ransferred to income statement -93 -63 15 -19
2 of which tax related to
- actuarial gains and losses on pensions 811 -239 103 -450
- cash f low hedges 57 -54 -2 -16
3 Total ef fect on equity f rom actuarial gains and losses on pensions -2,295 650 -337 1,223
Skanska currency hedges about 30 percent of its equity in foreign subsidiaries against the Swedish krona. The net translation differences as of December 31, 2011 amounted to SEK -352 M (-1,446).
The effects of actuarial gains and losses on pensions totaled SEK -3,106 M (889). This negative effect was primarily due to increased lifespan assumptions in the Swedish pension plan as well as lowered discount rates in Sweden and the U.K. The development of managed assets also adversely affected net pension liabilities. The effects of cash flow hedges, SEK -1,326 M (127), were mainly related to changes in the value of interest rate swaps attributable to Infrastructure Development projects.
Parent Company Net sales of the Parent Company during January-December were SEK 337 M (285). Operating income totaled SEK -319 M (-300). Income after financial items amounted to SEK 2,461 M (3,933).
Summary income statement, Parent Company
Jan-Dec Jan-D ec Oct-D ec Oct-D ec
SEK M 2011 2010 2011 2010
Net sales 337 285 257 224
Cost of sales and selling and administrative expenses -656 -585 -287 -255
Operating income -319 -300 -30 -31
Net f inancial items 2,780 4,233 351 1,273
Income after financial items 2,461 3,933 321 1,242
Taxes 0 -230 -94 -334
Profit for the period 2,461 3,703 227 908
Total comprehensive income 2,461 3,703 227 908

Skanska Year-end Report, January−December 2011 17/22
Summary balance sheet, Parent Company
Dec 31 D ec 31
SEK M 2011 2010
AS SET S
Intangible non-current assets 7 9
Property, plant and equipment 2 3
Financial non-current assets 1 11,131 12,008
Total non-current assets 11,140 12,020
Current receivables 301 134
Total current assets 301 134
TOTAL ASSETS 11,441 12,154
EQUITY AND LIABILITIES
Equity 5,742 8,216
Provisions 276 268
Non-current interest-bearing liabilities 1 5,286 3,316
Current liabilities 137 354
TOTAL EQUITY AND LIABILITIES 11,441 12,154
1 Of these amounts, SEK 368 M (Dec 31, 2010: 1,287) w ere intra-Group receivables and SEK 5,286 M (Dec 31, 2010: 3,316)
intra-Group liabilities.
Note, contingent liabilities
The Parent Company's contingent liabilities totaled SEK 99.3 bn (Dec 31, 2010: 109.3), of w hich SEK 92.4 bn (Dec 31, 2010: 103.1)
w as related to obligations on behalf of Group companies. Other obligations, SEK 6.9 bn (Dec 31 2010: 6.2), w ere related to
commitments to outside parties.
Share data
Jan-D ec Jan-D ec Oct-D ec O ct -D ec
2011 2010 2011 2010
Earnings per share according to segment reporting af ter repurchases and conversion, SEK 1 19.72 9.54 2.53 2.38
Earnings per share af ter repurchases and conversion, SEK 1 18.43 9.76 2.65 3.07
Earnings per share af ter repurchases, conversion and dilution, SEK 2 18.31 9.66 2.63 3.03
Average number of shares outstanding af ter repurchases and conversion 411,824,469 412,229,351
Average number of shares outstanding af ter repurchases, conversion and dilution 414,568,384 416,448,523
Average dilution, percent 0.66 1.01
Number of shares, at balance sheet date 419,903,072 423,053,072
of w hich Series A and Series B shares 419,903,072 419,413,072
of w hich Series D shares (w ithout right to
dividend, in Skanska's ow n custody) 3 0 3,640,000
Number of Series D shares converted to Series B shares 1,350,000 860,000
Average price, repurchased shares, SEK 104.79 105.40
Number of Series B shares repurchased 10,124,000 8,324,000
of w hich repurchased during the year 1,800,000 2,110,000
Number of shares in Skanska's ow n custody 8,323,103 8,253,247
Number of shares outstanding af ter repurchases and conversion 411,579,969 411,159,825
1 Earnings for the period at tributable to equity holders divided by the average number of shares outstanding af ter repurchases and conversion
2 Earnings for t he period at tributable to equity holders divided by the average number of shares outstanding after repurchases, conversion and dilution
3 On April 5, t he Annual Shareholders’ M eeting approved a reduct ion in share capital by SEK 9,450,000 through redemption of 3,150,000 Series D shares. All Series D shares are held by the Parent Company.
Five-year Group financial summary
Jan-Dec Jan-Dec Jan-Dec Jan-Dec Jan-Dec
2011 2010 2009 2008 2 2007 2
Revenue 118,734 122,224 139,124 143,674 138,781
Operating income 8,413 5,458 6,033 4,086 5,406
Prof it for the period 7,595 4,028 4,221 3,157 4,121
Earnings per share after repurchases and conversion, SEK 18.43 9.76 10.16 7.44 9.78
Return on capital employed, % 30.6 21.6 22.3 18.3 25.0
Return on equity, % 38.0 21.0 22.6 15.9 21.1
Operating margin, % 7.1 4.5 4.3 2.8 3.9
Cash flow per share, SEK 1 -9.82 4.12 7.99 -9.14 10.82
1 Cash f low before change in interest-bearing receivables and liab ilit es divided by the average number of shares outstanding after repurchases and conversion
2 Comparative f igures for 2007-2008 have not been adjusted to the eff ect s of IFRIC 12 och IFRIC 15

Skanska Year-end Report, January−December 2011 18/22
Exchange rates for the most important currencies
Jan-D ec Jan- D ec D ec 31 D ec 31
SEK 2011 2010 2011 2010
U.S. dollar 6.49 7.21 6.89 6.80
British pound 10.41 11.13 10.65 10.50
Norw egian krone 1.16 1.19 1.15 1.15
Euro 9.03 9.55 8.92 9.01
Czech koruna 0.37 0.38 0.35 0.36
Polish zloty 2.20 2.39 2.00 2.27
A verage exchange rates
Exchange rates o n
t he clo sing day
Personnel The average number of employees in the Group was 52,557 (51,645). Transactions with related parties No transactions between Skanska and related parties having an essential effect on the Company’s position and earnings have taken place.
Essential risks and uncertainty factors The construction and project development business is largely about risk management. Practically every project is unique. Size, shape, environment – everything varies for each new assignment. Construction and project development business differs in this way from typical manufacturing that operates in permanent facilities with long production runs. In Skanska’s operations there are many types of risks. Identifying, managing and pricing these risks are of fundamental importance to the Group’s profitability. Risks are normally of a technical, legal and financial nature, but political, ethical, social and environmental aspects are also part of assessing potential risks. To ensure a systematic and uniform assessment of risks and opportunities, the entire Skanska Group uses a common procedure for identifying and managing risks. With the aid of this model, Skanska evaluates projects continuously, from tender preparations to completion of the assignment. For further information about risks and a description of key estimates and judgments, see the Report of the Directors and Notes 2 and 6 in the Annual Report for 2010 as well as the above section on the market outlook. Acquisitions
Market Company Acquisition date
USA Industrial Contractors Inc. Dec 28, 2011 3 116 2 400
Finland Soraset Yhtiöt Oy Nov 2, 2011 1 295 270
Other Other 876 1 450
No of employeesAnnual revenue Mkr
During 2011, Skanska acquired companies with annual revenue of SEK 5.3 billion. In the 2011 revenues, SEK 0.7 billion refers to acquired companies. Additional information will be presented in the 2011 Annual report.
Other matters Redemption of shares
On April 5, the Annual Shareholders’ Meeting approved a reduction in share capital by SEK 9,450,000 through redemption of 3,150,000 Series D shares. All Series D shares are held by the Parent Company. Repurchases of shares
At its meeting on April 5, the Board of Directors decided to exercise its authorization by the Annual Shareholders’ Meeting to repurchase shares on the following conditions. On one or more occasions, however no later than the 2012 Annual Shareholders’ Meeting, a maximum of 4,500,000 Series B shares in Skanska may be acquired for the purpose of securing delivery of shares to participants in the Skanska Employee Ownership Program. Acquisitions may only be made on the NASDAQ OMX Stockholm exchange, at a price within the applicable price range at any given time. This refers to the interval between the highest purchase price and lowest selling price. On December 31, Skanska held 8,323,103 Series B shares in its own custody.

Skanska Year-end Report, January−December 2011 19/22
Annual Meeting
The Annual Shareholders’ Meeting will be held at 11:00 a.m. CET on April 13, 2012 at Berwaldhallen in the Östermalm district of Stockholm, Sweden. The invitation to the Meeting will be published on March 12, 2012.
Dividend
The Board of Directors proposes a regular dividend of SEK 6.00 (5.75) per share. The proposal is equivalent to a regular dividend payout totaling SEK 2,469 (2,364) M. The Board of Directors proposes April 18 as the record date for the dividend. The capital gain on the divestment of the Autopista Central enabled us to disburse an extra dividend of SEK 6.25 per share in May 2011, totaling SEK 2,570 M.
The total dividend amount may change by the record date, depending on repurchases of shares and transfers of shares to participants in Skanska’s long-term incentive programs.
Financial reports during 2012
Skanska’s interim reports as well as the Year-end Report are available for downloading on Skanska’s website, www.skanska.com/investors and can also be ordered from Skanska AB, Investor Relations. The Annual report for 2011 will be available on Skanska’s website and headquarters week 11 2012.
The Group’s reports during 2012 will be published on the following dates:
May 10, 2012 Three Month Report
July 19, 2012 Six Month Report
November 8, 2012 Nine Month Report
Solna, February 8, 2012
JOHAN KARLSTRÖM
President and CEO
This Year-end Report has not been subjected to a review by the Company’s auditors

Skanska Year-end Report, January−December 2011 20/22
Additional information, segment reporting
Revenue and earnings
Construction
Jan-D ec Jan-D ec Oct -D ec Oct -D ec
SEK M 2011 2010 2011 2010
Revenue 114,972 113,213 33,299 30,944
Gross income 9,322 10,137 2,493 2,911
Selling and administrative expenses -5,884 -5,764 -1,713 -1,624
Income from joint ventures and associated companies 29 15 7 1
Operating income 3,467 4,388 787 1,288
Investments -3,689 -1,351 -1,857 -431
Divestments 334 272 193 77
Net investments -3,355 -1,079 -1,664 -354
Gross margin, % 8.1 9.0 7.5 9.4
Selling and administrative expenses, % -5.1 -5.1 -5.1 -5.2
Operating margin % 3.0 3.9 2.4 4.2
Order bookings, SEK bn 123.6 130.3 41.0 29.0
Order backlog, SEK bn 155.7 145.9
Employees 51,119 50,197
Residential Development
Jan-D ec Jan-D ec Oct-D ec Oct-Dec
SEK M 2011 2010 2011 2010
Revenue 8,550 7,581 2,518 2,392
Gross income 1,030 1,095 271 307
Selling and administrative expenses -680 -589 -182 -178
Income from joint ventures and associated companies -5 53 -2 -3
Operating income 345 559 87 126
Operating margin, % 4.0 7.4 3.5 5.3
Employees 586 649
Investments -7,688 -5,562 -2,371 -1,277
Divestments 5,699 5,281 2,013 1,722
Net investments -1,989 -281 -358 445
Capital employed, SEK bn 12.7 10.2
Commercial Property Development
Jan-D ec J an-D ec Oct- D ec Oc t-D e c
SEK M 2011 20 10 2011 2010
Revenue 5,633 4,648 3,140 496
Gross income 1,603 1,277 751 229
Selling and administrative expenses -412 -355 -121 -105
Income from joint ventures and associated companies 5 -2 6 -1
Operating income 1,196 920 636 123
of w hich gain from divestments of properties 1 1,266 791 712 93
of w hich w ritedow ns/reversal of w ritedow ns -47 18 -41 22
Employees 235 199
1 Addit ional gain included in eliminat ions was 136 80 61 -9
Investments -3,493 -3,147 -1,221 -1,266
Divestments 3,731 6,571 2,879 2,797
Net investments 238 3,424 1,658 1,531
Capital employed, SEK bn 11.0 9.6
Infrastructure Development
Jan- D ec Jan-D ec O ct-D ec Oc t-D e c
SEK M 2011 2010 2 011 2010
Revenue 286 319 29 84
Gross income -57 -101 -39 -35
Selling and administrative expenses -132 -138 -31 -38
Income from joint ventures and associated companies 4,915 536 113 89
Operating income 4,726 297 43 16
of w hich gains from divestments of shares in projects 4,600 192 7 8
Investments -988 -692 -315 -202
Divestments 5,808 403 47 33
Net investments 4,820 -289 -268 -169
Capital employed, SEK bn 1.4 2.7
Return on capital employed (RoCE), % 100.5 14.4
Employees 146 140

Skanska Year-end Report, January−December 2011 21/22
Construction by business/reporting unit
Jan-D ec Jan-D ec Oct-D ec Oct -D ec
SEK M 2011 2010 2011 2010
Sw eden 27 014 23 232 8 058 6 902
Norw ay 12 521 11 228 3 903 3 039
Finland 8 166 6 892 2 506 2 143
Poland 10 350 9 022 3 241 2 665
Czech Republic 6 666 8 620 2 009 2 866
UK 12 714 14 212 3 001 3 365
USA Building 21 338 22 822 5 640 5 789
USA Civil 10 182 11 514 2 946 2 576
Latin America 6 021 5 671 1 995 1 599
Total 114 972 113 213 33 299 30 944
Jan-D ec Jan-D ec Oct-D ec Oct -D ec Jan-D ec Jan-D ec Oct -D ec Oct-D ec
SEK M 2011 2010 2011 2010 2011 2010 2011 2010
Sw eden 1 287 1 225 452 406 4,8 5,3 5,6 5,9
Norw ay -333 182 -99 -18 neg 1,6 neg neg
Finland -349 -79 -317 50 neg neg neg 2,3
Poland 937 593 128 155 9,1 6,6 3,9 5,8
Czech Republic 54 397 44 160 0,8 4,6 2,2 5,6
UK 421 425 130 121 3,3 3,0 4,3 3,6
USA Building 394 418 93 121 1,8 1,8 1,6 2,1
USA Civil 939 944 234 145 9,2 8,2 7,9 5,6
Latin America 117 284 122 149 1,9 5,0 6,1 9,3
Total 3 467 4 388 787 1 288 3,0 3,9 2,4 4,2
D ec 31 D ec 31 Jan-D ec Jan-D ec Oct -D ec Oct-D ec
SEK M 2011 2010 2011 2010 2011 2010
Sw eden 29 468 31 935 24 493 39 459 5 846 7 546 5
Norw ay 15 414 1 10 132 17 786 12 893 6 366 3 318 6
Finland 6 614 2 5 903 8 427 8 685 2 188 2 460
Poland 6 913 3 8 962 9 135 6 854 2 401 1 266
Czech Republic 7 497 8 399 5 988 6 786 1 706 1 038
UK 20 141 23 512 9 138 14 950 2 993 2 649
USA Building 35 936 30 649 25 928 25 576 10 354 8 689
USA Civil 24 807 4 20 812 13 142 7 129 3 616 547
Latin America 8 908 5 633 9 550 7 961 5 530 1 476
Total 155 698 145 937 123 587 130 293 41 000 28 989
1 Acquired orderbacklog 131 5 Adjustment of -1,073 in 2010
2 Acquired orderbacklog 559 6 Adjustment of -67 in 2010
3 Acquired orderbacklog 123
4 Acquired orderbacklog 573
Operat ing margin, %
Order backlo g Order boo kings
R evenue
Operating inco me

Skanska Year-end Report, January−December 2011 22/22
Residential Development
Jan-D ec Jan-D ec Oct-D ec Oct-D ec Jan-D ec Jan-D ec Oct-D ec Oct-Dec
SEK M 2011 2010 2011 2010 2011 2010 2011 2010
Sw eden 3,572 3,295 988 1,173 121 293 17 82
Norw ay 1,762 1,401 738 432 100 51 53 -15
Finland 2,665 2,372 673 662 168 169 33 44
Nordics 7,999 7,068 2,399 2,267 389 513 103 111
Czech Republic 504 513 72 125 3 46 0 15
Other2 47 - 47 - -47 0 -16 0
Total 8,550 7,581 2,518 2,392 345 559 87 126
Jan-D ec Jan-D ec Oct-D ec Oct-D ec
2011 2010 2011 2010
Sw eden 3.4 8.9 1.7 7.0
Norw ay 5.7 3.6 7.2 -3.5
Finland 6.3 7.1 4.9 6.6
Nordics 4.9 7.3 4.3 4.9
Czech Republic 0.6 9.0 0.0 12.0
Other2 - - - -
Total 4.0 7.4 3.5 5.3
1 Development gain only. Construction margin reported under Construct ion.
2 Start-ups in new market s
Opera ting margin, %1
Revenue Operat ing inco me 1
Jan-D ec Jan-D ec Oct -D ec Oct -D ec Jan-D ec Jan-D ec Oct -D ec Oct -D ec
2011 2010 2011 2010 2011 2010 2011 2010
Sw eden 1,293 1,681 580 503 1,147 1,227 344 367
Norw ay 540 461 287 192 408 396 166 158
Finland 1,298 1,556 321 530 1,192 1,138 284 300
Nordics 3,131 3,698 1,188 1,225 2,747 2,761 794 825
Czech Republic 414 415 0 0 407 415 46 101
Other 85 0 85 0 39 0 39 0
Total 3,630 4,113 1,273 1,225 3,193 3,176 879 926
D ec 31 D ec 31 D ec 31 D ec 31
2011 2010 2011 2010
Sw eden 2,244 1,945 57 58
Norw ay 676 516 59 71
Finland 1,906 1,532 62 60
Nordics 4,826 3,993 59 60
Czech Republic 534 541 48 61
Other 85 0 46 0
Total 5,445 4,534 58 59
D ec 31 D ec 31
2011 2010
Sw eden 49 34
Norw ay 11 4
Finland 29 39
Nordics 89 77
Czech Republic 95 100
Other 0 0
Total 184 177
C om pleted unso ld, number o f ho mes
H omes so ldH o mes started
H o mes under co nstructio n o f which so ld, %H o mes under co nst ructio n