Sizing Up Repo - University of...
63
Sizing Up Repo * Arvind Krishnamurthy † Northwestern University Stefan Nagel ‡ Stanford University Dmitry Orlov § Stanford University June 2012 ABSTRACT We measure the repo funding extended by money market funds and securities lenders to the shadow banking system, including quantities, haircuts, and repo rates by type of underlying collateral. Repo played only a small role in funding private sector assets prior to the crisis. The subsequent contraction in repo is relatively insignificant compared with the contraction in asset-backed commer- cial paper. Haircuts in our data rise less than in the interdealer repo market. While relatively small in aggregate, the contraction in repo with private-sector collateral particularly affected key dealer banks and led them to resort to the Fed’s emergency lending programs. * We thank Peter Crane for providing data, and we are grateful for comments from Anat Admati, Tobias Adrian, Jeremy Bulow, Anna Cieslak, Darrell Duffie, Jacob Goldfield, Michael Fleming, Gary Gorton, Antoine Martin, Atif Mian, Philipp Schnabl, seminar participants at the Bank of Canada, Dartmouth, DePaul, University of Florida, Goethe University Frankfurt, Harvard, Loyola, New York Fed, Northwestern, University of Lugano, University of Minnesota, UC San Diego, University of Southern California, Stanford, Wharton, University of Zurich, the American Economic Association Meetings, the NBER Monetary Economics and Capital Markets and the Economy workshops, the Stanford Institute for Theoretical Economics, and the Western Finance Association Meetings for useful comments. † Kellogg School of Management, Northwestern University, and NBER ‡ Graduate School of Business, Stanford University, NBER, and CEPR § Graduate School of Business, Stanford University
Transcript of Sizing Up Repo - University of...

Sizing Up Repo !
Arvind Krishnamurthy †
Northwestern UniversityStefan Nagel ‡
Stanford University
Dmitry Orlov §
Stanford University
June 2012
ABSTRACT
We measure the repo funding extended by money market funds and securitieslenders to the shadow banking system, including quantities, haircuts, and reporates by type of underlying collateral. Repo played only a small role in fundingprivate sector assets prior to the crisis. The subsequent contraction in repo isrelatively insignificant compared with the contraction in asset-backed commer-cial paper. Haircuts in our data rise less than in the interdealer repo market.While relatively small in aggregate, the contraction in repo with private-sectorcollateral particularly a!ected key dealer banks and led them to resort to theFed’s emergency lending programs.
!We thank Peter Crane for providing data, and we are grateful for comments from Anat Admati,Tobias Adrian, Jeremy Bulow, Anna Cieslak, Darrell Du"e, Jacob Goldfield, Michael Fleming, GaryGorton, Antoine Martin, Atif Mian, Philipp Schnabl, seminar participants at the Bank of Canada,Dartmouth, DePaul, University of Florida, Goethe University Frankfurt, Harvard, Loyola, New YorkFed, Northwestern, University of Lugano, University of Minnesota, UC San Diego, University ofSouthern California, Stanford, Wharton, University of Zurich, the American Economic AssociationMeetings, the NBER Monetary Economics and Capital Markets and the Economy workshops, theStanford Institute for Theoretical Economics, and the Western Finance Association Meetings foruseful comments.
†Kellogg School of Management, Northwestern University, and NBER‡Graduate School of Business, Stanford University, NBER, and CEPR§Graduate School of Business, Stanford University

Most analyses of the financial crisis of 2007-09 highlight the rapid expansion of the
shadow banking sector in the period from 2000 to 2007 and the subsequent collapse
of the sector during the crisis (see Adrian and Shin (2010), Brunnermeier (2009),
Gorton and Metrick (2011)). A wide variety of loans, including residential mortgages,
auto loans, and credit card loans, which a decade ago were held by the commercial
banking sector and financed by bank deposits were instead held by shadow banks and
financed by repurchase agreements (repo) and asset-backed commercial paper (ABCP)
(see Figure 1). Like deposits of traditional banks, the repo and ABCP liabilities created
by shadow banks were of short maturity. However, unlike for traditional bank deposits,
there was no regulatory structure that o!ered safety to the shadow-bank “depositors”.
In a series of papers, Gorton and Metrick (2010a, 2010b, 2011) have argued that the
repo market played a key role in the collapse of the shadow banking system through a
“run on repo” very much akin to the runs on commercial banks that plagued the U.S.
prior to the establishment of the Federal Reserve System.
Much of the discussion of the repo market has run ahead of our measurement of the
repo market (see Geanakoplos (2009); Gorton and Metrick (2010b); Shleifer (2010)).
Because of a lack of data, we know little about basic questions: How much did the
shadow banking system rely on repo for its short-term funding? How much did it
contract during the crisis? How much of repo funding provided by non-banks was
collateralized by (securitized) private-sector assets? Did this change during the crisis?
As a consequence, it is di"cult to evaluate the role played by the repo market in
propagating shocks during the financial crisis.
Our objective is to fill this gap with a new data set on the repo agreements between
non-bank lenders and dealer banks. To assess the funding conditions for the shadow
banking system as a whole, we focus on the repo funding flows that enter the shadow
1

!!"#$%&'(%)
*(+,(%#
-(./(#
"01.2#
345#
$6,+7(%+,#
8(9&#
!"#$%
!"&%
:$;4#
<&1.067#
=&+12)
!&%7/+/(2#
!"&%
>*(9&2672?#
@AB#C:5D#
'()*+,(-.%
/0+1%
!"&%
3(<0%6E(2#
,(1.(%#
;+2F#
;&,,+7(%+,##
Figure 1: Short-term Funding Flows in the Shadow Banking System. The biggest cashlenders to the shadow banking system are money market funds (MMF) and securitieslenders (SL). MMF take short-term funds from retail investors, institutions and corpo-rations, and promise to preserve a fixed $1 net asset value. SL are large institutionalinvestors or custodians for institutional portfolios who lend securities to short-sellersand in return receive cash, as collateral, that they seek to reinvest. A substantial por-tion of funding provided by MMF and SL to the shadow banking system is providedin collateralized form with repurchase agreements (repo) or asset-backed commercialpaper (ABCP). Repo is used by broker/dealers to fund their securities inventory, e.g.of asset-backed securities (ABS) and to fund repo loans that they provide to clients,e.g. hedge funds. ABCP is issued by special purpose vehicles (SPV) set up (usually bycommercial banks) for the purpose of purchasing long-term ABS. The repos betweenMMF/SL and broker/dealers are typically tri-party repos, in which a custodian banksafeguards the collateral on behalf of the cash lender. Repos between broker/dealersand hedge funds are typically bilateral repos without a third party custodian to standbetween.
2
banking system (through the tri-party repo market on the right-hand side of Figure 1)
rather than the inter(shadow)bank repo lending between dealers, and between dealers
and hedge funds. Statistics on aggregate repo volume in the U.S. such as the commonly
cited Primary Dealer repo survey of the Federal Reserve do not distinguish between
the flows into the shadow banking system and the flows within the system. Volume
statistics are computed by adding up all repos along the intermediation chain from non-
banks to dealers and between dealers. The quantity of interdealer repo is informative
about the length of intermediation chains within the shadow banking system, but not
about how the shadow banking system funds itself in aggregate vis-a-vis non-banks.1
To isolate the repo funding flows provided by non-banks, we use data on the repo
market activities of money market funds (MMF) complemented with data on repos of
security lenders (SL). These sectors are significant lenders of cash in the repo market.
For example, in 2007Q2, they lent a total of $930bn of cash in the repo market, which
accounts for about two thirds of the total repo funding flows from non-bank lenders to
shadow banks. The MMF data is extracted from quarterly SEC filings of MMF. The
SL data is from the Risk Management Association (RMA). We also analyze data from
the Federal Reserve’s emergency lending programs in 2008 and 2009 to understand how
much these actions counteracted a contraction in the repo market.
We start by examining the question of how significant was repo in funding private
sector assets prior to the crisis. That is, a key channel suggested by the “run on repo”
theory is that repo drove the growth of the shadow banking sector and the expansion
of privately securitized assets prior to the crisis. We do not find support for this
1For the very same reason, interbank deposits are not counted in the calculation of money stockmeasures like M2. However, the quantity of interbank repo may be relevant for other questions thatare not our focus here. For example, a high level of interdealer repo could a!ect the probability thatdefaults propagate from dealer to dealer in the same way as a high level of interdealer over-the-counterderivatives exposures could (Du"e and Zhu (2011)). Our focus, however, is not on the systemic riskcontribution of interdealer repos but on the role of repo for shadow bank funding in aggregate.
3

channel. Only a small portion of the outstanding amount of mortgage- and asset-
backed securities created in the private sector (private-label ABS) is used as collateral
in repo funding. In the period before the crisis, repo from MMF and SL collateralized
with private-label ABS total $151bn, which implies that only 3% of outstanding private-
label ABS is financed by repo from MMF or SL. Most of the repo funding extended
by MMF and SL is collateralized with Treasury or Agency-backed securities.
ABCP and direct holdings of privately securitized assets by MMF and SL play a
more significant role than repo as short-term funding sources for the shadow banking
system. In the period before the crisis, ABCP finances 23% of the outstanding private-
label ABS, which is an order of magnitude larger than repo.
As the crisis unfolds from 2007Q2 to 2009Q2, the short-term funding of private-
label ABS contracts by $1.4 trillion. Of this, $662bn comes from the reduction in
outstanding ABCP while only $151bn of the contraction comes from the reduction
of repo with private-label ABS collateral. The remainder comes from a contraction
of direct holdings of private-label ABS by MMF and SL. Moreover, the contraction
in short-term funding appears first in the ABCP market during the summer of 2007
(Covitz, Liang, and Suarez (2012)). In contrast, private-label ABS repo keeps growing
until the collapse of Bear Stearns in 2008Q1.
These findings are consistent with the views of many commentators that a contrac-
tion in the short-term debt of shadow banks played an important role in the collapse of
the shadow banking sector, but they are inconsistent with the view that a run on repo
played the central role. The more significant short-term debt contraction occurs in
ABCP. The latter observation is important for understanding the mechanism through
which the short-term debt contraction a!ected the financial system. While both ABCP
and repo are collateralized forms of short-term debt, ABCP typically receives liquidity
4

support guarantees from a commercial bank rather than a broker/dealer. Commercial
banks were a!ected early in the crisis in the fall of 2007, but shocks to their financing
were relatively well contained because of their access to Federal Reserve lending facili-
ties. The key role played by ABCP and the regulated sector also gives greater weight
to the regulatory arbitrage arguments of Acharya, Schnabl, and Suarez (2012) as being
an important factor in driving the growth of the shadow banking system.
A second key channel through which the “run on repo” may have contributed to
the crisis is through the e!ects of repo contraction on systemically important institu-
tions. That is, while the contraction in repo was relatively insignificant for shadow
bank funding in aggregate, its e!ects may have been amplified if the contraction dis-
proportionately a!ected key institutions. We find evidence that is supportive of this
channel. The contraction is concentrated among dealer banks that are most reliant on
the repo market to fund private collateral at the outbreak of the crisis. These banks
include Goldman Sachs, Morgan Stanley, Merrill Lynch, and Citigroup; in short, four
of the key players in the financial sector. These dealer banks also have the highest
perceived credit risk in September 2008, and they borrow most heavily from the TSLF
and PDCF emergency lending programs of the Federal Reserve. It is di"cult to pin
down, however, how much of this was a causal e!ect of a refusal of repo lenders to ex-
tend funding against risky/illiquid collateral, and to what extent dependence on private
collateral is just a symptom of weak capital positions, di"culty in obtaining unsecured
funding, loss of brokerage business, and collateral calls by derivatives counterparties,
as discussed in Du"e (2010).
Our results also highlight that to understand the role of repo during the crisis, it is
important to distinguish between funding conditions that dealer banks face when they
borrow cash from MMF and SL via (largely tri-party) repo from the funding terms
5

that dealer banks o!er when they lend via (largely bilateral) repo to other dealers
or hedge funds. Gorton and Metrick (2010a, 2011) document that haircuts in the
interdealer market rose dramatically in the crisis, while we find much smaller increases
in the MMF-to-dealer bank haircuts (see also Copeland, Martin, and Walker (2010)).
For private-label ABS, for which Gorton and Metrick report the highest haircuts, we
observe instead that quantities go to zero.
We argue that dealer balance sheet constraints provide a natural explanation of
this divergence between the tri-party and bilateral repo markets. Our data suggest
that MMF and SL stop lending when collateral becomes too illiquid or risky, and so we
see quantities for these types of collateral going to zero. Compared with MMF, dealer
banks are more capable of assessing counterparty and collateral risk, and are in a better
position to deal with illiquid collateral in the event of a default. As a result, they are
still willing to extent credit to other dealers and to hedge funds against riskier and
illiquid collateral. But their shrinking capital during the crisis led dealers to demand
higher haircuts to lessen the demands on their own balance sheets. Therefore, high
bilateral repo haircuts are not necessarily an indication that a “run on repo” is taking
place.
Overall, the picture therefore looks less like the analogue of a traditional bank run
by depositors and more like a credit-crunch in which dealers acted defensively given
their own capital and liquidity problems, raising credit terms to their borrowers. These
higher credit terms are manifest in the higher haircuts observed by Gorton and Metrick.
To fully understand the di!erential behavior of the bilateral and tri-party repo markets,
one needs quantity data on the bilateral market. To our knowledge, no such data exists
either publicly or with regulators.
The paper most related to ours is Copeland, Martin, and Walker (2010) who ex-
6

amine data on tri-party repo provided by the two tri-party agents, Bank of New York
Mellon and JPMorgan Chase, from July 2008 onwards. Their data has the advan-
tage that it is high frequency, and, for example, sheds light on the Lehman Brothers
failure. However, their sample is shorter and does not start until the middle of the
financial crisis. We are particularly interested in understanding how the private-label
ABS stock was financed pre-crisis, how this financing changed through the crisis, and
how it compares with alternative funding sources such as ABCP. Their data is less
suited to answering this question. Their data also includes GCF repo which is a type
of interdealer repo, and thus creates the double counting problem we have discussed
earlier. Nevertheless, their findings are similar to ours. Repo with private-label ABS
collateral is a small fraction of total repo. They document a rise in haircuts on repo
against private-label ABS which is similar in magnitude to our own findings. They
also find that haircuts on Treasuries and Agency securities remain relatively constant
during the crisis. The most significant di!erence in our respective findings is we find
little variation in haircuts across counterparties, while they find substantial variation.
At least part of the di!erence in these findings is due to the fact that their sample
has a more significant representation of smaller dealer banks, and it appears that these
banks drive the counterparty-specific haircut variation.
I. Funding Through Repurchase Agreements
We start by describing the main features of repurchase agreements that are important
for understanding our results. A more in-depth treatment of the institutional features
of the repo market can be found, e.g., in Du"e (1996), Garbade (2006), and Federal
Reserve Bank of New York (2010). To provide perspective on the empirical analysis
7

that follows, we then outline a simple model of repo markets.
A. Background on Repurchase Agreements
A repo involves the simultaneous sale and forward agreement to repurchase the same,
or a similar, security at some point in the future. E!ectively, a repo constitutes a
collateralized loan in which a cash-rich party lends to a borrower and receives securities
as collateral until the loan is repaid. The borrower pays the cash lender interest in the
form of the repo rate. The borrower typically also has to post collateral in excess of the
notional amount of the loan (the haircut). The haircut is defined as h = 1"F/C with
collateral value C and notional amount F . For example, a repo in which the borrower
receives a loan of $95m might require collateral worth $100m, implying that a haircut
of 5% is applied to the market value of the collateral.2
Repos constitute an important funding source for dealer banks. They use repos
to finance securities held on their balance sheets (as market-making inventory, ware-
housing during the intermediate stages of securitization, or for trading purposes), or
to finance repo loans they provided to clients such as hedge funds. In the latter case,
dealer banks re-hypothecate the collateral they receive from hedge funds to use as col-
lateral in their repos with cash lenders. King (2008) estimates that about half of the
financial instruments held by dealer banks were financed through repos.
In the years before the financial crisis, repos became an important funding source
for the shadow banking system. Just like the traditional banking system, the shadow
banking system raised short-term funding and directed these short-term funds into
2An central development in the 1980s that spurred the growth of repo was that repos receivedan exemption from automatic stay in bankruptcy (Garbade (2006)). This exemption allows the cashlender in a repo to sell the collateral immediately in the event of default by the borrower withouthaving to await the outcome of lengthy bankruptcy proceedings, thereby reducing the counterpartyrisk exposure of the cash lender.
8

relatively illiquid long-term investments, such as corporate securities and loans, as
well residential and commercial mortgages, as illustrated in Figure 1. MMF and SL
provided a large part of this short-term funding (Pozsar, Adrian, Ashcraft, and Boesky
(2010)).
MMF promise their investors a constant net-asset value (“$1 NAV”), which e!ec-
tively makes their investors’ claims similar to the demand deposits of the traditional
banking system (but without deposit insurance). Some of the funding provided by
MMF went into securitized products through vehicles that issued asset-backed com-
mercial paper (ABCP), while some went via repo to financial institutions that held
securitized products and other securities on their balance sheets (see in Figure 1).
SL are another cash-rich party that directed funds to the shadow banking system.
As part of their business as custodians for large portfolios of bonds and equity, these
institutions lend securities to investors who wish to establish short positions in bond
or stock markets. The shorting investor will typically leave cash with the securities
lender in an amount at least as high as the value of the borrowed securities. As a
result, securities lenders come into possession of a large amount of cash that they seek
to reinvest in the money markets. A significant share of this cash went into repos and
ABCP.
The repo that we examine in this paper are known as tri-party repos. The other
type of repo is known as a bilateral repo. Repo between dealer banks, or between a
dealer bank and a hedge fund are typically bilateral, while repo between dealer banks
and MMF/SL are typically tri-party. These two contracts may have di!erent terms in
practice (repo rates and haircuts). In a tri-party repo, a clearing bank stands as an
agent between the borrower and the cash lender, as illustrated in Figure 2. In the U.S.,
this role is performed either by JPMorgan Chase or Bank of New York Mellon. The
9

!!"#
$%&'()%*+#
,-.)%&/0#10./*#
2345#
,6--)*.%)-#
76%*829::5#
2345#
,6--)*.%)-#
76%*829::5#
;%6<.%=
>.)-.%#
Figure 2: Tri-Party Repurchase Agreements
clearing bank ensures that the repo is properly collateralized within the terms that
cash lender and borrower agreed to in the repo (haircut, marking-to-market, and type
of securities). The motivation for this tri-party arrangement is to enable cash lenders
like MMF that may not have the capability of handling collateral flows and assessing
collateral valuations to participate in this market without running the risk that the
counterparty might not adequately collateralize the repo.3
The risks for a cash lender in a repo are principally that the borrower defaults
and the lender does not have su"cient collateral to recover the lent amount. For
MMF, there is an additional concern that if the borrower defaults and the collateral
is illiquid, the MMF will be stuck with the collateral for an extended period. SEC
rules place limits on the amount of illiquid/long-term securities that that an MMF
can hold. Finally, there is repo risk unique to the tri-party market that stems from
the so-called daily “unwind.” Irrespective of the term of the repo, the clearing bank
unwinds the repo every morning by depositing cash in the cash-lenders’ deposit account
with the custodian and by extending an intraday overdraft and returning the collateral
to the borrower for use in deliveries during the day. If the term of the repo has not
3Garbade (2006) discusses incidents prior to the development of the tri-party repo market in whichborrowers had failed to properly collateralize loans.
10

expired, or if the lender and borrower agree, bilaterally, to renew the repo, a “rewind”
takes place at the end of the business day, whereby securities are transferred from
the borrower’s to the lender’s security accounts with the clearing bank, and cash is
transferred from the cash lender’s to the borrower’s deposit accounts. Thus, the cash
lender is a secured lender overnight, with the securities underlying the repo serving
as collateral, but during the day the cash lender becomes an unsecured depositor in
the tri-party custodian.4 Thus, the risks to a cash lender overnight stem from the
interaction of counterparty risk of the borrower with risk of collateral value changes
and illiquidity of underlying collateral. Intraday, the risks to a cash lender stem from
the counterparty risk of the clearing bank.
The lender can protect against collateral risk by raising the haircut on the repo
contract. Reducing the amount of repo lending can be a response to all three risks.
The lender can also raise the repo rate to compensate for all three risks, although in
practice this appears to be a less significant margin.
Finally, during the sample period we study, there was considerable uncertainty
about how a default of a repo borrower would play out in the tri-party repo market.
According to the Tri-Party Repo Infrastructure Reform Task Force (see Federal Reserve
Bank of New York (2010)), it was not clear for the cash investor if, when, and how
a repo trade would be unwound and how the collateral liquidation process would be
carried out. The ambiguity over these matters may also a!ect participation in the repo
market.4The potential systemic risk created by the huge intraday overdrafts extended by the two tri-party
custodian banks to broker/dealers have also lead to e!orts to change the practices in the tri-partyrepo market (see Federal Reserve Bank of New York (2010)), but for the sample period we study inthis paper, the market functioned in the way we described.
11

B. A Model of Funding and Intermediation Through Repur-
chase Agreements
To set the stage for our empirical analysis, we sketch a model of repo markets. The
model highlights several points that are central to our analysis. First, it clarifies the
distinct economic roles of the tri-party repo market (which largely involves lending from
non-banks to dealer banks) and the bilateral repo market (which is largely an inter-
dealer and dealer-to-hedge fund market). Funding conditions for the shadow banking
system in aggregate are set in the tri-party market, while the bilateral market allocates
funding within the shadow banking system. The focus of our empirical analysis is
on the tri-party market, but the model illustrates potentially important links between
tri-party funding and conditions in the biliateral repo market. Collateral illiquidity
may trigger reduction in lending quantities in the tri-party repo market. If dealer bank
capital is limited, this can lead to a “credit crunch” in the bilateral market in the form
of higher haircuts.5
Consider an asset that has price today of one. Its value tomorrow and thereafter is
either P = 1 + ! or P = 1 " !. However, the asset may turn illiquid tomorrow. We
model this as follows: If a seller wishes to liquidate q assets, then buyers can only be
found for a fraction (1 " ")q of the asset and "q of the asset cannot be sold. Here, "
measures the degree of illiquidity and can be thought of as the probability of finding
buyers, for example, in a search-theoretic model. A long-horizon investor who is able
to hold the asset through the illiquidity period can realize the eventual value of P .
5Martin, Skeie, and von Thadden (2012) provide an alternative and complementary theoreticalperspective on the di!erences between tri-party and bilateral repo markets. They focus on the factthat tri-party repo haircuts are not negotiated trade by trade, but are fixed in custodial agreementsthat are revised only infrequently. As a consequence, lenders in the tri-party repo market are morelikely to stop lending altogether, while in bilateral repo lenders may keep lending, albeit at higherhaircuts, if collateral risk increases.
12

There is a unit measure of cash lenders (“MMF”) indexed by i # [0, 1], where lender
i has cash ai to invest. MMF lend via a repo collateralized by the asset. We fix the
interest rate on this loan to be r = 0 and focus on the determination of the quantity
of lending and the haircut on lending. MMF face two constraints. First, they are
unwilling to accept default risk. This implies that the haircut is set su"ciently high to
ensure that lending is default free,
hm $ !. (1)
Second, they are sensitive to the potential illiquidity of the asset. All MMF face the
restriction that they can allocate only a fraction # of their portfolio to (potentially)
illiquid investments. This restriction captures the SEC regulations on liquidity in MMF
portfolios as well as endogenous restrictions that the funds place on themselves given
that their liabilities are demandable. This assumption implies that MMF i chooses
quantity of lending of qi such that,
qi" % ai# & qi %#
"ai. (2)
Higher haircuts do not help to relax this constraint. For example, suppose " = 0.5, ! =
0.2, and the MMF lends $100 against $200 worth of the asset (200 units), as collateral,
i.e., with collateral far in excess of what is required to keep the loan default-free. Now
suppose that the asset value falls to 1 " ! = 0.8 and the borrower defaults. The
MMF can only realize $80 by selling the portion (1" ") of the collateral immediately,
because the rest is temporarily illiquid. Nevertheless, one unit of the asset would be
judged to have a fair value of $0.80, and so the MMF can only keep (and liquidate)
(1/0.8)'100 = 125 units of the collateral, while the rest would go back to the borrower.
The 125 units would fully cover the borrowers liability of $100 at fair value of the asset,
13

but this leaves the MMF with an illiquid portion of "' $100. In aggregate, (2) implies
Qm % #
"A, (3)
where A =!
i![0,1] aidi is the aggregate cash available to the MMF sector and Qm =!
i![0,1] qidi. Thus, as the asset becomes more illiquid and " rises, it is possible that the
liquidity constraint binds and the quantity of lending falls.
MMF lend via the tri-party repo market to dealer banks who in turn lend via the
bilateral repo market to other dealers as well as hedge funds. Denote the haircut that
dealer banks charge on their lending as hb. We assume that dealers also require that
repo lending be default free so that hb $ ! and that the interest rate on lending is
fixed at r. We aim to show that hb may exceed ! (and thus hm). We assume that,
unlike MMF, dealers are not directly concerned about the liquidity of the underlying
collateral. Let us index the dealer banks by j # [0, 1] where dealer j has equity capital
of ej, which we assume to be fixed in the short-run. In aggregate, their lending
Qb % Eb + Qm (4)
is constrained by their aggregate equity capital, Eb =!
j![0,1] ejdj, and the lending
o!ered by MMF.
Last consider the hedge fund sector (and other leveraged sectors) who are the ulti-
mate borrowers in the bilateral repo market. We assume that the sector has aggregate
equity Eh and borrows the maximum possible amount from dealers. Given the haircut
hb set by dealers, hedge funds need to finance a portion hb of any collateral holdings
Ch with their own equity, i.e, Eh = hbCh, and hence their demand for repo borrowing
14
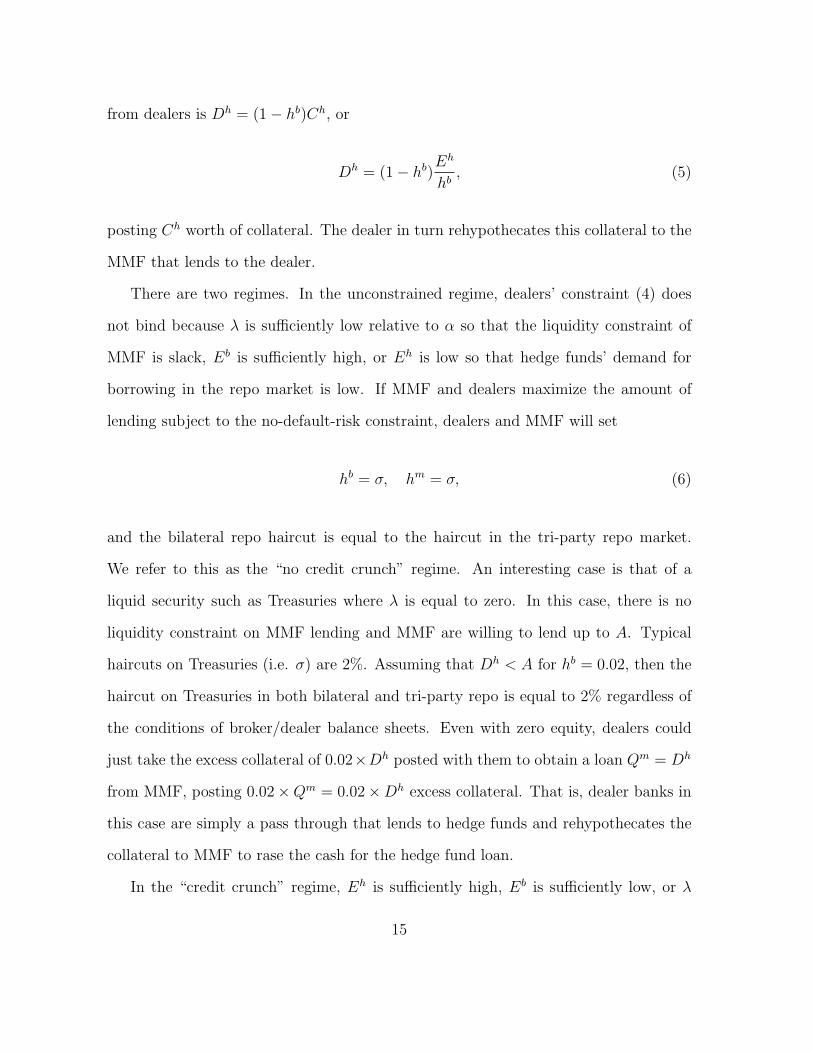
from dealers is Dh = (1" hb)Ch, or
Dh = (1" hb)Eh
hb, (5)
posting Ch worth of collateral. The dealer in turn rehypothecates this collateral to the
MMF that lends to the dealer.
There are two regimes. In the unconstrained regime, dealers’ constraint (4) does
not bind because " is su"ciently low relative to # so that the liquidity constraint of
MMF is slack, Eb is su"ciently high, or Eh is low so that hedge funds’ demand for
borrowing in the repo market is low. If MMF and dealers maximize the amount of
lending subject to the no-default-risk constraint, dealers and MMF will set
hb = !, hm = !, (6)
and the bilateral repo haircut is equal to the haircut in the tri-party repo market.
We refer to this as the “no credit crunch” regime. An interesting case is that of a
liquid security such as Treasuries where " is equal to zero. In this case, there is no
liquidity constraint on MMF lending and MMF are willing to lend up to A. Typical
haircuts on Treasuries (i.e. !) are 2%. Assuming that Dh < A for hb = 0.02, then the
haircut on Treasuries in both bilateral and tri-party repo is equal to 2% regardless of
the conditions of broker/dealer balance sheets. Even with zero equity, dealers could
just take the excess collateral of 0.02'Dh posted with them to obtain a loan Qm = Dh
from MMF, posting 0.02'Qm = 0.02'Dh excess collateral. That is, dealer banks in
this case are simply a pass through that lends to hedge funds and rehypothecates the
collateral to MMF to rase the cash for the hedge fund loan.
In the “credit crunch” regime, Eh is su"ciently high, Eb is su"ciently low, or "
15

su"ciently high relative to #, so that the constraint (4) binds. With the amount of
lending constrained, hb adjusts to clear the market Qb = Dh. Substituting (5) into (4)
with equality, and we obtain
hb =Eh
Eb + Qm + Eh> !. (7)
We then have three comparative statics: A fall in Eb is a left-shift in the repo supply
function and hence hb rises; a fall in Qm is a left-shift in the repo supply function and
hence hb rises; and a rise in Eh is a right shift in the repo demand function and hence
hb rises.
The model foreshadows our basic finding Sections in III to V that when private
collateral turns illiquid, the quantity of lending from MMF falls, but with little change
in tri-party repo haircuts. In contrast, bilateral haircuts rise as dealer banks’ bal-
ance sheet capacity is limited. This provides a credit crunch explanation for the high
bilateral haircuts reported in Gorton and Metrick (2010a, 2011). High bilateral repo
haircuts are therefore not necessarily an indication that a “run on repo” is taking place.
Shrinking equity capital can also lead dealers to raise haircuts to their borrowers. At
the same time, a reduction in lending from MMF that is relatively small in aggregate
could potentially have large e!ects on dealers with a fragile capital structure. We look
into this issue in our analysis of individual dealer banks in Section VI.
II. Repo Data
To examine the “run on repo” hypothesis, we now turn to data on the terms and
quantities of repo lending by the ultimate cash lenders, MMF and SL, in the tri-party
repo market. We first outline the data sources, and then we discuss the extent to which
16

these data sources cover the universe of repo funding flows into the shadow banking
system.
A. Data Sources
Mutual funds file a portfolio holdings report every quarter on forms N-CSR, N-CSRS,
and N-Q with the Securities and Exchange Commission (SEC). This filing requirements
also extends to MMF. The typical report of an MMF lists their holdings of certificates of
deposits, commercial paper, and repurchase agreements. For repos, the reports list each
repurchase agreement with the notional amount, repo rate, initiation date, repurchase
date, counterparty, the type of collateral, and, in most cases, the value of the collateral
at the report date. The level of detail about the underlying collateral varies between
funds. Some report fairly detailed categories, while others only report broad classes,
such as “U.S. Treasury Bonds”, “Government Agency Obligations”, or “Corporate
Bonds”, often with a maturity range. Typically a portfolio of securities serves as
collateral, but only rarely are the value-weights of di!erent classes of securities in the
portfolio reported. In most cases, though, the collateral portfolio consists of securities
of the same type (e.g., U.S. Treasury bonds of di!erent maturities and vintages, rather
than Treasury bonds mixed with corporate bonds or asset-backed securities).
We collect the quarterly filings from the SEC website with filing dates between Jan-
uary 2007 and June 2010. We parse the filings electronically and extract the repurchase
agreement information. We collect the data for the 20 biggest fund money market fund
families at the end of 2006, identified from a ranking of money market fund families
obtained from Cranedata (see Appendix A for a list of the families in the sample). This
yields a data set of approximately 16,000 repos. As the market for money market funds
is fairly concentrated, with the biggest 20 fund families accounting for more than 80%
17

of total net assets, our data should give us a fairly complete picture of the repo market
between MMF and dealer banks. In all of the computations below, we extrapolate the
MMF data we have collected to the entire MMF sector by scaling it up to match the
total repo from the Flow of Funds accounts (FoF) each quarter. While we refer to the
funds in our sample in general as MMF, some funds in the sample are enhanced cash
funds that are, strictly speaking, not money market funds, as they do not adhere to
the investment restrictions for money market funds in SEC rule 2a-7 and particularly
do not aim for $1 NAV. Also, not necessarily all of the repos in our data are tri-party,
but conversations with market participants confirmed that the vast majority of MMF
repo are tri-party.
To analyze securities lenders, the second main class of providers of short-term fund-
ing to shadow banks, we obtain data from the Risk Management Association (RMA).
The RMA conducts a quarterly survey of major securities lenders and reports statis-
tics on their aggregate portfolio of cash collateral reinvestments, including direct in-
vestments as well as repo agreements. Appendix B provides more detail on the data,
including a list of survey participants quarter-by-quarter. The RMA data combine
repo with private-label ABS and corporate debt into one category. We impute the
split between private-label ABS and corporate debt based on the assumption that
their relative proportion is the same as the corresponding proportion in MMF repos.
B. Coverage of Repo Funding Flows
The main objective of our data collection is to capture the repo funding flows that enter
the shadow banking system. One concern that may arise is that our data on MMF
and SL might miss important repo lenders. If so, we would not have a full picture of
the repo funding extended to shadow banks.
18

In 2007Q4, our total coverage of repo from MMF and SL is $1.1tn. The Flow of
Funds (FoF) accounts for 2007Q4 (December 2010 release) report that the other large
repo lenders were State and Local Governments ($163bn),6 Government Sponsored
Enterprises ($143bn), and Rest of the World ($338bn). The Treasury’s TIC data puts
the repo lending of foreign central banks at between $100 and $200bn (these numbers
are likely incorporated in the Flow of Funds’ Rest of the World entry). If these FoF
estimates are correct, then our data covers about two-thirds of repo lenders. However,
because data on the repo market is scant, there is uncertainty in these FoF estimates.
For this reason, why did some further analysis of commercial banks and non-financial
corporations as potential repo lenders.
Commercial banks are not on our list of repo lenders above, because they are net
repo borrowers according to the FoF. However, there could be important heterogeneity
within the commercial bank universe. For example, it is possible that deposit-rich
local banks are net repo lenders while big money center banks are net borrowers. To
check this, we turned to the FDIC’s Call Reports for 2007Q4. Aggregating the net
repo positions of all banks that are net lenders yields total net repo lending of $112bn
(gross lending of $177bn). Thus, bank deposits appear to fund some repo lending to the
shadow banking system. But the numbers are nevertheless relatively small compared
with the repo lending of MMF and SL.
Looking at some of the most cash-rich non-financial corporations, we did not find
other significant sources of repo funding. According to its 2007 Annual report, Mi-
crosoft held $23.4bn cash and short-term investments. Of this amount, $3.0bn is in
6Repos by state and local governments are typically backed by Treasury and Agency collateral, andare therefore not a likely funding source for private-label ABS. For example, California GovernmentCode Section 53601 restricts repo collateral to government, agency, and municipal securities and primecommercial paper. In Illinois, the Deposit of State Moneys Act (15 ILCS 520/22.5) allows only repocollateralized by government securities.
19

cash, and the remainder is in government, agency, and corporate bonds, MBS, mu-
nicipal securities, mutual funds, commercial paper, and certificates of deposit. While
some of Microsoft’s mutual fund investments might flow into repo markets through
MMF, these institutional MMF are already covered in our MMF sample. Similarly,
Apple reports $15.4bn cash and short-term investments in its 2007 annual report, of
which $256m is held as cash and the rest is wholly invested in government, agency,
and corporate securities, where corporate securities include commercial paper, certifi-
cates of deposit, and time deposits. The numbers in the FoF are consistent with these
two examples: Non-financial businesses have a small net repo lending position of $8bn
(compared with holdings of MMF shares of $619bn and domestic deposits of $1.4tn).
Overall, our analysis has not turned up other major sources of repo funding. Our
MMF and SL data appears to cover close to two thirds of the repo funding flows into
the shadow banking system. Moreover, some of the repo lenders not covered by our
MMF/SL data (such as state and local governments and central banks) are unlikely
sources of funding for private-label ABS collateral.
III. Quantity and Composition of Repo Funding
We use the repo data to tackle the first and most basic question: What is the total
amount of repo funding that MMF and SL extend to the shadow banking system? We
then look at the composition of repo funding by type of collateral.
A. Quantity of Repo Funding
The first column in Table I reports the aggregate amount of repos undertaken by MMF
in our SEC filings data set. In 2006Q4 we have only partial coverage because we miss
20

2006Q4 reports filed before January 2007. For comparison, the second column shows
the aggregate amount of MMF repo outstanding according to the FoF, and the third
column shows the total amount of MMF assets, also from the FoF. Our data set covers
roughly 80-90% of oustanding MMF repo. Repos account for about 15-20% of total
MMF assets.
Column four reports the total amount of repo oustanding in securities lenders’ cash
collateral reinvestment portfolios. Until 2008Q2, this number is of comparable magni-
tude as the total amount of MMF repo, but it contracts more strongly in subsequent
quarters. This is likely driven by the fact that the total amount of cash collateral
available to SL for reinvestment contracted sharply around the peak of the crisis. The
amount of MMF repo did not shrink appreciably until 2009Q2. One factor driving
the total size of MMF repo seems to be the flows in and out of MMF. MMF assets
increased by about 50% from 2007Q1 to 2009Q2.
The final column shows the end-of-quarter amount of total Primary Dealer repos
outstanding, as reported by the Federal Reserve Bank of New York. A comparison
of these numbers with the total amount of MMF and SL repo shows an interesting
and stark contrast: The Fed’s Primary Dealer repo numbers are about four times as
high as the MMF and SL repos combined. This di!erence arises because the Primary
Dealer statistics aggregate all repo transactions of Primary Dealers, including repos
done between dealers and with hedge funds, while the MMF and SL repo covers only
the funding raised from non-banks to shadow banks.
Repos between shadow bank intermediaries are common and involve re-hypothecation
of collateral along the intermediation chain. As an example, suppose dealer bank A
lends $1 to a hedge fund via a repo (collateralized by $1.02 of Treasuries),7 and then
7From the perspective of the hedge fund, this is a repo, from the perspective of dealer bank A it
21

Table I: Quantity of Repo Funding Provided by Money Market Funds and SecuritiesLenders
Money Market Funds Securities Lenders PrimaryCollected Total Total Cash Dealer
Quarter Repo Repo2 Assets2 Repo Collateral Repo3
2006Q4 2431 395 2,312 431 1,594 3,4422007Q1 324 387 2,372 527 1,834 3,6192007Q2 331 426 2,466 504 1,902 3,8892007Q3 412 528 2,780 522 1,754 3,8862007Q4 483 606 3,033 478 1,712 4,1062008Q1 501 592 3,383 467 1,537 4,2782008Q2 466 518 3,318 509 1,790 4,2222008Q3 433 592 3,355 490 1,519 3,9892008Q4 479 542 3,757 228 954 3,2082009Q1 546 562 3,739 212 779 2,7432009Q2 507 488 3,585 257 882 2,5822009Q3 495 495 3,363 244 865 2,4992009Q4 472 480 3,259 229 850 2,4692010Q1 427 440 2,931 263 837 2,477
1 Incomplete coverage of funds in MMF sample in 2006Q4.2 Source: Flow of Funds Accounts.3 Source: Federal Reseve Bank of New York
borrows the $1 from dealer bank B via a repo (collateralized by the same $1.02 of
Treasuries), who then borrows $1 from a MMF (collateralized by the same $1.02 of
Treasuries). The MMF does not re-hypothecate collateral. This chain is typical in
the repo market, as dealer banks both borrow and lend cash and rehypothecate collat-
eral extensively (Singh and Aitken (2010)). Note that sum of repo loans across these
four institutions is $3. The Fed’s Primary Dealer statistics would report total repos
of $2, i.e., the sum of the two repos that involve dealers as the party receiving funds.
However, the amount of repo funding extended by non-banks to the shadow banking
is a reverse repo
22
sector is only the $1 from the MMF to dealer bank B. Interdealer repos do not raise
funding for the shadow banking system, but instead reallocate funds within the shadow
banking system.
Repos between shadow bank intermediaries and hedge fund also often involve si-
multaneous repo/reverse-repo trades in which a dealer obtains one security as collateral
(say, a Treasury bond) from a hedge fund client in a reverse-repo transaction and at
the same time delivers another one (say, a corporate bond) to the same hedge fund in
a repo transaction. These transactions are e!ectively just an exchange of one security
against another and hence do not provide net funding to dealer banks. The repo leg
of these trades is included in the Fed’s Primary Dealer repo statistics.8
For these reasons, the amount of repo funding provided by non-banks shadow banks,
and the extent of its contraction, cannot be inferred from the Federal Reserve’s Primary
Dealer repo statistics. Estimates of the total size of the repo market based on the Pri-
mary Dealer repo numbers, as in Adrian and Shin (2009) or Gorton and Metrick (2011),
are di"cult to interpret, because these estimates do not distinguish between length of
intermediation chains within the shadow banking system from the repo funding raised
from outside the system. The shortening of intermediation chains that is implied by
the sharp contraction in Primary Dealer repo may be informative about other problems
in the shadow banking system that are not our focus here. For example, dealers may
have tried to reduce network exposures to vulnerable dealers, which made them more
8The substantial extent of these simultaneous repo/reverse repo transactions can be estimatedfrom dealers’ o!-balance sheet pledged collateral. FASB interpretation (FIN) 41 allows netting of therepo and reverse repo if they are both with the same counterparty and same maturity. For example,Goldman Sachs’ broker/dealer subsidiary reported, in its November 2006 FOCUS report filed with theSEC, a total of $489bn of collateral owned or received that was pledged, while the balance sheet onlyreports a total of $306bn repos, securities loaned, and financial instruments sold but not yet purchased.The di!erence of $183bn likely reflects repos netted with reverse repos, or similar transactions, thatsatisfied the requirements for netting of FIN 41. See King (2008) for similar calculations for severaldealer banks in 2008.
23
reluctant to lend to each other, and which inhibited the e"cient allocation of liquidity
within the shadow banking system.
A better benchmark against which to compare our data coverage is the size of the
tri-party repo market. According to data from Bank of New York Mellon and J.P.
Morgan, the total amount of tri-party repo was roughly $2.5 trillion at the end of
2007 (Federal Reserve Bank of New York (2010)), which compares with about $1.1
trillion of MMF and SL repo in our data. However, the Bank of New York Mellon and
J.P. Morgan numbers also include GCF repo, which is a form of interdealer repo (see
Copeland, Martin, and Walker (2010)). Our earlier analysis of Flow of Funds Accounts
data suggest that our MMF and SL data captures about two thirds of the repo funding
provided to the shadow banking system.
B. Composition by Type of Collateral
We next turn to evaluating the conjecture by Gorton and Metrick (2010a, 2010b,
2011) that private-label ABS played an important role as the collateral that backed
repo “money.”
Figure 3 presents the share (by notional value) accounted for by di!erent collateral
categories, reported for each quarter. The “Agency” category includes both Agency
bonds and Agency-backed MBS (many funds lump these together when reporting col-
lateral, so we cannot distinguish them in most cases). The “Priv. ABS” category
includes private-label ABS. The “Corporate” category refers to corporate debt, and
the “Other” category is composed mainly of equities, whole loan repos, and some
commercial paper, certificates of deposit, and municipal debt.
The most striking fact in this figure is the relatively small role played by private-
label ABS collateral. Treasury and Agency securities account for the majority of collat-
24

.5.6
.7.8
.91
Sh
are
2007q1 2008q1 2009q1 2010q1Quarter
U.S. Treasury Agency Priv. ABS
Corporate Other
0.2
.4.6
.81
Sh
are
2007q1 2008q1 2009q1 2010q1Quarter
U.S. Treasury Agency Priv. ABS
Corporate Other
Figure 3: Share of collateral types for money market fund repo (top) and securitieslender repo (bottom). The RMA data for securities lenders combines corporate andprivate-label ABS collateral. The split shown in this figure is imputed based on theassumption that the relative proportion of corporate and private-label ABS collateralis the same as for MMF.
25

eral in MMF repos. Private-label ABS make up less than 10% of MMF repo collateral
prior to the crisis, which corresponds to about $31 billion in terms of value. For SL,
Agency and Treasury securities account for roughly 50% of repo, with private label
collateral making up a more significant portion of the porfolio.
Private-label ABS disappears as collateral from MMF as the financial crisis reaches
its peak in 2008. Corporate debt also disappears almost entirely. Thus, riskier and
less liquid collateral were not used for financing in the tri-party repo market at that
time. For SL, we observe the same pattern of a reduction in the share of riskier and
less liquid collateral during the crisis. The disappearance of private credit instruments
as collateral is less extreme, though, than for MMF. The reduction of repo against
private-label ABS reflects the “run on repo” that many have commented on and we
will delve more into this run in the next sections.
IV. Short-term Funding of Private Credit Instru-
ments
We next ask how repo compares as a funding source for private-sector securitized
assets to other forms of short-term funding. We focus particularly on the importance
of ABCP vis-a-vis repo because both are proto-typical shadow banking transactions
involving relatively safe short-term funding a private sector asset.
A. Short-term Funding at the Onset of the Financial Crisis
The first row of Table II presents data on the total outstanding U.S. private-label ABS
in 2007Q2. The $5.213tn outstanding is the heart of what is commonly referred to as
26

Table II: Funding of Outstanding U.S. Private-Label ABS and Corporate Bonds in2007Q2 ($bn)
Private-label ABS Corporate BondsAmount % Amount %
Total outstanding1 5,213 100% 5,591 100%
Short-term fundingABCP2 1,173 23%Direct holdings3
MMF 243 5% 179 3%Securities lenders 502 10% 369 7%
Repo4
MMF 31 1% 42 1%Securities lenders 120 2% 166 3%
Total short-term 2,069 40% 755 14%
1 Souce: SIFMA for ABS, where ABS is ex CDO of ABS (the latter estimated as in He, Khang, andKrishnamurthy (2010)); Flow of Funds for corporate bonds, ex bonds issued by foreigners and ABSissuers.2 Source: Federal Reserve Board.3 Source: Risk management Association (RMA) for securities lenders, and Flow of Funds for totaldirect holdings by MMF of corporate bonds including ABS. The direct holdings estimate for MMF isbased on the assumption that the ratio of private-label ABS holdings to corporate bonds is the samefor MMF as the observed one for securities lenders.4 RMA (securities lenders) and SEC filings (MMF). The MMF repo numbers from our SEC filingsdata are scaled up to match the total amount of MMF repo according to the Flow of Funds. TheRMA data combines repos with corporate and private-label ABS collateral. The repo estimate forsecurities lenders is based on the assumption that the ratio of repos with private-label ABS to reposwith corporate debt securities collateral is the same for securities lenders as the observed one for MMF.
27

the shadow-banking sector; i.e., residential mortgages and other loans that are held in
securitization pools or in SPVs. The main sub-categories in the $5.213tn are roughly
$3tn private-label RMBS and CMBS (data from the Securities Industry and Financial
Market Association), which include about $1.4tn subprime RMBS outstanding at the
onset of the crisis (Greenlaw, Hatzius, Kashyap, and Shin (2008)). We also provide
data on the outstanding corporate bonds as some of these securities (e.g., bonds used
to finance LBOs, senior bank loans) also comprise the shadow banking sector. The
outstanding amount of corporate debt, excluding commercial paper, was $5.591tn in
2007Q2.
The table also details the amount of these securities financed by repo from MMF
or SL. Total repo of private-label ABS is $151bn. Even if we include the repo extended
against corporate bonds, the repo total is only $359bn. This is a small fraction of the
outstanding assets of shadow banks. This observation underscores a principal finding
of this study: repo was of far less importance in funding the shadow-banking sector
than is commonly assumed.
If repo was not the principal source of short-term funding, what was? The table
details the direct holdings of these securities by MMF and SL. The direct holdings are
substantial, totaling $745bn. It is likely that such holdings are high grade and short
maturity tranches of securitization deals. The largest source of funding is ABCP of
$1,173bn.9 The comparison between ABCP and repo shows that ABCP was probably
9Acharya, Schnabl, and Suarez (2012) note that the assets in the SPVs financed by ABCP are a50-50 mix of ABS and other loans (receivables or whole bank loans). As they point out, when anSPV contains loans rather than already-securitized assets, one can think of ABCP as the first layer ofsecuritization (which may be temporary if loans are “warehoused” in the SPV until they are eventuallypermanently securitized). In this case, too, the shadow banking system funds long-term assets withshort-term debt, and hence it makes sense to include the full amount of ABCP in our comparisonhere because this is one channel through which the shadow banking system funds long-term assets.One could therefore also add about 50% of ABCP as first-layer securitization to the headline amountof outstanding ABS/MBS, but this would not materially change the message of the table.
28

more important as a stress-point for the shadow banking system.
B. Contraction in Short-term Funding During the Financial
Crisis
Table III documents the contraction in short-term funding of the shadow banking sector
between 2007Q2 and 2009Q1. Total repo for private-label ABS goes to almost zero.
However, as we have noted, the quantity of contraction is modest since repo was a
relatively small source of funding. The contraction in repo funding accounts for only
about 10% of the total short-term funding contraction of roughly $1.4 trillion.
A striking fact is that repo with private-label ABS collateral completely disappears.
Thus, even though the total contraction is small, it seems possible that institutions
that were entirely reliant on repo were particularly a!ected by the reduction in repo
with private collateral. We return to this point later in the paper. For example, this
observation may square with accounts of the failures of Bear Stearns and Lehman
Brothers (see Du"e (2010)).
For the entire shadow bank sector though, the more important contraction was in
ABCP, which falls by $662bn. Direct holdings of ABS by MMF and SL also falls by
$568bn. The bottom panel of the table documents the contraction in corporate bonds.
The contraction is more modest, and this is likely driven by the fact that corporate
bonds did not su!er from the same rise in perceived risk and illiquidity as ABS.
Figure 4 illustrates the contraction in ABCP and repo graphically, quarter-by-
quarter. The figure compares the amount of repo with private-label ABS collateral
with the amount of ABCP outstanding, net of the amount funded through the Federal
Reserve’s Commercial Paper Funding Facility (see Adrian, Kimbrough, and Marchoni
29

Table III: Contraction in Short-term Funding ($bn.)
2007Q2 2009Q1 Contraction
private-label ABSABCP1 1173.2 511.0 -662.2Direct holdings
MMF3 243.3 59.4 -183.9Securities lenders2 501.6 116.0 -385.6
RepoMMF 30.5 0.3 -30.2Securities lenders4 120.1 1.6 -118.5
Total -1380.4
Corporate bondsDirect holdings
MMF3 178.9 158.4 -20.5Securities lenders 368.7 309.1 -59.6
RepoMMF 42.1 9.7 -32.4Securities lenders4 165.6 49.3 -116.3
Total -228.8
1 Source: Federal Reserve Board. ABCP outstanding less the amount of ABCP financed through theCommercial Paper Funding Facility ($116.8bn in 2009Q1).2 Part of these holdings is in the form of ABCP, part in direct holdings of long-term ABS (i.e.,possible double-counting with ABCP)3 The direct holdings estimate for MMF is based on the assumption that the ratio of private-labelABS holdings to corporate bonds is the same for MMF as the observed one for securities lenders.4 Risk management Association (RMA) and SEC filings (MMF). The RMA data combines reposwith corporate and private-label ABS collateral. The repo estimate for securities lenders is based onthe assumption that the share of repos with private-label ABS to repos with corporate debt securitiescollateral is the same for securities lenders as the observed one for MMF.
30

!"!
#!!
#"!
$!!
%&'()*+),(,!-.&,/0)123+423
5!!
6!!
7!!
#$!!
#"!!
4289)(:;<;-,=>,.
$!!6?5 $!!@?5 $!!A?5 $!!7?5 $!#!?5B:-C;&C
4289)(:;<;-,=>,. %&'()*+),(,!-.&,/0)123+423
Figure 4: Comparison of private-label ABS repo with ABCP outstanding (ex CPFF)
(2011)). The contraction in ABCP starts earlier than that of repo and continues
steadily through the crisis. The repo contraction occurs in a small window around 2008
Q1, roughly corresponding to the failure Bear Stearns. The fact that the contraction
in repo with private-label ABS starts later than ABCP indicates that the initial cracks
in shadow bank funding appeared in ABCP, not in the repo market.
The contraction in both repo and ABCP are consistent with the views of many
commentators that a contraction in the short-term debt of shadow banks played an
important role in the collapse of the shadow banking sector. While there are similarities
between repo and ABCP, the observation that ABCP plays a more important role
than repo in the short-term funding contraction is important for understanding the
mechanisms behind the spill-over into the wider financial system. While both ABCP
and repo are collateralized forms of short-term debt, ABCP typically receives liquidity
support guarantees from a commercial bank rather than a broker/dealer. When the
31

SPVs backed by ABCP could no longer roll over their short-term debt, their assets came
back onto the balance sheets of sponsoring banks (Covitz, Liang, and Suarez (2012), He,
Khang, and Krishnamurthy (2010)), spreading the problem to the regulated banking
system. The liquidity problems created by this loss of funding was relatively contained
because commercial banks had direct access to funding from the Federal Reserve. The
problem that commercial banks faced as a consequence was less one of funding liquidity
than the problem that supposedly o!-balance sheet assets of dubious value migrated
back onto their balance sheets depleting their capital.
The relative importance of ABCP in funding private-label ABS also sheds some
light on potential drivers of the run-up in short-term debt financing prior to the crisis.
The fact that the run-up and crash was concentrated in a part of the shadow banking
system that operated with implicit and explicit (but o!-balance sheet) support from
regulated banks supports the regulatory arbitrage arguments of Acharya, Schnabl,
and Suarez (2012). The extensive involvement of European commercial banks in the
ABCP business further points towards the global imbalances argument of Caballero
and Krishnamurthy (2009) and the global banking glut theory of Shin (2011).
C. Demand or Supply?
One thorny issue to sort out from this data is whether or not the contraction in out-
standing volumes was driven by supply forces or demand forces. That is, one interpre-
tation of this data is that cash investors including MMF and SL change their portfolios
to avoid ABS repo and ABCP (“repo supply”). A natural explanation for the fall in
loan supply is that the underlying collateral became illiquid, and higher haircuts do
not o!er protection against illiquidity, as in our model in Section I.B, leading cash
investors to cut lending altogether. It is also possible, though, that hedge funds and
32

dealer banks, motivated by the increased risk and uncertainty in asset markets, chose
to reduce their holdings of securities and hence no longer needed funding from the repo
markets (“repo demand”).
The quantity data is suggestive of a supply contraction (we discuss the price data in
the next section). First, the outstanding amount of securities in SPVs backing ABCP
was essentially fixed over this period. That is, banks sponsored the SPVs, filled them
with loans and securities, and issued ABCP and other claims against them, letting
them wind down as the loans and securities matured. The banks were not taking an
active decision to increase or decrease the loans/securities in the SPV. Thus, at least
for ABCP, it is likely that all of the action is driven by loan supply forces. Since ABCP
and repo are close substitutes for an MMF or SL, it is likely that the desire to not own
ABCP is mirrored in a desire to not own repo. Thus, it is likely that the contraction
in repo is also driven by supply forces.
Second, the fact that repo quantity goes to zero also suggests that supply was at
work. While dealer banks and hedge funds reduce their holdings of ABS/MBS over this
period (see He, Khang, and Krishnamurthy (2010)), they did not reduce their holdings
to zero, and so a financing need still existed.
Last, flows into money market funds provide another indication that the contrac-
tion was driven by supply-side e!ects. From September to December 2008, taxable
government money market funds received inflows of $489 billion while taxable non-
government money market funds experienced outflows of $234 billion (data from the
Investment Company Institute). Thus, part of the reduction in repo of non-goverment
securities, and the increase in repo with government securities during the later stages
of the crisis may have been driven by investors’ reallocation between money market
funds that invest only in government securities and other money market funds.
33
V. Repo Terms During the Financial Crisis
This section presents data on the evolution of the terms of repo contracts, including
repo rates, haircuts, and repo maturities. The analysis is based on the MMF repo data.
The data we present suggests that the “price” of repo borrowing rose over the crisis.
In conjunction with the quantity evidence, the results further suggests that a central
factor driving repo market dynamics in the crisis was the desire of cash lenders to avoid
lending against ABS collateral. The data on the change of contract terms also suggest
that it is a combination of risk-aversion and illiquidity aversion that drives cash lender
behavior.
A. Maturity Compression
Figure 5 illustrates the shortening in the maturity structure of repos over the crisis.
In general, the majority of repo contracts are overnight. In equal-weighted terms (top
panel), the 90th percentile reached 120 business days in 2007, but it subsequently
shrank to 20 business days. In value-weighted terms (bottom panel), the figure shows
a similar pattern, but the maturity compression is more concentrated in the tail since
the overwhelming majority of large repos are overnight. The reduction in maturity
is consistent with an increased demand for liquidity from cash-investors, since shorter
maturity repo is de-facto more liquid than longer maturity repo. Krishnamurthy (2010)
provides evidence of investors’ increased desire for liquidity over the crisis, as reflected
in a number of di!erent asset markets. That is, the data in Figure 5 is reflective of a
more general phenomenon that played out over the crisis.
34

(a) Equally weighted
050
100
150
Matu
rity
(busin
ess d
ays)
2006q3 2007q3 2008q3 2009q3 2010q3Quarter
90th 80th 70th 60th
(b) Weighted by notional value
050
100
150
200
250
Matu
rity
(busin
ess d
ays)
2006q3 2007q3 2008q3 2009q3 2010q3Quarter
99th 98th 95th 90th
Figure 5: Percentiles of Repo Maturities
35

B. Haircuts
Figure 6 plots the value-weighted average haircuts for di!erent categories of collateral
over the sample period. Since MMF file their SEC reports at di!erent month-ends
throughout each quarter, we can calculate these averages at a monthly frequency. The
line for private-label ABS has a gap from late 2008 to late 2009, as this type of collateral
completely disappeared during this period (see Figure 3). It is apparent that haircuts
for private-sector collateral increased significantly from 2007 to 2010 from around 3-
4% to about 5-7% for corporate debt and private-label ABS. The similarity of haircut
time series for private-label ABS and for corporate bonds until the collapse of Lehman
Brothers in September 2008 suggest that, at least until that point in time, the problem
was more generalized and not something specific to securitized assets. All of these
patterns are suggestive of cash investors’ desire to avoid risk/illiquidity in their repo
loans.
An important observation from this data is that the patterns in haircuts that we
observe in the tri-party repo market appear di!erent from the bilateral interdealer
repo haircuts reported in Gorton and Metrick (2011).10 First, in Gorton and Metrick’s
data average haircuts are frequently zero in 2007 for corporate debt and securitized
products, while the MMF repos in our data always have average haircuts of at least 2%,
even for Treasuries and Agency debt. Second, although our value-weighted averages
(which is the most relevant measure of aggregate funding conditions) are di"cult to
compare with the equal-weighted averages in finer categories reported in Gorton and
Metrick (2011), an informal comparison suggests that haircuts in tri-party repos of
MMF increased much less than the haircuts in their interdealer repo data (Gorton and
10While our findings on haircuts are at odds with Gorton and Metrick (2011), they are similar toCopeland, Martin, and Walker (2010).
36

24
68
Pe
rce
nt
2006m7 2007m7 2008m7 2009m7 2010m7Month
U.S. Treasury Agency
Priv. ABS Corporate
Figure 6: Haircuts by Collateral Type (weighted by notional value)
Metrick report average haircuts in excess of 50% for several categories of corporate
debt and securitized products).
Taken together with our findings of the relatively small amounts of MMF repos
against private-label ABS collateral, these observations suggest that the “run on repo”
may have had a more modest e!ect on aggregate funding conditions for the shadow
banking system than what one may guess from the enormous increase in haircuts for
securitized products in the bilateral interdealer repo market as reported by Gorton and
Metrick (2011). The model in Section I.B suggests that the higher bilateral haircuts
may reflect a credit crunch driven by weak balance sheets of dealers, rather than a
direct symptom of a “run on repo”.
Finally, there are some surprising patterns in this data. First, the increase in
37

haircuts does not revert following the peak of the financial crisis in 2008. Haircut
levels in 2010 are still as high, or even higher than at the end of 2008. Second, average
haircuts for Agency collateral remained the same as those for Treasury obligations,
despite the troubles of Fannie Mae and Freddie Mac during the summer of 2008.
C. Repo Rates
Figure 7 presents time-series of value-weighted average overnight repo rates (weighted
by notional amounts). As a benchmark for comparison, we use the Federal Funds rate
as a default-free rate proxy.11
As shown in Panel (a) of Figure 7, the average overnight repo rate for Treasury
collateral typically tracks the Fed Funds rate quite closely, but there are some striking
deviations. Starting in 2007, the repo rate on Treasuries drops below the Fed Funds
rate. This wedge reaches a maximum of almost 100bps in 2008Q1. It is apparent
that Treasuries as a class represented preferred collateral, and as Treasury collateral
was scarce, the repo rates on this collateral fell substantially below other risk-free
benchmarks. Note that the repo rate here is the general collateral repo rate and not
the “special” collateral repo rate as discussed in Du"e (1996). Indeed, this evidence
is more consistent with Krishnamurthy and Vissing-Jorgensen (2012) who argue that
Treasuries as a class command a collateral/liquidity premium. Fleming, Hrung, and
Keane (2010) investigate the low Treasury repo rate phenomenon in detail and show
that the implementation of the Term Securities Lending Facility (TSLF) in March 2008,
in which the Federal Reserve lent Treasury securities against non-Treasury collateral,
helped to reduce the repo premium on Treasuries.
There is substantial variation in the repo rate by category of collateral, as evidenced
11The Federal Funds rate is an overnight rate and as such almost free of default risk.
38

(a) Average Overnight Treasury Repo Rate and Fed Funds Rate
02
46
Perc
ent
2006m7 2007m7 2008m7 2009m7 2010m7Month
Fed Funds Rate Treasury Repo Rate (vw.)
(b) Average Overnight Repo Rate in Excess of Fed Funds Rate
01
23
45
Perc
ent
2006m7 2007m7 2008m7 2009m7 2010m7Month
Agency Priv. ABS
Corporate
Figure 7: Average Repo Rates (weighted by notional value)
39

in Panel (b) of Figure 7. The spread between the Fed funds rate and the repo rate for
Agency debt, corporate debt, and private-label ABS increased from close to zero in 2007
to almost 200bps in 2008Q1. The higher rates are consistent with cash investors’ desire
to avoid lending against risky/illiquid collateral and scarcity of Treasury collateral
around the time of the Bear Stearns collapse. The spread drops after the introduction
of the TSLF in March 2008, but it spikes again in September 2008 following the collapse
of Lehman Brothers. Private-label ABS collateral was almost absent at that time, but a
small volume of repo transactions took place at an average repo rate spread to Treasury
collateral of around 500bps. Corporate debt collateral commanded a similar spread.
In contrast, repo rates for Agency debt did not increase.
A final observation from this data is that unlike haircuts in Figure 6, these repo
rate spreads have reverted to near pre-crisis levels as financial markets normalized in
2009 and 2010. It is noteworthy that quantities and haircuts on some asset classes
have continued to reflect stress conditions. A possible explanation is that market par-
ticipants’ assessment of the risks of private debt instruments was permanently changed
by the financial crisis.
VI. Cross-sectional Patterns by Repo Counterparty
We now turn to evaluating another channel through which the repo contraction may
have contributed to the crisis. While the contraction in repo was relatively insignificant
for shadow bank funding in aggregate, its e!ects may have been amplified if the con-
traction disproportionately a!ected key institutions. This section presents some data
that is supportive of this channel. It is also possible that some dealer banks may have
been perceived as more prone to default than others, which may have led cash lenders
40

to run on repo of these banks, irrespective of the type of collateral o!ered. To shed light
on these issues, we examine how the contraction in repo funding with private collateral
played out in the cross-section of counterparties, and whether di!erent counterparties
faced di!erent repo terms (haircuts, repo rates) around the peak of the financial crisis.
Since we only have cross-sectional data by counterparty for MMF repos, but not for
SL repos, a caveat is that the following analysis only captures a partial picture of the
total repo funding flows from non-banks to dealer banks.
A. Changes in Repo Quantities by Counterparty
Dealer banks that were most reliant on repo funding for private collateral in the pre-
crisis period should be expected to have been more a!ected by the crisis. To measure
their pre-crisis reliance on private collateral repo funding we focus on the period prior
to the rescue of Bear Stearns in March 2008 as this was the time just before repo
volumes with private collateral started to contract. Since each MMF files holdings
reports only every three months, we sum up the repo funding amounts per counterparty
over three month windows.12 For each counterparty, we calculate the pre-Bear Stearns
(BSC) amounts of repo with di!erent collateral types by summing MMF repos over
the three months from December 2007 to February 2008. The latter date is when repo
funding with private collateral starts to contract (see Figure 4). We then compare these
numbers with the repo funding post-Lehman (LEH) (September 2008 to November
2008).
Figure 8 shows how repo funding contracted or expanded for each repo counterparty
12Otherwise one would run into the problem that a counterparty might finance Treasuries with oneMMF that files the holdings, say, at the end of February and private-label MBS with a di!erent MMFthat files holdings at the end of January. Looking at the repo funding amounts in February wouldyield a misleading picture in this case.
41

!"#
!#$
!%&'(
##$
)!
)*!
+$
,!#
-%+
.&/
/0*
/1+
/$
*!$
$#+2(
3!$
4!!56
756
8856
9,"%+0:;*0!<=9:>?:;?$>!@AB
7 58 5C 5D 5E 56 5F 5G 5H 5I;*-J">0:9?22">0*"2:=,"*0:;*0!<=9
K?>"2:L0&?
!"#
!#$
!%&'(
##$
)!
)*!
+$
,!#
-%+
.&/
/0*
/1+
/$
*!$
$#+2(
3!$ 4!
!56
756
8856
9,"%+0:;*0!<=9:>?:;?$>!@AB
7 58 5C 5D 5E 56 5F 5G 5H 5I;*-J">0:9?22">0*"2:=,"*0:;*0!<=9
K0&?:4L:M*0"$3*(LN+0%#(:9?22">0*"2
!"#
!#$ !%&'(
#
#$)!)*!+$
,!#-%+.&/
/0*
/1+
/$
*!$$#+2(3!$
4!
!56
756
8856
9:%;*"#;-:%<=*0!>?9<;:<=:$;!@AB
7 58 5C 5D 5E 56 5F 5G 5H 5I=*-J";0<9:22";0*"2<?,"*0<=*0!>?9
K0&:<4L<=*-J";0<9:22";0*"2
Figure 8: Contraction/Expansion in MMF Repo from Pre-Bear Stearns (Dec. 07 toFeb. 08) to Post-Lehman (Sep. 08 to Nov. 08). Change expressed as share of totalMMF repo in pre-Bear Stearns period (Dec. 07 to Feb. 08).
42

in our data from the pre-BSC period to the post-LEH period, where the change is
expressed as a fraction of each counterparty’s total repo funding from MMF in the
pre-BSC period. Bear Stearns and Lehman Brothers are not included in this plot,
as we cannot compute their post-LEH repo funding, but further below we will show
data on their private collateral shares in the pre-BSC period. The top panel plots the
change in total Repo funding against the pre-BSC private collateral share. The figure
shows that there was substantial heterogeneity in reliance on private debt instruments
as repo collateral. Mizhuo (MFG), Royal Bank of Scotland/Greenwich (RBS), Societe
Generale (SCGLY), Barclays (BCS) have private collateral shares of close to zero, while
Merrill Lynch (ML), Morgan Stanley (MS), Goldman Sachs (GS), and Citigroup (C)
have private collateral shares of almost 50%. Wachovia (WB) is an outlier with a
private collateral share above 80%. The change in total repo funding from the pre-
BSC to the post-LEH period is negatively correlated with the private collateral share
in the pre-BSC period. Total repo funding expanded for most counterparties, but it
contracted for many of those that had relatively high private collateral shares before
the financial crisis reached its peak.
The two panels below break the change in total repo funding into the change in repo
funding with Treasury and Agency collateral (middle) and the change in repo funding
with private collateral (bottom). They show that the change in total repo funding has
two drivers: (a) repo funding with Treasury and Agency collateral expands for most
counterparties, except those with high pre-BSC private collateral shares; (b) repo with
private collateral disappears almost completely for all counterparties (which leads to a
regression slope of approximately -1.0 in the bottom panel).
Figure 9 shows that the counterparties with the highest private collateral shares
in the pre-BSC period are also more likely to be among those that had the highest
43
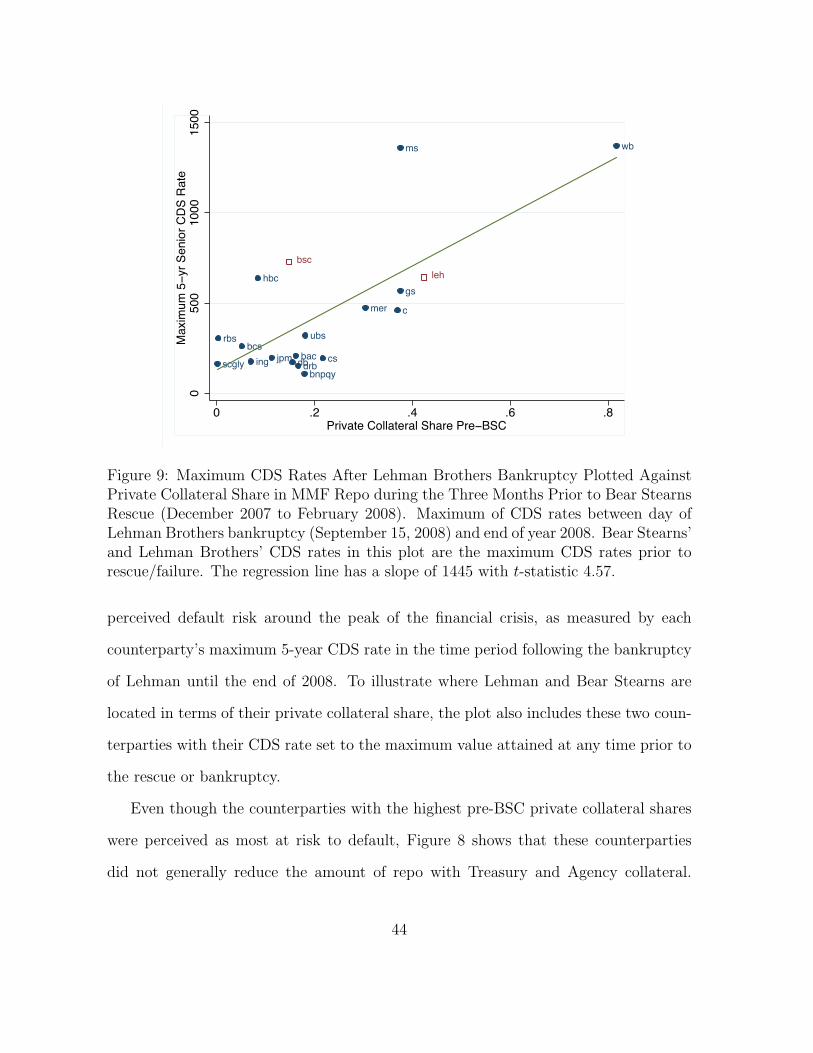
!"#!#$
!%&'(
#
#$)!)*!
+$
,!#
-%+ .&/
/0*
/$
*!$
$#+1(
2!$
3!
!$#
10,
4544
6444
6544
7"8-/2/95!(*9:0%-;*9<=:9>"?0
4 @A @B @C @DE*-F"?09<;11"?0*"19:,"*09E*0!G:<
Figure 9: Maximum CDS Rates After Lehman Brothers Bankruptcy Plotted AgainstPrivate Collateral Share in MMF Repo during the Three Months Prior to Bear StearnsRescue (December 2007 to February 2008). Maximum of CDS rates between day ofLehman Brothers bankruptcy (September 15, 2008) and end of year 2008. Bear Stearns’and Lehman Brothers’ CDS rates in this plot are the maximum CDS rates prior torescue/failure. The regression line has a slope of 1445 with t-statistic 4.57.
perceived default risk around the peak of the financial crisis, as measured by each
counterparty’s maximum 5-year CDS rate in the time period following the bankruptcy
of Lehman until the end of 2008. To illustrate where Lehman and Bear Stearns are
located in terms of their private collateral share, the plot also includes these two coun-
terparties with their CDS rate set to the maximum value attained at any time prior to
the rescue or bankruptcy.
Even though the counterparties with the highest pre-BSC private collateral shares
were perceived as most at risk to default, Figure 8 shows that these counterparties
did not generally reduce the amount of repo with Treasury and Agency collateral.
44

Morgan Stanley, the counterparty with the second highest perceived default risk at the
end of September 2008 and the third highest private collateral share in the pre-BSC
period, even increased its amount of repo funding with Treasury and Agency collateral
substantially. While these findings are subject to the caveat that we only observe MMF
repos, and not repos with SL and other cash providers, they are suggestive that repo
funding with high-quality collateral remained available even for dealer banks with high
perceived default risk.
Some accounts of the failure of Bear Stearns and Lehman suggest that these dealer
banks did indeed experience di"culty in rolling over repo on all forms of collateral, but
only in the last days before failure. This is not captured in our low-frequency MMF repo
data. Copeland, Martin, and Walker (2010) present daily data on Lehman’s tri-party
repo book in September 2008 and document that the total amount of repo funding
started to contract substantially only a few days prior to Lehman’s bankruptcy filing.
They show that the contraction a!ected all collateral categories, including Treasury
collateral.
B. Repo Terms by Counterparty on September 30, 2008
Funding di"culties of dealer banks with high perceived default risk, even if not apparent
in repo quantities, could also manifest themselves as a worsening of the price-terms of
repo agreements. For this reason, we also examine cross-sectional variation in haircuts
and repo rates of di!erent counterparties and find that most of the variation is due to
the type of collateral rather than the credit risk of counterparties. This finding further
reinforces our conclusion that funding problems at some dealer banks are driven by a
lack of high-quality collateral (and a contraction of repo loan supply for low-quality
collateral) rather than a general reluctance of repo lenders to extend credit to high-risk
45

counterparties. We again focus our analysis on the end of September 2008, the time
when dealer banks faced the most adverse funding conditions.
For the purpose of this analysis, we refine our categorization of collateral to deal
with some ambiguity in classification of Treasury and Agency collateral. We create
an additional mixed Treasury/Agency category for cases in which we cannot cleanly
classify the collateral as Treasury or Agency securities. This includes cases, for example,
in which the collateral is a portfolio of Treasury and Agency securities. In these cases,
we had so far assigned the collateral type that has the highest number of counts in the
list of securities comprising the collateral portfolio. But this means that some variation
in repo rates within a category could be driven by collateral portfolio composition rather
than the characteristics of the repo counterparty. This ambiguity is not significant
when Agency and Treasury collateral commands very similar terms in repos, but on
September 30, 2008 it could be significant. We further put all non-Treasury, non-
Agency collateral into a private collateral group. On September 30, 2008, this group
includes almost exclusively corporate bonds or corporate equities.
The top graph in Figure 10 plots the (value-weighted) average haircuts of each
counterparty, against the CDS rate for 5-year senior debt on September 30, 2008. It is
apparent from these figures that average haircuts vary by collateral type, but within
collateral categories, they are virtually identical for di!erent counterparties, irrespective
of the CDS rate. The bottom graph plots the (value-weighted) repo rate against the
CDS rate. While there is some variation in repo rates within collateral categories, this
variation is not correlated with the CDS rate of the counterparty.
46

!"
#$
%&'()*+
, !,, #,, -,, .,, /,,,$!0(1234'5(167218&+319:",:!,,.
;(3&<*(0 ;(3&<*(0:=>34)0
=>34)0 ?('@&+3
%&'()*+<
!"
#$
%&'()*&+,'
! "!! #!! $!! %!! -!!!.!/0*1'23)0*451*&+,'*678!7"!!%
90'+:;0/ 90'+:;0/7<='2>/
<='2>/ ?03@+,'
&'()*&+,':
Figure 10: Overnight Repo Rates and Haircuts on September 30, 2008. Value-weightedaverages per counterparty
47

VII. Federal Reserve Programs
Any evaluation of repo quantities during the financial crisis also must take into ac-
count that the the Federal Reserve initiated a series of funding programs, beginning in
2008Q1, that partly replaced private-sector repo lending. While these programs were
intended to o!set the reduction in private sector funding of the shadow banking sector,
it is also possible that these programs attracted some repo borrowers that would have
been able to access private markets. We are not able to establish the counterfactual,
i.e., the hypothetical amount of repo lending that would have taken place in private
markets in the absence of the Fed’s programs, but we can shed light on the extent to
which these programs did in fact o!set the private contraction in aggregate, and the
level of individual dealer banks. We also compare the terms of the Fed facilities versus
market terms.
A. Quantity of Fed Funding
We focus on four principal programs:
1. PDCF (Primary Dealer Credit Facility), March 2008: Loan facility that pro-
vided funding to primary dealers in exchange for any tri-party-eligible collateral.13
Loans were overnight, and made at the primary credit discount rate.
2. TSLF (Term Securities Lending Facility), March 2008: Facility to loan Treasuries
from the Fed’s portfolio in exchange for investment-grade collateral.14 Loans were
28-day, and rates were set in an auction.
13Before September 14, 2008, the collateral was restricted to investment grade securities (Adrian,Burke, and McAndrews (2009))
14Before September 17, 2008 the range of eligible collateral was more restricted (Fleming, Hrung,and Keane (2009))
48

3. Maiden Lane I and III, various dates: Fed made loans to SPVs that held private-
label ABS. Facilities were set up in conjunction with interventions in Bear Stearns
and AIG.
4. CPFF (Commercial Paper Funding Facility), October 2008: Fed made loans to
an SPV to purchase 3-month ABCP.
We omit Maiden Lane II, because this SPV acquired assets from AIG’s securities
lending business that were, prior to the crisis, funded with cash collateral that AIG
obtained in securities lending transactions, which means that these assets were not
funded with repo prior to the crisis. Maiden Lane III, in contrast, purchased ABS not
from AIG, but from dealer banks to whom AIG had sold credit protection on these
ABS. These dealer banks may have financed these ABS holdings with repo, and so we
include Maiden Lane III.
The top plot in Figure 11 aggregates the private-label ABS repos of MMF and SL
along with the funding on these securities that came from the Fed through PDCF,
TSLF, and Maiden Lane I and III.15 The figure shows that Fed programs o!set a
considerable portion of the contraction in repo funding starting in 2008Q1. As a result,
total funding smoothly decreases during the subsequent quarters. The bottom plot in
Figure 11 presents the same data for corporate bond repos. The Fed programs were
used much less in this case. But, the private sector funding contraction is also not as
severe.
Figure 12 presents the data for ABCP. The private sector funding contraction was
quite gradual and the CPFF was not as used. We should also add that a significant
portion of the assets from the ABCP funded SPVs were taken back onto commercial
15The split of SL repo between corporate debt securities and private-label ABS is calculated underthe assumption that the split (in terms of percentage) is the same as for MMF repos.
49

(a) private-label ABS
05
01
00
15
02
00
Am
ou
nt
($b
n.)
2006q3 2007q3 2008q3 2009q3 2010q3Quarter
Repo Maiden Lane
TSLF PDCF
(b) Corporate Debt
50
10
01
50
20
02
50
30
0A
mo
un
t ($
bn
.)
2006q3 2007q3 2008q3 2009q3 2010q3Quarter
Repo TSLF
PDCF
Figure 11: Repo and Federal Reserve (TSLF and PDCF) funding of Private SectorAssets
50

40
06
00
80
01
00
01
20
0A
mo
un
t ($
bn
.)
2006q3 2007q3 2008q3 2009q3 2010q3Date
ABCP ex CPFF ABCP in CPFF
Figure 12: ABCP oustanding (ex CPFF) and Federal Reserve (CPFF) funding
bank balance sheets. Commercial banks had access to alternative funding sources
including FDIC insured bank deposits and FDIC insured bond issues (see He, Khang,
and Krishnamurthy (2010)). With such alternatives it may be that the CPFF was not
as needed as the facility directed to dealer banks.
B. Fed Program Participation, by Dealer Bank
Where did the dealers with high pre-BSC private collateral shares turn for financing?
Column (2) in Table IV shows that part of the answer is that the Fed provided the
funding through the TSLF. In schedule 2 TSLF auctions, dealer banks could bid with
investment-grade securities as collateral to obtain Treasury securities on loan against
a fee. The dependent variable in column (2) measures the extent to which a dealer
bank utilized the maximum amount that it was allowed to borrow under schedule 2
in the two schedule 2 auctions just before and after 9/30/08 (9/25/08 and 10/1/08).
51
For each auction, we take the ratio of the loan amount awarded to a dealer bank to
the maximum possible award, and we average this ratio across the two auctions. We
regress this dependent variable on the agency collateral share and the private collateral
share prior to the Bear Stearns rescue (pre-BSC, December 2007 to February 2008).
As the regression results show, dealer banks with a high private collateral share tend
to max out their borrowing capacity under schedule 2.
The regressions in columns (1) and (2) also show that dealer banks with a high
Agency collateral repo share in the pre-BSC period are more likely to max out their
borrowing capacity under both schedules in the TSLF. Moreover, column (3) shows
that the total amount of borrowing under the TSLF on 9/30/08 is positively related
to both Agency and private collateral shares in the pre-BSC period. Thus, only dealer
banks with high pre-BSC Treasury collateral shares do not resort much to the TSLF
(which is sensible, as the purpose of the TSLF was to exchange non-Treasury collateral
against Treasuries).
C. Fed versus Market, Program Terms
The TSLF terms appears cheaper than market terms. For example, the schedule 2
auction on 10/1/08 yielded a (uniform) loan fee of 1.51%. As the TSLF exchanges
non-Treasury collateral against Treasuries, the relevant comparison here is the spread
between Treasury repo rates and repo rates for non-Treasury collateral. Figure 10
shows that the spread for private collateral on 9/30/08 was approximately 7%.16 Thus,
the TSLF rate of 1.51% appears subsidized relative to market conditions at the time.
For Agency collateral, the comparison between the schedule 2 auction and the private
16Private collateral on this date included a substantial amount of corporate equities, which was noteligible as TSLF collateral. However, the average repo rates for corporate debt and corporate equitieswere virtually identical on this date.
52

Table IV: Fed Program Utilization by Primary Dealers in September 2008
For each dealer bank, we have two explanatory variables: Agency share pre-BSC is the proportionof MMF repos with Agency collateral in the three-month period prior to the rescue of Bear Stearns(December 2007 to February 2008). Private share pre-BSC is the share of corporate debt, private-labelABS, and other non-Treasury, private-label collateral in the pre-BSC period. Dependent variablesare defined as follows: For the TSLF, maxout1 denotes average utilization of maximum availableborrowing under TSLF schedule 1 (Treasury and Agency collateral) in the two schedule 1 auctionsclosest to 9/30/08 (9/18/08 and 10/2/08), maxout2 is defined accordingly as the average utilization inschedule 2 auctions (9/25/08 and 10/1/08), while Total refers to the total notional amount of Treasurysecurities borrowed from the TSLF (in $bn) on 9/30/08. PDCF Total is the total amount borrowedfrom the PDCF (in $bn) on 9/30/08. We report t-statistics in parentheses.
TSLF PDCFmaxout1 maxout2 Total Total
(1) (2) (3) (4)
Agency Share pre-BSC 1.43 0.77 46.16 9.34(2.21) (1.58) (2.31) (0.62)
Private Share pre-BSC -0.36 1.10 39.33 57.85(-0.48) (1.92) (1.66) (3.26)
Observations 15 15 15 15Adjusted R2 0.17 0.28 0.36 0.42
market rates is less clear-cut. The spread of Agency repo rates to Treasury repo rates
in Figure 10 is often below 1.51%. However, there is a more clear-cut distinction when
comparing the schedule 1 auction, which accepted Agency but not private collateral, to
the private repo market. The schedule 1 auction on 10/2/08 yielded a (uniform) loan
fee of 0.42%, which is lower than most of the Agency repo spreads in Figure 10. How
can we understand the di!erences in these Fed and market terms, especially where the
Fed terms are set in a competitive auction? It is possible that the di!erences are due
to measurement problems and not comparing repo terms on exactly identical assets.
However, it is also possible that these di!erences are reflective of a stigma attached
53

to TSLF borrowing. Indeed, as we discuss next, it is fairly clear cut that the PDCF
carried such a stigma.
Some dealers with a high pre-BSC private collateral share maxed out their funding
under TSLF. Where did they fund their excess private collateral? As we know from
Figure 8, they did not obtain further repo funding from MMF with this type of col-
lateral. Column (4) of Table 10 provides the answer: They turned to the PDCF. The
amount borrowed from the PDCF is strongly positively correlated with the pre-BSC
private collateral share. Unlike the TSLF, dealer banks with high Agency collateral
shares however avoided the PDCF even though funding rates were attractive for pri-
vate collateral (2.25% on 9/30/08), and all collateral eligible for tri-party repo funding
was also eligible for borrowing under the PDCF. This is consistent with the view that
borrowing from the PDCF was viewed as carrying a stigma similar to the stigma associ-
ated with discount-window borrowing from the Fed (on which the PDCF was modeled).
Borrowing from the PDCF seems to be viewed as a last resort that dealer banks try to
avoid at possibly high cost. For example, Lehman Brothers did not access the PDCF
in the week prior to its bankruptcy filing (Valukas (2010)).
D. Summary
Overall, these findings reinforce the conclusion that the problem of repo was one of
funding private collateral. Any heterogeneity in funding conditions among dealer banks
was driven by the type of collateral held by the banks. The dealers with high private
collateral shares found themselves in di"culty not because of a run on a counterparty
per se, but because getting repo financing with private collateral became expensive. To
avoid high financing costs in the repo market, dealer banks with high private collateral
shares turned to the TSLF and PDCF. Dealer banks with low private collateral shares,
54

in contrast, avoided the PDCF, despite the attractively low rates charged in the PDCF
relative to market rates at the time, which was likely due to a discount window stigma.
VIII. Conclusion
We examine data on the repo lending by money market funds and securities lenders to
understand the role of repo in the demise of the shadow banking system, and as a factor
in the financial crisis. Money market funds and securities lenders provide the majority
of repo funding to the shadow banking system. During the financial crisis, repo funding
collateralized by private-label securitized assets contracted sharply. This aspect of the
data is consistent with the “run on repo” that has been prominently emphasized by
Gorton and Metrick (2010a, 2011, 2010b). However, repo accounts for only a small
fraction of the short-term funding of securitized assets in the shadow banking system
prior to the crisis. This finding does not support the broadbrush picture painted by
Gorton and Metrick that the expansion of repo drove the growth of the shadow-banking
system and the subsequent run on repo caused its collapse. The short-term funding of
securitized assets through ABCP and direct investments by money market investors is
an order of magnitude larger than repo funding, and the contraction in ABCP is an
order of magnitude larger than the run on repo. Short-term debt played an important
role in the expansion and collapse of the shadow banking sector, but, in aggregate,
repo was a sideshow relative to ABCP.
While small in aggregate, the run on repo may have contributed to the crisis through
an alternative channel: Troubles in funding securitized assets with repo may have
been a major source of problems for some systemically important dealer banks that
were most heavily exposed to these assets. We find that dealers with a high share of
55

private securities in repo collateral were the most vulnerable, and most likely to access
emergency programs of the Federal Reserve. The troubles of dealer banks also provide
an explanation for the divergence between the terms of the MMF-to-dealer repo in our
data (in which haircuts rise only moderately), and the interdealer repo in Gorton and
Metrick’s data (which show dramatically rising haircuts): Raising haircuts can be a
response by balance-sheet constrained dealers to their own lack of capital and liquidity.
Overall, the problems in the repo market during the crisis look less like the ana-
logue of a traditional bank run by depositors and more like a credit-crunch in which
dealer banks tightened the terms for their borrowers. Our findings also underscore
that it is important to distinguish between non-bank to dealer repo lending (which is a
source of net funding for the shadow banking system) and interdealer repo (which real-
locates liquidity within the shadow banking system). More research is needed to better
understand the role of interdealer repo markets in the dynamics of shadow banking.
56

References
Acharya, Viral, Philipp Schnabl, and Gustavo Suarez, 2012, Securitization WithoutRisk Transfer, Journal of Financial Economics , forthcoming.
Adrian, Tobias, Christopher R. Burke, and James J. McAndrews, 2009, The FederalReserves Primary Dealer Credit Facility, FRBNY Current Issues in Economicsand Finance 15(4), 1–10.
Adrian, Tobias, Karin Kimbrough, and Dina Marchoni, 2011, The Federal ReservesCommercial Paper Funding Facility, FRBNY Economic Policy Review 17(1),25–39.
Adrian, Tobias, and Hyun Song Shin, 2009, Money, Liquidity and Monetary Policy,American Economic Review 99, 600–605.
Adrian, Tobias, and Hyun Song Shin, 2010, Liquidity and Leverage, Journal ofFinancial Intermediation 19, 418–437.
Brunnermeier, Markus K., 2009, Deciphering the Liquidity and Credit Crunch 2007–2008, Journal of Economic Perspectives 23, 77–100.
Caballero, Ricardo, and Arvind Krishnamurthy, 2009, Global Imbalances and Fi-nancial Fragility, American Economic Review 99, 584–88.
Copeland, Adam, Antoine Martin, and Michael Walker, 2010, The Tri-Party RepoMarket before the 2010 Reforms, Working Paper, Federal Reserve Bank of NewYork.
Covitz, Daniel M., Nellie Liang, and Gustavo Suarez, 2012, The Evolution of a Fi-nancial Crisis: Collapse of the Asset-Backed Commercial Paper Market, Journalof Finance, forthcoming.
Du"e, Darrell, 1996, Special Repo Rates, Journal of Finance 51, 493–526.
Du"e, Darrell, 2010. How Big Banks Fail and What to Do about It. Princeton, NJ:Princeton University Press.
Du"e, Darrell, and Haoxiang Zhu, 2011, Does a Central Clearing CounterpartyReduce Counterparty Risk?, Review of Asset Pricing Studies 1, 74–95.
Federal Reserve Bank of New York, 2010, Tri-Party Repo Infrastructure Reform.White paper.
Fleming, Michael J., Warren B. Hrung, and Frank M. Keane, 2009, The Term Se-curities Lending Facility: Origin, Design, and E!ects, FRBNY Current Issues inEconomics and Finance 15(2), 1–10.
Fleming, Michael J., Warren B. Hrung, and Frank M. Keane, 2010, Repo Market Ef-fects of the Term Securities Lending Facility, American Economic Review: Papers& Proceedings, 591–596.
57

Garbade, Kenneth D., 2006, The Evolution of Repo Contracting Conventions in the1980s, FRBNY Policy Review , 27–42. May.
Geanakoplos, John, 2009, The Leverage Cycle, in Daron Acemoglu, Kenneth Rogo!,and Michael Woodford, eds.: NBER Macroeconomics Annual.
Gorton, Gary, and Andrew Metrick, 2010a, Haircuts, Federal Reserve Bank of St.Louis Review 92, 507–519.
Gorton, Gary, and Andrew Metrick, 2010b, Regulating the Shadow Banking System,Brookings Papers on Economic Activity (2), 261–297.
Gorton, Gary, and Andrew Metrick, 2011, Securitized Banking and the Run on Repo,Journal of Financial Economics , forthcoming.
Greenlaw, David, Jan Hatzius, Anil K. Kashyap, and Hyun Song Shin, 2008, Lever-aged Losses: Lessons from the Mortgage Market Meltdown, Proceedings of theU.S. Monetary Policy Forum.
He, Zhiguo, In Gu Khang, and Arvind Krishnamurthy, 2010, Balance Sheet Adjust-ments during the 2008 Crisis, IMF Economic Review 1, 118–156.
King, Matt, 2008, Are the Brokers Broken? Report, Citigroup European Quantita-tive Credit Strategy and Analysis.
Krishnamurthy, Arvind, 2010, How Debt Markets Have Malfunctioned in the Crisis,Journal of Economic Perspectives 24, 3–28.
Krishnamurthy, Arvind, and Vissing-Jorgensen, 2012, The Aggregate Demand forTreasury Debt, Journal of Political Economy , forthcoming.
Martin, Antoine, David Skeie, and Ernst-Ludwig von Thadden, 2012, Repo Runs,Working Paper, Federal Reserve Bank of New York.
Pozsar, Zoltan, Tobias Adrian, Adam Ashcraft, and Hayley Boesky, 2010, ShadowBanking, Working Paper, Federal Reserve Bank of New York.
Shin, Hyun Song, 2011, Global Banking Glut and Loan Risk Premium, WorkingPaper, Princeton University.
Shleifer, Andrei, 2010, Comments on Gorton and Metrick: Regulating the ShadowBanking System, Brookings Papers on Economic Activity (2), 298–303.
Singh, Manmohan, and James Aitken, 2010, The (Sizable) Role of Rehypothecationin the Shadow Banking System, Working Paper, IMF.
Valukas, Anton R., 2010, Examiners Report. United States Bankrupty Court, South-ern District of New York.
58

Appendix
A. Money Market Mutual Fund SEC Filings Data
Table A.I lists the fund families for which we have collected repo data as of the time ofthis writing, along with the CIK numbers under which their portfolio holdings reportsare filed with the SEC. Often the reports of many or all money market funds of a familyare filed under the same CIK number. In other cases (e.g., Dreyfus), the reports arefiled under di!erent CIK numbers.
The most di"cult part of the data collection is the classification of collateral. Typ-ically, the holdings reports provide a brief description of the collateral underlying therepo agreement, such as ”U.S. Treasury Securities”, or a list of specific securities (interms of maturity, coupon rate, and issuer). In some cases, the portfolio of securitiesunderlying a repo agreement can be a mix of di!erent types of securities. The mostcommon case of mixed collateral involves Treasury securities mixed with Agency bondsor Agency-backed MBS. private-label backed ABS or corporate bonds are only veryrarely mixed with Treasuries and Agency securities. Except in rare cases, the filingsdo not report the portfolio weights. To approximate the portfolio weights, we countthe number of securities in the list of securities in the portfolio, and we assign portfolioweights based on the relative number of times a collateral type is mentioned in thislist. For quantity calculations, we split the notional value of a repo agreement with aportfolio of collateral based on these portfolio weights. For calculations involving repoterms by collateral, we assign the collateral type that has the highest number of countsin the list of securities.
Some fund families (e.g. Goldman Sachs and Fidelity) have the funds in their familypool much of their repo investments in a joint account. For these joint accounts, thefilings report a list of counterparties to the repos in this joint account, but only onerepo rate for the whole account, and only the total collateral amount for the wholejoint account, while notional values are listed by counterparty. We assign the singlerepo rate and the same haircuts to all counterparties to the repos in this joint account.
B. Risk Management Association Securities LenderData
Some securities lenders do not participate in the RMA survey in some quarters (seetable A.II. Participants are marked with “x”). The biggest worry in this regard isabout the non-participation of State Street in some of the surveys. State Street’s cashcollateral reinvestments amount to more than $0.5 trillion, and so omission of StateStreet would substantially understate the role of securities lenders. For this reason, we
59
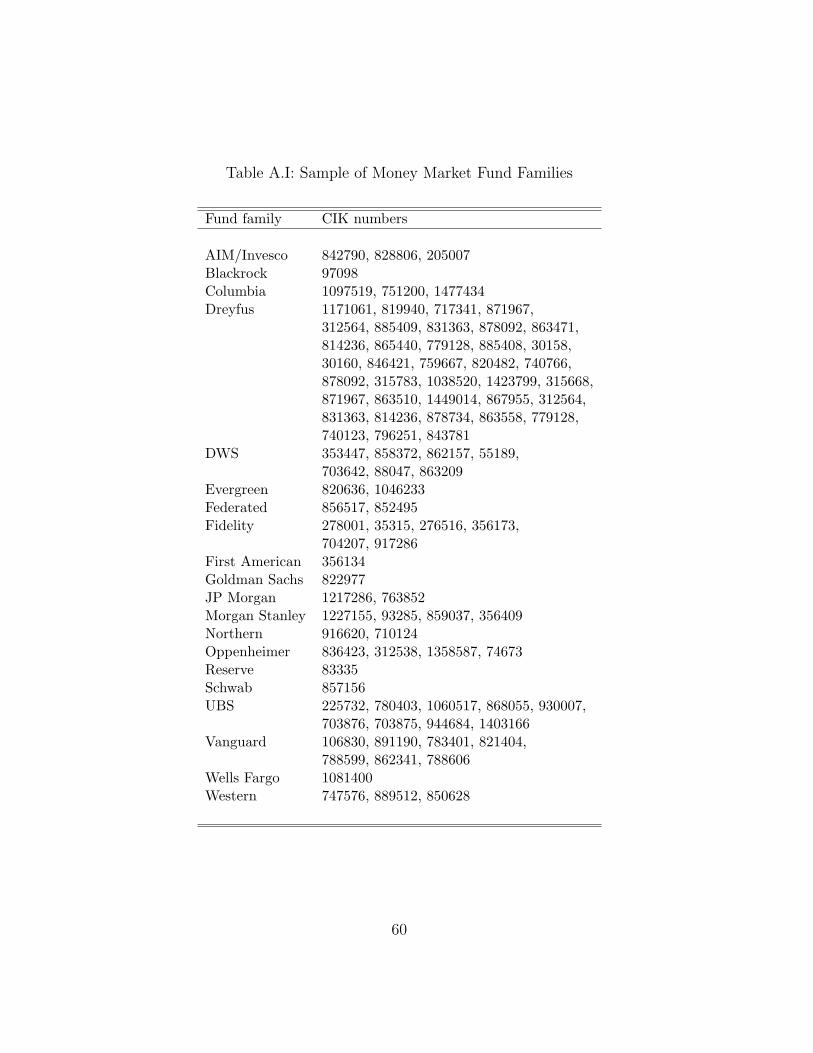
Table A.I: Sample of Money Market Fund Families
Fund family CIK numbers
AIM/Invesco 842790, 828806, 205007Blackrock 97098Columbia 1097519, 751200, 1477434Dreyfus 1171061, 819940, 717341, 871967,
312564, 885409, 831363, 878092, 863471,814236, 865440, 779128, 885408, 30158,30160, 846421, 759667, 820482, 740766,878092, 315783, 1038520, 1423799, 315668,871967, 863510, 1449014, 867955, 312564,831363, 814236, 878734, 863558, 779128,740123, 796251, 843781
DWS 353447, 858372, 862157, 55189,703642, 88047, 863209
Evergreen 820636, 1046233Federated 856517, 852495Fidelity 278001, 35315, 276516, 356173,
704207, 917286First American 356134Goldman Sachs 822977JP Morgan 1217286, 763852Morgan Stanley 1227155, 93285, 859037, 356409Northern 916620, 710124Oppenheimer 836423, 312538, 1358587, 74673Reserve 83335Schwab 857156UBS 225732, 780403, 1060517, 868055, 930007,
703876, 703875, 944684, 1403166Vanguard 106830, 891190, 783401, 821404,
788599, 862341, 788606Wells Fargo 1081400Western 747576, 889512, 850628
60

impute State Streets’ cash collateral reinvestment position (marked with “e” in TableA.II). We collect the total cash collateral reinvestment amount from State Street’s10-K and 10-Q filings, and we assume that State Streets cash collateral is investedin the same way as the aggregate cash collateral portfolio of the securities lendersthat participate in the RMA survey in a given quarter. A comparison of the portfolioallocations in adjacent quarters in which State Street does and does not participatedoes not reveal any substantial shifts in allocations. This indicates that State Streetsportfolio allocation is unlikely to be very di!erent from the allocation of other securitieslenders.
61
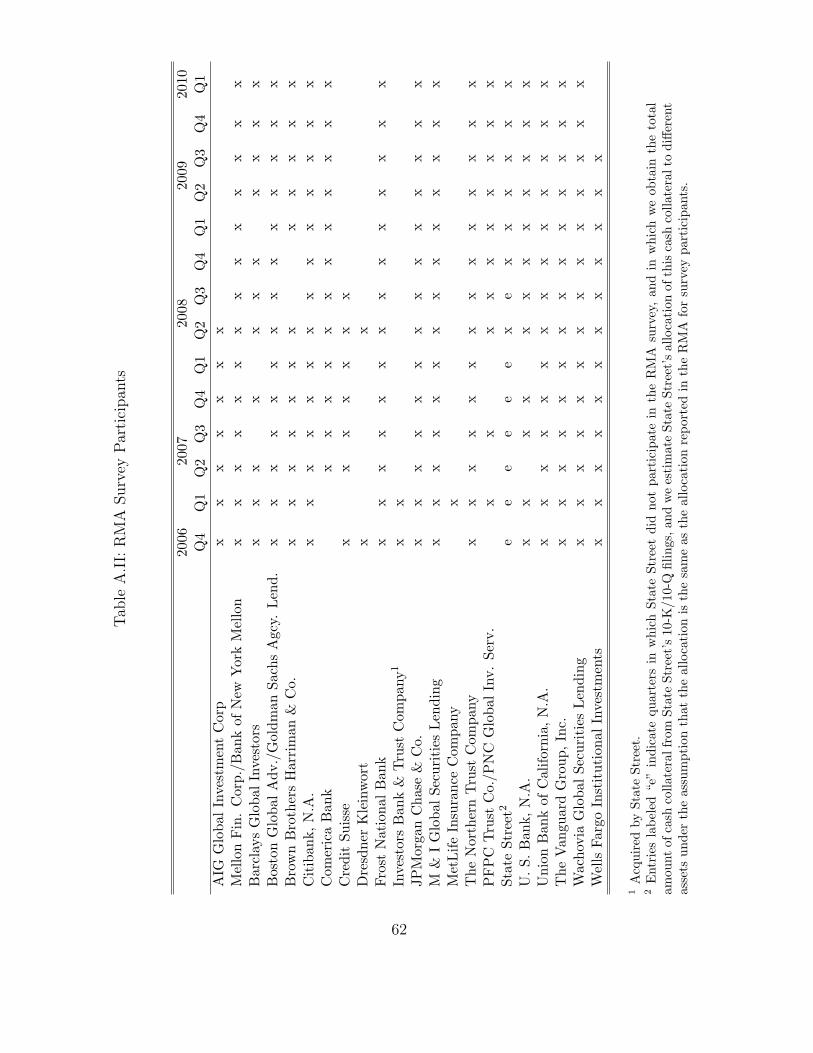
Tab
leA
.II:
RM
ASurv
eyPar
tici
pan
ts
2006
2007
2008
2009
2010
Q4
Q1
Q2
Q3
Q4
Q1
Q2
Q3
Q4
Q1
Q2
Q3
Q4
Q1
AIG
Glo
balI
nves
tmen
tC
orp
xx
xx
xx
xM
ello
nFin
.C
orp.
/Ban
kof
New
Yor
kM
ello
nx
xx
xx
xx
xx
xx
xx
xB
arcl
ays
Glo
balI
nves
tors
xx
xx
xx
xx
xx
xB
osto
nG
loba
lAdv
./G
oldm
anSa
chs
Agc
y.Le
nd.
xx
xx
xx
xx
xx
xx
xx
Bro
wn
Bro
ther
sH
arri
man
&C
o.x
xx
xx
xx
xx
xx
xC
itib
ank,
N.A
.x
xx
xx
xx
xx
xx
xx
xC
omer
ica
Ban
kx
xx
xx
xx
xx
xx
xC
redi
tSu
isse
xx
xx
xx
xD
resd
ner
Kle
inw
ort
xx
Fros
tN
atio
nalB
ank
xx
xx
xx
xx
xx
xx
xx
Inve
stor
sB
ank
&Tr
ust
Com
pany
1x
xJP
Mor
gan
Cha
se&
Co.
xx
xx
xx
xx
xx
xx
xx
M&
IG
loba
lSec
urit
ies
Lend
ing
xx
xx
xx
xx
xx
xx
xx
Met
Life
Insu
ranc
eC
ompa
nyx
The
Nor
ther
nTr
ust
Com
pany
xx
xx
xx
xx
xx
xx
xx
PFP
CTr
ust
Co.
/PN
CG
loba
lInv
.Se
rv.
xx
xx
xx
xx
xx
Stat
eSt
reet
2e
ee
ee
ex
ex
xx
xx
xU
.S.B
ank,
N.A
.x
xx
xx
xx
xx
xx
xU
nion
Ban
kof
Cal
iforn
ia,N
.A.
xx
xx
xx
xx
xx
xx
xx
The
Van
guar
dG
roup
,Inc
.x
xx
xx
xx
xx
xx
xx
xW
acho
via
Glo
balS
ecur
itie
sLe
ndin
gx
xx
xx
xx
xx
xx
xx
xW
ells
Farg
oIn
stit
utio
nalI
nves
tmen
tsx
xx
xx
xx
xx
xx
x
1A
cqui
red
bySt
ate
Stre
et.
2E
ntri
esla
bele
d“e
”in
dica
tequ
arte
rsin
whi
chSt
ate
Stre
etdi
dno
tpa
rtic
ipat
ein
the
RM
Asu
rvey
,an
din
whi
chw
eob
tain
the
tota
lam
ount
ofca
shco
llate
ralf
rom
Stat
eSt
reet
’s10
-K/1
0-Q
filin
gs,a
ndw
ees
tim
ate
Stat
eSt
reet
’sal
loca
tion
ofth
isca
shco
llate
ralt
odi
!ere
ntas
sets
unde
rth
eas
sum
ptio
nth
atth
eal
loca
tion
isth
esa
me
asth
eal
loca
tion
repo
rted
inth
eR
MA
for
surv
eypa
rtic
ipan
ts.
62