
Size-exclusion flow extraction of bisphenol A in human urine for liquid chromatography–mass...
7
Journal of Chromatography B, 798 (2003) 17–23 Size-exclusion flow extraction of bisphenol A in human urine for liquid chromatography–mass spectrometry Koichi Inoue, Migaku Kawaguchi, Yukari Funakoshi, Hiroyuki Nakazawa ∗ Department of Analytical Chemistry, Faculty of Pharmaceutical Sciences, Hoshi University, 2-4-41 Ebara, Shinagawa-ku, Tokyo 142-8501, Japan Received 17 April 2003; received in revised form 31 July 2003; accepted 21 August 2003 Abstract We report an approach for assessing human exposure to bisphenol A (BPA), which involves measuring the glucuronide in urine sample that were subjected to a novel size-exclusion flow extraction method. The present approach includes the addition of 13 C 12 -BPA, enzymatic deconjugation, and the proposed sample preparation method. The sample solution is separated and detected by liquid chromatography–mass spectrometry (LC–MS). The following are used for the LC–MS: a reversed-phase separation column, electrospray ionization (ESI), negative mode, and single ion monitoring (SIM) with m/z 227 for BPA and m/z 239 for 13 C 12 -BPA. The detection limit was 0.1 ng ml −1 and the calibration curves (0.45–90 ng ml −1 ) had correlation coefficients exceeding 0.999. To urine samples requiring deglucuronidation, -glucuronidase was added followed by incubation at 37 ◦ C for 3 h. After the enzymatic treatment, the samples were subjected to the extraction in the reversed-phase (ODS) and size-exclusion (GPC) modes. It was possible to extract, clean up and concentrate BPA in a single run of 20min by means of the novel extraction method. The method enables the determination of standards and may be applied to the detection of trace amounts of BPA in human urine samples. © 2003 Elsevier B.V. All rights reserved. Keywords: Sample preparation; Bisphenol A 1. Introduction The report entitled “Global Assessment of the State-of-the -Science of Endocrine Disruptors”, is a result of a com- prehensive review of publicly available scientific literature on endocrine disruptors organized by the International Pro- gramme on Chemical Safety [1]. In Japan, the Health Sci- ences Research conducted by the Ministry of Health, Labour and Welfare indicated that risk assessment, human exposure and toxicological studies have been conducted and analyti- cal techniques for endocrine disruptors have been provided by many researchers [2]. Bisphenol A (BPA) contributes sig- nificantly to the environmental problem as evidenced by a number of studies indicating the effects of BPA in the “low dose” range, including its effects at the ppt level, in the last two years [3–6]. Thus, the potential effects of BPA on hu- man health and human exposure to BPA must be examined for risk assessment. ∗ Corresponding author. Tel.: +81-3-5498-5763; fax: +81-3-5498-5062. E-mail address: [email protected] (H. Nakazawa). The metabolism and kinetics of low doses of BPA in hu- man following oral administration have been the subject of numerous studies. The efficient glucuronidation of BPA and the rapid excretion of the formed glucuronide were reported in human [7]. In addition, it was reported that BPA was glu- curonidated in liver microsomes during metabolisation [8]. Therefore, we assessed BPA levels in human plasma sam- ples by monitoring both free and glucuronidated BPAs [9]. In preparation for a population-based human exposure study, we reviewed recent literature on the current methods for an- alyzing BPA in human samples (Table 1). In general, the gas chromatography–mass spectrometry (GC–MS) method is the most commonly employed technique for the environ- mental analysis of endocrine disruptors. However, due to the low volatility of some compounds including a hydroxyl group, derivatization steps aimed at producing more BPA are required to improve the sensitivity of the subsequent GC–MS analysis. Therefore, the use of chemical derivatives of improve analysis has been a practice in the GC–MS anal- ysis of a trace amount of BPA in water [36]. On the other hand, liquid chromatography (LC) and enzyme-linked im- munosorbent assay (ELISA) are used for the determination 1570-0232/$ – see front matter © 2003 Elsevier B.V. All rights reserved. doi:10.1016/j.jchromb.2003.08.042
-
Upload
koichi-inoue -
Category
Documents
-
view
214 -
download
2
Transcript of Size-exclusion flow extraction of bisphenol A in human urine for liquid chromatography–mass...

Journal of Chromatography B, 798 (2003) 17–23
Size-exclusion flow extraction of bisphenol A in human urinefor liquid chromatography–mass spectrometry
Koichi Inoue, Migaku Kawaguchi, Yukari Funakoshi, Hiroyuki Nakazawa∗
Department of Analytical Chemistry, Faculty of Pharmaceutical Sciences, Hoshi University,2-4-41 Ebara, Shinagawa-ku, Tokyo 142-8501, Japan
Received 17 April 2003; received in revised form 31 July 2003; accepted 21 August 2003
Abstract
We report an approach for assessing human exposure to bisphenol A (BPA), which involves measuring the glucuronide in urine samplethat were subjected to a novel size-exclusion flow extraction method. The present approach includes the addition of13C12-BPA, enzymaticdeconjugation, and the proposed sample preparation method. The sample solution is separated and detected by liquid chromatography–massspectrometry (LC–MS). The following are used for the LC–MS: a reversed-phase separation column, electrospray ionization (ESI), negativemode, and single ion monitoring (SIM) withm/z 227 for BPA andm/z 239 for13C12-BPA. The detection limit was 0.1 ng ml−1 and the calibrationcurves (0.45–90 ng ml−1) had correlation coefficients exceeding 0.999. To urine samples requiring deglucuronidation,�-glucuronidase wasadded followed by incubation at 37◦C for 3 h. After the enzymatic treatment, the samples were subjected to the extraction in the reversed-phase(ODS) and size-exclusion (GPC) modes. It was possible to extract, clean up and concentrate BPA in a single run of 20 min by means of thenovel extraction method. The method enables the determination of standards and may be applied to the detection of trace amounts of BPA inhuman urine samples.© 2003 Elsevier B.V. All rights reserved.
Keywords: Sample preparation; Bisphenol A
1. Introduction
The report entitled “Global Assessment of the State-of-the-Science of Endocrine Disruptors”, is a result of a com-prehensive review of publicly available scientific literatureon endocrine disruptors organized by the International Pro-gramme on Chemical Safety[1]. In Japan, the Health Sci-ences Research conducted by the Ministry of Health, Labourand Welfare indicated that risk assessment, human exposureand toxicological studies have been conducted and analyti-cal techniques for endocrine disruptors have been providedby many researchers[2]. Bisphenol A (BPA) contributes sig-nificantly to the environmental problem as evidenced by anumber of studies indicating the effects of BPA in the “lowdose” range, including its effects at the ppt level, in the lasttwo years[3–6]. Thus, the potential effects of BPA on hu-man health and human exposure to BPA must be examinedfor risk assessment.
∗ Corresponding author. Tel.:+81-3-5498-5763;fax: +81-3-5498-5062.
E-mail address: [email protected] (H. Nakazawa).
The metabolism and kinetics of low doses of BPA in hu-man following oral administration have been the subject ofnumerous studies. The efficient glucuronidation of BPA andthe rapid excretion of the formed glucuronide were reportedin human[7]. In addition, it was reported that BPA was glu-curonidated in liver microsomes during metabolisation[8].Therefore, we assessed BPA levels in human plasma sam-ples by monitoring both free and glucuronidated BPAs[9].In preparation for a population-based human exposure study,we reviewed recent literature on the current methods for an-alyzing BPA in human samples (Table 1). In general, thegas chromatography–mass spectrometry (GC–MS) methodis the most commonly employed technique for the environ-mental analysis of endocrine disruptors. However, due tothe low volatility of some compounds including a hydroxylgroup, derivatization steps aimed at producing more BPAare required to improve the sensitivity of the subsequentGC–MS analysis. Therefore, the use of chemical derivativesof improve analysis has been a practice in the GC–MS anal-ysis of a trace amount of BPA in water[36]. On the otherhand, liquid chromatography (LC) and enzyme-linked im-munosorbent assay (ELISA) are used for the determination
1570-0232/$ – see front matter © 2003 Elsevier B.V. All rights reserved.doi:10.1016/j.jchromb.2003.08.042

18K
.Inoue
etal.
/J.
Chrom
atogr.B
798(2003)
17–23
Table 1The recent literature for current methods for analyzing and assessment of BPA in human biological samples
Target BPA form Biologicalsample
Analytical technique Sample preparation LOD(ng ml−1)
LOQ(ng ml−1)
Ref.
Free Serum LC–MS, LC–ED SPE 0.1–0.2 – Sajiki et al. (1999)[10]Free Serum LC–ED SPE 0.01 0.05 Inoue et al. (2000)[11]Free Serum LC–FD (using labeling reagent) Column-switching 0.04 0.1 Kuroda et al. (2003)[12]Free Serum ELISA, GC–MS (derivatization) Proteins precipitation – 0.3 Ohkuma et al. (2002)[13]Free Serum GC–MS (derivatization) SPE 0.005 0.01 Yoshimura et al. (2002)[14]Free Serum ELISA SPE 0.2 – Yamada et al. (2002)[15]Free Serum Novel ELISA SPE – – Takeuchi et al. (2002)[16]Free Serum,
UrineGC–MS (derivatization) Proteins precipitation 5.0–10 10 Kudo et al. (1998)[17]
Free Plasma LC–FD (using labeling reagent) SPE 0.05 1.0 Watanabe et al. (2001)[18]Free Red
blood cellLC–ED novel SPE – – Sajiki (2003)[19]
Free Semen LC–MS, ELISA SPE 0.1 0.5 Inoue et al. (2002)[20]Free Saliva GC–MS – 3 15 Zafra et al. (2002)[21]Free Saliva GC–MS (derivatization), HPLC Proteins precipitation – 1.0 Atkinson et al. (2002)[22]Free Saliva LC–UV Proteins precipitation 0.1 0.3 Arenholt-Bindslev et al. (1999)[23]Free Tissue LC–UV Proteins precipitation 25 – Csanady et al. (2002)[24]
Free andglucuronidated
Plasma LC–MS Novel SPE 0.1 1.0 Inoue et al. (2001)[9]
Free andglucuronidated
Urine GC–MS (derivatization) SPE 0.12 0.27 Brock et al. (2001)[25]
Free andglucuronidated
Urine LC–ED Column-switching – 0.2 Ouchi et al. (2002)[26]
Free andglucuronidated
Urine LC–ED Proteins precipitation 0.25 – Hanaoka et al. (2002)[27]
Free andglucuronidated
Urine GC–MS (derivatization) SPE – 0.1 Tsukioka et al. (2003)[30]
Abbreviations: LOD, limit of detection; LOQ, limit of quantitation; LC–MS, liquid chromatography–mass spectrometry; LC–ED, liquid chromatography–electrochemical detection; LC–FD, liquidchromatography–fluorescence detection; ELISA, enzyme linked immuno-sorbent assay; GC–MS, gas chromatography–mass spectrometry; SPE solid phase extraction.
K. Inoue et al. / J. Chromatogr. B 798 (2003) 17–23 19
of trace amounts of BPA in human samples (Table 1). Ourstudies reported that sufficiently sensitive LC method forthe determination of BPA in biological sample was devel-oped by the derivatization[12,18]. In addition, we foundthat the ELISA method may give erroneous values due tonon-specific binding to the antibody, leading to an overesti-mation of trace amounts of BPA in human semen samples[20]. Therefore, it may lack precision for the determina-tion of trace levels of BPA in human samples. On the otherhand, for the detection of trace levels of BPA in human sam-ples by LC–electrochemical detection (LC–ED) and fluores-cence detection (FD) methods more selective and accurateinformation is needed other than peak response and reten-tion time[11,12,18,19,26,27]. Here, we demonstrate that theliquid chromatography–mass spectrometry (LC–MS) tech-nique using a labeled surrogate standard is the method ofchoice for the simple, accurate and selective analysis of BPAlevels in human samples[9,20].
Recently, the leaching of BPA from food-contacting plas-tics and can coatings, and the presence of BPA in foods hasbeen reported[28–32]. Therefore, it is possible that humansare exposed to BPA via a variety of daily activities. In hu-man exposure studies, trace levels of BPA were found in hu-man blood samples. However, compared to urine collection,blood collection is thought to be unsuitable for exposureassessment of healthy people because of its invasiveness.Equally important in measuring BPA in human samples arethe following: its contamination in the laboratory and dur-ing pretreatment, and the monitoring of its free forms andmetabolites. Brock et al. reported the use of the GC–MSmethod after the enzymatic deglucuronidation step to mea-sure BPA levels in human urine samples in order to obtaina reference range[25]. In the present study, we used humanurine samples for the assessment of human exposure to BPAas well.
In the preliminary study for assessment and determi-nation of BPA in human samples, the sample preparationmethod is selected. Solvent evaporation, steam distillationand liquid–liquid extraction methods, which were used inthe past, have been replaced by the more efficient and ver-satile solid-phase extraction (SPE) technique for biologicalsamples. The preparation of human samples containingBPA using SPE has been reported (Table 1). In our practi-cal study, the SPE technique was used for the preparationof BPA in human samples. However, this technique pre-sented several problems. First, there was contamination oftrace levels of BPA during sample preparation with SPE[11]. Second, human samples are at a high risk of infectionby HIV, hepatitis, or other unknown diseases or viruses.Therefore, manual handling of biological samples directlyby laboratory researchers during sample preparation shouldbe avoided as much as possible. As a solution, the directinjection of sample into a system consisting of a reversedphase and a size exclusion column which were connectedon-line was developed for the extraction and fraction ofBPA in human urine samples.
In the present study, an accurate, safe, sensitive, selec-tive and high-throughput analytical method was developedfor the quantification of BPA by using stable isotopically la-beled internal standards. The use of�-glucuronidase to hy-drolyze glucuronide metabolites enables the quantificationof both free and glucuronidated forms of BPA. We evaluatedthe method for screening these compounds in human urinesamples with creatinine correction.
2. Experimental
2.1. Reagents
Bisphenol A (BPA) standard was purchased from KantoChemical Industries, Ltd. (Tokyo, Japan).13C12-BPA surro-gate standard was purchased from Cambridge Isotope Lab-oratories, Inc. (MA, USA). HPLC-grade acetonitrile for themobile phase was purchased from Wako Pure Chemical In-dustries, Ltd. (Osaka, Japan), as were all pesticide-gradesolvents used in sample preparation. Purified water was ob-tained using a Milli-Q gradient A10 Elix with an EDS pol-isher system (Millipore, Bedford, MA., USA). The EDS pol-isher is a new filter purchased from Millipore, Japan. Thewater refined by this filter was non-contamination of BPA(<0.01 ng ml−1) [33]. Creatinine determination was carriedout using the Wako creatinine test (Law of Jaffé) from WakoPure Chemical Industries, Ltd., Osaka, Japan.
2.2. Urine samples
Urine samples were obtained from four healthy volunteersaged 21–28 years. All samples were stored at−80◦C priorto use.
2.3. Liquid chromatography–mass spectrometry (LC–MS)measurement
Liquid chromatography with electrospray mass spec-trometry (LC–MS) was performed using an Agilent 1100MSD-SL system (Agilent Technologies, Palo Alto, USA).The injection volume was 5.0�l in the needle washingmode. The column used was Mightysil RP-18 GP Aqua(150 mm× 2.0 mm, particle size 5�m) with a MightysilRP-18 GP pre-column (20 mm× 2.0 mm, particle size5�m). The column oven was maintained at 40◦C for theseparation of the compounds. The separation was carriedout using a mobile phase of 0.01% acetic acid in water andacetonitrile (65/35 (v/v)) at a flow rate of 0.2 ml min−1.
The working conditions for the electrospray MS were asfollows: the drying nitrogen gas was set at a temperatureof 350◦C and was introduced into the capillary region at aflow rate of 12 l min−1; the capillary was held at a potentialof 3500 V relative to the counter electrode in the negativeion mode. The fragmentor voltage was 140 V during thechromatographic run. When working in the selected ion
20 K. Inoue et al. / J. Chromatogr. B 798 (2003) 17–23
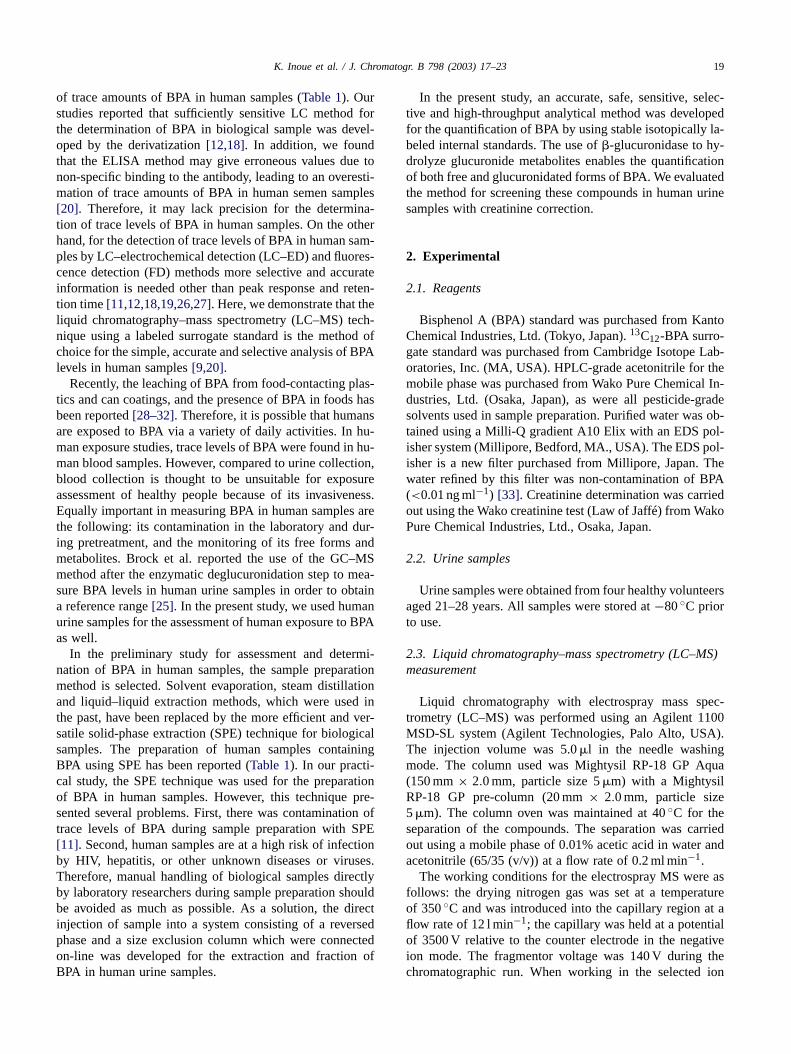
Fig. 1. Schematic representation of the column-switching extraction system. (A) A urine sample was directly injected onto the TSK–precolumn BSA–ODS/Sin stream of pure water using pump A. (B) This configuration allowed to back-flashing the ODS column to the GPC column and the detector in theflow path of pump B.
monitoring (SIM) mode, them/z 227 and 239 ions, were as-signed as the [M–H]− of BPA and13C12-BPA, respectively.
Standard solutions of BPA were prepared in methanoland added to a fixed concentration of13C12-BPA. Quan-titative analysis was performed using SIM in order tomaximize sensitivity. This resulted in a calibration curvecovering the concentration range of 0.45–90 ng ml−1. BPAconcentrations were calculated relative to13C12-BPA stan-dards that were added to the samples prior to extraction togive a final extract concentration of 2.0 ng ml−1 in urinesamples. Eight-point calibrations were performed daily forall analyzers with internal standards. The detection limit(DL) was calculated as three times the standard deviationof the analyte concentration determined in the spiked blanksample.
2.4. Enzymatic deconjugation of glucuronidatedform of BPA in urine
One milliliter of human urine sample was buffered withammonium acetate (100�l, 1.0 M, pH 6.8). AfterE. coli�-glucuronidase (10�l, 89 U ml−1; Fluka Chemie AG,Buchs, Switzerland) was added, the sample was sealed ina glass tube and gently mixed. Quantitative glucuronidasehydrolysis to obtain the free BPA was accomplished byincubating at 37◦C for 3 h. After the enzymatic deconju-gation, the sample solution was centrifuged at 3000 rpmfor 15 min to remove proteins. This treatment is suffi-cient to deconjugate the glucuronidated BPA[25]. Thesample was subjected to the proposed sample preparationmethod.
2.5. Novel sample preparation for LC–MSmeasurement of BPA in urine samples
A previously reported method for the sample preparationof BPA in human plasma was modified[14].
The column-switching extraction system consists of twoLC pumps (Shimadzu LC-10AS (pump A) and LC-10ADvp(pump B) pumps: Shimadzu, Kyoto, Japan), a detector
(SPD-10A, UV 225 nm[11], Shimadzu, Kyoto, Japan)and extraction columns (TSK-PRECOLUMN BSA-ODS/S4.6 mm × 10 mm: 5�m, TOSOH Co., Tokyo, Japan, andCLNpak PAE-800 8.0 mm× 300 mm Shodex Co., Tokyo,Japan). The column-switching extraction system, as de-picted in Fig. 1, was used for the direct injection of urinesamples. A urine sample (0.5 ml) was directly injectedonto the TSK–precolumn BSA–ODS/S in stream of purewater at a rate of 1.0 ml min−1 using pump A for 5 min(Fig. 1A). While the effluent of this column was directedto drain during the 5 min lading period, the sample wasextracted on the ODS column. After 5 min, the position ofthe switching valve was changed (Fig. 1B). This configura-tion allowed to back-flashing the ODS column to the GPCcolumn and the detector in the flow path of pump B. Theactual GPC separation and clean up were carried out usingan acetonitrile solution at a flow rate of 1.0 ml min−1. Upondetection of BPA, the fraction was collected for 1 min. Therun time for the preparation of the sample mixture was20 min. The solution was dried under a stream of nitro-gen at 40◦C prior to re-suspension in 50�l of methanol.The sample was then subjected to LC–MS as describedbelow.
3. Results and discussion
3.1. LC–MS validation for determination of BPA
In the analysis using electrospray MS with flow injectionanalysis of BPA standard solutions, them/z 227 ion, whichwas assigned the [M–H]− ion, was observed as the mainpeak. In addition, a fragment ion atm/z 212, resulting froma cleavage of one of the CH3 groups is observed[9]. Wereported that the ion atm/z 227 can be used in the negativeion mode to both screen for and quantitatively analyze BPAin standard samples[9,20].
The most important parameters affecting LC–MS are thefragmentor voltage and the composition of mobile phase.In order to establish the optimum fragmentor voltage forthe detection of BPA, them/z 227 signal for BPA versus
K. Inoue et al. / J. Chromatogr. B 798 (2003) 17–23 21
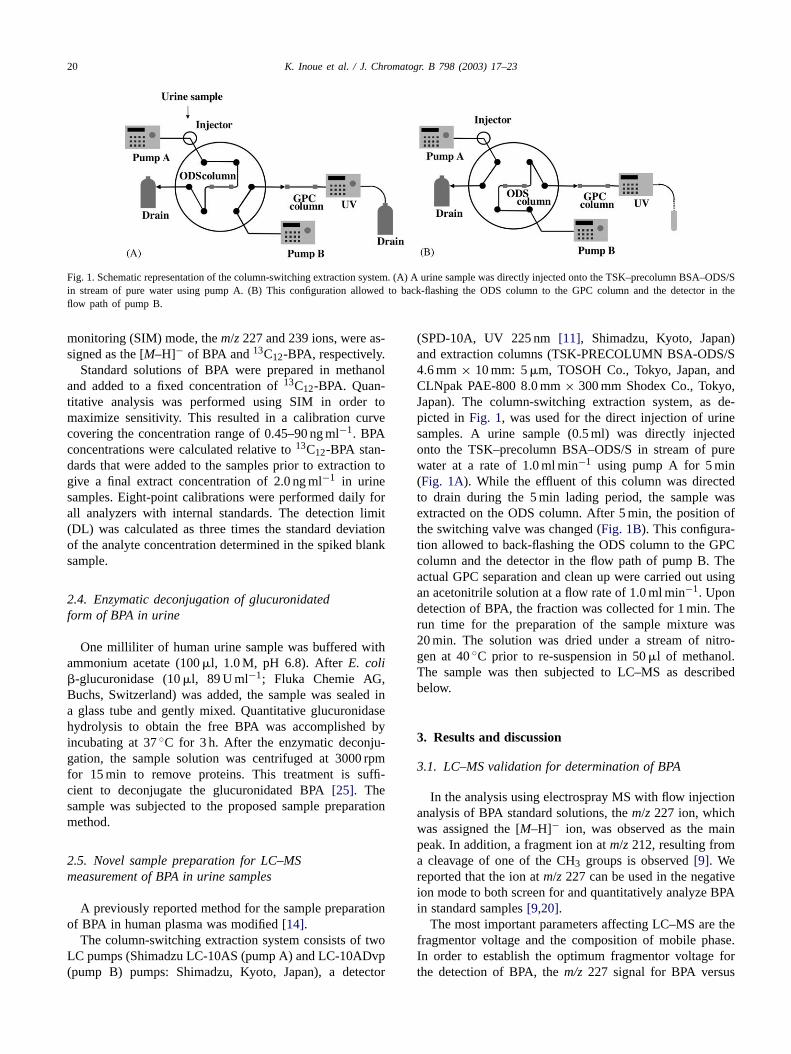
Fig. 2. Structures of stable isotopically labeled internal standards (BPA-d16 and 13C12-BPA) and reaction with water.
fragmentor voltage was investigated. The monitored signalshowed a maximum in 0.01% acetic acid at 140 V for BPA[9,20].
3.2. Analytical method parameter and calibration fordetermination of BPA
In general, it is very important that LC–MS determina-tion of a target compound be accomplished by using stableisotopically labeled internal standards. When working in theSIM mode, the [M–H]− ion of BPA was assigned to the sig-nal atm/z 227. On the other hand, stable isotopically labeledinternal standards of BPA, such as BPA-d16 and13C12-BPA,werem/z 241 and 239, respectively (Fig. 2). BPA-d16 (MW244) was transformed into BPA-d14 (MW 242) in water(Fig. 2). The two acid deuterium atoms of BPA-d16 are im-mediately exchanged against protons when dissolved in aprotic medium. It is for the reason thatm/z 241 was assignedas [M (BPA-d14)–H]− in the negative ion mode. The deu-terium atoms bound to carbon atoms are of course stable.The phenolic deuterium atoms, however, are due to theiracidity easily exchangeable. They would not only exchangein water, but also in any other protic solvent and even inaprotic solvents that inevitably contain traces of water. This,however, does not impair the utility of BPA-d14 as isotopi-cally labeled internal standard. In the present study, there-fore, we used a more stable internal standard,13C12-BPA,rather than BPA-d16. The 13C12-BPA standard is not trans-formed and its [M–H]− signal is assigned tom/z 239.
The calculated detection limit was 0.1 ng ml−1 forLC–MS. In addition, the limit of quantitation calculatedwhen the signal-to-noise ratio was higher than 20 was0.1 ng ml−1 in urine samples. LC–MS with SIM calibrationwas used to investigate the linearity of the method. Peakarea ratios with respect to13C12-BPA internal standard wereplotted. The response was found to be linear in the vali-dated range with “area ratio= 0.025× amount ratio+ 0.03(correlation: 0.999)”. The method may be applied to
the detection of trace amounts of BPA in human urinesamples.
3.3. Optimal conditions and recovery of BPA fromthe urine samples subjected to the samplepreparation method
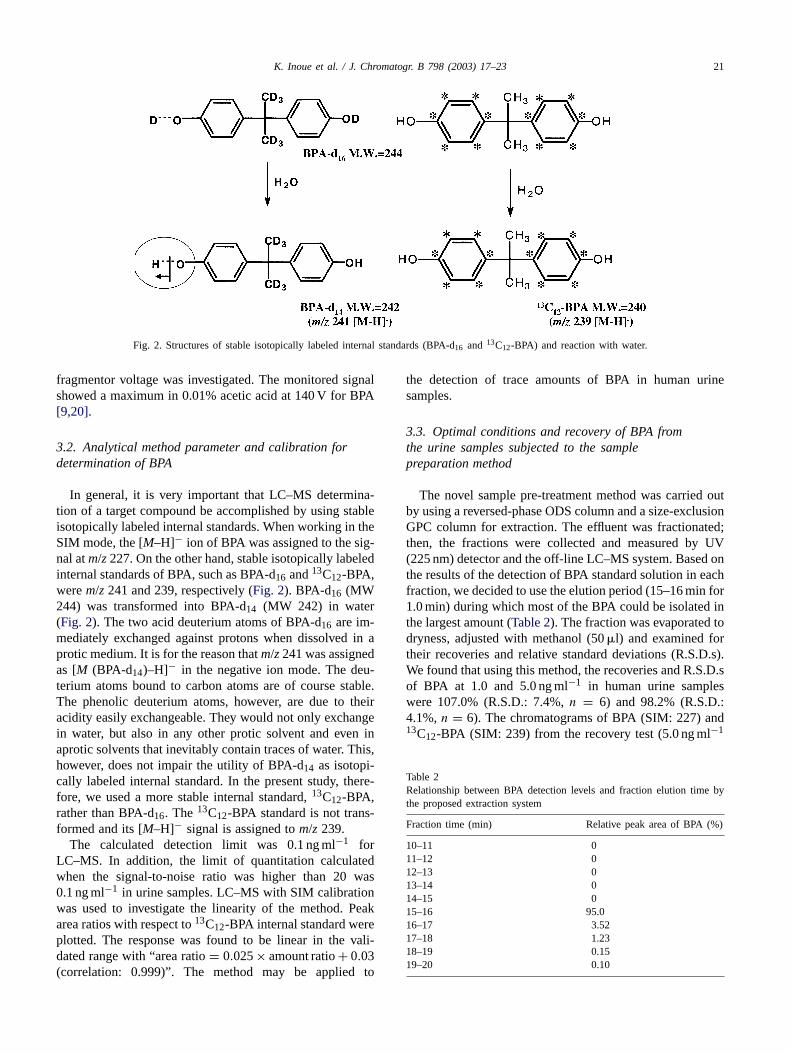
The novel sample pre-treatment method was carried outby using a reversed-phase ODS column and a size-exclusionGPC column for extraction. The effluent was fractionated;then, the fractions were collected and measured by UV(225 nm) detector and the off-line LC–MS system. Based onthe results of the detection of BPA standard solution in eachfraction, we decided to use the elution period (15–16 min for1.0 min) during which most of the BPA could be isolated inthe largest amount (Table 2). The fraction was evaporated todryness, adjusted with methanol (50�l) and examined fortheir recoveries and relative standard deviations (R.S.D.s).We found that using this method, the recoveries and R.S.D.sof BPA at 1.0 and 5.0 ng ml−1 in human urine sampleswere 107.0% (R.S.D.: 7.4%,n = 6) and 98.2% (R.S.D.:4.1%,n = 6). The chromatograms of BPA (SIM: 227) and13C12-BPA (SIM: 239) from the recovery test (5.0 ng ml−1
Table 2Relationship between BPA detection levels and fraction elution time bythe proposed extraction system
Fraction time (min) Relative peak area of BPA (%)
10–11 011–12 012–13 013–14 014–15 015–16 95.016–17 3.5217–18 1.2318–19 0.1519–20 0.10
22 K. Inoue et al. / J. Chromatogr. B 798 (2003) 17–23
Fig. 3. Chromatograms of BPA and internal standard (13C12-BPA) in human urine sample (recovery test: added 5.0 ng ml−1 in urine).
Table 3BPA concentration in human urine samples after meals (2 and 5 h) used in the present method
Age 2 h 5 h
Creatinine(mg dl−1)
BPA (ng ml−1) Creatinine(mg dl−1)
BPA (ng ml−1)
(−)�-g1ucuronidase
(+)�-g1ucuronidase
(−)�-g1ucuronidase
(+)�-g1ucuronidase
A 28 Male 21.5 ND ND 7.0 ND NDB 25 Female 5.5 ND ND 6.7 ND ND
C 23 Male 22.1 ND ND 19.1 ND 0.26D 21 Female 9.0 ND ND 13.9 ND 0.38
ND <0.1 ng ml−1.
in urine sample) are shown inFig. 3. Accuracy of the methodwas expressed as recovery relative to the internal standard.
3.4. Measurement of BPA in human urine samples
It was determined previously that the limit of quantita-tion was 0.1 ng ml−1 at signal-to-noise ratios higher than 20in human urine samples. Healthy volunteers were enrolledin this study. The aim of the present study was to investi-gate urinary BPA levels in human after ingestion of cannedfoods. The experimental design was as follows: four volun-teers had consumed the same meal and drinks (green tea inPET bottle): in addition, two volunteers (C and D) had con-sumed the canned foods. Then, we examined four urine sam-ples for the presence of BPA after meals (2 and 5 h) usingthe present method. As expected, the average urinary creati-nine level was 13.1± 6.1 mg dl−1 (Table 3). All urine sam-ples analyzed by the LC–MS system after being subjected to
the novel sample preparation method demonstrated no de-tectable free BPA (not detected: ND<0.1 ng ml−1) beforedeglucuronidation. After deglucuronidation, trace amountsof urinary BPA in healthy volunteers (C and D) were de-tected after 5 h (Table 3).
Recently, there have been reports on the contaminationand leaching of BPA from food cans. It is, however, difficultto say that main source of human exposure is the ingestionof food contaminated by BPA leaching from cans. We con-firmed that there is a need for investigation and monitoringof human exposure of BPA on a large scale.
4. Conclusions
Our findings suggest that the LC–MS method can detectthe presence of BPA at very low levels (the limit of quan-titation, 0.1 ng ml−1) in human urine samples. In addition,
K. Inoue et al. / J. Chromatogr. B 798 (2003) 17–23 23
we have demonstrated that other sources of human exposureto BPA may also exist such as drinking water, indoor air,medical treatment, work environment, etc.[13,27,33–35].On the other hands, the presence of BPA at very low lev-els in human urine may undergo a changed by human livingfactors. Therefore, the development of analytical techniquesfor quantification and survey of the presence of BPA in hu-man sample need to be careful and control about the effectsof sampling time, taking foods, medical treatment, work en-vironment, etc.
Acknowledgements
This study was supported by the Grant-in-Aid for Can-cer Research and Health Sciences Research grants from theMinistry of Health, Labour and Welfare of Japan and by aGrant-in-Aid for Scientific Research from the Ministry ofEducation, Culture, Sports, Science and Technology.
References
[1] T. Damstra, S. Barlow, A. Bergman, R. Kavlock, G.V.D. Kraak,International program on chemical safety, global assessment ofthe state-of-the-science of endocrine disruptors (http://ehp.niehs.nih.gov/who/).
[2] Ministry of Health, Labour and Welfare of Japan, Informa-tion of Endocrine disruptors in Japan (http://www.nihs.go.jp/edc/edc.html).
[3] Anon, Reprod. Toxicol. 15 (2001) 587.[4] R. Melnick, G. Lucier, M. Wolfe, R. Hall, G. Stancel, G. Prins,
M. Gallo, K. Reuhl, S.-M. Ho, T. Brown, J. Moore, J. Leakey, J.Haseman, M. Kohn, Environ. Health Perspect. 110 (2002) 427.
[5] R.J. Witorsch, Food Chem. Toxicol. 40 (2002) 905.[6] I. Quesada, E. Fuentes, M.C. Viso-Leon, B. Soria, C. Ripoll, A.
Nadal, FASEB J. 16 (2002) 1671.[7] W. Voelkel, T. Colnot, G.A. Csanady, J.G. Filser, W Dekant, Chem.
Res. Toxicol. 15 (2002) 1281.[8] H. Yokota, H. Iwano, M. Endo, T. Kobayashi, H. Inoue, S. Ikushiro,
A. Yuasa, Biochem. J. 340 (1999) 405.[9] K. Inoue, A. Yamaguchi, M. Wada, Y. Yoshimura, T. Makino, H.
Nakazawa, J. Chromatogr. B 765 (2001) 121.[10] J. Sajiki, K. Takahashi, J. Yonekubo, J. Chromatogr. B 736 (1999)
255.[11] K. Inoue, K. Kato, Y. Yoshimura, T. Makino, H. Nakazawa, J.
Chromatogr. B 749 (2000) 17.
[12] N. Kuroda, Y. Kinoshita, Y. Sun, M. Wada, N. Kishikawa, K.Nakashima, T. Makino, H. Nakazawa, J. Pharm. Biomed. Anal. 30(2003) 1743.
[13] H. Ohkuma, K. Abe, M. Ito, A. Kokado, A. Kambegawa, M. Maeda,Analyst 127 (2002) 93.
[14] Y. Yoshimura, J.W. Brock, T. Makino, H. Nakazawa, Anal. Chim.Acta 458 (2002) 331.
[15] H. Yamada, I. Furuta, E.H. Kato, S. Kataoka, Reprod. Toxicol. 16(2002) 735.
[16] T. Takeuchi, O. Tsutsumi, Biochem. Biophys. Res. Commun. 291(2002) 76.
[17] K. Kudo, C. Miyazaki, R. Kadoya, T. Imamura, N. Jitsufuchi, N.Ikeda, J. Anal. Toxicol. 22 (1998) 274.
[18] T. Watanabe, H. Yamamoto, K. Inoue, A. Yamaguchi, Y. Yoshimura,K. Kato, H. Nakazawa, N. Kuroda, K. Nakashima, J. Chromatogr.B 762 (2001) 1.
[19] J. Sajiki, J. Chromatogr. B 783 (2003) 367.[20] K. Inoue, M. Wada, T. Higuchi, S. Oshio, T. Umeda, Y. Yoshimura,
H. Nakazawa, J. Chromatogr. B 773 (2002) 97.[21] A. Zafra, O.M. Del, R. Pulgar, A. Navalon, J.L. Vilchez, Chro-
matographia 56 (2002) 213.[22] J.C. Atkinson, F. Diamond, F. Eichmiller, R. Selwitz, G. Jones, Dent.
Mater. 18 (2002) 128.[23] D. Aarthus-Bindslev, V. Breinholt, A. Preiss, G. Schmalz, Clin. Oral
Invest. 3 (1999) 120.[24] G.A. Csanady, H.R. Oberste-Frielinghaus, B. Semder, C. Baur, K.T.
Schneider, J.G. Filser, Arch. Toxicol. 76 (2002) 299.[25] J.W. Brock, Y. Yoshimura, J.R. Barr, V.L. Maggio, R. Sam, H.
Nakazawa, L.L. Needham, J. Expos. Anal. Environ. Epid. 11 (2001)323.
[26] K. Ouchi, S. Watanabe, J. Chromatogr. B 780 (2002) 365.[27] T. Hanaoka, N. Kawamura, K. Hara, S. Tsugane, Occup. Environ.
Med. 59 (2002) 625.[28] M. Horie, T. Yoshida, R. Ishii, S. Kobayashi, H. Nakazawa, Bunseki
Kagaku 48 (1999) 579.[29] Y. Kawamura, C. Tagai, T. Maehara, T. Yamada, J. Food Hyg. Soc.
Jpn. 40 (1999) 189.[30] T. Tsukioka, J. Brock, S. graiser, J. Nguyen, H. Nakazawa, T. Makino,
Anal. Sci. 19 (2003) 151.[31] T. Yoshida, M. Horie, Y. Hoshino, H. Nakazawa, Food Addit. Con-
tamin. 18 (2001) 69.[32] C. Nerin, M.R. Philo, J. Salafranca, L. Castle, J. Chromatogr. A 963
(2002) 375.[33] K. Inoue, Y. Yoshie, S. Kondo, Y. Yoshimura, H. Nakazawa, J.
Chromatogr. A 946 (2002) 291.[34] T. Toyooka, Y. Oshige, Anal. Sci. 16 (2000) 1071.[35] R.A. Rudel, J.G. Brody, J.D. Spengler, J. Vallarino, P.W. Geno, G.
Sun, A. Yau, J. Air Waste Manage. Assoc. 51 (2001) 499.[36] A. González-Casado, N. Navas, M. del Olmo, J.L. Vı́lchez, J. Chro-
matogr. Sci. 36 (1998) 565.
![Bisphenol A Diglycidyl Ether of Bisphenol A Method · PDF file4 of 18 Diglycidyl Ether of Bisphenol A13 synonyms: 2,2-bis[4-(glycidyloxy)phenyl]propane, 4,4′-isopropylidenediphenol](https://static.fdocuments.net/doc/165x107/5a76e9947f8b9a93088d7abf/bisphenol-a-diglycidyl-ether-of-bisphenol-a-method-4-of-18-diglycidyl-ether.jpg)


