Size Exclusion BioHPLC Columns - Agilent · Separation of Bio-Rad Size Exclusion Protein Standard...
30
Size Exclusion BioHPLC Columns 1
Transcript of Size Exclusion BioHPLC Columns - Agilent · Separation of Bio-Rad Size Exclusion Protein Standard...

Size Exclusion BioHPLC Columns
1
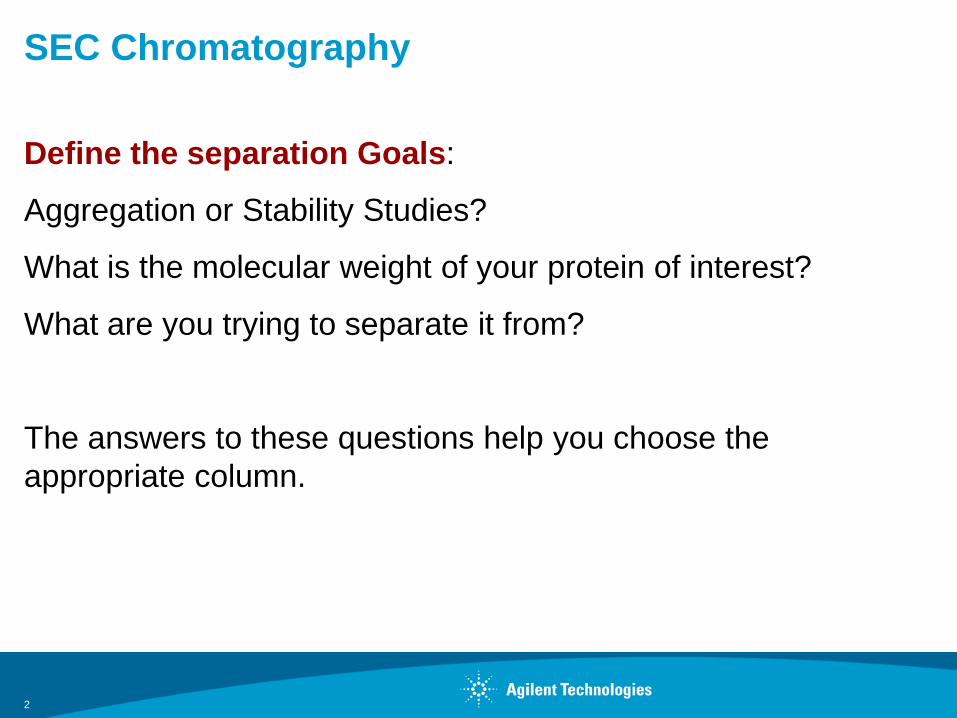
SEC Chromatography
Define the separation Goals:
Aggregation or Stability Studies?
What is the molecular weight of your protein of interest?
What are you trying to separate it from?
The answers to these questions help you choose the appropriate column.
2

Size Exclusion Process
3
Larger molecules spend less time in the pores and elute sooner.
Smaller molecules spend longer in the pores and elute later.
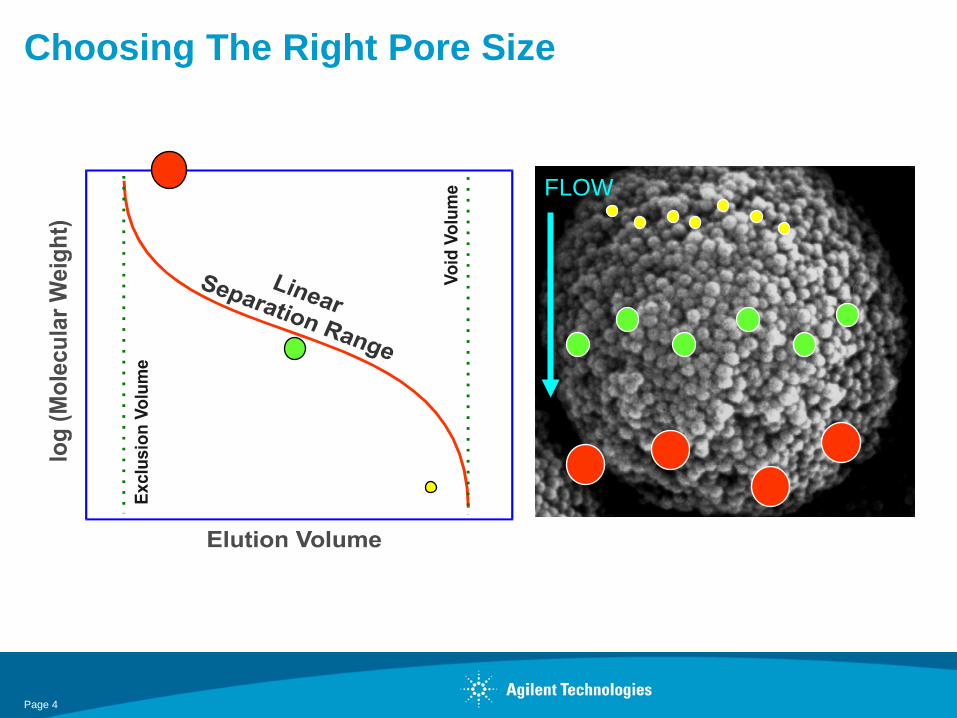
Choosing The Right Pore Size
Page 4
FLOW

Choose The Right Pore Size
5
• Choose a pore size that allows you to work in the linear portion of the calibration curve.
• If two molecules have the same molecular weight but different size in solution they may be separated
• The calibration curve describes how different size molecules elute from the column and can be used to determine molecular weight equivalents based on solution size
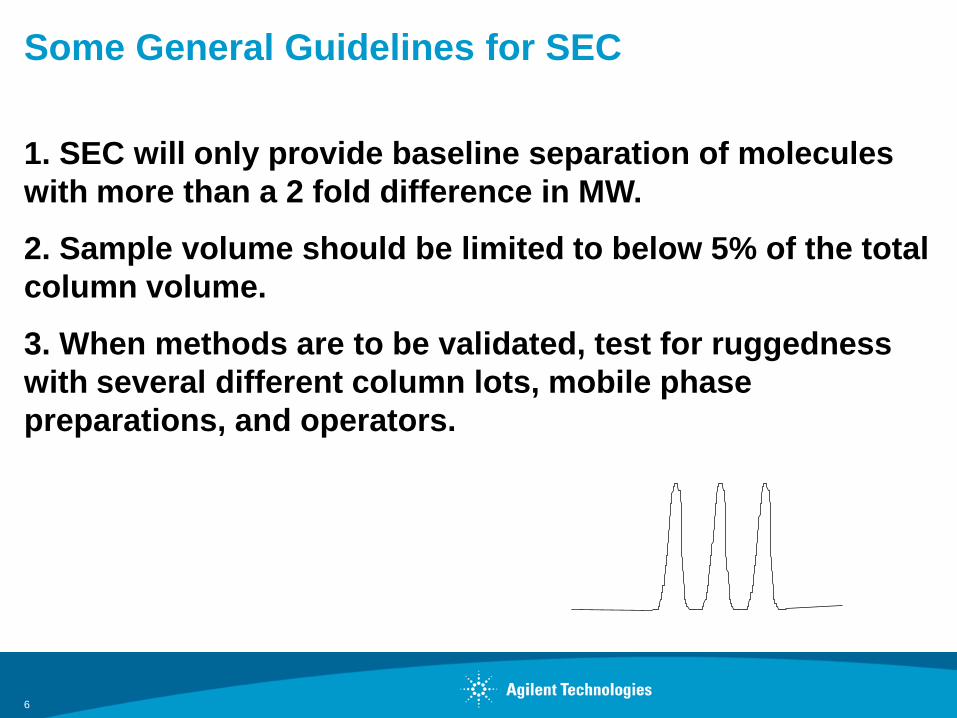
Some General Guidelines for SEC
1. SEC will only provide baseline separation of molecules with more than a 2 fold difference in MW.
2. Sample volume should be limited to below 5% of the total column volume.
3. When methods are to be validated, test for ruggedness with several different column lots, mobile phase preparations, and operators.
6

Column Evaluation and Comparison Bio-Rad Size Exclusion Standards
1. Thyroglobulin- 670 KD
2. Gamma Globulin – 320KD and 150 KD
3. Ovalbumin – 44.3 KD
4. Myoglobin- 17 KD
5. Vitamin B12 - 1,350 Da
7

Comparison of Agilent And Tosoh Agilent Bio SEC-5 in 150 mM NAPO4 pH 7.0 Tosoh TSKgel G3000 SWxl in 100 mM NaPO4 + 100 mM Na2SO4, pH 7.0
Rs – 1.47N, B12 - 29,115
N, B12 - 21,481Agilent Bio SEC-5, 300Å
Tosoh G3000 SWxl
Rs – 1.30
8

Columns: Bio SEC-3, 150Å, 7.8x300mm
& Bio SEC-3 300Å, 7.8x300mm
Buffer: 0.15 M Phosphate, pH 7.0
Flow rate: 1.0 mL/min
Detector: 214 nm
Injection: 10 µL
Sample:
1) Thyroglobulin, 670 kD
2) γ-Globulin, 158 kD
3) Ovalbumin, 44 kD
4) Myoglobulin, 16.9 kD
5) Vitamin B12, 1355 D.
Peak
Protein
SEC-3 150Å
SEC-3 300Å
1
Thyroglobulin
12420
1760
2
γ-Globulin
2860
3650
3
Ovalbumin
6620
11760
4
Myoglobulin
15020
20810
5
Vitamin B12
34370
35460
Min 0 1 2 3 4 5 6 7 8 9 10 11 12 13 14 15
1
2
3 4
5
1 2
3 4 5
Agilent Bio SEC-3, 150Å, 7.8x300mm
Agilent Bio SEC-3, 300Å, 7.8x300mm
Agilent Bio SEC-3 Separation of Bio-Rad Size Exclusion Protein Standard

Total Column Pore Volume Comparison (A) Agilent Bio SEC-5 in 100 mM NaPO4+100 mM NaSO2 buffer, pH 7.0 (B) Tosoh TSKgel G3000SWxl in 100 mM NaPO4+100 mM NaSO2 buffer, pH 7.0
A
B
7,43 mL
6.29 mL
N, B12- 29,115
N, B12- 21,481
10
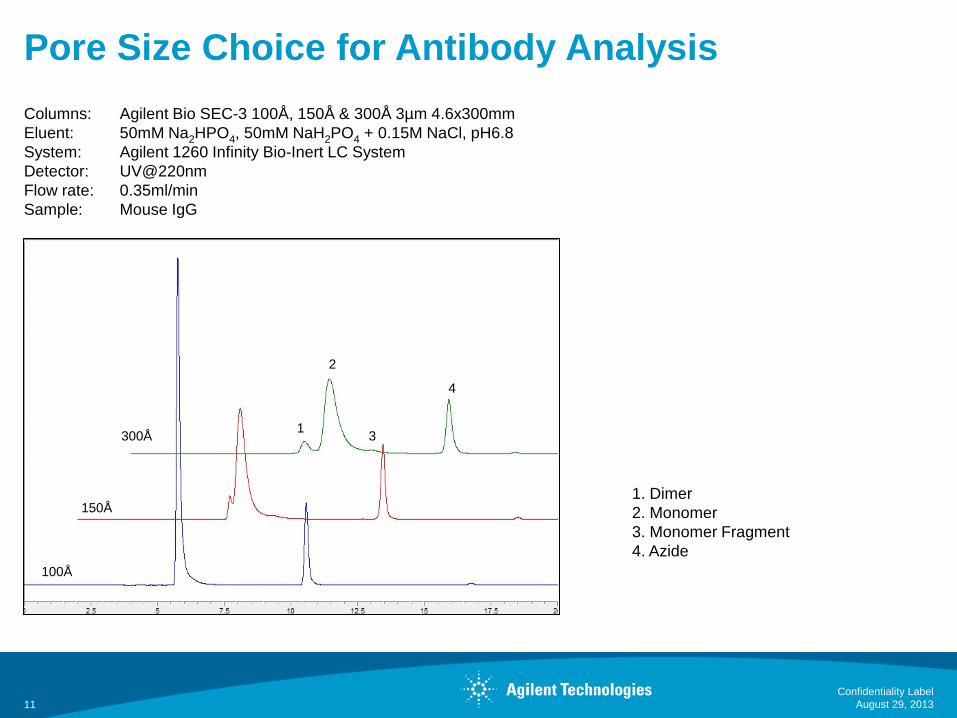
Pore Size Choice for Antibody Analysis
August 29, 2013 Confidentiality Label
11
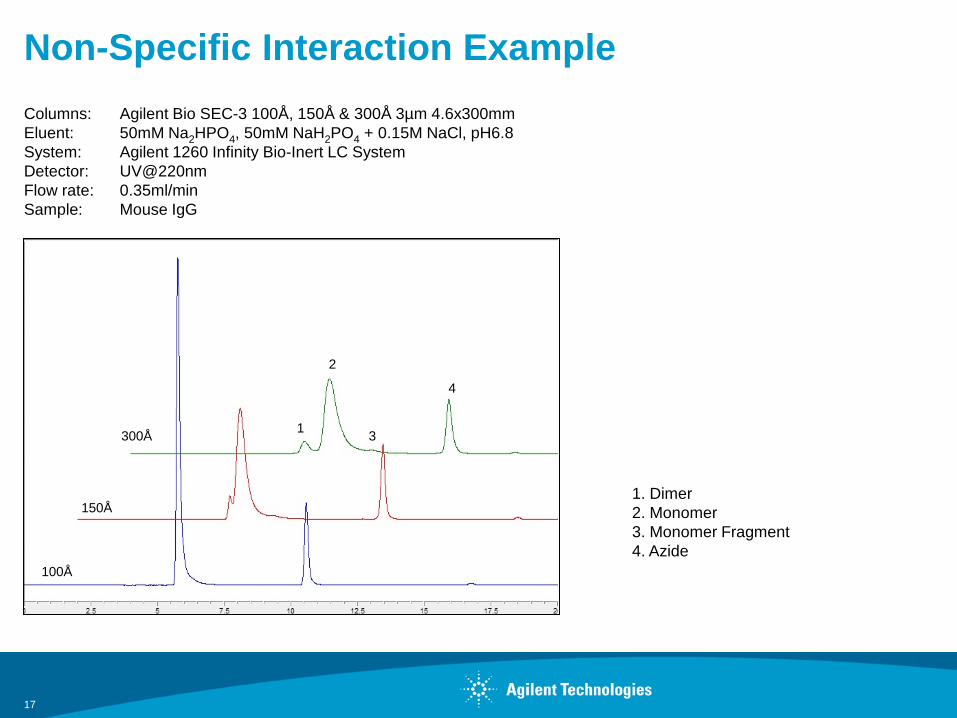
Columns: Agilent Bio SEC-3 100Å, 150Å & 300Å 3µm 4.6x300mm Eluent: 50mM Na2HPO4, 50mM NaH2PO4 + 0.15M NaCl, pH6.8 System: Agilent 1260 Infinity Bio-Inert LC System Detector: UV@220nm Flow rate: 0.35ml/min Sample: Mouse IgG
300Å
150Å
100Å
1
2
3
4
1. Dimer 2. Monomer 3. Monomer Fragment 4. Azide

Determine Optimal Mobile Phase Conditions
What conditions give you the best results?
What additives may be required to reduce non-specific interactions?
What is the optimal pH?
What is the optimal flow rate?
12

Mobile Phase Considerations:
• Mobile phase should contain buffer/salt (to overcome ionic interactions).
• Mobile phase should not contain too much buffer/salt (to prevent hydrophobic interactions).
• Mobile phase should not alter the analyte (cause degradation / aggregation etc.).
• Mobile phase should be made up fresh and used promptly (bacterial growth is rapid in dilute buffer stored at room temperature).
• Buffer shelf life < 7 days unless refrigerated.
• Mobile phase should be filtered before use. Particulates may be present in water (less likely) or in buffer salts (more likely).
2 13
A Note About Pre-Made PBS:
Note: PBS is typically around 10mM phosphate, pH 7.2, 0.8% NaCl (150mM).
Our preference is to use 150mM phosphate buffer, pH 7.0 to avoid use of salt (NaCl).
Other possibilities: sodium sulfate instead of sodium chloride (but remember 0.15M Na2SO4 is twice the ionic strength of 0.15M NaCl).
13-17 February 2012 Bio-applications Training Program
14

100mM Phosphate Buffer (Mixing NaH2PO4 and Na2HPO4 stock solution)
x mL 0.2M Na2HPO4
y mL 0.2M NaH2PO4
z mL H2O
200 mL 0.1M pH, 25°C
4.0 46.0 50.0 5.8 6.15 43.85 50.0 6.0 9.25 40.75 50.0 6.2
13.25 36.75 50.0 6.4 18.75 31.25 50.0 6.6 24.5 25.5 50.0 6.8 30.5 19.5 50.0 7.0 36.0 14.0 50.0 7.2 40.5 9.5 50.0 7.4 43.5 6.5 50.0 7.6
45.75 4.25 50.0 7.8 47.35 2.65 50.0 8.0
13-17 February 2012 Bio-applications Training Program
15
Stock Solutions: 0.2M Na2HPO4 = 28.39 g/L Na2HPO4 (anhydrous) or 71.64 g/L Na2HPO4.12H2O 0.2M NaH2PO4 = 31.21 g/L NaH2PO4.2H2O

RECOMMENDED STARTING CONDITIONS
150 Mm phosphate buffer, pH 7.0
Flow rate of 0.1-1.25 ml/min for 7.8 mm id columns
Isocratic for 30 minutes
Temperature 20-30 C. Higher temperatures can be used, see manufacturer’s spec.
16
Non-Specific Interaction Example
17
Columns: Agilent Bio SEC-3 100Å, 150Å & 300Å 3µm 4.6x300mm Eluent: 50mM Na2HPO4, 50mM NaH2PO4 + 0.15M NaCl, pH6.8 System: Agilent 1260 Infinity Bio-Inert LC System Detector: UV@220nm Flow rate: 0.35ml/min Sample: Mouse IgG
300Å
150Å
100Å
1
2
3
4
1. Dimer 2. Monomer 3. Monomer Fragment 4. Azide

EXAMPLES OF ADDITIVES TO REDUCE NONSPECIFIC INTERACTIONS 100-150mM NaCl
100-150mM NaSO4
50-100mM urea
Guanidine hydrochloride can also be used
5-10% ethanol
5% DMSO
18

About Particle Size, Dimensions, and Flow Rate
19

2 WAYS TO IMPROVE SEC RESOLUTION With SEC, there are two ways to improve efficiency/resolution:
1. Increase column length
2. Decrease column particle size
20

Agilent Bio SEC-5 Monoclonal Antibody Aggregation Monitoring
21
AU
-0.008
-0.006
-0.004
-0.002
0.000
0.002
0.004
0.006
0.008
0.010
0.012
0.014
0.016
0.018
0.020
Min 1.0 2.00 3.0 4.0 5.0 6.0 7.0 8.0 9.0 10.0 11.0 12.0 13.0 14.0 15.0
Excipients
MAb Dimer
Mab Aggregates
Columns: Bio SEC-5, 300Å, 7.8x300mm Buffer: 150 mM PBS, pH 7 Flow Rate: 1.0 mL/min Sample: Mab Temperature: Ambient

Size Exclusion Monitoring Aggregation and Impurities of Monoclonal Antibodies
22
AU
-0.005
0.000
0.005
0.010
0.015
0.020
0.025
0.030
0.035
Minutes1.00 2.00 3.00 4.00 5.00 6.00 7.00 8.00 9.00 10.00 11.00 12.00 13.00 14.00 15.00
Column: Bio SEC-3 300Å, 7.8x300mm Mobile phase: 150 mM Phosphate, pH 7 Flow rate: 1.0 mL/min Temperature: Ambient Sample: Monoclonal antibody (10 µL, 5 mg/mL)
Buffer/Excipients MAb
Dimer MAb
Aggregates
Low Molecular Weight Impurities

INCREASE THROUGHPUT/REDUCE TIME
Smaller particle size columns allow you to reduce time and improve throughput by:
1. allows you to use shorter column lengths without losing resolution
2. Allows you to also increase flow rate because you have more resolution room.
23

Fast SEC
Fast SEC
24
Column: Agilent Bio SEC-3, 7.8 x150mm Sample: mAb (2mg/ml) Injection: 5ul Flow rate: 1.0 and 1.5ml/min (56 bar , 75 bar) Eluent : 150mM sodium phosphate Detection: 220nm
Flow Rate Resolution Monomer/Dimer
Monomer Efficiency
Percentage Dimer
1.0ml/min 1.58 3,684 0.65
1.5ml/min 1.31 2,574 0.70
4 Minutes
monomer dimer
monomer dimer
1.5ml/min 1.0 ml/min

Fast SEC
August 29, 2013
Fast SEC
25
Column: Agilent Bio SEC-3, 7.8 x150mm Sample: mAb (2mg/ml) Injection: 5ul Flow rate: 1.0, 1.5 and 2ml/min (56 bar , 75 bar, 105 bar) Eluent: 150mM sodium phosphate + 100mM Na-sulfate Detection: 220nm
Flow Rate Resolution Monomer/Dimer
Monomer Efficiency
Percentage Dimer
1.0ml/min 1.53 3,510 0.64
1.5ml/min 1.43 2,502 0. 47
2.0ml/min 1.13 1,917 0.64
4 Minutes
monomer dimer
2.0ml/min 1.5ml/min 1.0 ml/min

• 5µm Particle • 100Å, 150Å, 300Å, 500Å, 1000Å,
2000Å pore sizes • High stability and long lifetime • Great reproducibility • IDs: 4.6, 7.8 (larger are currently
custom)
26

• Unique, 3µm particle • 100Å, 150Å, 300Å pore sizes • Highest resolution • Highest efficiency • Faster SEC separations • IDs: 4.6, 7.8 (larger are currently
custom)
27

Consistent, accurate results with reproducible separation of IgG monomer & aggregates
28
IgG Inj. No. Aggs Dimer Monomer
1st % Ratio 6.906 17.178 75.916
RS Factor - 0.72 1.63
10th % Ratio 6.628 17.045 76.326
RS Factor - 0.73 1.63
20th % Ratio 6.336 16.773 76.892
RS Factor - 0.73 1.63
30th % Ratio 6.145 16.661 77.194
RS Factor - 0.74 1.63
40th % Ratio 6.004 16.610 77.386
RS Factor - 0.74 1.63
50th % Ratio 6.345 16.768 76.892
RS Factor - 0.74 1.63
Overlays of injections from 1, 10, 20, 30, 40, and 50th injection visually show the consistency of the results. The table shows the consistent ratios of monomer, dimer and aggregate Technology: Small particle SEC Column
Bio SEC-3, 7.8x 300 mm ID column Result: Consistent Quantitation

SEC CONCLUSION
Use what works best and helps you achieve your separation goal!
29

Questions?
30