Im twelve years old. Section B. eleven twelve thirteen fourteen fifteen New words sixteen.

TWO
Nichols plc is a highly focused soft drinks business.
Its brand portfolio includes Vimto, which is sold in over 65 countries and Sunkist & Panda which are sold in the UK.
The group has a leading market position in both the stills and carbonates drinks categories and also in the soft drinks on dispense market, where its brands include Cabana, Ben Shaws & Dayla.
THREE
FOURCHAIRMAN’S STATEMENT
SIXCHIEF EXECUTIVE’S REVIEW
TWELVEFINANCIAL REVIEW
FOURTEENDIRECTORS & ADVISORS
SIXTEENDIRECTORS’ REPORT
TWENTYINDEPENDENT AUDITOR’S REPORT
TWENTY ONEFINANCIAL STATEMENTS
FIFTYNOTICE OF MEETING
FIFTY FIVEFINANCIAL CALENDAR
FOUR
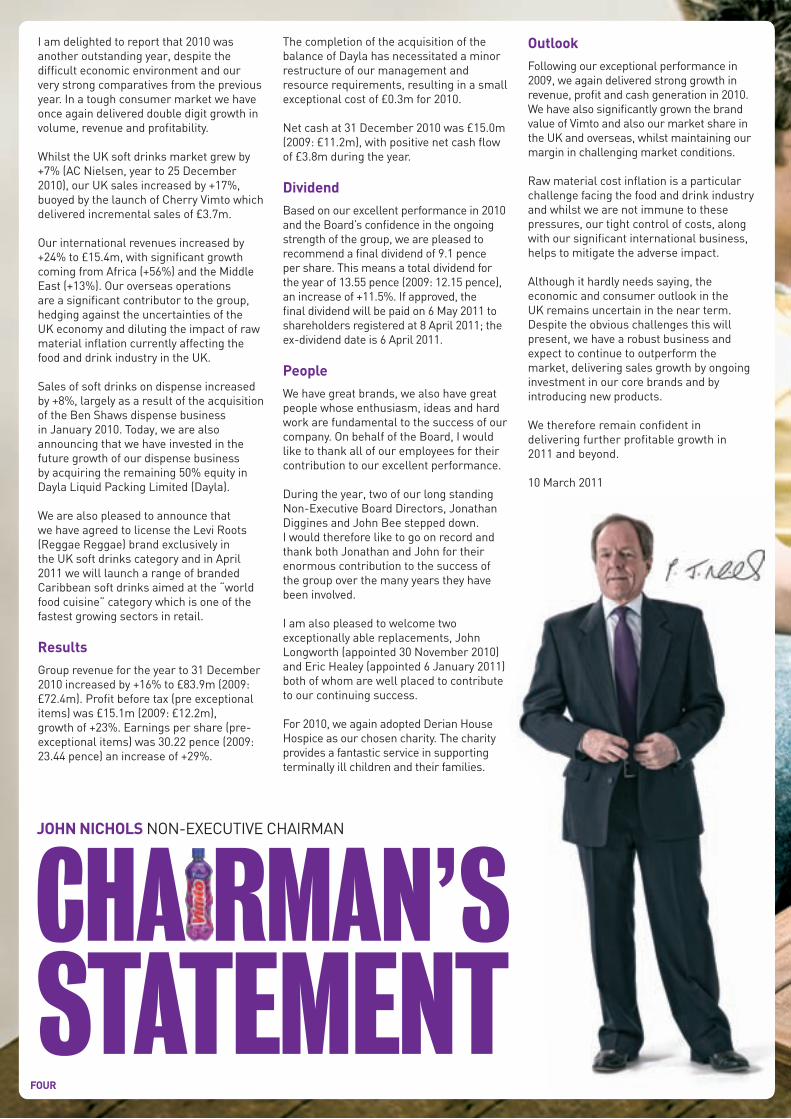
JOHN NICHOLS NON-EXECUTIVE CHAIRMAN
I am delighted to report that 2010 was another outstanding year, despite the diffi cult economic environment and our very strong comparatives from the previous year. In a tough consumer market we have once again delivered double digit growth in volume, revenue and profi tability.
Whilst the UK soft drinks market grew by +7% (AC Nielsen, year to 25 December 2010), our UK sales increased by +17%, buoyed by the launch of Cherry Vimto which delivered incremental sales of £3.7m.
Our international revenues increased by +24% to £15.4m, with signifi cant growth coming from Africa (+56%) and the Middle East (+13%). Our overseas operations are a signifi cant contributor to the group, hedging against the uncertainties of the UK economy and diluting the impact of raw material infl ation currently affecting the food and drink industry in the UK.
Sales of soft drinks on dispense increased by +8%, largely as a result of the acquisition of the Ben Shaws dispense business in January 2010. Today, we are also announcing that we have invested in the future growth of our dispense business by acquiring the remaining 50% equity in Dayla Liquid Packing Limited (Dayla).
We are also pleased to announce that we have agreed to license the Levi Roots (Reggae Reggae) brand exclusively in the UK soft drinks category and in April 2011 we will launch a range of branded Caribbean soft drinks aimed at the “world food cuisine” category which is one of the fastest growing sectors in retail.
ResultsGroup revenue for the year to 31 December 2010 increased by +16% to £83.9m (2009: £72.4m). Profi t before tax (pre exceptional items) was £15.1m (2009: £12.2m), growth of +23%. Earnings per share (pre-exceptional items) was 30.22 pence (2009: 23.44 pence) an increase of +29%.
The completion of the acquisition of the balance of Dayla has necessitated a minor restructure of our management and resource requirements, resulting in a small exceptional cost of £0.3m for 2010.
Net cash at 31 December 2010 was £15.0m (2009: £11.2m), with positive net cash fl ow of £3.8m during the year.
Dividend Based on our excellent performance in 2010 and the Board’s confi dence in the ongoing strength of the group, we are pleased to recommend a fi nal dividend of 9.1 pence per share. This means a total dividend for the year of 13.55 pence (2009: 12.15 pence), an increase of +11.5%. If approved, the fi nal dividend will be paid on 6 May 2011 to shareholders registered at 8 April 2011; the ex-dividend date is 6 April 2011.
PeopleWe have great brands, we also have great people whose enthusiasm, ideas and hard work are fundamental to the success of our company. On behalf of the Board, I would like to thank all of our employees for their contribution to our excellent performance.
During the year, two of our long standing Non-Executive Board Directors, Jonathan Diggines and John Bee stepped down.I would therefore like to go on record and thank both Jonathan and John for their enormous contribution to the success of the group over the many years they have been involved.
I am also pleased to welcome two exceptionally able replacements, John Longworth (appointed 30 November 2010) and Eric Healey (appointed 6 January 2011) both of whom are well placed to contribute to our continuing success.
For 2010, we again adopted Derian House Hospice as our chosen charity. The charity provides a fantastic service in supporting terminally ill children and their families.
OutlookFollowing our exceptional performance in 2009, we again delivered strong growth in revenue, profi t and cash generation in 2010. We have also signifi cantly grown the brand value of Vimto and also our market share in the UK and overseas, whilst maintaining our margin in challenging market conditions.
Raw material cost infl ation is a particular challenge facing the food and drink industry and whilst we are not immune to these pressures, our tight control of costs, along with our signifi cant international business, helps to mitigate the adverse impact.
Although it hardly needs saying, the economic and consumer outlook in the UK remains uncertain in the near term. Despite the obvious challenges this will present, we have a robust business and expect to continue to outperform the market, delivering sales growth by ongoing investment in our core brands and by introducing new products.
We therefore remain confi dent in delivering further profi table growth in 2011 and beyond.
10 March 2011

FIVE
SIX
SEVEN
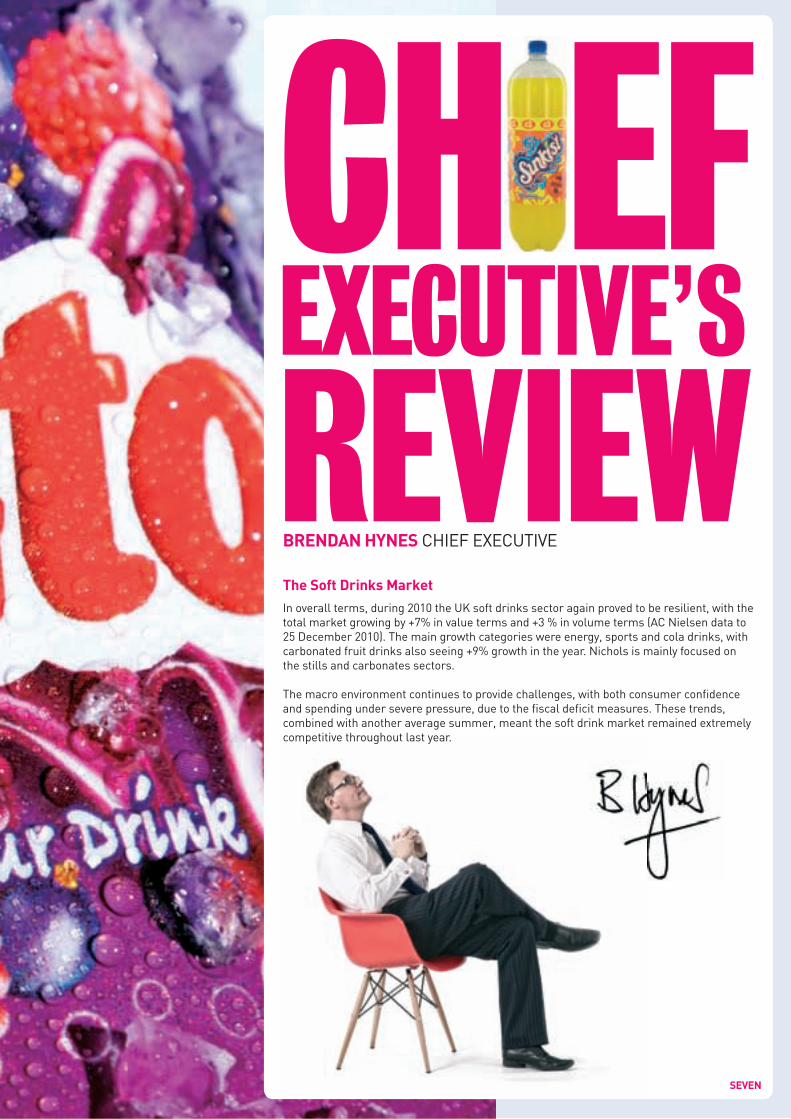
BRENDAN HYNES CHIEF EXECUTIVE
The Soft Drinks MarketIn overall terms, during 2010 the UK soft drinks sector again proved to be resilient, with the total market growing by +7% in value terms and +3 % in volume terms (AC Nielsen data to 25 December 2010). The main growth categories were energy, sports and cola drinks, with carbonated fruit drinks also seeing +9% growth in the year. Nichols is mainly focused on the stills and carbonates sectors.
The macro environment continues to provide challenges, with both consumer confi dence and spending under severe pressure, due to the fi scal defi cit measures. These trends, combined with another average summer, meant the soft drink market remained extremely competitive throughout last year.

The food and drink industry is also suffering from severe input cost infl ation, with limited visibility on key commodity costs and availability. Despite all these challenging factors we continued to make excellent progress, which bodes well for the long term health of our business.
Our strategy, which is to grow our business both organically and through acquisition, whilst pursuing a balanced mix of volume and value growth, was again successful in 2010. This strategy, combined with increased year on year investment in our core brands, has enabled us to continue to grow our market share. It also resulted in a +16% growth in group sales, whilst maintaining our operating margin. Sales growth in 2009 was also a very healthy +29%, which provided a very testing set of comparatives to beat in 2010.
In January 2010, we acquired the number four player in the soft drinks dispense market, Ben Shaws. This addition consolidated our position as the number three player in this sector.
Group Financial PerformanceIn 2010 we again delivered a very strong fi nancial performance, above both our internal and external expectations. This has been achieved despite the economic and consumer uncertainties highlighted above, along with high raw material infl ation.
In summary, in 2010 we delivered:• 16% sales growth
• 23% profi t growth
• 29% Earnings per share growth(pre-exceptional)
• 11.5% Dividend growth
EIGHT

Additionally, the group’s cash conversion was also ahead of expectations and we finished the year with £15m of cash in the bank, having completed the purchase of the Ben Shaws dispense business and invested more behind our core brands in 2010 than in 2009.
Our highly focused strategy has resulted in a further increase in our market share in the year across both the stills and carbonates categories.
Trading PerformanceThe group now sells in the UK and to over 65 countries internationally. We have a leading market position in both the stills and carbonates drinks categories, through our brand portfolio which includes Vimto, Sunkist, Panda, Cabana and Ben Shaws.
Sales in the UK increased by +14% to £69m
(2009: £61m). This was achieved through increased distribution of Vimto in the UK, combined with new customer account wins in the independent sector. The successful launch of Cherry Vimto at the beginning of 2010 also contributed to our strong growth. Our sales of soft drinks on dispense increased by +8 % year on year, a good result given the downturn experienced in the licensed sector, in particular. This was largely achieved by the acquisition of the Ben Shaws dispense business in January 2010.
We again invested heavily in marketing in 2010, running our “seriously mixed up fruit” campaign for a second year. This award winning campaign has improved market penetration and brought over 1 million new consumers into the Vimto brand.
We have also re-designed the Vimto packaging and this will be launched in the first quarter of 2011. This initiative will update
NINE
and modernise the brand image with a cleaner more natural look.
In 2008, we acquired a 50% share of Dayla Liquid Packing Limited (Dayla), with an option to acquire the remaining 50% on agreed terms. On 9 March 2011 we exercised this option and have now completed the 100% acquisition of Dayla. This gives us access to the premium juice, bag in box market in Europe and broadens our product offering and market reach.
Internationally, 2010 was another successful year with sales increasing by +24% to £15.4m. This was driven by Vimto increasing its market share particularly in Africa, the Middle East and Northern Europe.
In Africa, we again increased the level of product that is locally manufactured and increased our marketing investment. These factors resulted in sales increasing by +56% in this region.

In the Middle East, sales grew by +13% year on year with growth across both stills and carbonates products.
In summary, growth from our core markets, combined with new product developments and opening new geographical markets in 2010, has enabled us to maintain our strong momentum.
Brand LicensingThe expansion of the Vimto brand franchise into new product categories continues with great success. Revenues from licensing the Vimto brand were again signifi cantly up year on year, with nearly 40 million individual products consumed in 2010.
The Vimto brand is now available in a number of new licensed products including Vimto Fruit Numbers, Vimto Fruit Rope and Vimto Ice Lollies. These are complementary and contribute greatly to improving Vimto’s overall brand awareness and penetration.
Corporate Responsibility We take our responsibilities seriously and Nichols plc has a sustainable business strategy which includes our environmental and wider social responsibilities.
Sustainability and the EnvironmentWe continue to actively work with the British Soft Drinks Association (BSDA), the Food and Drink Federation (FDF) and our key suppliers on environmental improvements, with four key areas targeted. These are:• Climate change• Waste and packaging• Water• Transport
We made good progress against these targets in 2010, including an ongoing review of the packaging and distribution requirements for all our products. This has resulted in reductions in packaging weights and distribution movements including:
• Increased Dilute cases per pallet reducing pallet movements by 1,900 per annum, equivalent to 72 truck loads
• Increased tetra cartons cases per pallet resulting in a reduction in pallet movements by 140 per annum, equivalent to 5 truck loads
• Lightening of Dilute bottles reducing PET usage by over 145 tonnes or 17%
• Dilute bottles now contain 25% recycled PET equivalent to 180 tonnes
• Recycled on pack labels now used for all new labels
To underline our continued commitment we have now also signed up to the Courtauld Commitment (Phase 2) and look forward to working with the Waste Resources Action Programme (WRAP) to achieve their aims.
We are also members of Business in the Community (BITC), a charitable organisation committed to building a sustainable future for people and the planet. With the help of BITC, businesses are challenged to improve performance and benefi t society in the areas of community, environment and workplace.
EmployeesOur people are crucial to what we do and who we are. Our core values are built on our unique and special culture and cover key areas such as customer service, quality, professionalism, teamwork and mutual support. We have a strong emphasis on learning and development and aim to deliver consistently high results in everything we do. This has again been recognised externally, with Nichols plc being awarded an Outstanding Three Star status in the 2010 Best Companies Survey.
CommunityWe actively encourage our people to give something back and work with the wider community. In 2010 our charity team once again worked hard on behalf of our chosen charity, Derian House, holding a wide variety of events, including the annual Nichols plc Charity Golf Day, which involve our customers, suppliers and advisors.
10 March 2011TEN

ELEVEN
Income Statement2010 group revenue increased by 16% to £83.9m (2009: £72.4m). This performance was outstanding on the back of 2009’s exceptional performance (29% growth) and means the group has now delivered a 49% increase in sales over the last two years.
Both the stills and carbonates soft drinks segments contributed to the growth across all business activities:
UK soft drink revenues totalled £49.9m, 17% up on 2009, carbonated drinks were 20% up and still drinks were 14% ahead of the prior year. Key drivers were:• Further distribution gains for Vimto
original. • The successful launch of Cherry Vimto
in both stills and carbonates categories delivered incremental sales of £3.7m.
• Re-launch of Sunkist in the carbonates category.
Revenue from our international business also increased, rising by 24% to £15.4m. Most notably: • Sales to African customers were up 56%
on the prior year, totalling £4.2m (2009: £2.7m).
• Middle East sales were £9.1m, 13% ahead of 2009 (£8.1m).
Dispense sales were £18.6m (2009: £17.3m), an increase of 8% in a challenging market. The growth was driven by our acquisition of the Ben Shaws dispense business in January 2010.
Revenue
2005 adjusted to show like for like revenue (excluding£11.8m for Balmoral, sold January 2006)
TWELVE
Operating profi t before exceptional items increased by 21% to £15.1m (2009: £12.5m). A strong focus on cost control meant that the sales growth was converted in to profi t, as a result, the operating margin (before exceptionals) return on sales was 18%, up from 17% in 2009.
The net fi nancing costs reduced to less than £0.1m (2009: net cost of £0.28m), interest received on our cash deposits increased and the IAS 19 net fi nance charges were lower due to an increase in expected returns on the defi ned benefi t pension plan assets.
Profi t Before Tax and exceptional items increased by 23% to £15.1m (2009: £12.2m).
Exceptional items totalled £0.29m and were due to a minor restructure of resources following the acquisition of the remaining 50% share capital of Dayla Liquid Packing Ltd.
The tax charge was £4.0m, the effective rate was 27% (2009: 30%), the change in rate being the effect of timing differences.
Statement of Financial PositionBy exception, points of note are:• Goodwill increased by £2.0m to £11.9m
as a result of the acquisition of the Ben Shaws dispense business.
• Inventories were valued at £3.4m, £0.7m higher than 2009 (£2.7m). The increase was driven by the higher trading volumes and a specifi c stock build for January 2011 promotions.
Group cash at the year-end was £15.0m (2009: £11.2m), a net positive cash fl ow of £3.8m. Signifi cant non-operating cash outfl ows during the year were: dividends £4.6m, acquisition of the Ben Shaws dispense business £2.7m and tax payments £3.8m.
Earnings Per ShareEarnings Per Share (EPS) before exceptional items was 30.22 pence, 29% up on 2009. EPS before exceptional items has increased by 137% since 2005.
DividendThe Board is recommending a fi nal dividend of 9.1 pence per ordinary share (2009, the comparable second interim dividend was 8.1 pence) payable to shareholders on the register at 8 April 2011. The fi nal dividend together with the interim dividend of 4.45 pence, gives a total dividend of 13.55 pence per share for the full year (2009: 12.15 pence).
Internal ControlThe Nichols group complies with the principles of good corporate governance and has an established process of internal control and risk management.
Internal Financial ControlThe Board is ultimately responsible for maintaining sound internal control systems to safeguard the investment of shareholders and the company’s assets. The systems are reviewed by the Board and are designed to provide reasonable, but not absolute, assurance against material mis-statement or loss.
TIM CROSTON GROUP FINANCIAL DIRECTOR

THIRTEEN
Audit CommitteeThe Audit Committee consists of E Healey, J Nichols and J Longworth. The terms of reference of the Committee include keeping under review the scope and results of the external audit. The Committee ensures the independence and objectivity of the external auditors, including the nature and extent of non-audit services supplied. Any further services with a value over £25,000 would require Nichols plc Board approval.
Risks and UncertaintiesThe UK soft drinks business continues to be fully dependent on third party suppliers for all products. To manage this risk we have appropriate and adequate audit procedures and resource at our disposal to ensure that the division sells product of the highest quality.
Following the acquisition of the remaining 50% of the shares of Dayla Liquid Packing Limited (March 2011), the Dispense business has direct influence over product supply.
A large proportion of our international business is with the Middle East and Africa. Any political instability in these key regions could lead to volatility in our trading patterns. Issues in the Middle East at the time of writing are not affecting our core international markets.
In common with many businesses we are now also highly dependent on the availability of IT systems to carry out many trading activities.
We have robust business continuity plans and stress test procedures in place to minimise all risks and exposures that the group faces.
ShareholdersWe consider that both the FTSE AIM index and FTSE Fledgling index serve well as ongoing performance comparatives against the Total Shareholder Return (TSR) delivered by Nichols plc.
Going ConcernAfter making enquiries, the directors have formed a judgement, at the time of approving the financial statements, that there is a reasonable expectation that the group has adequate resources to continue in operational existence for the foreseeable future. For this reason the directors continue to adopt the going concern basis in preparing the financial statements.

FOURTEEN
FIFTEEN
AuditorsGrant Thornton UK LLP,4 Hardman Square, Spinningfi elds,Manchester. M3 3EB
BankersThe Royal Bank of Scotland plc,1 Spinningfi elds Square,Manchester. M3 3AP
SolicitorsDLA Piper, 101 Barbirolli Square,Manchester. M2 3DL
Stockbrokers & Nominated AdvisorBrewin Dolphin Limited, PO Box 512,National House, 36 St Ann Street,Manchester. M60 2EP
Financial AdvisorsN M Rothschild & Sons Limited,82 King Street, Manchester. M2 4WQ
RegistrarsCapita Registrars Limited,Northern House, Woodsome Park,Fenay Bridge, Huddersfi eld. HD8 0GA
Registered Offi ceLaurel House, Woodlands Park,Ashton Road, Newton-le-Willows. WA12 0HH
Registered Number238303
SIXTEEN
TIM CROSTON COMPANY SECRETARY
The directors present their report and the audited fi nancial statements for the year ended 31 December 2010.
Principal activities and business reviewThe company and its principal operating subsidiaries are engaged in the supply of soft drinks to the retail, wholesale, catering, licensed and leisure industries.
A review of the group’s trading during the year and its prospects are contained in the Chairman’s Statement on pages four and fi ve, the Chief Executive’s Review on pages six to eleven and the Financial Review on pages twelve to thirteen.
Details of signifi cant events since the balance sheet date are contained in the Chairman’s Statement, Chief Executive’s Review and the Financial Review.
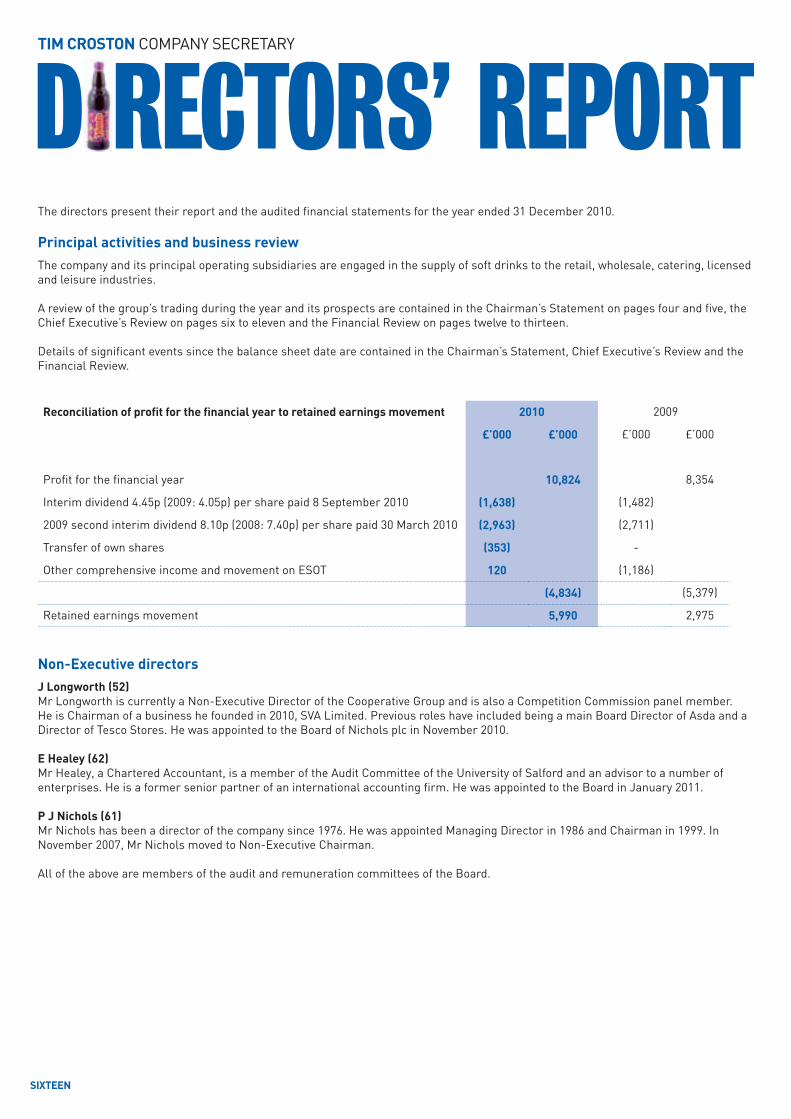
Reconciliation of profi t for the fi nancial year to retained earnings movement 2010 2009
£’000 £’000 £’000 £’000
Profi t for the fi nancial year 10,824 8,354
Interim dividend 4.45p (2009: 4.05p) per share paid 8 September 2010 (1,638) (1,482)
2009 second interim dividend 8.10p (2008: 7.40p) per share paid 30 March 2010 (2,963) (2,711)
Transfer of own shares (353) -
Other comprehensive income and movement on ESOT 120 (1,186)
(4,834) (5,379)
Retained earnings movement 5,990 2,975
Non-Executive directorsJ Longworth (52)Mr Longworth is currently a Non-Executive Director of the Cooperative Group and is also a Competition Commission panel member. He is Chairman of a business he founded in 2010, SVA Limited. Previous roles have included being a main Board Director of Asda and a Director of Tesco Stores. He was appointed to the Board of Nichols plc in November 2010.
E Healey (62)Mr Healey, a Chartered Accountant, is a member of the Audit Committee of the University of Salford and an advisor to a number of enterprises. He is a former senior partner of an international accounting fi rm. He was appointed to the Board in January 2011.
P J Nichols (61)Mr Nichols has been a director of the company since 1976. He was appointed Managing Director in 1986 and Chairman in 1999. In November 2007, Mr Nichols moved to Non-Executive Chairman.
All of the above are members of the audit and remuneration committees of the Board.
SEVENTEEN
On 30 November 2010 and 6 January 2011, J Diggines and J Bee respectively, resigned as Non-Executive Directors.
Executive directorsB M Hynes (50)Mr Hynes joined the company as Group Finance Director in 2002 and was appointed Chief Executive Officer in November 2007. He has previously been group Finance Director at William Baird plc and KPS plc.
T J Croston (47)Mr Croston initially joined the company as Group Financial Controller in 2005 and moved to Finance and Operations Director for the Soft Drinks Division in 2007. He was appointed Group Finance Director on 1 January 2010.
Financial risk management objectives and policiesBusiness risks and uncertainties are included within the Financial Review on page thirteen and financial risks are set out in note 22 to the financial statements.
Creditor payment policyThe group’s policy is to agree terms of payment at the start of business with all suppliers, to abide by these terms and to pay in accordance with its contractual and other legal obligations. At 31 December 2010 there were 39 (2009: 47) creditor days outstanding.
EmployeesThe group’s policy is to recruit and promote on the basis of aptitude and ability without discrimination of any kind. Applications for employment by disabled people are always fully considered bearing in mind the qualification and abilities of the applicants. In the event of employees becoming disabled every effort is made to ensure their continued employment.The management of the individual operating companies consult with employees and keep them informed on matters of current interest and concern to the business.
Charitable and political donationsCharitable donations during the year amounted to £28,000 (2009: £7,000). There were no political donations in either 2010 or 2009.
Share optionsThe company operates a Save As You Earn share option scheme. In conjunction with this it makes donations to an Employee Share Ownership Trust to enable shares to be bought in the market to satisfy the demand from option holders.
Share capitalThe resolutions concerning the ability of the Board to purchase the company’s own shares and to allot shares are again being proposed at the Annual General Meeting.
In exercising its authority in respect of the purchase and cancellation of the company’s shares the Board takes as its major criterion the effect of such purchases on future expected earnings per share. No purchase is made if the effect is likely to be deterioration in future expected earnings per share growth. During the year the company did not purchase any of its own shares.The Board believes that being permitted to allot shares within the limits set out in the resolution without the delay and expense of a general meeting gives the ability to take advantage of circumstances that may arise during the year.
EIGHTEEN
AuditorsIn accordance with Section 487(2) of the Companies Act 2006 a resolution will be proposed at the Annual General Meeting that Grant Thornton UK LLP be re-appointed auditors. Directors’ Responsibilities Statement The directors are responsible for preparing the Directors’ Report and the fi nancial statements in accordance with applicable law and regulations.
Company law requires the directors to prepare fi nancial statements for each fi nancial year. Under that law the directors have elected to prepare the fi nancial statements in accordance with International Financial Reporting Standards as adopted by the European Union (IFRSs). Under company law Section 393, Companies Act 2006, the directors must not approve the fi nancial statements unless they are satisfi ed that they give a true and fair view of the state of affairs and profi t or loss of the company and group for that period. In preparing these fi nancial statements, the directors are required to:
• select suitable accounting policies and then apply them consistently; • make judgments and accounting estimates that are reasonable and prudent;• state whether applicable IFRSs have been followed, subject to any material departures disclosed and explained in the fi nancial
statements; • prepare the fi nancial statements on the going concern basis unless it is inappropriate to presume that the company will continue in
business.
The directors are responsible for keeping adequate accounting records that are suffi cient to show and explain the company’s transactions and disclose with reasonable accuracy at any time the fi nancial position of the company and enable them to ensure that the fi nancial statements comply with the Companies Act 2006. They are also responsible for safeguarding the assets of the company and hence for taking reasonable steps for the prevention and detection of fraud and other irregularities.
In so far as each of the directors is aware:
• there is no relevant audit information of which the company’s auditor are unaware; and• the directors have taken all steps that they ought to have taken to make themselves aware of any relevant audit information and to
establish that the auditors are aware of that information.
The directors are responsible for the maintenance and integrity of the corporate and fi nancial information included on the company’s website. Legislation in the United Kingdom governing the preparation and dissemination of fi nancial statements may differ from legislation in other jurisdictions.
Directors’ indemnityThe group has agreed to indemnify its directors against third party claims which may be brought against them and has in place an offi cers’ insurance policy.
NINETEEN
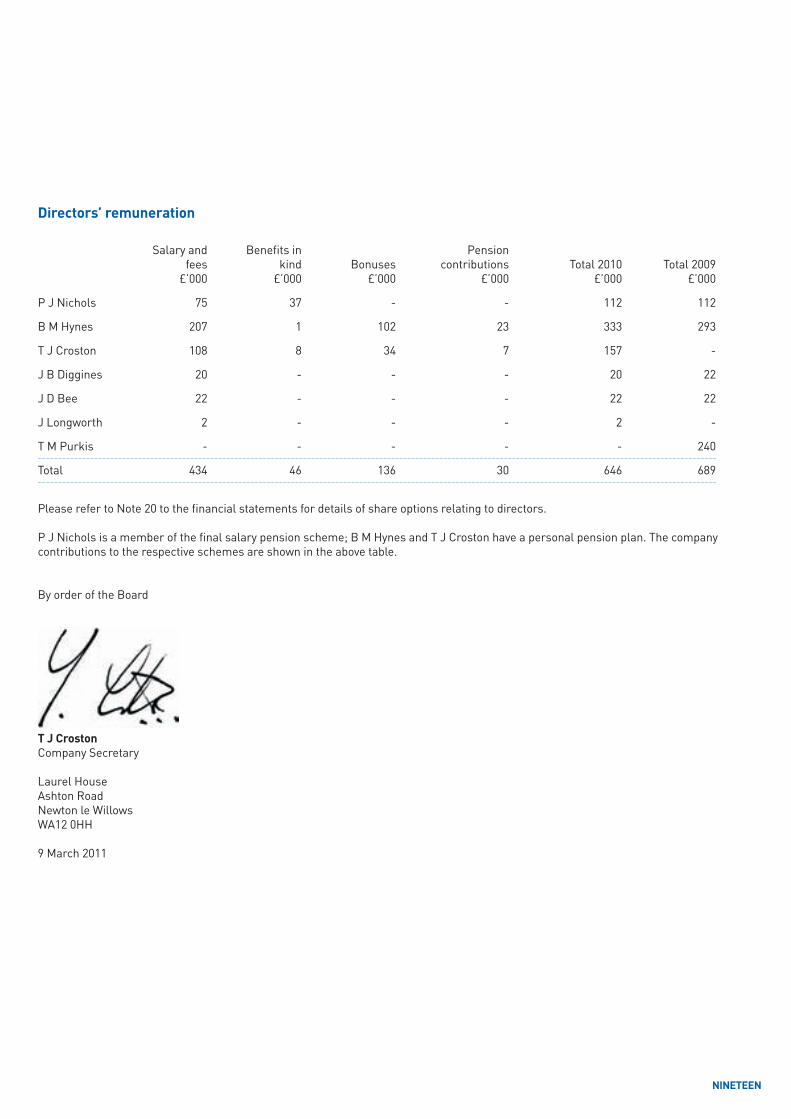
Directors’ remuneration
Salary and Benefits in Pension fees kind Bonuses contributions Total 2010 Total 2009 £’000 £’000 £’000 £’000 £’000 £’000
P J Nichols 75 37 - - 112 112
B M Hynes 207 1 102 23 333 293
T J Croston 108 8 34 7 157 -
J B Diggines 20 - - - 20 22
J D Bee 22 - - - 22 22
J Longworth 2 - - - 2 -
T M Purkis - - - - - 240
Total 434 46 136 30 646 689
Please refer to Note 20 to the financial statements for details of share options relating to directors.
P J Nichols is a member of the final salary pension scheme; B M Hynes and T J Croston have a personal pension plan. The company contributions to the respective schemes are shown in the above table.
By order of the Board
T J CrostonCompany Secretary
Laurel House Ashton Road Newton le WillowsWA12 0HH
9 March 2011
TWENTY
We have audited the financial statements of Nichols plc for the year ended 31 December 2010 which comprise the consolidated income statement, the consolidated statement of comprehensive income, the group and parent company statements of financial position, the consolidated and parent company statements of cash flow, the group and parent company statements of changes in equity and the related notes. The financial reporting framework that has been applied in their preparation is applicable law and International Financial Reporting Standards (IFRSs) as adopted by the European Union and, as regards the parent company financial statements, as applied in accordance with the provisions of the Companies Act 2006.
This report is made solely to the company’s members, as a body, in accordance with Chapter 3 of Part 16 of the Companies Act 2006. Our audit work has been undertaken so that we might state to the company’s members those matters we are required to state to them in an auditor’s report and for no other purpose. To the fullest extent permitted by law, we do not accept or assume responsibility to anyone other than the company and the company’s members as a body, for our audit work, for this report, or for the opinions we have formed.
Respective responsibilities of directors and auditorAs explained more fully in the Directors’ Responsibilities Statement set out on page eighteen, the directors are responsible for the preparation of the financial statements and for being satisfied that they give a true and fair view. Our responsibility is to audit and express an opinion on the financial statements in accordance with applicable
law and International Standards on Auditing (UK and Ireland). Those standards require us to comply with the Auditing Practices Board’s (APB’s) Ethical Standards for Auditors.
Scope of the audit of the financial statementsA description of the scope of an audit of financial statements is provided on the APB’s website at www.frc.org.uk/apb/scope/private.cfm.
Opinion on financial statementsIn our opinion:
• the financial statements give a true and fair view of the state of the group’s and of the parent company’s affairs as at 31 December 2010 and of the group’s profit for the year then ended;
• the group financial statements have been properly prepared in accordance with IFRSs as adopted by the European Union;
• the parent company financial statements have been properly prepared in accordance with IFRS as adopted by the European Union and as applied in accordance with the provisions of the Companies Act 2006; and
• the financial statements have been prepared in accordance with the requirements of the Companies Act 2006.
Opinion on other matter prescribed by the Companies Act 2006In our opinion the information given in the Directors’ Report for the financial year for which the financial statements are prepared is consistent with the financial statements.
Matters on which we are required to report by exception
We have nothing to report in respect of the following matters where the Companies Act 2006 requires us to report to you if, in our opinion:
• adequate accounting records have not been kept by the parent company, or returns adequate for our audit have not been received from branches not visited by us; or
• the parent company financial statements are not in agreement with the accounting records and returns; or
• certain disclosures of directors’ remuneration specified by law are not made; or
• we have not received all the information and explanations we require for our audit.
Joanne KearnsSenior Statutory Auditor
for and on behalf of Grant Thornton UK LLPStatutory Auditor, Chartered AccountantsManchester
9 March 2011

TWENTY ONE
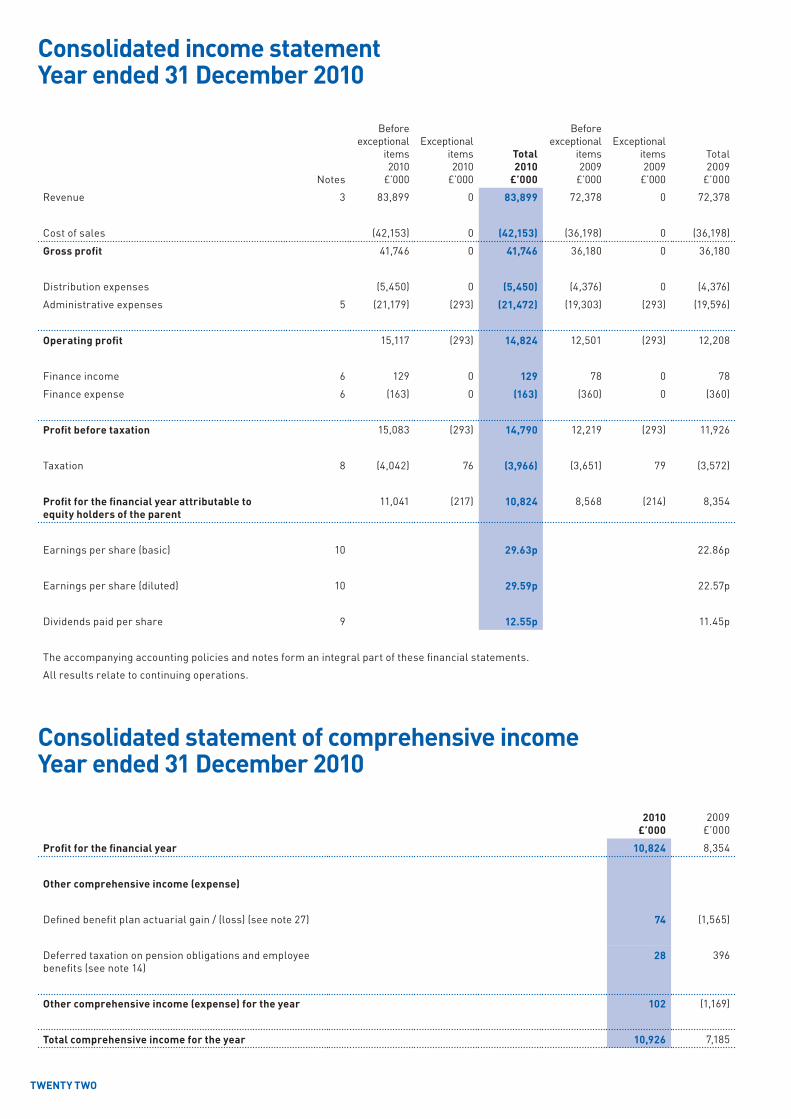
Consolidated income statementYear ended 31 December 2010
Consolidated statement of comprehensive incomeYear ended 31 December 2010
Notes
Beforeexceptional
items2010
£’000
Exceptionalitems2010
£’000
Total2010
£’000
Beforeexceptional
items2009
£’000
Exceptionalitems2009
£’000
Total2009
£’000
Revenue 3 83,899 0 83,899 72,378 0 72,378
Cost of sales (42,153) 0 (42,153) (36,198) 0 (36,198)
Gross profit 41,746 0 41,746 36,180 0 36,180
Distribution expenses (5,450) 0 (5,450) (4,376) 0 (4,376)
Administrative expenses 5 (21,179) (293) (21,472) (19,303) (293) (19,596)
Operating profit 15,117 (293) 14,824 12,501 (293) 12,208
Finance income 6 129 0 129 78 0 78
Finance expense 6 (163) 0 (163) (360) 0 (360)
Profit before taxation 15,083 (293) 14,790 12,219 (293) 11,926
Taxation 8 (4,042) 76 (3,966) (3,651) 79 (3,572)
Profit for the financial year attributable to equity holders of the parent
11,041 (217) 10,824 8,568 (214) 8,354
Earnings per share (basic) 10 29.63p 22.86p
Earnings per share (diluted) 10 29.59p 22.57p
Dividends paid per share 9 12.55p 11.45p
The accompanying accounting policies and notes form an integral part of these financial statements.
All results relate to continuing operations.
2010£’000
2009£’000
Profit for the financial year 10,824 8,354
Other comprehensive income (expense)
Defined benefit plan actuarial gain / (loss) (see note 27) 74 (1,565)
Deferred taxation on pension obligations and employee benefits (see note 14)
28 396
Other comprehensive income (expense) for the year 102 (1,169)
Total comprehensive income for the year 10,926 7,185
TWENTY TWO
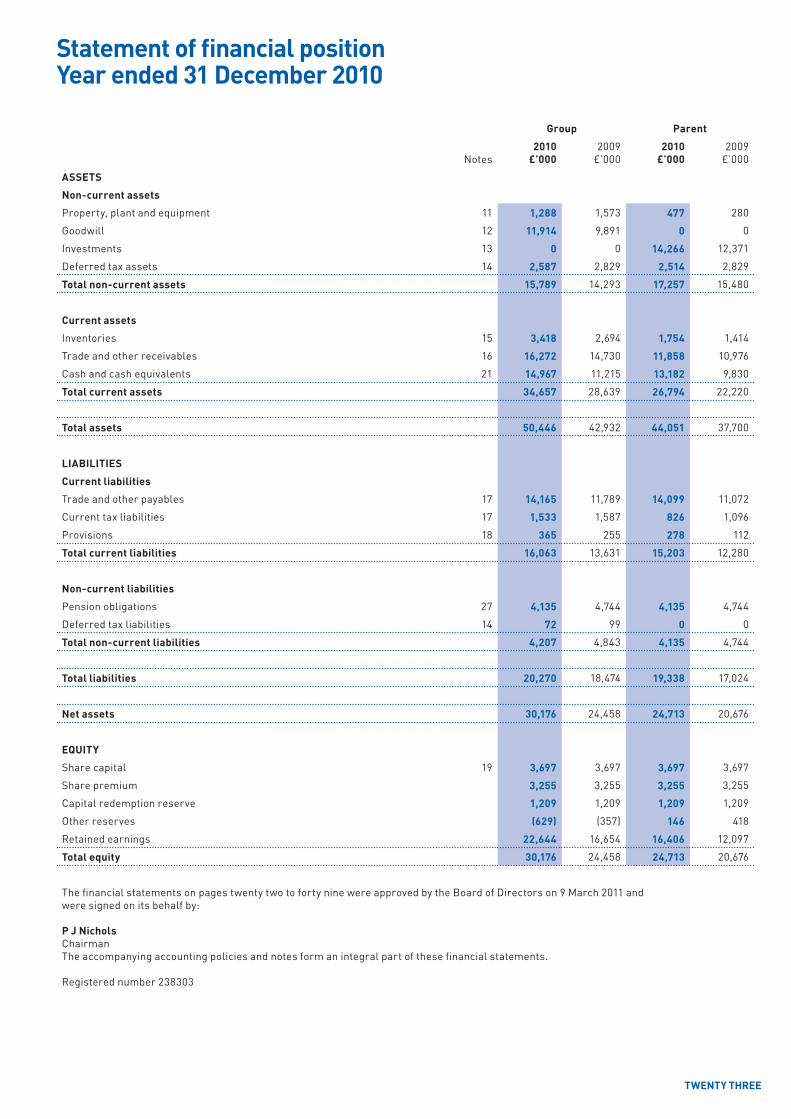
Statement of financial positionYear ended 31 December 2010
Group Parent
Notes2010
£’0002009
£’0002010
£’0002009
£’000
ASSETS
Non-current assets
Property, plant and equipment 11 1,288 1,573 477 280
Goodwill 12 11,914 9,891 0 0
Investments 13 0 0 14,266 12,371
Deferred tax assets 14 2,587 2,829 2,514 2,829
Total non-current assets 15,789 14,293 17,257 15,480
Current assets
Inventories 15 3,418 2,694 1,754 1,414
Trade and other receivables 16 16,272 14,730 11,858 10,976
Cash and cash equivalents 21 14,967 11,215 13,182 9,830
Total current assets 34,657 28,639 26,794 22,220
Total assets 50,446 42,932 44,051 37,700
LIABILITIES
Current liabilities
Trade and other payables 17 14,165 11,789 14,099 11,072
Current tax liabilities 17 1,533 1,587 826 1,096
Provisions 18 365 255 278 112
Total current liabilities 16,063 13,631 15,203 12,280
Non-current liabilities
Pension obligations 27 4,135 4,744 4,135 4,744
Deferred tax liabilities 14 72 99 0 0
Total non-current liabilities 4,207 4,843 4,135 4,744
Total liabilities 20,270 18,474 19,338 17,024
Net assets 30,176 24,458 24,713 20,676
EQUITY
Share capital 19 3,697 3,697 3,697 3,697
Share premium 3,255 3,255 3,255 3,255
Capital redemption reserve 1,209 1,209 1,209 1,209
Other reserves (629) (357) 146 418
Retained earnings 22,644 16,654 16,406 12,097
Total equity 30,176 24,458 24,713 20,676
The financial statements on pages twenty two to forty nine were approved by the Board of Directors on 9 March 2011 and were signed on its behalf by:
P J NicholsChairmanThe accompanying accounting policies and notes form an integral part of these financial statements.
Registered number 238303
TWENTY THREE
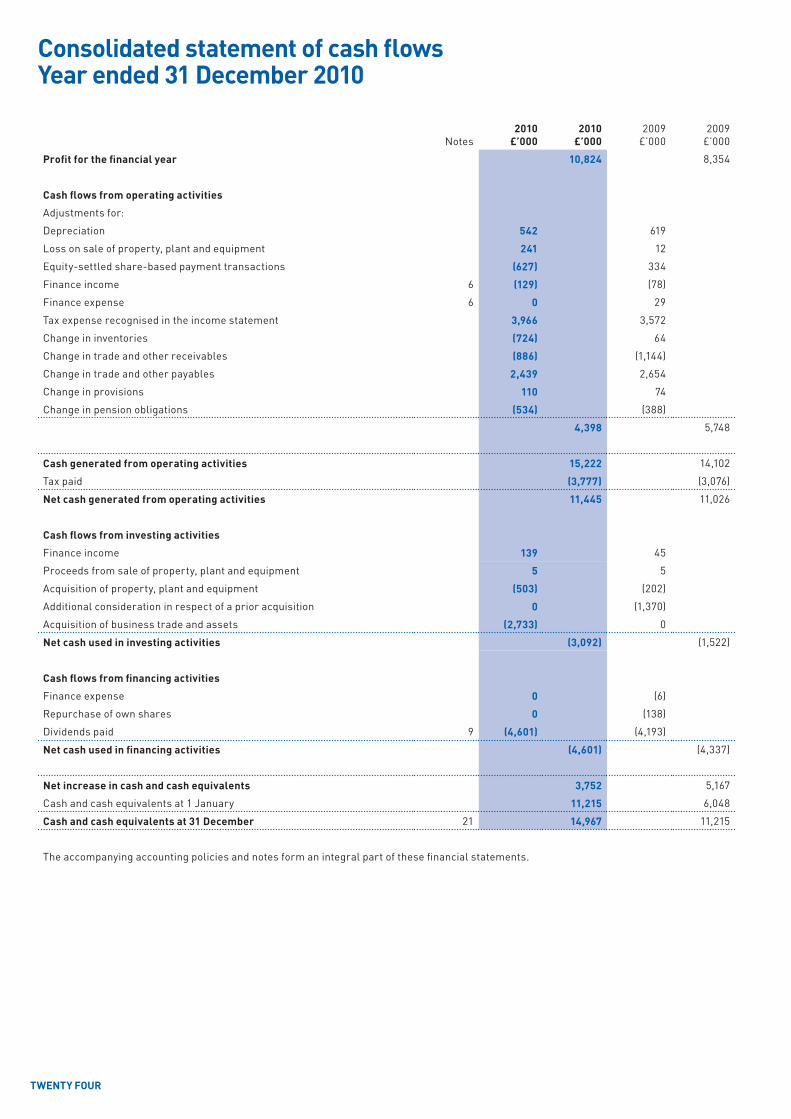
Consolidated statement of cash flowsYear ended 31 December 2010
Notes2010
£’0002010
£’0002009
£’0002009
£’000
Profit for the financial year 10,824 8,354
Cash flows from operating activities
Adjustments for:
Depreciation 542 619
Loss on sale of property, plant and equipment 241 12
Equity-settled share-based payment transactions (627) 334
Finance income 6 (129) (78)
Finance expense 6 0 29
Tax expense recognised in the income statement 3,966 3,572
Change in inventories (724) 64
Change in trade and other receivables (886) (1,144)
Change in trade and other payables 2,439 2,654
Change in provisions 110 74
Change in pension obligations (534) (388)
4,398 5,748
Cash generated from operating activities 15,222 14,102
Tax paid (3,777) (3,076)
Net cash generated from operating activities 11,445 11,026
Cash flows from investing activities
Finance income 139 45
Proceeds from sale of property, plant and equipment 5 5
Acquisition of property, plant and equipment (503) (202)
Additional consideration in respect of a prior acquisition 0 (1,370)
Acquisition of business trade and assets (2,733) 0
Net cash used in investing activities (3,092) (1,522)
Cash flows from financing activities
Finance expense 0 (6)
Repurchase of own shares 0 (138)
Dividends paid 9 (4,601) (4,193)
Net cash used in financing activities (4,601) (4,337)
Net increase in cash and cash equivalents 3,752 5,167
Cash and cash equivalents at 1 January 11,215 6,048
Cash and cash equivalents at 31 December 21 14,967 11,215
The accompanying accounting policies and notes form an integral part of these financial statements.
TWENTY FOUR
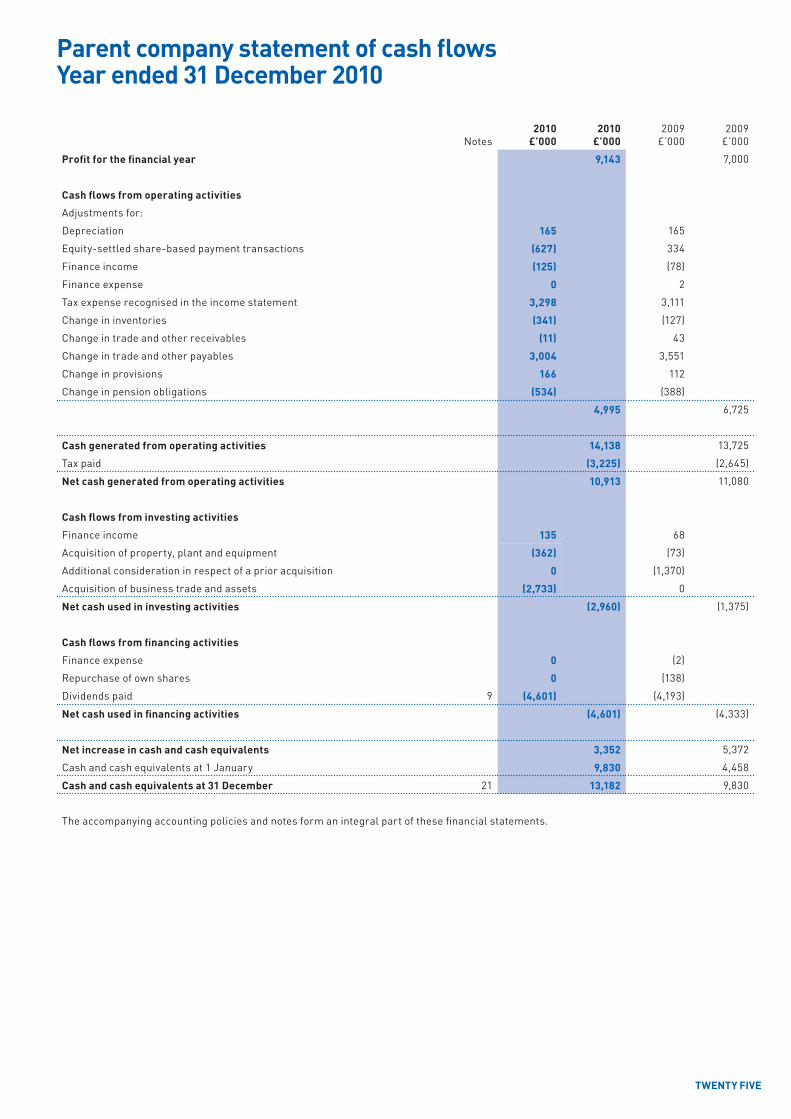
Notes2010
£’0002010
£’0002009
£’0002009
£’000
Profit for the financial year 9,143 7,000
Cash flows from operating activities
Adjustments for:
Depreciation 165 165
Equity-settled share-based payment transactions (627) 334
Finance income (125) (78)
Finance expense 0 2
Tax expense recognised in the income statement 3,298 3,111
Change in inventories (341) (127)
Change in trade and other receivables (11) 43
Change in trade and other payables 3,004 3,551
Change in provisions 166 112
Change in pension obligations (534) (388)
4,995 6,725
Cash generated from operating activities 14,138 13,725
Tax paid (3,225) (2,645)
Net cash generated from operating activities 10,913 11,080
Cash flows from investing activities
Finance income 135 68
Acquisition of property, plant and equipment (362) (73)
Additional consideration in respect of a prior acquisition 0 (1,370)
Acquisition of business trade and assets (2,733) 0
Net cash used in investing activities (2,960) (1,375)
Cash flows from financing activities
Finance expense 0 (2)
Repurchase of own shares 0 (138)
Dividends paid 9 (4,601) (4,193)
Net cash used in financing activities (4,601) (4,333)
Net increase in cash and cash equivalents 3,352 5,372
Cash and cash equivalents at 1 January 9,830 4,458
Cash and cash equivalents at 31 December 21 13,182 9,830
The accompanying accounting policies and notes form an integral part of these financial statements.
Parent company statement of cash flowsYear ended 31 December 2010
TWENTY FIVE
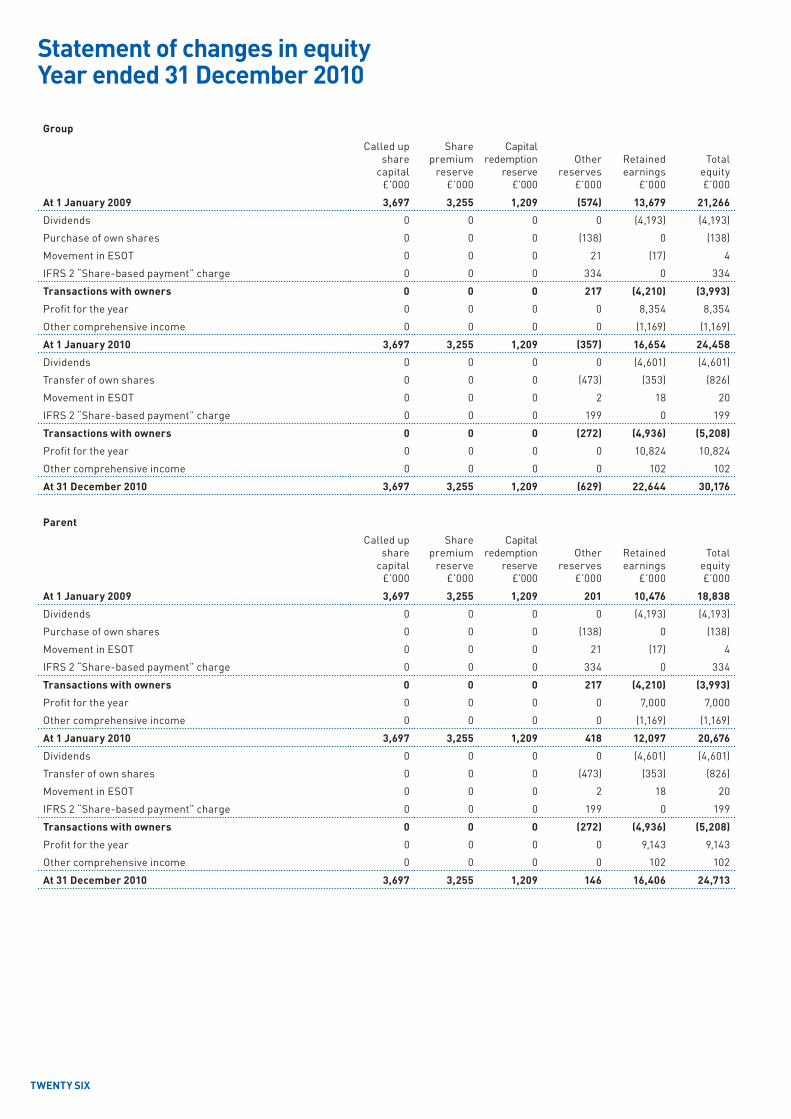
Group
Called upshare
capital£’000
Share premium
reserve£’000
Capital redemption
reserve£’000
Otherreserves
£’000
Retainedearnings
£’000
Total equity£’000
At 1 January 2009 3,697 3,255 1,209 (574) 13,679 21,266
Dividends 0 0 0 0 (4,193) (4,193)
Purchase of own shares 0 0 0 (138) 0 (138)
Movement in ESOT 0 0 0 21 (17) 4
IFRS 2 “Share-based payment” charge 0 0 0 334 0 334
Transactions with owners 0 0 0 217 (4,210) (3,993)
Profit for the year 0 0 0 0 8,354 8,354
Other comprehensive income 0 0 0 0 (1,169) (1,169)
At 1 January 2010 3,697 3,255 1,209 (357) 16,654 24,458
Dividends 0 0 0 0 (4,601) (4,601)
Transfer of own shares 0 0 0 (473) (353) (826)
Movement in ESOT 0 0 0 2 18 20
IFRS 2 “Share-based payment” charge 0 0 0 199 0 199
Transactions with owners 0 0 0 (272) (4,936) (5,208)
Profit for the year 0 0 0 0 10,824 10,824
Other comprehensive income 0 0 0 0 102 102
At 31 December 2010 3,697 3,255 1,209 (629) 22,644 30,176
Parent
Called upshare
capital£’000
Share premium
reserve£’000
Capital redemption
reserve£’000
Otherreserves
£’000
Retained earnings
£’000
Total equity£’000
At 1 January 2009 3,697 3,255 1,209 201 10,476 18,838
Dividends 0 0 0 0 (4,193) (4,193)
Purchase of own shares 0 0 0 (138) 0 (138)
Movement in ESOT 0 0 0 21 (17) 4
IFRS 2 “Share-based payment” charge 0 0 0 334 0 334
Transactions with owners 0 0 0 217 (4,210) (3,993)
Profit for the year 0 0 0 0 7,000 7,000
Other comprehensive income 0 0 0 0 (1,169) (1,169)
At 1 January 2010 3,697 3,255 1,209 418 12,097 20,676
Dividends 0 0 0 0 (4,601) (4,601)
Transfer of own shares 0 0 0 (473) (353) (826)
Movement in ESOT 0 0 0 2 18 20
IFRS 2 “Share-based payment” charge 0 0 0 199 0 199
Transactions with owners 0 0 0 (272) (4,936) (5,208)
Profit for the year 0 0 0 0 9,143 9,143
Other comprehensive income 0 0 0 0 102 102
At 31 December 2010 3,697 3,255 1,209 146 16,406 24,713
Statement of changes in equityYear ended 31 December 2010
TWENTY SIX

Notes to the financial statementsYear ended 31 December 2010
1. REPORTING ENTITyNichols plc (the “company”) is a company domiciled in the United Kingdom. The address of the company’s registered office is Laurel House, Woodlands Park, Ashton Road, Newton-le-Willows, WA12 0HH. The consolidated financial statements of the company as at and for the year ended 31 December 2010 comprise the company and its subsidiaries (together referred to as the “group”). The group is primarily engaged in the supply of soft drinks to the retail, wholesale, catering, licensed and leisure industries.
The company’s business activities, together with the factors likely to affect its future development, performance and position are set out in the Chief Executive’s Review on pages six to eleven. The financial position of the company, its cash flows, liquidity position and borrowing facilities are described in the Finance Review on pages twelve to thirteen. In addition, notes 22 and 24 to the financial statements include the company’s objectives, policies and processes for managing its capital; its financial risk management objectives; details of its financial instruments and hedging activities; and its exposures to credit risk and liquidity risk.
The company has considerable financial resources together with long-term contracts with a number of customers and suppliers across different geographic areas and industries. As a consequence, the directors believe that the company is well placed to manage its business risks successfully despite the current uncertain economic outlook.
The directors have a reasonable expectation that the company has adequate resources to continue in operational existence for the foreseeable future. Thus they continue to adopt the going concern basis of accounting in preparing the annual financial statements.
2. ACCOUNTING POLICIESBasis of preparation
The consolidated and parent company financial statements have been prepared in accordance with International Financial Reporting Standards (IFRSs) as adopted by the EU.
The financial statements were approved by the Board of Directors on 9 March 2011.
The financial statements have been prepared on the historical cost basis.
The accounting policies have been applied consistently by the group.
IFRS 3 ‘Business Combinations’ (Revised 2008) is effective for this period and will be applied going forward. There was no impact on the accounts in the current year.
An income statement is not provided for the parent company as permitted by Section 408 of the Companies Act 2006.The profit dealt with in the financial statements of Nichols plc was £9,143,000 (2009: £7,000,000).
Functional and presentation currency
These consolidated financial statements are presented in sterling, which is also the functional currency of the parent company.
Use of estimates and judgements
The preparation of financial statements requires management to make judgements, estimates and assumptions that affect the application of accounting policies and the reported amounts of assets, liabilities, income and expenses. Actual results may differ from these estimates.
The following are the key assumptions concerning the future and other key sources of estimation uncertainty at the balance sheet date, that have a significant risk of causing a material adjustment to the carrying amounts of assets and liabilities within the next financial year.
Impairment of goodwill
Determining whether goodwill is impaired requires an estimation of the value in use of the cash-generating units to which goodwill has been allocated. The “value in use” calculation requires management to estimate the future cash flows expected to arise from the cash-generating unit and a suitable discount rate in order to calculate present value (see note 12).
The carrying amount of goodwill at the balance sheet date was £11.9 million (2009: £9.9 million).
Share options
The assumptions on the expected life of share options, volatility of shares, risk free yield to maturity and expected dividend yield on shares are used in the IFRS fair value calculation of the group’s share options outstanding at the balance sheet date (see note 20).
Defined benefit obligations
For the group’s defined benefit plan, the main assumptions used by the actuary are the rate of future salary increases, the rate of increase in pensions in payment, the discount rate and the expected rate of inflation (see note 27).
Useful lives of property, plant and equipment
As described within the property, plant and equipment paragraph below, the group reviews the estimated useful lives of property, plant and equipment at least annually.
Estimates and underlying assumptions are reviewed by management on an ongoing basis. Revisions to accounting estimates are recognised in the period in which the estimate is revised and in any future periods affected.
TWENTY SEVEN
Notes to the financial statementsYear ended 31 December 2010
Basis of consolidation
The group financial statements consolidate those of the company and all of its subsidiary undertakings drawn up to 31 December 2010. Subsidiaries are entities controlled by the group. Control exists when the group has the power to govern the financial and operating policies of an entity so as to obtain benefits from its activities. In assessing control, potential voting rights that are exercisable are taken into account. The financial statements of subsidiaries are included in the consolidated financial statements from the date that control commences until the date that control ceases. Entities whose economic activities are jointly controlled by the group and other ventures independent of the group are accounted for using the proportionate consolidation method.
Intra-group balances and any unrealised gains and losses arising from intra-group transactions are eliminated in preparing the consolidated financial statements. All group companies have coterminous year ends.
Acquisitions of subsidiaries are dealt with by the purchase method. The purchase method involves the recognition at fair value of all identifiable assets and liabilities at the acquisition date, regardless of whether or not they were recorded in the financial statements of the subsidiary prior to acquisition. On initial recognition, the assets and liabilities of the subsidiary are included in the consolidated balance sheet at their fair values, which are also used as the basis for subsequent measurement in accordance with group accounting policies. Goodwill is stated after separating out identifiable assets. Goodwill represents the excess of acquisition costs over the fair value of the group’s share of the identifiable net assets of the acquired subsidiary at the date of acquisition.
The group has elected not to apply IFRS 3 “Business combinations” retrospectively to business combinations established prior to 1 January 2006.
Accordingly, the classification of the combination (acquisition, reverse acquisition or merger) remains unchanged from that used under UK GAAP. Assets and liabilities are recognised at the date of transition if they would be recognised under IFRS and are measured using their UK GAAP carrying amount immediately post-acquisition as deemed cost under IFRS, unless IFRS requires fair value measurement. Deferred tax and non-controlling interest are adjusted for the impact of any consequential adjustments after taking advantage of the transitional provisions.
Revenue recognition
Revenue from the sale of goods is measured at the fair value of the consideration received or receivable, net of returns and allowances, trade discounts, volume discounts and excluding VAT. Revenue is recognised when the significant risks and rewards of ownership have been transferred to the buyer, the amount of revenue can be measured reliably, recovery of the consideration is probable, the associated costs and possible return of goods can be estimated reliably and there is no continuing management involvement with the goods.
Transfer of risks and rewards vary depending on the individual term of the contract of sale. For sales in the UK, transfer occurs when the product is despatched to the customer. However, for some international shipments, transfer occurs either upon loading the goods onto the relevant carrier or when the goods have arrived in the overseas port. The point of transfer for international shipments is dictated by the terms of each sale.
Segmental reporting
An operating segment is a component of the group that engages in business activities from which it may earn revenues and incur expenses, including revenues and expenses that relate to transactions with any of the group’s other components and for which discrete financial information is available. An operating segment’s operating results are reviewed regularly by the management committee (as chief operating decision maker) to make decisions about resources to be allocated to the segment and assess its performance.
Segment results that are reported to the management committee include items directly attributable to a segment as well as those that can be allocated on a reasonable basis. Segment reporting for the group is made to the gross profit level for the operating segments but no segment reporting is made for further expenditure or for the assets and liabilities of the group. The assets and liabilities of the group are reported as group totals and no reporting of these balances is recorded at a segment level. As a result all of the group’s assets and liabilities are unallocated items and no reconciliation of segment assets to the group’s total assets is prepared.
Foreign currency transactions
Transactions in foreign currencies are translated into the respective functional currencies of group entities at exchange rates at the date of transactions. Monetary assets and liabilities denominated in foreign currencies at the reporting date are retranslated to the functional currency at the exchange rate at that date.
Any exchange differences arising on the settlement of monetary items or on translating monetary items at rates different from those at which they were initially recorded are recognised in the consolidated income statement in the period in which they arise.
Exceptional items
Exceptional items are material items which individually, or if of a similar type, in aggregate, need to be disclosed by virtue of their size or incidence in order to assist in understanding the group’s financial performance (see note 5).
TWENTY EIGHT
Notes to the financial statementsYear ended 31 December 2010
Taxation
Income tax expense comprises current and deferred tax. Income tax expense is recognised in the income statement except to the extent that it relates to items recognised directly to equity, in which case it is recognised in other comprehensive income.
Current tax
Current tax is the expected tax payable on the taxable income for the year, using rates which are enacted or substantively enacted at the reporting date and any adjustment to tax payable in respect of previous years.
Deferred tax
Deferred tax is recognised using the balance sheet method, with no discounting, providing for temporary differences between the carrying amounts of assets and liabilities for financial reporting purposes and the amounts used for taxation purposes. Deferred tax is not provided on the initial recognition of goodwill, or on the initial recognition of an asset or liability unless the related transaction is a business combination or affects tax or accounting profit. Deferred tax is measured at the tax rates that are expected to be applied to the temporary differences when they reverse, provided they are enacted or substantively enacted at the reporting date.
A deferred tax asset is recognised to the extent that it is probable that future taxable profits will be available against which temporary differences can be utilised. Deferred tax assets are reviewed at each reporting date and are reduced to the extent that it is no longer probable that the related tax benefit will be realised.
Goodwill
Goodwill arises on the acquisition of subsidiaries, associates and joint ventures.
Goodwill representing the excess of the cost of acquisition over the fair value of the group’s share of the identifiable assets acquired, is capitalised and reviewed annually for impairment. Goodwill is measured at cost less accumulated impairment losses.
As part of its transition to IFRS, the group elected to restate only those business combinations that occurred on or after 1 January 2006. In respect of acquisitions prior to 1 January 2006, the net book value of goodwill at the date of transition is the deemed cost of goodwill to the group under IFRS.
For acquisitions on or after 1 January 2006, goodwill represents the excess of the cost of the acquisition over the group’s interest in the net fair value of the identifiable assets, liabilities and contingent liabilities of the acquiree. When the excess is negative, it is recognised immediately in the group income statement.
Goodwill written off to reserves prior to the date of transition to IFRS remains in reserves. There is no re-instatement of goodwill previously amortised on the transition to IFRS. Goodwill previously written off to reserves is not written back to the income statement on subsequent disposal.
Other reserves
Other reserves incorporate purchase of own shares, movements in the group’s ESOT and the IFRS 2 “Share-based payment” charge for the year.
Impairment
The carrying values of the group’s non-current assets are reviewed at each reporting date to determine whether there is any indication of impairment. Goodwill is reviewed for impairment annually. All property, plant and equipment is tested for impairment whenever events or changes in circumstances indicate that the carrying amount may not be recoverable. If any such indication of impairment exists then the asset’s recoverable amount is estimated.
For the purposes of assessing impairment, assets are grouped at the lowest levels for which there are separately identifiable cash flows (cash-generating units). As a result, some assets are tested individually for impairment and some are tested at a cash-generating unit level.
An impairment loss is recognised if the carrying amount of an asset or its cash-generating unit exceeds its recoverable amount. The recoverable amount is the higher of fair value, reflecting market conditions less costs to sell and value in use. In assessing value in use, the estimated future cash flows are discounted to their present value using the cost of capital that reflects the current market assessments of the time value of money and the risks specific to the asset. Impairment losses recognised in respect of cash-generating units are allocated first to reduce the carrying amount of any goodwill allocated to the units and then to reduce the carrying amount of the other assets in the unit on a pro rata basis. Impairment losses are recognised in the income statement.
TWENTY NINE

Notes to the financial statementsYear ended 31 December 2010
Property, plant and equipment
Items of property, plant and equipment are measured at cost less accumulated depreciation and impairment losses.
Cost includes expenditures that are directly attributable to the acquisition of the asset.
The cost of replacing part of an item of plant, property and equipment is recognised in the carrying amount of the item if it is probable that the future economic benefits embodied within the part will flow to the group and its cost can be measured reliably. The costs of the day-to-day servicing of property, plant and equipment are recognised in the income statement as incurred.
Depreciation is calculated on a straight line basis to write down the cost less estimated residual value on property, plant and equipment over their estimated useful lives.
The estimated useful lives for the current and comparative periods are as follows:
Property, plant and equipment 3-10 years
Material residual value estimates and useful economic lives are updated at least annually.
Inventories
Inventories are measured at the lower of cost and net realisable value. The cost of inventories is based on the first-in first-out principle and includes expenditure incurred in acquiring the inventories and bringing them to their existing location and condition. Net realisable value is the estimated selling price in the ordinary course of business, less the costs of completion and selling expenses.
Financial assets
The group’s financial assets comprise primarily cash, bank deposits and trade receivables that arise from its business operations.
For the purpose of the consolidated statement of cash flows, cash and cash equivalents comprise deposits with banks and bank and cash balances.
Cash equivalents are short term, highly liquid investments that are readily convertible to known amounts of cash and which are subject to an insignificant risk of changes in value.
Trade receivables are recognised initially at fair value and subsequently measured at amortised cost using the effective interest method, less provisions for impairment. A provision for impairment of trade receivables is established when there is evidence that the group will not be able to collect all amounts due according to the original terms of the receivable.
Financial liabilities
The group’s financial liabilities comprise trade payables. Financial liabilities are obligations to pay cash or other financial assets and are recognised when the group becomes a party to the contractual provisions of the instruments. Trade payables are initially measured at fair value and are subsequently measured at amortised cost, using the effective interest rate method.
Leased assets
Operating leases and the payments are recognised in the income statement on a straight-line basis over the term of the lease. Lease incentives received are recognised as an integral part of the total lease expense, over the term of the lease.
Employee benefits
Defined contribution plan
Obligations for contributions to the group’s defined contribution pension plan are recognised as an expense in the income statement when they are due.
Defined benefit plan
The group’s net obligation in respect of its defined benefit pension plan is calculated by estimating the amount of future benefit that employees have earned in return for their service in the current and prior periods. That benefit is discounted to determine its present value, and any unrecognised past service costs and the fair value of any plan assets are deducted. The discount rate is the yield at the reporting date on AA credit-rated bonds that have maturity dates approximating the terms of the group’s obligations. The calculation is performed by a qualified actuary using the projected unit credit method. When the calculation results in a benefit to the group, the recognised asset is limited to the net total of any unrecognised past service costs and the present value of any future refunds from the plan or reductions in future contributions to the plan.
Actuarial gains and losses are recognised in the statement of comprehensive income. Interest expenses related to pension obligations are included in “finance costs” in the group income statement. All other post employment benefits are included in administrative expenses in the group income statement.
When the benefits of a plan are improved, the portion of the increased benefit relating to past service by employees is recognised in the income statement on a straight-line basis over the average period until the benefits become vested. To the extent that the benefits vest immediately, the expense is recognised immediately in the income statement.
THIRTY
Notes to the financial statementsYear ended 31 December 2010
Share-based payment transactions
The group’s equity-settled share-based payments comprise the grant of options under the group’s share option schemes.
In accordance with IFRS 2 “Share-based payment”, the group has recognised an expense to the income statement representing the fair value of outstanding equity-settled share-based payment awards to employees which have not vested as at 1 January 2010 for the year ending 31 December 2010.
Those fair values were charged to the income statement over the relevant vesting period adjusted to reflect actual and expected vesting levels. The group has calculated the fair market value of the nil cost options as being based on the market value of a company’s share at the date of grant adjusted to reflect the fact that an employee is not entitled to receive dividends over the relevant holding period.
The total amount to be expensed over the vesting period is determined with reference to the fair value of options granted, excluding the impact of any non market vesting conditions. Non market vesting conditions are included in the assumptions about the number of options expected to vest. At each balance sheet date the group revises its estimate of the number of options expected to vest. It recognises the impact of revisions to original estimates, if any, in the income statement, with a corresponding adjustment to equity. The proceeds received, net of any directly attributable transactions costs, are credited to share capital and share premium when the options are exercised.
Provisions and contingent liabilities
A provision is recognised if, as a result of a past event, the group has a present legal or constructive obligation that can be estimated reliably and it is probable that an outflow of economic benefits will be required to settle the obligation. Provisions are determined by discounting the expected future cash flows at a pre-tax rate that reflects current market assessments of the time value of money and the risks specific to the liability.
A provision for restructuring is recognised when the group has approved a detailed and formal restructuring plan and the restructuring either has commenced or has been announced publicly. Future operating costs are not provided for.
Finance income and expenses
Finance income comprises interest income on funds invested. Interest income is recognised as it accrues, using the effective interest method. Dividend income is recognised on the date that the group’s right to receive payment is established.
Finance expenses comprise interest expense on borrowings and are recognised in the income statement.
Earnings per share
The group presents basic and diluted earnings per share (EPS) data for its ordinary shares. Basic EPS is calculated by dividing the profit or loss attributable to ordinary shareholders of the company by the weighted average number of ordinary shares outstanding during the period. Diluted EPS is determined by adjusting the profit or loss attributable to ordinary shareholders and the weighted average number of ordinary shares outstanding for the effects of all dilutive potential ordinary shares, which comprise share options granted to employees.
Employee Share Ownership Trust
The assets and liabilities of the Employee Share Ownership Trust (“ESOT”) have been included in the consolidated financial statements.
The costs of purchasing own shares held by the ESOT are shown as a deduction against equity. Neither the purchase nor sale of own shares leads to a gain or loss being recognised in the consolidated income statement.
Investments in subsidiaries
Investments in subsidiaries are shown in the parent company balance sheet at cost less any provision for impairment.
Standards and interpretations in issue not yet adopted
New standards and interpretations currently in issue but not effective for accounting periods commencing on 1 January 2010 are:• IFRS 9 Financial Instruments (effective 1 January 2013)• IAS 24 (Revised 2009) Related Party Disclosures (effective 1 January 2011)• Amendment to IAS 32 Classification of Rights Issues (effective 1 February 2010)• IFRIC 19 Extinguishing Financial Liabilities with Equity Instruments (effective 1 July 2010)• Prepayments of a Minimum Funding Requirement - Amendments to IFRIC 14 (effective 1 January 2011)• Improvements to IFRS issued May 2010 (some changes effective 1 July 2010, others effective 1 January 2011)• Disclosures - Transfers of Financial Assets - Amendments to IFRS 7 (effective 1 July 2011)• Deferred Tax: Recovery of Underlying Assets - Amendments to IAS 12 Income Taxes (effective 1 January 2012)
THIRTY ONE
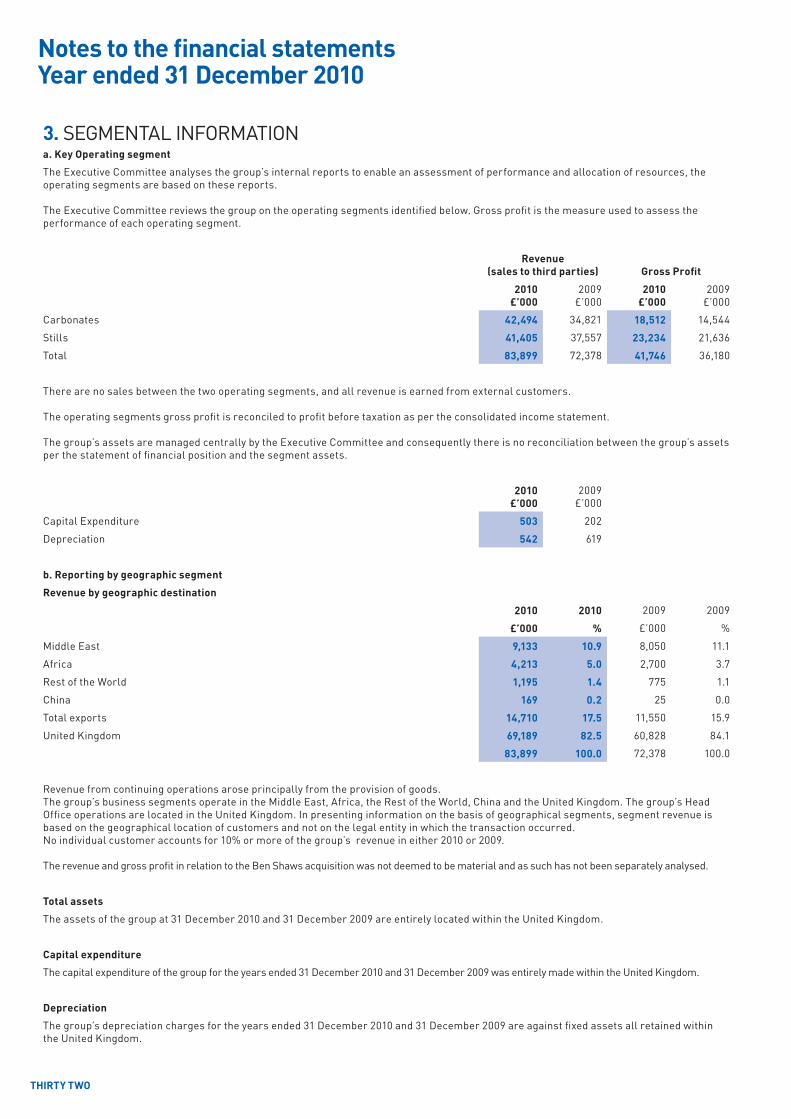
3. SEGMENTAL INFORMATIONa. Key Operating segment
The Executive Committee analyses the group’s internal reports to enable an assessment of performance and allocation of resources, the operating segments are based on these reports.
The Executive Committee reviews the group on the operating segments identified below. Gross profit is the measure used to assess the performance of each operating segment.
Revenue(sales to third parties) Gross Profit
2010£’000
2009£’000
2010£’000
2009£’000
Carbonates 42,494 34,821 18,512 14,544
Stills 41,405 37,557 23,234 21,636
Total 83,899 72,378 41,746 36,180
There are no sales between the two operating segments, and all revenue is earned from external customers.
The operating segments gross profit is reconciled to profit before taxation as per the consolidated income statement.
The group’s assets are managed centrally by the Executive Committee and consequently there is no reconciliation between the group’s assets per the statement of financial position and the segment assets.
2010£’000
2009£’000
Capital Expenditure 503 202
Depreciation 542 619
b. Reporting by geographic segment
Revenue by geographic destination
2010 2010 2009 2009
£’000 % £’000 %
Middle East 9,133 10.9 8,050 11.1
Africa 4,213 5.0 2,700 3.7
Rest of the World 1,195 1.4 775 1.1
China 169 0.2 25 0.0
Total exports 14,710 17.5 11,550 15.9
United Kingdom 69,189 82.5 60,828 84.1
83,899 100.0 72,378 100.0
Revenue from continuing operations arose principally from the provision of goods. The group’s business segments operate in the Middle East, Africa, the Rest of the World, China and the United Kingdom. The group’s Head Office operations are located in the United Kingdom. In presenting information on the basis of geographical segments, segment revenue is based on the geographical location of customers and not on the legal entity in which the transaction occurred.No individual customer accounts for 10% or more of the group’s revenue in either 2010 or 2009.
The revenue and gross profit in relation to the Ben Shaws acquisition was not deemed to be material and as such has not been separately analysed.
Total assets
The assets of the group at 31 December 2010 and 31 December 2009 are entirely located within the United Kingdom.
Capital expenditure
The capital expenditure of the group for the years ended 31 December 2010 and 31 December 2009 was entirely made within the United Kingdom.
Depreciation
The group’s depreciation charges for the years ended 31 December 2010 and 31 December 2009 are against fixed assets all retained within the United Kingdom.
Notes to the financial statementsYear ended 31 December 2010
THIRTY TWO

4. OPERATING PROFIT2010
£’0002009
£’000
Operating profit is stated after charging/(crediting):
Inventory amounts charged to cost of sales 42,153 36,198
Auditors’ remuneration - audit of the company’s annual accounts 37 35
Fees payable to the auditors for other services:
Audit of the company’s subsidiaries 18 15
Depreciation of property, plant and equipment 542 619
Operating lease rentals payments 420 563
Equity-settled share-based payments 199 334
(Gain)/loss on foreign exchange differences (63) 255
Loss on sale of property, plant and equipment 241 12
5. ExCEPTIONAL ITEMS2010
£’0002009
£’000
Dispense Operation restructuring costs 293 293
The cash impact in 2010 of the exceptional items is £15,000 (2009: £38,000).
6. FINANCE INCOME AND ExPENSE2010
£’0002009
£’000
Finance income comprises:
Bank interest receivable 129 78
Finance expense comprises:
Bank interest payable 0 29
Expected return on defined benefit pension scheme assets (979) (737)
Interest on defined benefit pension scheme obligations 1,142 1,068
Finance expense 163 360
Notes to the financial statementsYear ended 31 December 2010
THIRTY THREE
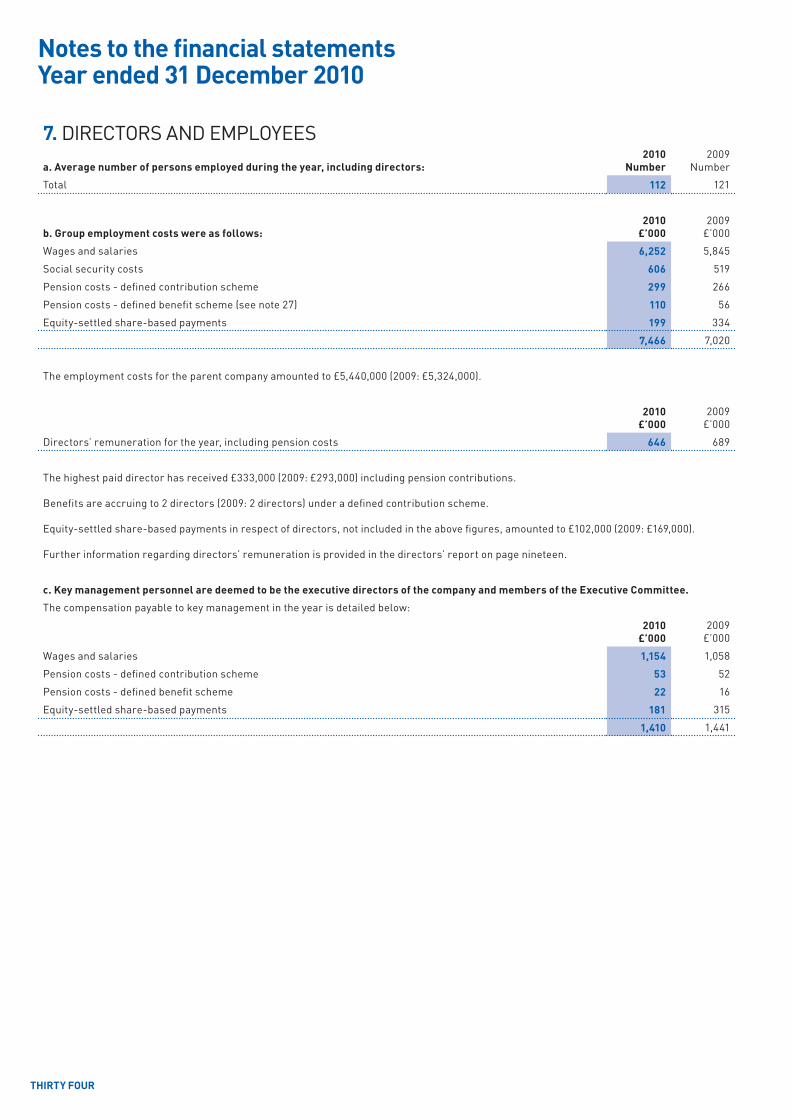
7. DIRECTORS AND EMPLOyEES
a. Average number of persons employed during the year, including directors:2010
Number2009
Number
Total 112 121
b. Group employment costs were as follows:2010
£’0002009
£’000
Wages and salaries 6,252 5,845
Social security costs 606 519
Pension costs - defined contribution scheme 299 266
Pension costs - defined benefit scheme (see note 27) 110 56
Equity-settled share-based payments 199 334
7,466 7,020
The employment costs for the parent company amounted to £5,440,000 (2009: £5,324,000).
2010£’000
2009£’000
Directors’ remuneration for the year, including pension costs 646 689
The highest paid director has received £333,000 (2009: £293,000) including pension contributions.
Benefits are accruing to 2 directors (2009: 2 directors) under a defined contribution scheme.
Equity-settled share-based payments in respect of directors, not included in the above figures, amounted to £102,000 (2009: £169,000).
Further information regarding directors’ remuneration is provided in the directors’ report on page nineteen.
c. Key management personnel are deemed to be the executive directors of the company and members of the Executive Committee.
The compensation payable to key management in the year is detailed below:
2010£’000
2009£’000
Wages and salaries 1,154 1,058
Pension costs - defined contribution scheme 53 52
Pension costs - defined benefit scheme 22 16
Equity-settled share-based payments 181 315
1,410 1,441
Notes to the financial statementsYear ended 31 December 2010
THIRTY FOUR

8. TAxATION
a. Analysis of expense recognised in the consolidated income statement2010
£’0002009
£’000
Current taxation:
UK corporation tax on income for the year 3,747 3,397
Adjustments in respect of prior years (24) (41)
Total current tax charge for the year 3,723 3,356
Deferred tax:
Origination and reversal of temporary differences 277 35
Adjustments in respect of prior years (34) 181
Total deferred tax charge for the year 243 216
Total tax expense in the consolidated income statement 3,966 3,572
The tax expense is wholly in respect of UK taxation.
b. Tax reconciliation2010
£’0002009
£’000
Profit before taxation 14,790 11,926
Profit before taxation multiplied by the standard rate of corporation tax in the United Kingdom of 28% (2009: 28%) 4,143 3,339
Effect of:
Non-deductible expenses 32 99
Permanent element of share scheme deduction (157) 0
Impact on deferred tax of use of hybrid tax rate 91 0
Other timing differences (164) 0
Adjustments to the tax charge in respect of prior years (58) 140
Depreciation for the year greater/(less) than capital allowances 79 (6)
Total tax expense in the consolidated income statement 3,966 3,572
The effective rate of tax for the year of 26.8% (2009: 30.0%) is lower than the standard rate of corporation tax in the United Kingdom (28%). The differences are explained above.
c. The effective rate of tax on profit before exceptional items is 26.3% (2009: 29.9%).
d. Tax on items charged to equityIn addition to the amount credited to the consolidated income statement, £28,000 (2009: £396,000) has been credited directly to equity, being the movement on deferred taxation relating to retirement benefit obligations and employee benefits.
9. EqUITy DIVIDENDS2010
£’0002009
£’000
Interim dividend 4.45p (2009: 4.05p) paid 8 September 2010 1,638 1,482
Second Interim dividend proposed for 2009 8.10p (2008: 7.40p) paid 30 March 2010 2,963 2,711
4,601 4,193
The interim dividend for the prior year of £1,482,000 was paid on 2 September 2009.
In accordance with IAS 10 “Events after the balance sheet date”, the 2010 final dividend of £3,324,000 (9.10p per share) has not been accrued as it had not been approved by the year end.
Notes to the financial statementsYear ended 31 December 2010
THIRTY FIVE
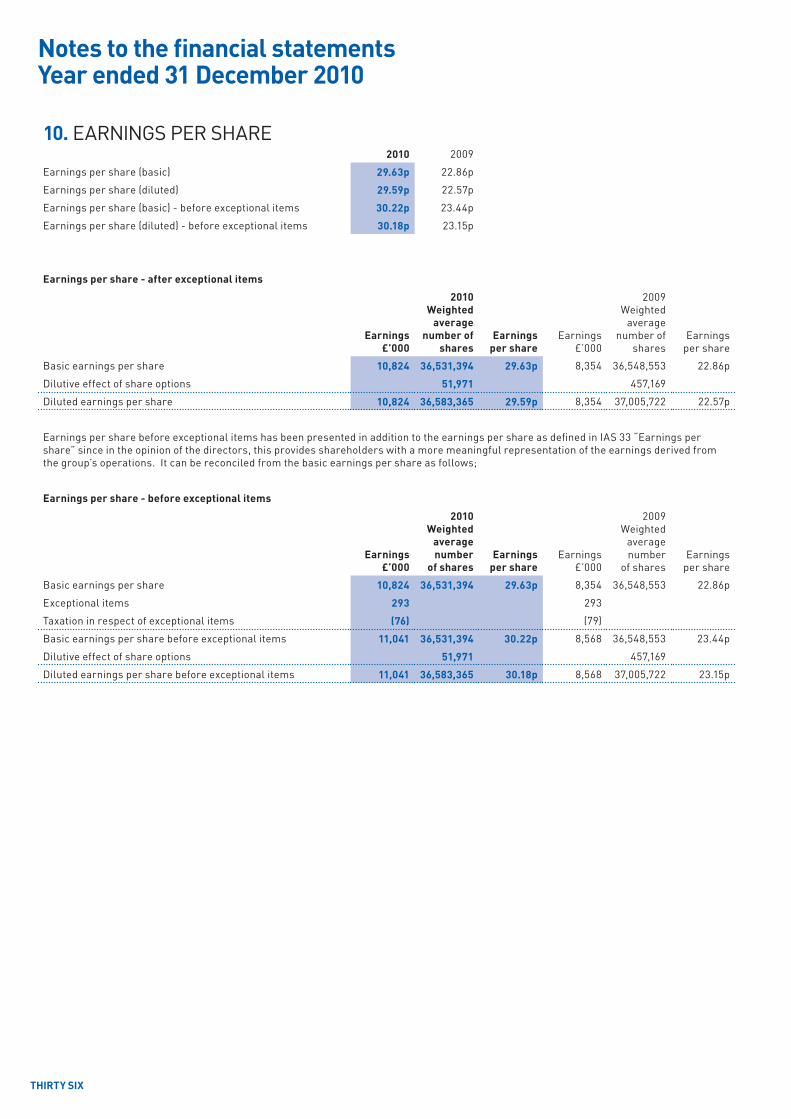
10. EARNINGS PER SHARE2010 2009
Earnings per share (basic) 29.63p 22.86p
Earnings per share (diluted) 29.59p 22.57p
Earnings per share (basic) - before exceptional items 30.22p 23.44p
Earnings per share (diluted) - before exceptional items 30.18p 23.15p
Earnings per share - after exceptional items
Earnings£’000
2010Weighted
averagenumber of
sharesEarnings
per shareEarnings
£’000
2009Weighted
averagenumber of
sharesEarnings
per share
Basic earnings per share 10,824 36,531,394 29.63p 8,354 36,548,553 22.86p
Dilutive effect of share options 51,971 457,169
Diluted earnings per share 10,824 36,583,365 29.59p 8,354 37,005,722 22.57p
Earnings per share before exceptional items has been presented in addition to the earnings per share as defined in IAS 33 “Earnings per share” since in the opinion of the directors, this provides shareholders with a more meaningful representation of the earnings derived from the group’s operations. It can be reconciled from the basic earnings per share as follows;
Earnings per share - before exceptional items
Earnings£’000
2010Weighted
averagenumber
of sharesEarnings
per shareEarnings
£’000
2009Weighted
averagenumber
of sharesEarnings
per share
Basic earnings per share 10,824 36,531,394 29.63p 8,354 36,548,553 22.86p
Exceptional items 293 293
Taxation in respect of exceptional items (76) (79)
Basic earnings per share before exceptional items 11,041 36,531,394 30.22p 8,568 36,548,553 23.44p
Dilutive effect of share options 51,971 457,169
Diluted earnings per share before exceptional items 11,041 36,583,365 30.18p 8,568 37,005,722 23.15p
Notes to the financial statementsYear ended 31 December 2010
THIRTY SIX
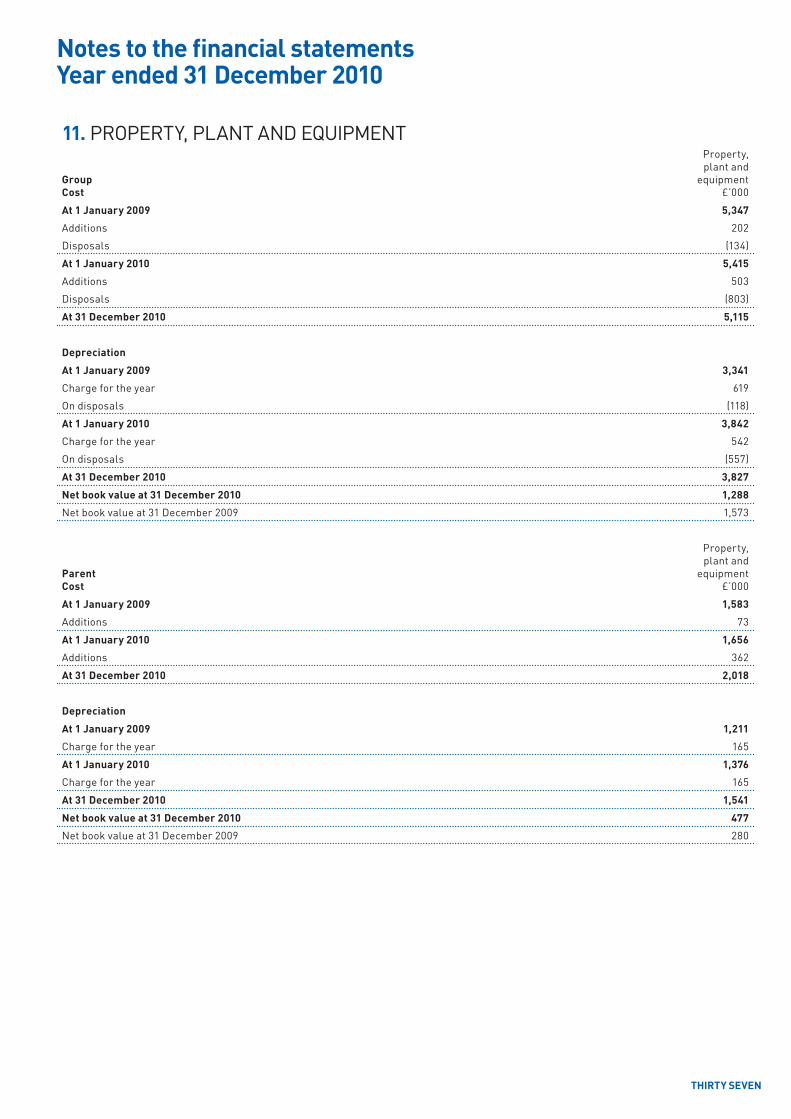
11. PROPERTy, PLANT AND EqUIPMENT
GroupCost
Property, plant and
equipment£’000
At 1 January 2009 5,347
Additions 202
Disposals (134)
At 1 January 2010 5,415
Additions 503
Disposals (803)
At 31 December 2010 5,115
Depreciation
At 1 January 2009 3,341
Charge for the year 619
On disposals (118)
At 1 January 2010 3,842
Charge for the year 542
On disposals (557)
At 31 December 2010 3,827
Net book value at 31 December 2010 1,288
Net book value at 31 December 2009 1,573
ParentCost
Property, plant and
equipment£’000
At 1 January 2009 1,583
Additions 73
At 1 January 2010 1,656
Additions 362
At 31 December 2010 2,018
Depreciation
At 1 January 2009 1,211
Charge for the year 165
At 1 January 2010 1,376
Charge for the year 165
At 31 December 2010 1,541
Net book value at 31 December 2010 477
Net book value at 31 December 2009 280
Notes to the financial statementsYear ended 31 December 2010
THIRTY SEVEN

12. GOODWILLGroupCost £’000
At 1 January 2009 9,521
Additions 370
At 1 January 2010 9,891
Additions 1,895
Adjustment to a prior acquisition 128
At 31 December 2010 11,914
Goodwill relates to the historic Dispense business which is considered by management to be one cash-generating unit.
Goodwill is tested at least annually for impairment and whenever there are indications that goodwill might be impaired. The recoverable amount of a cash-generating unit is based on its value in use. Value in use is the present value of the projected cash flows of the cash-generating unit. The key assumptions regarding the value in use calculations were forecast growth in revenues and the discount rate applied. Budgeted revenue growth is estimated based on actual performance over the past two years and expected market changes. The discount rate used is a pre-tax rate and reflects the risks specific to the relevant cash-generating unit. Dispense Operation cash flow projections are based on the most recent financial budgets approved by management. Management have applied an annual growth rate of 6% in projecting the cash flows for a period of five years. Cash flows beyond this period are extrapolated using a growth rate of 1.1%. The discount rate applied was 9%.
Goodwill additions for 2010 consist of the acquisition of the trade of the Ben Shaws ‘soft drinks on draught’ business. The total goodwill is entirely attributable to the Dispense Operation.
If the discount rate were to increase by 10% the discounted cashflows would still exceed the carrying amount, likewise if the free cashflows were to reduce by 10% the discounted cashflows would still exceed the carrying amount.
13. INVESTMENTS: SHARES IN GROUP UNDERTAKINGSParentCost and net book amount £’000
At 1 January 2009 12,001
Additions 370
At 1 January 2010 12,371
Additions 1,895
At 31 December 2010 14,266
All non current investments relate to group undertakings. Listed below are the trading subsidiaries and the ownership of their ordinary share capital by the group.
%
Beacon Holdings Limited 100
Beacon Drinks Limited * 100
Ben Shaws Dispense Drinks Limited 100
Cabana (Holdings) Limited 100
Cabana Soft Drinks Limited ** 100
Cariel Soft Drinks Limited 100
Dayla Liquid Packing Limited 50
The company directly owns Cabana (Holdings) Limited, Beacon Holdings Limited, Cariel Soft Drinks Limited, Ben Shaws Dispense Drinks Limited and 50% of Dayla Liquid Packing Limited, (which is proportionately consolidated as it is considered to be a joint venture).*Beacon Drinks Limited is directly owned by Beacon Holdings Limited.**Cabana Soft Drinks Limited is directly owned by Cabana (Holdings) Limited.All group undertakings are consolidated.The above companies and the parent company were all incorporated and operate in the United Kingdom.Particulars of non-trading companies are filed with the annual return.All companies in the group are engaged in the supply of soft drinks and other beverages.
Notes to the financial statementsYear ended 31 December 2010
THIRTY EIGHT

Notes to the financial statementsYear ended 31 December 2010
14. DEFERRED TAx ASSETS AND LIABILITIESMovement in temporary differences during the year
Group
Net balance at 1 January 2010
£’000
Recognisedin income
£’000
Recognisedin equity
£’000
Deferred taxacquired
£’000
Net balance at 31 December 2010
£’000
Property, plant and equipment 22 61 0 0 83
Goodwill 1,277 (107) 0 0 1,170
Employee benefits 1,428 (277) 28 0 1,179
Provisions 3 80 0 0 83
2,730 (243) 28 0 2,515
Group
Net balance at 1 January 2009
£’000
Recognisedin income
£’000
Recognisedin equity
£’000
Deferred taxacquired
£’000
Net balance at 31 December 2009
£’000
Property, plant and equipment (21) 43 0 0 22
Goodwill 1,341 (64) 0 0 1,277
Employee benefits 1,189 (157) 396 0 1,428
Provisions 41 (38) 0 0 3
2,550 (216) 396 0 2,730
Parent
Net balance at 1 January 2010
£’000
Recognisedin income
£’000
Recognisedin equity
£’000
Deferred taxacquired
£’000
Net balance at 31 December 2010
£’000
Property, plant and equipment 121 (39) 0 0 82
Goodwill 1,277 (107) 0 0 1,170
Employee benefits 1,428 (277) 28 0 1,179
Provisions 3 80 0 0 83
2,829 (343) 28 0 2,514
Parent
Net balance at 1 January 2009
£’000
Recognisedin income
£’000
Recognisedin equity
£’000
Deferred taxacquired
£’000
Net balance at 31 December 2009
£’000
Property, plant and equipment 134 (13) 0 0 121
Goodwill 1,341 (64) 0 0 1,277
Employee benefits 1,189 (157) 396 0 1,428
Provisions 33 (30) 0 0 3
2,697 (264) 396 0 2,829
Recognised deferred tax assets and liabilitiesDeferred tax assets and liabilities are attributable to the following:
Group
Assets Liabilities Net
Current year£’000
Prior year£’000
Current year£’000
Prior year£’000
Current year£’000
Prior year£’000
Property, plant and equipment 155 121 (72) (99) 83 22
Goodwill 1,170 1,277 0 0 1,170 1,277
Employee benefits 1,179 1,428 0 0 1,179 1,428
Provisions 83 3 0 0 83 3
2,587 2,829 (72) (99) 2,515 2,730
Parent
Assets Liabilities Net
Current year£’000
Prior year£’000
Current year£’000
Prior year£’000
Current year£’000
Prior year£’000
Property, plant and equipment 82 121 0 0 82 121
Goodwill 1,170 1,277 0 0 1,170 1,277
Employee benefits 1,179 1,428 0 0 1,179 1,428
Provisions 83 3 0 0 83 3
2,514 2,829 0 0 2,514 2,829
THIRTY NINE
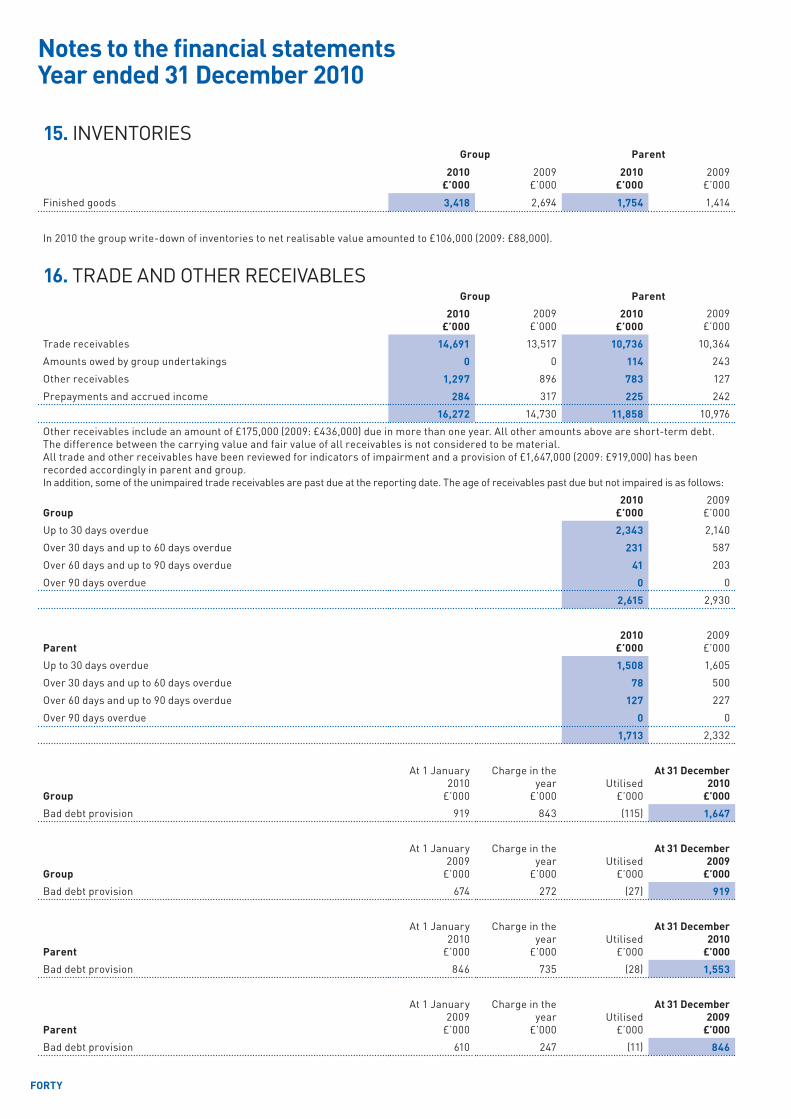
Notes to the financial statementsYear ended 31 December 2010
15. INVENTORIESGroup Parent
2010 £’000
2009 £’000
2010 £’000
2009 £’000
Finished goods 3,418 2,694 1,754 1,414
In 2010 the group write-down of inventories to net realisable value amounted to £106,000 (2009: £88,000).
16. TRADE AND OTHER RECEIVABLESGroup Parent
2010 £’000
2009 £’000
2010 £’000
2009 £’000
Trade receivables 14,691 13,517 10,736 10,364
Amounts owed by group undertakings 0 0 114 243
Other receivables 1,297 896 783 127
Prepayments and accrued income 284 317 225 242
16,272 14,730 11,858 10,976
Other receivables include an amount of £175,000 (2009: £436,000) due in more than one year. All other amounts above are short-term debt. The difference between the carrying value and fair value of all receivables is not considered to be material.All trade and other receivables have been reviewed for indicators of impairment and a provision of £1,647,000 (2009: £919,000) has been recorded accordingly in parent and group.In addition, some of the unimpaired trade receivables are past due at the reporting date. The age of receivables past due but not impaired is as follows:
Group2010
£’0002009
£’000
Up to 30 days overdue 2,343 2,140
Over 30 days and up to 60 days overdue 231 587
Over 60 days and up to 90 days overdue 41 203
Over 90 days overdue 0 0
2,615 2,930
Parent2010
£’0002009
£’000
Up to 30 days overdue 1,508 1,605
Over 30 days and up to 60 days overdue 78 500
Over 60 days and up to 90 days overdue 127 227
Over 90 days overdue 0 0
1,713 2,332
Group
At 1 January 2010
£’000
Charge in the year
£’000Utilised
£’000
At 31 December 2010
£’000
Bad debt provision 919 843 (115) 1,647
Group
At 1 January 2009
£’000
Charge in the year
£’000Utilised
£’000
At 31 December 2009
£’000
Bad debt provision 674 272 (27) 919
Parent
At 1 January 2010
£’000
Charge in the year
£’000Utilised
£’000
At 31 December 2010
£’000
Bad debt provision 846 735 (28) 1,553
Parent
At 1 January 2009
£’000
Charge in the year
£’000Utilised
£’000
At 31 December 2009
£’000
Bad debt provision 610 247 (11) 846
FORTY
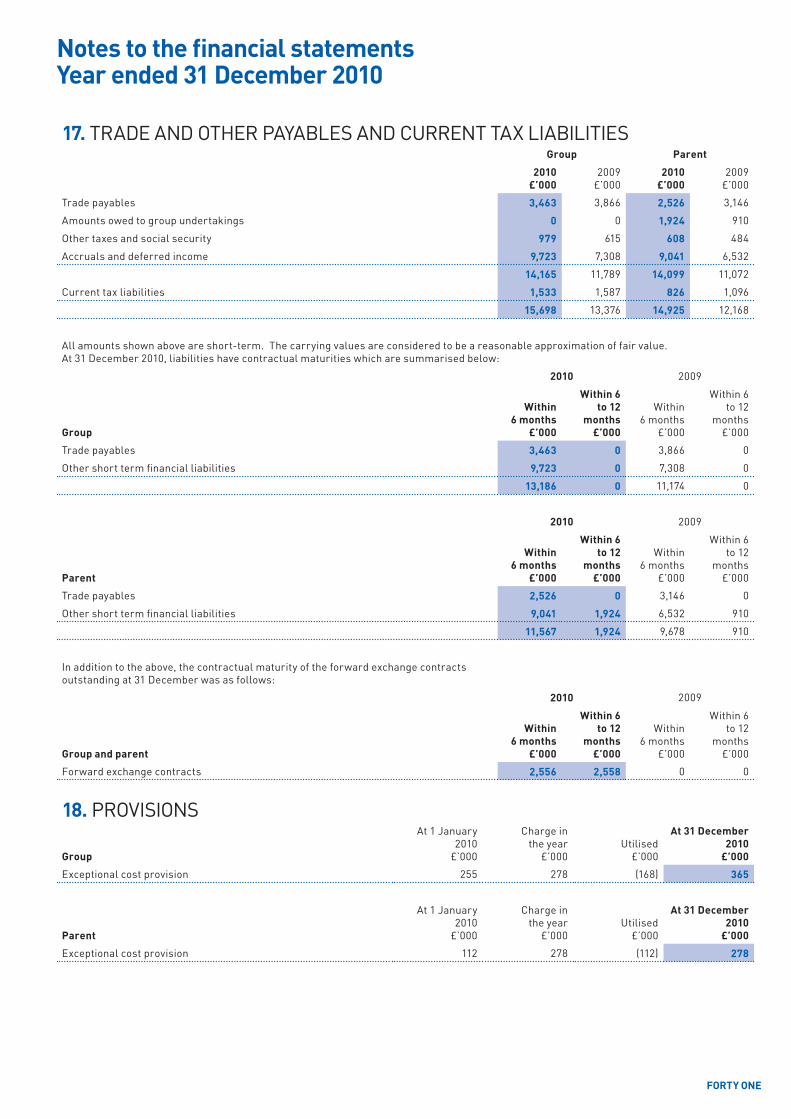
Notes to the financial statementsYear ended 31 December 2010
17. TRADE AND OTHER PAyABLES AND CURRENT TAx LIABILITIESGroup Parent
2010£’000
2009£’000
2010£’000
2009£’000
Trade payables 3,463 3,866 2,526 3,146
Amounts owed to group undertakings 0 0 1,924 910
Other taxes and social security 979 615 608 484
Accruals and deferred income 9,723 7,308 9,041 6,532
14,165 11,789 14,099 11,072
Current tax liabilities 1,533 1,587 826 1,096
15,698 13,376 14,925 12,168
All amounts shown above are short-term. The carrying values are considered to be a reasonable approximation of fair value.At 31 December 2010, liabilities have contractual maturities which are summarised below:
2010 2009
Group
Within6 months
£’000
Within 6 to 12
months£’000
Within6 months
£’000
Within 6 to 12
months£’000
Trade payables 3,463 0 3,866 0
Other short term financial liabilities 9,723 0 7,308 0
13,186 0 11,174 0
2010 2009
Parent
Within6 months
£’000
Within 6 to 12
months£’000
Within6 months
£’000
Within 6 to 12
months£’000
Trade payables 2,526 0 3,146 0
Other short term financial liabilities 9,041 1,924 6,532 910
11,567 1,924 9,678 910
In addition to the above, the contractual maturity of the forward exchange contracts outstanding at 31 December was as follows:
2010 2009
Group and parent
Within6 months
£’000
Within 6 to 12
months£’000
Within6 months
£’000
Within 6 to 12
months£’000
Forward exchange contracts 2,556 2,558 0 0
18. PROVISIONS
Group
At 1 January 2010
£’000
Charge in the year
£’000Utilised
£’000
At 31 December 2010
£’000
Exceptional cost provision 255 278 (168) 365
Parent
At 1 January 2010
£’000
Charge in the year
£’000Utilised
£’000
At 31 December 2010
£’000
Exceptional cost provision 112 278 (112) 278
FORTY ONE

19. SHARE CAPITAL2010
£’0002009
£’000
Authorised 52,000,000 (2009: 52,000,000) 10p ordinary shares 5,200 5,200
Allotted, issued and fully paid 36,968,772 (2009: 36,968,772) 10p ordinary shares 3,697 3,697
The share capital of Nichols plc consists only of ordinary 10p shares. All shares are equally eligible to receive dividends and the repayment of capital and represent one vote at shareholders’ meetings.
There were no movements in the group’s authorised and allotted, issued and fully paid share capital for the financial years ending 31 December 2010 and 31 December 2009.
20. SHARE OPTIONSThe group operates a Long Term Incentive Plan (LTIP) for senior managers which is based upon the achievement of performance targets over a three year period. The group also operates a Save As you Earn (SAyE) scheme for all other employees. The estimated fair values of options which fall under the IFRS 2 “Share-based payment” accounting charge and inputs used in the Binomial model to calculate those fair values, are as follows:
Save As You Earn Scheme
Date of Grant Numbergranted
Share priceon grant
date
Exerciseprice
Fair valueson grant
date
Vestingperiod
Expecteddividend
yield
Lapserate
Riskfree rate
Volatility
14 October 2004 24,052 £1.60 £1.26 £0.33 5.00 years 3.50% 5.00% 4.50% 24.08%
26 September 2005 28,991 £2.05 £1.63 £0.40 5.00 years 3.50% 5.00% 3.91% 22.65%
3 October 2006 60,376 £2.51 £1.92 £0.46 5.00 years 3.50% 5.00% 4.38% 21.13%
1 September 2008 30,796 £2.45 £1.77 £0.66 3.00 years 4.35% 5.00% 4.36% 20.31%
1 September 2008 11,398 £2.45 £1.77 £0.65 5.00 years 4.35% 5.00% 4.37% 20.31%
1 June 2010 46,776 £3.54 £2.83 £0.70 3.00 years 4.35% 5.00% 2.25% 25.70%
1 June 2010 9,008 £3.54 £2.83 £0.69 5.00 years 4.35% 5.00% 4.75% 25.70%
Long Term Incentive Plan
Date of Grant Numbergranted
Share priceon grant
date
Exerciseprice
Fair valueson grant
date
Vestingperiod
Expecteddividend
yield
Lapserate
Riskfree rate
Volatility
11 June 2008 125,000 £2.43 £0.00 £2.37 0.56 years 4.28% 0.00% 5.22% 19.93%
11 June 2008 150,000 £2.43 £0.00 £2.28 1.56 years 4.28% 0.00% 5.22% 19.93%
11 June 2008 150,000 £2.43 £0.00 £2.18 2.55 years 4.28% 0.00% 5.22% 19.93%
1 January 2010 25,000 £2.93 £0.00 £3.45 0.00 years 4.28% 0.00% 5.22% 19.93%
Expected volatilityThe volatility of the company’s share price on each date of grant was calculated as the average of annualised standard deviations of daily continuously compounded returns on the company’s stock, calculated over five years back from the date of the grant, where applicable.
Risk-free rateThe risk-free rate is the yield to maturity on the date of grant of a UK Gilt Strip, with term to maturity equal to the life of the option.
Expected lifeThe expected life of a SAyE option is equal to the vesting period plus a six month exercise period and for an LTIP share option is equal to the vesting period.
Notes to the financial statementsYear ended 31 December 2010
FORTY TWO

20. SHARE OPTIONS (continued)
Date of grant:
At 1 January
2010 Granted Exercised Lapsed
At 31 December
2010
Exercise price
per share
14 October 2004 2,623 0 (2,623) 0 0 126p*
26 September 2005 9,666 0 (1,013) (6,221) 2,432 163p*
3 October 2006 50,143 0 (2,040) (1,371) 46,732 192p
11 June 2008 125,000 0 (120,000) (5,000) 0 0p
11 June 2008 150,000 0 (150,000) 0 0 0p
11 June 2008 150,000 0 (150,000) 0 0 0p
1 September 2008 42,194 0 (1,651) (11,650) 28,893 177p
1 January 2010 0 25,000 (25,000) 0 0 0p
1 June 2010 0 55,784 0 (3,206) 52,578 283p
529,626 80,784 (452,327) (27,448) 130,635
Options are exercisable at the end of a three or five year savings contract commencing on the date of grant and for a period of six months thereafter. The share price during 2010 varied between 290.5p and 474.8p and the weighted average price for the year was 408p. At 31 December 2010, options over 130,635 shares were outstanding under Employee Share Option Plans (2009: 529,626).
*Indicates share options exercisable at 31 December 2010
Directors’ rights to subscribe for shares in the company and its subsidiaries are indicated below:
At 1 January
2010 Granted Exercised
At 31 December
2010
Exercise price
per share
BM Hynes 225,000 0 (225,000) 0 0p
TJ Croston 0 25,000 (25,000) 0 0p
The total number and value of the options outstanding under both of the company’s share option schemes are as follows:
2010 2009
Number
Weightedaverage
exercise pricein pence Number
Weightedaverage
exercise pricein pence
Outstanding on 1 January 529,626 137.82 574,002 141.71
Granted 80,784 195.42 0 0.00
Exercised (452,327) 2.58 (44,376) 188.10
Lapsed (27,448) 189.18 0 0.00
Outstanding on 31 December 130,635 224.77 529,626 137.82
21. CASH AND CASH EqUIVALENTS
GroupAt 1 January 2010
£’000Cash flow
£’000At 31 December 2010
£’000
Cash at bank and in hand 11,215 3,752 14,967
ParentAt 1 January 2010
£’000Cash flow
£’000At 31 December 2010
£’000
Cash at bank and in hand 9,830 3,352 13,182
Notes to the financial statementsYear ended 31 December 2010
FORTY THREE

22. FINANCIAL INSTRUMENTSExposure to interest rate, credit and currency risks arises in the normal course of the group’s business.
Treasury managementThe group’s treasury activities are targeted to provide suitable, flexible funding arrangements to satisfy the group’s requirements. Interest rate and liquidity risk are managed at a group level. Foreign currency risk is managed, in consultation with group management, in subsidiaries which are responsible for the majority of purchases. The group’s policy for investing any surplus cash balances is to place such amounts on deposit.
Liquidity riskThe group seeks to manage financial risk to ensure sufficient liquidity is available to meet foreseeable needs. The acquisition of companies and the continuing investment in non-current assets will be achieved by a mix of operating cash and short term borrowing facilities. Short term flexibility is achieved by bank overdraft.
Interest rate riskThe group finances its activities through a mixture of retained profits and borrowings. All borrowings are in sterling at floating rates of interest, based upon the prevailing base rate or LIBOR. The group has reviewed the impact of sensitivity on interest rate fluctuations and has concluded that there would be no impact on the income statement following the effects of such variances.
Credit riskThe group has no significant concentrations of credit risk. The group has implemented stringent policies that ensure that credit evaluations are performed on all potential customers before sales commence. Credit risk is managed by limiting the aggregate exposure to any one individual counterparty, taking into account its credit rating. Such counterparty exposures are regularly reviewed and adjusted as necessary. Accordingly, the possibility of material loss arising in the event of non-performance by counterparties is considered to be unlikely. Cash at bank is held only with major UK banks with high quality external credit ratings or government support.
Foreign currency riskThe group is exposed to foreign currency risk on sales and purchases that are denominated in a currency other than the functional currency of the group. The currencies giving rise to this risk are primarily US Dollars (USD) and Euros (€). The group uses forward exchange contracts to hedge its foreign currency risk. Forward purchase contracts in US Dollars are made to cover at least the full year of projected purchases. The forward foreign currency purchase contracts, which are a mixture of firm contracts and conditional options, mature in line with expected purchases throughout 2011. The directors have reviewed the fair value of the forward contracts outstanding at the balance sheet date, and have concluded that this amount is not materially different to that shown in note 17.
Foreign currency assets2010
£’0002009
£’000
US Dollar 1,970 1,502
Euro 418 590
Chinese yuan 32 13
2,420 2,105
Foreign currency sensitivity
Some of the group’s transactions are carried out in US Dollars, Euros and Chinese yuan.As a result, management have undertaken sensitivity analysis to consider the financial impact if Sterling had both strengthened and weakened against the US Dollar, the Euro and the Chinese yuan .
If Sterling had strengthened against the US Dollar, Euro and Chinese yuan by 5% (2009: 5%), then this would have had the following impact:
2010£’000
2009£’000
USD Euro CNY Total USD Euro CNy Total
Net result for the year (93) (20) (1) (114) (72) (28) (1) (101)
If Sterling had weakened against the US Dollar, Euro and Chinese yuan by 5% (2009: 5%), then this would have had the following impact:
2010£’000
2009£’000
USD Euro CNY Total USD Euro CNy Total
Net result for the year 104 22 2 128 79 31 0 110
Exposures to foreign exchange rates vary during the year depending on the volume of overseas transactions. Nonetheless, the analysis above is considered to be representative of the group’s exposure to currency risk.
Notes to the financial statementsYear ended 31 December 2010
FORTY FOUR
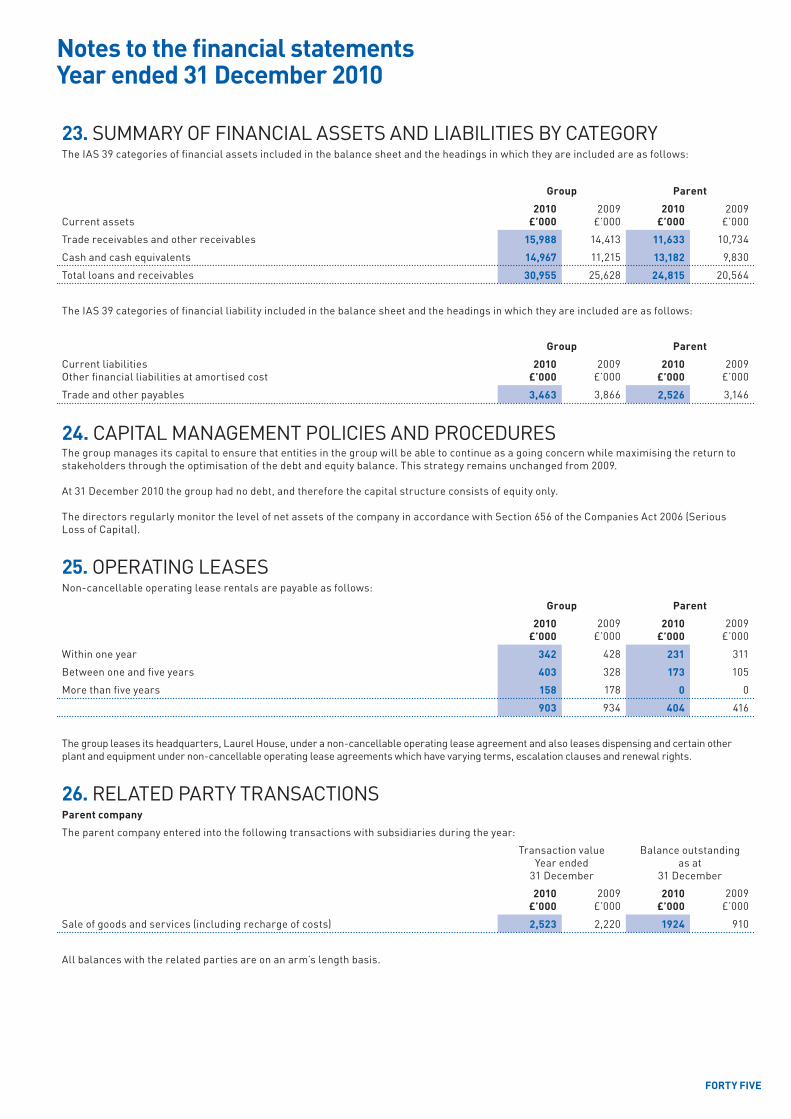
23. SUMMARy OF FINANCIAL ASSETS AND LIABILITIES By CATEGORyThe IAS 39 categories of financial assets included in the balance sheet and the headings in which they are included are as follows:
Group Parent
Current assets2010
£’0002009
£’0002010
£’0002009
£’000
Trade receivables and other receivables 15,988 14,413 11,633 10,734
Cash and cash equivalents 14,967 11,215 13,182 9,830
Total loans and receivables 30,955 25,628 24,815 20,564
The IAS 39 categories of financial liability included in the balance sheet and the headings in which they are included are as follows:
Group Parent
Current liabilitiesOther financial liabilities at amortised cost
2010£’000
2009£’000
2010£’000
2009£’000
Trade and other payables 3,463 3,866 2,526 3,146
24. CAPITAL MANAGEMENT POLICIES AND PROCEDURESThe group manages its capital to ensure that entities in the group will be able to continue as a going concern while maximising the return to stakeholders through the optimisation of the debt and equity balance. This strategy remains unchanged from 2009.
At 31 December 2010 the group had no debt, and therefore the capital structure consists of equity only.
The directors regularly monitor the level of net assets of the company in accordance with Section 656 of the Companies Act 2006 (Serious Loss of Capital).
25. OPERATING LEASESNon-cancellable operating lease rentals are payable as follows:
Group Parent
2010£’000
2009 £’000
2010£’000
2009 £’000
Within one year 342 428 231 311
Between one and five years 403 328 173 105
More than five years 158 178 0 0
903 934 404 416
The group leases its headquarters, Laurel House, under a non-cancellable operating lease agreement and also leases dispensing and certain other plant and equipment under non-cancellable operating lease agreements which have varying terms, escalation clauses and renewal rights.
26. RELATED PARTy TRANSACTIONSParent company
The parent company entered into the following transactions with subsidiaries during the year:
Transaction valueyear ended
31 December
Balance outstandingas at
31 December
2010£’000
2009£’000
2010£’000
2009£’000
Sale of goods and services (including recharge of costs) 2,523 2,220 1924 910
All balances with the related parties are on an arm’s length basis.
Notes to the financial statementsYear ended 31 December 2010
FORTY FIVE
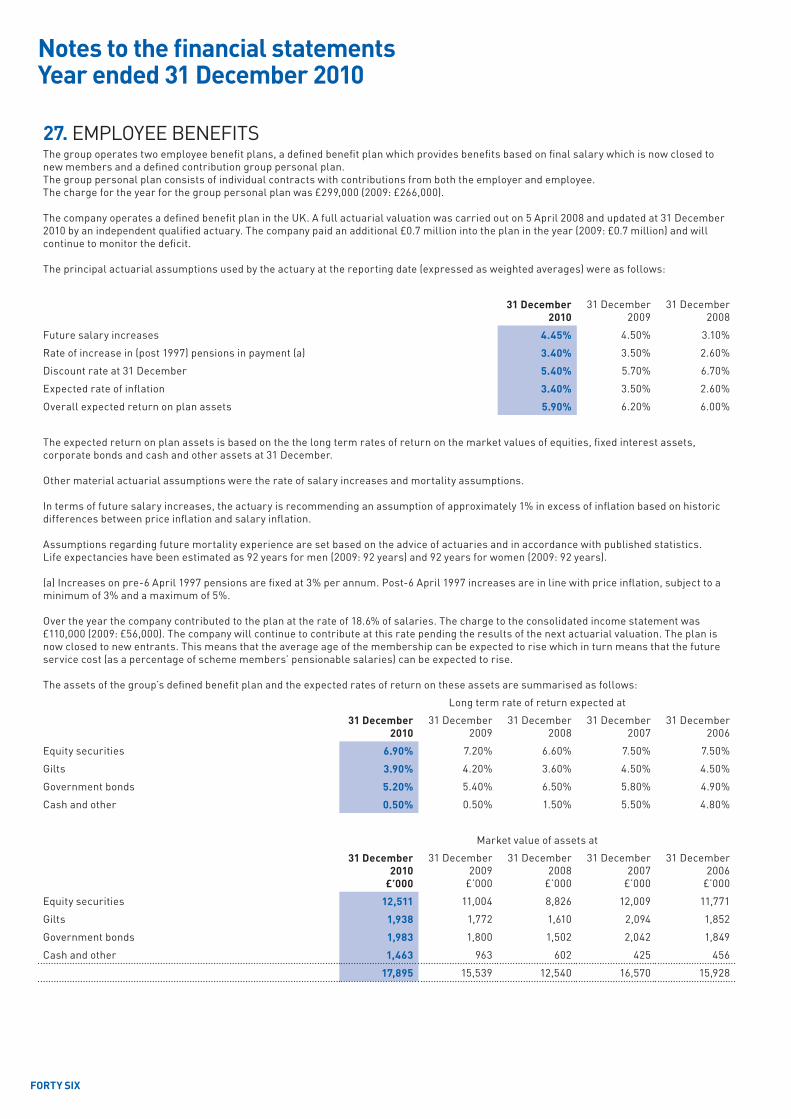
Notes to the financial statementsYear ended 31 December 2010
27. EMPLOyEE BENEFITSThe group operates two employee benefit plans, a defined benefit plan which provides benefits based on final salary which is now closed to new members and a defined contribution group personal plan.The group personal plan consists of individual contracts with contributions from both the employer and employee.The charge for the year for the group personal plan was £299,000 (2009: £266,000).
The company operates a defined benefit plan in the UK. A full actuarial valuation was carried out on 5 April 2008 and updated at 31 December 2010 by an independent qualified actuary. The company paid an additional £0.7 million into the plan in the year (2009: £0.7 million) and will continue to monitor the deficit.
The principal actuarial assumptions used by the actuary at the reporting date (expressed as weighted averages) were as follows:
31 December2010
31 December2009
31 December2008
Future salary increases 4.45% 4.50% 3.10%
Rate of increase in (post 1997) pensions in payment (a) 3.40% 3.50% 2.60%
Discount rate at 31 December 5.40% 5.70% 6.70%
Expected rate of inflation 3.40% 3.50% 2.60%
Overall expected return on plan assets 5.90% 6.20% 6.00%
The expected return on plan assets is based on the the long term rates of return on the market values of equities, fixed interest assets, corporate bonds and cash and other assets at 31 December.
Other material actuarial assumptions were the rate of salary increases and mortality assumptions.
In terms of future salary increases, the actuary is recommending an assumption of approximately 1% in excess of inflation based on historic differences between price inflation and salary inflation.
Assumptions regarding future mortality experience are set based on the advice of actuaries and in accordance with published statistics.Life expectancies have been estimated as 92 years for men (2009: 92 years) and 92 years for women (2009: 92 years).
(a) Increases on pre-6 April 1997 pensions are fixed at 3% per annum. Post-6 April 1997 increases are in line with price inflation, subject to a minimum of 3% and a maximum of 5%.
Over the year the company contributed to the plan at the rate of 18.6% of salaries. The charge to the consolidated income statement was £110,000 (2009: £56,000). The company will continue to contribute at this rate pending the results of the next actuarial valuation. The plan is now closed to new entrants. This means that the average age of the membership can be expected to rise which in turn means that the future service cost (as a percentage of scheme members’ pensionable salaries) can be expected to rise.
The assets of the group’s defined benefit plan and the expected rates of return on these assets are summarised as follows:
Long term rate of return expected at
31 December2010
31 December2009
31 December2008
31 December2007
31 December2006
Equity securities 6.90% 7.20% 6.60% 7.50% 7.50%
Gilts 3.90% 4.20% 3.60% 4.50% 4.50%
Government bonds 5.20% 5.40% 6.50% 5.80% 4.90%
Cash and other 0.50% 0.50% 1.50% 5.50% 4.80%
Market value of assets at
31 December 2010
£’000
31 December 2009
£’000
31 December 2008
£’000
31 December2007
£’000
31 December2006
£’000
Equity securities 12,511 11,004 8,826 12,009 11,771
Gilts 1,938 1,772 1,610 2,094 1,852
Government bonds 1,983 1,800 1,502 2,042 1,849
Cash and other 1,463 963 602 425 456
17,895 15,539 12,540 16,570 15,928
FORTY SIX

Notes to the financial statementsYear ended 31 December 2010
27. EMPLOyEE BENEFITS (continued)The following amounts were measured in accordance with IAS 19 “Employee benefits”.
The amounts recognised in the statement of financial position are determined as follows:
31 December 2010
£’000
31 December 2009
£’000
31 December 2008
£’000
31 December2007
£’000
31 December2006
£’000
Fair value of plan assets 17,895 15,539 12,540 16,570 15,928
Present value of defined benefit obligations (22,030) (20,283) (16,107) (20,205) (22,432)
Recognised liability for defined benefit obligations (4,135) (4,744) (3,567) (3,635) (6,504)
The expense is recognised in the following line items in the consolidated income statement :
Operating profit2010
£’0002009
£’0002008
£’0002007
£’0002006
£’000
Current service costs (110) (56) (84) (161) (158)
Total operating charge (110) (56) (84) (161) (158)
Finance expense
Expected return on plan assets 979 737 1,102 1,085 981
Interest on obligation (1,142) (1,068) (1,145) (1,088) (1,007)
Total finance expense (163) (331) (43) (3) (26)
Total charge to the consolidated income statement (273) (387) (127) (164) (184)
Group consolidated statement of comprehensive income
Actual return less expected return on plan assets 1,033 1,901 (4,782) (634) 256
Experience gains and losses arising on plan liabilities (72) 120 1,113 (22) 836
Changes in the assumptions underlying the present value of the plan liabilities
(887) (3,586) 2,383 3,178 (1,001)
Actuarial movement in defined benefit plan recognised in statement of comprehensive income
74 (1,565) (1,286) 2,522 91
The movement during the year in the liability for defined benefit obligations was as follows:
2010£’000
2009£’000
2008£’000
2007£’000
2006£’000
Liability for defined benefit obligations at 1 January (4,744) (3,567) (3,635) (6,504) (7,008)
Current service costs (110) (56) (84) (161) (158)
Contributions paid into the plan 808 775 672 511 597
Gain on settlement of obligations 0 0 809 0 0
Other finance costs (163) (331) (43) (3) (26)
Actuarial gain/(loss) recognised in statement of comprehensive income
74 (1,565) (1,286) 2,522 91
Liability for defined benefit obligations at 31 December (4,135) (4,744) (3,567) (3,635) (6,504)
The movement during the year in the present value of the plan assets was as follows:
2010£’000
2009£’000
2008£’000
2007£’000
2006£’000
Opening fair value of plan assets 15,539 12,540 16,570 15,928 14,102
Expected return on plan assets 979 737 1,102 1,085 981
Actuarial gain/(loss) 1,033 1,901 (4,782) (634) 256
Contributions by the group 344 361 417 191 589
Assets distributed on settlement of obligations 0 0 (767) 0 0
Closing fair value of plan assets 17,895 15,539 12,540 16,570 15,928
FORTY SEVEN
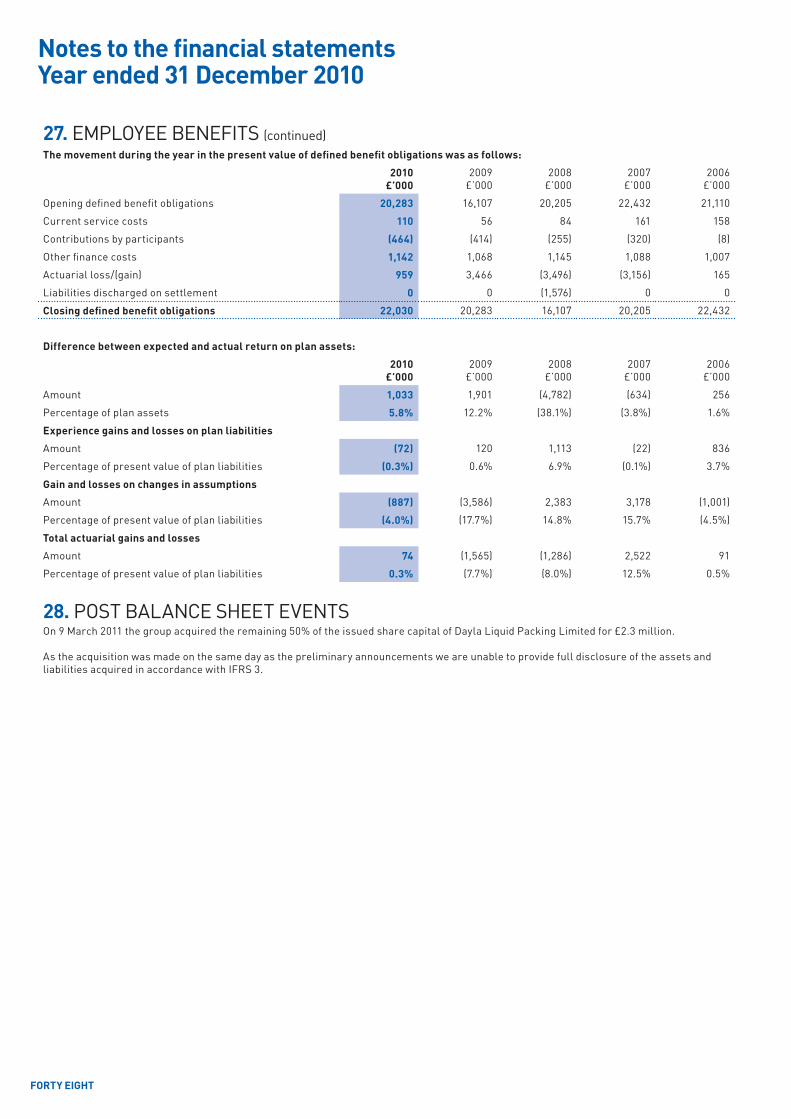
Notes to the financial statementsYear ended 31 December 2010
27. EMPLOyEE BENEFITS (continued)The movement during the year in the present value of defined benefit obligations was as follows:
2010£’000
2009£’000
2008£’000
2007£’000
2006£’000
Opening defined benefit obligations 20,283 16,107 20,205 22,432 21,110
Current service costs 110 56 84 161 158
Contributions by participants (464) (414) (255) (320) (8)
Other finance costs 1,142 1,068 1,145 1,088 1,007
Actuarial loss/(gain) 959 3,466 (3,496) (3,156) 165
Liabilities discharged on settlement 0 0 (1,576) 0 0
Closing defined benefit obligations 22,030 20,283 16,107 20,205 22,432
Difference between expected and actual return on plan assets:
2010£’000
2009£’000
2008£’000
2007£’000
2006£’000
Amount 1,033 1,901 (4,782) (634) 256
Percentage of plan assets 5.8% 12.2% (38.1%) (3.8%) 1.6%
Experience gains and losses on plan liabilities
Amount (72) 120 1,113 (22) 836
Percentage of present value of plan liabilities (0.3%) 0.6% 6.9% (0.1%) 3.7%
Gain and losses on changes in assumptions
Amount (887) (3,586) 2,383 3,178 (1,001)
Percentage of present value of plan liabilities (4.0%) (17.7%) 14.8% 15.7% (4.5%)
Total actuarial gains and losses
Amount 74 (1,565) (1,286) 2,522 91
Percentage of present value of plan liabilities 0.3% (7.7%) (8.0%) 12.5% 0.5%
28. POST BALANCE SHEET EVENTSOn 9 March 2011 the group acquired the remaining 50% of the issued share capital of Dayla Liquid Packing Limited for £2.3 million.
As the acquisition was made on the same day as the preliminary announcements we are unable to provide full disclosure of the assets and liabilities acquired in accordance with IFRS 3.
FORTY EIGHT
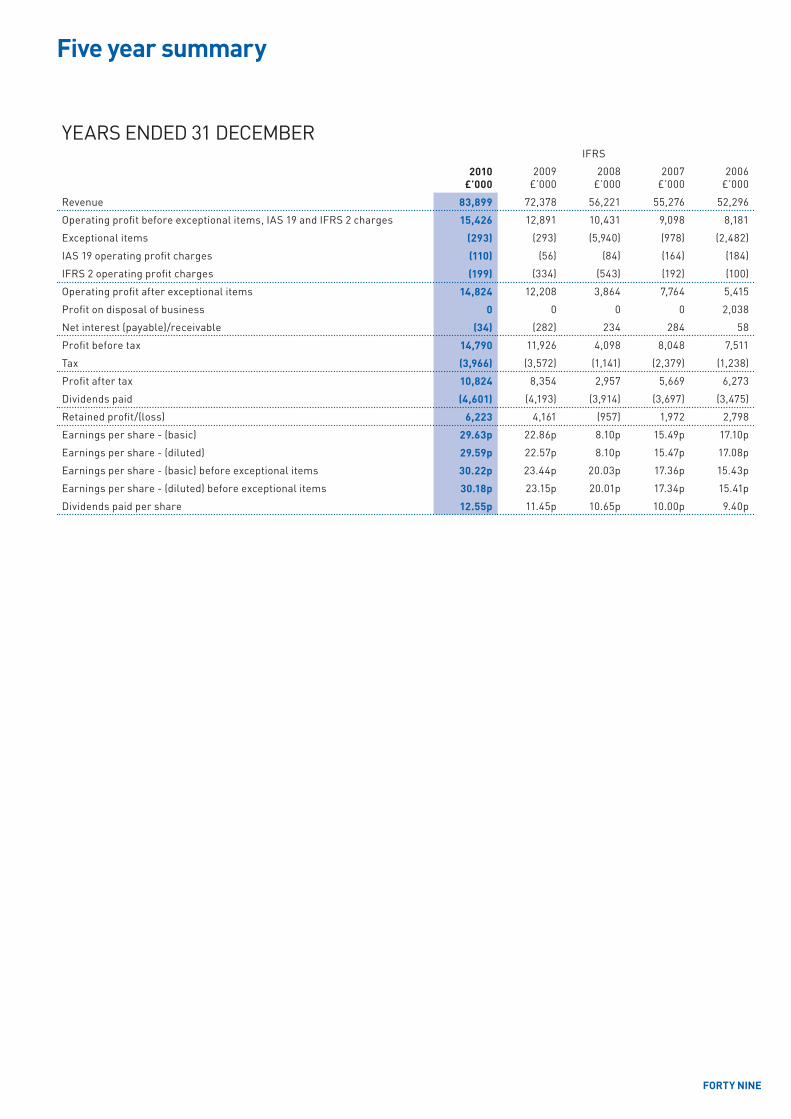
Five year summary
yEARS ENDED 31 DECEMBERIFRS
2010£’000
2009£’000
2008£’000
2007£’000
2006£’000
Revenue 83,899 72,378 56,221 55,276 52,296
Operating profit before exceptional items, IAS 19 and IFRS 2 charges 15,426 12,891 10,431 9,098 8,181
Exceptional items (293) (293) (5,940) (978) (2,482)
IAS 19 operating profit charges (110) (56) (84) (164) (184)
IFRS 2 operating profit charges (199) (334) (543) (192) (100)
Operating profit after exceptional items 14,824 12,208 3,864 7,764 5,415
Profit on disposal of business 0 0 0 0 2,038
Net interest (payable)/receivable (34) (282) 234 284 58
Profit before tax 14,790 11,926 4,098 8,048 7,511
Tax (3,966) (3,572) (1,141) (2,379) (1,238)
Profit after tax 10,824 8,354 2,957 5,669 6,273
Dividends paid (4,601) (4,193) (3,914) (3,697) (3,475)
Retained profit/(loss) 6,223 4,161 (957) 1,972 2,798
Earnings per share - (basic) 29.63p 22.86p 8.10p 15.49p 17.10p
Earnings per share - (diluted) 29.59p 22.57p 8.10p 15.47p 17.08p
Earnings per share - (basic) before exceptional items 30.22p 23.44p 20.03p 17.36p 15.43p
Earnings per share - (diluted) before exceptional items 30.18p 23.15p 20.01p 17.34p 15.41p
Dividends paid per share 12.55p 11.45p 10.65p 10.00p 9.40p
FORTY NINE

Notice is hereby given that the ninetieth Annual General Meeting of Nichols plc (“company”) will be held at its registered office at Laurel House, Woodlands Park, Ashton Road, Newton le Willows WA12 0HH on Wednesday, 4 May 2011 at 11.00 a.m. to consider and, if thought fit, to pass the following resolutions. Resolutions 1 to 7 will be proposed as ordinary resolutions and resolutions 8 and 9 will be proposed as special resolutions:
As ordinary business:
1. To receive the company’s annual accounts and directors’ and auditors’ reports for the year ended 31 December 2010.
2. To declare a final dividend for the year ended 31 December 2010 of 9.10 pence per ordinary share in the capital of the company to be paid on 6 May 2011 to shareholders whose names appear on the register of members at the close of business on 8 April 2011.
3. To re-elect P J Nichols, who retires by rotation, as a director of the company.
4. To reappoint J Longworth, who has been appointed by the board since the last Annual General Meeting, as a director of the company.
5. To reappoint E J Healey, who has been appointed by the board since the last Annual General Meeting, as a director of the company.
6. To reappoint Grant Thornton UK LLP as auditors of the company.
7. To authorise the directors to determine the remuneration of the auditors.
As special business:
8. That, pursuant to section 551 of the Companies Act 2006 (“Act”), the directors be and are generally and unconditionally authorised to exercise all powers of the company to allot shares in the company or to grant rights to subscribe for or to convert any security into shares in the company up to an aggregate nominal amount of £184,843, provided that (unless previously revoked, varied or renewed) this authority shall expire at the conclusion of the next annual general meeting of the company after the passing of this resolution or on 4 August 2012 (whichever is the earlier), save that the company may make an offer or agreement before this authority expires which would or might require shares to be allotted or rights to subscribe for or to convert any security into shares to be granted after this authority expires and the directors may allot shares or grant such rights pursuant to any such offer or agreement as if this authority had not expired. This authority is in substitution for all existing authorities under section 80 of the Companies Act 1985 (which, to the extent unused at the date of this resolution, are revoked with immediate effect).
9. That, subject to the passing of resolution 8 and pursuant to sections 570 and 573 of the Companies Act 2006 (“Act”), the directors be and are generally empowered to allot equity securities (within the meaning of section 560 of the Act) for cash pursuant to the authority granted by resolution 7 and to sell ordinary shares held by the company as treasury shares for cash as if section 561(1) of the Act did not apply to any such allotment or sale, provided that this power shall be limited to the allotment of equity securities or sale of treasury shares:
9.1 in connection with an offer of equity securities (whether by way of a rights issue, open offer or otherwise):
9.1.1 to holders of ordinary shares in the capital of the company in proportion (as nearly as practicable) to the respective numbers of ordinary shares held by them; and
9.1.2 to holders of other equity securities in the capital of the company, as required by the rights of those securities or, subject to such rights, as the directors otherwise consider necessary, but subject to such exclusions or other arrangements as the directors may deem necessary or expedient in relation to treasury shares, fractional entitlements, record dates or any legal or practical problems under the laws of any territory or the requirements of any regulatory body or stock exchange; and
9.2 otherwise than pursuant to paragraph 8.1 of this resolution, up to an aggregate nominal amount of £184,843, and (unless previously revoked, varied or renewed) this power shall expire at the conclusion of the next annual general meeting of the company after the passing of this resolution or on 4 August 2012 (whichever is the earlier), save that the company may make an offer or agreement before this power expires which would or might require equity securities to be allotted or treasury shares to be sold for cash after this power expires and the directors may allot equity securities or sell treasury shares for cash pursuant to any such offer or agreement as if this power had not expired. This power is in substitution for all existing powers under section 95 of the Companies Act 1985 (which, to the extent unused at the date of this resolution, are revoked with immediate effect).
By order of the BoardT J CrostonCompany Secretary
11 April 2011
Registered officeLaurel HouseWoodlands ParkAshton RoadNewton le WillowsWA12 0HH
Registered in England and Wales No. 238303
Notice of annual general meeting
FIFTY
1. Copies of the executive directors’ service agreements and Non-Executive directors letters of appointment will be available for inspection at the registered office of the company during normal business hours (excluding weekends and public holidays) from the date of this notice until the conclusion of the Annual General Meeting.
2. The right to vote at the meeting is determined by reference to the register of members. Only those shareholders registered on the register of members of the company as at 11.00 a.m. on Monday, 2 May 2011 (or, if the meeting is adjourned, 11.00 a.m. on the date which is two working days before the date of the adjourned meeting) shall be entitled to attend and vote at the meeting in respect of the number of shares registered in their name at that time. Changes to entries in the register of members after that time shall be disregarded in determining the rights of any person to attend or vote (and the number of votes they may cast) at the meeting.
3. A member is entitled to appoint another person as his or her proxy to exercise all or any of his rights to attend, speak and vote at the meeting. A proxy need not be a member of the company. A member may appoint more than one proxy in relation to the meeting provided that each proxy is appointed to exercise the rights attached to a different share or shares held by him or her. To appoint more than one proxy, you will need to complete a separate proxy form in relation to each appointment. Additional proxy forms may be obtained from the company’s registrar on [email protected] or on 07811 664 0300 (calls cost 10p per minute plus networks own charges) or you may photocopy the proxy form already in your possession. you will need to state clearly on each proxy form the number of shares in relation to which the proxy is appointed. A failure to specify the number of shares each proxy appointment relates to or specifying a number which when taken together with the number of shares set out in the other proxy appointments is in excess of those held by the member, may result in the proxy appointment being invalid.
4. The appointment of a proxy will not preclude a member from attending and voting in person at the meeting if he or she so wishes.
5. A form of proxy is enclosed. To be valid, it must be completed, signed and sent to the offices of the company’s registrars, Capita Registrars, The Registry, 34 Beckenham Road, Beckenham, Kent BR3 4TU so as to arrive no later than 11.00 a.m. on Monday 2 May 2011 (or, in the event that the meeting is adjourned, no later than 48 hours before the time of any adjoined meeting).
6. CREST members who wish to appoint a proxy or proxies through the CREST electronic proxy appointment service may do so by using the procedures described in the CREST Manual. CREST personal members or other CREST sponsored members, and those CREST members who have appointed a voting service provider(s), should refer to their CREST sponsor or voting service provider(s), who will be able to take the appropriate action on their behalf.
7. In order for a proxy appointment or instruction made using the CREST service to be valid, the appropriate CREST message (a “CREST Proxy Instruction”) must be properly authenticated in accordance with Euroclear UK & Ireland Limited’s specifications and must contain the information required for such instructions, as described in the CREST Manual. The message, regardless of whether it constitutes the appointment of a proxy or is an amendment to the instruction given to a previously appointed proxy, must, in order to be valid, be transmitted so as to be received by the company’s Registrar, Capita Registrars (CREST ID RA10) no later than 11.00 a.m. on Monday 2 May 2011 (or, if the meeting is adjourned, no later than 48 hours before the time of any adjourned meeting). For this purpose, the time of receipt will be taken to be the time (as determined by the timestamp applied to the message by the CREST Applications Host) from which Capita Registrars is able to retrieve the message by enquiry to CREST in the manner prescribed by CREST. After this time, any change of instructions to proxies appointed through CREST should be communicated to the appointee through other means.
CREST members and, where applicable, their CREST sponsors or voting service providers should note that Euroclear UK & Ireland Limited does not make available special procedures in CREST for any particular messages. Normal system timings and limitations will therefore apply in relation to the input of CREST Proxy Instructions. It is the responsibility of the CREST member concerned to take (or, if the CREST member is a CREST personal member or sponsored member or has appointed a voting service provider(s), to procure that his or her CREST sponsor or voting service provider(s) take(s)) such action as shall be necessary to ensure that a message is transmitted by means of the CREST system by any particular time. In this connection, CREST members and, where applicable, their CREST sponsors or voting service providers are referred, in particular, to those sections of the CREST Manual concerning practical limitations of the CREST system and timings.
The company may treat a CREST Proxy Instruction as invalid in the circumstances set out in Regulation 35(5)(a) of the Uncertificated Securities Regulations 2001.
General notes
FIFTY ONE
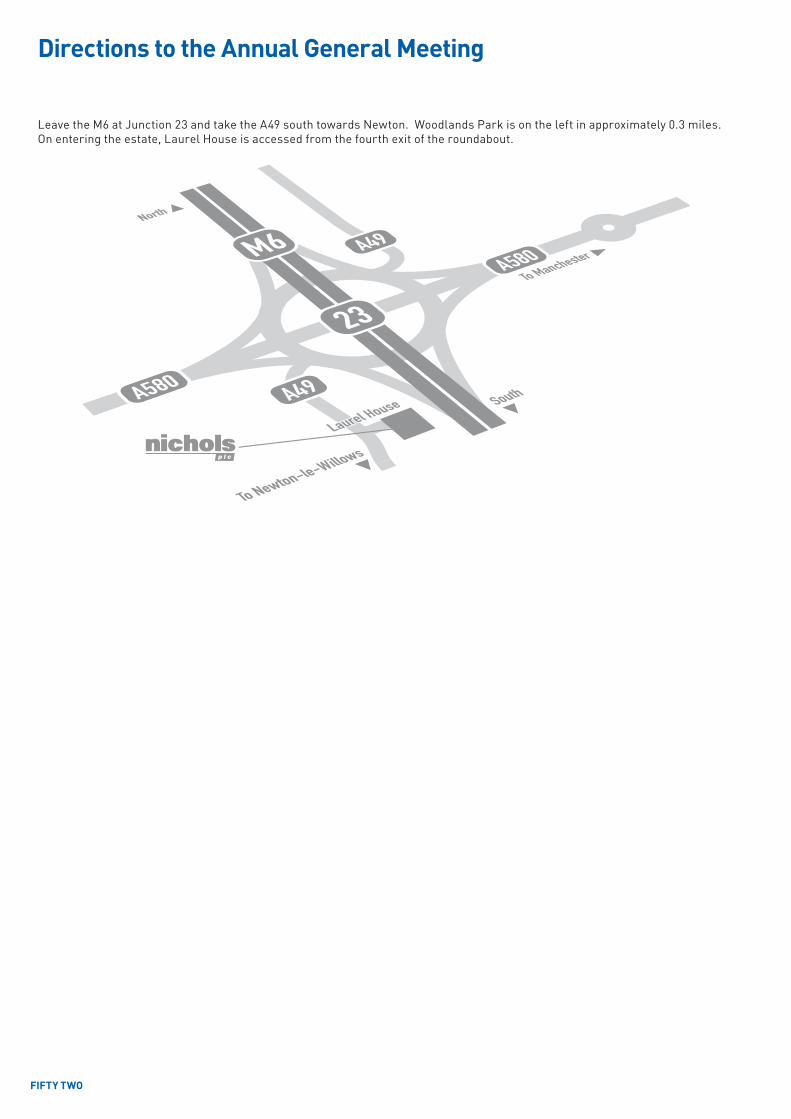
Leave the M6 at Junction 23 and take the A49 south towards Newton. Woodlands Park is on the left in approximately 0.3 miles. On entering the estate, Laurel House is accessed from the fourth exit of the roundabout.
Directions to the Annual General Meeting
FIFTY TWO

Notes:
FIFTY THREE

FIFTY FOUR

FIFTY FIVE
10th MARCH 2011PRELIMINARY RESULTS ANNOUNCED
4th MAY 2011ANNUAL GENERAL MEETING
3rd AUGUST 2011INTERIM RESULTS ANNOUNCED

Laurel House, Woodlands Park,Ashton Road, Newton-le-Willows,Merseyside. WA12 0HH
Tel 01925 222222www.nicholsplc.co.uk