Six Sigma Prof. Dr. T. P. Bagchi Department of …textofvideo.nptel.ac.in/110105039/lec4.pdfcompany...
39
Six Sigma Prof. Dr. T. P. Bagchi Department of Management Indian Institute of Technology, Kharagpur Lecture No. # 04 Initiating Six Sigma Good afternoon, we start again we will be doing a very important step now, that is like getting into a little bit of justifying six sigma and initiating a six sigma mission or a six sigma project. How do we do that? (Refer Slide Time: 00:37) Let me start with the slide that I have here notice here we I have restated the mission of total quality management which basically is a philosophy that involves everyone in an organization in a continual effort to improve quality and achieve customer satisfaction, that is the stated mission of TQM. How do I really activate this thing I have top management direct involvement that is one of the pillars of TQM then we have strong customer orientation and we have already found out the reason for this. We have company-wide participation that; also we are pretty clear about and then of course, we have got systematic problems solving and we have continuous improvement as the thing. These are the requirements of TQM, if you are doing these things you are doing TQM there is no issue at all. People would be happy to tell you that you are a six sigma of company no problem at all, but how long can you sustain this momentum. Just by a
Transcript of Six Sigma Prof. Dr. T. P. Bagchi Department of …textofvideo.nptel.ac.in/110105039/lec4.pdfcompany...

Six Sigma Prof. Dr. T. P. Bagchi
Department of Management Indian Institute of Technology, Kharagpur
Lecture No. # 04
Initiating Six Sigma
Good afternoon, we start again we will be doing a very important step now, that is like
getting into a little bit of justifying six sigma and initiating a six sigma mission or a six
sigma project. How do we do that?
(Refer Slide Time: 00:37)
Let me start with the slide that I have here notice here we I have restated the mission of
total quality management which basically is a philosophy that involves everyone in an
organization in a continual effort to improve quality and achieve customer satisfaction,
that is the stated mission of TQM. How do I really activate this thing I have top
management direct involvement that is one of the pillars of TQM then we have strong
customer orientation and we have already found out the reason for this. We have
company-wide participation that; also we are pretty clear about and then of course, we
have got systematic problems solving and we have continuous improvement as the thing.
These are the requirements of TQM, if you are doing these things you are doing TQM
there is no issue at all. People would be happy to tell you that you are a six sigma of
company no problem at all, but how long can you sustain this momentum. Just by a

basically saying, this is a way of looking at things. You should be customer oriented and.
So, on and already you are doing is you are trying to propagate a particular philosophy.
That is why; you are doing without giving what we say tangible reasons; for it tangible
justification for it. So, what is missing here missing here is money, and that is the
language of business and most managers would probably say, “Well fine, I agree with all
that”. In fact, it is just fine you know I am I am quite used to that, that I know I must
have orientation toward customers, but you talked about training, that I have to go
through I have to put my people through all this, how can I justify that I do not see an
impact on the bottom line you promise nothing at all you just asked me to do these things
and you take me you tell me that this is going to be you must take this on faith; this is
going to be good for you. So, dollar being missing, dollar is a something that is being
absent it begins very difficult to justify the sustaining of sick of TQM it does become
difficult.
(Refer Slide Time: 02:37)
How will do I find the justification: the justification I find by going into something
called the cost of quality and look at this look at the screen here right in a middle, right in
the centre we have got something called cost of quality. Actually, it should be probably
reworded it should be called the cost of poor quality. Let us take a look at: what actually
is going on here and the first thing that we see is something called external failure cost.
You all know if I produce something and if it is sold in market place and it has some
adverse impact on the user, something happens to the customer because of this. In a

factory it could be that I supply him bad parts; so his production stops; so it becomes
defective or he has to have a lot of rework. That is an impact that is an external impact.
So, probably a pretty mild external impact the bigger impact could be that the tyres that
are supplies the bus on the road or the medicines that I supplied they are not package
properly. So, there is some pilferage and people put in some precious drugs in the same
packet. Any of these things can happen and these are all external failures and that is, that
can be a pretty big cost to the company.
(Refer Slide Time: 02:37)
That is like one type of cost and in trying to deliver quality I have something called
appraisal cost which is the money that I pay the inspectors for buying raw materials; for
buying various chemicals for buying instruments. All this money is they have being
spent to try to keep these inspectors alive and make sure that they are able to make the
measurements and produce the produce the data that we need to be able to control the
process then; we got something called internal failures.
(Refer Slide Time: 02:37)
what are internal failures, these are the scraps these are the rework before the product is
shift out all this is happening the internal failure costs has been incurred before I am able
to shift the products out. It is very important first you realize this is also rain on the
company’s money. In fact, all these three balloons I have three balloons here; I have got
external failure either appraisal cost ; I have got internal failures these are balloons that
are basically they are going to reduce the profit of the company .They are going to raise
the expense; they are going to raise the reduce the profit.
(Refer Slide Time: 02:37)
Now, there is one balloon which I have just added here these are called preventive costs.
It turns out that prevention costs are those things ,when I try to correct the situations; I
try to reduce defect; I try to reduce the work; I try to reduce internal failure; I try to
reduce scrap; I try to reduce the external failure. When I am doing these things and I do I
will show you in a minute what all things going to this try to try to make that impact. I
am basically trying to prevent problems that could lead to high a high level of
inspections; the high level of external failure; high level of internal failure. Those are the
things; I am trying to basically reduce by taking steps which are preventing cause.
(Refer Slide Time: 02:37)
So, can u think of a trade off right now can you imagine or trade off? I spend money here
and the result is going to be less inspection, lower failure cost; external failure cost and
low internal failure cost.
(Refer Slide Time: 06:10)
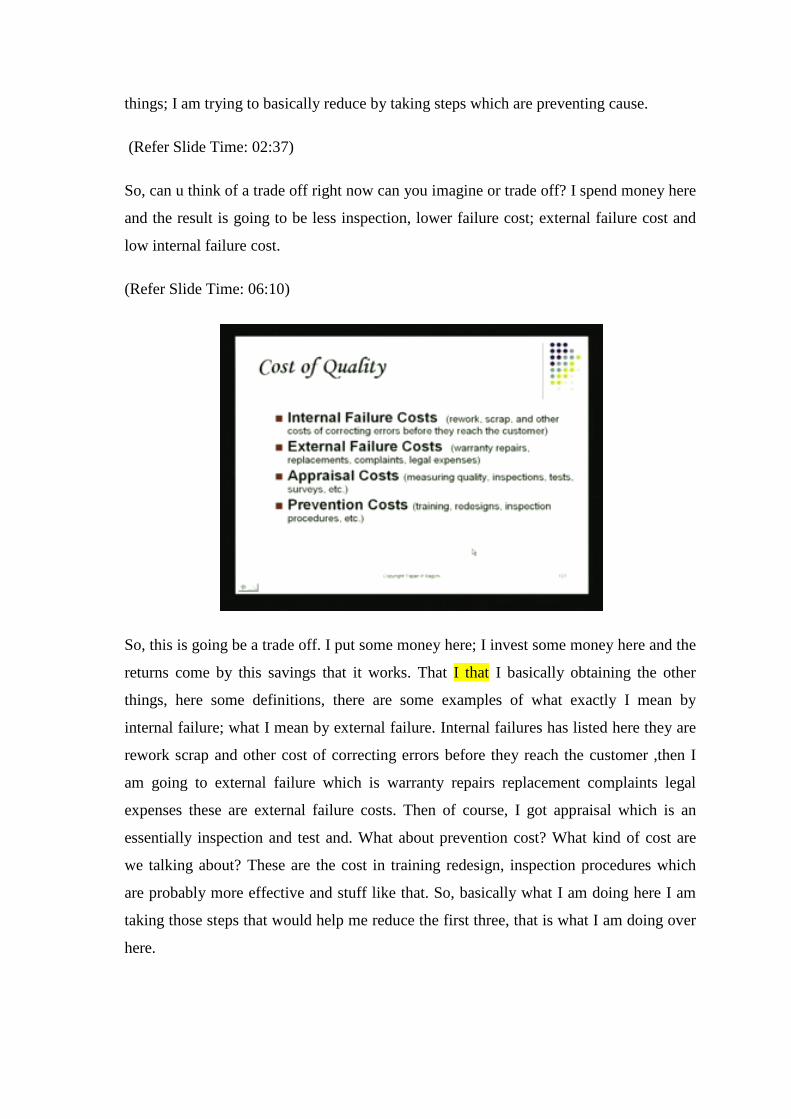
So, this is going be a trade off. I put some money here; I invest some money here and the
returns come by this savings that it works. That I that I basically obtaining the other
things, here some definitions, there are some examples of what exactly I mean by
internal failure; what I mean by external failure. Internal failures has listed here they are
rework scrap and other cost of correcting errors before they reach the customer ,then I
am going to external failure which is warranty repairs replacement complaints legal
expenses these are external failure costs. Then of course, I got appraisal which is an
essentially inspection and test and. What about prevention cost? What kind of cost are
we talking about? These are the cost in training redesign, inspection procedures which
are probably more effective and stuff like that. So, basically what I am doing here I am
taking those steps that would help me reduce the first three, that is what I am doing over
here.

(Refer Slide Time: 07:00)
And here another example: There is another way to present the same thing, I have
internal failures which comprise scrap and rework ; when these decline I have little or no
defective rework. Defective work basically, because these are scrap and rework and
basically when they decline, I have little or no defective work. External failures warranty
cost that is like a big cost to many companies and product liability. These are like major
components or external failure costs. When these decline the result is no dissatisfied
customers because they all feel pretty happy with what they get. No returns and all those
things are there appraisal cost a lot of money is spent to inspection and when these
declined I required very little inspections. In fact, I am shrinking the balloons on these
three sides internal failure, external failures and appraisal I am I am shrinking these
balloons and I am ending up with smaller size balloons. Here, how do I? do that I do that
by spending money of prevention and prevention would be through process improvement
products specification changes, perhaps training costs and what is going to increase here
the prevention the all the all the effort that I put into prevention. So, when these increase
I end up with a win-win situation; I am reducing losses, at the same time; I am able to
justify these of things because there is a positive or I positive return on investment.

(Refer Slide Time: 08:26)
Again this is basically a repeat of what we had there and. So, I would not read them
again, but you can actually see that these lead to better situation.
(Refer Slide Time: 08:23)
So, if I raise production cost prevention cost if I raise prevention cost my appraisal cost
is going to come down my external failure cost is going to come down and my internal
failure cost is also going to come down and the result of this is. There is going to be a
positive returned and this is exactly the motivator for generating six sigma projects six
sigma projects look at the size of appraisal; they look at the size of external failure cost
;they look at the size of internal failure cost and they think of variety of different
preventive steps that could be the. Where money could be spent and the result would be
reduction of these with the increase here and the net result is going to be always a
positive return on this.
(Refer Slide Time: 09:18)
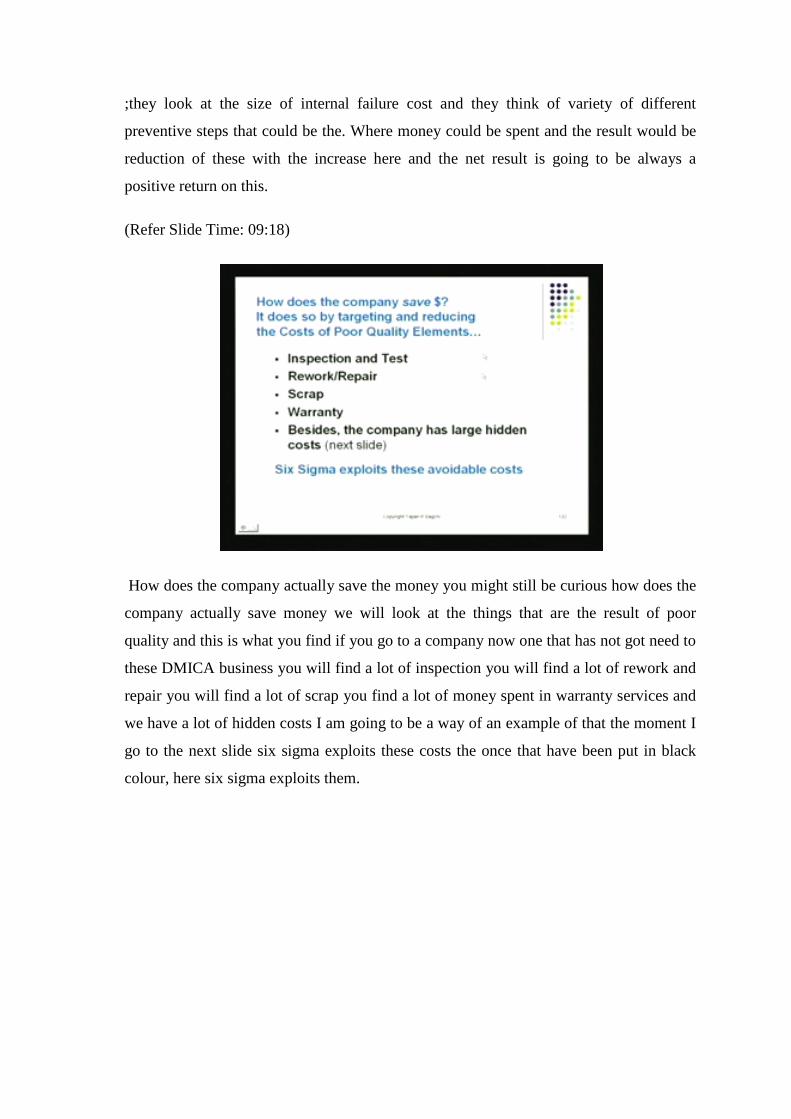
How does the company actually save the money you might still be curious how does the
company actually save money we will look at the things that are the result of poor
quality and this is what you find if you go to a company now one that has not got need to
these DMICA business you will find a lot of inspection you will find a lot of rework and
repair you will find a lot of scrap you find a lot of money spent in warranty services and
we have a lot of hidden costs I am going to be a way of an example of that the moment I
go to the next slide six sigma exploits these costs the once that have been put in black
colour, here six sigma exploits them.

(Refer Slide Time: 09:58)
Let me show you the hidden cost, this may be a slightly hard for you to see unless you
get close to the screen. What is generally visible in terms of the cost of poor quality is
scrap rework and warranty cost, these are quite visible to people. What is not visible to
them is the conversion efficiency of materials, because materials are poor, poor quality
or there of low cost sort of, I tried to save some money there in adequate resource
utilization that also happens many terms because I have got idling machine or idling
Labour because quality is poor. So, lot of rework is going on there the excessive use of
material that also happens when I have got I have got to redo the same again redo the
thing again and this again is a hidden cost. It is not known many times cost of redesign
and re-inspection this is also hidden cost, it also stays there if quality is poor, cost of
resolving customers problems. Many times we do not write down exactly what we did in
trying to help the customer what we did what we have to do. This is something that also
is a hidden cost.
(Refer Slide Time: 09:58)
Then lost customers and lost good will this is like something for which I do not really,
how you can find them find a tag find a find a money tag for this, but this is also a major
hidden cost. If you lose a customer it will probably cost you ten times as much to bring a
new customer of the same sort of value and also if you got poor quality almost invariably
will have high inventory. In fact, if you go to a place where the supply material says a

poor quality, they will have all kinds of bins these are supplies come from people and
they will do some inspection there they will sort them between good and bad , they hold
on to them till the till the dispute is resolve. The same thing happens on the shipment
side also when finished goods have put out there, a lot of sorting goes on you know these
are things that can be shift immediately. Those are that is things they have to be
approved because, there is some waiver required. So, if you have a poor quality you will
end up invariable with high inventory and if you have a poor quality again there are
linkages between this and the maintenance of the machines. If you have poor quality
invariable machines are going to breakdown also, because the culture is that way your
maintenance oriented culture. You know instead of preventing problems, you probably
live with the problems and they will lead to what we have what we had is piles of
unfinished items between the difference stages, that will that will be like extra work in
process extra inventory.
(Refer Slide Time: 12:24)
The goal of six sigma of course, this to reduce defects: the target plus minus you know
something that is far lower than customer tolerance. Customer tolerance has basically
three sigma what we would like to do is, the process sigma here. I am going to explain
this to you and I and I let me just see, I have got couple of slides here for that.

(Refer Slide Time: 12:44)
(Refer Slide Time: 12:45)

(Refer Slide Time: 12:53)
Let me just draw a picture I have normal production coming out. I am going to be doing
this on this blue sheet here, I got normal production coming out here and let see my
normal production. This is normal production and that is coming this way I am going to
first put this spec limits. So, this is my lower spec limit and this is my upper spec limit.
Upper spec limit, which I found out by talking with customer this is lower spec limit
again, it come from the customer. I have these two under normal conditions, when I am
producing; you know at a quality level which is exactly fitting within this my distribution
of my defects quality is going to be like this. This going to be then the distribution when
defects them very few on this side very few on this side these are actually at percent level
the defects her defects are at percent level. When I fitting exactly in the middle. In fact, it
turns out if the standard deviation of this distribution. This is my raw production, if this
is sigma then the distance from this midpoint to this point is going to be three sigma,
three sigma this way and three sigma this way, I am write in the middle the target is right
there. This is my normal production this is not six sigma production this actually three
sigma production, because the midpoint the target is three sigma away from the nearest
specification limit this is three sigma production. So, I am going to tag it three sigma
production three sigma production. This is one level of quality performance. Now, I
bring in a process which has gone through a six sigma project and the process has
reduces defects to parts per million.
They what I have, I have distribution that looks like this and clearly this curve this

distribution is much tighter was when compared to the other one. So, let me draw this
green sigma, green sigma is here and what I find is that the green sigma chart, it starts
from this point to this point and only up to this point is three sigma and again from this
side to this point is three sigma ,then beyond that there is a lot of space left. If this is the
sigma if this is a six sigma process, then the distance from this point to the spec limit is
going to be another three sigma and also another three sigma this way. Let me explain
what is going on my new process which is this one which is the six sigma process the
midpoint of that process is six sigma away from the nearest specification limits three
sigma plus three sigma is six sigma, but distance from here what the green process is six
sigma and the same thing happens on this side also. I have distance that is six sigma six
sigma and notice this is for the green process. So, the green process indeed is the six
sigma process, because from the midpoint the average of the process and the nearest
specification limit is six sigma away.
(Refer Slide Time: 12:53)
Now, let start looking at the impact of doing this it did cost me some money to shrink a
process, which was initial at the stage to try to make. It a six sigma process and shifting a
process from there to their this change here it did cost me some money. In fact, I shrunk
the process on both side, I reduced its variability. If I did that what exactly is the impact,
let us look at the impact; if you look at the tail of this if you look at the tail of the green
curve there and we take the tail out to the upper spec limit on this side, if we take the tail
out on this side to the upper spec limit on this side. This tail here is at parts per minute
parts, per million level and this tail here the defect level there also again, is parts per
million. You know why because the curve has shrunk the green curve, the green curve
have shrunk and the little tail of it that is left behind the beyond the lower spec limit,
there is the upper spec limit and there is the lower spec limit this the lower spec limit.
What remains beyond the lower spec limit is going to be at parts per million. whereas,
for the for the blue curve it was percent the blue curve had defect levels at percent
beyond this spec limit the green curve have as it as parts per million. So, what I have
done I really reduced the fraction. I have reduced
(Refer Slide Time: 12:53)
I have reduced the fraction of defective part greatly by going from three sigma to six
sigma and doing this they may both look like sigma process, but the sigma are different
this sigma is twice of this sigma. Look at the blue curve look at the blue curve and the
sigma for the blue curve is you know, it is like huge and you will look at this sigma of
the green curve its half the size of this sigma. This half of the size of this sigma This of
course, will not come free this will require you to do some investigation; this will require
you to follow the DMAIC process.
(Refer Slide Time: 12:53)
So, how do I convert how do I convert now by blue curve to this green curve. This
conversion from here to here this will happen by DMAIC. DMAIC is the framework, if
you do DMAIC your old process which is the blue curve, it will shift to the green curve.
That is a big improvement it will cost you money, but what it will prevent is all those
things that we saw external failure, internal failure and appraisal cost. Each of those three
balloons would shrink because you put money now to reduce sigma. You reduce the
sigma of the process sigma is the natural variability of a process. Again, I am going to
bring this up again and I go to another location and I am going to bringing up this thing.
(Refer Slide Time: 12:24)
Let’s keep moving here so. In fact, the goal here is to try to eliminate defects that is what
we are really trying to do and the name six sigma refers to the variation that is within
plus or minus the level that we put there.
(Refer Slide Time: 12:44)
As, statistically speaking when I talk about a six sigma process, it is three point four
parts per million and conceptually of course, what is what happening it is design to
reduce defects and it requires; obviously, certain tools and techniques.
(Refer Slide Time: 12:53)
I mentioned to you that the technique that we use here is called DMAIC. That is the
technique that you will be using I will be going through the going through the going
through the process for doing this.

(Refer Slide Time: 12:45)
Six sigma programs improve quality and they save time material wasted effort. They also
cut cost and they are employed in design; they are employed in production; they
employed in service inventory management and even in supplies in management six
sigma programs, shall be used and lot of other.
(Refer Slide Time: 20:30)
Other things are there and what does it do for management. Management provides strong
leadership this was provided by Jack Welch remember Jack Welch who works for GE,
he was the boss of GE and he did by personal examples. We have to define performance
metrics the something that we have to do here we have to go much more precise than we
would be otherwise and this is very, very important this is important. I cannot tell you
how, important this is this is absolutely important and of course, we have to select the
process that is likely to succeed. If there is a like a really difficulty, you cannot really
control the factors, there is no sense in saying that, I will be doing one six sigma project.
There is no sense in saying that, selecting training people training appropriate people.
People you can understand statistics and this cannot be done by shop floor people. You
will have to have a engineers involved, you will have to send schools; you have to send
them a specialize training in statistical methods. For example, and these people when
they come back from their they will either have a green belt or they will have black belt
and they have some experience. They will become a master black belt. These are
specialize people. So, you cannot get something for nothing you have to put money
there. These are preventing cost, what is the plus side the plus side is literally company
that say billions of dollars by doing this they are lots a lots a document and examples to
check them out all you have to do is go to internet.
(Refer Slide Time: 22:00)
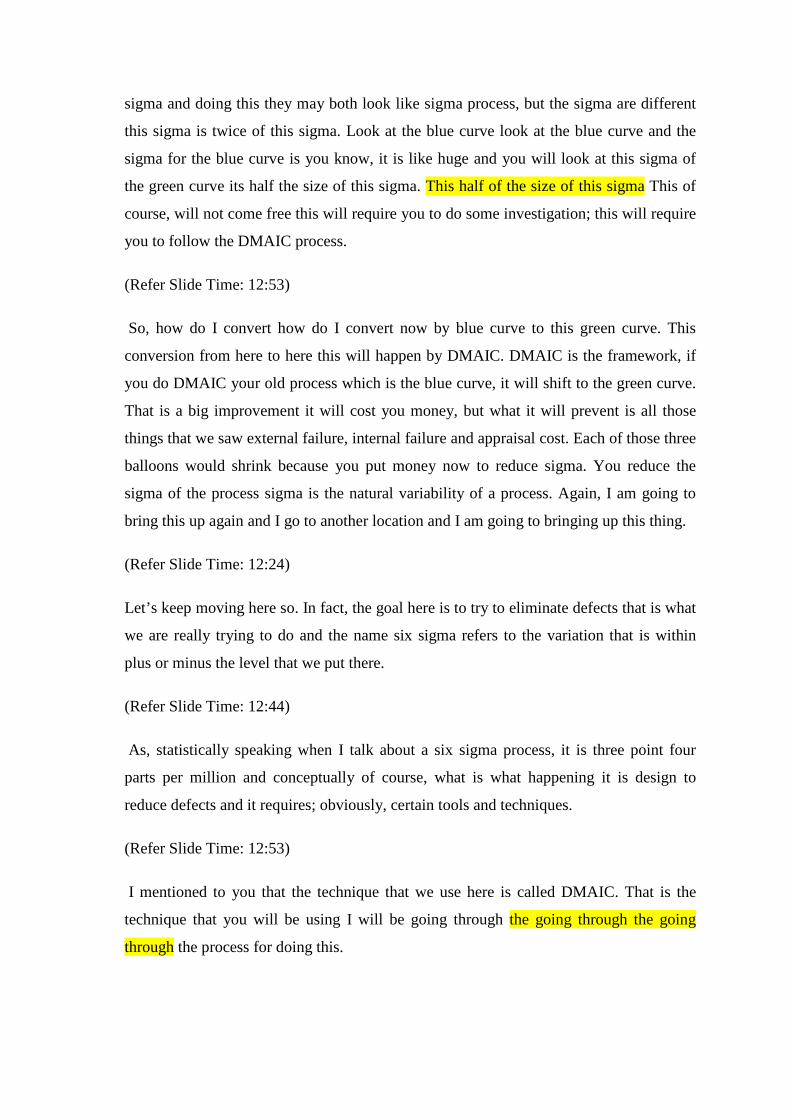
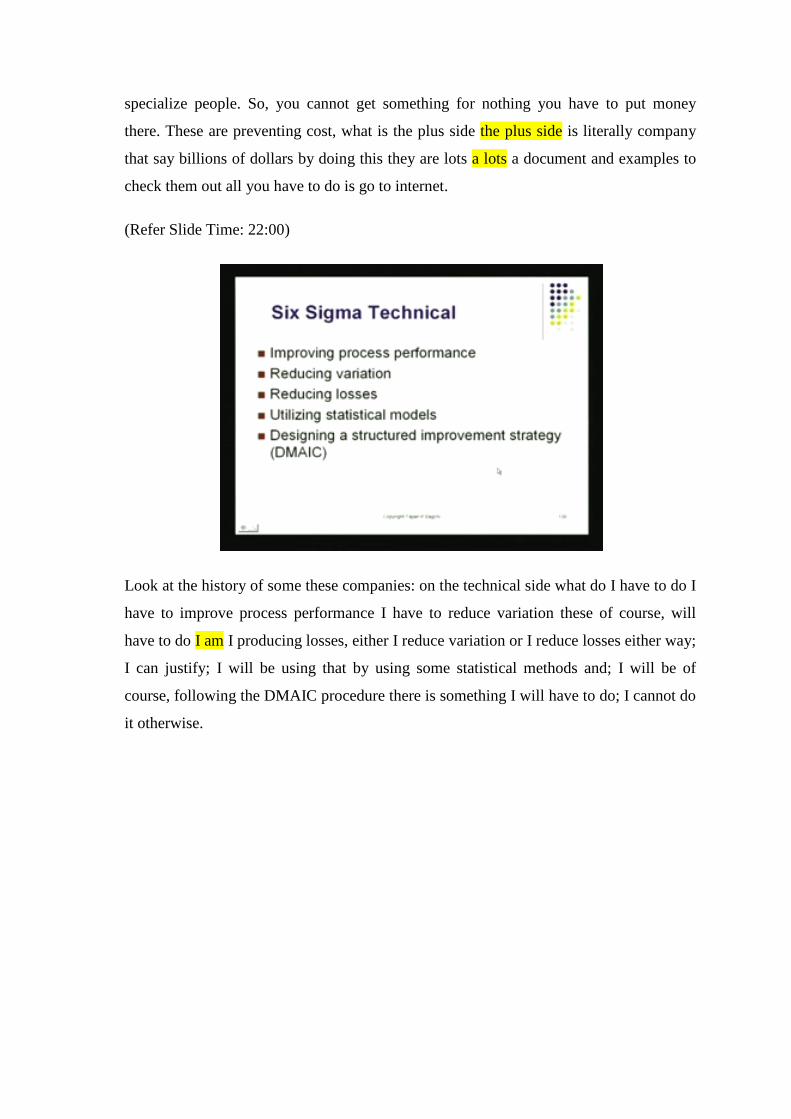
Look at the history of some these companies: on the technical side what do I have to do I
have to improve process performance I have to reduce variation these of course, will
have to do I am I producing losses, either I reduce variation or I reduce losses either way;
I can justify; I will be using that by using some statistical methods and; I will be of
course, following the DMAIC procedure there is something I will have to do; I cannot do
it otherwise.

(Refer Slide Time: 22:22)
what will the team comprise top management will be; obviously, directly involved that
the program champions these are people, who have a big stack involved in the success of
the process. You will a master black belt these are guys who are really the [FL] they are
the honchos. They really know what is going on they understand process, they also
understand statistics, then you got black belt people. These are dedicated people, they are
the hands are dirtying always and they are into the process. They are fixing things; they
are guiding people and doing all those things green belt people know the statistical
methods and they can help along as the process is going on they can help along in data
collection planning that trials and all those things green belts come very, very handy then
know also plenty of statistics.

(Refer Slide Time: 23:05)
So, what is the DMAIC procedure it is define the problem measure the quality
characteristic that you are looking at that you want to improve analyze the situation
perhaps use some TQM tools if it is necessary and do not forget the cause and effect
diagram, because eventually you want to run some trials and experiments in a structured
manner and that can happen only when you got the factors indentified and the factors can
be identified only when you got here fishbone diagram done. Then of course, you will be
doing improvement and improvement would require you to do some experiment or show
you little example of that once these things are standardize then you do control you put
in a piece in place and it start controlling the process that is something you will do.

(Refer Slide Time: 23:50)
Parts per million how do I measure that you look at the opportunities, how many
opportunities are there to make a mistake? And what is the actual mistake that happens
that really remains in the system? After I have done my six sigma so, look at the number
of defects that remain divided by number of opportunities for error per unit or unit could
be some of objects were probably, there is a chance of an error happening. You look at
that object you try to find out there are; many circuits there actually means there are
many opportunities of a mistake; that you put down, here number of opportunities
multiplied by number of few such units that you produce per day then, I will give you the
total number of opportunities when you could make a mistake then you will at the actual
number of defects that you produce multiply that by a million. You will end up with the
defects per million opportunities that is actually the metric that is used in doing six
sigma.
(Refer Slide Time: 24:49)
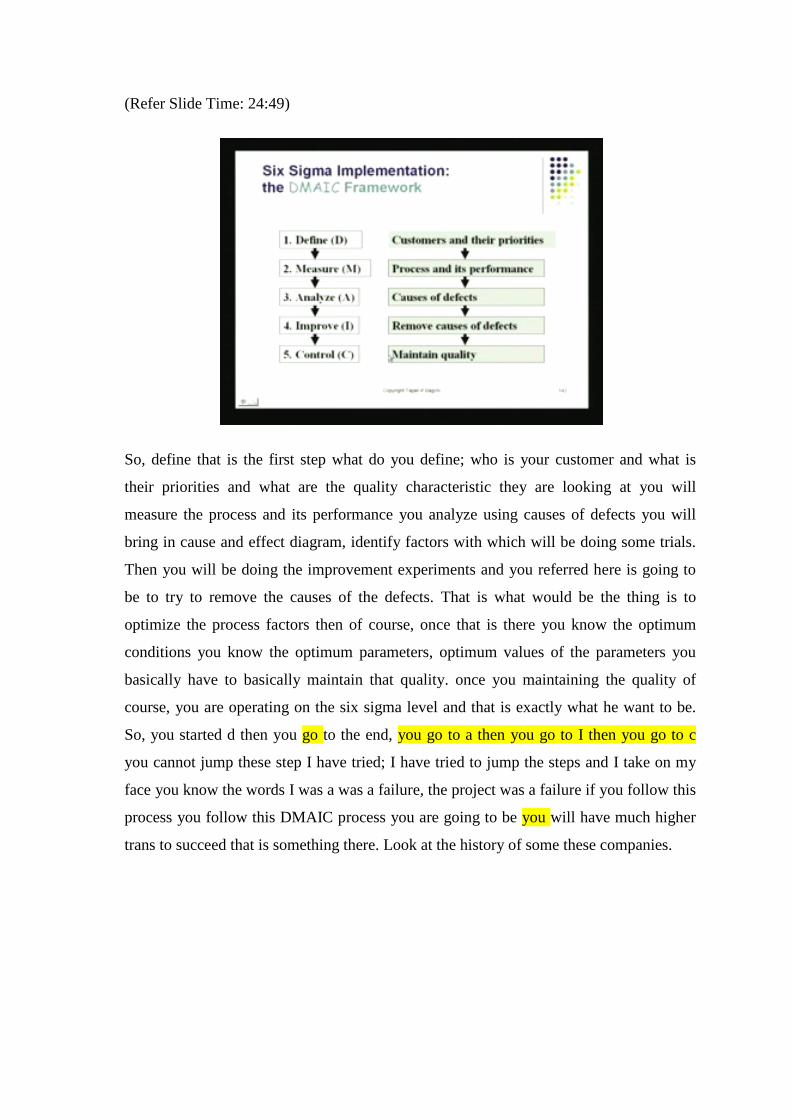
So, define that is the first step what do you define; who is your customer and what is
their priorities and what are the quality characteristic they are looking at you will
measure the process and its performance you analyze using causes of defects you will
bring in cause and effect diagram, identify factors with which will be doing some trials.
Then you will be doing the improvement experiments and you referred here is going to
be to try to remove the causes of the defects. That is what would be the thing is to
optimize the process factors then of course, once that is there you know the optimum
conditions you know the optimum parameters, optimum values of the parameters you
basically have to basically maintain that quality. once you maintaining the quality of
course, you are operating on the six sigma level and that is exactly what he want to be.
So, you started d then you go to the end, you go to a then you go to I then you go to c
you cannot jump these step I have tried; I have tried to jump the steps and I take on my
face you know the words I was a was a failure, the project was a failure if you follow this
process you follow this DMAIC process you are going to be you will have much higher
trans to succeed that is something there. Look at the history of some these companies.
(Refer Slide Time: 26:02)
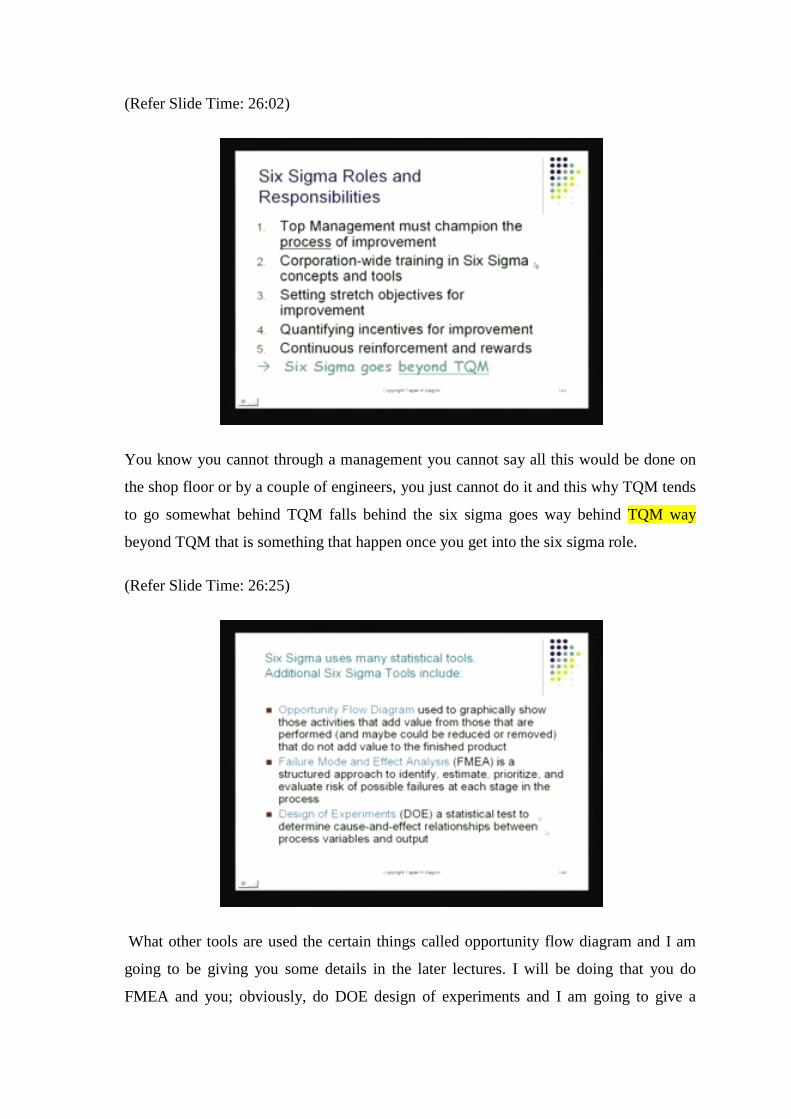
You know you cannot through a management you cannot say all this would be done on
the shop floor or by a couple of engineers, you just cannot do it and this why TQM tends
to go somewhat behind TQM falls behind the six sigma goes way behind TQM way
beyond TQM that is something that happen once you get into the six sigma role.
(Refer Slide Time: 26:25)
What other tools are used the certain things called opportunity flow diagram and I am
going to be giving you some details in the later lectures. I will be doing that you do
FMEA and you; obviously, do DOE design of experiments and I am going to give a

glimpse of that in this lecture itself.
(Refer Slide Time: 26:43)
Quality improvement is like one of the machines and reduction of variance or reduction
of variability that is going to one of the objects and if we remember the slide that I had
here.
(Refer Slide Time: 27:00)
I started with a process, which was the blue process; I have the blue process that will be
initial process. So, I did my d and m and I found my process was at this stage then I did
my analysis what did I do with my analysis I took this process and I try to construct

cause and effect diagram. So, I took this process and I construct the cause and effect
diagram. this is what I did with this process and I located at the various things that could
be that could be going wrong and that is like this thing I have factor a factor b, factor c
factor d and probably some noise factors also those are there and my response is here
response are y or quality. I had trusted that is there basically that is the output that I
would like to see when I am constructing this I am in the analysis phase of DMAIC once
I have identified the factors that I will be playing with I will be moving to I and I will be
planning design of experiments. So, here what I have done, I basically tried to reduce
variability initial variability was the blue sigma which is high and I brought it down to
green sigma, which is a smaller which is a tighter process is got a higher precision. So,
here I have reduced variability, here I have reduced variability I have taken it from here
to this level and there is another approach to try to apply your six sigma logic. You look
after waste reduction, try to find out where you waste is and you try to reduce that and
the Japanese call it Muda. Muda is waste reduction and basically this is also another
approach or another strategy that you could utilize when it doing six sigma you could
that quite easily.
(Refer Slide Time: 28:44)
Just take a look at DOE: I am just going to give a glimpse of DOE and you will actually
see, you will end up seeing how useful this particular tool is in locating the source is our
problems.

(Refer Slide Time: 29:06)
Let us start with this little diagram here and if you are sitting in front pic I will probably
ask you a question and let me ask you the question, anyhow on the right hand side on the
right hand side of this diagram I have my digital watch. You see my digital watch here I
am showing my digital watch I have this digital watch sitting at the right hand side of
this diagram. This is the digital watch and on the left hand side; I have got other types of
systems; I have got the weather the monsoon weather for example, all I could you know
talking about other thing that are unpredictable I have the economy and no one really
knows where today’s economy is going this is the middle of two thousand nine really we
have no idea of which where the economy is going to go and then you look at slightly
more perhaps more understood distance, but still pretty mysterious systems call this
whole body of psychology human psychology there is like another area. So, you look at
the two extremes on this side, I have got electronic watch on this side, I have got
nebulous systems like the like the weather for example, or the economy or psychology.
(Refer Slide Time: 29:06)
For example, now can you tell me can actually think of the difference between systems
on this side on the systems on this side can you think of the differences think for a
minute. You probably say well professor on this side is probably electronics is
concerned, I can write all the equations that going to making that digital watch, I can
write the exact equation and I can fabricate that thing with the methods that, we have

now to a nanosecond I can correct the thing, I can make sure that this watch operates
within a nanosecond of think suddenly for a day. In a year may be it will it will lose two
three seconds that is all I have got such perfect understanding of the system on this side
on the electronic side, then I really have no issue no problem at all on the side. My
knowledge is pretty close to being perfect on the right hand side, which is toward the
digital watch, but my knowledge on this side is very nebulous. I hardly know anything
about how the weather gets affected by may be the flutter of a butterfly or waterfalls
somewhere or god knows what the weather wind is blowing and the effect of green,
green house gases and so on...
(Refer Slide Time: 29:06)
I do not really know what effects to weather I do not completely understand that very
few people will actually do in between in between we have a whole range of systems.
For example, we got medicine you understand some what you got Chemistry, then we
got engineering Mechanical engineering. These systems are such there are better
understood than these systems on the left hand side, but these systems are not as well
understood as the electronic, I do not really have good equations in medicine or
chemistry we have some equation. In fact, how would those equation form sometimes of
course, you got pure theory like Ohm’s Law, Kirchhoff’s Law, Newton’s Law and so
on...
(Refer Slide Time: 29:06)
Those could lead to some degree they could lead to design of systems based on basic
theory or those of the product of a lot of basic research and they have produce those what
that body of knowledge and we can utilize those equations then to design systems which
are near perfect. For example, in between we have a lot of things for which we have
equations today and there are the technique is empirical, run experiments. In fact, in
many cases we can run, we normally run only one factor at a time experiment. In
chemistry, I have a sister and she is the top-notch chemist; she works in a top-notch
university, but when I talk to her she always talks in terms of the effect of one parameter,
she says if I use this catalyst the reaction runs faster then she shuts up and then she again
after ten minutes she said when I test temperature the reaction gets slower it become
slower then again she shuts up for a while, then she comes back again after she finishes.

she says you know when I change the concentration of something some component that
goes into this reaction I see a precipitate form in all the time she is talking about one
factor at a time experiments
(Refer Slide Time: 27:00)
Unfortunately in real life, if you look at a cause and effect diagram and I am going to
show you again the one which is right here and I am going to shift the paper a little bit.
So, you cans see the full cause and effect diagram. Now, you can see the full diagram
these are the factor that are affecting these blue process somehow, I have to take this blue
process to this green process I have to convert it; I have to make it the green process and
I have found out by talking to people and doing brainstorming, but there are these four
factors A,B,C and D they can all influence why I cannot do I cannot do own factor at a
time experiments here because there is something there is a phenomena called
interaction. The effect of A and the effect of B they may interact. In fact, it is very
possible the effect of A, C and D they interact in a very complex way. So, if I had to
optimize Y if have to maximise y or if I have to minimise sigma. Sigma is something I
would like to minimise I would like to take this blue sigma and like to convert it to a
small sigma, the green sigma what I would like to do I know that when there are. So,
many factors they could be interaction also going on that might be might be affecting the
process. So, in this case unlike what my sister does, I cannot do one factor at an
experiment. I cannot have any kind of success by running one factor at a time experiment
all have to run what we call multifactor experiment. So, two or three or four factors they
will have to be run together and this will be done using a matrix type of structure, I will
give a glimpse of that I will just give a glimpse of that right. Now, because I am not
really running through a full lecture on DOE, but this is DOE. DOE is design of
experiments involving multiple factors design of design of experiments using involving
multiple factors that is what we are trying to do.
(Refer Slide Time: 29:06)
That, those would be useful right in a middle right in middle when we got medicine,
chemistry engineering. We will be using these multifactor DOE say. In fact, on top of
this you could write DOE. DOE is the way to take these systems from the left to right.
(Refer Slide Time: 27:00)

Now, can you do DOE with weather; can you do DOE with psychology; can you do
DOE with economy; first of all these are large systems very complex system the second
factor is many times you cannot draw the cause and effect diagram when it comes to
economy you cannot draw the cause and effect diagram our knowledge has not
progressed to the point when we can write down all the different factors that affect
economy or inflation or whatever we are not able to do that and because of that what we
have to do is we have to really restrict the application of DOE to those systems, but I can
draw the cause and effect diagram unless I am able to do this I cannot DOE; I cannot
really hope to get to six sigma. I just cannot do it there is a limitation, you know that is a
kind of a block there and I cannot I cannot really go through the block and reach a six
sigma level without having done this work, which is like construction of the cause and
effect diagram; how will I run my experiment; where will I find the factors which factor
will I play with which factors. I am going to set at low level which was; I am going to set
at high level unless I am able to do that, I am going to be complete failures.
(Refer Slide Time: 37:23)
So, let us see how this is done we start again with a system that has got multiple factors.

(Refer Slide Time: 37:26)
Now, sometimes what happens you might be able to observe the correlation between two
factors. I have got two factors here if you look carefully at the screen I have got walking
speed and I have got heart rate. Now, we all know we are human beings we know as we
walk faster our hear rate goes up and there is a correlation here. What this is really trying
to say is, if I want to control my heart rate. I can do that by adjusting my walking speed,
this is kind of a cause and effect cause and effect relationship this is what this is and this
relationship it is a really cool one, but this correlation plot here, but this scattered plot
here. It gives us an idea there is some hope here of controlling heart rate by playing with
walking speed then I could do that this is a one factor at a time experiment. Imagine now,
if you got two or three different factors they all have affect like this, how do I find out,
what is affecting; what, how do I find that all; I am going to show you, how I am going
to take an example.

(Refer Slide Time: 38:37)
I am going to show you how think of the real system which has got lot of variations; lot
of sources and variations. So, we did the cause and effect diagram, it will be pretty
complicated it will be sort of like this.
(Refer Slide Time: 38:46)
The cause and effect diagram itself will be pretty complicated, it will be like this and
then of course,

(Refer Slide Time: 37:23)
you will have to see can boil them down to three or four factors or five factor then
probably there is a chance for me to do some experiment.
(Refer Slide Time: 38:59)
Let’s see how we do that what is the logic for doing the experiment
(Refer Slide Time: 38:46)
I have my cause and effect diagram which is this one from that I select factors, I select
factors based on experience and what is that experience people tell us people were
knowledgeable about the system, they say well sir, in this case if you are looking to
response power outage is important and burned out bulb is important and not plugged in
plug is important and switch missing is important. These are four important factors. So,
why did not you do a experiment using this. Here, I am using a person’s experience, who
has some experience with this, but still he is not able to give me the precise answer that I
will be able to find with the help of DOE and I am going to move in that direction. So, I
will start with his knowledge his knowledge based which is now put in the form this
construction, this cause and effect diagram.
(Refer Slide Time: 38:59)
What I then do is, I try to sort of say C is giving me three factors. I have to run now,

multifactor experiment unless into this very carefully. How many factors are there? You
can actually see I have listed out factor A that is one of the factors, factor B is another
factor, factor C another factor and imagine these three factors together. They are
basically driving the process they are running the process. So, how a cause and effect
diagram here, which is got factor A driving it; factor B driving it and factor C driving it
what we do not know which of these factors is really the culprit, which of these factors is
really the important one and indeed also if there is an interaction between factor A and
factor C if there is an interaction that also is something that will have to discover because
we want to optimize the process; we want to control the response in a manner that will
reduce the overall defect in the process that is what we would like to be do.
Let’s see how we do that the first question, that we have to resolve we do jump at
optimization like we do not get out PhD right away as soon as we enter IIT we do not
look for the PhD degree we do our B.tech and within b tech we do first year, second year
third year, fourth year then we go through another test then enter our m tech and we do
first year, second year and M.tech then we move on to PhD and PhD again we got an
entrance then got one year, two year ,three year may be in three years .I will complete
my PhD. So, I went through stages and what I have to remember is in doing experiments
also I do not quite jump to the optimize state completely first I have to get my first year
of B tech then I do my second year B.tech and. so on. Then I reaches a certain level then;
I see what else can I do now I could do probably a few courses and. So, on I could do a
project then I will be ready for my PhD, then I can start my PhD. So, let us see how we
do that when we do a six sigma project.
(Refer Slide Time: 38:59)
The first question that I ask is does factor A have an impact, that is all, does factor A
have an impact on my process does factor B; have an impact on my process and does
factor C; have on my an impact on my process if I ask this question of my sister she
would say “oh, there is no problem at all [FL]” what you do is you run a trial using factor
a only factor a and just see if the curve can goes up; that means, factor a has an affect
then you know clean up the table and so on, put everything away then I bring in factor b
we bring in catalyst and I put the catalyst a little bit then little bit more little more and
you try to what happens to the process. So, you got a response based on addition of
factor B then you put that aside and you bring in factor C we do the same thing. So, a

response that was generated by factor a response that was generated by factor B another
response that was generated by factor C was a good sound was good to me, but it does
not give me the answer because in the real process I have a changing b changing and C
changing all together, can you tell me how can find the composite defect of A changing,
B changing, C changing my sister says me you asking very complicated question I do not
think this can be done because I am not seeing any chemistry paper or physic paper
people manipulating two or three things together or this I do not think such a question is
a relevant question as, but you do not know I am trying to improve this device and thinks
that can actually change with this is the battery voltage; something about the screen and
something about the software there is there three factors and they are all interacting
perhaps . So, the performance of the total system now is depending on factor A, factor B
and factor C that is the total that is what determinate the total performance how do I take
care of this and for this there was a method given that is called a matrix experiment and I
am showing that matrix experiment on the screen here.
(Refer Slide Time: 38:59)
Let us check a look at, it does look like a matrix does it not looks like a box, but look at
little bit more carefully I have decided to use only two levels : only two levels of a I have
a decided that, I will set a I will run my trials with a set only at two levels: a low level
and a high level that is all and then of course, I have factor b again; I have decided all try
it only at running at low level and running at high level and then I have got factor C ,this
guy his is also at two level: factor C at low level and factor C at high level. Now, I have
got two times, two times two what is the total number two times, two times two that is
eight. So, I have got eight combinations low and highs are you with me. So, far I have
factor A which can be set at two levels. So, I can run two trials with factor A at low level
factor A at high level for each of these trials I can set B now at low level, high level. So,
I can have a set at low level and I can run B at low level and high level and then I can
move a to high level and I can run B at low level and high level that also, I can do you
can see that this is factor B and this factor A. So, factor A at high level then factor B
could be run at low level and factor B could also be run at high level when A is being at
held at high level.

(Refer Slide Time: 38:59)
Take a look at the matrix, take a look at the matrix that I have here the box A can be set
at low level or it could set at high level and while I am changing this, I can change the
setting of B from low to high. I could to do that as B goes up it goes from low to high
and then of course, I have got a combination of A and B. So, this box this square here, it
shows me the low, low combination of A and B; the high, low combination of A and B;
the low, high combination of A and B and the high and high combination of A and B and
these four setting, they were done with C set up low level. These are my four trials then,
I have got similarly, I have got four trials at C at high level and those are the back walls.
So, I have got a total of eight different possible trials, great I have got eight trials now; I
will be running my experiments at each of these blocks each of these box each of these
box basically they show us the different experiments I will be running. So, I have run
here eight trials with a low and high combination of the three factors then I do something
called data analysis after I have done this and this I am going to teach you later on I do
data analysis the result is data analysis is I have observations here. and here and. So, on.
(Refer Slide Time: 38:59)
All these observations what I am really after is finding something called main effects.
Main effects are the effect of factor A and the factor B and the effect of factor C
independent of the effect of any other factor. Let me repeat again, what I said by doing
these trial these eight trials and by doing my special data analysis which I am going to
teach you I can isolate the effect of factor, the effect of changing factor setting of factor
A from low to high I can find that effect I am going to show you that in a minute the
same calculations can also show me the effect going from B, setting B set at low level
and then set at high level. The impact on response when I change my setting of B from
low to high.
(Refer Slide Time: 38:59)
I will be able to see that effect also and the same thing I could do for factor C, whatever
is the effect on the response of the of the process. When I shift the setting of C from low
to high whatever the response is whatever the impact is one response of the process, that
also I can observe and let me show you why those are showing. Look at the curve plotted
look at the curve plotted here these curve show you when I change the setting of a from

low to high the response goes up may be going up is good. So, response improves when I
low when, I raise this setting off from low to high with B the effect is exactly the
opposite. I bring down the response, response actually gets worse when I change the
setting of B from low to high and when I do the same thing for C, I again find the setting
of shifting of the settle shifting the setting of C from low to high reduces the response.
Now, just while you looking at these things which factor will you see has the highest
effect on the response ,which factor will you see is it a is it B or is it C well it is pretty
obvious factor C has the highest effect factor C has the highest effect. Now, was just
main effect there is a similar possibility; there is a similar procedure available for me to
find out whether factor A or B or C whether they interact with each other and also, if
their effect is significant let me tell you little about the significant business.
Say in this room, there is hardly any noise. So, we can hear my hear my sound, but
actually you may not know this there is very faint noise in this room, which is the a
motor that is running here inside the PC and suppose my suppose my signal is reduced.
my signal is my voice suppose it is reduced to the level when my signal and the noise
coming out of the PC they are at the same level and let me try to do that. Can you hear
could you hear anything? I doubt if you could hear anything at all because my signal
which is my voice had come down I had reduced it to the level when basically it was at
the same level as the background noise at that point you probably say, “sir you are quiet
you not saying anything”. In fact, the same thing we do when it comes to testing the
effect of these factors we say that the effect is strong if the effect is audible, if the effect
is audible in comparison to the background noise, if that happens we say the factor has
an effect; if that does not have happen we say the factor is low significant effect that
would be one stage when I move from there after finding these effects I can go into
(Refer Slide Time: 38:59)
What we call a mathematical equation which is predicted model and here I put response
on this side and I got my A, B, C factor here and then of course, I have constructed a
model, this model can be very handy optimizing the process. So that for next goal, I did
my experiment. I found the factor effects. I did my plotting then; I constructed this
mathematical model the last stage is you either reduce variation, which is like when you
reduce sigma you reduce the six sigma from reduce the sigma from being blue to green
this you do by doing your experiments and all the other thing is you could also directly

reduce defects that also, you something we could there I am optimizing the process once.
I have found the right setting for A, B and C then I can do control I can actually bring
this whole thing into what we call the control mode and I can put yes, PC to monitor the
system to make sure it stays there.
(Refer Slide Time: 52:52)
Let me show you what happen in real application then Nissan company, it found
suddenly that the Nissan logo was falling of the cars, on the back of the car they used to
paste this logo when the car was ready finishing; was done painting; was done
everything was polish was done, then they took this logo which was a nice little thing
that has Nissan and it they stuck it with some glue they stuck it on the back of the car,
but the customers complaint by saying these logos keep falling off and we have to come
to the come to the dealer again get another logo which is not so good, and this is a big
problem there and this turn out to be a few percent of the cars may be ten fifteen percent
they were losing the logos. So, this was an issue. So, the definition of the problem D was
those a problem with this thing, the measured it the found out fifteen percent of logos are
falling off, then they starting doing the analysis and the constructed the cause and effect
diagram which I showed you on the on the tree again I showed you the cause and effect
diagram which is this one the constructed the diagram and in doing that.
(Refer Slide Time: 52:52)
What they found was they were:

These factors that could be affecting it addition area that could be one factor, the other
factor could be the type of glue, that was used the third factor could be the foam; that
was used the type of foam that was used and the thickness of the logo and then there
some other factors also the amount pressure that was applied to stick. The stick the logo,
the wall that also was something that could be done. So, this is something they started to
play with the constructed a matrix,
(Refer Slide Time: 54:36)
Let me show you the matrix here, is the matrix here is the experimental matrix you see
factors A, B, C ad let written up there. This is the logo this is the experiment actually and
the experiment actually was done only at two levels: high level which is shown by a plus
and a low level that was shown by a minus and you can read the matrix there, you can
actually see the first trial this was a matrix experiment. Just like we had eight trials there:
we also have eight trials here the first trail produced a gluing strength, when A was set at
high level; B was set at high level; C was set at high level and D was at low level glue
strength turn out to be nine point eight, then they change the setting of A in the in the
next trial plus. plus that is high, high, low and low and glue strength turn out to be eight
point nine this had to be measured because this was the response of the system. So, run
they run all these eight trials, having done that they found the factor effects and I am
going to show you the plot of the factor effect. So, plots are this.
(Refer Slide Time: 55:40)
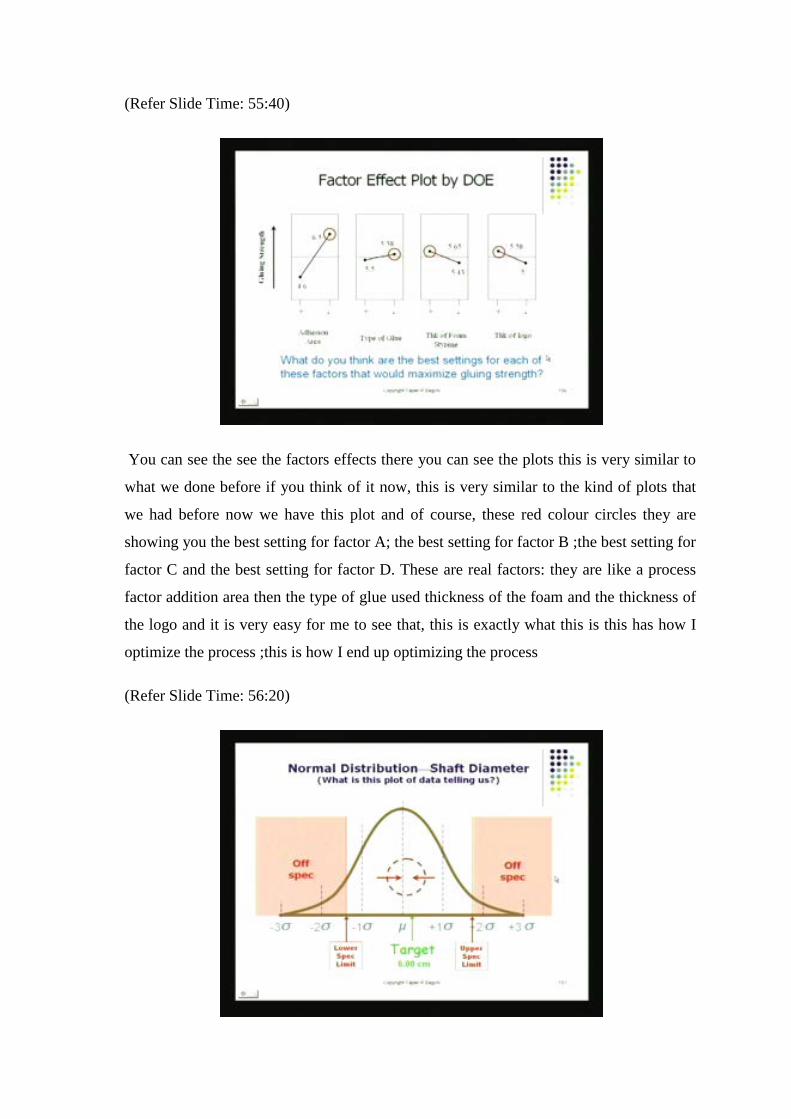
You can see the see the factors effects there you can see the plots this is very similar to
what we done before if you think of it now, this is very similar to the kind of plots that
we had before now we have this plot and of course, these red colour circles they are
showing you the best setting for factor A; the best setting for factor B ;the best setting for
factor C and the best setting for factor D. These are real factors: they are like a process
factor addition area then the type of glue used thickness of the foam and the thickness of
the logo and it is very easy for me to see that, this is exactly what this is this has how I
optimize the process ;this is how I end up optimizing the process
(Refer Slide Time: 56:20)
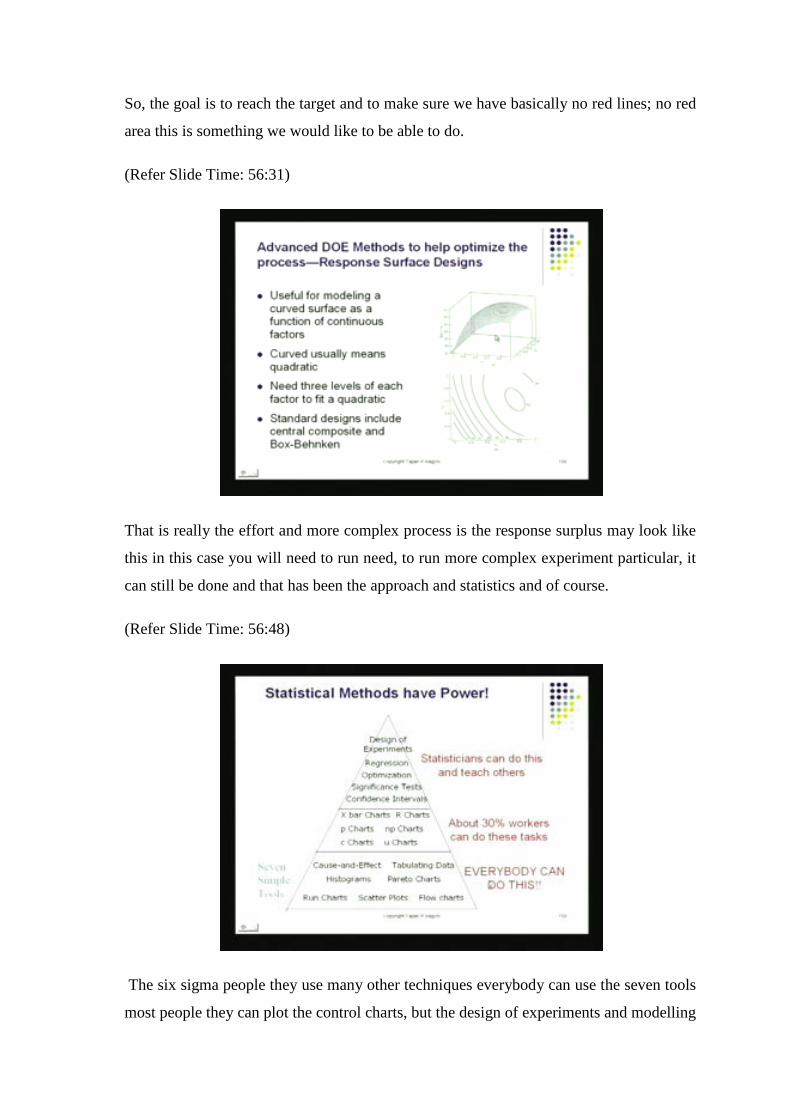
So, the goal is to reach the target and to make sure we have basically no red lines; no red
area this is something we would like to be able to do.
(Refer Slide Time: 56:31)
That is really the effort and more complex process is the response surplus may look like
this in this case you will need to run need, to run more complex experiment particular, it
can still be done and that has been the approach and statistics and of course.
(Refer Slide Time: 56:48)
The six sigma people they use many other techniques everybody can use the seven tools
most people they can plot the control charts, but the design of experiments and modelling
and optimization those are done general by black belt people.
(Refer Slide Time: 57:07)
They are the guys, who can do those things and the black belt of course, is the leader.
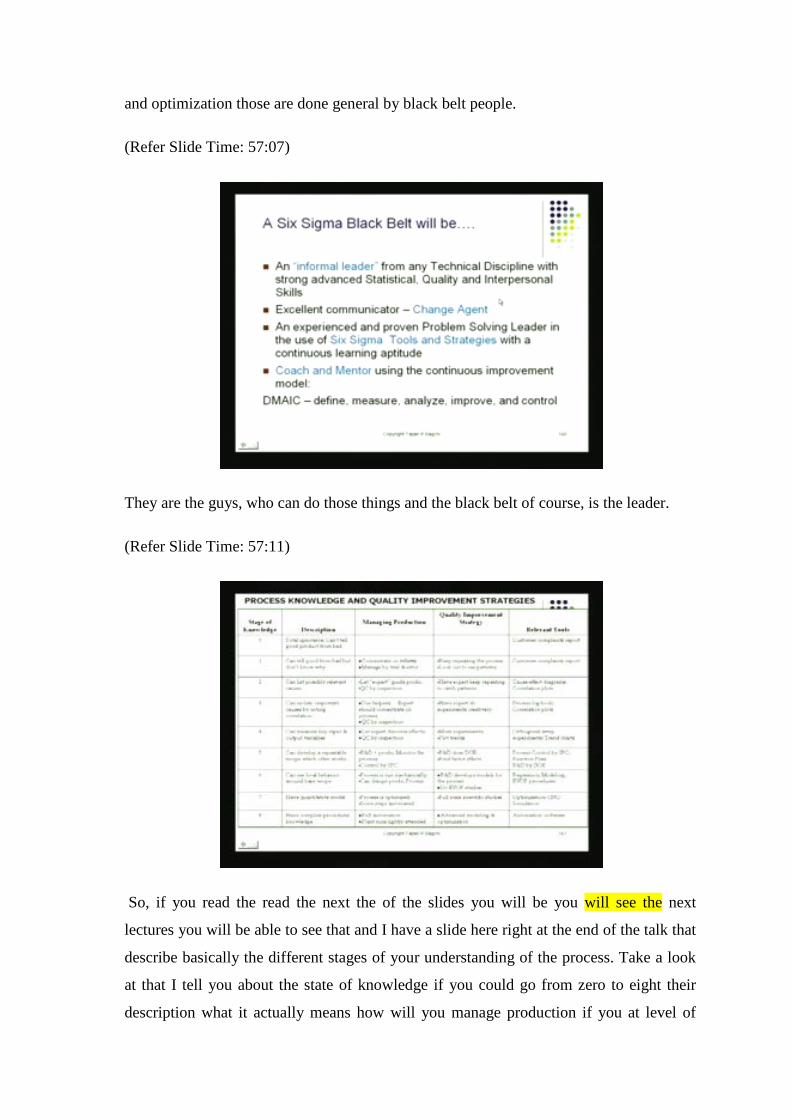
(Refer Slide Time: 57:11)
So, if you read the read the next the of the slides you will be you will see the next
lectures you will be able to see that and I have a slide here right at the end of the talk that
describe basically the different stages of your understanding of the process. Take a look
at that I tell you about the state of knowledge if you could go from zero to eight their
description what it actually means how will you manage production if you at level of

knowledge is right stuck at two or three level or some are there what quality
improvement strategies you will be using and what are the relevant tools the relevant
tools notice here I do not use SPC or DOE at the beginning I do not do that I wait till, I
reach a certain level of understanding my process, which could be level four or level
three or something. Only, then I bring in SPC and DOE of course, when I reach the last
stage my performance is like my digital watch which is an automated system. Thank you
very much we will follow up, in the next lecture thank you.