Six Sigma DMAIC Improvement Story - Miami-Dade · Six Sigma DMAIC Improvement Story Jack Kardys...
34
Last Updated: 8-1-13 Team: The Faster Fixer-uppers Michael Ruiz (Team Leader) Ray Scher (Team Leader) Robert Zubieta Jorge Mora Rosie Abreu Carol Kruse Amalia Hurtado Cesar Rivero Juan Armas Green Belt Project Objective: Reduce the Backlog of Parks Maintenance and Repair Work Orders Six Sigma DMAIC Improvement Story Jack Kardys (Sponsor)
Transcript of Six Sigma DMAIC Improvement Story - Miami-Dade · Six Sigma DMAIC Improvement Story Jack Kardys...

Last Updated: 8-1-13
Team: The Faster Fixer-uppers
Michael Ruiz (Team Leader) Ray Scher (Team Leader)
Robert Zubieta Jorge Mora Rosie Abreu
Carol Kruse Amalia Hurtado Cesar Rivero Juan Armas
Green Belt Project Objective:
Reduce the Backlog of Parks
Maintenance and Repair Work Orders
Six Sigma DMAIC Improvement Story
Jack Kardys (Sponsor)
Six Sigma Problem Solving Process
2 Define Measure Analyze Improve Control
Process StepDescription of Team Activities
Number Name
1 DEFINE
· Select Problem
· Identify Project Charter
· Develop Project Timeline
· Establish Method to Monitor Team Progress
· Construct Process Flowchart
· Develop Data Collection Plan
· Display Indicator Performance “Gap”
2 MEASURE· Stratify Problem (i.e.“Gap”)
· Identify Problem Statement
3 ANALYZE· Identify Potential Root Cause(s)
· Verify Root Cause(s)
CONTROL
· Standardize Improvements within Operations
· Implement Process Control System (PCS)
· Document Lessons Learned
· Identify Future Plans
5
DMAIC Performance Improvement Process
4 IMPROVE
· Identify and Select Improvement(s)
· Identify Barriers and Aids
· Develop and Implement Improvement Plan
· Confirm Improvement Results
The team utilized the 5-Step DMAIC problem solving process.

Identify Project Charter The team (chartered by management) completed their Project Charter.
Project Name: Reduce the Backlog of Parks Maintenance and Repair Work Orders
Problem/Impact:
Too many work orders taking too long to complete resulting in large backlog of work orders. As a result, parks wait
too long for required repairs. Impacts include customer dissatisfaction with the aesthetic and fuctional value of our
parks, potential safety issues, and inefficient use of limited resources.
Expected Benefits:
Improvement will result in more work orders being completed on time, fewer safety issues,
greater customer satisfaction of park patrons.
Outcome Indicator(s) Q3- % of Work Orders Completed On Time
Proposed Target(s) Target= 90 % completed in 7 calendar days
Time Frame: March 2013 through July 2013
Strategic Alignment: Supports the County's Business Plan
In Scope: All Facility Maintenance/Repair Work Orders
Out-of-Scope: Capital Construction and special projects (e.g. Mayoral and/or Commissioner Requests)
Authorized by: Ray Scher; Jack Kardys
Sponsor: Jack Kardys, Ray Scher
Team Leader: Michael Ruiz, Ray Scher
Team Members: Jorge Mora, Robert Zubieta, Rosie Abreu, Cesar Rivero, Amalia Hurtado, Carol Kruse
Process Owner(s): Jorge Mora
Mgmt Review Team: Jack Kardys, Ray Scher
Completion Date: 31-Jul-13
Review Dates: Monthly and Final Review in July 2013
Key Milestone Dates:See Action Plan
Team
Schedule
Project Charter
Business
Case
Objectives
Scope
3 Define Measure Analyze Improve Control
1.
2.

Develop Project Timeline Plan Legend:
= Actual
= Proposed
The team developed a timeline plan to complete the Project.
Define Measure Analyze Improve Control
4.
4
Mar Apr May Jun Jul Aug
1. Define
2. Measure
3. Analyze
4. Improve
5. Control
WHAT: Complete DMAIC Story Project by July 31, 2013
DMAIC Story
Process Step
WHEN 2013
7/31/13
Completed 4/12/13
Completed 4/23/13
Completed7/9/13
Completed 6/13/13
Step 2
Measure
DMAIC Story Checkpoints
PL
AN
DO
CH
EC
KA
CT
6. A target for improvement was established based on the stakeholders' need.
7. The impact of the target on the indicator was determined.
8. A problem statement that describes the "remaining dataset" was developed.
Step 3
Analyze
9. Cause and effect analysis was taken to the root level.
10. Potential causes most likely to have the greatest impact on the problem were selected.
11. A relationship between the root causes and the problem was verified with data.
12. The impact of each root cause on the gap was determined.
13. Countermeasures were selected to address verified root causes.
15. Barriers and aids were determined for countermeasures worth implementing.
16. The action plan reflected accountability and schedule.
17. The effect of countermeasures on the root causes was demonstrated.
18. The effect of countermeasures on the problem (or indicator) was demonstrated.
19. The improvement target was achieved and causes of significant variation were addressed.
20. The effect of countermeasures on the indicator representing the stakeholders' need was
demonstrated.
Objective: Confirm that the countermeasures taken impacted the root causes and the problem; and that the target has been met.
Objective: Analyze the stratified data to identify and verify the root causes.
Objective: Develop and implement countermeasures to eliminate the verified root causes of the problem.
Step 4
Improve
Objective: Prevent the problem and its root causes from recurring. Maintain and share the gains.
23. Specific areas for replication were identified.
Objective: Evaluate the team's effectiveness and plan future activities.24. Any remaining problems (or gaps) were addressed.
Step 5
Control
Step 1
Define
1. The stakeholders' need(s) were identified.
2. The problem can be described as an "object" with a "defect" with unknown cause(s) that need to be identified.
3. A line graph outcome indicator was constructed that appropriately measures the problem (or gap).
Objective: Demonstrate the importance of improvement needs in measurable terms.
Objective: Investigate the features of the indicator, stratify the problem and set a target for improvement.5. Data contained or directly linked to the indicator were stratified from various viewpoints (i.e., what, where, when and who) and a significant dataset was chosen.
14. The method for selecting the appropriate countermeasures was clear and considered
effectiveness and feasibility.
21. A method was established to document, permanently change, and communicate the revised
process or standard.
22. Responsibility was assigned and periodic checks scheduled to ensure compliance with the
revised process or standard.
25. Lessons learned, P-D-C-A of the Story process, & team growth were assessed & documented.
4. A schedule for completing the five DMAIC Story steps was developed.
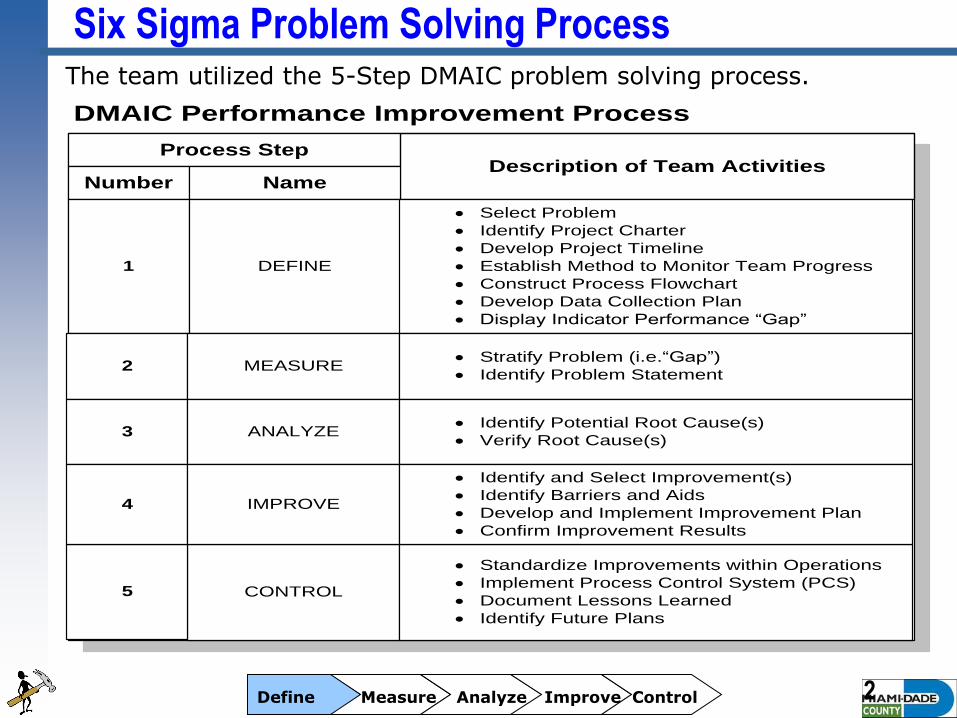
Monitor Team Progress
Team identified an indicator;
developed a Flowchart and a
Spreadsheet
The Team and Management used a Checklist to monitor team progress.
5 Define Measure Analyze Improve Control
Paretos , Histograms, SIPOC and
Customer Requirements Matrix
Single Case Bore; Fishbone ; RC
Verification Matrix
Countermeasures Matrix; Barriers
and Aids; Action Plan
Line Graph
Process Flowchart; Process Control
Chart
Lessons Learned

Hidden Costs of Late Work Order Completion The team collected info on costs of late work order completion.
6
1. Handling Costs for Inquiries/Complaints & asking about late work orders
(decreased customer satisfaction)
Define Measure Analyze Improve Control
Annual Cost
Annual Costs = $ 154,780
b. Operations Management
[6 staff hours per week] X [52 weeks]
X [average estimated $40 per staff hr ]............................................ $ 12,480
2. Increased risk of safety issues
a. Trades Management
[45 staff hours per week] X [52 weeks]
X [average estimated $45 per staff hr ]........................................... $ 105,300
a. Settlement Costs (from previous 12 months) ................................ $ 22,000
b. Est. Processing Costs (incl. attorney/investigator/manager)........ $ 15,000

WHO
STEP
CUSTOMER(INTERNAL / EXTERNAL)
FACILITIES MAINT DIV MGMT/CHIEF
NEED
Complete Parks and Recreation Repair Orders
DMAIC_Story_Miami Dade_Complete P&R Repair Orders_5-1-13.vsd 6/28/13
3RD
PARTIES (VENDORS,
DEPTS .)
Need Park Maintained
Parks Maintained
MAINTAINED
PERFORM
MAINTENANCE WORKER
· Assign / Train Workers In Repair Order Specifics
P5 - Lost worker hours associated with
equipment / supplies, maintenance problems
P6 - # of exceptions found
Q1% customer satisfaction with maintenance (safety, cleanliness, stocked, usable)
Q2 Number of days work orders completed late
Q5 % maintenance budget variance
Q4 Lost activity hours
CONTACT
RECEIVE/PRIORITIZE/MONITOR/SELECT
ASSIGN
SECURE/INSPECT
All OK?
Wkr Can Handle?
· Contact Approp Parties & Resolve
· Adjust Schd As Reqd
· Perform Maintenance Activities As Scheduled
Actvty w/o Excpn?
RESOLVE/CONTACT
ADJUST
· Correct If Possible
· Doc Exception
OK w/o new Wrk Ordr?
· Wrkr Provides Wrk Order Info To Supv
All Actvties Cmpld?
· Rtn/Ready Equip For Next Use
· Discuss Activity Lessons Learned To Apply To Future Plan/Schd
CORRECT/DOC
PROVIDES
RETURN / READY
DISCUSS
Ready To Work?
· Resolve With Approp. Parties
· Contact Supvr.
YES
NO
NO
YES
NO
NO
NO
YES
YES
YES
YES
NO
· Workers Secure Equipment For Maintenance Activities· Inspect And Ensure Equipment And Supplies Are Sufficient
· Receive New Repair Orders· Prioritize With Existing Work· Monitor Field Conditions And Resources· Select Next Repair Order(s) To Work
(Process Owner: Jorge Mora )
Q3 % of work orders completed on-time
P1 - # of days for shops to review/assign
(from WO Creation)
P2 - # of days for crews to begin work
(from shop review/assigning)
P3 - # of days for crews to finish work
(from beginning of work)
P4 - # of days for completing system data
entry & closing WO (from finish of work)
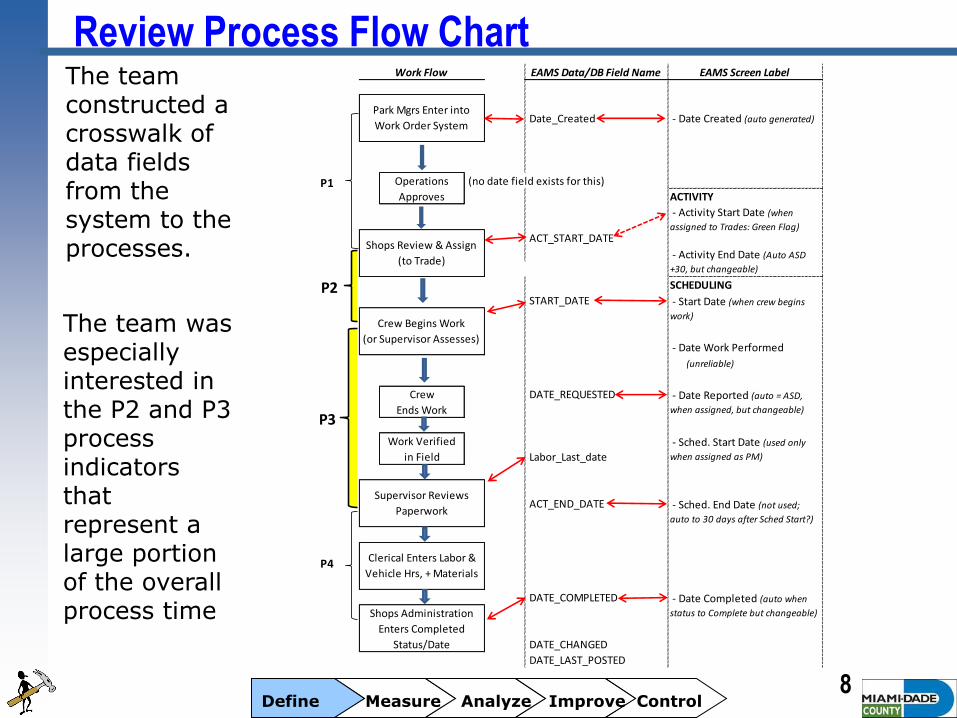
Review Process Flow Chart
Define Measure Analyze Improve Control 7
The team constructed a flowchart for the Work Order Process.
The team developed Outcome Indicators from SIPOC and Customer Rqmts analysis (see Appendix)
Date_Created - Date Created (auto generated)
(no date field exists for this)
ACTIVITY
ACT_START_DATE
SCHEDULING
START_DATE
DATE_REQUESTED
Labor_Last_date
ACT_END_DATE
DATE_COMPLETED
DATE_CHANGED
DATE_LAST_POSTED
Operations
Approves
Work Flow EAMS Data/DB Field Name EAMS Screen Label
Park Mgrs Enter into
Work Order System
- Activity Start Date (when
assigned to Trades: Green Flag)
Shops Review & Assign
(to Trade) - Activity End Date (Auto ASD
+30, but changeable)
- Start Date (when crew begins
work)Crew Begins Work
(or Supervisor Assesses) - Date Work Performed
(unreliable)
Clerical Enters Labor &
Vehicle Hrs, + Materials
- Date Completed (auto when
status to Complete but changeable)Shops Administration
Enters Completed
Status/Date
Crew
Ends Work
- Date Reported (auto = ASD,
when assigned, but changeable)
Work Verified
in Field
- Sched. Start Date (used only
when assigned as PM)
Supervisor Reviews
Paperwork - Sched. End Date (not used;
auto to 30 days after Sched Start?)
P2
P1
P3
P4
Review Process Flow Chart
Define Measure Analyze Improve Control 8
The team constructed a crosswalk of data fields from the system to the processes.
The team was especially interested in the P2 and P3 process indicators that represent a large portion of the overall process time

Identify Data Collection Needs The team developed a data collection spreadsheet to collect indicator and demographic data…
9 Define Measure Analyze Improve Control
Parks Work Orders Process Status Summary
D E M O G R A P H I C S
B C D E F G H I J K L M N O P Q R S T U V
Lin
e #
55,522 $2,510,242 $6,361,532 $3,868,863 $2,275,287 $217,382
1 91646 BRKD Routine RequestREPAIR BROKEN CORNER OF CONCRETE SLAB AROUND THE BBQMEDIUM SHELTER - PICNIC SHELTER # 4A D DOUG BARNES PARK6 Jovany FigueroaKESHA PRECNS327548 T-KENDALL CARPENTER ERVIN 196756 5 $0 $523 $334 $157 $32 Completed
2 91768 TECH Technician Found(UMSA) BACKFLOW PREVENTERS (1) - TESTING AND CERTIFICATIONBIRD LAKES PARKBIRD LAKES PARK11 DENNIS BLALOCKA070474 PRECNS327565 T-SOUTH PLUMBER BLALOCK $1,000 $0 $0 $0 $0 Cancelled
3 91767 TECH Technician Found(AW) BACKFLOW PREVENTERS (2) - TESTING AND CERTIFICATIONAFRICAN HERITAGE CULTURAL ARTS CNTRAFRICAN HERITAGE CULT ARTS CTR3 DENISE BLALOCKA070474 PRECNS327565 T-SOUTH PLUMBER BLALOCK $2,500 $0 $0 $0 $0 Cancelled
4 92055 BRKD Routine RequestSewer in shower/toilet/laundry #4 is backed up. The bathouse had to close down.BATHHOUSE - CAMP - SHOWER/TOILET/LAUNDRY #4,B/W #11 & #9LARRY AND PENNY THOMPSON PARK9 Johnnie JacksonASERGIO PRECNS327548 T-KENDALL $0 $0 $0 $0 $0 Cancelled
Work
Order
Number Location Com
m D
istr
ict
Type
WO
TYPE StatusSupervisor Assigned to
Tool
ExpenseBudget
Total
Expense
Labor
ExpenseLabor HrsIndex CodeDescription Asset Contact Created By
Shop
Assigned
Total
Parts
ExpenseTrade
MILESTONE DATES DURATION
AB AC AD AE AF AG AH AI AJ AK BB
Date Day Date Day Date Day Date Day Date Day
% Mo % Mo % Mo % Mo % Mo Avg # of Days %Y
21.2 18.7 15.7 14.5 9.4 -2603.6 102.3 36.9 90.6 52.3 7.0 45.3 25.9
P1 P2 P3 P4 P1+P2+P3 Q2 Q3
1/4/12 We 1/4/12 We 1/4/12 We 2/17/12 Fr 1/9/12 Mo 0 0 44 -38 44 7 37 N
1/10/12 Tu 1/10/12 Tu 1/10/12 Tu 0 7
1/10/12 Tu 1/10/12 Tu 1/10/12 Tu 0 7
1/23/12 Mo 1/23/12 Mo 1/25/12 We 0 7
AM=
AF-AD
AN=
AH-AF
OUTCOMES
End Labor
Finalized
(Complete)Shops Assign
Comments
AW='Y' if
AV<=0
AV=
AQ-AR
Date
Created
TO
Shops
Assigned
Work
Order
Cmpltd
On-Time?
# of Days
Work
Order
Cmpltd
Late
Begin
Labor
TO
End
Labor
AR
End
Labor
TO
Finalized
(Cmpl)
Shops
Assigned
TO
Begin
Labor
Estimated
Number of
Days to
Complete
Date Created Begin Labor
AL=
AD-AB
AQ=
AJ-AB
Date
Created
TO
End Labor
AO=
AJ-AH

0%
10%
20%
30%
40%
50%
60%
70%
80%
90%
100%
Jan Feb Mar Apr May Jun Jul Aug Sep Oct Nov Dec
Pe
rce
nt
Co
mp
lete
d O
n-T
ime
Work Order Creation Month (2012)
Q3 - Parks Work Orders Completed On-Time
Actual
Target
Review Selected Indicator
The data above is for work orders created in calendar year 2012
The team collected indicator data and reviewed performance trends:
10 Define Measure Analyze Improve Control
3.
GAP
GOOD
Target = 90% within 7 calendar days
Monthly Avg

0
200
400
600
800
1000
1200
1400
-4.5
-0.5
3.5
7.5
11
.51
5.5
19
.52
3.5
27
.53
1.5
35
.53
9.5
43
.54
7.5
51
.55
5.5
59
.56
3.5
67
.57
1.5
75
.57
9.5
83
.58
7.5
91
.59
5.5
99
.51
03
.51
07
.51
11
.51
15
.51
19
.51
23
.51
27
.51
31
.51
35
.51
39
.51
43
.51
47
.51
51
.51
55
.51
59
.51
63
.51
67
.51
71
.51
75
.51
79
.51
83
.51
87
.51
91
.51
95
.51
99
.52
03
.5
# o
f W
ork
Ord
ers
# of Days to Complete Work Order from Begin Date
P&R Work Orders Created in 2012 & Marked "Complete"
1222
272
154153
951076577737181
5049333735212317231823251331152419121313109 6 9 127 6 124 12149 121421283210
30
_x
n = 3,208 (87 WO's >200 days not shown)mean = 38.8std dev = 61.4
1,714 (53%) of the work orders exceeded the standard of 7 calendar days for completion
Stratify the Problem The team stratified 2012 Work Order Data using a histogram and found…
11 The team looked closer at the 1,714 work orders that exceeded the 7 day standard...
Define Measure Analyze Improve Control
USL = 7

0
50
100
150
200
250
300
350
400
450
-4.0
65
0.4
95
5.0
55
9.6
15
14
.17
5
18
.73
5
23
.29
5
27
.85
5
32
.41
5
36
.97
5
41
.53
5
46
.09
5
50
.65
5
55
.21
5
59
.77
5
64
.33
5
68
.89
5
73
.45
5
78
.01
5
82
.57
5
87
.13
5
91
.69
5
96
.25
5
10
0.8
15
10
5.3
75
10
9.9
35
11
4.4
95
11
9.0
55
12
3.6
15
12
8.1
75
13
2.7
35
13
7.2
95
14
1.8
55
14
6.4
15
15
0.9
75
15
5.5
35
16
0.0
95
16
4.6
55
16
9.2
15
17
3.7
75
17
8.3
35
18
2.8
95
18
7.4
55
19
2.0
15
19
6.5
75
Nu
mb
er
of
Wo
rk O
rde
rs
Labor Hours to Complete Work Orders
Work Orders over 7 days
393
372
259
191
97
78
5646 40
23 2512 14 8 6 9 11
6 7 6 5 7 2 7 4 1 1 1 2 1 1 2 4 1 4 1
_x n = 1,714
mean = 29.9std dev = 39.3
Stratify the Problem
12
The team looked closer at these 1,196 work orders.
The team stratified the 1,714 work orders by labor hours and found…
Define Measure Analyze Improve Control
5.
1,196 work orders (70%) took 18 hours
or less in labor hours but more than
7 days to complete!
0
50
100
150
200
250
300
350
400
450
-9.5 7.5 24.541.558.575.592.5109.5126.5143.5160.5177.5194.5211.5228.5245.5262.5279.5296.5313.5330.5347.5364.5381.5398.5415.5432.5449.5466.5483.5500.5517.5534.5551.5568.5585.5
Nu
mb
er
of
Wo
rk O
rde
rs
Calendar Days to Complete
Work Orders Requiring 18 hrs or less in Labor, but taking more than 7 days to complete
387
225
126
6455 50
3524 22
40
8369
3 2 2 2 2 2 2 1
_x
n = 1196mean = 70.7std dev = 68.1
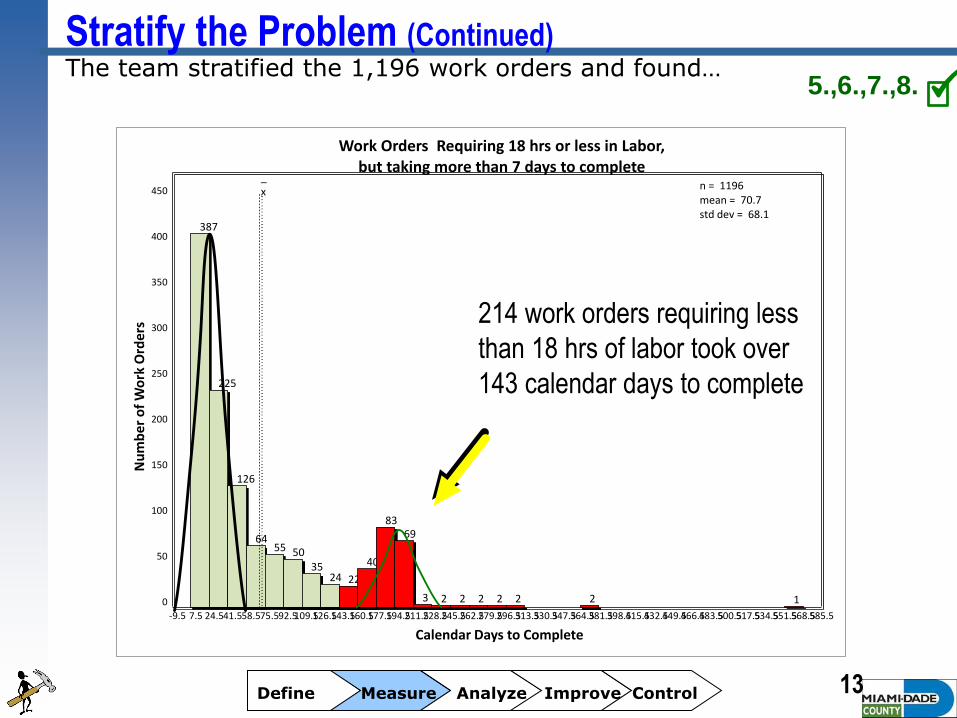
Stratify the Problem (Continued) The team stratified the 1,196 work orders and found…
13 Define Measure Analyze Improve Control
5.,6.,7.,8.
214 work orders requiring less
than 18 hrs of labor took over
143 calendar days to complete

109
45
36
7 5 3 3 2 2 1 1
%
%
%%
% % % % % %
0
10
20
30
40
50
60
70
80
90
100
0
50
100
150
200
% o
f To
tal
Nu
mb
er
of
Wo
rk O
rde
rs
By Trade
Work Orders Requiring 18 hrs or Less in Labor,Taking More than 143 Calendar Days to Complete
n = 214
Stratify the Problem (Continued) The team stratified those 214 work orders and found…
14 Define Measure Analyze Improve Control
5.,6.,7.,8.
109 (51%) of these are
Plumber Related Work Orders
but this is consistent with
overall mix of trades.
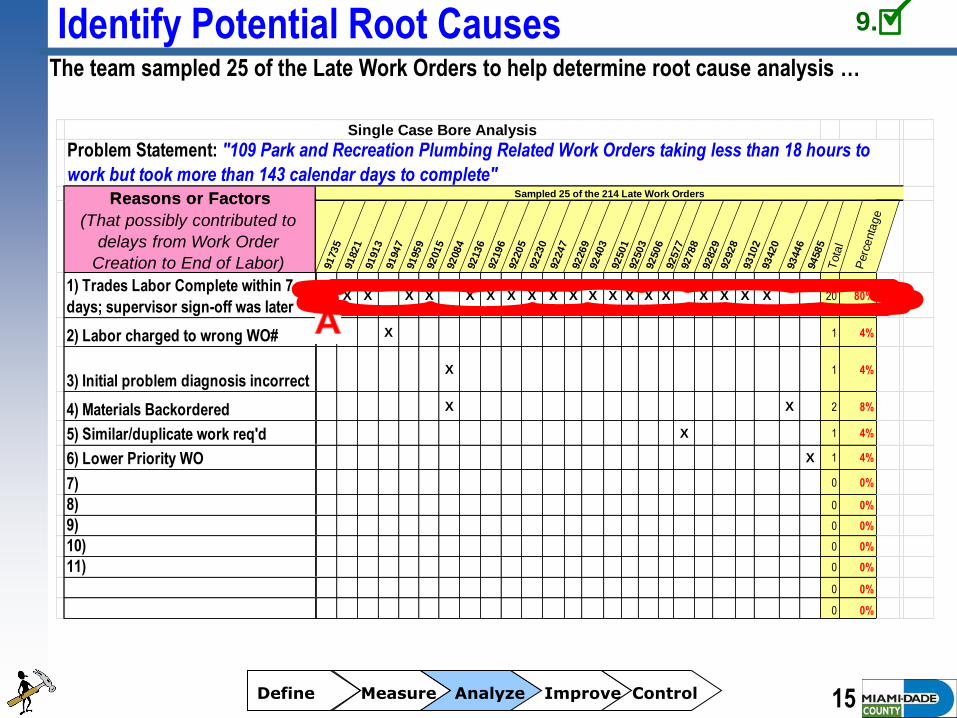
Identify Potential Root Causes The team sampled 25 of the Late Work Orders to help determine root cause analysis …
15 Define Measure Analyze Improve Control
9.
Single Case Bore Analysis
Problem Statement: "109 Park and Recreation Plumbing Related Work Orders taking less than 18 hours to
work but took more than 143 calendar days to complete"
Reasons or Factors
(That possibly contributed to
delays from Work Order
Creation to End of Labor)
Sampled 25 of the 214 Late Work Orders
91735
91821
91913
91947
91959
92015
92084
92136
92196
92205
92230
92247
92269
92403
92501
92503
92506
92577
92788
92829
92928
93102
93420
93446
94585
Tota
l
Perc
enta
ge
Reasons or Factors
(That possibly contributed to
delays from Work Order
Creation to End of Labor)
1) Trades Labor Complete within 7
days; supervisor sign-off was laterX X X X X X X X X X X X X X X X X X X X 20 80%
2) Labor charged to wrong WO# X 1 4%
3) Initial problem diagnosis incorrectX 1 4%
4) Materials Backordered X X 2 8%
5) Similar/duplicate work req'd X 1 4%
6) Lower Priority WO X 1 4%
7) 0 0%
8) 0 0%
9) 0 0%
10) 0 0%
11) 0 0%
0 0%
0 0%

"109 Park and
Recreation
Plumbing Related
Work Orders
taking less than
18 hours to work
but took more
than 143 calendar
days to complete"
Problem
Statement
Fishbone
Cause and
Effect Diagram
= Potential Root
Cause
A- Trades Labor Complete within 7 calendar
days; supervisor sign-off was later (80%)
No standards on when
supervisor’s time should be
entered into the system
Trades Supervisor entered time
much later than when actual
work was completed
A
Identify Potential Root Causes The team completed Cause and Effect Analysis and found…
The team next looked to verify these Potential Root Causes.
16 Define Measure Analyze Improve Control
9.,10.

Verify Root Causes The team collected data to verify the root cause and found….
17
…it was validated as a root cause.
Define Measure Analyze Improve Control
11.,12.
A No standards on when supervisor’s
time should be entered into the
system
Root
Cause
Root Cause
or Symptom
Reviewed systems and operational
manual and procedures; no standard
exists.
Root Cause Verification Matrix
Potential Root Cause How Verified?
Eff
ec
tiv
en
es
s
Fe
as
ibilit
y
Ov
era
ll
Ta
ke
Ac
tio
n?
Ye
s/N
o
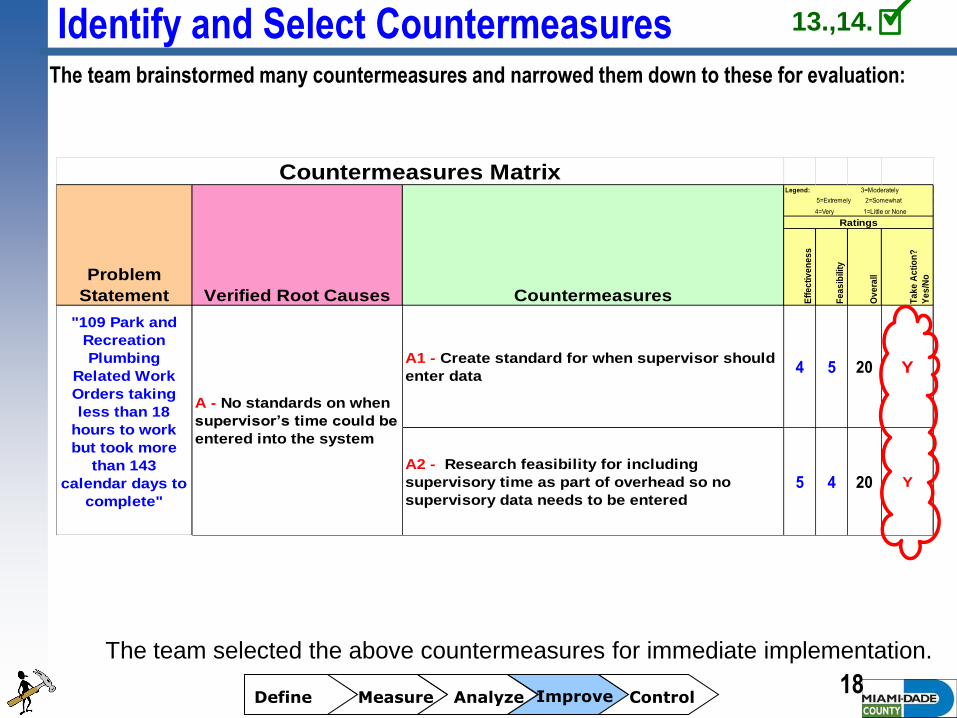
A1 - Create standard for when supervisor should
enter data4 5 20 Y
A2 - Research feasibility for including
supervisory time as part of overhead so no
supervisory data needs to be entered
5 4 20 Y
"109 Park and
Recreation
Plumbing
Related Work
Orders taking
less than 18
hours to work
but took more
than 143
calendar days to
complete"
A - No standards on when
supervisor’s time could be
entered into the system
Countermeasures Matrix
Problem
Statement Verified Root Causes Countermeasures
Legend: 3=Moderately
5=Extremely 2=Somewhat
4=Very 1=Little or None
Ratings
Identify and Select Countermeasures
The team selected the above countermeasures for immediate implementation.
The team brainstormed many countermeasures and narrowed them down to these for evaluation:
18 Define Measure Analyze Improve Control
13.,14.

Refocusing the Analysis
Because of the data misrepresentation for the true
time for a crew to complete a job, the project team
decided to look at other process indicators as well.

20 Define Measure Analyze Improve Control
Refocusing the Analysis (cont)
After some deliberation, the team decided that the P2 indicator
(time from the “Shops Review and Assign to Trades” to when
the “Crew Begins Work”) consisted of reliable data and was a
good overall indicator for delays in work order completion.
DURATION
AJ AK
Date Day
% Mo Avg # of Days %Y
9.4 -2603.6 102.3 36.9 87.2 52.3 7.0 45.3 25.9
P1 P2 P3 P4 P1+P2+P3 Q2 Q3
9/6/12 Th 0 23 22 209 45 7 38 N
9/11/12 Tu 0 23 22 209 45 7 38 N
9/11/12 Tu 0 38 8 203 46 7 39 N
AM=
AF-AD
AN=
AH-AF
OUTCOMES
Finalized
(Complete)
AW='Y' if
AV<=0
AV=
AQ-AR
Date
Created
TO
Shops
Assigned
Work
Order
Cmpltd
On-Time?
# of Days
Work
Order
Cmpltd
Late
Begin
Labor
TO
End
Labor
AR
End
Labor
TO
Finalized
(Cmpl)
Shops
Assigned
TO
Begin
Labor
Estimated
Number of
Days to
Complete
AL=
AD-AB
AQ=
AJ-AB
Date
Created
TO
End Labor
AO=
AJ-AH

0%
10%
20%
30%
40%
50%
60%
70%
80%
90%
100%
Jan Feb Mar Apr May Jun Jul Aug Sep Oct Nov Dec
Pe
rce
nt
Star
ted
On
-Tim
e
Work Order Assigned Month (2012)
P2 - Parks Work Orders Started On-Time
Actual
Target
Review Selected Indicator
The data above is for work orders created in calendar year 2012
The team collected indicator data and reviewed performance trends:
21 Define Measure Analyze Improve Control
3.
GAPGOOD
Target = 90% within 7 calendar days
Monthly Avg

0
200
400
600
800
1000
1200
1400
1600
-5.5-0.54.59.514.519.524.529.534.539.544.549.554.559.564.569.574.579.584.589.594.599.5104.5109.5114.5119.5124.5129.5134.5139.5144.5149.5154.5159.5164.5169.5174.5179.5184.5189.5194.5199.5204.5209.5214.5219.5224.5229.5234.5239.5244.5249.5254.5259.5264.5269.5274.5279.5284.5289.5
Nu
mb
er
of
Wo
rk O
rde
rs
Days from Trades Assignment to Labor Beginning
P2 Data: Parks Work Orders Created in 2012with Dates for Shops Assigning Work & Labor Beginning
1370
656
270
168167122
7471635757584526222229222523106 20155 114 107 6 5 3 4 3 3
n = 3,487 (does not include 307 records under 0 days and 8 records with faulty Assigned Dates)
Additional Stratification of the Problem The team again stratified 2012 Work Order Data using a histogram and found…
22 The team looked closer at the 1,461 work orders that exceeded 10 days...
Define Measure Analyze Improve Control
1,461 work orders (38%)
took 10 or more days
before a crew began work

443
336
263
136
55 51 37 36 36 24 24 7 6 7
%
%
%
%
%%
%%
%%
% % % %
0
10
20
30
40
50
60
70
80
90
100
0
200
400
600
800
1000
1200
1400
% o
f To
tal
Nu
mb
er
of
Wo
rk O
rde
rs
Trade Category Assigned
Work Orders for 2012 Requiring 10 days or Morefrom Assignment to Labor Begin
n = 1461
Stratify the Problem (Continued) The team stratified those 1,461 work orders many ways and found…
23 Define Measure Analyze Improve Control
5.,6.,7.,8.
Problem Statement: "1,042 of Carpenter, Electrician, and Plumber Park and
Recreation Work Orders took more than 10 days for a crew to respond in 2012"
1,042 of the work orders
were from these 3 trades

Identify Potential Root Causes The team sampled 25 of the 1,042 Late Work Orders to help determine root cause analysis …
24 Define Measure Analyze Improve Control
9.
Single Case Bore Analysis
Problem Statement: "1,042 of Carpenter, Electrician, and Plumber Park and Recreation Work Orders took more
than 10 days for a crew to respond in 2012"
Reasons or Factors
(That possibly contributed to
delays for a Crew to respond )
Sampled 25 of the 1,042 Late Work Orders
92356
97769
94632
92405
99813
99859
100716
93768
95764
92526
96373
92147
100634
93727
95189
92929
93105
97438
93599
92072
96887
97802
97615
98389
91685
Tota
l
Perc
enta
geReasons or Factors
(That possibly contributed to
delays for a Crew to respond )
1) Too many higher priority WOs
(work requested not high priority)X X X X X X X X X X X X X X X 15 60%
2) Material/Parts Availablity
(Procurement Time)X X 2 8%
3) Required Welding (scarce
resources)X X 2 8%
4) Backlog of Sidewalk Requests X X 2 8%
5) Pool/Aquatics Closed at Time X X X X 4 16%
6) Inaccurate WO Request (initial
problem diagnosis incorrect)X 1 4%
7) Vendor Called to Perform Work X X 2 8%
8) Req'd Coordination with WASD
leak detectionX 1 4%
9) Potential Warranty Issue Delayed
Start of LaborX 1 4%
10) Unknown X X 2 8%
B
C
The team looked closer at the above factors; factor C was chosen because the team felt that
they could likely influence/control this factor more so than other similarly occurring factors.

Identify Potential Root Causes The team completed Cause and Effect Analysis and found…
The team next looked to verify these Potential Root Causes.
25 Define Measure Analyze Improve Control
9.,10.
"1,042 of
Carpenter,
Electrician, and
Plumber Park and
Recreation Work
Orders took more
than 10 days for a
crew to respond in
2012"
Problem
Statement
Fishbone
Cause and
Effect Diagram
= Potential Root
Cause
Trades performing work that could be done
by field/operations
A- Trades working on too many
other higher priority WOs (60%)
Insufficient training of field ops
personnel (to perform basic jobs)
B- Pool/Aquatics Closed (16%)
B
C- Material/Parts Availability
(8%)
No systematic standard for
prioritization or tracking emergencies
No AVLs in vehicles or GPS scheduling of
resources
C
Insufficient documentation/stds
on what jobs ops can/can’t do
Inadequate mgmt information
available from system
Insufficient Preventative
Maintenance being performed
Work to be done is not always clearly
described/communicated or
understood by Trades
Trades don’t always have right equipment/
materials
A
D

Verify Root Causes The team collected data to verify the root causes and found….
26
…all were validated as root causes.
Define Measure Analyze Improve Control
11.,12.
A Insufficient documentation/stds on
what jobs operations personnel
can/can’t do
Root
Cause
B Insufficient training of field
operations personnel (to perform
basic jobs)
Root
Cause
C No systematic standard for
prioritization or tracking
emergencies
Root
Cause
D Work to be done is not always
clearly described/communicated or
understood by Trades
Root
Cause
Reviewed work orders - no priority
field exists or is being used. There
is no ability for the system to sort or
isolate by priority.At least one work order in the
sample was inaccurate due to poor
description or commnication.
Root Cause Verification Matrix
Potential Root Cause How Verified?Root Cause
or Symptom
Reviewed standards and found
some work that op's may be able to
perform (e.g. some basic plumbing
jobs not listed on standards)
Work orders found where staff has
created unnecessary work orders;
knowledge level of ops staff varies
throughout the workforce.

Identify and Select Countermeasures
The team selected several countermeasures for immediate implementation.
The team brainstormed many countermeasures and narrowed them down to these for evaluation:
27 Define Measure Analyze Improve Control
13.,14.
Eff
ec
tiv
en
es
s
Fe
as
ibilit
y
Ov
era
ll
Ta
ke
Ac
tio
n?
Ye
s/N
o
A1 - Review current documentation and
standards and identify shortcomings3 5 15 Y
A2 - Enhance current documentation and
standards for jobs to be performed by op's3 4 12 Y
B1 - Review existing training materials/approach 3 5 15 Y
B2 - Develop and write up enhancements to
training3 4 12 Y
B3 - Deliver enhanced training to operations staff 3 4 12 Y
C - No systematic
standard for prioritization
including tracking
emergencies
C1- Develop & Implement priority ranking system
(e.g. 1-Emerg, 2-Important, etc.)4 3 12 Y
D1- Develop and implement plan to use
photographs with certain (e.g. emergency) work
orders
3 4 12 Y
D2 - Train operations personnel to improve work
order information (in coordination with B2)3 4 12 Y
D3- Evaluate expanded use of photographs for
work orders3 3 9 Later
Countermeasures Matrix
Problem
Statement Verified Root Causes Countermeasures
Legend: 3=Moderately
5=Extremely 2=Somewhat
4=Very 1=Little or None
Ratings
"1,042 of
Carpenter,
Electrician, and
Plumber Park
and Recreation
Work Orders
took more than
10 days for a
crew to respond
in 2012"
A - Insufficient
documentation/stds on
what jobs operations
personnel can/can’t do
B - Insufficient training of
field operations personnel
(to perform basic jobs)
D - Work to be done is not
always clearly
described/communicated
or understood by Trades

Identify Barriers and Aids
The team next sought to incorporate this analysis into the team’s Action Plan.
The team performed Barriers and Aids analysis on the selected Countermeasures.
28 Define Measure Analyze Improve Control
15.
Impact (H, M, L)
M 1) Will require coordination of
limited resources (staff)
(Supported by Aid: A, B, C)
A) Strong management support and
commitment
M 2) Will require some level of
culture change
(Supported by Aid: A & B)
B) All levels throughout dept share
strong camaraderie and desire for
Project Benefits
C) Many of the Countermeasures are
not costly and can be done in-
house
H 3) Any database modifications
could be costly or unfeasible
(Supported by Aid: A)
Countermeasure(s): Implement 8 Countermeasues to Improve Timeliness of Work Orders
Barriers Aids
Forces against Implementation Forces For Implementation

Develop and Implement Action Plan Legend:
= Actual
= Proposed
The team implemented an Action Plan for the team’s Countermeasures.
29 Define Measure Analyze Improve Control
16.
2014
Jun Jul Aug Sep Oct Nov Dec Jan
Develop Countermeasures:
A1 - Review current documentation and standards and identify
shortcomings Maint Div
A2 - Enhance current documentation and standards for jobs to
be performed by op's Maint Div
B1 - Review existing training materials/approach Maint/Ops
Div
B2 - Develop and write up enhancements to training Maint/Ops
Div
B3 - Deliver enhanced training to operations staffMaint/Trg
C1 - Develop & Implement priority ranking system (e.g. 1-Emerg,
2-Important, etc.)Project
Team
D1 - Develop and implement plan to use photographs with
certain (e.g. emergency) work ordersMaint/Ops
Div
D2 - Train operations personnel to improve work order
information (in coordination with B2) Maint/Trg
D3 - Evaluate expanded use of photographs for work orders ?
2. Secure Management Approval of Countermeasures (share
benefits and cost savings)
Team
3. Communicate/Train Parks Staff in Countermeasures and
related policies/procedures (share benefits and cost
savings)
Team
4. Implement Countermeasures and Pilot Countermeasures Team
5. Review Pilot and determine Benefits and adjust as
necessary and present results to management
Team
6. Establish On-going responsibilities and standardize
countermeasures into operations
Process
Owner
WHAT: Implement Countermeasures to Reduce Time to Complete Parks Work Orders
HOW WHO
WHEN
1.
2013
7/23/13
9/6/13
12/13/13
On-going
8/6/13
8/9/13
10/2/13
8/2/13
8/23/13
9/20/13
8/30/13
7/31/13
8/23/13
12/6/13

0%
10%
20%
30%
40%
50%
60%
70%
80%
90%
100%
Mar '1
3
Ap
r '13
May '1
3
Jun
'13
Jul '1
3
Au
g '13
Sep
'13
Oct '1
3
No
v '13
De
c '13
Pe
rce
nt
Star
ted
On
-Tim
e
Work Order Assigned Month
P2 - Parks Work Orders Started On-Time
Actual
Target
Review Results
The team was encouraged by the results and will continue to monitor the countermeasures
The team collected indicator data and reviewed results of its countermeasures:
30
3.
GAPGOOD
Target = 90% within 7 days
Monthly Avg
Define Measure Analyze Improve Control
Countermeasures implemented by Oct. 2013
WHO
STEP
CUSTOMER(INTERNAL / EXTERNAL)
FACILITIES MAINT DIV MGMT/CHIEF
NEED
Complete Parks and Recreation Repair Orders
DMAIC_Story_Miami Dade_Complete P&R Repair Orders_Proposed_Flow_7-11-13.vsd 7/11/13
3RD
PARTIES (VENDORS,
DEPTS .)
Need Park Maintained
Parks Maintained
MAINTAINED
PERFORM
MAINTENANCE WORKER
P5 - Lost worker hours associated with
equipment / supplies, maintenance problems
P6 - # of exceptions found
Q1% customer satisfaction with maintenance (safety, cleanliness, stocked, usable)
Q2 Number of days work orders completed late
Q5
Q4 Lost activity hours
CONTACT
RECEIVE/PRIORITIZE/MONITOR/SELECT
ASSIGN
SECURE/INSPECT
All OK?
· Contact Approp Parties & Resolve
· Adjust Schd As Reqd
· Perform Maintenance Activities As Scheduled
RESOLVE/CONTACT
ADJUST
· Correct If Possible
· Doc Exception
OK w/o new Wrk Ordr?
· Wrkr Provides Wrk Order Info To Supv
All Actvties Cmpld?
CORRECT/DOC
PROVIDES
RETURN / READY
DISCUSS
YES
NO
NO
YES
NO
NO
NO
YES
YES
YES
YES
NO
(Process Owner: Jorge Mora )
Q3 % of work orders completed on-time
P1 - # of days for shops to review/assign
(from WO Creation)
P2 - # of days for crews to begin work
(from shop review/assigning)
P3 - # of days for crews to finish work
(from beginning of work)
P4 - # of days for completing system data
entry & closing WO (from finish of work)
Document/Photograph
Need
% maintenance budget variance
· Discuss Activity Lessons Learned To Apply To Future Plan/Schd
· Rtn/Ready Equip For Next Use
Actvty w/o Excpn?
Wkr Can Handle?
· Resolve With Approp. Parties
· Contact Supvr.
· Workers Secure Equipment For Maintenance Activities· Inspect And Ensure Equipment And Supplies Are Sufficient
· Assign / Train Workers In Repair Order Specifics
Ready To Work?
· Receive New Repair Orders· Prioritize And Enter Code In EAMS· Monitor Field Conditions And Resources· Select Next Repair Order(s) To Work
On Ops List?
YES
Perform Work
NO
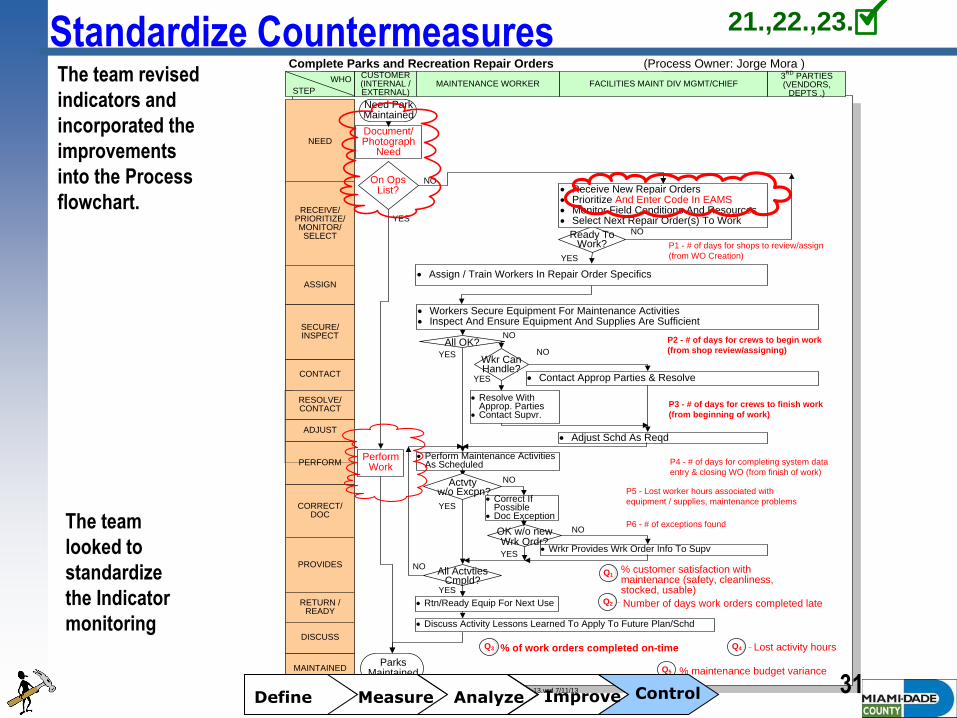
Standardize Countermeasures The team revised
indicators and
incorporated the
improvements
into the Process
flowchart.
The team
looked to
standardize
the Indicator
monitoring
31 Define Measure Analyze Improve Control
21.,22.,23.

1) The current work order system is used primarily to allocate costs to the
appropriate work order (asset) and is weak in providing useful
management tracking information
2) The current work order system has the capacity, with perhaps minor
modification, to provide management tracking information if appropriate
standards are developed and implemented
3) Graphs (Paretos, Histograms, etc.) are powerful analysis tools and were
very helpful to the team in analyzing the data
4) Identifying Root Cause(s) examining the data using the tools and
techniques is better that guessing at what you think are the causes
5) The Single Case Bore was useful in validating (and invalidating) initial
assumptions
Identify Lessons Learned Lessons Learned
32
Next Steps
1) Continue to monitor the countermeasures and performance results.
Define Measure Analyze Improve Control
24.,25.

Appendix –SIPOC Analysis (support for slide 7)
33
Note: See next Appendix Page for derived Indicators from SIPOC Outputs
Date Approved:
Suppliers Inputs Process Outputs* Customers
Operations Broken item Work Orders
Fac. Maint Div? Maintenance Reqm't
Facility
Maintenance
Operations Workorder
Crew Task
Assignment Crew
Fac. Maint Div?
Facility Maint Div Work Assignment
Completed Work
Order Faciltiy Maint
Operations
Faciltiy Maint
Work Crew Completed Work Order
Closed Out Work
Order Operations
Repaired item Public
S.I.P.O.C. AnalysisProcess: Parks and Recreation Repair & Maintenance Work Orders
Process Owner: George N?
1. Identify need for repair or maintentance
2. Prepare & submit Work Order
3. Evaluate and Prioritize Work Order
7. Verify Work Completed & Close Out Work Order
* Outputs used to Identify Outcomes
6. Perform Work
5. Assign Work to Crew
OK to assign?
Yes
No4. Hold/Resolve
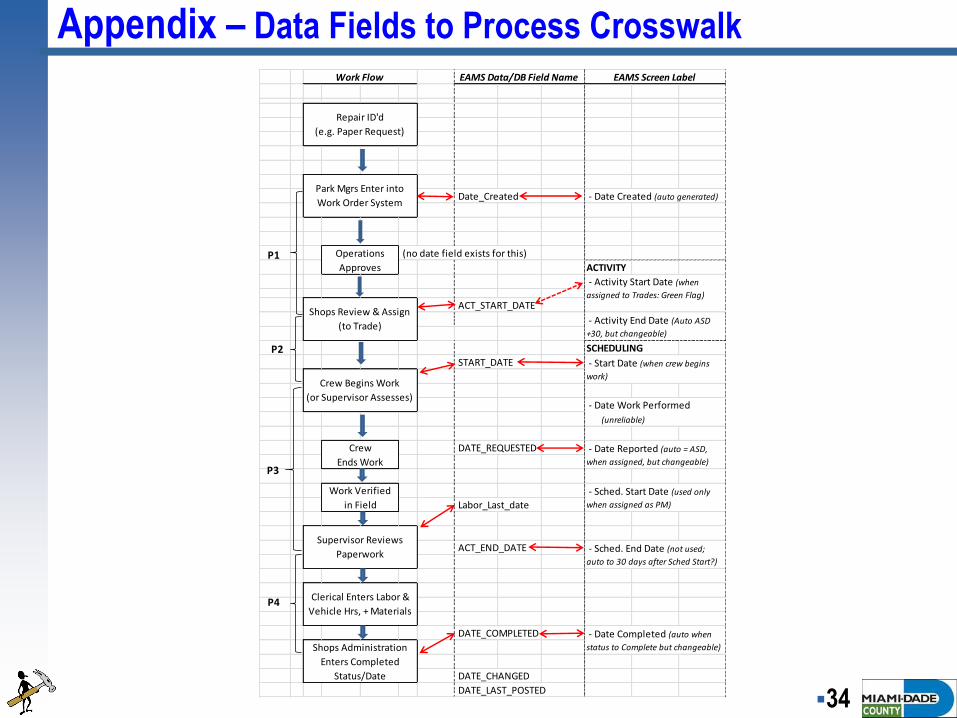
Appendix – Data Fields to Process Crosswalk
34
Date_Created - Date Created (auto generated)
(no date field exists for this)
ACTIVITY
ACT_START_DATE
SCHEDULING
START_DATE
DATE_REQUESTED
Labor_Last_date
ACT_END_DATE
DATE_COMPLETED
DATE_CHANGED
DATE_LAST_POSTED
Operations
Approves
Work Flow EAMS Data/DB Field Name EAMS Screen Label
Repair ID'd
(e.g. Paper Request)
Park Mgrs Enter into
Work Order System
- Activity Start Date (when
assigned to Trades: Green Flag)
Shops Review & Assign
(to Trade) - Activity End Date (Auto ASD
+30, but changeable)
- Start Date (when crew begins
work)Crew Begins Work
(or Supervisor Assesses) - Date Work Performed
(unreliable)
Clerical Enters Labor &
Vehicle Hrs, + Materials
- Date Completed (auto when
status to Complete but changeable)Shops Administration
Enters Completed
Status/Date
Crew
Ends Work
- Date Reported (auto = ASD,
when assigned, but changeable)
Work Verified
in Field
- Sched. Start Date (used only
when assigned as PM)
Supervisor Reviews
Paperwork - Sched. End Date (not used;
auto to 30 days after Sched Start?)
P2
P1
P3
P4