Six Sigma
40
PS&J Software Six Sigma PS&J Software Six Sigma Six Sigma & Software Process Improvement Six Sigma & Software Process Improvement Washington DC SPIN Wednesday, March 3, 2004 Steve Janiszewski PS&J Software Six Sigma
-
Upload
sixsigmacentral -
Category
Documents
-
view
577 -
download
0
description
Transcript of Six Sigma

PS&J Software Six SigmaPS&J Software Six Sigma
Six Sigma & Software Process Improvement
Six Sigma & Software Process Improvement
Washington DC SPIN
Wednesday, March 3, 2004
Steve Janiszewski
PS&J Software Six Sigma

PS&J Software Six Sigma
Copyright © 2004, PS&J Software Six SigmaAll rights reserved.
2
March 3, 2004
CMM ShortcomingsCMM Shortcomings
• Many organizations take years to move from level to levelbecause the CMM does not identify a specific process andbecause it does not provide much guidance on improvementmethods
• Many more organizations fail to progress at all or drop back alevel within six months of an assessment
• Many organizations don’t understand how to define anefficient process and they implement processes that are CMMlevel 2 or level 3 compliant, but that actually add overheadwithout improving productivity, predictability, and productquality
• Because level 3 was the minimum level required for Americanmilitary contracts, many organizations think that level 3 is“good enough”. Level 3 requires most of the investment, butmost of the benefits accrue at levels 4 and 5!
• Many organizations get no improvement at all because thedevelopers don’t actually use the new processes!

PS&J Software Six Sigma
Copyright © 2004, PS&J Software Six SigmaAll rights reserved.
3
March 3, 2004
Measurements, Goals, & ManagementMeasurements, Goals, & Management
• Measurements– If we can’t measure a process, we cannot manage it much less
systematically improve it.– If we do not actively manage a process, it’s performance is a matter of
chance• Goals must be stated in terms of measurable quantities if we hope to
achieve them
InspectionProcess Goals
InspectionProcess Goals

PS&J Software Six Sigma
Copyright © 2004, PS&J Software Six SigmaAll rights reserved.
4
March 3, 2004
Six Sigma Starts with Business ResultsSix Sigma Starts with Business Results
• Six Sigma is a metrics driven approach to continuousimprovement that starts with quantitative business goalsproviding direct value to the customer
• Data analysis is used to identify specific processes with thegreatest leverage on these goals
• Critical inputs affecting process performance are identified
• Goals are related to changes in process outputs
• Improvements are implemented on a pilot basis
• If measurements indicate goals have been achieved,improvements are institutionalized
• Process performance is controlled to the new levels bycontrolling critical inputs
What are you going to tell your new boss when he asks you to quantify the return on your SPI activities?
What are you going to tell your new boss when he asks you to quantify the return on your SPI activities?

PS&J Software Six Sigma
Copyright © 2004, PS&J Software Six SigmaAll rights reserved.
5
March 3, 2004
One definition of insanity: doing the same thingover and over and expecting a different result
One definition of insanity: doing the same thingover and over and expecting a different result
Why Apply Six Sigma to SPI?Why Apply Six Sigma to SPI?• In order to meet business needs, one cannot simply try
harder. One must significantly change the developers’ dailyactivities– involves a level of risk that many organizations are unwilling to
accept
• With conventional SPI, it is easy to fall into the trap of laying aveneer of process over the same old activities– flows from a desire to hit CMM level goals while causing as little
disruption to daily routine as possible– often adds overhead while resulting in no significant
improvements– can destroying credibility of SPI initiative with the developers
• Six Sigma increases the likelihood of success– providing visible linkage to business goals makes sustainable
executive sponsorship more likely– emphasis on measurement makes significant changes in
organization behavior more likely

PS&J Software Six Sigma
Copyright © 2004, PS&J Software Six SigmaAll rights reserved.
6
March 3, 2004
“Six Sigma”“Six Sigma”
• The phrase “Six Sigma” is frequently used with three differentbut related meanings
• In the narrowest sense, Six Sigma is used as a measurementof product quality– A Six Sigma quality level means that products have less than 3.4
defects per million opportunities, i.e. the product is 99.9997%error-free
• By extension, a process capable of producing products at SixSigma quality levels is referred to as a Six Sigma Process– typical software processes operate at between 2.3 and 3.0 sigma– the best software processes operate at 4 - 5 sigma although they
exhibit all the characteristics of a typical 6 sigma process
• In the broadest sense Six Sigma is– the application of DMAIC as a continuous improvement method,– in conjunction with a more or less standard toolkit of statistical
analysis methods,– with the object of producing and managing Six Sigma processes

PS&J Software Six Sigma
Copyright © 2004, PS&J Software Six SigmaAll rights reserved.
7
March 3, 2004
DMAICThe Six Sigma Continuous Improvement Cycle
• Define the process
• Measure the process
• Analyze the process to identify causal variables
• Improve the process– Modify the process– Measure the modified process– Verify the improvement– Define control mechanism
• Control the process to new performance levels– Monitor performance metrics and take designated action when
required– Perform continuous verification of the stability and capability
of the process

PS&J Software Six Sigma
Copyright © 2004, PS&J Software Six SigmaAll rights reserved.
8
March 3, 2004
DMAIC vs. IdealDMAIC vs. Ideal
IDEALSM MODEL
Define
Measure
Analyze
Control Improve
DMAIC MODEL
Define
Measure Analyze
Improve
• IDEAL cycles are long - sometimes up to two years• IDEAL explicitly includes establishing sponsorship - DMAIC occurs in the
context of a top down Six Sigma initiative with strong executive sponsorship• DMAIC places much more emphasis on measurements and includes a control
phase that is largely absent from IDEAL• Either model can be used for CMM based improvement but DMAIC is more
likely to yield measurable economic benefits
SetContext
Build
Sponsorship
Charter
Infrastructure
CharacterizeCurrent &Desired States
DevelopRecommendations
SetPriorities Develop
Approach
PlanActions
CreateSolution
Pilot/TestSolution
RefineSolution
ImplementSolution
AnalyzeandValidate
Propose
Future
Actions
Initiating
Diagnosing
Acting
Learning

PS&J Software Six Sigma
Copyright © 2004, PS&J Software Six SigmaAll rights reserved.
9
March 3, 2004
A Control System ViewpointA Control System Viewpoint
• Process outputs, y, are a function, f, of a set of controllable inputvariables, x, and process noise ε:– y = f(x) + ε– The y’s are not directly controllable, but they can be controlled by controlling
the x’s.– Statistical measurements are necessary to avoid re-acting to the noise ε
• Six Sigma techniques are used to develop a process model, identify thecontrol variables xC, and drive performance to targeted values yT, byactively controlling the inputs xC:
x yf
ε
+
xCyTf
ε
+

PS&J Software Six Sigma
Copyright © 2004, PS&J Software Six SigmaAll rights reserved.
10
March 3, 2004
A Control System Viewpoint - Closing the LoopA Control System Viewpoint - Closing the Loop
• For a software project, y’s include cost and schedule and x’sinclude product quality and time on task.
• A software process should a responsive, “closed loop” systemthat is controlled to achieve project goals
Closed loop processes are the differencebetween tracking and managing
Closed loop processes are the differencebetween tracking and managing
xCyTf
ε
+
h

PS&J Software Six Sigma
Copyright © 2004, PS&J Software Six SigmaAll rights reserved.
11
March 3, 2004
Six Sigma Software Process CharacteristicsSix Sigma Software Process Characteristics
• Accurate project planning based on historical data andaccurate project tracking that enables timely and effectivecorrective actions by management
• Application of statistical tools to trustworthy process andproduct metrics to support real time decision making usingquantitative phase exit criteria
• Quantitative management of product quality– allowing delivery of very high quality product (very few latent
defects)– reducing time spent in integration and test thereby cutting overall
cost and cycle time– making the software development process more repeatable and
predictable
• Closed loop process management and improvement• Quantifiable SPI benefits
Sounds a lot like CMM Level 5Sounds a lot like CMM Level 5

PS&J Software Six Sigma
Copyright © 2004, PS&J Software Six SigmaAll rights reserved.
12
March 3, 2004
CMM Levels – A Six Sigma PerspectiveCMM Levels – A Six Sigma Perspective
• From a business perspective, predictableprocess performance is a key aspect ofprocess capability– Predictable performance requires a stable
process
– First step to a stable process is a “definedprocess”
• Moving up the CMM levels requires– first stabilizing the overall process,
– centering on estimated performance,
– reducing variation,
– continuously improving the process byimproving centering & variation
• The same cycle can be applied to anylow level process at any CMM level
Estimate
5
Estimate4
Estimate3
Estimate2
Estimate1
SCHEDULE/COST/QUALITY

PS&J Software Six Sigma
Copyright © 2004, PS&J Software Six SigmaAll rights reserved.
13
March 3, 2004
Driving Model Based SPI With Six SigmaDriving Model Based SPI With Six Sigma
• Six Sigma methodology can be used to drive CMM or CMMI basedSPI in a bottoms-up fashion
• Emphasis on direct coupling to business results and measurableimprovements– allows easy quantification SPI ROI– moves organization away from level oriented goals – levels become a
by-product of SPI, not the primary goal of SPI– sustains executive sponsorship
• More likely to result in measurable improvements than top downprocess deployment driven by level goals– Apply DMAIC to one or two processes at a time as part of an SPI
action plan - doesn’t necessarily imply SPC– Use process metrics to access success in achieving business goals
in order to quantify process effectiveness– Track SPI ROI
• Objective measurements are required to successfully manage aprocess - a process that is not managed is unlikely to performwell– Fits particularly well with CMMI’s new measurement PA

PS&J Software Six Sigma
Copyright © 2004, PS&J Software Six SigmaAll rights reserved.
14
March 3, 2004
Example: DMAIC Without SPCExample: DMAIC Without SPC
• Managing Integration & Testmeans managing defects
• Defect-prone modules can beidentified by keeping a list ofmodules ranked by defect count– Consider pulling them from the
link and performing acomprehensive inspection
– If warranted, scrap and re-work
• Perform immediate root cause analysis on integration defects– opportunity for high value process improvements– escapes tend to occur in clusters, so find as many as possible with a
single test failure– Root cause analysis starts with the author identifying
� the mechanism by which the defect escaped earlier process steps� and the other modules that could have similar defects
• Defects in legacy code may warrant an automated search or aninspection targeting specific defect types
De fe cts Pe r M od ule Pare to Analysis
0
10
20
30
40
50
60
70
80
90
100
1 36
71
10
61
41
17
62
11
24
62
81
31
6
35
13
86
42
14
56
49
15
26
56
15
96
63
16
66
70
17
36
77
18
06
84
18
76
91
19
46
98
11
01
61
05
11
08
61
12
1
M odu le ID
De
fec
ts
0
1000
2000
3000
4000
5000
6000
Cu
mu
lati
v
70% defects in 20% modules50% defects in 10% modules
De fe cts Pe r M od ule Pare to Analysis
0102030405060708090100
36
71
10
61
41
17
62
11
24
62
81
31
6
35
13
86
42
14
56
49
15
26
56
15
96
63
16
66
70
17
36
77
18
06
84
18
76
91
19
46
98
11
01
61
05
11
08
61
12
1
M odu le ID
ef e
ct s
0100020003000400050006000
Cu
mu
lati
v
70% defects in 20% modules50% defects in 10% modules

PS&J Software Six Sigma
Copyright © 2004, PS&J Software Six SigmaAll rights reserved.
15
March 3, 2004
Level 1 - Initial
Level 2 - Repeatable
Level 3 - Defined
Level 4 - Managed
Level 5 - Optimizing
Organization
Project 1
Project 2
Project 3
Project N
…
• Processes at the lower levelsprovide the foundation forprocesses at the higher levels
• Success at the lower levelsprepares the organization toaccept the changes required at thehigher levels
• Most of the organization’s projectsmove forward more or less inparallel one level at a time
• The main drawback isorganizational inertia – it canliterally take years to move a level
Staged RepresentationStaged Representation

PS&J Software Six Sigma
Copyright © 2004, PS&J Software Six SigmaAll rights reserved.
16
March 3, 2004
Level 1 - Initial
Level 2 - Repeatable
Level 3 - Defined
Level 4 - Managed
Level 5 - Optimizing
Process 1
Process 2
Process 3
Process N
…
Continuous RepresentationContinuous Representation
• Six Sigma is used to deployprocesses with managed andoptimizing characteristics ateach individual CMMI level
• Selection is guided by businessvalue and CMMI level
• Measurable successes are usedto pull through the next round ofprocess improvements
• Number of processes operatingwith managed and optimizingcharacteristics grows asorganization moves from level 1to level 3
• Organization moves from level 3to level 5 very quickly

PS&J Software Six Sigma
Copyright © 2004, PS&J Software Six SigmaAll rights reserved.
17
March 3, 2004
Some Common MisconceptionsSome Common Misconceptions
• Many organizations put off getting involved with six sigma untilthey are CMM level 3– Don’t realize that Six Sigma as a continuous improvement
methodology is applicable to any process element at any CMM leveland they wait till they are ready to go to level 4 before they evenconsider Six Sigma
– Miss opportunity to make their CMM effort more likely to succeedand to achieve measurable business results
• Some organizations attempt to provide the same Six Sigmatraining to everyone resulting in sending software engineers totraining courses appropriate for manufacturing
• Other organizations have heard about good experiences withSix Sigma in operations or services, but know that softwaredevelopment is not like manufacturing. So they assume that SixSigma is not applicable because “software is different”– The detailed application of Six Sigma to software is significantly
different, but the principles and results are very similar

PS&J Software Six Sigma
Copyright © 2004, PS&J Software Six SigmaAll rights reserved.
18
March 3, 2004
Software is different!Software is different!
• Process variation can never be eliminated or even reducedbelow a moderate level– No two modules are alike so process performance always
includes an intrinsic degree of variability– There are very large differences in skills & experience from one
developer to another that cause dramatic differences in processperformance
• Specifications are not based around tolerances– Systems don’t fail because they are assembled from many
loosely toleranced components– A single well-placed defect in a low level component can be
catastrophic– Concept of quadratic loss function has less applicability because
the true goal is no “serious” defects

PS&J Software Six Sigma
Copyright © 2004, PS&J Software Six SigmaAll rights reserved.
19
March 3, 2004
Software is different!Software is different!
• Rolled Throughput Yield is not useful a concept for softwaredevelopment
• Measurement System Evaluation (MSE) has limitedapplicability
• It is frequently very hard to perform designed experiments, soregression analysis of available data is relative more commonthan DOE
• Early defect removal is just as important as defect prevention– Certain classes of defects can be prevented– The application of Six Sigma to software development
emphasizes defect containment & early removal as well asprevention

PS&J Software Six Sigma
Copyright © 2004, PS&J Software Six SigmaAll rights reserved.
20
March 3, 2004
Software Processes Are Different Too!Software Processes Are Different Too!
• Individual low level software processes are generally muchsimpler than manufacturing processes– They have fewer steps - typically under 10– They are dependent on far fewer variables
� There are no material factors� Environmental factors like temperature & humidity are generally not
important
• Low level software processes are pretty much the sameacross the industry– They are not proprietary like manufacturing processes– They are frequently published with extensive supporting
performance data– They are largely independent of the specific module under
development

PS&J Software Six Sigma
Copyright © 2004, PS&J Software Six SigmaAll rights reserved.
21
March 3, 2004
But software is measurable & controllable!But software is measurable & controllable!
• Software development processes can be fully characterizedby just three simple measurements time, size, and defects
• Statistical analysis techniques can be applied to softwaremeasurements provided:– Data is complete, consistent, and accurate– Data from individuals with widely varying skill levels is not mixed
• Metrics need to be put into a statistical context before beingused to make decisions
• Software process performance can be managed usingstatistical process control
Six Sigma is applicable and has the potential for dramatic performance improvements
Six Sigma is applicable and has the potential for dramatic performance improvements

PS&J Software Six Sigma
Copyright © 2004, PS&J Software Six SigmaAll rights reserved.
22
March 3, 2004
Making Effective ImprovementsMaking Effective Improvements
• Data driven continuous improvement requires the activeparticipation of each software developer– managers and support staff cannot improve productivity & product
quality because they don’t develop the products– making an improvement requires changing current practice,
something only developers can do� “improvements” that don’t significantly change what the developers do at
their desks are likely to be marginal or counterproductive– metrics are not likely to be collected for long or very consistent unless
the people collecting them use the metrics and see their value• To be successful at continuous improvement, developers must
– be trained to understand the value of process, how to collect and usemetrics, and how to make and measure improvements� Six Sigma uses “green belt” & “black belt” training
– understand the mechanisms that make processes effective– be given quantitative improvement goals and motivated to meet them– be given the time to analyze the data and make improvements (post
mortem phase)

PS&J Software Six Sigma
Copyright © 2004, PS&J Software Six SigmaAll rights reserved.
23
March 3, 2004
• Process Maps• Descriptive Statistics• Statistical Process Control (SPC)• Measurement System Evaluation
(MSE)
• Failure Mode Effects Analysis(FMEA)
• Root Cause Corrective Action(RCCA)
• Statistical Process Control (SPC)• Regression Analysis• Analysis of Variance (ANOVA)• Design Of Experiments (DOE)
• Statistical Process Control (SPC)
Analyze
Define &
Measure
Improve&
Control
Using the Six Sigma ToolkitUsing the Six Sigma Toolkit
)(xfy =
Possible Possible x’sx’s
ActualActual x’s x’s
KeyKey x’s x’sSix Sigma Toolkit is a more or lessstandard set of statistical tool for dataanalysis and modeling

PS&J Software Six Sigma
Copyright © 2004, PS&J Software Six SigmaAll rights reserved.
24
March 3, 2004
Software Six Sigma Measurement FrameworkSoftware Six Sigma Measurement Framework
• In order to address the typical business goals: costs, cycletime, product quality, predictability, Software Six Sigma usesa simple measurement framework that fully characterizessoftware development processes with three simplemeasurements– Time: the time required to perform an activity– Defects: the number & type of defects, fix time, point of injection,
point of removal, and a description adequate for root causeanalysis or creation of a checklist question
– Size: the size of the work product produced• Time & defect metrics are collected in-process• Size metrics are collected during task post mortem• In general, there are far fewer variables that affect a software
development process than a manufacturing process– No issues with variables like raw materials, temperature,
humidity, curing time, measurement tolerances, etc.

PS&J Software Six Sigma
Copyright © 2004, PS&J Software Six SigmaAll rights reserved.
25
March 3, 2004
Operational DefinitionsOperational Definitions
• An operational definition is a precise description of how tomeasure a data item– It defines the data and provides a clear procedure for measuring the
data• The goal of an operational definition is to make sure all data
collectors measure a characteristic in the same way– Removes ambiguity– Reduces variation in measurements
• A Six Sigma approach should use very precise operationaldefinitions for size, time, and defects and provide an automatedmeans to support complete consistent data collection
• Example: Time measurement– Record the time (M/D/Y H:M) when you begin or resume the activity as
the start time– Record the activity phase. Note any comments– When you complete the phase or are interrupted record the stop time– Elapsed time is the difference between stop and start times in minutes

PS&J Software Six Sigma
Copyright © 2004, PS&J Software Six SigmaAll rights reserved.
26
March 3, 2004
Structuring Tasks for Measurement Structuring Tasks for Measurement
• Tasks transform inputs to outputs• In Six Sigma, tasks should always begin with a planning
phase and end with a postmortem phase– Beginning planning requires meeting task entry criteria– Completing postmortem requires meeting task exit criteria– Planning sets up expected process performance and product
quality targets that serve as exit criteria• In between planning & postmortem is development
– Consists of at least one production phase & one appraisal phase• Since human beings are involved
– production brings with it defect injection– appraisal carries with it the opportunity for defect removal
InputsTask
OutputPlanning(entry criteria) Production
(defect injection)Appraisal(defect removal)
Postmortem(exit criteria)
Development

PS&J Software Six Sigma
Copyright © 2004, PS&J Software Six SigmaAll rights reserved.
27
March 3, 2004
Process Performance ModelsProcess Performance Models
• In order to understand the relationship between cost andquality, we can begin by modeling the economics of thesoftware development process
• Starts with quantitative business goals providing direct valueto the customer– Frequently they are on-time delivery, cost, cycle time, and
product quality• In order to understand where and how to improve, one needs
to understand how the development process x’s drive theseprocess y’s– Costs are driven by productivity, product quality, and time on
task– Cycle time is driven by cost and time on task– Predictability is driven by product quality

PS&J Software Six Sigma
Copyright © 2004, PS&J Software Six SigmaAll rights reserved.
28
March 3, 2004
Six Sigma
“Hidden Factory”
DesignReview
Code CodeReview
Compile UnitTest
IntegrationDesign Use
SystemTest
ArchitectureReview
Requirements Review
ArchitectureAnalysis
Use
Development
SystemTest
Defects not recorded prior to system testYield = nsystem / ( nsystem + nescapes)
Software’s Hidden FactorySoftware’s Hidden Factory
True yield includes all defects injected in developmentYield = ndevelopment / (ndevelopment + nescapes)
Usually, the later a defect is removed, the higher its removal costs
PS&J Software Six Sigma
Copyright © 2004, PS&J Software Six SigmaAll rights reserved.
29
March 3, 2004
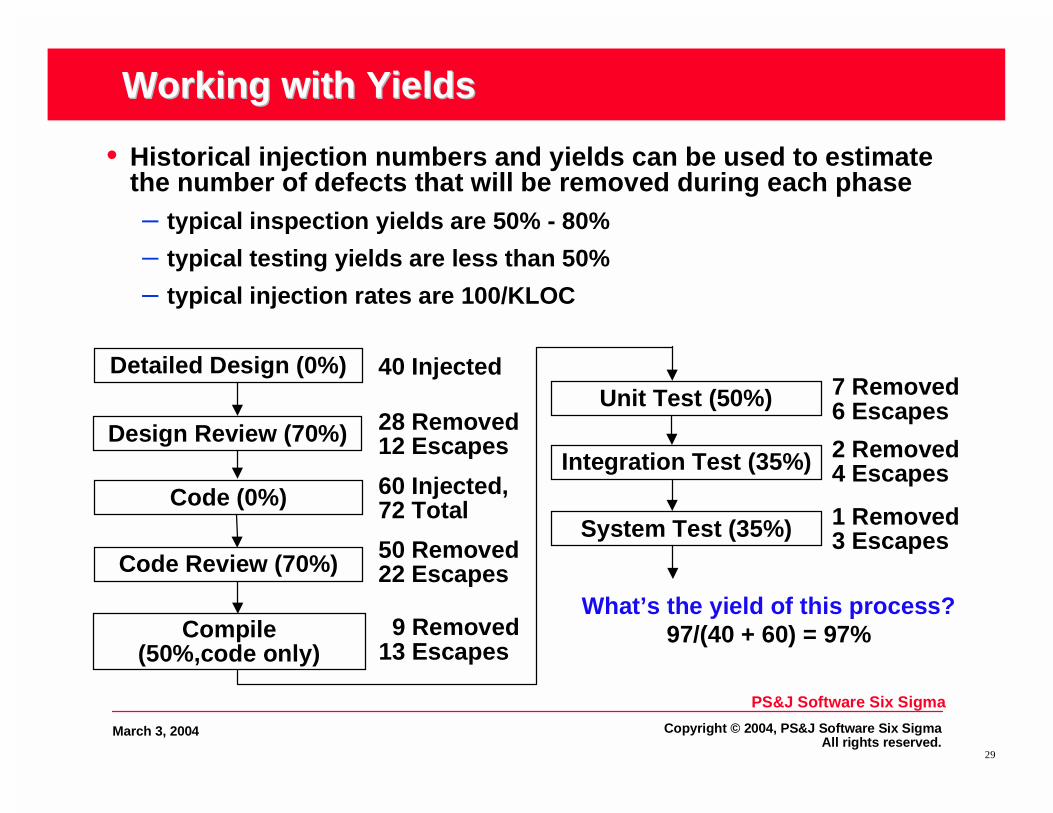
Working with YieldsWorking with Yields
• Historical injection numbers and yields can be used to estimatethe number of defects that will be removed during each phase– typical inspection yields are 50% - 80%
– typical testing yields are less than 50%
– typical injection rates are 100/KLOC
Code Review (70%)
Detailed Design (0%)
Design Review (70%)
Code (0%)
Unit Test (50%)
Compile(50%,code only)
40 Injected
28 Removed12 Escapes
60 Injected,72 Total
50 Removed22 Escapes
7 Removed6 Escapes
9 Removed13 Escapes
What’s the yield of this process?
Integration Test (35%)
System Test (35%)
2 Removed4 Escapes
1 Removed3 Escapes
97/(40 + 60) = 97%

PS&J Software Six Sigma
Copyright © 2004, PS&J Software Six SigmaAll rights reserved.
30
March 3, 2004
Inspections Phase Remaining Injected Present Yield Removed Cost/Defect Activity Cost Failure Cost Appraisal Cost
Design 0.0 30 30.0 0% 0.0 5 1000 0 Design Review 30.0 30.0 50% 15.0 5 75 300 Design Inspection 15.0 15.0 50% 7.5 10 75 900 Code 7.5 60 67.5 0% 0.0 1 1000 0 Code Review 67.5 67.5 70% 47.3 3 142 300 Compile 20.3 20.3 50% 10.1 1 10 Code Inspection 10.1 10.1 70% 7.1 5 35 900 Unit Test 3.0 3.0 50% 1.5 12 180 18 Integration 1.5 1.5 35% 0.5 300 180 159 System Test 1.0 1.0 35% 0.3 600 180 207 Customer Test 0.6 0.6 35% 0.2 1200 180 270 Total (minutes) 2720 992 2400
Total Cost (hrs) 102
Process Modeling & DesignProcess Modeling & Design
Xtreme Phase Remaining Injected Present Yield Removed Cost/Defect Activity Cost Failure Cost
Design/Code 0.0 100 100.0 50% 50.0 10 4000 500 Compile 50.0 50.0 50% 25.0 2 50 Unit Test 25.0 25.0 70% 17.5 24 360 420 Refactoring 7.5 10 17.5 0% 0.0 0 0 0 RegressionTest 17.5 17.5 50% 8.8 24 800 210 Integration 8.8 8.8 35% 3.1 600 180 1838 System Test 5.7 5.7 35% 2.0 1200 180 2389 Customer Test 3.7 3.7 35% 1.3 2400 180 3105 Total (minutes) 5700 8512
Total Cost (hrs) 237
Code & Test Phase Remaining Injected Present Yield Removed Cost/Defect Activity Cost Failure Cost
Design 0.0 40 40.0 0% 0.0 5 0 0 Design Review 40.0 40.0 0% 0.0 5 0 Design Inspection 40.0 40.0 0% 0.0 10 0 Code 40.0 60 100.0 0% 0.0 1 2000 0 Code Review 100.0 100.0 0% 0.0 3 0 Compile 100.0 100.0 50% 50.0 1 50 Code Inspection 50.0 50.0 0% 0.0 5 0 Unit Test 50.0 50.0 50% 25.0 12 180 300 Integration 25.0 25.0 35% 8.8 300 180 2625 System Test 16.3 16.3 35% 5.7 600 180 3413 Customer Test 10.6 10.6 35% 3.7 1200 180 4436 Total (minutes) 2720 10824
Grand Total (hrs) 226
IN OUT
Are the business goals achievable?
IN OUT

PS&J Software Six Sigma
Copyright © 2004, PS&J Software Six SigmaAll rights reserved.
31
March 3, 2004
Module S ize D istribution
0
10
20
30
40
50
60
70
80
0 15 30 45 60 75 90105120135150165180195
LOC S
Freq
uen
cy
• Most data tends to follow the normaldistribution or bell curve.
• The standard deviation (σ) measuresvariation present in the data
• For data that follows a normaldistribution– 99.99999975% of the data is within ± 6σ
VariationVariation
• The empirical rule allows us to treat non-normal data as if it werenormal for the purposes of statistical process control– 60%-75% of the data is within 1σ of the mean– 90%-98% of the data is within 2σ of the mean– 99%-100% of the data is within 3σ of mean
2)(1
1 ∑ −−
= avgxxn
σ 3σ 2σ 1σ xavg1σ 2σ 3σ
68.2%
95.4%99.7%
• ±3σ is natural limit of random data variation produced by a process

PS&J Software Six Sigma
Copyright © 2004, PS&J Software Six SigmaAll rights reserved.
32
March 3, 2004
Statistical ControlStatistical Control
• A process exhibits statistical control when a sequence ofmeasurements x1, x2, x3,…xn,… has a consistent and predictableamount of variation
• It is possible to model this pattern of variation with a stationaryprobability density function f(x)
• Can make statistically valid predictions about processes thatexhibits statistical control
• When the process does not exhibit statistical control, thedistribution function changes over time, destroying the ability tomake statistically valid predictions
• A stable well-defined process is a pre-requisite for statisticalcontrol
f(x)
σ….

PS&J Software Six Sigma
Copyright © 2004, PS&J Software Six SigmaAll rights reserved.
33
March 3, 2004
Special cause variation
Average
Time
x
- 3σ
+ 3σ
Commoncause
variation
Control ChartsControl Charts
• Common cause variation is normal random variation in processperformance– Don’t over-react to common cause variation– Reduction requires a process change
• Special cause variation represents an exception to the process– Actions to correct special cause variation must eliminate a specific
assignable cause– Special cause action eliminates a specific isolated event; does not
necessarily involve a process change
• Don’t take special cause action to deal with common causeproblem
• Control charts are agraphical depiction ofthe normal range ofvariation of a stableprocess

PS&J Software Six Sigma
Copyright © 2004, PS&J Software Six SigmaAll rights reserved.
34
March 3, 2004
Reading Reading XmR XmR ChartsCharts
Average
Time
x- 3σ
XX
+ 3σXX
Distribution ofindividual x’sControl
limits are theVoice of the
Process
USL
LSL
Specificationlimits are theVoice of theCustomer
• There are many types of control charts in the Six Sigma Toolkit• The XmR chart is most useful for software development• Consists of two charts: X & mR (moving Range of X)
– mR chart must be in control before you can interpret X chart– Sigma estimated from average moving range
• Special causes are indicated by points outside the control limits,runs of points to one side of the central line, and trends

PS&J Software Six Sigma
Copyright © 2004, PS&J Software Six SigmaAll rights reserved.
35
March 3, 2004
Open Loop Process Run ChartsOpen Loop Process Run Charts
• Average review rate 244 LOCs/Hr• Average defect density 39 Defects/KLOC• Average removal rate 6/Hr
Inspection Rate
0
100
200
300
400
500
600
700
800
900
1 5 9 13 17 21 25 29 33 37 41 45 49 53 57 61 65 69 73 77 81 85
Inspection ID
LO
Cs
/Hr
Moving Range (mR) Inspection Rate
0
100
200
300
400
500
600
In s p e c t io n ID
Defects Found in Inspection/KLOC Inspected
0
20
40
60
80
100
120
140
160
180
200
Inspection ID
Def
ect
s/K
LOC
Moving Range (mR) Defects Found in Inspection/KLOC Inspected
0
20
40
60
80
100
120
1 5 9 13 17 21 25 29 33 37 41 45 49 53 57 61 65 69 73 77 81 85
Inspection IDD
efe
cts
/KL
OC

PS&J Software Six Sigma
Copyright © 2004, PS&J Software Six SigmaAll rights reserved.
36
March 3, 2004
Correlation AnalysisCorrelation Analysis
• To evaluate review rate forsuitability as a control variable usecorrelation analysis
• r2 = 0.67 – moderately good fit byhyperbola: y = 1000/(0.1x + 3)
• Chart suggests targeting reviewrate in the 100 – 200 LOCs hourrange
• Similar analysis show dependency onsize of product under review
• r2 = 0.68 – moderately good fit byhyperbola: y = 1000exp(-x/2000)/ (x)1/2
• Charts suggests very little value ininspection review of large products
• Target product size < 500 LOCs
Inspection Rate vs Defects Found in Inspection/KLOC Inspected
0
50
100
150
200
250
0 100 200 300 400 500 600 700 800 900
Inspection Rate (LOC/Hr)
Def
ects
Fou
nd in
Insp
ectio
n/K
LOC
Insp
ecte
d
Defects/KLOC Found vs. Product Size Inspected
0
20
40
60
80
100
120
140
160
180
200
0 1000 2000 3000 4000 5000 6000
LOC
De
fect
s/K
LO
C

PS&J Software Six Sigma
Copyright © 2004, PS&J Software Six SigmaAll rights reserved.
37
March 3, 2004
Inspection Action PlanInspection Action Plan
Slow Review Rate & Many DefectsIs the product really buggy?
Was the review really effective?Was the review cost efficient?
Fast Review Rate & Many Defects => Buggy ProductThe product is buggy.
Return to author for reworkAsk someone else to rewrite
Slow Review Rate & Few DefectsIs the product really good?
Was the review really ineffective?Was the review cost efficient?
Fast Review Rate & Few Defects => Poor ReviewIs the product really good?Re-review at a slower rate
Make sure reviewers are using the checklist
Defect Density vs Review Rate
0
20
40
60
80
100
120
140
160
180
200
0 100 200 300 400 500 600 700 800 900
LOCs/Hr
Defe
cts/
KLO
C
Defect Density vs Review Rate
0
20
40
60
80
100
120
140
160
180
200
0 100 200 300 400 500 600 700 800 900
LOCs/Hr
Defe
cts/
KLO
C

PS&J Software Six Sigma
Copyright © 2004, PS&J Software Six SigmaAll rights reserved.
38
March 3, 2004
Closed Loop Run Charts Closed Loop Run Charts
• Targeting rate yielded major decrease in variation• Closed loop process achieved significant improvements
– Average Review Rate 138 LOCs/hr– Average Defect Density 118 Defects/KLOC– Average Defect Removal Rate 15/hr
Inspection Rate
0
20
40
60
80
100
120
140
160
180
200
1 2 3 4 5 6 7 8 9 10 11 12
Inspection ID
LO
Cs
/Hr
Defects Found in Inspection/KLOC Inspected
0
50
100
150
200
250
300
350
400
1 2 3 4 5 6 7 8 9 10 11 12
Inspection ID
De
fect
s/K
LO
CMoving Range (m R) Inspe ction Ra te
05
101520253035404550
1 2 3 4 5 6 7 8 9 10 11 12
Ins pe ction ID
LO
Cs
/Hr
M o v in g R a n g e ( m R ) D e f e c t s Fo u n d in In s p e c t io n /KL O C In s p e c te d
0
5 0
1 0 0
1 5 0
2 0 0
2 5 0
3 0 0
1 2 3 4 5 6 7 8 9 1 0 1 1 1 2
In s p e c t i o n ID
De
fec
ts/K
L

PS&J Software Six Sigma
Copyright © 2004, PS&J Software Six SigmaAll rights reserved.
39
March 3, 2004
Why Adopt Six Sigma?Why Adopt Six Sigma?
• Achieve bigger savings, lower cycle times, and betterpredictability for the same investment– Initial estimates typically accurate to better than 20%– Estimates to go typically good to under 10%– Productivity up 30% - 50%– Product Quality better by at least a factor of 4
• Demonstrate a quantitative connection between processimprovement and business goals
• Maintain sponsorship through reorganizations and changesin senior management
• Exploit corporate Six Sigma sponsorship to boost your SPIinitiative
• Accelerate progress to higher CMM levels

PS&J Software Six Sigma
Copyright © 2004, PS&J Software Six SigmaAll rights reserved.
40
March 3, 2004
ReferencesReferences
• For more on statistical process control see– Understanding Statistical Process Control, Donald J. Wheeler & David S.
Chambers, SPC Press, 1992
• For additional information see our web site or for questions contact:
www.SoftwareSixSigma.com
Ellen George 201- [email protected]
Steve Janiszewski 201- [email protected]