Situation assesement on drought - Thardeep Rural...
22
SITUATION ASSESEMENT ON DROUGHT Tharparkar and Umerkot September 2014 Monitoring and Evaluation Section TRDP
Transcript of Situation assesement on drought - Thardeep Rural...

SITUATION ASSESEMENT ON
DROUGHT Tharparkar and Umerkot
September 2014 Monitoring and Evaluation Section TRDP

1
CONTENTS
Executive Summary 02
The objective 04
Methodology 05
Migration 05
Livestock 06
Agriculture 07
Health 08
Households under Debt 09
Food security 10
Community Needs 11
Recommendations 12
Map of Tharparkar drought affected UCs. 14

2
Executive Summary TRDP has worked with the Communities in the drought affected areas since many years in the past and is seen as major organization inspiring the community to pin hope with it. The community expects and looks towards TRDP to bring in intervention both as emergency relief initiative and long term initiative to mitigate the recurring drought affects by providing assistance in creating sustainable economy. Realizing the situation, the monitoring and evaluation (M&E) section and Disaster preparedness and management unit (DPMU) jointly started assessment in the mid of September 2014, generally the time when people’s diminishing hope for good year fades completely and start looking around for livelihoods and for their own survival. Initially on the basis of information collected through rapid assessment on amount of rain falls the union councils were categorized in four types. The sample villages representing high population (averagely 300 households per village) with multicast inhabitants from the severely affected UCs were selected for the survey. The three member enumeration teams of each SMT after complete orientation on questionnaire had the community meetings in 74 villages of Thar during the last two weeks of September. Data punching, compilation analysis tabulation and report writing was handled by the monitoring and Evaluation section at head office Mithi. Survey results obtained on current situation indicate the drought like situation mainly in Chachro and Nangar, and the desert-area UCs of Umerkot district while Diplo and Mithi are comparatively better where recorded varying degree of rains, though erratic and scattered. 4463 households from 59 villages of Tharparkar plowed their land during current year of 2014 and 3719 (84%) got their seed destroyed due to not raining timely. The drought indicator of migration show 1518 (7%) complete families migrated to barrage areas and 4129 or (18%) migrated partially by one male family member for livestock grazing or for agriculture labor. The majority (70%) in complete migration and 58% in partial migration is of three communities of Bheel, Kolhi and Meghwar out of 25 communities from 74 villages. Livestock, the main source of livelihood was the priority area need immediate attention, market price of goat, sheep and cows have reduced up to 30-40%. The 4% of big animals (cows) and 14% of small animals (goats/sheep) were sold and the migration of big livestock ratio stands 15% of total big animals. The community need priority index show demand of fodder and veterinary services at top of all other needs. 182 children deaths under 5 were reported and 4446 children suffered mainly (78%) by diarrhea and fever/malaria. Similar is the case of adults, according to results 3910 adults found suffered by abdomen and fever due to unknown reason. The household economy mostly depend upon the livestock as averagely each household possessed 11 small domestic animals (goats/sheep) and 3 big (mostly cows), the sale of goats and sheep served their cash and immediate needs. According to data out of total 22361 households of 74 villages 15426 (69%) were under the debt. The 35% of debt sources were NGOs or banks, 33% money lenders, 24% shop keepers and 8% had the source of debt was their close relatives. The ratio of money lenders is high where the access of the financial institutions was lacking as the case of Dahalee and Chachro area villages. Besides debt with low capacity of purchasing power, the food security conditions are also bad. Averagely the 17% of the total households told they have food available for next one to 6 months period, only 1% had food secure for one year while the 82% household had either no food secure for next fifteen days even. 50 of the total 74 villages admired government support of wheat they are getting since last couple of months period. None of the village of Umerkot district have got any relief in form of wheat support by the Government.

3
On the basis of the indicators as above at the end when the community was asked about the solutions they want, their response and priorities are tabulated in table below.
Priority Area of intervention % 1st Fodder and Vaccination (for livestock) 22%
2nd Health facilities (doctor, medicines and camps)
19%
3nd Food ration 17%
4rd Water (RO plants, dug wells, hand pumps) 14%
5th Education (teachers, schools, girls education) 11%
6th Solar lights 4%
7th Others 12%
Total 100%

4
Situation assessment on Drought Tharparkar and Umerkot
September 2014
The objectives:
The objectives of the assessment were
1. Identify the areas having more drought like situation due to low rain falls. 2. Assess the drought indicators on food security, migration, livestock, agriculture, health,
education and water 3. Identify the problems being faced by the affected communities in current situation and know the
possible solutions at community ends to mitigate the drought like situation in their area.
Process and Methodology-
The information was gathered through questionnaire and Focus group discussion (FGDs) in the most drought affected villages, selected according to the low rainfall in the union council. On the basis of the data on rainfall all union councils of Tharparkar and Umerkot (only desert UCS) were categorized into four types; UCs which got very low rains, low, moderate and better on following basis.
Very Low: UCs where either there were no rains at all or very low rains
Low: UCs where land cultivation/crop plowing was very rare, or if cultivated it remained unbeneficial. Grass for livestock grew at scattered areas which was insufficient,
Moderate: UCs where rain was for more than two times, people plowed their fields and currently caring their cultivated lands, grown-grass is currently sufficient for their livestock.
Better: UCs where it rained sufficiently and more than three times, people cultivated their lands and expecting good crops. Grass seems good enough for their livestock survival.
The UC level information on rainfall was initially collected through visiting villages by the field staff, meetings with community organizations and information collected from district government offices. According to the initial data and information collected on rainfalls, the 44 union councils of Tharparkar and 7 of Umerkot were divided into four categories. The Taluka wise segregation is as under.
Taluka Very low Low Moderate Better Total
No of Union councils
Mithi 4 7 1 12
Diplo 3 4 1 8
Chachro 11 3 3 17
Nagar parker 3 3 1 7
Umerkot 4 2 1 7
18 15 15 3 51

5
Methodology:
According to the severity in terms of low rainfalls in UC the 60 villages were selected from Tharparkar and
15 from district Umerkot. The number of villages were in proportionate, taking high number from UCs
highly affected ones. Hence 27 villages were taken from Chachro tehsil, 14 from Nagar parker, 12 from
Diplo, 8 from Taluka Mithi and similarly the 15 villages from the Tehsil Umerkot.
The field team of the concerned field office was given orientation on the questionnaire and on FGD
process and methodology. A team of three members including one supervisor at respective field office
had the community meetings in the identified villages of the unit area. Maximum participation was
ensured through advance information to the village activists, teachers, shopkeepers and women. The
information, suggestions and the feedback was obtained through filling a close and open ended
questionnaires. The facilitation role was of the supervisor while the two were supportive in taking the
notes and filling the forms.
The two or three highly populated villages with multi casts dwellers which represent the major part of the
union councils in terms of current drought condition were selected from each union council of the area.
The feedback on current drought situation in the area was also obtained from the respective local support
organization (LSOs) of the area.
1. Migration
According to the data collected from 74 villages of Tharparkar and Umerkot 5,647 families have been affected due to migration. Out of total affected families, 1518 i.e. 36.7% are complete migrant families while 4129 households are those who migrated partially with livestock herds for grazing purpose of their livestock to neighboring areas in Thar or for labor for harvesting the agriculture at barrage areas
Taluka wise migration
Taluka No. of
Villages
Complete Migrated
HHs
Partial Migrated HHS
Total HHs planning
to Migrate
Chachro 25 699 2017 2716 661
Dahli 2 50 130 180 60
Diplo 13 199 307 506 350
Mithi 8 157 289 446 130
Nangarparkar 11 213 785 998 309
Umerkot 15 200 601 801 514
Grand Total 74 1518 4129 5647 2024
It is common that the Bheel and Kolhi communities migrate every year during the wheat harvesting
season but not in the months of August or September like this year. The 70% of the migrating families
belong to Bheel Kolhi and Meghwar communities. At the other side the partial migration is higher of

6
Meghwar 25% than Bheel and Kolhi communities. While the rest of 22 communities ratio of partial
migration stood comparatively high at 42%.
While having interviews with community representatives during the community conferences it was
found that more 2024 families of 22 villages were ready to migrate within next couple of weeks. This
trend will increase month by month as they are forced to sell off their animals swiftly due to cash needs,
fodder scarcity and diseases/mortality of animals
Affected Complete migrating families Partial migrating families
Total Families 1518 4129
Bheel community 807 (53%) 855 (21%)
Kolhi community 165 (11%) 526 (13%)
Meghwar 88 (6%) 1018 (25%)
Others 22 communities
458 (30%) 1730 (42%)
2. Livestock
According to the data collected on number of livestock in the 22,361 households of 74 villages total 246,819 small animals (goats and sheep) and 72,048 big animals (cows, camels or donkeys) are available in the villages. That makes average of 11 small animals and 3 big animals are owned by each household.
Taluka No. of HHs
No.of Villages
Total No. of Livestock
No. of Death of Livestock in 3
Month
No. of Migrated Livestock
No. of HHs who sold Livestock Goats &
Sheeps Other
Goats & Sheeps
Big Animals
Small Big
Chachro 8309 25 101375 29688 14456 2186 10392 3451 5386
Dahli 550 2 3700 1295 840 263 400 32 358
Diplo 1918 13 23507 5651 4585 84 3800 2608 868
Mithi 2227 8 26180 6592 3525 117 5000 985 1292
Nangarparkar 2872 11 14776 6854 1946 145 0 78 928
Umerkot 6485 15 77277 21968 8605 347 29667 2994 4350
Grand Total 22,361 74 246,815 72,048 33,957 3,142 49,259 10,148 13,182
The livestock death ratio during the last three months period (July-September) is recorded at 14% in sheep and goats and 4% in cows or big domestic animals. This ratio varies in each Taluka ranging highest at 23% and lowest at 11% in small animals and 20% to 1% in big animals.
Livestock Migration In the dry period which normally starts if it is not a good year (not abundant rains up to the end of July), farmers start a temporary migration to the areas with good rains in Thar or to the barrage areas in the interior Sindh in search fodder for their livestock. The human partial migration of

7
4,129 is basically in connection to the livestock grazing. The livestock migration during the last three months is recorded 59,407 i.e. 19% (20% goats and sheep and 14% of cows) of the total livestock owned by the inhabitant of 74 villages of Tharparkar and Umerkot. The sale of small animals enhances the purchasing power through providing cash in hand and sale of big animals are sold as their survival becomes difficult due to no land for grazing and the feed purchasing for them on cash is un-affordable for them
Market prices trend during (March-September) 2014
Animal Before After Change
Goat 5,503 3,542 -36%
Sheep 4,003 2,416 -40%
Cow 47,257 32,854 -30%
During the last six months the decrease in the prices of the animals also indicate higher supply in open local markets. Though a slight change was observed the time of rains but against it stood stable as above. The price rates is decreased more in Umerkot district as compared to Tharparkar.
3. Agriculture:
According to respondents from 59 villages of Tharparkar out of total 15,876 households, 7257 (46%) were the land holders and due to low amount of rain falls only 4,463 i.e. 61% of them cultivated their land. It is important, that majority 54% of the growers took seed on credit, 30% purchased on cash while only the 15% of the growers had stock already available.
For a good crop averagely four to five, timely rains are required. Here in the case majority 3739 or 84% of the farmers got their seed completely destroyed due to no second or on time rain. This lets their time energy and efforts hopeless at the end. Since last 3 years (2012-14), peoples are continuously facing drought like situations in Tharparkar except few rain in scattered as responded by the villagers.

8
4. Health
Children Affected
The data analysis of 74 sample villages from Tharparkar and Umerkot districts reveals 2729 children who
affected due to migration with their parents. 44% or the 1204 children missed their schooling due to
migration.
Indicators District
Total Tharparkar Umerkot
Villages 59 15 74
Households 15,876 6,485 22,361
Total Migrating Families 1,318 200 1,518
No. of Children with migrating families 2,360 369 2,729
Children under 5 deaths in three months 161 21 182
Sufferings due to desease (Below 5 years) 3,235 1,211 4,446
Sufferings due to desease (Above 5 years) 958 793 1,751
Schools absent due to migration 863 341 1,204
Total 182 children died during the last three months period. The specific causes are not known yet. It is
anticipated that the improper care and lack of food availability besides the hygienic practices matter
most. The children suffering due to various diseases is high @ 4446 of under 5 children and 1751 of the
children of age between 5-18 years.
The children affected by different diseases are enlisted below. Under 5 years of age children the most
common diseases were found diherea and the fever or malaria. Generally fever caused by any infection
is named as malaria or fever.
Diseases in Children Below 5 years %age 5 to 18 Years
%age
No. of Affected Children 4,446 1,751
Diarrhea 1,697 38 833 48%
Malaria 1,604 36 540 31%
Skin Infection 412 9 158 9%
ARI 383 9 62 4%
Eye Infection 150 3 117 7%
TB 74 2 5 0%
Others 126 3 36 2%

9
The adult’s number of deaths during the last three months in the villages is 149 from which 91 were
male and 58 female. And 4910 people who were suffered due to different diseases during the period of
last three months. The Diherea and malaria/fever were the diseases most of the people found affected
of as the 60% of the total people were found affected by these two diseases.
Diseases in Adults Tharparkar Umerkot Total %
No. of Affectees Children
2,912 998 3,910
Diarrhea 877 312 1,189 30%
Malaria 776 390 1,166 30%
Skin Infection 519 210 729 19%
ARI 359 2 361 9%
Eye Infection 194 19 213 5%
TB 145 64 209 5%
Others 42 1 43 1%
5. Households under debt
Loan/borrowing is the most common indicator in poor economies but the same can make the poor
more vulnerable if the incomes are associated with the rain-fed economies like Thar. The data collected
on the household-debt conditions in the 74 villages of Thar Desert depicts that 69% of the total
households are under the debt. The majority of households took loan from banks or NGOs secondly 33%
from the money lenders at higher interest rates.
Taluka No.of Villag
es
No.of HHs
No. of HHs who took loan
Loan Takers % to Total HHS
Realtives Org/bank
Money Landers
Shopkeepers
Other Source
Chachro 25 8309 5613 668 1393 2638 894 0 68% Dahli 2 550 150 40 20 90 0 0 27% Diplo 13 1918 1629 153 109 615 717 35 85% Mithi 8 2227 1765 190 407 498 670 0 79%
Nangarparkar 11 2872 2202 67 745 742 648 0 77% Umerkot 15 6485 4067 99 2675 491 802 0 63%
Total 74 22361 15426 1217 5349 5074 3731 35 69%
8% 35% 33% 24% 0%
The ratio of loan takers is more where the access to financial market is not the problem, in the far flung
areas the main source of borrowing is the money lenders, as the case of Dahli Taluka where the
percentage of loan takers from money lenders is 60% and Chachro 41%, while it is lesser i.e. 28% in
Mithi Taluka where the poor have different options.

10
The above table provides the outlook on the exposure of the risk associated with these borrowings the
volatility of the repaying capacities of these borrowers.
6. Food security
Taluka No.of
Villages No.of HHs
No. of HHs who took loan
Food Security % Food Insecure
Households 1-6
Month 1 Year
Nothing or max 15
days
Chachro 25 8309 5613 648 12 7649 92%
Dahli 2 550 150 36 0 514 93%
Diplo 13 1918 1629 805 40 1073 56%
Mithi 8 2227 1765 500 40 1687 76%
Nangarparkar 11 2872 2202 965 56 1851 64%
Umerkot 15 6485 4067 865 126 5494 85%
74 22361 15426 3819 274 18268 82%
69% 17% 1% 82%
According to the survey results of 74 villages of Thar Desert 69% of the total households are already
under the debt ultimately with lesser purchasing power of food items. Government relief wheat has
been distributed in the 50 villages of Tharparkar district in the month of September, 4 villages in the
month of August and 12 villages got free wheat in the month of July. It has provided worthy cushion to
their food needs. And communities found quite satisfied if this support remains continued. The number
of families who are planning to migrate will also decrease if the government assures free and
transparent distribution to the needy families.
From the above data 82% of the total households are food insecure only the 17% has food security up to
six months period and only the one percent are having the food available for even one year period. This
indication is bad in Chachro and Dahli tehsils followed by Umerkot and Mithi. The situation is
comparatively better in Diplo. This situation envisages their sale of the assets and livestock at lower
prices.

11
7. Community Needs
To know real community needs perceived more important at their end in the current scenario the
community prioritized their immediate needs as shown in the table below.
Taluka Fodder &
Vaccination Medical Services
Water Food
Ration Wheat
School &
Teacher
Solar light
Others
Chachro 24% 22% 13% 21% -
18% -
2%
Dahli 18% 18% 9% 18% -
18% 18% -
Diplo 17% 17% 23% 23% -
10% -
10%
Mithi 25% 18% 18% 18% -
14% -
7%
N Parkar
23% 19% 9% 21% -
-
13% 15%
Umerkot 24% 22% 11% -
24% 5% -
14%
Total 22% 19% 14% 17% 4% 11% 5% 8%
According to the results obtained from the sample of 74 villages in both the districts of Tharparkar and
Umerkot the first immediate and high priority need identified which is 22% was fodder and the
vaccination for livestock. As the livestock is the core source for their livelihood and its survival in dry
season is not only the challenge but also the matter for their own survival. The second priority need was
the health, the most of the health causalities particularly in children are the result of nutrition
deficiencies, unavailability of clean drinking water and unhygienic conditions as the most of the
sufferings in children as well as in adults is due to diherea 48% children and 30% adults. The malaria and
the fever is the second cause of health suffering that is also due to malaria or fever due to any abdomen
infection or other infection.
Provision of food ration to the families takes the third with 17% and water 14%. The need of wheat
support is only from Umerkot district where the government free what bags are not distributed so far. In
summary the sequence of the needs stand as under

12
Priority Area of intervention % 1st Fodder and Vaccination (for livestock) 22%
2nd Health facilities (doctor, medicines and camps)
19%
3nd Food ration 17%
4rd Water (RO plants, dug wells, hand pumps) 14%
5th Education (teachers, schools, girls education) 11%
6th Solar lights 4%
7th Others 12%
Total 100%
Recommendations
The community needs and the solutions of the problems in the current situation are prioritized and by
themselves and tabulated at the end of the report. Keeping in view the TRDP work approach in light of
the self-prioritized needs following are the recommendations.
Emergency-basis initiatives
1. For immediate response to face the current situation TRDP should start relief activities by
prioritizing the areas according the severity of drought of the situation. The 18 union councils
which affected more (Chachro 11, Umerkot 4 and Nangar Parkar 3) be taken as high priority areas.
And the second priority to the 15 union councils (13 UCs of Tharparkar and 2 of Umerkot district)
2. Livestock survival, the only source for the household economy found the utmost need, it not only
provides cushion to meet immediate cash needs but also pledges the food security. Regarding the
livestock following are the interventions provided on urgent basis.
Concentrated food (fodder) at subsidized rates for livestock.
Vaccination, and deworming/drench and medication services for livestock
Easy and affordable Livestock insurance
3 Free medical services at through camps with Health and hygiene sessions
Mosquito Nets (LLINs)
Essential medicines, including clean delivery kits

13
RUTF (ready to use therapeutic food) and Fortified food
Micro health insurance and access to health facilities (MCH services in particular)
4 Food ration package (high-energy biscuits, pulses, flour, rice etc.)
Long term initiatives
5 Establishing water treatment plants for converting brackish water into potable especially in the
areas where the water table is deep down the surface and the quality of the water is much
below the WHO standards.
6 Establishment of water treatment (RO) plants for converting brackish water into potable.
7 Introduce crops and agriculture suitable for saline water.
8 Enhance home based workers capacity and create market linkages for local productions.
9 Awareness raising on climate change and training on disaster risk reduction

14
DISTRICT UMERKOT

THARDEEP RURAL DEVELOPMENT PROGRAMME Disaster Preparedness & Management Unit
& Monitoring & Evaluation Section
Assessment on Drought Situation in Arid zone of TRDP Programme area (Village level close ended questionnaire)
Field Visit (Date): ………………………… Mobile Number of Active Person: …………………………………………..
1. BASIC INFORMATION:
1.1 Name of Village: …………………………….…………………… 2.1 Taluka: …………………… 2.3 Union Council: ……………………..
2.4 Deh: ………….……………………………..…..…………………. 2.5 Households: ……………... 2.6 Population: ……………….…………
2. What type of disaster affected your village in last three Years?
Disaster Type 2011 2012 2013
Flood
Heavy Rains
Drought
Fire Incidents
Any Others (Please specify)
2.1 Questions about current year 2014
2.1.1: How many houses in your villages ploughed their fields this year? No. of HHs: …………………….
2.1.2: Sources of seed (No. of HHs)
a. Purchased ……………………………………. b. On credit……………………………………… c. stock already available ……………………….

2.1.3: When did they get wheat or any other items support by govt, NGOS and other stakeholders?
Support By Government NGOs and Other Stakeholders
Support March 2014
April 2014
May 2014
June 2014
July 2014
August 2014
Sept. 2014
March 2014
April 2014
May 2014
June 2014
July 2014
August 2014
Sept. 2014
Wheat
Other Items (Specify)
2.1.4: No. of Households received loan during this year:
Received Loan from relative from organization/bank from money lenders from shopkeepers from others (Specify)
No. of HHs
3. HUMAN MIGRATION:
Caste wise Migration
No. of migrated families
(Completed)
No. of migrated families (Partially) No. of
families migrated to
nearest town (Within Thar
Purpose 1. For livestock grazing 2. Agriculture Labor 3. Labor/business 4. Children Education 5. Other (Specify)
Mode of Migration by
HHs Men Women Children
Kekra/ Bus
Animal Foot

3.1. Months of migration
Name of months
March 14 April 2014 May 2014 June 2014 July 2014 August 2014 September 2014
No. of families
Umerkot Sanghar Mirpur khas Badin Within Thar Nawabshah Others
Where to be migrated (No. of HHs)
How many families (HHs) are planning to migrate in current situation?
3.4 Will number of household planning to migrate will decrease due to govt. support for wheat?
a) Yes b) No
If yes, than how many Households: …………………
3.5 No. of Families (HHs) having their food secure in following period
1. One month
2. for three months
3. for six months
4. for one year
5. Nothing
3.6 What other support will you need to face the current situation (Prioritize)
I. ___________________________
II. ____________________________
III. ______________________________
IV. ______________________________

4. LIVESTOCK:
Type of Livestock
Total number of livestock in village
No. of animals migrated
from Village
No. of Animals Death in
last three months
Cause of Death No. of Animals Sold during (June-Aug. 14)
No. of HHs who sold animals
during (June-Aug. 14)
Rate of Animal (unit) Before and after
current situation (June-Aug.14)
Diseases in Livestock
(Currently)
Before Now
Goat
Sheep
Cow
Buffalo
Camel
Donkey
Horse
(4.1) What is the source of fodder for your livestock in current situation? (No. of HHs)
4.1.1 Cash purchase
4.1.2 Own Farm / Stored
4.1.3 Grazing lands
4.1.4 Other (Specify):_________________________
Total
4.2 On average how much fodder will be needed to each HH per month with expected cost?
Average Quantity for sheep & goat ………………….. Estimated average Cost: ………………
Average quantity for Cow and Camel………………. Estimated average Cost:……………….
4.3 What could be done the best for livestock support? I. _____________________ II: _____________________ III: _____________________ IV: _________________________
5. AGRICULTURE INFORMATION:
Total number of HHs who have land for cultivation ……………… Total number of HHs who cultivate lands in current year……………
5.1 Is the seed destroyed completely? 5.1.1 If Yes (No of HHs)
5.2 How many times sufficient rains are needed for better yield? .............................. 5.3 No of times sufficient rain fall till today……………

6. HEALTH AND EDUCATION:
Health Men Women Children
Boys Girls
No. of Deaths during last three Months
Cause of Deaths
How many children (0-5) in your village suffered from following* diseases in last three month?
- - 1= 2= 3= 4= 5= 6= 7=
1= 2= 3= 4= 5= 6= 7=
How many children (above 5-less than 18 years) in your villages have suffered from following diseases in last three month?
1= 2= 3= 4= 5= 6= 7=
1= 2= 3= 4= 5= 6= 7=
How many adults (above 18 years) suffered from following* disease in last three months?
1= 2= 3= 4= 5= 6= 7=
1= 2= 3= 4= 5= 6= 7=
- -
No. of Children absent from Schools in the month of August?
- -
*: 1. Skin Diseases, 2. Diarrhea 3. ARI 4. Eye Infections 5. Malaria/Dengue 6. T.B 7. Others: (Please specify)
Name of Supervisor _________________________ Signature of Supervisor & Date__________________
Name of Enumerator _________________________ Signature of Enumerator & date__________________
Name of Enumerator _________________________ Signature of Enumerator & date__________________
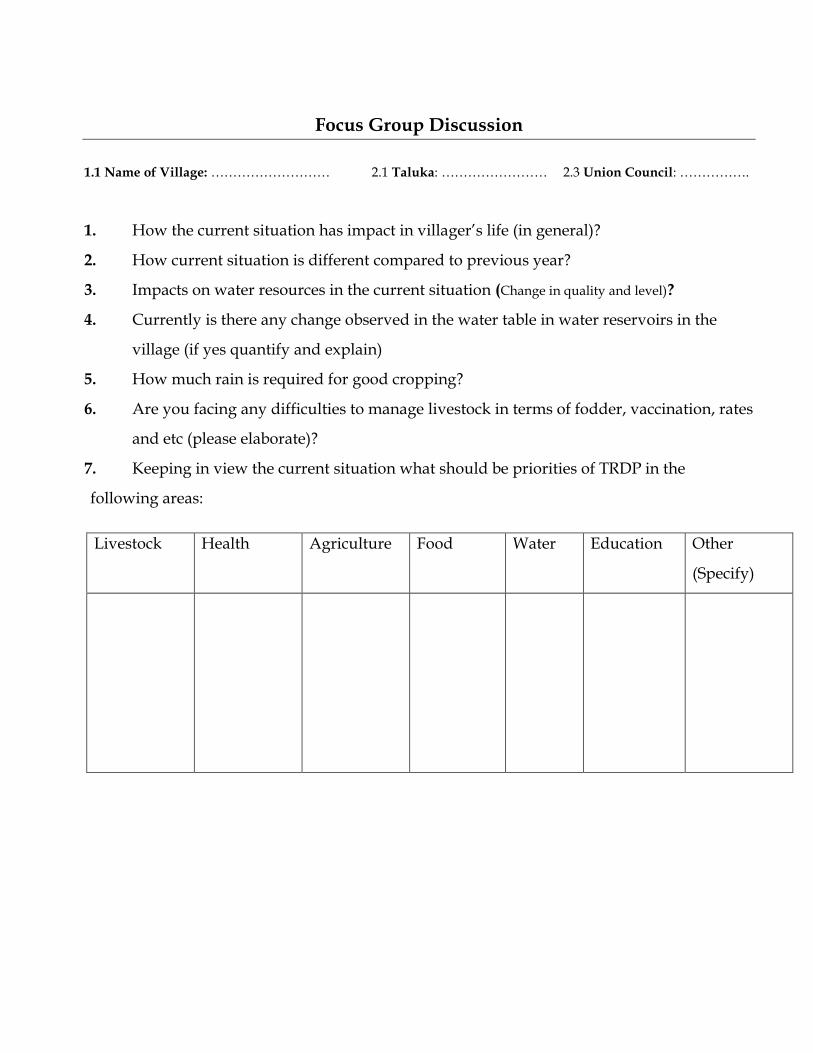
Focus Group Discussion
1.1 Name of Village: ……………………… 2.1 Taluka: …………………… 2.3 Union Council: …………….
1. How the current situation has impact in villager’s life (in general)?
2. How current situation is different compared to previous year?
3. Impacts on water resources in the current situation (Change in quality and level)?
4. Currently is there any change observed in the water table in water reservoirs in the
village (if yes quantify and explain)
5. How much rain is required for good cropping?
6. Are you facing any difficulties to manage livestock in terms of fodder, vaccination, rates
and etc (please elaborate)?
7. Keeping in view the current situation what should be priorities of TRDP in the
following areas:
Livestock Health Agriculture Food Water Education Other
(Specify)

Market Survey
1. What are the trends in the prices of following key goods?
S.
No
Name of Items Price (Per KG)
August
2014
July
2014
June
2014
May
2014
April
2014
March
1 Wheat
2 Moth
3 Guwar
4 Bajra
5 Mung
6 Moth
7 Till
8 Chunno (Rice Bran)
9 Kharr
10 Others (Specify):
11 Others (Specify):
12 Others (Specify):
13 Others (Specify):
2. What are the trends in the prices of following Livestock?
S.
No
Name of Items Price (Per Animal) August
2014
July
2014
June
2014
May
2014
April
2014
March
1 Goat
2 Cow
3 Camel
4 Sheep
5 Buffalo
6 Others:
7 Others: 8 Others: 9 Others: 10 Others: 11 Others:
12 Others: