Situation 47: Graphing Inequalities with Absolute...
12
060510_SituationAbsGraph.doc Page 1 of 12 Situation 47: Graphing Inequalities with Absolute Values Prepared at Penn State Mid-Atlantic Center for Mathematics Teaching and Learning Shari & Anna Prompt This episode occurred during a course for prospective secondary mathematics teachers. The discussion focused on the graph of y – 2 " |x + 4|. The instructor demonstrated how to graph this inequality using compositions of transformations, generating the following graph. Students proposed other methods, which included the two different algebraic formulations and accompanying graphs as seen below. y " 2 # x + 4 or " x " 4 # y " 2
Transcript of Situation 47: Graphing Inequalities with Absolute...

060510_SituationAbsGraph.doc Page 1 of 12
Situation 47: Graphing Inequalities with Absolute Values Prepared at Penn State
Mid-Atlantic Center for Mathematics Teaching and Learning Shari & Anna
Prompt This episode occurred during a course for prospective secondary mathematics teachers. The discussion focused on the graph of y – 2
!
" |x + 4|. The instructor demonstrated how to graph this inequality using compositions of transformations, generating the following graph.
Students proposed other methods, which included the two different algebraic formulations and accompanying graphs as seen below.
!
y " 2 # x + 4 or
!
"x " 4 # y " 2
060510_SituationAbsGraph.doc Page 2 of 12
!
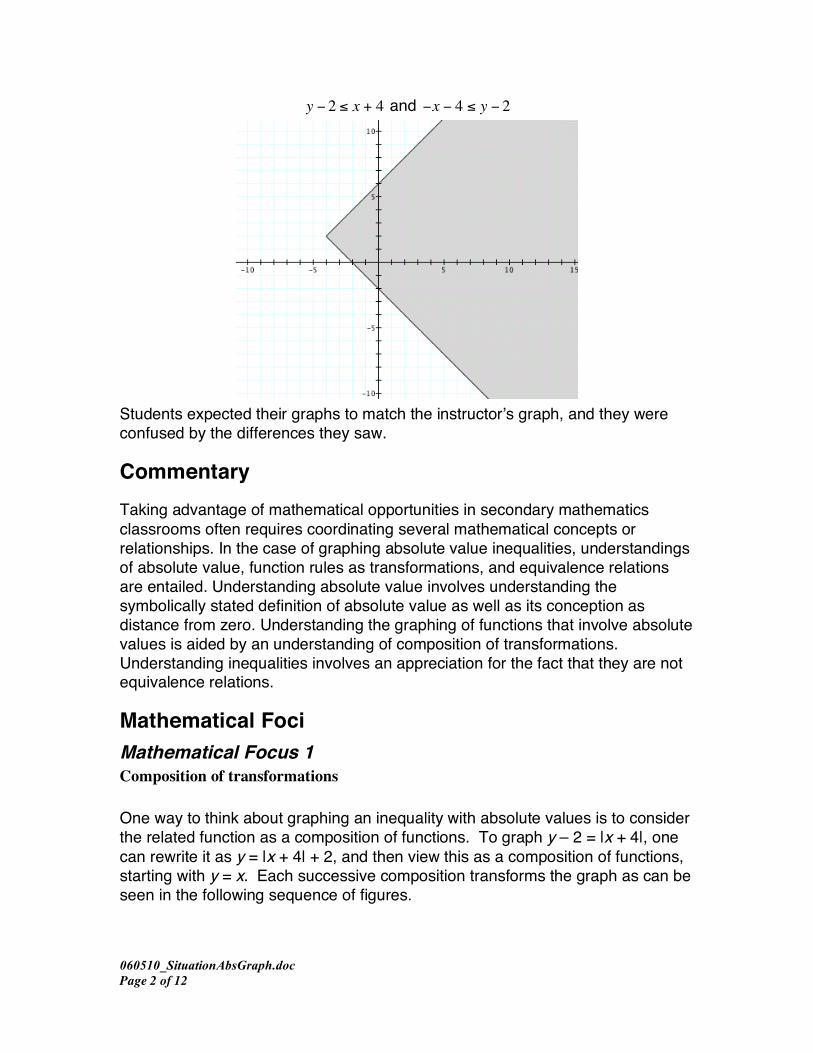
y " 2 # x + 4 and
!
"x " 4 # y " 2
Students expected their graphs to match the instructor’s graph, and they were confused by the differences they saw.
Commentary Taking advantage of mathematical opportunities in secondary mathematics classrooms often requires coordinating several mathematical concepts or relationships. In the case of graphing absolute value inequalities, understandings of absolute value, function rules as transformations, and equivalence relations are entailed. Understanding absolute value involves understanding the symbolically stated definition of absolute value as well as its conception as distance from zero. Understanding the graphing of functions that involve absolute values is aided by an understanding of composition of transformations. Understanding inequalities involves an appreciation for the fact that they are not equivalence relations.
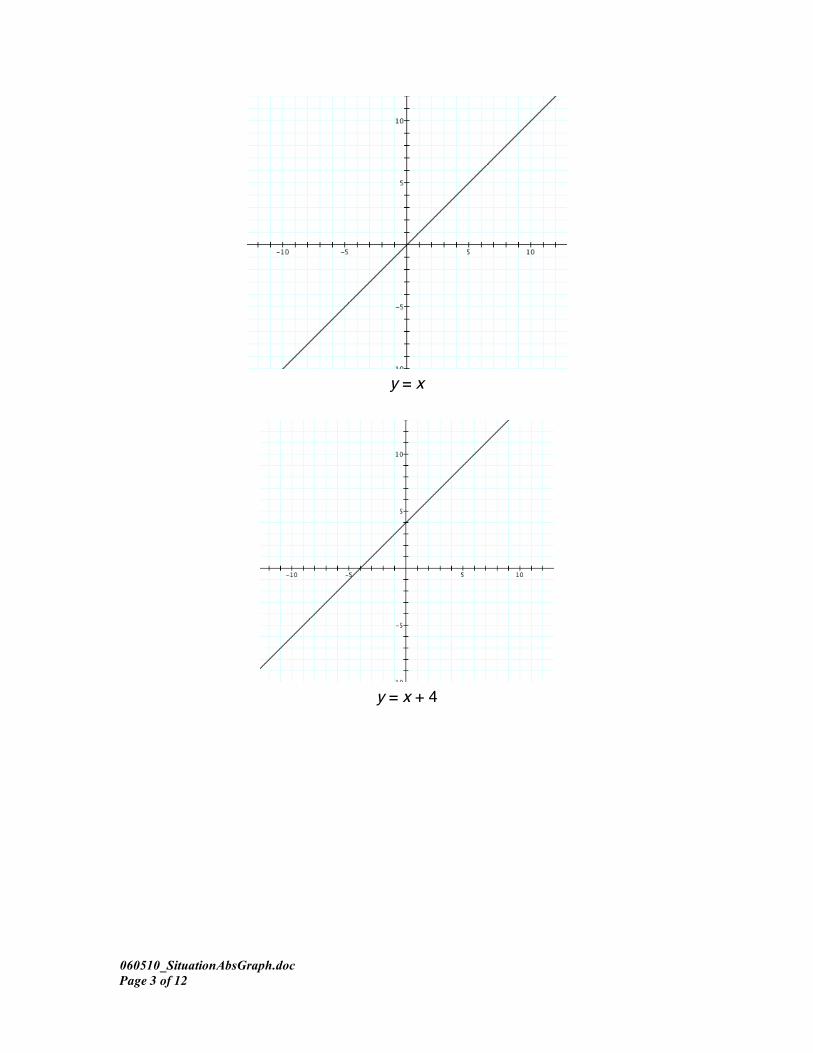
Mathematical Foci Mathematical Focus 1 Composition of transformations One way to think about graphing an inequality with absolute values is to consider the related function as a composition of functions. To graph y – 2 = |x + 4|, one can rewrite it as y = |x + 4| + 2, and then view this as a composition of functions, starting with y = x. Each successive composition transforms the graph as can be seen in the following sequence of figures.
060510_SituationAbsGraph.doc Page 3 of 12
y = x
y = x + 4
060510_SituationAbsGraph.doc Page 4 of 12
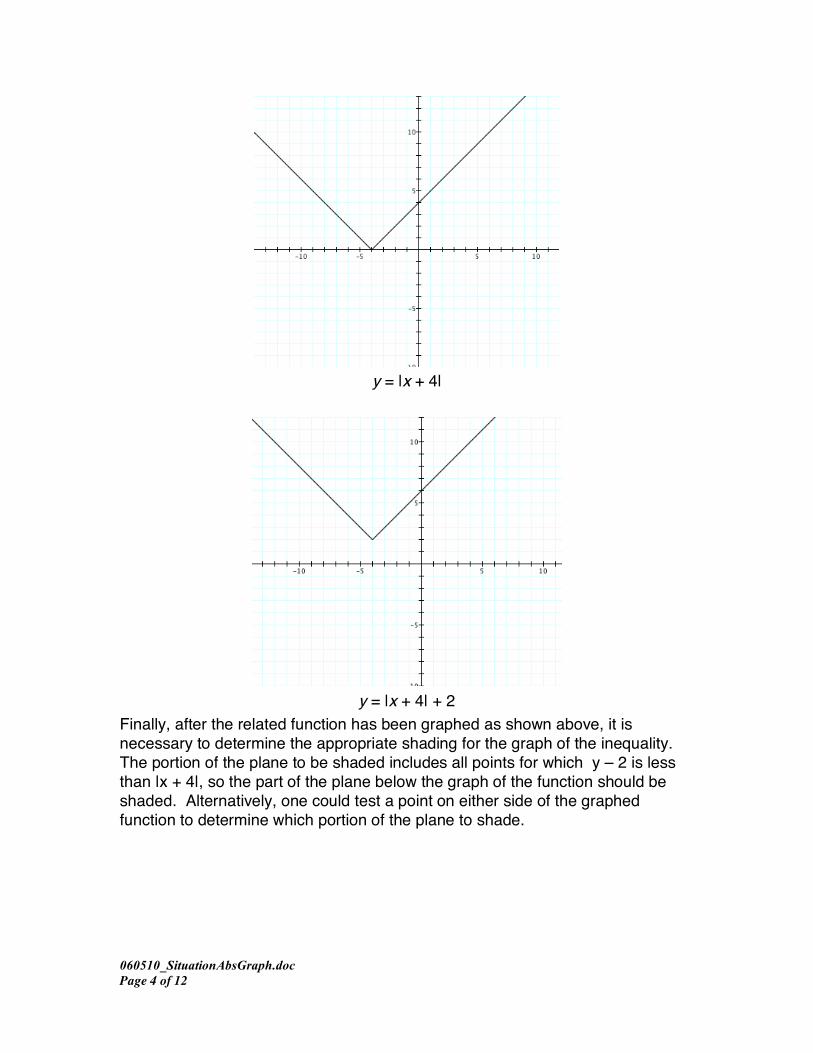
y = |x + 4|
y = |x + 4| + 2
Finally, after the related function has been graphed as shown above, it is necessary to determine the appropriate shading for the graph of the inequality. The portion of the plane to be shaded includes all points for which y – 2 is less than |x + 4|, so the part of the plane below the graph of the function should be shaded. Alternatively, one could test a point on either side of the graphed function to determine which portion of the plane to shade.
060510_SituationAbsGraph.doc Page 5 of 12
!
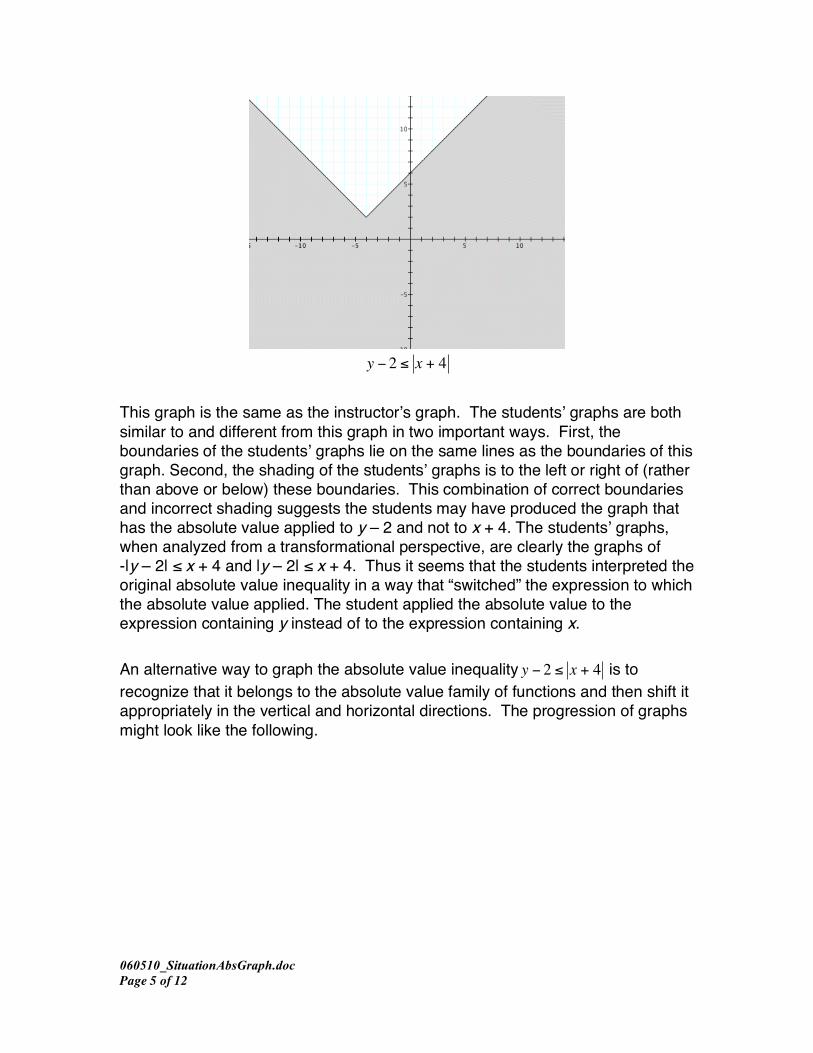
y " 2 # x + 4 This graph is the same as the instructor’s graph. The students’ graphs are both similar to and different from this graph in two important ways. First, the boundaries of the students’ graphs lie on the same lines as the boundaries of this graph. Second, the shading of the students’ graphs is to the left or right of (rather than above or below) these boundaries. This combination of correct boundaries and incorrect shading suggests the students may have produced the graph that has the absolute value applied to y – 2 and not to x + 4. The students’ graphs, when analyzed from a transformational perspective, are clearly the graphs of -|y – 2| ≤ x + 4 and |y – 2| ≤ x + 4. Thus it seems that the students interpreted the original absolute value inequality in a way that “switched” the expression to which the absolute value applied. The student applied the absolute value to the expression containing y instead of to the expression containing x. An alternative way to graph the absolute value inequality
!
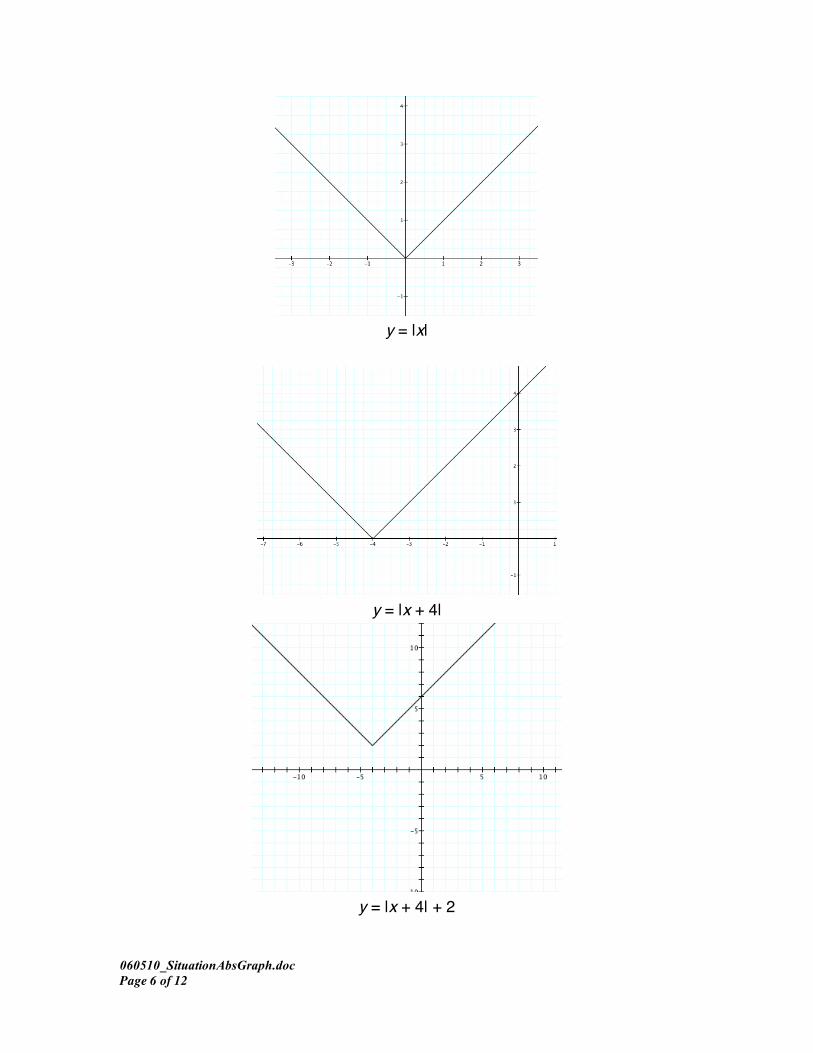
y " 2 # x + 4 is to recognize that it belongs to the absolute value family of functions and then shift it appropriately in the vertical and horizontal directions. The progression of graphs might look like the following.
060510_SituationAbsGraph.doc Page 6 of 12
y = |x|
y = |x + 4|
y = |x + 4| + 2
060510_SituationAbsGraph.doc Page 7 of 12
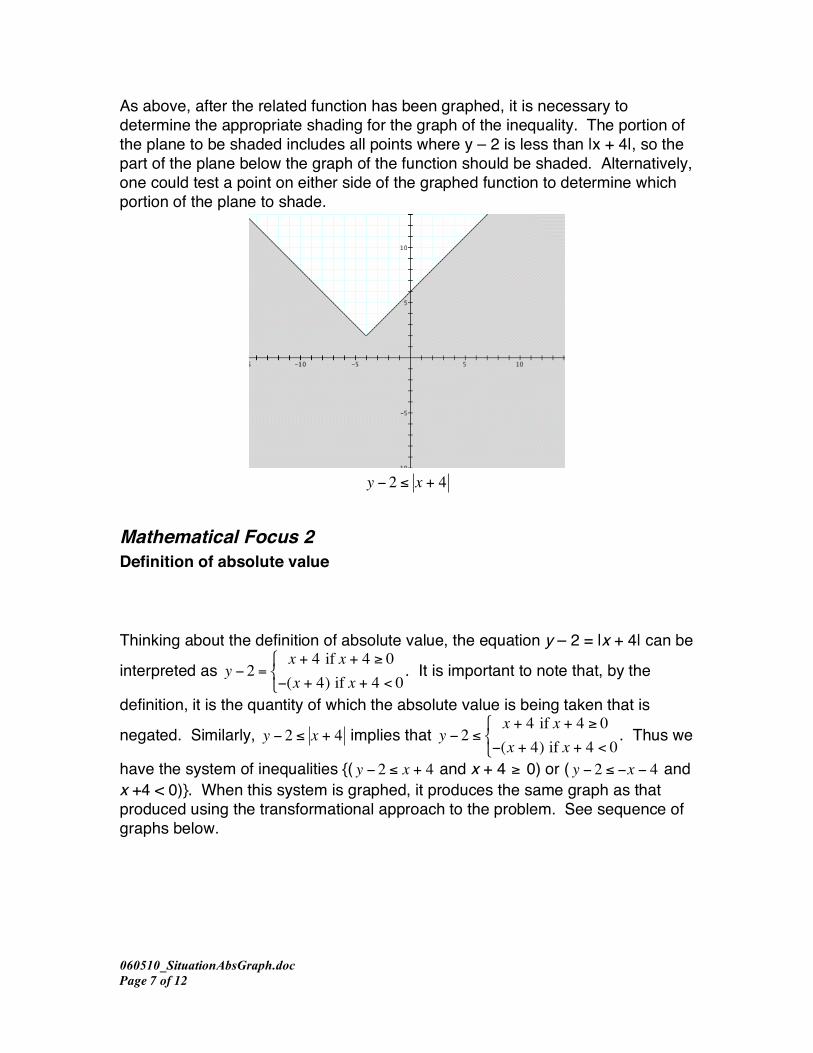
As above, after the related function has been graphed, it is necessary to determine the appropriate shading for the graph of the inequality. The portion of the plane to be shaded includes all points where y – 2 is less than |x + 4|, so the part of the plane below the graph of the function should be shaded. Alternatively, one could test a point on either side of the graphed function to determine which portion of the plane to shade.
!
y " 2 # x + 4
Mathematical Focus 2 Definition of absolute value Thinking about the definition of absolute value, the equation y – 2 = |x + 4| can be
interpreted as
!
y " 2 =x + 4 if x + 4 # 0
"(x + 4) if x + 4 < 0
$ % &
. It is important to note that, by the
definition, it is the quantity of which the absolute value is being taken that is
negated. Similarly,
!
y " 2 # x + 4 implies that
!
y " 2 #x + 4 if x + 4 $ 0
"(x + 4) if x + 4 < 0
% & '
. Thus we
have the system of inequalities {(
!
y " 2 # x + 4 and x + 4
!
" 0) or (
!
y " 2 # "x " 4 and x +4 < 0)}. When this system is graphed, it produces the same graph as that produced using the transformational approach to the problem. See sequence of graphs below.
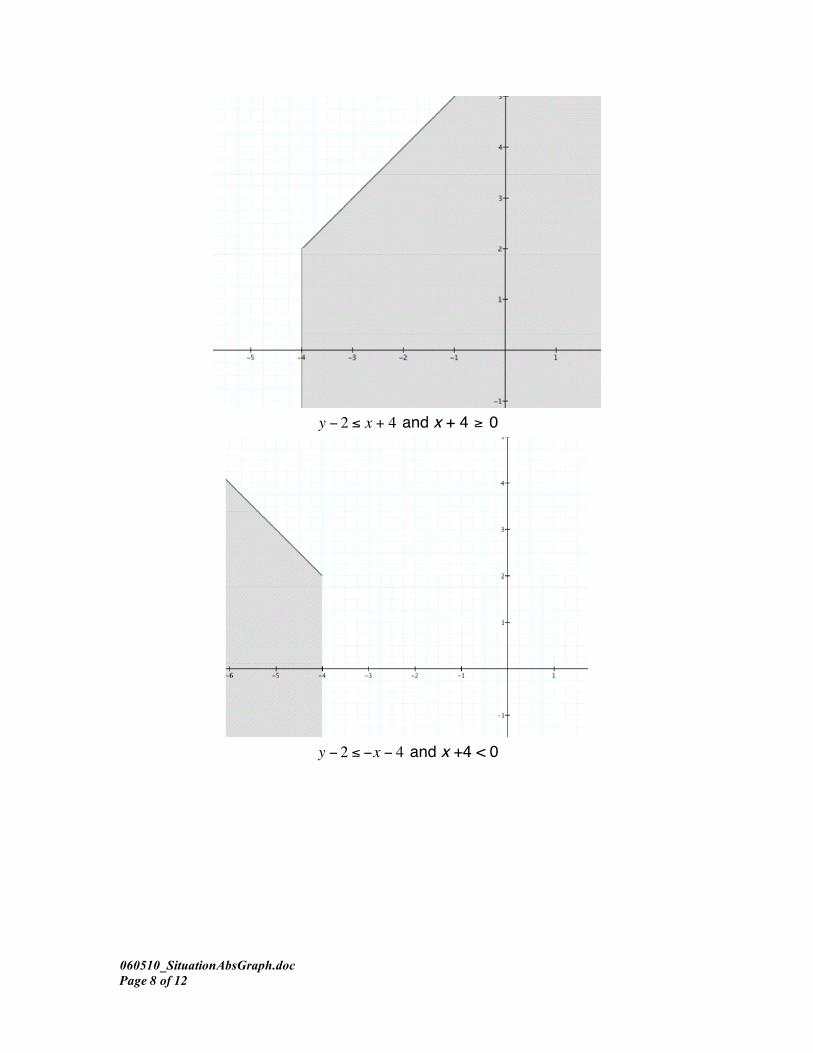
060510_SituationAbsGraph.doc Page 8 of 12
!
y " 2 # x + 4 and x + 4
!
" 0
!
y " 2 # "x " 4 and x +4 < 0
060510_SituationAbsGraph.doc Page 9 of 12
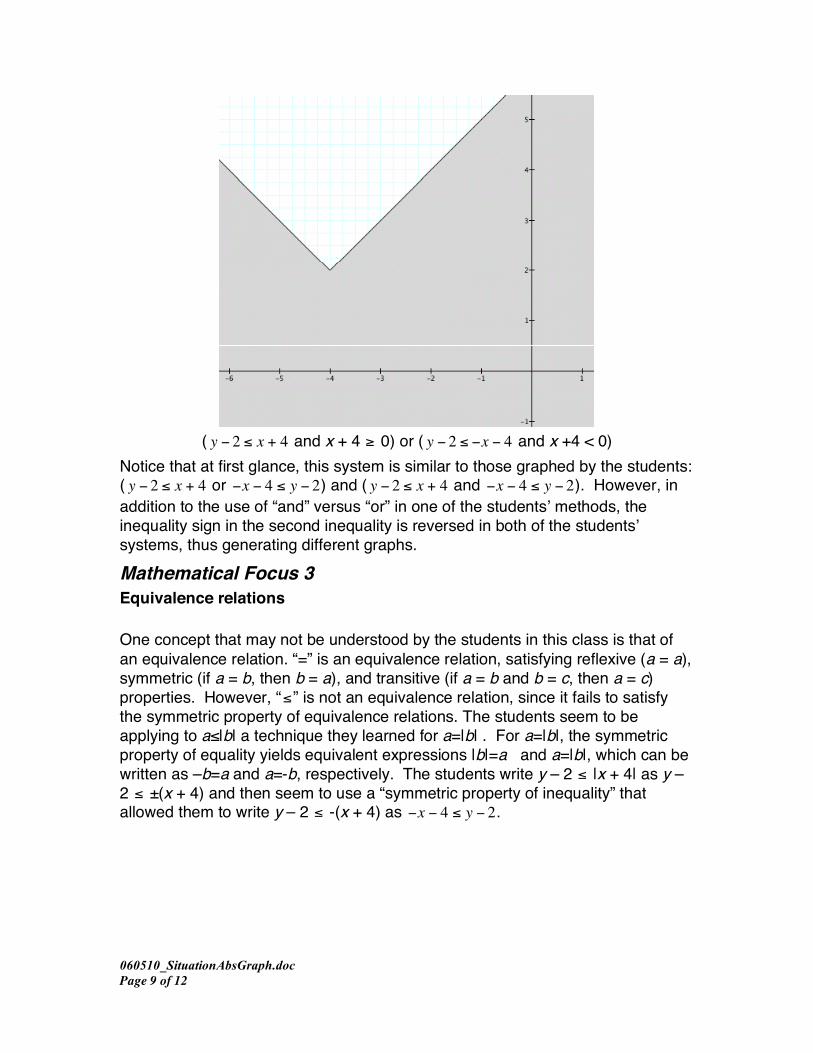
(
!
y " 2 # x + 4 and x + 4
!
" 0) or (
!
y " 2 # "x " 4 and x +4 < 0) Notice that at first glance, this system is similar to those graphed by the students: (
!
y " 2 # x + 4 or
!
"x " 4 # y " 2) and (
!
y " 2 # x + 4 and
!
"x " 4 # y " 2). However, in addition to the use of “and” versus “or” in one of the students’ methods, the inequality sign in the second inequality is reversed in both of the students’ systems, thus generating different graphs.
Mathematical Focus 3 Equivalence relations One concept that may not be understood by the students in this class is that of an equivalence relation. “=” is an equivalence relation, satisfying reflexive (a = a), symmetric (if a = b, then b = a), and transitive (if a = b and b = c, then a = c) properties. However, “
!
"” is not an equivalence relation, since it fails to satisfy the symmetric property of equivalence relations. The students seem to be applying to a≤|b| a technique they learned for a=|b| . For a=|b|, the symmetric property of equality yields equivalent expressions |b|=a and a=|b|, which can be written as –b=a and a=-b, respectively. The students write y – 2
!
" |x + 4| as y – 2
!
" ±(x + 4) and then seem to use a “symmetric property of inequality” that allowed them to write y – 2
!
" -(x + 4) as
!
"x " 4 # y " 2.
060510_SituationAbsGraph.doc Page 10 of 12
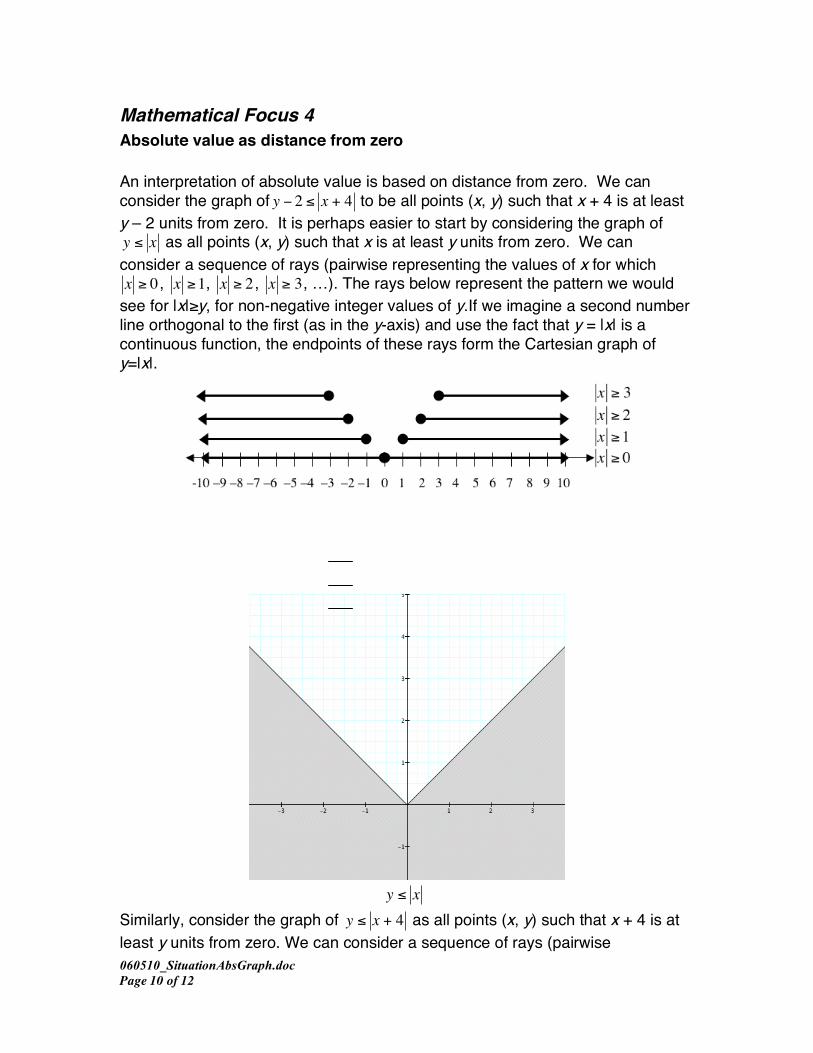
Mathematical Focus 4 Absolute value as distance from zero An interpretation of absolute value is based on distance from zero. We can consider the graph of
!
y " 2 # x + 4 to be all points (x, y) such that x + 4 is at least y – 2 units from zero. It is perhaps easier to start by considering the graph of
!
y " x as all points (x, y) such that x is at least y units from zero. We can consider a sequence of rays (pairwise representing the values of x for which
!
x " 0 ,
!
x "1,
!
x " 2 ,
!
x " 3, …). The rays below represent the pattern we would see for |x|≥y, for non-negative integer values of y.If we imagine a second number line orthogonal to the first (as in the y-axis) and use the fact that y = |x| is a continuous function, the endpoints of these rays form the Cartesian graph of y=|x|.
!
y " x Similarly, consider the graph of
!
y " x + 4 as all points (x, y) such that x + 4 is at least y units from zero. We can consider a sequence of rays (pairwise
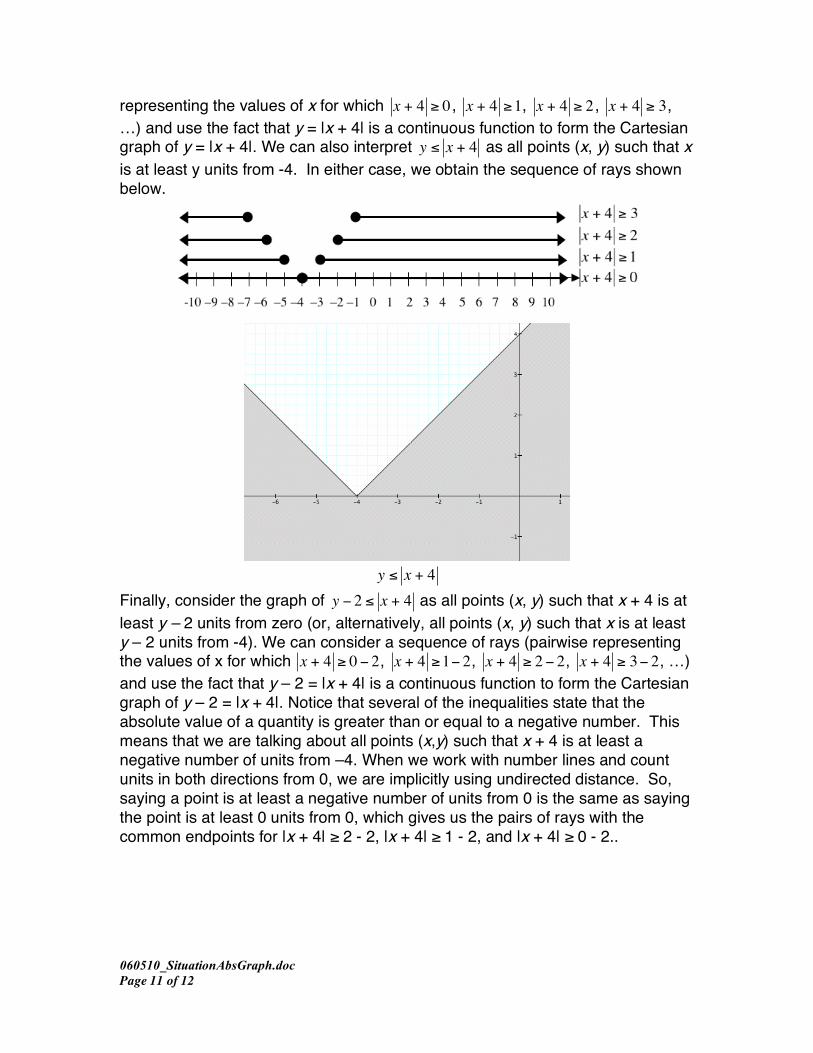
060510_SituationAbsGraph.doc Page 11 of 12
representing the values of x for which
!
x + 4 " 0 ,
!
x + 4 "1,
!
x + 4 " 2 ,
!
x + 4 " 3, …) and use the fact that y = |x + 4| is a continuous function to form the Cartesian graph of y = |x + 4|. We can also interpret
!
y " x + 4 as all points (x, y) such that x is at least y units from -4. In either case, we obtain the sequence of rays shown below.
!
y " x + 4 Finally, consider the graph of
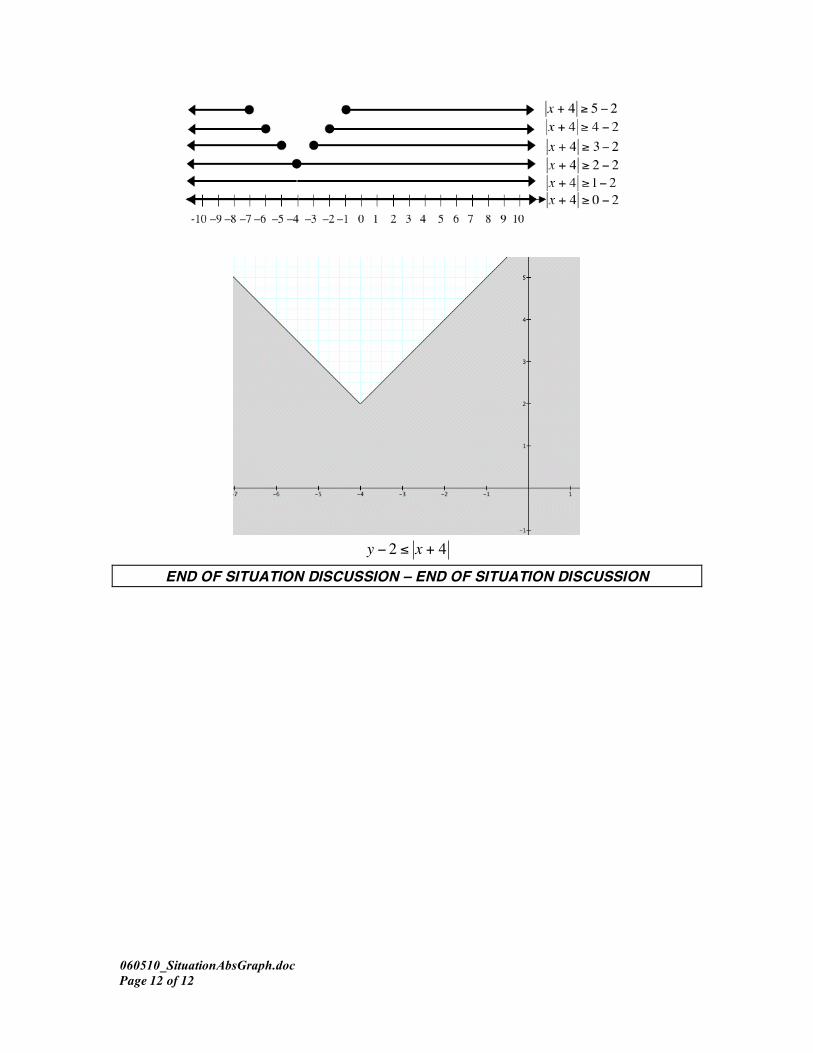
!
y " 2 # x + 4 as all points (x, y) such that x + 4 is at least y – 2 units from zero (or, alternatively, all points (x, y) such that x is at least y – 2 units from -4). We can consider a sequence of rays (pairwise representing the values of x for which
!
x + 4 " 0 # 2,
!
x + 4 "1# 2,
!
x + 4 " 2 # 2,
!
x + 4 " 3# 2, …) and use the fact that y – 2 = |x + 4| is a continuous function to form the Cartesian graph of y – 2 = |x + 4|. Notice that several of the inequalities state that the absolute value of a quantity is greater than or equal to a negative number. This means that we are talking about all points (x,y) such that x + 4 is at least a negative number of units from –4. When we work with number lines and count units in both directions from 0, we are implicitly using undirected distance. So, saying a point is at least a negative number of units from 0 is the same as saying the point is at least 0 units from 0, which gives us the pairs of rays with the common endpoints for |x + 4| ≥ 2 - 2, |x + 4| ≥ 1 - 2, and |x + 4| ≥ 0 - 2..
060510_SituationAbsGraph.doc Page 12 of 12
!
y " 2 # x + 4 END OF SITUATION DISCUSSION – END OF SITUATION DISCUSSION