Site Sustainability Plan -...
48
-
Upload
phungkhanh -
Category
Documents
-
view
220 -
download
1
Transcript of Site Sustainability Plan -...


Contents
Site Sustainability PlanPushing Forward to a Better Future
Contents
Acronyms and Abbreviations iv
Executive Summary v
Greenhouse Gas Reduction 1
Sustainable Buildings 5
Fleet Management 8
Water Use Efficiency and Management 11
Pollution Prevention and Waste Reduction 13
Sustainable Acquisition 16
Electronic Stewardship and Data Centers 17
Renewable Energy 20
Climate Change Resilience 21
High-Energy Mission-Specific Facilities 26
Budget and Funding 28
Utility Usage, Costs and Projections 29
Appendix A — Self Certification 30
Appendix B — Policy and Program Status 34
Appendix C — Social and Economic Performance 36
iii
On The Cover: A group of about 50 PNNL staff members pedaled their way to take part in the 50th Anniversary celebration of PNNL at the Toyota Center in Kennewick WA They were escorted by the Kennewick Police Department for the last leg of the 12-mile journey
Site
Sus
tain
abili
ty P
lan:
Pus
hing
For
war
d t
o a
Bet
ter
Futu
re |
FY1
5

Acronyms and AbbreviationsAFV alternative fuel vehicles ARM Atmospheric Radiation Measurement (Climate Research Facility)ASHRAE American Society of Heating, Refrigerating, and Air-Conditioning Engineers
B2B Business to Business BOCC Building Operations Control Center BTU British Thermal Unit(s)
C&D construction and demolitionCD-2 Critical Decision 2 CEDR Consolidated Energy Data ReportCEM Certified Energy Manager CEQ Council on Environmental and QualityCO2e carbon dioxide equivalentCOR City of Richland CRAC computer room air conditioningCSF Computational Sciences Facility
DC Pro Data Center Profiler Software Tool SuiteDHS U S Department of Homeland SecurityDLA Defense Logistics Agency DOE U S Department of Energy DOEGRIT DOE Green ITDSOM™ Decision Support for Operations and Maintenance Software
EB existing buildingECM energy conservation measureEISA Energy Independence and Security Act of 2007EMSL Environmental Molecular Sciences LaboratoryEPA U S Environmental Protection AgencyEPAct Energy Policy Act of 2005EPEAT Electronic Product Environmental Assessment ToolESPC Energy Savings Performance Contract EV electric vehicle
FIMS Facilities Information Management SystemFY fiscal year
gal gallon(s) GGE gallons of gasoline equivalent GHG greenhouse gas GP Guiding PrinciplesGRI Global Reporting Initiative GSA General Services AdministrationGSF gross square foot/feet
HDI How Do I?, PNNL’s standards-based management systemHEMSF High-Energy Mission-Specific Facility HPSB high performance and sustainable building
IG (DOE) Inspector General ILA industrial, landscaping, and agricultural (water)IPM integrated pest managementISB2 Information Sciences Building 2 IT information technology
JGCRI Joint Global Change Research Institute
kBtu thousands British thermal units kW kilowatt(s)
LDV light duty vehicle LEED® Leadership in Energy and Environmental Design LSB Laboratory Support Building
MHP Managed Hardware ProgramMT metric ton(s)
NASA National Aeronautics and Space AdministrationN2O nitrous oxide
OMB Office of Management and Budget
PC personal computer P2 Pollution PreventionPNNL Pacific Northwest National LaboratoryPUE power usage effectivenessPV photovoltaic
R&D research and developmentRDHx rear door heat exchanger REC Renewable Energy Certificate
SF6 sulfur hexafluorideSSP Site Sustainability Plan SSPP Strategic Sustainability Performance Plan STEM science, technology, engineering, and mathmatics
T&D transmission and distributionTRIM Total Records Information Management
U S United States
iv
Site
Sus
tain
abili
ty P
lan:
Pus
hing
For
war
d t
o a
Bet
ter
Futu
re |
FY1
5
Acronyms and Abbreviations

PNNL received two awards in FY14 that highlight our sustainability efforts—one for designing and modifying our campus to support sustainable operations and the other for taking an innovative, holistic approach to sustainability by adopting the triple-bottom-line framework to manage our social, environmental, and economic performance.
Executive Summary
Much like a honeycomb with its interlocking pieces that gain strength through mutual support and integration, our three pillars and twelve focus areas create a Sustainability Program that is greater than the sum of its parts
Executive Summary As a federal research laboratory of the United States (U S ) Department of Energy (DOE), Pacific Northwest National Laboratory (PNNL) has both an opportunity and a responsi- bility to solve complex scientific and technological challenges related to energy, environment, and national security, and we transfer that knowledge and technology to industries worldwide
PNNL’s success requires a commitment to our stakeholders—our customers, our employees, and our community We take seriously the social, environmental, and economic impacts of our operations, and our sustainability focus areas reflect the priorities of those stakeholders
With its comprehensive approach to fulfilling Executive Order 13514, PNNL advances the DOE sustainability mission with a diverse, concentrated effort to achieve the goals of fiscal year (FY)20 and beyond Our plan includes actions to conserve energy, water, and financial resources; improve the comfort and productivity of our staff members; and benefit the environment In FY14, we achieved several sustainability milestones, as highlighted below
• High Performance and Sustainable Buildings (HPSBs): PNNL certified two additional buildings in FY14 using the DOE Federal Energy Management Program (FEMP) Guiding Principles for existing buildings, resulting in 36% of our facilities meeting the HPSB criteria Construction is also underway on the first of three new buildings scheduled to become operational in FYs 15 and 16, which are being designed to meet the Guiding Principles for HPSB
• Scope 3 Greenhouse Gas (GHG) Emissions: The PNNL Telework Program continues to expand, with 6 4% of the staff participating one day a week on average and logging over 28,071 telework days in FY14 Beyond helping achieve GHG goals by eliminating commuting miles, flexible work arrangements save our staff members money and time, reduce stress, increase productivity, and help staff members achieve a better work/life balance In addition, the recently completed bi-annual commuting survey revealed a 15 5% reduction from FY13 in GHG emissions, partly due to employees teleworking more
• Industrial, Landscaping, and Agricultural (ILA) Water: Several landscape areas were analyzed in an effort to better understand ILA usage Irrigation meters, analysis of sprinkler broadcast patterns, and actual water intensity was measured The results were mixed, showing many areas being overwatered, while a few needed a little more Changes enacted from these efforts lead to improvements in sprinkler-nozzle sizing and watering times, resulting in an overall 2 3% reduction of ILA water compared to the previous FY
For additional information about these projects, please refer to the success story sections of this Site Sustainability Plan (SSP)
v
Site
Sus
tain
abili
ty P
lan:
Pus
hing
For
war
d t
o a
Bet
ter
Futu
re |
FY1
5

Summary Table of Goals and Targets
SSPP Goal DOE Goal
Performance Status Through FY14
Planned Actions and Contribution
Risk of Non-
attainment
Goal #1: Greenhouse Gas Reduction
1.1 28% Scope 1 & 2 GHG reduction by FY20 from a FY08 baseline (FY14 target: 19%)
FY08 Baseline: 43,686 metric tons (MT) of carbon dioxide equivalent (CO2e)FY14 Actual: 18,027 MTCO2e (50,699 MTCO2e without renewable energy certificates [RECs])FY20 Goal: 31,454 MTCO2e Status: 58.7% reduction
Continue REC purchases for near-term GHG reduction goal and implement energy conservation measures, where cost-effective
Low
1.2 13% Scope 3 GHG reduction by FY20 from a FY08 baseline (FY14 target: 5%)
FY08 Baseline: 24,122 MTCO2eFY14 Actual: 23,616 MTCO2e (21,463 MTCO2e adjusted for RECs)FY20 Goal: 20,987 MTCO2e Status: 11% reduction
Continue promoting telework and high-end video usage to reduce travel; encourage staff through bus and carpool promotions and incentives
Low
Goal #2: Sustainable Buildings
2.1 30% energy intensity (British thermal units [Btu] per gross square foot [GSF]) reduction by FY15 from a FY03 baseline (FY14 target: 27%)
FY03 Baseline: 213,700 Btu/GSF FY14 Actual: 181,976 Btu/GSFFY15 Goal: 149,590 Btu/GSF Status: 14.8% reduction
Continue implementing Consolidated Energy Data Report (CEDR) projects and operational improvements
High
2.2 Energy Independence and Security Act of 2007 (EISA) Section 432 energy and water evaluations
Completed second year of the 4-year EISA cycle of eight buildings
Continue executing EISA evaluations
Low
2.3 Individual buildings metering for 90% of electricity (by October 1, 2012); for 90% of steam, natural gas, and chilled water (by October 1, 2015)(1) (FY14 target: 90% and 75%, respectively)
FY14: 97.9% metering of electricity, 98.5% metering of natural gas, 100% metering of water
Improve building performance through data analysis from the meters. Assessment will be completed for new FIMS buildings in FY15
Low
2.4 Unless uneconomical, install cool roof for replacements unless project already has Critical Decision-2 (CD-2) approval. New roofs must have thermal resistance of at least R-30
FY14: 49% of PNNL roof area per Facilities Information Management System (FIMS) are cool roofs
Unless uneconomical, all new roofs will have a thermal resistance of at least R-30 and be solar reflective, consistent with former DOE Secretary Chu requirements
Low
The following table summarizes each of DOE’s Office of Science goals, along with PNNL’s performance status, planned actions, and an assessment of the risk of non-attainment as noted below:
Technical Risks: Technology is/is not available in current facilities and systems to attain goal
Management Risks: Management systems and/or policies may require changes for which approval authority is outside DOE or requires an internal policy or procedural change
Financial Risks: Funds are/are not identified in current or out-year targets to achieve goal
Each risk is assigned a rating of high, medium, or low, defined as follows
High Risk: Risk in one of the three categories is so significant that goal non-attainment is likely or expected
Medium Risk: Risk in one of the three categories is significant enough that goal non-attainment is moderate
Low Risk: Any risks are satisfactorily mitigated such that goal attainment is likely
(1) Per National Energy Conservation Policy Act (U.S. Code Section 8253), the term “buildings” includes industrial, process, or laboratory facilities.
vi
Site
Sus
tain
abili
ty P
lan:
Pus
hing
For
war
d t
o a
Bet
ter
Futu
re |
FY1
5
Executive Summary

2.5 15% of existing buildings greater than 5,000 GSF are compliant with the HPSB Guiding Principles by FY15 (FY14 target:13%)
36% of PNNL buildings > 5,000 GSF per FIMS are HPSB compliant
Continue trending toward 100% of facilities meeting HPSB
Low
2.6 All new construction, major renovations, and building alterations greater than 5,000 GSF must comply with the Guilding Principles(2)
Institutionalized the Guiding Principles commitment in PNNL Engineering Standards
Achieve Guiding Principles for all new construction, major renovations, and building alterations greater than 5,000 GSF
Low
2.7 Efforts to increase regional and local planning coordination and involvement
Collaborated with DOE RL and Hanford Site contractors on sustainability topics
Continuing leveraging partnerships to obtain SSP goals
Low
Goal #3: Fleet Management
3.1 10% annual increase in fleet alternative fuel consumption by FY15 relative to FY05 baseline (FY14 target: 136% cumulative since FY05)
FY06 Baseline: 456 gallons (gal) of gasoline equivalent (GGE) (note: FY05 usage not measured)FY14 Actual: 11,267 (GGE)FY20 Goal: 1,183 (GGE) Status: Exceeded goal
Actively manage alternate fuel use through fleet oversight and staff member training; increase percentage of alternative fuel vehicles (AFVs) when available
Low
3.2 2% annual reduction in fleet petroleum consumption by FY20 relative to FY05 baseline (FY14 target: 18% cumulative since FY05)
FY05 Baseline: 38,824 (GGE)FY14 Actual: 31,836 (GGE)FY20 Goal: 28,674 (GGE) Status: 18.0% reduction
Continue assessing the transition to AFVs
Low
3.3 100% of light duty vehicle (LDV) purchases must consist of AFV by FY15 and thereafter (75% FY00–FY15)
Of total 38 LDVs in PNNL fleet, 34 (89%) are AFVs; added 5 E85 AFVs and 1 hybrid in FY14
Continue working with fleet vendors to replace vehicles with AFV types where available
Low
Goal #4: Water Use Efficiency and Management
4.1 26% potable water intensity (gal/GSF) reduction by FY20 from a FY07 baseline (FY14 target: 14%)
FY07 Baseline: 70.08 gal/GSFFY14 Actual: 25.87 gal/GSFFY20 Goal: 51.86 gal/GSF Status: Exceeded goal
As feasible, continue implementing potable water projects to reduce overall use
Low
4.2 20% water consumption (gal) reduction of industrial, landscaping, and agricultural (ILA) water by FY20 from a FY10 baseline (FY14 target: 8%)
FY11 Baseline: 176,248,000 galFY14 Actual: 143,184,541 galFY20 Goal: 140,998,400 gal Status: 18.8% decrease
Continue implementing Landscaping Plan with focus on reducing ILA where possible
Low
Goal #5: Pollution Prevention and Waste Reduction
5.1 Divert at least 50% of non-hazardous solid waste, excluding construction and demolition (C&D) debris, by FY15
FY14: Diverted 54% of non-hazardous solid waste
Continue conducting assessments for waste reduction opportunities
Low
5.2 Divert at least 50% of C&D materials and debris by FY15
FY14: Diverted nearly 98% of C&D waste
Continue monitoring C&D recycling performance and raising awareness on waste diversion requirements
Low
(2) DOE considers buildings meeting the following criteria as complying with Guilding Principles (GPs): Any building that achieves LEED-EB Silver or higher or LEED-NC Gold or higher; Any building that achieves a Green Globes-NC rating of four or a Green Globes CIEB rating of three; Any building that has been occupied for more than one year that achieves Living Status designation by the Living Building Challenge (although included as policy in the 2012 SSPP, these equivalencies are contingent upon Office of Management and Budget (OMB) and Council on Environmental and Quality (CEQ) approval).
vii
Site
Sus
tain
abili
ty P
lan:
Pus
hing
For
war
d t
o a
Bet
ter
Futu
re |
FY1
5
Executive Summary

Goal #6: Sustainable Acquisition
6.1 Procurements meet requirements by including necessary provisions and clauses in 95% of applicable contracts
100% of acquisitions have sustainability requirements and clauses
Continue being proactive with sustainable item procurement
Low
Goal #7: Electronic Stewardship and Data Centers
7.1 All core data centers are metered to measure a monthly power utilization effectiveness (PUE) of 100% by FY15 (FY14 target: 90%)
All of PNNL’s three data centers are now fully metered
Complete data center metering before
Low
7.2 Core data centers maximum annual weighted average PUE of 1.4 by FY15 (FY14 target: 1.50)
FY14: Annual weighted average PUE is 1.33
Implement projects to maintain the goal
Low
7.3 Electronic Stewardship: 100% of eligible personal computers (PCs), laptops, and monitors with power management actively implemented and in use by FY12
100% of eligible equipment is compliant
Assure new equipment has power management features
Low
Goal #8: Renewable Energy
8.1 20% of annual electricity consumption from renewable sources by FY20 (FY14 target: 7.5%)
FY14: 50.1% of annual electric consumption from on-site generation and REC purchases
Continue operating our 125 kilowatt (kW) on-site photovoltaic (PV) array and purchasing RECs
Low
Goal #9: Climate Change Resilience
9.1 Address DOE Climate Change Adaptation Plan goals (see Appendic C)
Completed all actions planned for FY14
Continue to seek opportunities to participate in existing partnership with agencies in the Pacific Northwest region
Low
Goal #10: Energy Performance Contracts
10.1 Utilization of Energy Performance Contracts
Three Energy Savings Performance Contracts (ESPCs) have been implemented at PNNL
Future projects will leverage the use of alternate financing if applicable
Low
viii
Site
Sus
tain
abili
ty P
lan:
Pus
hing
For
war
d t
o a
Bet
ter
Futu
re |
FY1
5
Executive Summary

Goals1.1 – 28% Scope 1 & 2 GHG reduction by FY20 from a FY08 baseline
1.2 – 13% Scope 3 GHG reduction by FY20 from a FY08 baseline
Greenhouse Gas Reduction
Sulfur Hexafluoride Reduction
PNNL inventoried all of its existing sources of sulfur hexafluoride (SF6) and has a good understanding of its uses, which have historically been as an insulator in electron microscopes and as tracer gas in research In 2011, PNNL worked with researchers who used SF6 as a tracer to adopt a substitute gas, nitrous oxide (N2O), which has a lower global warming potential This replacement has continued, and no new project work has included SF6 For electron microscopes,
Scope 1&2 GHG emissions for DOE reported buildings MTCO2e
PNNL will continue targeting opportunities that have a net positive effect on Scope 1, 2, and 3 GHG emissions.
FY14 Performance Status
Scope 1 & 2PNNL continues to work toward the goal of reducing GHG Scope 1 & 2 emissions by 28% by FY20 compared with our FY08 baseline In FY14, PNNL targeted several activities to reduce Scope 1 & 2 GHG Activities include installation of variable air volume fume hoods, further consolidation of data servers, retro commissioning, updating our Engineering Standards and Specifications, and initiating daily Building Operations Control Center (BOCC) meetings with the air balance team
The PNNL FY08 Scope 1 & 2 GHG baseline is 43,686 MTCO2e Between FYs 08 and 14, Scope 1 & 2 GHG emissions increased from 43,686 MTCO2e to 50,699 MTCO2e This was largely driven by an increase in computer equipment to support of our growing computational sciences research area PNNL continues to implement its strategy of procuring RECs in FY14, resulting in an offset of 32,672 MTCO2e
1
Site
Sus
tain
abili
ty P
lan:
Pus
hing
For
war
d t
o a
Bet
ter
Futu
re |
FY1
5
Greenhouse Gas Reduction

In FY14, PNNL took major steps to enhance remote collaboration capabilities and encourage staff to explore alternatives to business travel where possible Key accomplishments include:
• Launch of the newest Connected@PNNL mobile app “Connect” to all staff members, which allows users to easily and remotely connect with and locate each other
• Continued technical support and training for the suite of mobile platform tools which allow employees to access work documents, staff directories and applications remotely
• Added high-end Tandem video systems to conference rooms throughout PNNL and satellite locations to facilitate Lync video meetings Another 20 conference rooms now have an overhead projector and Polycom Roundtable camera, which lets remote meeting participants see 360° views of the physical meeting space and gives individual views that target the person speaking
SF6 is relatively stable, and any year-to-year fluctuations are primarily due to use of a mass balance inventory method
Scope 3All Scope 3 Emissions
Scope 3 emissions totaled 21,463 MTCO2e, representing an 11% reduction from the FY08 baseline(1) after adjusting for transmission and distribution loss-related emissions avoided through REC purchases
In FY14, business travel was the largest contributor to these emissions (56 2%), followed by employee commuting (30 8%) and transmission and distribution (T&D) losses (10 7%) Emissions from contracted solid waste disposal and wastewater treatment made up just 2 2%
Scope 3 GHG emissions for DOE reported buildings MTCO2e
Business Air and Ground Travel
In FY14, total emissions from business travel were 13,283 MTCO2e, an increase of 1 5% compared with FY13 Air travel totaled 12,530 MTCO2e and increased 1 7% compared with FY13 Business ground travel accounted for 753 MTCO2e, a decrease of 2 7% from the previous year
While PNNL has made some reductions in business travel volume since a peak in FY10, emissions remain 2% above FY08 baseline levels As noted in previous SSPs, PNNL experienced a dramatic increase during FY09 and FY10 in business volume and business travel to support project-specific requirements (e g , the Department of Homeland Security’s (DHS) Radiation Portal Monitoring Program)
(1) Scope 3 calculations for all years FY08 – FY14 were adjusted to reflect T&D losses associated with electricity use for additional buildings not previously included in PNNL’s reported portfolio.
Scope 3 Business Travel
Employee Commuting
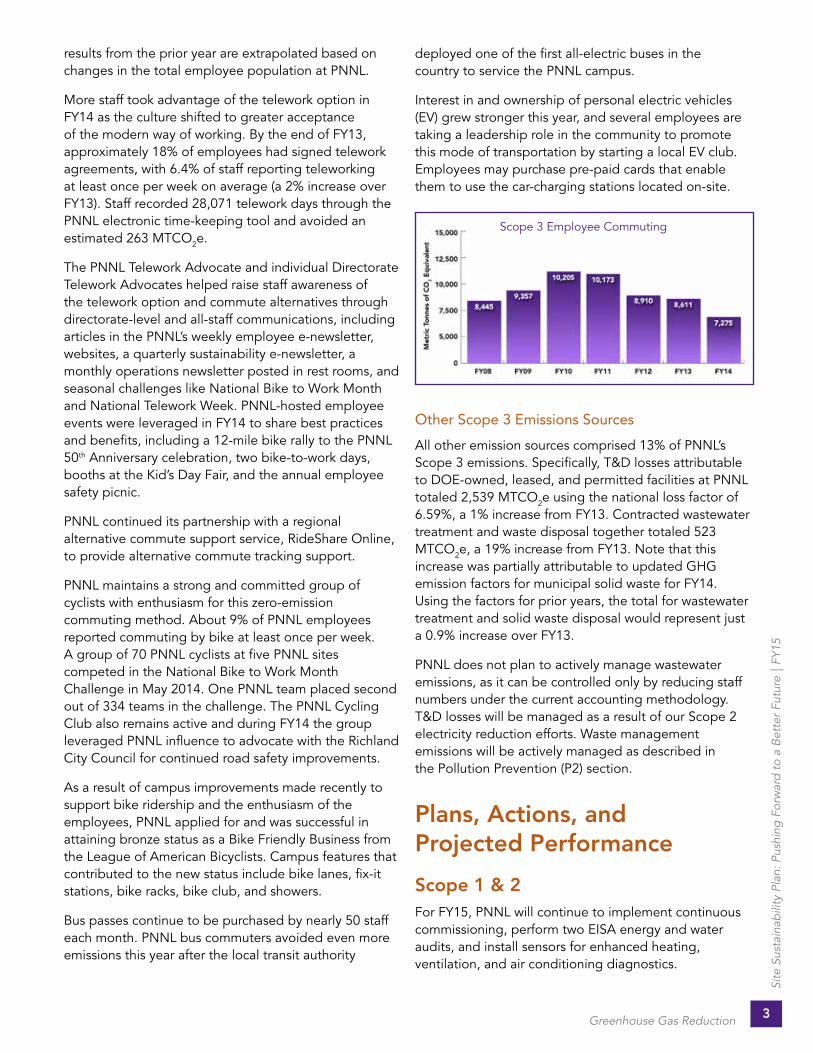
PNNL’s employee commute emissions in FY14 totaled 7,275 MTCO2e, a decrease of 15 5% from FY13 Employee commuting represented the largest category of Scope 3 emissions reductions from FY13, both as a percentage and in absolute MTCO2e The decrease in FY14 employee commute emissions is attributed to a decrease in permanent staff of 3% from FY13 levels, the continued growth of the telework program, and a decrease in the average commute distance reported by employees in the bi-annual Commute Survey Employee commute emissions in FY14 were 14% below the FY08 baseline
Employee commute emissions are calculated using the results of the General Services Administration’s Scope 3 Commuter Survey The survey is conducted bi-annually, and for years in which the survey is not conducted,
2
Site
Sus
tain
abili
ty P
lan:
Pus
hing
For
war
d t
o a
Bet
ter
Futu
re |
FY1
5
Greenhouse Gas Reduction
deployed one of the first all-electric buses in the country to service the PNNL campus
Interest in and ownership of personal electric vehicles (EV) grew stronger this year, and several employees are taking a leadership role in the community to promote this mode of transportation by starting a local EV club Employees may purchase pre-paid cards that enable them to use the car-charging stations located on-site
Scope 3 Employee Commuting
results from the prior year are extrapolated based on changes in the total employee population at PNNL
More staff took advantage of the telework option in FY14 as the culture shifted to greater acceptance of the modern way of working By the end of FY13, approximately 18% of employees had signed telework agreements, with 6 4% of staff reporting teleworking at least once per week on average (a 2% increase over FY13) Staff recorded 28,071 telework days through the PNNL electronic time-keeping tool and avoided an estimated 263 MTCO2e
The PNNL Telework Advocate and individual Directorate Telework Advocates helped raise staff awareness of the telework option and commute alternatives through directorate-level and all-staff communications, including articles in the PNNL’s weekly employee e-newsletter, websites, a quarterly sustainability e-newsletter, a monthly operations newsletter posted in rest rooms, and seasonal challenges like National Bike to Work Month and National Telework Week PNNL-hosted employee events were leveraged in FY14 to share best practices and benefits, including a 12-mile bike rally to the PNNL 50th Anniversary celebration, two bike-to-work days, booths at the Kid’s Day Fair, and the annual employee safety picnic
PNNL continued its partnership with a regional alternative commute support service, RideShare Online, to provide alternative commute tracking support
PNNL maintains a strong and committed group of cyclists with enthusiasm for this zero-emission commuting method About 9% of PNNL employees reported commuting by bike at least once per week A group of 70 PNNL cyclists at five PNNL sites competed in the National Bike to Work Month Challenge in May 2014 One PNNL team placed second out of 334 teams in the challenge The PNNL Cycling Club also remains active and during FY14 the group leveraged PNNL influence to advocate with the Richland City Council for continued road safety improvements
As a result of campus improvements made recently to support bike ridership and the enthusiasm of the employees, PNNL applied for and was successful in attaining bronze status as a Bike Friendly Business from the League of American Bicyclists Campus features that contributed to the new status include bike lanes, fix-it stations, bike racks, bike club, and showers
Bus passes continue to be purchased by nearly 50 staff each month PNNL bus commuters avoided even more emissions this year after the local transit authority
Other Scope 3 Emissions Sources
All other emission sources comprised 13% of PNNL’s Scope 3 emissions Specifically, T&D losses attributable to DOE-owned, leased, and permitted facilities at PNNL totaled 2,539 MTCO2e using the national loss factor of 6 59%, a 1% increase from FY13 Contracted wastewater treatment and waste disposal together totaled 523 MTCO2e, a 19% increase from FY13 Note that this increase was partially attributable to updated GHG emission factors for municipal solid waste for FY14 Using the factors for prior years, the total for wastewater treatment and solid waste disposal would represent just a 0 9% increase over FY13
PNNL does not plan to actively manage wastewater emissions, as it can be controlled only by reducing staff numbers under the current accounting methodology T&D losses will be managed as a result of our Scope 2 electricity reduction efforts Waste management emissions will be actively managed as described in the Pollution Prevention (P2) section
Plans, Actions, and Projected Performance
Scope 1 & 2For FY15, PNNL will continue to implement continuous commissioning, perform two EISA energy and water audits, and install sensors for enhanced heating, ventilation, and air conditioning diagnostics
3
Site
Sus
tain
abili
ty P
lan:
Pus
hing
For
war
d t
o a
Bet
ter
Futu
re |
FY1
5
Greenhouse Gas Reduction
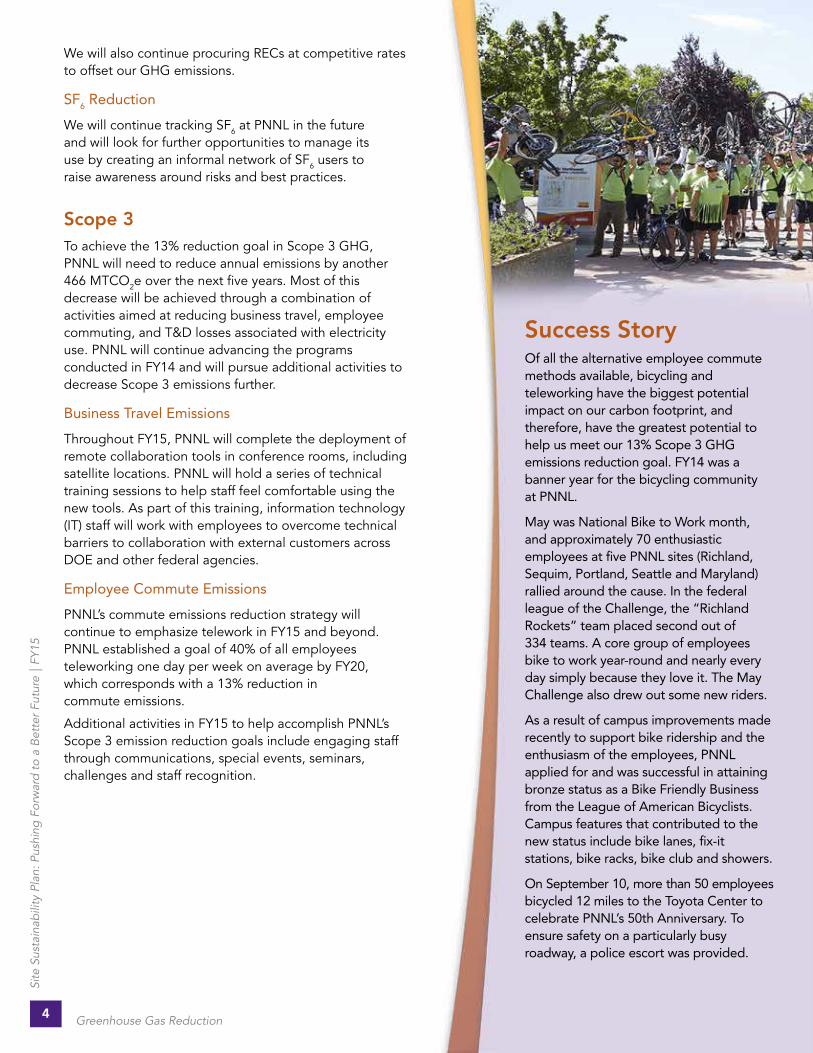
Success StoryOf all the alternative employee commute methods available, bicycling and teleworking have the biggest potential impact on our carbon footprint, and therefore, have the greatest potential to help us meet our 13% Scope 3 GHG emissions reduction goal. FY14 was a banner year for the bicycling community at PNNL.
May was National Bike to Work month, and approximately 70 enthusiastic employees at five PNNL sites (Richland, Sequim, Portland, Seattle and Maryland) rallied around the cause. In the federal league of the Challenge, the “Richland Rockets” team placed second out of 334 teams. A core group of employees bike to work year-round and nearly every day simply because they love it. The May Challenge also drew out some new riders.
As a result of campus improvements made recently to support bike ridership and the enthusiasm of the employees, PNNL applied for and was successful in attaining bronze status as a Bike Friendly Business from the League of American Bicyclists. Campus features that contributed to the new status include bike lanes, fix-it stations, bike racks, bike club and showers.
On September 10, more than 50 employees bicycled 12 miles to the Toyota Center to celebrate PNNL’s 50th Anniversary. To ensure safety on a particularly busy roadway, a police escort was provided.
We will also continue procuring RECs at competitive rates to offset our GHG emissions
SF6 Reduction
We will continue tracking SF6 at PNNL in the future and will look for further opportunities to manage its use by creating an informal network of SF6 users to raise awareness around risks and best practices
Scope 3To achieve the 13% reduction goal in Scope 3 GHG, PNNL will need to reduce annual emissions by another 466 MTCO2e over the next five years Most of this decrease will be achieved through a combination of activities aimed at reducing business travel, employee commuting, and T&D losses associated with electricity use PNNL will continue advancing the programs conducted in FY14 and will pursue additional activities to decrease Scope 3 emissions further
Business Travel Emissions
Throughout FY15, PNNL will complete the deployment of remote collaboration tools in conference rooms, including satellite locations PNNL will hold a series of technical training sessions to help staff feel comfortable using the new tools As part of this training, information technology (IT) staff will work with employees to overcome technical barriers to collaboration with external customers across DOE and other federal agencies
Employee Commute Emissions
PNNL’s commute emissions reduction strategy will continue to emphasize telework in FY15 and beyond PNNL established a goal of 40% of all employees teleworking one day per week on average by FY20, which corresponds with a 13% reduction in commute emissions
Additional activities in FY15 to help accomplish PNNL’s Scope 3 emission reduction goals include engaging staff through communications, special events, seminars, challenges and staff recognition
4
Site
Sus
tain
abili
ty P
lan:
Pus
hing
For
war
d t
o a
Bet
ter
Futu
re |
FY1
5
Greenhouse Gas Reduction
Sustainable BuildingsAdvanced metering, HPSB, EISA evaluations, and energy efficiency project implementation continues to drive positive progress toward PNNL’s energy goals.
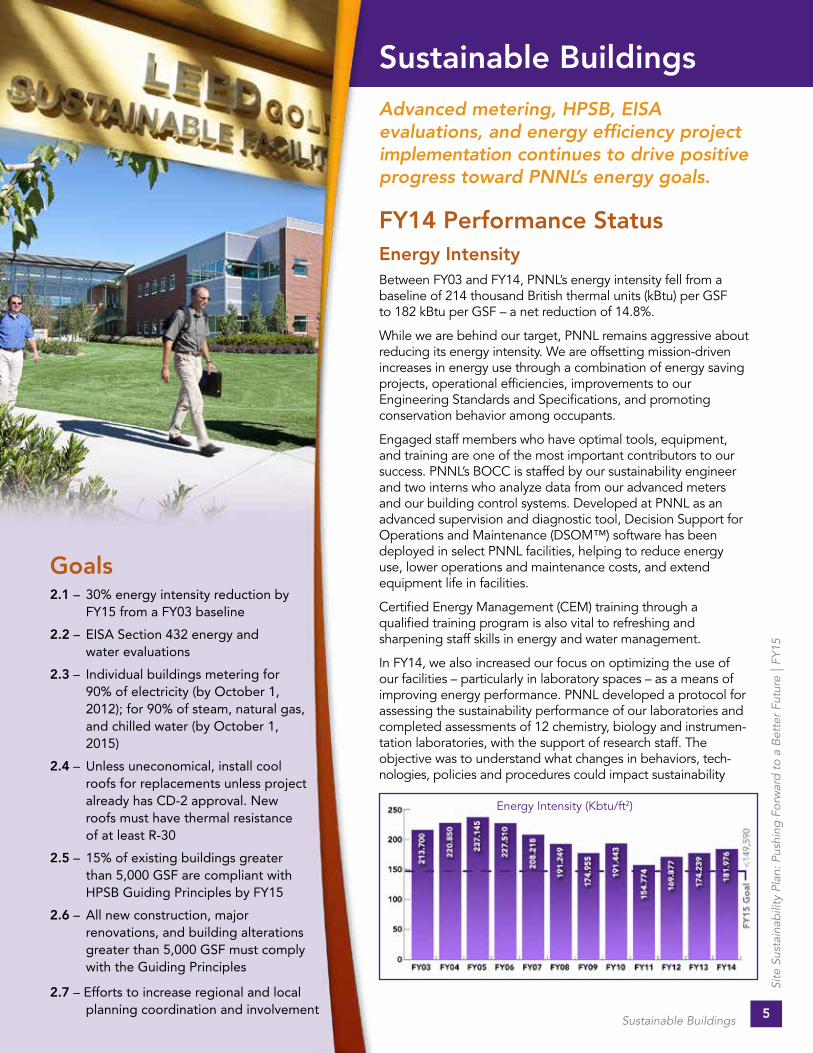
FY14 Performance StatusEnergy IntensityBetween FY03 and FY14, PNNL’s energy intensity fell from a baseline of 214 thousand British thermal units (kBtu) per GSF to 182 kBtu per GSF – a net reduction of 14 8%
While we are behind our target, PNNL remains aggressive about reducing its energy intensity We are offsetting mission-driven increases in energy use through a combination of energy saving projects, operational efficiencies, improvements to our Engineering Standards and Specifications, and promoting conservation behavior among occupants
Engaged staff members who have optimal tools, equipment, and training are one of the most important contributors to our success PNNL’s BOCC is staffed by our sustainability engineer and two interns who analyze data from our advanced meters and our building control systems Developed at PNNL as an advanced supervision and diagnostic tool, Decision Support for Operations and Maintenance (DSOM™) software has been deployed in select PNNL facilities, helping to reduce energy use, lower operations and maintenance costs, and extend equipment life in facilities
Certified Energy Management (CEM) training through a qualified training program is also vital to refreshing and sharpening staff skills in energy and water management
In FY14, we also increased our focus on optimizing the use of our facilities – particularly in laboratory spaces – as a means of improving energy performance PNNL developed a protocol for assessing the sustainability performance of our laboratories and completed assessments of 12 chemistry, biology and instrumen- tation laboratories, with the support of research staff The objective was to understand what changes in behaviors, tech- nologies, policies and procedures could impact sustainability
Energy Intensity (Kbtu/ft2)
5
Site
Sus
tain
abili
ty P
lan:
Pus
hing
For
war
d t
o a
Bet
ter
Futu
re |
FY1
5
Goals2.1 – 30% energy intensity reduction by FY15 from a FY03 baseline
2.2 – EISA Section 432 energy and water evaluations
2.3 – Individual buildings metering for 90% of electricity (by October 1, 2012); for 90% of steam, natural gas, and chilled water (by October 1, 2015)
2.4 – Unless uneconomical, install cool roofs for replacements unless project already has CD-2 approval. New roofs must have thermal resistance of at least R-30
2.5 – 15% of existing buildings greater than 5,000 GSF are compliant with HPSB Guiding Principles by FY15
2.6 – All new construction, major renovations, and building alterations greater than 5,000 GSF must comply with the Guiding Principles
2.7 – Efforts to increase regional and local planning coordination and involvement
Sustainable Buildings

performance in our laboratories Opportunities were identified in fume hood management, cold storage management, and the operation of table-top equipment (e g ovens, incubators)
The final list of buildings excluded from the energy intensity goal and a copy of the exclusion self-certification letter can be found in Appendix A
EISA EvaluationsPNNL successfully completed the second of the 4-year cycle for our buildings that are subject to EISA section 432 energy and water evaluation requirements In FY14, we completed three facilities, the information from which was used immediately to improve plant performance and plan for future energy conservation measures (ECMs), whenever cost-effective
MeteringWhole-building metering, as required by EISA for electricity, natural gas, and water, has been completed for all buildings where economic calculations showed that it was viable to install With real-time meter data, our BOCC has all the necessary information to perform system analyses on facilities The PNNL Metering Plan details our successful completion of this goal and outlines future strategies of how we intend to use the data
Cool RoofsPNNL’s Engineering Standards and Specifications ensure that all new construction and renovations meet the cool roof requirements In FY14, the PNNL cool roof inventory was 651,527 square feet, or approximately 49% of FIMS facilities We will continue to add cool roofs in both new construction and when replacing existing building roofs, when life-cycle cost-effective
Existing BuildingsCurrently, 36% of PNNL buildings have been classified as HPSB All existing FIMS buildings have been assessed against the HPSB Guiding Principles using the checklist provided in the U S Environmental Protection Agency’s (EPA’s) ENERGY STAR Portfolio Manager
A gap analysis in FY11 determined that pursuing either Leadership in Energy and Environmental Design (LEED®) for existing buildings (EB) Silver or the FEMP Guiding Principles EB certification were both viable strategies to progress toward 100% of all buildings meeting the HPSB criteria In FY14, two buildings were selected to meet the Guiding Principles - the Laboratory Support Building (LSB) and the Radiological Calibrations Laboratory (318) PNNL successfully documented their compliance with the Guiding Principle requirements by the end of FY14
Number of Buildings that are HPSB
New ConstructionPNNL began construction of a new laboratory facility in FY14, designed to meet the new American Society of Heating, Refrigerating & Air Conditioning Engineers (ASHRAE) 90 1 2010 energy code and will be certified LEED Gold Additionally, potential strategies to achieve the FY30 goal of net zero buildings continue to be discussed and actively incorporated, where life-cycle cost-effective, into our Engineering Standards
Regional and Local PlanningCollaboration with the City of Richland (COR), our local utility provider, allows PNNL to secure long-term, reliable utility services COR is the primary electrical service provider for the PNNL Campus In FY11, DOE requested that PNNL evaluate 300 Area site services, particularly electrical, to consider options to determine the best value for the government PNNL completed the evaluation, and in FY11, recommended that DOE pursue the COR for 300 Area electrical services With the approval and com- pletion of various agreements, PNNL established a COR 300 Area electrical service agreement, initiated construc- tion, and in FY14, successfully completed the project
Plans, Actions, and Projected PerformanceEnergy IntensityThrough the BOCC, PNNL will continue initiating real-time commissioning of facility systems to increase attention on daily building system operations and reduce dependency on periodic retro commissioning Energy conservation measures will be evaluated for life-cycle cost-effectiveness and return-on-investment calculations The ability to monitor, perform diagnostics, and make informed decisions will enhance the overall performance of PNNL facilities, leading to increased energy savings and greater operational performance
Maintaining a highly qualified organization is vital to the long-term success of the Sustainability Program and, ultimately, the completion of the goals outlined in this SSP We will continue to train staff regarding the latest building efficiency technologies and maintain or increase the amount of qualified certified energy managers (CEMs)
PNNL believes that achieving the 30% energy intensity reduction goal by FY15 is unlikely Business growth in key areas of PNNL’s portfolio has led to energy intensity increases, most of which have been offset by aggressive 6
Site
Sus
tain
abili
ty P
lan:
Pus
hing
For
war
d t
o a
Bet
ter
Futu
re |
FY1
5
Sustainable Buildings
Success StoryIn FY14, the LSB and the 318 buildings were documented to comply with the Guiding Principles for HPSB. The 318 building was the second government facility on the PNNL campus to meet the Guiding Principles, and LSB was the first leased building. PNNL has exceeded the goal that 15% of existing buildings comply with the Guiding Principles for HPSB by FY15, with 36% of our inventory now complying with the Guiding Principles or an approved equivalence (i.e. LEED).
Supporting documentation was provided for both buildings for each Guiding Principle, including: Integrated Assess- ment, Operation, and Management; Energy Efficiency; Indoor and Outdoor Water Efficiencies; Occupant Environ- mental Comfort; and Recycled Content.
The re-carpeting of the 83,921 square-foot LSB in 2011 helped it meet the recycled content Guiding Principle. The carpet chosen contains a minimum of 40% post-consumer recycled content, among the highest in the industry.
To meet the requirements for the outdoor water Guiding Principle for the 318 building, PNNL uses no potable or other water for outdoor irrigation at this facility.
management of energy usage in other areas We will look for additional ways to reduce energy while continuing our world-class research
EISA EvaluationsPNNL will continue to conduct energy and water evaluations in our EISA-covered facilities With the 40% increase in FIMS buildings, the number of covered facilities for PNNL has increased from 8 to 10 In FY15, our plan is to evaluate two buildings, as outlined in the CEDR This will keep us on track to complete approximately 25% of our facilities every year, allowing us to distribute workload and funding Identified ECMs will be tracked in the CEDR, with funding requests initiated into our planning process
MeteringWith the 40% increase to our FIMS inventory of buildings, PNNL intends to assess the value of installing advanced metering, based on life-cycle cost-effectiveness Those determined to be value-added will be submitted for funding and prioritized with other planned work activities PNNL will continue to gather data for BOCC use and analyze it with our award-winning DSOM software Any operational improvements or maintenance corrections can be easily identified and corrected in real time Future strategies for data use will be outlined in the PNNL Metering Plan
Cool RoofsBy integrating requirements to install cool roofs into to our Building Engineering Standards and Specifications, PNNL is ensuring that cool roofs are the default consideration for all roof installations, replacements and repairs
Existing BuildingsPNNL believes it will be challenging to comply with the Guiding Principles of HPSB in 100% of buildings in PNNL’s FIMS inventory Investments to achieve the Guiding Principles for HPSB in existing buildings may not be cost-effective, depending on the facility age, mechanical equipment designs, or specific and specialized research activities In FY15, PNNL is planning to complete an assessment to determine the cost of certifying the remaining facilities
New ConstructionPNNL will build three new facilities over the next several years We have committed that all new construction, major renovations, and alterations of buildings greater than 5,000 GSF will comply with the Guiding Principles or equivalent certification methods Planning for future facilities, including line item, general plant project, or leases, will include these requirements
The availability of high-efficiency facility equipment and the incorporation of advancements in engineering methods will allow PNNL to work toward net zero buildings PNNL will strive to meet this goal and will use life-cycle cost analysis methods to implement viable technologies and strategies
Regional and Local PlanningPNNL will continue to strengthen our existing relationships, along with reaching out to others—acting as a role model for how the community can implement sustainable practices
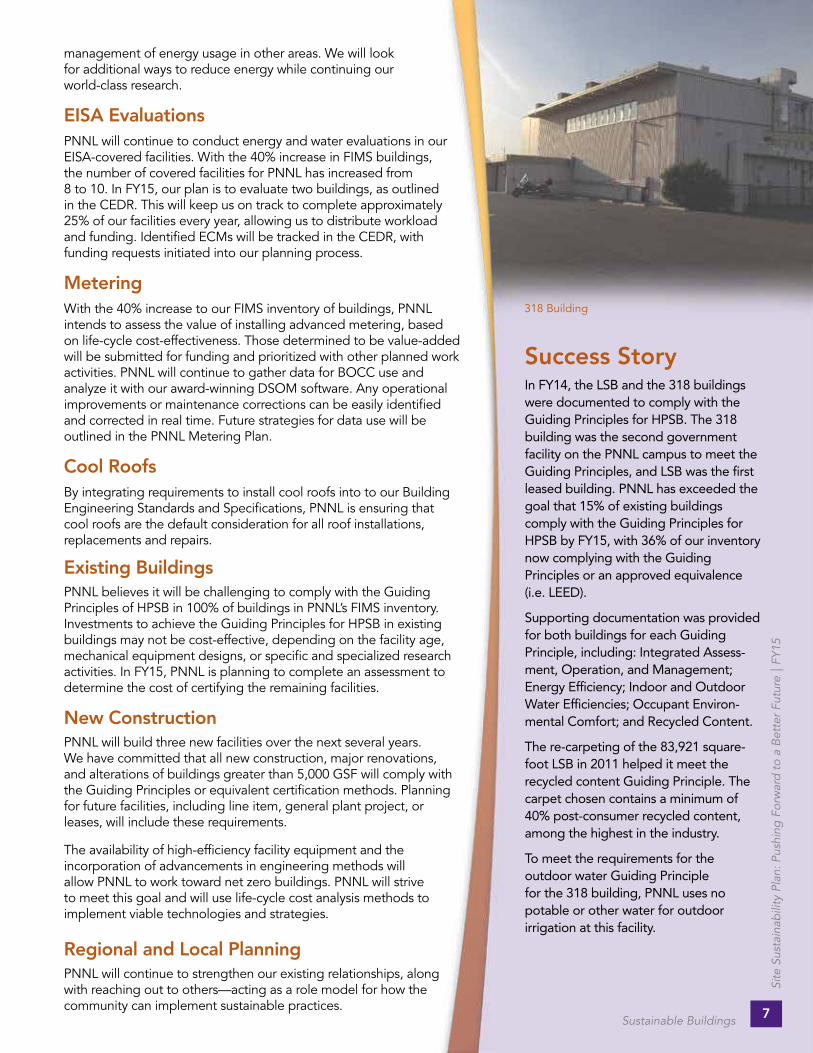
318 Building
7
Site
Sus
tain
abili
ty P
lan:
Pus
hing
For
war
d t
o a
Bet
ter
Futu
re |
FY1
5
Sustainable Buildings

Goals3.1 – 10% annual increase in fleet alternative fuel consumption by FY15 relative to a FY05 baseline
3.2 – 2% annual reduction in fleet petroleum consumption by FY20 relative to a FY05 baseline
3.3 – 100% of light duty vehicle purchases must consist of AFVs by FY15
Fleet Management Plan
Fleet ManagementPNNL will continue working diligently to meet all fleet goals and balance program requirements by increasing our alternative fuel fleet and integrating additional electric vehicles into service.
FY14 Performance Status
Alternative FuelThrough continued training and proactive management, PNNL has far exceeded the goal of increasing alternative fuel use to the original baseline of 456 GGE PNNL continues to work with local fuel stations to secure a continued supply of E85 fuel
Reduced PetroleumPNNL continues to trend in the right direction through expanded use of AFVs, including electric vehicles In FY14, PNNL achieved the 2% annual reduction and met the cumulative target of 18% since FY05
PNNL Electric Vehicle
Alternative Fuel (GGE)
Petroleum Reduction (GGE)
8
Site
Sus
tain
abili
ty P
lan:
Pus
hing
For
war
d t
o a
Bet
ter
Futu
re |
FY1
5
Fleet Management
Alternative Fuel VehiclesPNNL strives to meet the FY14 goal of 75% AFV purchases annually by working with vehicle suppliers to acquire them whenever possible During FY14, 75% of the new fleet acquisitions consisted of AFVs Currently, PNNL has a total of 38 LDVs, of which 34 (89%) are AFVs
Plans, Actions, and Projected PerformanceAlternative FuelPNNL will continue to research the availability of bio-diesel fuel in place of standard diesel PNNL is also researching full-time electric vehicles and their capabilities for space and payload, with the idea of replacing some of the current larger gas and diesel engine vehicles
Reduced PetroleumPNNL is currently evaluating fleet practices at other national laboratories, including whether they have an established vehicle pool from which staff request a government-owned vehicle as needed, and how the pool operates PNNL will continue to look at sharing of vehicles, mileage reimbursement plans, and short-term rentals, where viable
Alternative Fuel VehiclesPNNL will continue working with the General Services Administration (GSA) or other vehicle suppliers to replace vehicles with AFV types whenever available
Fleet Management PlanPNNL’s Fleet Management is aligned within the Asset Management organization, which oversees the efficient lifecycle management of assets and materials One of Fleet Management’s primary responsibilities is to oversee the government-owned vehicles and equipment that support PNNL’s mission Fleet Management provides the vehicles that facilitate research in the field, relocate offices, and keep our facilities fully operational In addition to Fleet Management, the business areas that Asset Management is responsible for include Property Management, Shipping and
Receiving, Excess and Redeployment, and Property Accounting
PNNL’s fleet procurement each year is based on replacement needs of the current fleet GSA-leased vehicles are replaced according to the GSA retention schedule, depending on the type of vehicle and the vehicle’s current mileage DOE-owned vehicles are also replaced on a schedule similar to the GSA retention schedule Each year, PNNL reviews the eligible vehicles for replacement and the current business requirements of the fleet and requests replacement vehicles that meet DOE requirements and business needs Replacement vehicle orders are reviewed to meet acquisition and sustainability goals, by ensuring that all light duty vehicles acquired use alternative fuel, and all medium- and heavy-duty vehicles are the most fuel efficient possible (EISA section 142; EO 13514 section 2; EO 13423 and EPAct 1992, section 303) Vehicle fuel type is also taken into consideration, based on location and availability of the fuel types where the vehicle is utilized
PNNL vehicles are fueled at local fueling stations that accept either the Wright Express card supplied with GSA vehicles or a P-card issued to the vehicle driver of a DOE-owned vehicle Currently, the PNNL site has unleaded, diesel, and E85 fuel types available in the area Only vehicles accepting these types of fuels are acquired for the PNNL fleet
PNNL’s entire fleet is assigned to a permanent custodian/organization to meet the business objectives Annual justifications are required and reviewed to ensure vehicles are being utilized and properly assigned At the time the vehicle is assigned to the organization, drivers are instructed on basic policies of operating a vehicle and provided additional policies for detailed instructions of the responsibilities of operating a government vehicle
Each year, vehicle custodians are required to submit a justification for the upcoming year vehicle needs The justification provides the business need and estimated utilization goal The information is reviewed quarterly to ensure the fleet is meeting business needs and to determine if vehicles need to be redistributed in order to enhance the overall utilization of PNNL’s fleet
9
Site
Sus
tain
abili
ty P
lan:
Pus
hing
For
war
d t
o a
Bet
ter
Futu
re |
FY1
5
Fleet Management

Success StoryAlthough we made significant progress reducing petroleum consumption through the purchase and increased use of electric neighborhood vehicles over the past several years, PNNL has been striving to improve performance through sustainable operating practices as well. In FY14, PNNL assessed and optimized the delivery routes used by petroleum-consuming trucks. The logistics team also sought opportunities to consolidate loads and streamline deliveries. A full truck is seen as a sign of success.
These practices have reduced both the total miles traveled and the number of trips between buildings, leading to reductions in petroleum consumption and GHG emissions, as well as economic savings.
The overall mileage has been reduced 23% from FY12 and 12% from FY13.
FY12 Mileage = 24,683
FY13 Mileage = 22,464
FY14 Mileage = 19,998
At this time, PNNL does not have any specific plans for increasing or decreasing the fleet size
The PNNL fleet currently has a total of 90 vehicles (89 leased and 1 owned) We replace 9 to 10 vehicles per year, depending on the age and mileage utilization Currently, 38 light-duty vehicles, of which 89% (34) are alternatively fueled vehicles The average age of the PNNL fleet is 4 5 years old Proper maintenance and replacing vehicles as soon as they are eligible helps to keep repair cost down by using warrantee coverage on newer vehicles, diverting the cost to the manufacturer instead of DOE
10
Site
Sus
tain
abili
ty P
lan:
Pus
hing
For
war
d t
o a
Bet
ter
Futu
re |
FY1
5
Fleet Management
Goals4.1 – 26% potable water intensity reduction by FY20 from a FY07 baseline
4.2 – 20% water consumption reduction of ILA water by FY20 from a FY10 baseline
Water Use Efficiency and ManagementPNNL will continue balancing water use with enhanced energy efficiency and sustainable landscaping for overall water reduction.
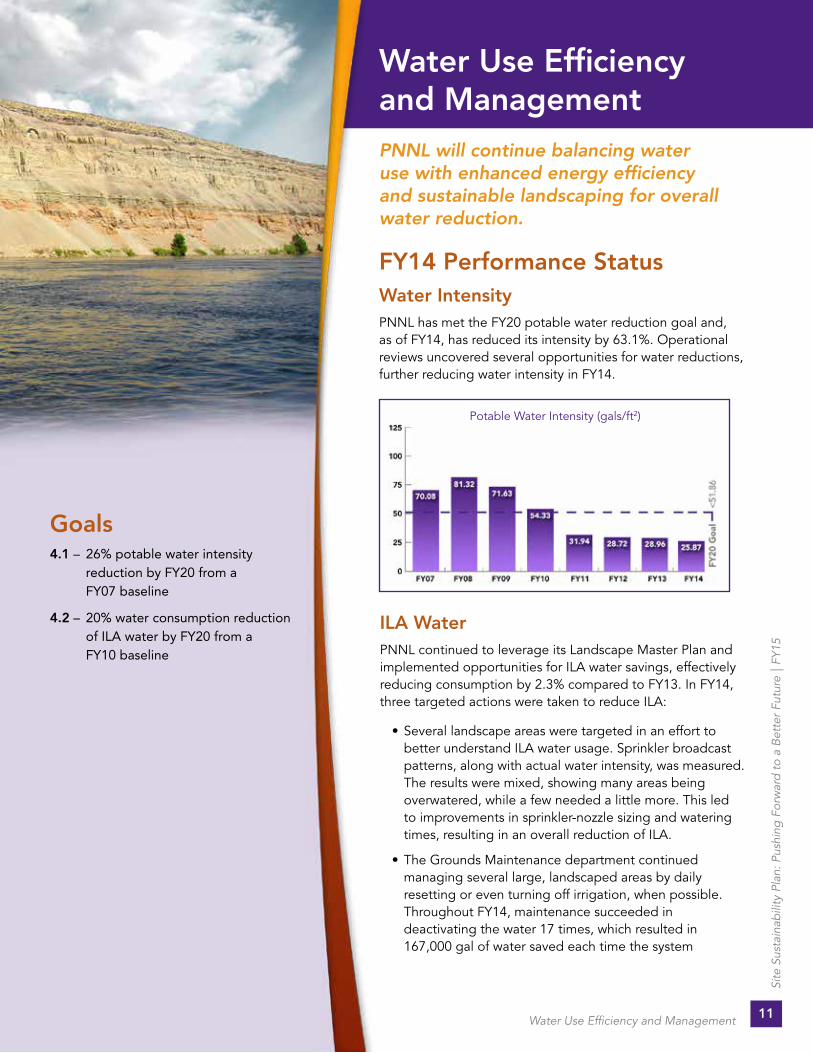
FY14 Performance StatusWater IntensityPNNL has met the FY20 potable water reduction goal and, as of FY14, has reduced its intensity by 63 1% Operational reviews uncovered several opportunities for water reductions, further reducing water intensity in FY14
Potable Water Intensity (gals/ft2)
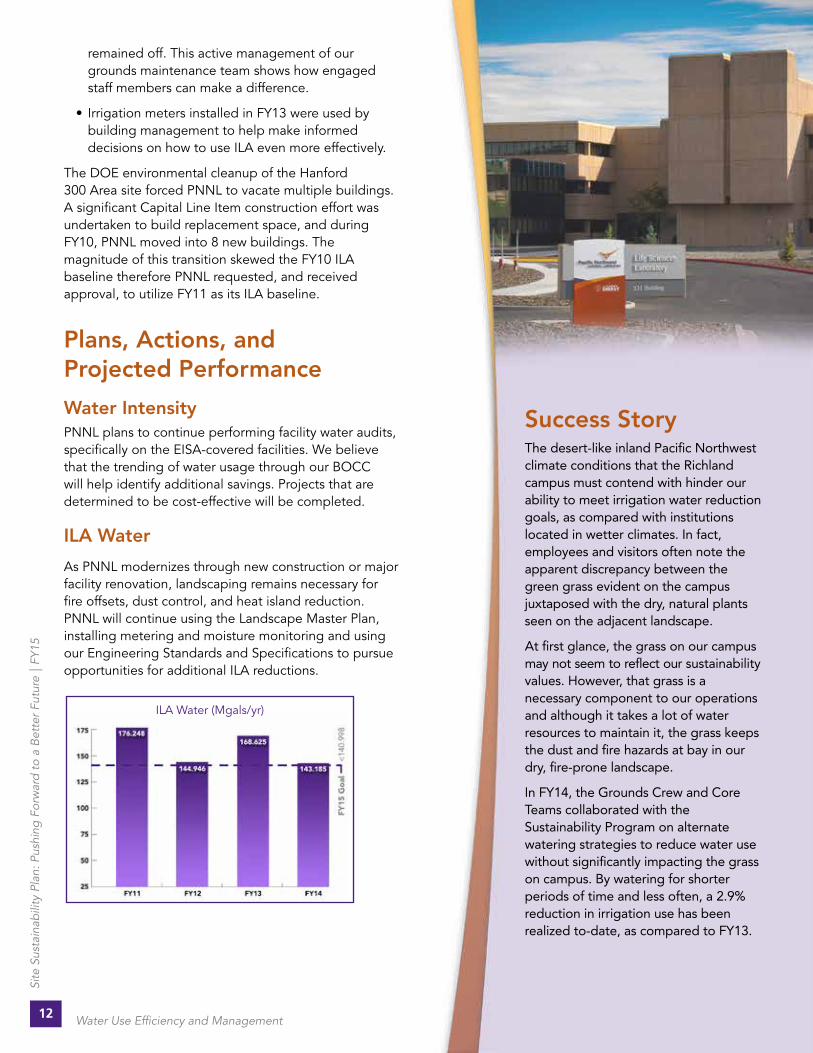
ILA WaterPNNL continued to leverage its Landscape Master Plan and implemented opportunities for ILA water savings, effectively reducing consumption by 2 3% compared to FY13 In FY14, three targeted actions were taken to reduce ILA:
• Several landscape areas were targeted in an effort to better understand ILA water usage Sprinkler broadcast patterns, along with actual water intensity, was measured The results were mixed, showing many areas being overwatered, while a few needed a little more This led to improvements in sprinkler-nozzle sizing and watering times, resulting in an overall reduction of ILA
• The Grounds Maintenance department continued managing several large, landscaped areas by daily resetting or even turning off irrigation, when possible Throughout FY14, maintenance succeeded in deactivating the water 17 times, which resulted in 167,000 gal of water saved each time the system
11
Site
Sus
tain
abili
ty P
lan:
Pus
hing
For
war
d t
o a
Bet
ter
Futu
re |
FY1
5
Water Use Efficiency and Management
Success StoryThe desert-like inland Pacific Northwest climate conditions that the Richland campus must contend with hinder our ability to meet irrigation water reduction goals, as compared with institutions located in wetter climates. In fact, employees and visitors often note the apparent discrepancy between the green grass evident on the campus juxtaposed with the dry, natural plants seen on the adjacent landscape.
At first glance, the grass on our campus may not seem to reflect our sustainability values. However, that grass is a necessary component to our operations and although it takes a lot of water resources to maintain it, the grass keeps the dust and fire hazards at bay in our dry, fire-prone landscape.
In FY14, the Grounds Crew and Core Teams collaborated with the Sustainability Program on alternate watering strategies to reduce water use without significantly impacting the grass on campus. By watering for shorter periods of time and less often, a 2.9% reduction in irrigation use has been realized to-date, as compared to FY13.
ILA Water (Mgals/yr)
remained off This active management of our grounds maintenance team shows how engaged staff members can make a difference
• Irrigation meters installed in FY13 were used by building management to help make informed decisions on how to use ILA even more effectively
The DOE environmental cleanup of the Hanford 300 Area site forced PNNL to vacate multiple buildings A significant Capital Line Item construction effort was undertaken to build replacement space, and during FY10, PNNL moved into 8 new buildings The magnitude of this transition skewed the FY10 ILA baseline therefore PNNL requested, and received approval, to utilize FY11 as its ILA baseline
Plans, Actions, and Projected Performance
Water IntensityPNNL plans to continue performing facility water audits, specifically on the EISA-covered facilities We believe that the trending of water usage through our BOCC will help identify additional savings Projects that are determined to be cost-effective will be completed
ILA Water
As PNNL modernizes through new construction or major facility renovation, landscaping remains necessary for fire offsets, dust control, and heat island reduction PNNL will continue using the Landscape Master Plan, installing metering and moisture monitoring and using our Engineering Standards and Specifications to pursue opportunities for additional ILA reductions
12
Site
Sus
tain
abili
ty P
lan:
Pus
hing
For
war
d t
o a
Bet
ter
Futu
re |
FY1
5
Water Use Efficiency and Management

Goals5.1 – Divert at least 50% of non-hazardous solid waste, excluding C&D debris, by FY15
5.2 – Divert at least 50% of C&D materials and debris by FY15
Pollution Prevention and Waste Reduction
PNNL will continue increasing waste diversion and reduce or reuse its chemical inventory.
FY14 Performance Status
Waste DiversionSolid Waste
PNNL has integrated recycling and excessing programs for multiple waste streams, including electronics, batteries, research equipment, furniture, office products, scrap metal, wood, paper, plastic, glass, aluminum, tin, and cardboard PNNL’s excessing process includes verifying that items are free of beryllium, radiological, or biological contamination A procedure in “How Do I?” (HDI)—PNNL’s standards-based management tool—provides instructions and requirements for all staff members prior to releasing any materials or equipment from PNNL HDI also provides instructions on waste minimiza- tion through recycling or redistribution Non-regulated chemicals are diverted from the landfill through the waste minimization process For example, in FY14, over 2,000 pounds of non-regulated Kaolinite powder was redistributed within PNNL to multiple projects, and over 150 kg of “Boehmite” powder was reused by others through public auction
As part of the strategy to move toward a fully integrated campus, relocation of selected capabilities continued in FY14 As relocations occur, PNNL recycles and redistributes as much as possible, including chemicals, furniture, books, journals, and electronic media (see Success Story for details)
PNNL also continues hosting “zero waste” picnic events through mixed recycling and teaming with a local pig farmer In FY14, PNNL diverted approximately 54% of non-hazardous sanitary waste
Diversion of Non-Hazardous Waste from Landfill
13
Site
Sus
tain
abili
ty P
lan:
Pus
hing
For
war
d t
o a
Bet
ter
Futu
re |
FY1
5
Pollution Prevention and Waste Reduction
Construction and Demolition Waste
PNNL has a wide variety of C&D work activities, from large construction projects to small scopes of work Recycling and reuse strategies are integrated during project planning, enabling continued success in construction and demolition waste diversion For example, in FY14, soil stockpiling during development of a new LEED laboratory and office building was segregated from other clearing waste for future use as grading and landscaping material Approximately 500 tons of material was diverted from the landfill as a result of this effort Based on available data, PNNL diverted 98% of C&D waste in FY14
Composting
PNNL’s effort in reducing compostable waste includes the use of two industrial-size hot composters for on-site food waste composting and a yard waste collection lugger for off-site composting In FY14, PNNL composted approximately 1 ton of food waste, and approximately 30 tons of yard waste was sent off-site for composting
P2 Program
The primary mechanism PNNL uses to reduce waste is conducting P2 assessments and funding the opportunities identified with PNNL’s dedicated sustainability investment fund, called Sustainability Pays
In an effort to reduce toner/cartridge waste from network and personal printers, a handful of network-able copiers were reprogramed to perform printing, copying, and scanning functions Based on a previous P2 assessment, significant reduction of toner/cartridges waste is possible if network printers are removed and replaced with lower numbers of network copiers The next step is to convert other network-able copiers throughout PNNL, when appropriate
Toxic Chemical ReductionChemical Management
PNNL’s ChemAgain chemical redistribution program provides the primary means of collecting and redistributing usable chemicals This program has successfully redirected over 220 containers of chemicals through internal transfer or donation
PNNL’s strategy for implementing an integrated, risk-based approach in managing chemicals differentiates between substances based on the level of impact to safety and operations and contribution to the research and development (R&D) missions The strategy accounts for the lifecycle of the material, its impact on
facilities, and the data generated and used by staff and management This process improves integration and effectiveness and helps reduce costs, while maintaining excellence in management, research, and operations
Integrated Pest Management
PNNL has state-licensed commercial pesticide applicators on the grounds crew These professionals are required to complete continuing education annually to learn about the latest trends in pest control, current chemical and biological control agents, and updated legislative changes All applicators are committed to integrated pest management (IPM) principles, where applicable
The grounds staff recognizes the responsibility to provide a clean, low-pest environment at PNNL and strives to limit control efforts to those absolutely required for optimal results Pest control methods begin with the lowest impact, escalating when required, and only to the level necessary for acceptable control
IPM best practices are summarized below:
• using wasp traps in lieu of spraying
• removing pest attractants from the grounds and loading docks, such as cardboard and wood pallets
• using sticky and metal traps for mouse control
• using netting and spikes to reduce bird droppings
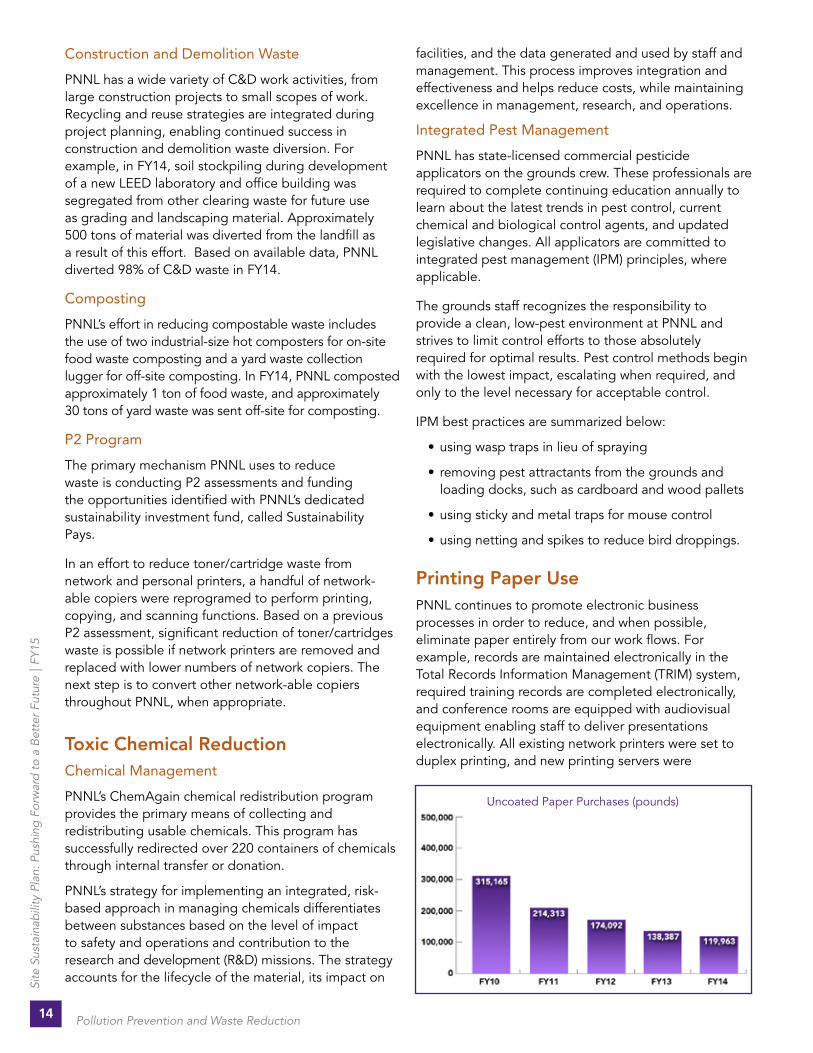
Printing Paper UsePNNL continues to promote electronic business processes in order to reduce, and when possible, eliminate paper entirely from our work flows For example, records are maintained electronically in the Total Records Information Management (TRIM) system, required training records are completed electronically, and conference rooms are equipped with audiovisual equipment enabling staff to deliver presentations electronically All existing network printers were set to duplex printing, and new printing servers were
Uncoated Paper Purchases (pounds)
14
Site
Sus
tain
abili
ty P
lan:
Pus
hing
For
war
d t
o a
Bet
ter
Futu
re |
FY1
5
Pollution Prevention and Waste Reduction

Success StoryOffice and laboratory moves present an opportunity to optimize the campus footprint and improve operating efficiency. Project planners minimize waste impact from these moves by identifying recycling and reuse opportunities.
Prior to a move, the costs to relocate or purchase new equipment/furniture are compared, as this defines the move scope and disposition paths. Items not being relocated are either reused internally, donated to local non-profits, or recycled through a scrap metal vendor.
During FY14, PNNL’s Relocation Services Team prepared a sustainability plan, which implements PNNL’s pollution prevention principles. The first project to benefit was the Sigma 4 relocation project. Recycling bins were arranged in a central staging area for staff to deposit journals, electronic media, and re-useable office supplies. Staff members worked with the Relocation Service Center (RSC) project manager to excess unwanted items.
The Sigma 4 relocation was sustainable in part due to the close collaboration between the RSC team and Pollution Prevention, Safeguards and Security, and the Teamsters, who facilitated extra shred bins.
The numbers tell the story:
• 34 boxes of office supplies for reuse
• 4 boxes of hard-bound books
• 2 55-gallon shred bins of office paper
• 2 30-gallon bins of toner cartridges
• 1 box of batteries
• 15 pieces of non-tracked property such as computer monitors and desktop printers
• 30 1-gallon-bins of electronic media.
deployed In FY13, PNNL continued reducing printing paper use with the successful implementation of a paperless procurement process
In FY14, PNNL reduced uncoated printing paper by 13%; and 98% of paper purchased contained at least 30% post-consumer content
Plans, Actions, and Projected Performance
Waste DiversionPNNL has achieved both DOE 50% waste diversion goals The following initiatives have been established to support waste diversion
Solid Waste
• Reducing sanitary waste by adding recycling collection bins in appropriate laboratory spaces, including evaluating nitrile glove recycling
• Fostering culture and behavior changes in waste reduction through “zero waste” at all-staff celebration events
• Reducing paper use and toner cartridge waste by enabling appropriate network copiers to perform printing, copying, and scanning
P2 Program
PNNL will continue the ChemAgain program to help decrease chemical inventory, thus reducing chemical disposals PNNL will also continue encouraging staff to identify and seek funding for P2 opportunities through the Sustainability Pays program
15
Site
Sus
tain
abili
ty P
lan:
Pus
hing
For
war
d t
o a
Bet
ter
Futu
re |
FY1
5
Pollution Prevention and Waste Reduction

Sustainable Acquisition
PNNL includes sustainable acquisition provisions in 100% of applicable solicitations and contracts.
FY14 Performance StatusDuring FY14, PNNL implemented several improvement to its acquisition system for sustainability compliance Below are highlights:
• Implemented a low-emitting materials requirement into sustainable acquisitions for campus-wide procurements
• Promoted the use of bio-based products through a variety of vendor shows held on campus for all staff members to attend
• Performed a targeted self-assessment of compliance with sustainable acquisition
In addition, the contracts department advertised sustainable ideas to employees via an information booth at several events and remained actively involved with various ongoing internal issues to enhance PNNL staff awareness of and commitment to sustainable purchasing
Plans, Actions, and Projected PerformancePNNL will continue increasing staff awareness of available sustainable products, participate again in Earth Day and other events, and educate staff about sustainable acquisitions Collaborating with other federal agencies on best practices will also proceed Planned activities for FY15 include the following:
• Provide continuing education to contracts specialists and technical oversight representatives about sustainable requirements and their roles/responsibilities to comply
• Provide education to end users and management via vendor product demonstrations and training, focusing on energy-efficient alternatives, with a focus on cold storage equipment
• Team with P2 Program to evaluate technologies that have the ability to reuse printed paper
Goal6.1 – Procurements meet requirements by including necessary provisions and clauses in 95% of applicable contracts
Success StoryPNNL uses the Business to Business (B2B) catalogue as the primary procurement tool to simplify and encourage the purchase of sustainable products. The B2B program has been hosting vendor fairs at key employee events so that employees can see and try the sustainable products in person, making their purchasing decisions easier. Having this additional experience and information furthers PNNL’s cultural shift towards the purchase of sustainable products.
In FY14, the program focused its effort toward promoting and raising awareness of the federal requirements to purchase United States Department of Agriculture’s bio-based products. A series of vendor shows was presented on campus to highlight bio-based cleaning supplies and industrial lubricants. Staff were educated on the environmental benefits of selecting a bio-based alternative to their janitorial and industrial supplies via hands-on product demonstrations.
Staff participation in B2B increased as they became aware of their part in PNNL’s overall Sustainable Acquisitions requirements. PNNL plans to continue this effort with its B2B vendors and end-users in hopes of shifting purchases of all cleaning supplies and industrial lubricants to a bio-based alternative where applicable.
16
Site
Sus
tain
abili
ty P
lan:
Pus
hing
For
war
d t
o a
Bet
ter
Futu
re |
FY1
5
Sustainable Acquisition
Electronic Stewardship and Data Centers
Goals7.1 – All core data centers are metered to measure a monthly PUE of 100% by FY15
7.2 – Core data centers maximum annual weighted average PUE of 1.4 by FY15
7.3 – Electronic stewardship: 100% of eligible PCs, laptops, and monitors with power management actively implemented and in use by FY12
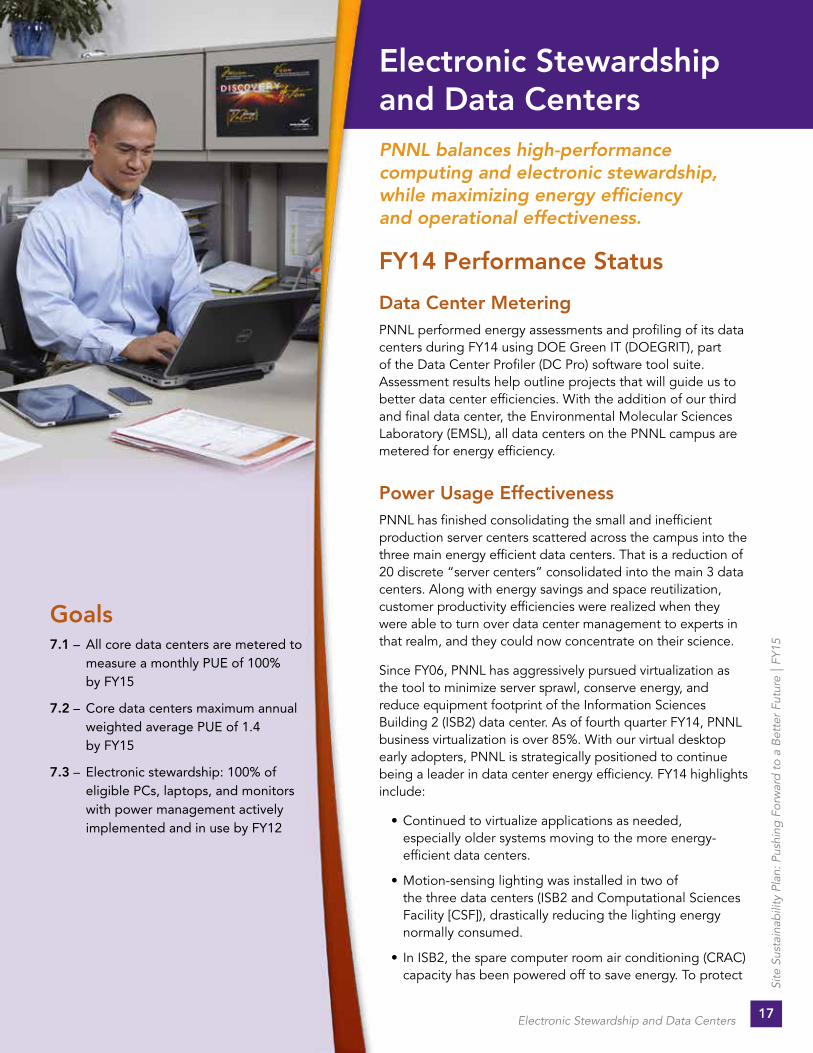
PNNL balances high-performance computing and electronic stewardship, while maximizing energy efficiency and operational effectiveness.
FY14 Performance Status
Data Center MeteringPNNL performed energy assessments and profiling of its data centers during FY14 using DOE Green IT (DOEGRIT), part of the Data Center Profiler (DC Pro) software tool suite Assessment results help outline projects that will guide us to better data center efficiencies With the addition of our third and final data center, the Environmental Molecular Sciences Laboratory (EMSL), all data centers on the PNNL campus are metered for energy efficiency
Power Usage EffectivenessPNNL has finished consolidating the small and inefficient production server centers scattered across the campus into the three main energy efficient data centers That is a reduction of 20 discrete “server centers” consolidated into the main 3 data centers Along with energy savings and space reutilization, customer productivity efficiencies were realized when they were able to turn over data center management to experts in that realm, and they could now concentrate on their science
Since FY06, PNNL has aggressively pursued virtualization as the tool to minimize server sprawl, conserve energy, and reduce equipment footprint of the Information Sciences Building 2 (ISB2) data center As of fourth quarter FY14, PNNL business virtualization is over 85% With our virtual desktop early adopters, PNNL is strategically positioned to continue being a leader in data center energy efficiency FY14 highlights include:
• Continued to virtualize applications as needed, especially older systems moving to the more energy-efficient data centers
• Motion-sensing lighting was installed in two of the three data centers (ISB2 and Computational Sciences Facility [CSF]), drastically reducing the lighting energy normally consumed
• In ISB2, the spare computer room air conditioning (CRAC) capacity has been powered off to save energy To protect
17
Site
Sus
tain
abili
ty P
lan:
Pus
hing
For
war
d t
o a
Bet
ter
Futu
re |
FY1
5
Electronic Stewardship and Data Centers

the data center from overheating in the event of main CRAC failure, these “Standby CRACs” have been wired to an emergency-start circuit controlled by a discrete thermostat, independent of the main CRAC controls
• Louvers were added to the ISB2 Standby CRACs to prevent air backflow from the pressurized, raised floor This prevents cool air from mixing with the hot server exhaust air, keeping the cooling system at its maximum energy efficiency
• PNNL continues to monitor spaces across the campus to prevent any new ad hoc computer rooms from springing up against PNNL policy The combination of monitoring and providing excellent data centers for our users assures adherence to the PNNL three-data-center-only policy
PNNL achieved a maximum annual weighted average PUE of 1 33 across all three data centers It required different solutions at each building to maximize the unique existing configurations Our PUE metering has allowed us to determine the success and degree of impact of various energy-efficient projects Some energy saving projects have included removal of under-floor cable, replacement of outdated equipment and supplies, and use of rear door heat exchangers (RDHx) to cool the Cascade and Constance high-density, high-performance computers
All three data centers have been profiled using DC Pro by our certified data center energy practitioner Results are as follows:
• CSF: PUE 1 14 annualized, average IT Load = 443kW
• EMSL: PUE 1 36 annualized, average IT Load = 1737kW
• ISB2: PUE 1 52 annualized, average IT Load = 149kW
Electronic StewardshipWith the deployment of Windows 7, PNNL minimized power consumption with user pre-configurations on new Windows-based systems and displays PNNL continued to promote upgrading desktop operating systems and now has 100% of desktop systems at Windows 7 or beyond, which allows us to take advantage of the energy savings features everywhere
Teleworking—a pilot program in FY12—was formally rolled out in FY13 and specifically targets Scope 3 commuting emissions A side benefit of teleworking is a migration to energy-efficient laptop devices (for ease of
mobility and taking home) in the office environment, which will further decrease PNNL’s overall energy use The acquisition of electronic office products is through our Managed Hardware Program (MHP), where 100% of the PC offerings are registered with the Electronic Product Environmental Assessment Tool (EPEAT) and ENERGY STAR Any deviation from the pre-approved MHP purchase list is discouraged and requires management approval
Disposition of 100% of PNNL’s electronic assets is through the Excess Materials and Redeployment Service group, where equipment can follow one of four paths: Computers for Learning, redeploy within PNNL, Tri-City Asset Recovery, or DOE-approved vendor recycling
Plans, Actions, and Projected Performance
Data Center MeteringPNNL will continue performing energy assessments and profiling of its data centers using DOEGRIT Assessment results will be analyzed using the Decision Tool and implemented, if cost-effective Data Center metering is now active across all three data centers and reporting PUE Additional refinements, data collection, and software to monitor and warn of thresholds being exceeded will make measurements more useful
Power Usage EffectivenessAs PNNL works to maintain the 1 4 PUE goal, various methods will be considered and employed to improve energy efficiency in the data centers, to include minimizing the number of systems that exist in general laboratory space
Some of the major focuses to maintain the PUE goal are:
• Continue virtualizing systems to reduce both the physical footprint and energy use
• Use ceiling plenums as hot air returns to avoid hot and cold aisle mixing
• Replace CRAC air circulation motors with high-efficient motors to reduce energy consumption
• Install aerodynamic fans and more efficient motors on outdoor chillers
• Continue to raise the cold aisle temperatures to save cooling energy and increase efficiency and lower the PUE even further
• Install CRACs in CSF that will take advantage of the highly efficient Adiabatic cooling system
18
Site
Sus
tain
abili
ty P
lan:
Pus
hing
For
war
d t
o a
Bet
ter
Futu
re |
FY1
5
Electronic Stewardship and Data Centers
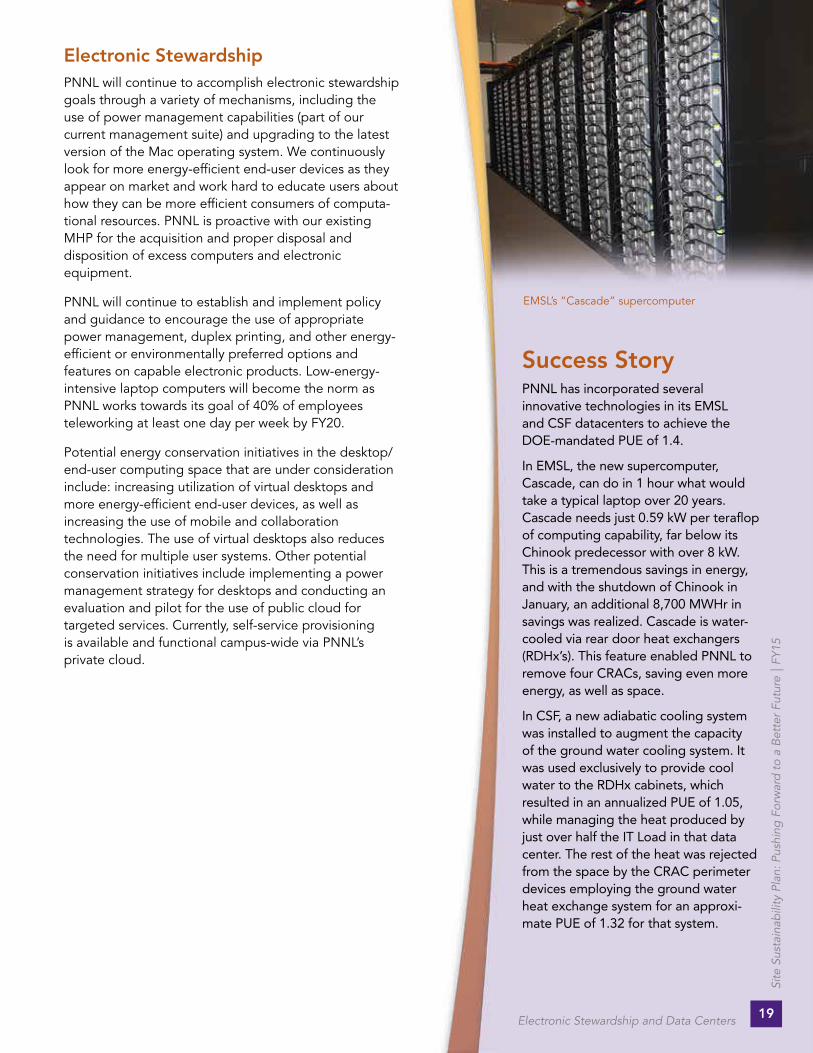
EMSL’s “Cascade” supercomputer
Success StoryPNNL has incorporated several innovative technologies in its EMSL and CSF datacenters to achieve the DOE-mandated PUE of 1.4.
In EMSL, the new supercomputer, Cascade, can do in 1 hour what would take a typical laptop over 20 years. Cascade needs just 0.59 kW per teraflop of computing capability, far below its Chinook predecessor with over 8 kW. This is a tremendous savings in energy, and with the shutdown of Chinook in January, an additional 8,700 MWHr in savings was realized. Cascade is water-cooled via rear door heat exchangers (RDHx’s). This feature enabled PNNL to remove four CRACs, saving even more energy, as well as space.
In CSF, a new adiabatic cooling system was installed to augment the capacity of the ground water cooling system. It was used exclusively to provide cool water to the RDHx cabinets, which resulted in an annualized PUE of 1.05, while managing the heat produced by just over half the IT Load in that data center. The rest of the heat was rejected from the space by the CRAC perimeter devices employing the ground water heat exchange system for an approxi- mate PUE of 1.32 for that system.
Electronic StewardshipPNNL will continue to accomplish electronic stewardship goals through a variety of mechanisms, including the use of power management capabilities (part of our current management suite) and upgrading to the latest version of the Mac operating system We continuously look for more energy-efficient end-user devices as they appear on market and work hard to educate users about how they can be more efficient consumers of computa- tional resources PNNL is proactive with our existing MHP for the acquisition and proper disposal and disposition of excess computers and electronic equipment
PNNL will continue to establish and implement policy and guidance to encourage the use of appropriate power management, duplex printing, and other energy-efficient or environmentally preferred options and features on capable electronic products Low-energy-intensive laptop computers will become the norm as PNNL works towards its goal of 40% of employees teleworking at least one day per week by FY20
Potential energy conservation initiatives in the desktop/end-user computing space that are under consideration include: increasing utilization of virtual desktops and more energy-efficient end-user devices, as well as increasing the use of mobile and collaboration technologies The use of virtual desktops also reduces the need for multiple user systems Other potential conservation initiatives include implementing a power management strategy for desktops and conducting an evaluation and pilot for the use of public cloud for targeted services Currently, self-service provisioning is available and functional campus-wide via PNNL’s private cloud
19
Site
Sus
tain
abili
ty P
lan:
Pus
hing
For
war
d t
o a
Bet
ter
Futu
re |
FY1
5
Electronic Stewardship and Data Centers

Renewable Energy
Leveraging large-scale, interagency REC procurements continues to enable purchasing at the lowest cost possible.
FY14 Performance StatusIn FY14, PNNL procured enough RECs to offset 50 1% of its electrical use and is already meeting the FY20 goal of 20% annual electrical consumption PNNL standardized the process for evaluating and procuring RECs through a third-party supplier, leveraging multi-agency REC procurements This competitive bidding process enables us to achieve the best price, as recognized during a DOE IG audit
Aside from RECs, PNNL has several on-site solar arrays The solar hot water heater installed at EMSL produces a maximum of 160,000 Btu/hr of hot water and is dedicated to the lunchroom and associated restrooms, fulfilling the majority of that area’s hot water needs Several solar PV arrays also power various air and water monitoring stations throughout the campus In addition, PNNL operates a 125 kW PV array, which includes charging stations for electric fleet vehicles and is used for several R&D projects
Plans, Actions, and Projected PerformanceAs previously noted, PNNL annually assesses the necessary number of RECs based on growth, LEED commitments, and desired GHG Scope 1 and 2 offsets The strategy of competitively bidding for REC procurement will continue to meet (and likely exceed) the renewable energy goal of 20% of annual electrical consumption
PNNL is committed to finding ways to increase the amount of renewable power generated on site We will periodically review the addition of new projects where economically feasible All new building construction will evaluate the cost effectiveness of the use of solar hot water heaters (EISA section 523), in accordance with our Engineering Standards and Specifications
Goal8.1 – 20% of annual electricity consumption from renewable sources by FY20
Success StoryPNNL has standardized the process for evaluating and procuring RECs annually for the desired number of certificates. Adjustments are made based on growth, LEED commitments, and desired GHG Scope 1 and 2 offsets. RECs are solicited every 1-2 years to minimize the internal cost and manpower needed for the procurement. Utilizing the Defense Logistics Agency (DLA) multi-agency REC solicitations, PNNL has successfully leveraged its procurement through an established competitive bidding process in order to attract the attention of enough REC brokers to achieve the best overall price. This best practice was recognized during a DOE Inspector General (IG) audit.
Continuing to produce on-site renewable power
20
Site
Sus
tain
abili
ty P
lan:
Pus
hing
For
war
d t
o a
Bet
ter
Futu
re |
FY1
5
Renewable Energy

Goal9.1 – Address DOE Change Climate Adaptation Plan goals
Climate Change Resilience
In FY14, PNNL continued to examine the impacts of climate variability and change on our site’s operations. In FY15, we intend to strengthen the support for climate change adaptation by engaging a broader set of decision-makers from across PNNL—as well as external stakeholders—in an effort to develop a climate resiliency action plan.
Risks to Missions, Operations, and PeopleObjective 1: DOE Climate Change Adaptation Screening Assessment
PNNL completed the voluntary screening assessment on November 17, 2014, after consultation with several facilities and operations management personnel
Objective 2: Determining RiskThe DOE High-Level Analysis of Vulnerability to Climate Change and the Washington State Integrated Climate Response Strategy (both April 2012) were used to establish potential climate change vulnerabilities at PNNL’s major sites east and west of the Cascade Mountains There have been no documented changes to these assessments in the past year
The greatest vulnerabilities and risks to PNNL’s operations in the Pacific Northwest region are described below
• Facility energy shortages – Projected declines in springtime snowpack will lead to reduced stream flows during the summer months and potentially reduced hydro-electric power generation Considering that over 75% of Richland’s fuel mix currently comes from regional hydropower sources, changes in water supply could affect the seasonal availability and reliability of power to PNNL
• Reduced water supply – Projected reductions in seasonal water supply may lead to policy changes regarding Columbia River water use As the Columbia River Treaty between the United States and Canada is renegotiated, anticipated climate impacts will likely inform this process (e g , Canada may not offer as much flood protection,
21
Site
Sus
tain
abili
ty P
lan:
Pus
hing
For
war
d t
o a
Bet
ter
Futu
re |
FY1
5
Climate Change Resilience
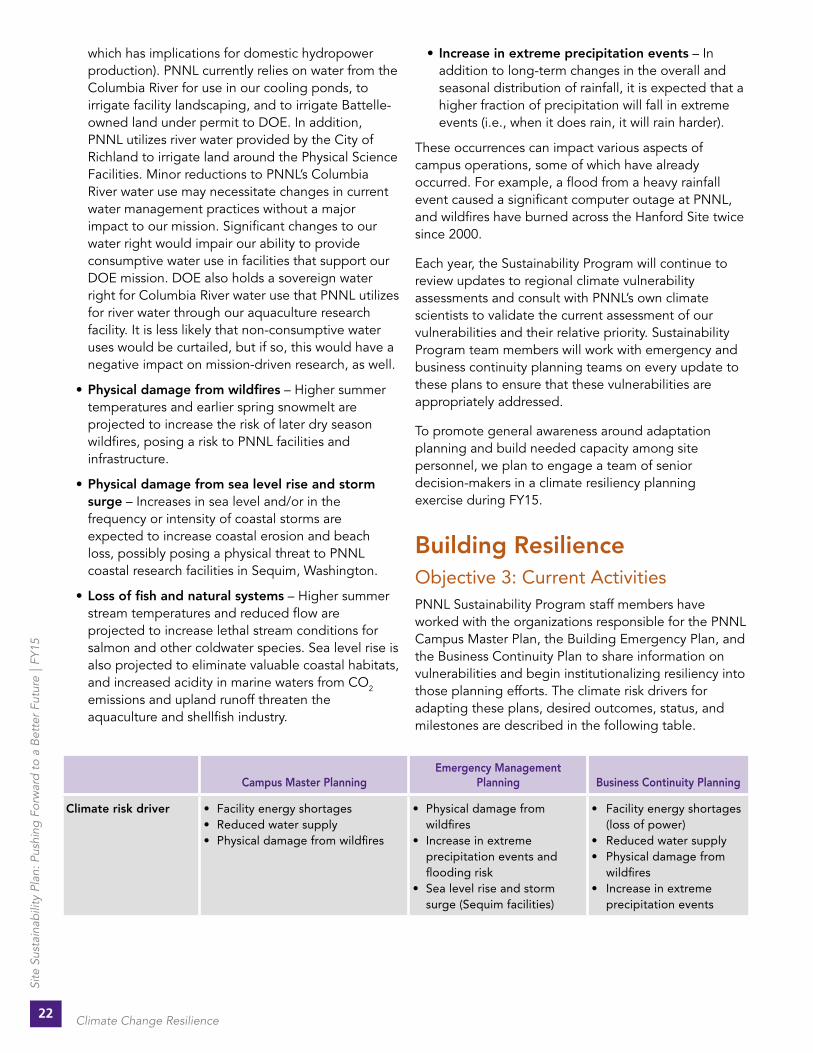
which has implications for domestic hydropower production) PNNL currently relies on water from the Columbia River for use in our cooling ponds, to irrigate facility landscaping, and to irrigate Battelle-owned land under permit to DOE In addition, PNNL utilizes river water provided by the City of Richland to irrigate land around the Physical Science Facilities Minor reductions to PNNL’s Columbia River water use may necessitate changes in current water management practices without a major impact to our mission Significant changes to our water right would impair our ability to provide consumptive water use in facilities that support our DOE mission DOE also holds a sovereign water right for Columbia River water use that PNNL utilizes for river water through our aquaculture research facility It is less likely that non-consumptive water uses would be curtailed, but if so, this would have a negative impact on mission-driven research, as well
• Physical damage from wildfires – Higher summer temperatures and earlier spring snowmelt are projected to increase the risk of later dry season wildfires, posing a risk to PNNL facilities and infrastructure
• Physical damage from sea level rise and storm surge – Increases in sea level and/or in the frequency or intensity of coastal storms are expected to increase coastal erosion and beach loss, possibly posing a physical threat to PNNL coastal research facilities in Sequim, Washington
• Loss of fish and natural systems – Higher summer stream temperatures and reduced flow are projected to increase lethal stream conditions for salmon and other coldwater species Sea level rise is also projected to eliminate valuable coastal habitats, and increased acidity in marine waters from CO2 emissions and upland runoff threaten the aquaculture and shellfish industry
• Increase in extreme precipitation events – In addition to long-term changes in the overall and seasonal distribution of rainfall, it is expected that a higher fraction of precipitation will fall in extreme events (i e , when it does rain, it will rain harder)
These occurrences can impact various aspects of campus operations, some of which have already occurred For example, a flood from a heavy rainfall event caused a significant computer outage at PNNL, and wildfires have burned across the Hanford Site twice since 2000
Each year, the Sustainability Program will continue to review updates to regional climate vulnerability assessments and consult with PNNL’s own climate scientists to validate the current assessment of our vulnerabilities and their relative priority Sustainability Program team members will work with emergency and business continuity planning teams on every update to these plans to ensure that these vulnerabilities are appropriately addressed
To promote general awareness around adaptation planning and build needed capacity among site personnel, we plan to engage a team of senior decision-makers in a climate resiliency planning exercise during FY15
Building ResilienceObjective 3: Current ActivitiesPNNL Sustainability Program staff members have worked with the organizations responsible for the PNNL Campus Master Plan, the Building Emergency Plan, and the Business Continuity Plan to share information on vulnerabilities and begin institutionalizing resiliency into those planning efforts The climate risk drivers for adapting these plans, desired outcomes, status, and milestones are described in the following table
Campus Master PlanningEmergency Management
Planning Business Continuity Planning
Climate risk driver • Facility energy shortages• Reduced water supply• Physical damage from wildfires
• Physical damage from wildfires• Increase in extreme precipitation events and flooding risk • Sea level rise and storm surge (Sequim facilities)
• Facility energy shortages (loss of power)• Reduced water supply• Physical damage from wildfires• Increase in extreme precipitation events
22
Site
Sus
tain
abili
ty P
lan:
Pus
hing
For
war
d t
o a
Bet
ter
Futu
re |
FY1
5
Climate Change Resilience

Desired outcome Next iteration of the Campus Master Plan establishes climate change resiliency as a factor influencing placement and design of buildings as the campus expands. Major building retrofit and new design efforts include analysis of climate change impacts energy use/cost
Plans adequately address response to hazards that could result from long-term climate variability and change
Future plans consider ways to mitigate impacts of longer-term power outages and water shortages
Maturity of the effort Initiated in FY13; opportunity for further development
Mature. Plans adequately address PNNL’s climate-related hazards
Initiated in FY13; opportunity for further development
Responsible office Facilities & Operations Strategic Planning
Environmental Planning & Emergency Preparedness
Environmental Planning & Emergency Preparedness
Milestones to gauge success
Participation in planning cycle every 3 years
Review of plans when updated to ensure response to fire and storm surge hazards are included
Stakeholder meeting to agree on level of threat and need to address
Objective 4: Future ActivitiesDuring FY15, PNNL proposes to develop a more robust climate resiliency action plan that can be institutionalized by key stakeholders across PNNL and in our surrounding community Actions taken to date, as described under Objective 3, have targeted a limited set of internal stakeholders, and the dialogue has focused primarily on operational risks and opportunities To develop a more strategic assessment of climate risks and opportunities to PNNL and our partners in the region, the Sustainability Program proposes to include a broader set of stakeholders in assessing our vulnerabilities and planning for the future This would
include representatives of PNNL’s major research areas, PNNL facilities and operations, those responsible for managing and planning external resources that PNNL depends on (e g , suppliers of power, water, wastewater, transportation, and telecommunications services), and other strategic regional partners who want to understand and plan for climate change and its potential impacts in the region (e g , the Hanford Site)
The table below outlines proposed new planning efforts that will be initiated during FY15, in addition to the ongoing activities described under Objective 3 A funding request has been approved to support climate action planning at the scale described above
PNNL Research Program Planning Utility Service Provider PlanningPlanning with Other
Strategic Regional Partners
Climate risk driver • Loss of fish and natural systems • Reduced water supply• Need for better predictive models
• Facility energy shortages• Reduced water supply• Physical damage from wildfires
All of the aforementioned vulnerabilities
Desired outcome Long-term research agenda reflects opportunities to better inform the climate science dialogue and addresses risks posed to current mission-driven research (e.g., aquaculture)
Common understanding of risk of service disruption or long-term changes and mutually agreeable approaches outlined for dealing with such changes
Synergies from collaborative planning
Maturity of the effort
Ongoing for individual research organizations; holistic assessment starting in FY15
Starting in FY15 Starting in FY15
Responsible office
All research organizations with potential research/mission risks and opportunities (e.g., Atmospheric Sciences & Global Change Research, Ecology Research, others)
Facilities and Operations Utilities Management
Community Outreach, Sustainability Program
Milestones to gauge success
Leadership review of business opportunities considers these risks
Participation in climate resiliency meetings with PNNL
Hanford Site representatives engaged at a minimum
23
Site
Sus
tain
abili
ty P
lan:
Pus
hing
For
war
d t
o a
Bet
ter
Futu
re |
FY1
5
Climate Change Resilience

Objective 5: Real Property and Supply Chain ResilienceSome climate change vulnerabilities of the PNNL campus, such as increased risk of wildfire and potential for power shortages, may be mitigated, in part, with new construction or leasing decisions, including the location and design of the building For the most part, PNNL will address these risks through existing construction practices Plans for the future build-out of the PNNL campus focus primarily on the development of federally owned lands that are currently part of PNNL’s core campus (see Campus Master Plan) While some existing leases may be renewed, new leases are not currently the focus of our facility acquisition strategy for the PNNL site
Fire risk is currently addressed by the requirement of the PNNL fire protection program to maintain defensible space between PNNL-managed facilities and natural cover or wildland areas Current maintenance and new development practices that support this objective include ensuring that vegetation is kept away from buildings, increasing the use of xeriscaping and rock garden features, and focusing development on the existing core campus rather than in outer wildland areas
Mitigation of risk posed by future energy shortages is partially addressed though a systematic assessment of the operations in each facility and the criticality of business continuity in those facilities Backup power is integrated into the design, as appropriate, for critical operations Designs do not currently address scenarios for longer-term, rolling black-outs
The subsurface water table, which is influenced by river water levels, is also considered for new construction Water levels are currently controlled primarily through federal dam management We have not yet considered how long-term changes in river water levels and the water table may impact our facilities, nor integrated that into new facility design decisions
The Sustainability Program team will work with personnel responsible for facilities leasing and new facilities construction in FY15 to determine whether current procedures for assessing these risks are adequate or need to be modified This will ideally be accomplished through the resiliency action plan development process described in Objective 4
Regional and Local CoordinationObjective 6: Regional and Local CoordinationPNNL has a number of collaborative research efforts underway that seek to improve our understanding of climate change effects and impacts Our Climate and Earth Systems Science research tackles key questions related to atmospheric aerosols, clouds, and precipi- tation; human systems such as agriculture and energy; the cycling of water, carbon, and other important constituents; and the impacts of and potential responses to climate change To help better understand these systems and their interactions, PNNL draws from core research capabilities in:
• climate, aerosol, and cloud physics
• regional- and global-scale modeling
• integrated assessment of energy and the environment
• complex regional meteorology and chemistry
• computational science and mathematics
Much of this work involves collaboration with other federal entities, including DOE, DHS, EPA, National Aeronautics and Space Administration (NASA), universities, and industry A few examples of the programs and facilities we bring to climate research include the following:
• Joint Global Change Research Institute (JGCRI) – With the University of Maryland, PNNL has domestic and international collaborators to deepen our understanding of the interactions between climate, energy production and use, economic activity, and the environment
• Atmospheric Radiation Measurement (ARM) Climate Research Facility – PNNL plays a leadership role in the multi-laboratory ARM program A scientific user facility aimed at improving climate models, ARM provides in situ and remote sensing climate measurements from strategically located sites around the world
• The Atmospheric Measurements Laboratory (AML) and EMSL – Where scientists conduct laboratory studies, often working with partners from around the world, aimed at understanding the important role that molecular-scale processes play in the global climate system
24
Site
Sus
tain
abili
ty P
lan:
Pus
hing
For
war
d t
o a
Bet
ter
Futu
re |
FY1
5
Climate Change Resilience

• Accelerated Climate Modeling for Energy (ACME) – A multi-laboratory program to develop a version of the Community Earth System Model that can resolve key earth system processes, such as regional precipitation patterns, with unprecedented detail
Objective 7: Removing and Reforming BarriersPotential barriers to ensuring ongoing preparedness for potential impacts of climate change on PNNL’s mission and operations include:
• Failure to update climate vulnerability assessments based on revised state and regional climate impact assessments
• Failure to consider climate impacts and vulnerabilities in future iterations of key plans (e g , Campus Master Plan) due to turnover of personnel or lack of Sustainability Program participation in the process
• Failure to consider impacts of climate change on long-term energy demand of facilities when making design decisions
A plan to institutionalize procedures to overcome these barriers will be addressed as part of the proposed climate resiliency action planning effort for the PNNL site in FY15 Actions to overcome these barriers could include:
• Schedule a bi-annual review of state and national climate data
• Schedule annual planning meetings between the Sustainability Program, Campus Master Planning, and Emergency Management to ensure future plans continue to address evolving vulnerabilities
• Create a contractual requirement that the design process for all new buildings includes development of an energy model that considers regional climate impact scenarios (i e , due to temperatures changes) and their impact on energy use and building operating costs
Objective 8: Organizing Resources to Address Climate Change (SC required)Climate change management responsibilities at PNNL are currently based in two organizations The Sustainability Program within the Operational Systems Directorate is responsible for ensuring that PNNL facilities and infrastructure are maintained and developed in a way that considers climate change impacts and ensures long-term resiliency to such changes One member of the Sustainability Program team has been assigned responsibility for coordinating these efforts
The Fundamental and Computational Sciences Directorate is responsible for advancing our DOE research mission related to climate science—specifically, this work focuses on understanding the dynamics of the integrated earth system (atmosphere, surface, and subsurface) and the interactions with energy systems and other human systems to inform the development of solutions that mitigate the impacts of climate change and produce a sustainable energy future Research scientists at PNNL play an important role in regional coordination on climate research and have also helped inform the Sustainability Program of specific climate change vulnerabilities at the PNNL site
A single climate change management plan for the PNNL site has not been developed yet PNNL plans to develop a climate resiliency action plan for the site during FY15, based on a robust stakeholder engagement process, as described under Objective 4 This includes engagement of regional DOE stakeholders, such as the Hanford Site, who may also benefit from this effort
25
Site
Sus
tain
abili
ty P
lan:
Pus
hing
For
war
d t
o a
Bet
ter
Futu
re |
FY1
5
Climate Change Resilience
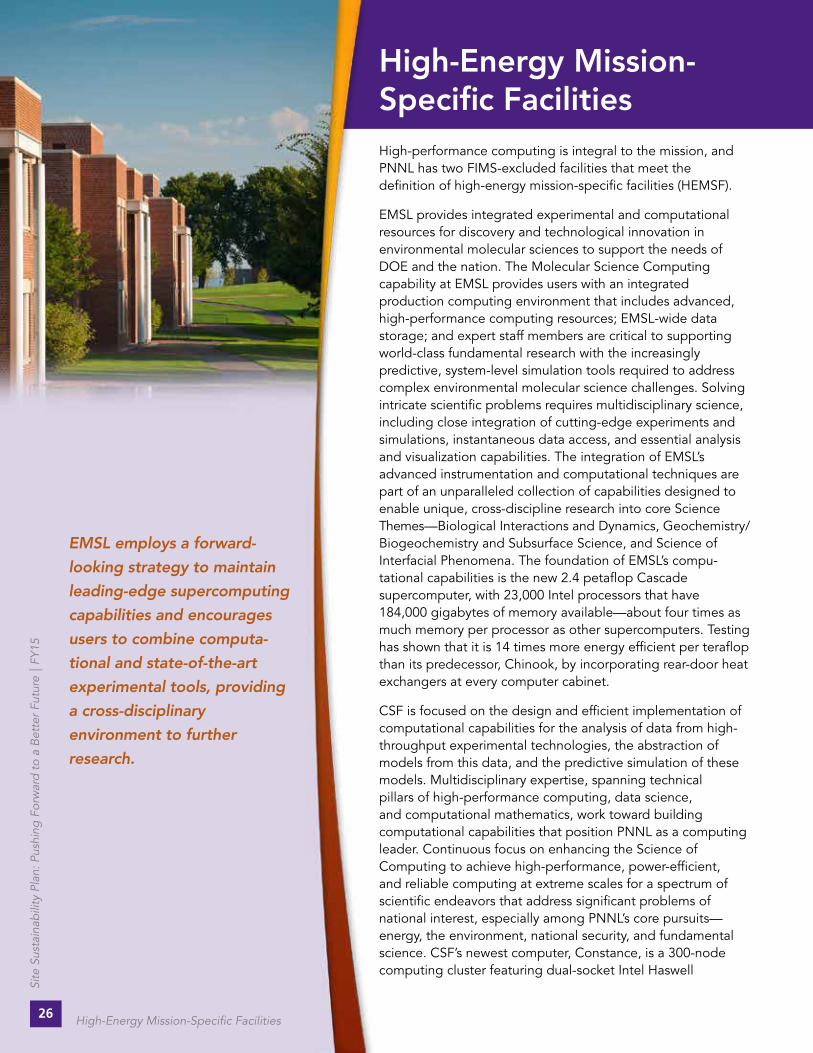
High-Energy Mission- Specific Facilities High-performance computing is integral to the mission, and PNNL has two FIMS-excluded facilities that meet the definition of high-energy mission-specific facilities (HEMSF)
EMSL provides integrated experimental and computational resources for discovery and technological innovation in environmental molecular sciences to support the needs of DOE and the nation The Molecular Science Computing capability at EMSL provides users with an integrated production computing environment that includes advanced, high-performance computing resources; EMSL-wide data storage; and expert staff members are critical to supporting world-class fundamental research with the increasingly predictive, system-level simulation tools required to address complex environmental molecular science challenges Solving intricate scientific problems requires multidisciplinary science, including close integration of cutting-edge experiments and simulations, instantaneous data access, and essential analysis and visualization capabilities The integration of EMSL’s advanced instrumentation and computational techniques are part of an unparalleled collection of capabilities designed to enable unique, cross-discipline research into core Science Themes—Biological Interactions and Dynamics, Geochemistry/ Biogeochemistry and Subsurface Science, and Science of Interfacial Phenomena The foundation of EMSL’s compu- tational capabilities is the new 2 4 petaflop Cascade supercomputer, with 23,000 Intel processors that have 184,000 gigabytes of memory available—about four times as much memory per processor as other supercomputers Testing has shown that it is 14 times more energy efficient per teraflop than its predecessor, Chinook, by incorporating rear-door heat exchangers at every computer cabinet
CSF is focused on the design and efficient implementation of computational capabilities for the analysis of data from high-throughput experimental technologies, the abstraction of models from this data, and the predictive simulation of these models Multidisciplinary expertise, spanning technical pillars of high-performance computing, data science, and computational mathematics, work toward building computational capabilities that position PNNL as a computing leader Continuous focus on enhancing the Science of Computing to achieve high-performance, power-efficient, and reliable computing at extreme scales for a spectrum of scientific endeavors that address significant problems of national interest, especially among PNNL’s core pursuits—energy, the environment, national security, and fundamental science CSF’s newest computer, Constance, is a 300-node computing cluster featuring dual-socket Intel Haswell
EMSL employs a forward-looking strategy to maintain leading-edge supercomputing capabilities and encourages users to combine computa- tional and state-of-the-art experimental tools, providing a cross-disciplinary environment to further research.
26
Site
Sus
tain
abili
ty P
lan:
Pus
hing
For
war
d t
o a
Bet
ter
Futu
re |
FY1
5
High-Energy Mission-Specific Facilities

HEMSF Electricity Projections for PNNL
E5-2670v3 (12-core-per-socket, running at 2 3 GHz) nodes with 64 GB of memory, an FDR Infiniband network interface card, and 480 GB of local disk
storage Incorporating the use of rear-door heat exchangers coupled with an innovative ground source cooling system has resulted in the lowest PUE at PNNL
HEMSF Electricity Usage and Cost Projections
27
Site
Sus
tain
abili
ty P
lan:
Pus
hing
For
war
d t
o a
Bet
ter
Futu
re |
FY1
5
High-Energy Mission-Specific Facilities
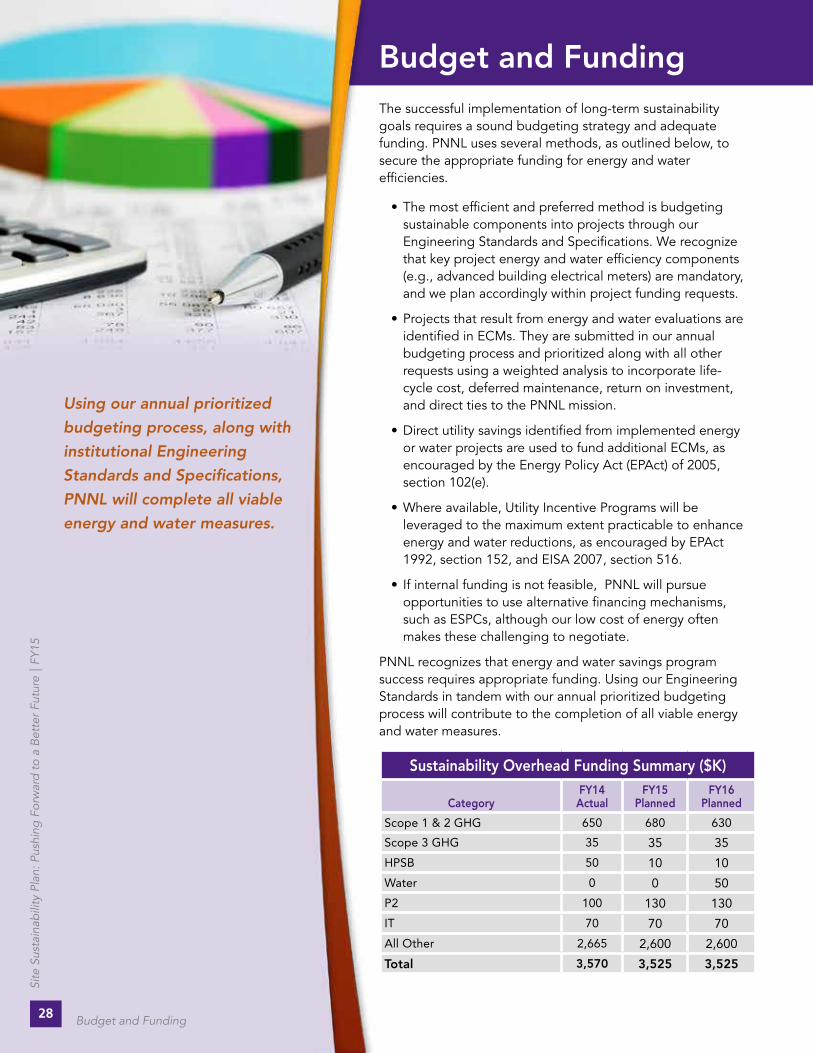
Budget and FundingThe successful implementation of long-term sustainability goals requires a sound budgeting strategy and adequate funding PNNL uses several methods, as outlined below, to secure the appropriate funding for energy and water efficiencies
• The most efficient and preferred method is budgeting sustainable components into projects through our Engineering Standards and Specifications We recognize that key project energy and water efficiency components (e g , advanced building electrical meters) are mandatory, and we plan accordingly within project funding requests
• Projects that result from energy and water evaluations are identified in ECMs They are submitted in our annual budgeting process and prioritized along with all other requests using a weighted analysis to incorporate life-cycle cost, deferred maintenance, return on investment, and direct ties to the PNNL mission
• Direct utility savings identified from implemented energy or water projects are used to fund additional ECMs, as encouraged by the Energy Policy Act (EPAct) of 2005, section 102(e)
• Where available, Utility Incentive Programs will be leveraged to the maximum extent practicable to enhance energy and water reductions, as encouraged by EPAct 1992, section 152, and EISA 2007, section 516
• If internal funding is not feasible, PNNL will pursue opportunities to use alternative financing mechanisms, such as ESPCs, although our low cost of energy often makes these challenging to negotiate
PNNL recognizes that energy and water savings program success requires appropriate funding Using our Engineering Standards in tandem with our annual prioritized budgeting process will contribute to the completion of all viable energy and water measures
Using our annual prioritized budgeting process, along with institutional Engineering Standards and Specifications, PNNL will complete all viable energy and water measures.
Sustainability Overhead Funding Summary ($K)
CategoryFY14 Actual
FY15 Planned
FY16 Planned
Scope 1 & 2 GHG 650 680 630
Scope 3 GHG 35 35 35
HPSB 50 10 10
Water 0 0 50
P2 100 130 130
IT 70 70 70
All Other 2,665 2,600 2,600
Total 3,570 3,525 3,525
28
Site
Sus
tain
abili
ty P
lan:
Pus
hing
For
war
d t
o a
Bet
ter
Futu
re |
FY1
5
Budget and Funding

Utility Usage, Costs and Projections
Costs and usage on electricity, water and natural gas with electrical projections through FY20.
PNNL FY14 Utility ($ Cost)
PNNL FY14 Energy (MMBtus)
PNNL FY14 Utility Consumption
Projected Electrical Energy Costs ($M)
29
Site
Sus
tain
abili
ty P
lan:
Pus
hing
For
war
d t
o a
Bet
ter
Futu
re |
FY1
5
Utility Usage, Costs and Projections

Appendix A — Self Certification
30
Site
Sus
tain
abili
ty P
lan:
Pus
hing
For
war
d t
o a
Bet
ter
Futu
re |
FY1
5
Appendix A — Self Certification
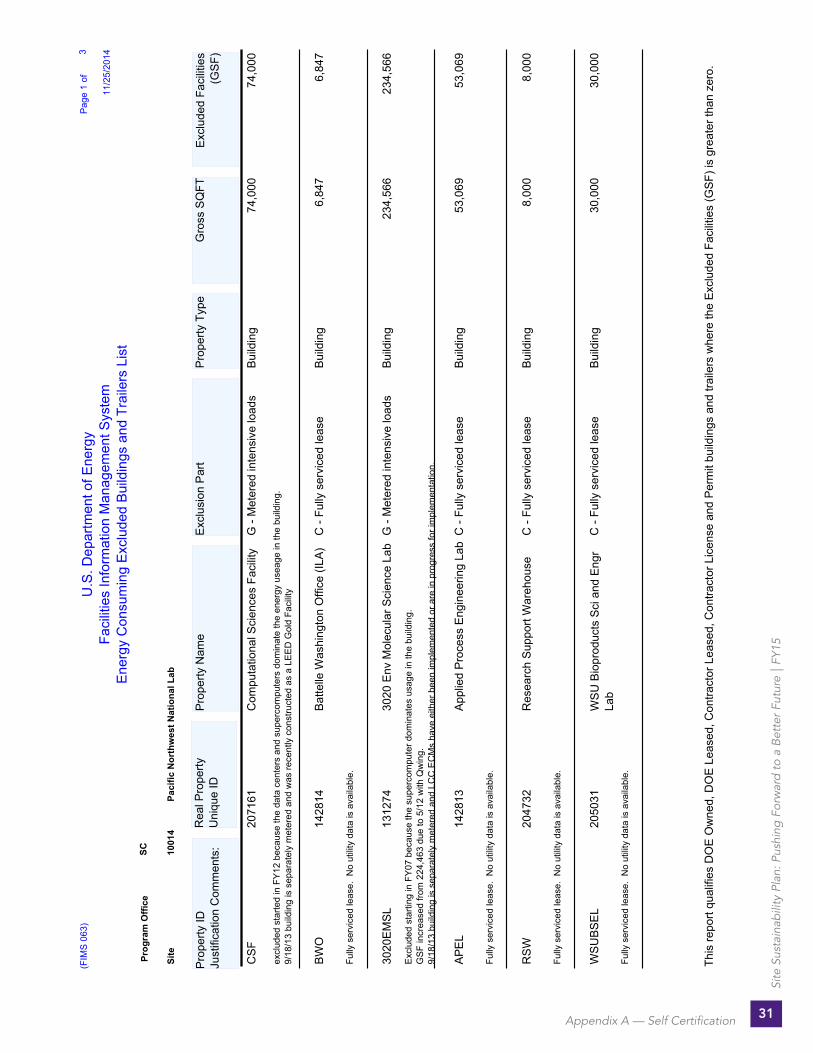
(FIM
S 0
63)
11/2
5/20
14 3P
age
1 of
U.S
. Dep
artm
ent o
f Ene
rgy
Faci
litie
s In
form
atio
n M
anag
emen
t Sys
tem
Ene
rgy
Con
sum
ing
Exc
lude
d B
uild
ings
and
Tra
ilers
Lis
t
Site
Pro
gram
Offi
ceSC
Paci
fic N
orth
wes
t Nat
iona
l Lab
1001
4
Pro
perty
IDJu
stifi
catio
n C
omm
ents
:R
eal P
rope
rtyU
niqu
e ID
Pro
perty
Nam
eE
xclu
sion
Par
tP
rope
rty T
ype
Gro
ss S
QFT
Exc
lude
d Fa
cilit
ies
(GS
F)
excl
uded
sta
rted
in F
Y12
bec
ause
the
data
cen
ters
and
sup
erco
mpu
ters
dom
inat
e th
e en
ergy
use
age
in th
e bu
ildin
g.9/
18/1
3 bu
ildin
g is
sep
arat
ely
met
ered
and
was
rece
ntly
con
stru
cted
as
a LE
ED
Gol
d Fa
cilit
y
74,0
00C
SF
G -
Met
ered
inte
nsiv
e lo
ads
2071
61C
ompu
tatio
nal S
cien
ces
Faci
lity
Bui
ldin
g74
,000
Fully
ser
vice
d le
ase.
No
utili
ty d
ata
is a
vaila
ble.
6,84
7B
WO
C -
Fully
ser
vice
d le
ase
1428
14B
atte
lle W
ashi
ngto
n O
ffice
(ILA
)B
uild
ing
6,84
7
Exc
lude
d st
artin
g in
FY
07 b
ecau
se th
e su
perc
ompu
ter d
omin
ates
usa
ge in
the
build
ing.
GS
F in
crea
sed
from
224
,463
due
to 5
/12
with
Qw
ing.
9/18
/13
build
ing
is s
epar
atel
y m
eter
ed a
nd L
CC
EC
Ms
have
eith
er b
een
impl
emen
ted
or a
re in
pro
gres
s fo
r im
plem
enta
tion.
234,
566
3020
EM
SL
G -
Met
ered
inte
nsiv
e lo
ads
1312
7430
20 E
nv M
olec
ular
Sci
ence
Lab
Bui
ldin
g23
4,56
6
Fully
ser
vice
d le
ase.
No
utili
ty d
ata
is a
vaila
ble.
53,0
69A
PE
LC
- Fu
lly s
ervi
ced
leas
e14
2813
App
lied
Pro
cess
Eng
inee
ring
Lab
Bui
ldin
g53
,069
Fully
ser
vice
d le
ase.
No
utili
ty d
ata
is a
vaila
ble.
8,00
0R
SW
C -
Fully
ser
vice
d le
ase
2047
32R
esea
rch
Sup
port
War
ehou
seB
uild
ing
8,00
0
Fully
ser
vice
d le
ase.
No
utili
ty d
ata
is a
vaila
ble.
30,0
00W
SU
BS
EL
C -
Fully
ser
vice
d le
ase
2050
31W
SU
Bio
prod
ucts
Sci
and
Eng
rLa
bB
uild
ing
30,0
00
This
repo
rt qu
alifi
es D
OE
Ow
ned,
DO
E L
ease
d, C
ontra
ctor
Lea
sed,
Con
tract
or L
icen
se a
nd P
erm
it bu
ildin
gs a
nd tr
aile
rs w
here
the
Exc
lude
d Fa
cilit
ies
(GS
F) is
gre
ater
than
zer
o.
31
Site
Sus
tain
abili
ty P
lan:
Pus
hing
For
war
d t
o a
Bet
ter
Futu
re |
FY1
5
Appendix A — Self Certification

(FIM
S 0
63)
11/2
5/20
14 3P
age
2 of
U.S
. Dep
artm
ent o
f Ene
rgy
Faci
litie
s In
form
atio
n M
anag
emen
t Sys
tem
Ene
rgy
Con
sum
ing
Exc
lude
d B
uild
ings
and
Tra
ilers
Lis
t
Site
Pro
gram
Offi
ceSC
Paci
fic N
orth
wes
t Nat
iona
l Lab
1001
4
Pro
perty
IDJu
stifi
catio
n C
omm
ents
:R
eal P
rope
rtyU
niqu
e ID
Pro
perty
Nam
eE
xclu
sion
Par
tP
rope
rty T
ype
Gro
ss S
QFT
Exc
lude
d Fa
cilit
ies
(GS
F)
Fully
ser
vice
d le
ase.
No
utili
ty d
ata
is a
vaila
ble.
1,53
5V
TAR
CC
- Fu
lly s
ervi
ced
leas
e21
4253
Virg
inia
Tec
h A
pplie
d R
esea
rch
Cor
pB
uild
ing
1,53
5
Fully
ser
vice
d le
ase.
No
utili
ty d
ata
is a
vaila
ble.
3,20
7M
BI1
1C
- Fu
lly s
ervi
ced
leas
e20
5866
Mic
ropr
oduc
ts B
reak
thro
ugh
Inst
11B
uild
ing
3,20
7
Fully
ser
vice
d le
ase.
No
utili
ty d
ata
is a
vaila
ble.
3,15
0P
OS
2C
- Fu
lly s
ervi
ced
leas
e20
7368
Por
t of S
kam
ania
Tie
tzel
Offi
ceB
uild
ing
3,15
0
Fully
ser
vice
d le
ase.
No
utili
ty d
ata
is a
vaila
ble.
18,0
43JG
CR
IC
- Fu
lly s
ervi
ced
leas
e20
6372
Join
t Glo
bal C
hang
e R
esea
rch
Inst
Bui
ldin
g18
,043
Fully
ser
vice
d le
ase.
No
utili
ty d
ata
is a
vaila
ble.
2,62
0P
OS
C -
Fully
ser
vice
d le
ase
1429
12P
ort o
f Ska
man
ia L
ab-W
areh
ouse
Bui
ldin
g2,
620
Fully
ser
vice
d le
ase.
No
utili
ty d
ata
is a
vaila
ble.
30,9
25B
SR
CC
- Fu
lly s
ervi
ced
leas
e20
0709
Bat
telle
Sea
ttle
Res
earc
h C
ente
r(IL
A)
Bui
ldin
g30
,925
This
repo
rt qu
alifi
es D
OE
Ow
ned,
DO
E L
ease
d, C
ontra
ctor
Lea
sed,
Con
tract
or L
icen
se a
nd P
erm
it bu
ildin
gs a
nd tr
aile
rs w
here
the
Exc
lude
d Fa
cilit
ies
(GS
F) is
gre
ater
than
zer
o.
32
Site
Sus
tain
abili
ty P
lan:
Pus
hing
For
war
d t
o a
Bet
ter
Futu
re |
FY1
5
Appendix A — Self Certification

(FIM
S 0
63)
11/2
5/20
14 3P
age
3 of
U.S
. Dep
artm
ent o
f Ene
rgy
Faci
litie
s In
form
atio
n M
anag
emen
t Sys
tem
Ene
rgy
Con
sum
ing
Exc
lude
d B
uild
ings
and
Tra
ilers
Lis
t
Site
Pro
gram
Offi
ceSC
Paci
fic N
orth
wes
t Nat
iona
l Lab
1001
4
Pro
perty
IDJu
stifi
catio
n C
omm
ents
:R
eal P
rope
rtyU
niqu
e ID
Pro
perty
Nam
eE
xclu
sion
Par
tP
rope
rty T
ype
Gro
ss S
QFT
Exc
lude
d Fa
cilit
ies
(GS
F)
Fully
ser
vice
d le
ase.
No
utili
ty d
ata
is a
vaila
ble.
6,39
5P
OR
TLA
ND
C -
Fully
ser
vice
d le
ase
1428
16P
ortla
nd O
ffice
Bui
ldin
g6,
395
Fully
ser
vice
d le
ase.
No
utili
ty d
ata
is a
vaila
ble.
2,43
0A
LBU
QU
ER
QU
EC
- Fu
lly s
ervi
ced
leas
e14
2911
Alb
uque
rque
NM
Offi
ceB
uild
ing
2,43
0
Exc
ludi
ng th
e da
ta c
ente
r loc
ated
in th
is b
uild
ing.
9/18
/13
build
ing
is s
epar
atel
y m
eter
ed a
nd d
ata
cent
er is
the
pred
omin
ant l
oad
in th
e bu
ildin
g an
d al
l LC
C E
CM
s ha
ve b
een
impl
emen
ted.
3,85
4IS
B2
G -
Met
ered
inte
nsiv
e lo
ads
1398
11In
form
atio
n S
cien
ces
Bui
ldin
g 2
Bui
ldin
g60
,080
This
repo
rt qu
alifi
es D
OE
Ow
ned,
DO
E L
ease
d, C
ontra
ctor
Lea
sed,
Con
tract
or L
icen
se a
nd P
erm
it bu
ildin
gs a
nd tr
aile
rs w
here
the
Exc
lude
d Fa
cilit
ies
(GS
F) is
gre
ater
than
zer
o.
33
Site
Sus
tain
abili
ty P
lan:
Pus
hing
For
war
d t
o a
Bet
ter
Futu
re |
FY1
5
Appendix A — Self Certification

Appendix B — Policy and Program Status
SSPP Goal – Policy/Program In Place (Y/N) Last Update (MM/YY)
Goal 1: Greenhouse Gas Reduction
Program: Sulfur hexfluoride (SF6) capture N N/A
Plan: Commuter reduction N N/A
Policy: Teleworking and/or alternative work schedule Y 02/2014
Goal 2: Sustainable Buildings
Policy: Space management Y 06/2012
Policy: Cool roof installation Y 09/2013
Policy: Design new Federal buildings to achieve net-zero energy FY 2030 Y 09/2013
Program: Participation in critical local and regional efforts and initiatives N N/A
Plan: Update agency/site policy and guidance (EIS’s and EA’s) N N/A
Policy: Dispose and consolidate excess and underutilized property Y 06/2012
Policy: Reduce need for new buildings and field office space N N/A
Policy: Conserve, rehabilitate, and reuse historic Federal properties N N/A
Policy: Incorporate sustainable practices into new/renew leases Y 06/2013
Plan: Green buildings roadmap N N/A
Program: Sustainable landscape Y 09/2011
Plan: Metering Y 07/2014
Goal 3: Fleet Management
Program: Fleet Optimization/Vehicle Allocation Methodology (VAM) Y 11/2013
Program: Sustainable transportation options N N/A
Program: Vehicle sharing/pooling N N/A
Goal 4: Water Use Efficiency and Management
Policy: Storm water management Y 09/2013
Policy: Water reuse N N/A
Plan: Water N N/A
Goal 5: Pollution Prevention and Waste Reduction
Program: Reduce and minimize hazardous chemicals and materials Y 07/2014
Policy: Integrated pest management and landscape management N N/A
Policy: Increase use of acceptable alternative chemicals and processes Y 07/2014
Policy: Report per Sections (301 – 313) of EPCRA of 1986 Y 02/2014
Policy: Duplex printing and paper containing at least 30% post-consumer fiber Y 10/2013
Program: Composting N N/A
34
Site
Sus
tain
abili
ty P
lan:
Pus
hing
For
war
d t
o a
Bet
ter
Futu
re |
FY1
5
Appendix B — Policy and Program Status

Goal 6: Sustainable Acquisition
Policy: Inclusion of FAR sustainability clause Y 10/2013
Policy: Inclusion of bio-based products Y 10/2013
Policy: Inclusion of energy efficient products (e.g. Energy Star, FEMP –designated) Y 10/2013
Policy: Inclusion of recycled content products Y 10/2013
Policy: Inclusion of water efficient products (e.g. WaterSense) Y 10/2013
Policy: Inclusion of environmentally preferable products/services (excluding EPEAT) Y 10/2013
Goal 7: Electronic Stewardship and Data Centers
Policy: Power management Y 07/2010
Policy: Data center consolidation N N/A
Goal 8: Renewable Energy
Policy: Prioritization of on-site renewable N N/A
Policy: Purchase renewable energy from sources on tribal land N N/A
Goal 9: Climate Change Resilience
Plan: Update all appropriate plans to address climate change resiliency N N/A
Program: Identify or establish and participate in regional climate N N/A
Goal 10: Energy Performance Contracts
Policy: Utilize performance contracts N N/A
Other
Program: Cost savings reinvestment N N/A
35
Site
Sus
tain
abili
ty P
lan:
Pus
hing
For
war
d t
o a
Bet
ter
Futu
re |
FY1
5
Appendix B — Policy and Program Status

Since 2009, PNNL has used the Global Reporting Initiative (GRI) Sustainability Reporting Guidelines as a basis for disclosing our governance approach and the environmental, social, and economic performance and impacts of our operations The GRI provides reporting principles, standard disclosures, and criteria to ensure consistency in reporting, and is used by thousands of organizations worldwide
PNNL defines the content of our GRI report considering the interests of our stakeholders, the sustainability context within which we operate, how material the sustainability aspect is, and whether it provides a complete view of our significant impacts Our material issues are conveyed through the honeycomb diagram and scorecard below These are the issues that most influence our stakeholders (our employees, customers, and community) and that represent our significant sustainability impacts To ensure a comprehensive view of our performance the boundaries of our annual GRI report extend beyond our DOE facilities to include all facilities that PNNL operates as part of the integrated campus
Now in our sixth year of sustainability reporting, PNNL is transitioning to an online-only GRI report to save resources and streamline results PNNL’s FY14 Annual Sustainability Report will be completed in early 2015 and available at http://sustainable pnnl gov The content on the next few pages provide a glimpse of our social and economic performance
4
SUSTAINABILITY PERFORMANCE SCORECARD
1. Reported per 200,000 employee hours worked.
2. Economic contribution is an estimate of the value to the economy of goods and services embodying licensed PNNL technologies. The measure is consistently calculated across all DOE labs and is reported to DOE headquarters on an annual basis, but not submitted against a related target. The number fl uctuates from year to year, and a fi ve-year simple moving average was used to smooth the data for this report. For this report, a target was developed for the measure. While a continual upward trend in results is the goal, performance is most directly controlled by licensees of Lab technology and their efforts to commercialize it.
3. Community investments include those made by PNNL and Battelle’s Pacifi c Northwest Division because of Battelle’s management role of the Laboratory.
EN
VIR
ON
ME
NT
SOC
IAL
EC
ON
OM
IC
Reducing building energy use and greenhouse GHG emissions
Traveling smarter
Minimizing water use
Reducing material purchases and waste
Keeping employees healthy and safe
Investing in our employees’ professional development
Creating an inclusive work environment
Fostering the next generation of scientists and engineers
Transfering technology that makes a difference
Maintaining financial viability though research and operational excellence
Supporting small businesses
Giving back to our communities
did not meet target
risk of not meeting target
met or on track to meet target
21
External Assurance Letter
Sustainable Business Consulting evaluated Paci c Northwest National Laboratory’s (PNNL) sustainability report to establish that the information in the report was an authentic representation of the company’s social, environmental, and economic performance in relation to the Global Reporting Initiative (GRI) reporting framework as speci ed in the GRI G3.1 Guidelines. Our responsibility was to carry out an assurance engagement, verify data and provide speci c suggestions for improvement.
We found that PNNL meets the guidelines and reported the information in the spirit of GRI disclosure. The 2012 Sustainability Report provides a balanced and reasonable representation of information concerning boundary setting, quality, report content, and material indicators. PNNL reported on all the core performance indicators, pro le disclosures and management approaches. While these are not all incorporated in the print version, we have reviewed all the data and content that will be posted on the organization’s Sustainability at PNNL Web pages for complete disclosure. We are not aware of the exclusion of any material issues or misstatements of information and are con dent in PNNL’s disclosure.
After we reviewed the initial draft of the report and highlighted concerns or made suggestions for improvement, PNNL responded to each concern with a thorough explanation and addressed each one. These changes were included for the nal version of the report.
Assurance approach:
Our activities included a review of the report content, reporting metrics and a selection of source data. We conducted several meetings with PNNL employees to discuss the accuracy and authenticity of report content, data points, methodologies and policies around the organization’s social, environmental, and economic data and activities.
Our assurance team was made up of sustainability experts, one of which is certi ed in GRI reporting. As part of this process, we:
• reviewed all the core performance indicators, pro le disclosures, management approaches and assessed the information based on the GRI Guidelines
• took a random sample of data points and interviewed employees who provided that data to verify accuracy and understand the procedures for data collection, tracking and analysis
• analyzed stakeholder engagement activities and materiality determination process
• provided suggestions after initial readings and two reviews
• assessed the nal version of the report content to ensure it met the principles for ensuring report content and quality, as de ned by the GRI
Recommendations for improvement
PNNL is doing more for sustainability than they have time to describe in their reporting procedures. Many of the efforts are simply from the employees’ regular day to day and PNNL has the opportunity to put policy in place to support those efforts and have an even stronger sustainability performance and reporting. Community impact could be tracked with more metrics than just how many dollars are spent in the community. Social and environmental impacts come from each philanthropic effort at PNNL and the recipients could be asked to deliver the results of these impacts after project completion. This will assist future decisions when assessing the PNNL mission and its relation to incoming grant proposals. Risks associated with PNNL’s sustainability efforts could be discussed as part of the overall bene t of sustainability and why PNNL chose the areas for its honeycomb.
Opinion: This was PNNL’s fourth GRI-based sustainability report. The organization has once again demonstrated rigorous procedures for data gathering and reporting, and has improved its reporting efforts by committing to a stronger stakeholder engagement process. We fully support the company’s self-assessment that its 2012 report meets the GRI application level of A+.
Kevin Wilhelm, CEO Seattle, Washington.Sustainable Business Consulting April 5, 2013
SOCIA
LECONOMIC
• Total recordable case rate ≤ .651
• Days away, restricted, or transferred rate ≤ .251
• Average participant satisfaction rating from professional development programs ≥ 4.5/5
• No goal established
• Average participant rating of work-based learning programs ≥ 4.0/5
• Economic contribution to global economy from licensed technologies (Target: Minimum=$50M, Stretch=$100M)
• Sales (Target: >$835M)
• Business volume/operating budget (Target: >$1,016M)
• Award at least 52% procurement dollars to small businesses
• Philanthropic investments (No target)2
Keeping employees healthy and safe
Investing in our employees’ professional development
Creating an inclusive work environment
Fostering the next generation of scientists and engineers
Transferring technology that makes a difference
Maintaining financial viability through research and operational excellence
Supporting small businesses
Giving back to our communities
2013 2014
0.60 0.82
0.24 0.22
4.6 4.7
4.7 4.6
$107.7M
$1,064.0M $938.0M
$122.1M
$936.0M $1,020.0M
66% 57%
$732,500 $734,383 N/A
N/A
Appendix C — Social and Economic Performance
36
Site
Sus
tain
abili
ty P
lan:
Pus
hing
For
war
d t
o a
Bet
ter
Futu
re |
FY1
5
Appendix C — Social and Economic Performance
SUSTAINABILITY PERFORMANCE SCORECARD
1. Reported per 200,000 employee hours worked.2. Philanthropic investments are distributed by a committee of employees from Battelle’s Pacific Northwest Division. At least 50% of giving is directed to science, technology, engineering, and mathmatics (STEM) education.

Appendix C — Social and Economic Performance
37
Site
Sus
tain
abili
ty P
lan:
Pus
hing
For
war
d t
o a
Bet
ter
Futu
re |
FY1
5
Appendix C — Social and Economic Performance

38
Site
Sus
tain
abili
ty P
lan:
Pus
hing
For
war
d t
o a
Bet
ter
Futu
re |
FY1
5
Appendix C — Social and Economic Performance