Site Stormwater Analysis Report - Connecticut · Site Stormwater Analysis Report Hawthorne...
50
Site Stormwater Analysis Report Hawthorne Capacitor Bank Addition Project 160 Hawthorne Drive Fairfield, Connecticut Document Number: 188336-0001 July 15, 2015 Prepared for: Connecticut Financial Center 157 Church St #16 New Haven, CT 06510 Prepared by: Black & Veatch Corporation 11401 Lamar Avenue Overland Park, Kansas 66211
-
Upload
vuongthuan -
Category
Documents
-
view
218 -
download
2
Transcript of Site Stormwater Analysis Report - Connecticut · Site Stormwater Analysis Report Hawthorne...

Site Stormwater Analysis Report
Hawthorne Capacitor Bank Addition Project
160 Hawthorne Drive
Fairfield, Connecticut
Document Number: 188336-0001
July 15, 2015
Prepared for:
Connecticut Financial Center
157 Church St #16 New Haven, CT 06510
Prepared by: Black & Veatch Corporation
11401 Lamar Avenue Overland Park, Kansas 66211

TableofContentsTableofContents......................................................................................................................................................ii 1.0 Engineer’sCertificationofStormwaterReview..........................................................................iii 1.0 ProjectDescription...................................................................................................................................4 2.0 TopographicFeaturesoftheProjectSite........................................................................................4 3.0 StormwaterAnalysis–DesignBasis.................................................................................................4 4.0 Pre‐ConstructionCharacteristicsandPeakFlowRates............................................................5 5.0 PostConstructionCharacteristicsandPeakFlowRates..........................................................6 6.0 SummaryofPeakFlowRates...............................................................................................................7 7.0 Recommendations.....................................................................................................................................8 7.1 Existing Catch Basin ....................................................................................................................... 8
7.2 Wetland Degradation .................................................................................................................... 9
LIST OF ATTACHMENTS AttachmentA–SiteDrawing
AttachmentB–BVCalculation‐188336.58.1003,Prevs.PostConstructionStormwater
Runoff,Rev1,July15,2015


Hawthorne Substation The United Illuminating Co.
Site Stormwater Analysis Report B&V Project No. 188336 15/July/15
BLACK&VEATCH| 4
1.0 ProjectDescriptionThe Hawthorne Substation is located on an R‐3 zoned area of a 2.8 acre parcel at 160 Hawthorne Drive
(Rear) in the City of Fairfield. The existing parcel is bounded to the east and south by residential
buildings, to the north and west by vegetation and General Electric Company property. Eversource
transmission easement, occupied by 115 kV overhead transmission lines, extends across the southern
portion of the property. The expansion work will be adjacent to the Eversource transmission line
easement. Two 115kV 20MVAR transmission capacitor banks will be installed along the west side of
the existing Hawthorne substation with the existing 115 kV equipment/buswork remaining in place.
Refer to Attachment A.
2.0 TopographicFeaturesoftheProjectSiteAcross the project site the elevation varies 20 feet. The highest elevations (279.0 – 259.0) of the site are
in the southwest corner. The elevation within the substation is relatively flat. Stormwater runoff from
the western portion of the project site generally flows north across the substation yard before crossing
the property boundary. The stormwater runoff from the eastern portion of the project site runs along
the existing asphalt roadway and exits from the southeast corner of the property, pooling at an existing
catch basin.
The majority of the area outside the substation fence is wooded. Aggregate surfacing comprises the
majority of the area within the substation fence. The access road to the substation is paved and a small
portion of the access road adjacent to the control building is paved. Refer to Figure 1.
3.0 StormwaterAnalysis–DesignBasisThe Connecticut Siting Council has requested an analysis of the stormwater runoff from the project site.
The purpose of this analysis is to evaluate the runoff from the site including potential effects on the
adjacent wetland and abutting properties and assess the effectiveness of the existing access road catch
basin. The analysis compares the site characteristics and runoff flow rates of the pre‐construction
project site to the post construction project site. Once this comparison is completed, further
investigation on the effect of this change in runoff will occur.
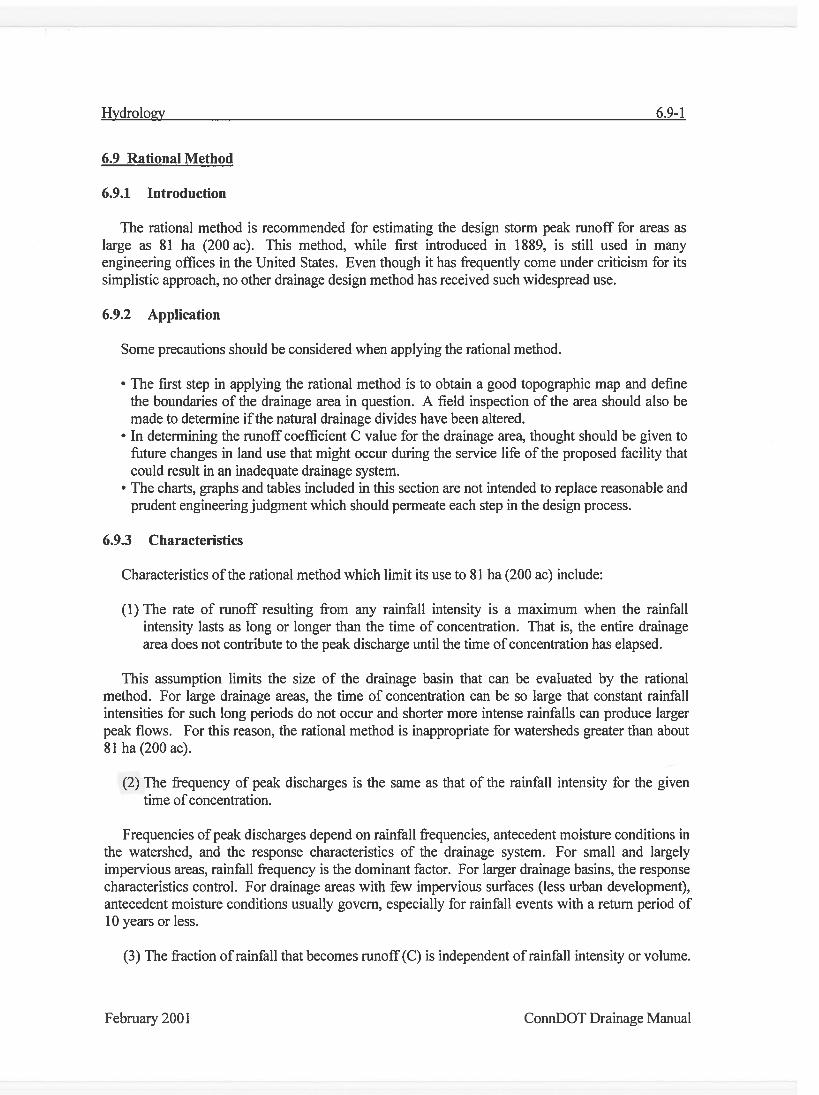
Using the Rational method, the difference in runoff from pre‐development to post‐development can be
analyzed. The results will be correctly sizing the catch basin located in the southeast corner of the site
as well as ensuring protection of the wetland area and the feeding grounds of the Eastern Box Turtle.
The property area for the Hawthorne substation is approximately 2.8 acres. This can be subdivided into
eastern and western drainage subbasins. Refer to Attachment A. Estimated runoff volumes for each
subbasin drainage area have been calculated using the Rational Method in conjunction with the
ConnDOT Drainage Manual. The runoff coefficient for this drainage area is calculated using a weighted

Hawthorne Substation The United Illuminating Co.
Site Stormwater Analysis Report B&V Project No. 188336 15/July/15
BLACK&VEATCH| 5
average of the runoff coefficients (c) for unimproved cover, aggregate cover, asphalt pavement, and
roof cover. These areas are shown in Figure 1. Referencing chapter 6 of the ConnDOT Drainage Manual,
the small site area allows an assumption that the time of concentration is the minimum of 5 minutes.
Using the time of concentration, the rainfall intensity can be found for the 10‐year, 25‐year, and 100‐
year storms. These intensity values are from the ConnDOT Drainage Manual Table B‐2.1 as shown
below in Table 1.
Table 1 – Rainfall Intensity for Storm Events
RAINFALL INTENSITY (in/hr)
Duration (min)
10 YR 25 YR 100 YR
5 6.0 6.7 7.8
.
The estimated runoff volume is calculated using Equation 6.2 from the ConnDOT Drainage Manual
∗ ∗ ∗
Stormwater Runoff (cfs)
Weighted runoff coefficient
Frequency factor
Rainfall Intensity (in/hr)
Area (ac)
4.0 Pre‐ConstructionCharacteristicsandPeakFlowRatesThe existing substation area is predominantly unimproved land with aggregate surfacing, an asphalt
paved road on the eastern side of the site, and a control building. The calculated runoff coefficients are
as shown in Tables 2 and 3.
Table 2 – Pre Construction Weighted Coefficient (West)
Pre‐Construction Weighted C (Cw)
ASPHALT PAVING AGGREGATE SURFACING ROOF UNIMPROVED TOTAL WEIGHTED C
c 0.95 0.60 0.95 0.20 0.31
AREA (ac) 0.06 0.24 0.03 1.16 1.49

Hawthorne Substation The United Illuminating Co.
Site Stormwater Analysis Report B&V Project No. 188336 15/July/15
BLACK&VEATCH| 6
Table 3 – Pre‐Construction Weighted Coefficient (East)
Pre‐Construction Weighted C (Cw)
ASPHALT PAVING AGGREGATE SURFACING ROOF UNIMPROVED TOTAL WEIGHTED C
c 0.95 0.60 0.95 0.20 0.43
AREA (ac) 0.20 0.30 0.05 0.76 1.31
Runoff peak flow rates (Q) for the 10‐year and 100‐year storms are shown in Tables 4 and 5 and
calculated as described above in section 3.0.
Table 4 – Pre‐Construction Peak Flow Rates ‐ West
West Pre‐Construction Peak Flow Rates ‐ Q(cfs)
Rainfall Event (yr)
Cw Cf I (in/hr) A (ac) Q (cfs)
10‐yr 0.31 1.00 6.00 1.49 2.77
100‐yr 0.31 1.25 7.80 1.49 4.50
Table 5 – Pre‐Construction Peak Flow Rates ‐ East
5.0 PostConstructionCharacteristicsandPeakFlowRatesThe development occurring on site will replace unimproved land with aggregate surfacing. The
calculated weighted runoff coefficients are shown in Tables 6 and 7.
Table 6 – Post Construction Weighted Coefficient (West)
Post‐Construction Weighted C (Cw)
ASPHALT PAVING AGGREGATE SURFACING ROOF UNIMPROVED TOTAL WEIGHTED C
c 0.95 0.60 0.95 0.20 0.48
AREA (ac) 0.06 0.89 0.03 0.51 1.49
East Pre Construction Peak Flow Rates ‐ Q(cfs)
Rainfall Event (yr) Cw Cf I (in/hr) A (ac) Q (cfs)
10‐yr 0.43 1.00 6.00 1.31 3.38
25‐yr 0.43 1.10 6.70 1.31 4.15
100‐yr 0.43 1.25 7.80 1.31 5.49

Hawthorne Substation The United Illuminating Co.
Site Stormwater Analysis Report B&V Project No. 188336 15/July/15
BLACK&VEATCH| 7
Table 7 – Post Construction Weighted Coefficient (East)
Post‐Construction Weighted C (Cw)
ASPHALT PAVING AGGREGATE SURFACING ROOF UNIMPROVED TOTAL WEIGHTED C
c 0.95 0.60 0.95 0.20 0.49 AREA (ac) 0.18 0.53 0.05 0.55 1.31
Runoff peak flow rates (Q) for the 10‐year and 100‐year storms are shown in Tables 8 and 9 and
calculated as described above in section 3.0.
Table 8 – Post Construction Peak Flow Rates ‐ West
West Post Construction Peak Flow Rates ‐ Q(cfs)
Rainfall Event (yr) Cw Cf I (in/hr) A (ac) Q (cfs)
10‐yr 0.48 1.00 6.00 1.49 4.29
100‐yr 0.48 1.25 7.80 1.49 6.97
Table 9 – Post Construction Peak Flow Rates – East
6.0 SummaryofPeakFlowRates
Table 10 – Post Construction Peak Flow Rates ‐ East
Summary of Peak Flow Rates ‐ Q (cfs)
Rainfall Event (yr)
West East
Pre Q Post Q Pre Q Post Q
10 2.77 4.29 3.38 3.85
25 ‐ ‐ 4.15 4.73
100 4.50 6.97 5.49 6.26
East Post‐Construction Peak Flow Rates ‐ Q(cfs)
Rainfall Event (yr) Cw Cf I (in/hr) A (ac) Q (cfs)
10‐yr 0.49 1.00 6.00 1.31 3.85
25‐yr 0.49 1.10 6.70 1.31 4.73
100‐yr 0.49 1.25 7.80 1.31 6.26


Hawthorne Substation The United Illuminating Co.
Site Stormwater Analysis Report B&V Project No. 188336 15/July/15
BLACK&VEATCH| 8
7.0 Recommendations
7.1ExistingCatchBasinThe existing catch basin located down gradient of the substation on the western edge of the access
road. This catch basin is outside of the southeast property boundary. The peak flow rate for the 25‐year
rainfall event was used as the basis for the analysis of the adequacy of the catch basin and outlet pipe.
See attached Figure 2.
Based on the existing contours and estimated routing of the outlet pipe from the catch basin, the pipe
slope is estimated to be approximately 6%. Information obtained during a site walk down indicates that
the outlet pipe diameter is 4 inches. Multiple pipe slope scenarios were evaluated using the hydraulic
software FlowMaster to analyze current capacity and develop a range of outlet pipe sizes.
The existing 4 inch corrugate high density polyethylene pipe (CHDPE) pipe at 6% slope has a full flow
capacity of 0.50 cfs as shown in Table 11.
Table 11 – Existing Catch Basin Capacity
4 inch CHDPE Capacity
Slope (%) Capacity (cfs)
0.5 0.15
2.0 0.29
4.0 0.41
6.0 0.50
Preliminary calculations on catch basin resizing were done with multiple pipe scenarios ran in
FlowMaster. For each of the pipe slope scenarios, the Manning’s coefficient remained constant. The
pre‐construction 25 year peak flow rate is 4.15 cfs. Table 12 shows the results of these scenarios.
Table 12 – Recommended Pre‐Construction Catch Basin Outlet Pipe Resizing
CHDPE Pre‐Construction Outlet Pipe Sizing
Slope (%)
Calculated Diameter
(in)
Recommended Diameter
(in)
0.5 14.0 15
2.0 10.8 12
4.0 9.5 12
6.0 8.8 12

Hawthorne Substation The United Illuminating Co.
Site Stormwater Analysis Report B&V Project No. 188336 15/July/15
BLACK&VEATCH| 9
Preliminary calculations on catch basin resizing were done with multiple pipe scenarios ran in
FlowMaster. For each of the pipe slope scenarios, the Manning’s coefficient and peak flow rate
remained constant. Table 13 shows the results of these scenarios.
Table 13 – Recommended Post‐Construction Catch Basin Outlet Pipe Resizing
CHDPE Post Construction Outlet Pipe Sizing
Slope (%)
Calculated Diameter
(in)
Recommended Diameter
(in)
0.5 14.8 15
2.0 11.4 12
4.0 10.0 12
6.0 9.2 12
As shown in Table 11, the existing catch basin outlet pipe is inadequately sized to handle the runoff
quantity draining to the existing catch basin. The site expansion will create additional impervious area
which will generate more runoff and increase the amount of water that may pond at the existing catch
basin. To address the existing water ponding and outlet pipe size issue, the existing outlet pipe (4”
diameter) should be removed and a 15” diameter pipe installed. Calculations for the post‐construction
site conditions indicate that installing a 15” diameter CHDPE outlet pipe will effectively handle the
design flow.
Therefore, it is recommended that a 15” diameter CHDPE pipe be installed at the existing pipe slope and
alignment to resolve the existing drainage issue and account for the future site expansion.
7.2WetlandDegradationThe calculated increase in runoff from the existing site to the post‐development site is shown in
Table 14.
Table 14 – Flow Rate Summary
Summary of Flow Rates ‐ Q (cfs)
Rainfall Event (yr)
West East
Pre Q Post Q ∆Q Pre Q Post Q ∆Q
10 2.77 4.29 1.52 3.38 3.85 0.47
25 ‐ ‐ ‐ 4.15 4.73 0.58
100 4.50 6.97 2.47 5.49 6.26 0.77

Hawthorne Substation The United Illuminating Co.
Site Stormwater Analysis Report B&V Project No. 188336 15/July/15
BLACK&VEATCH| 10
The primary expansion area for the Hawthorne Substation is located on the western side of the project
site. This area will be expanded to allow for the installation of additional equipment. Surface area that
does not become foundations or structures will be aggregate surfaced in accordance Black & Veatch
Drawing 25252‐414D. The runoff from this additional area will flow north across the substation pad,
traverse the pad side slopes and continue into a delineated wetland north of the property line,
approximately 18 feet. Figure 1 demonstrates the drainage area and flow pattern for the western
portion of the substation. Wetlands are a sensitive ecological area and measures will be taken to
prevent degradation caused by sediment or other potential pollutants transported by the runoff.
To ensure water quality protection for the wetland area, the following best management practices will
be installed as part of the substation expansion project.
Erosion control blanket – the blanket will be installed along the 2 (H) : 1 (V) slope on the
northern western substation pad. The erosion blanket will prevent erosion of the soil slope by
“locking” the slope together and promoting seed growth for re‐vegetation.
Re‐vegetation of side slopes – after construction the earthen slopes will be susceptible to
erosion control. The slopes will be seeded/re‐vegetated to deter erosion on the slopes. After
the slope is considered stabilized (70% uniform cover) with vegetation, the vegetation will
reduce the velocity of stormwater runoff and will provide soil interlock to prevent erosion of the
slope.
Compost filter sock – at the transition of the new slope and the existing site slope, a compost
filter sock will be installed. The compost filter sock will enhance the runoff water quality in
multiple ways. The compost filter sock will prevent soil erosion in the transition area by
minimizing the potential for turbulence caused by the transition of slopes. Installing compost
filter socks is considered a high quality best management practice. The compost filter socks
filter the runoff and remove sediment or other pollutants from the runoff.
Vegetated buffer – the existing vegetated/wooded area between the site boundary and the
wetland will not be disturbed during construction. The width of this buffer is approximately 18
feet. Stormwater runoff flowing to the wetland area will be flow through this
vegetated/wooded buffer which will provide additional filtering of sediment and reduce the
velocity of the runoff.

Hawthorne Substation The United Illuminating Co.
Site Stormwater Analysis Report B&V Project No. 188336 15/July/15
BLACK&VEATCH| 12
Attachment A
Site Drawing


Hawthorne Substation The United Illuminating Co.
Site Stormwater Analysis Report
B&V Project No. 188336 15/July/15
BLACK & VEATCH | 13
Attachment B
BV Calculation - 188336.58.1003
Pre vs. Post Construction Stormwater Runoff, Rev 1, July 15, 2015
You created this PDF from an application that is not licensed to print to novaPDF printer (http://www.novapdf.com)

CALCULATION RECORD
Client Name The United Illuminating Company Page 1 of 27
Project Name Hawthorne Substation Project No. 188336
Calculation Title Pre vs. Post Construction Stormwater Runoff
Calculation No./File No. 188336.58.1003
Verification Method: Check and Review Alternate Calculations
Objective: To compare pre-construction versus post-constrution to determine the change in stormwater runoff from the project site.
Unverified Assumptions Requiring Subsequent Verification No. Assumption Verified By Date
Refer to Page of this calculation for additional assumptions.
This Section Used for Software-Generated Calculations
Program Name/Number FlowMaster Version V8i
Standard B&V Application Used? Yes No If no, list approved deviation permit number below and attach approved deviation permit.
Review and Approval Rev Prepared By Date Verified By Date Approved By Date
0 Abigail Allgood 07/08/2015 Stephen Reitz 07/08/2015 David Koehler 07/08/2015
1 Abigail Allgood 07/15/2015 Stephen Reitz 07/15/2015 David Koehler 07/16/2015
P-GN-100G (Referenced by Energy-Std-2-03880-00140) Effective 15/DEC/11

Client: The United Illuminating Company Project Name: Hawthorne Substation Project No.: 188336 File No. Title: Pre vs. Post Stormwater Runoff Analysis Page: 2 .
TABLE OF CONTENTS 1. REFERENCES .......................................................................................................................................... 3
2. DESIGN BASIS........................................................................................................................................ 3
3. DEFINITIONS OF UNITS & CONSTANTS ................................................................................................ 3
4. ANALYSIS & DESIGN ............................................................................................................................. 3
4.1. FLOW CALCULATION - PRE-CONSTRUCTION................................................................................ 3
4.1.1. C value (C) ............................................................................................................................. 4
4.1.1.1. Western Subbasin ............................................................................................................. 4
4.1.1.2. Eastern Subbasin ............................................................................................................... 4
4.1.2. Time of Concentration (Tc) .................................................................................................... 4
4.1.3. Rainfall Intensity ................................................................................................................... 4
4.1.4. Flow Calculation .................................................................................................................... 5
4.2. FLOW CALCULATION - POST CONSTRUCTION .............................................................................. 5
4.2.1. C value (C) ............................................................................................................................. 6
4.2.1.1. Western Subbasin ............................................................................................................. 6
4.2.1.2. Eastern Subbasin ............................................................................................................... 6
4.2.2. Time of Concentration (Tc) .................................................................................................... 6
4.2.3. Rainfall Intensity ................................................................................................................... 6
4.2.4. Flow Calculation .................................................................................................................... 7
5. CATCH BASIN PIPE SIZE DESIGN ........................................................................................................... 8
5.1. SITE TO CATCH BASIN .................................................................................................................... 8
LIST OF ATTACHMENTS
ATTACHMENT A Schematic of Drainage Area and Proposed Surfacing ATTACHMENT B ConnDOT Drainage Manual: Select Pages ATTACHMENT C CWEIGHTED Calculations ATTACHMENT D Flow Rate Calculations ATTACHMENT E FlowMaster Results

Client: The United Illuminating Company Project Name: Hawthorne Substation Project No.: 188336 File No. Title: Pre vs. Post Stormwater Runoff Analysis Page: 3 . 1. REFERENCES
1.1. Connecticut Department of Transportation (ConnDOT); “ConnDOT: Drainage Manual" accessed 7/1/2015
1.2. US Department of Agriculture; “Urban Hydrology for Small Watersheds, 2nd Edition;” Technical Release 55 (TR-55), June 1986
2. DESIGN BASIS 2.1. Surface drainage is required to convey stormwater runoff from the Hawthorne Substation
northwest to surrounding wetlands and south to an existing catch basin. 2.2. The peak flow rates will be calculated using the Rational Method. This will require defining the
drainage areas , determining the time of concentration for each drainage area and computing the runoff coefficient for the drainage area. The design rainfall events will be the 10-Year, 25-Year and the 100-Year per reference 1.1.
2.3. The existing catch basin outlet pipe will be analyzed in FlowMaster using the calculated 25-Year peak flow rate.
3. DEFINITIONS OF UNITS & CONSTANTS In/hr inches/hour ft/s feet/second ID Inside diameter cfs cubic feet per second ac acres ft2 square feet
4. ANALYSIS & DESIGN
4.1. FLOW CALCULATION - PRE-CONSTRUCTION The drainage area of the site is such that the minimum time of concentration can be used. Chapter 6 of the ConnDOT Drainage Manual (Ref 1.1) states that a minimum Time of Concentration is 5 minutes. A schematic of the site including runoff area and time of concentration path can be found in Attachment A. Calculation results for CWEIGHTED are shown in Attachment C.

Client: The United Illuminating Company Project Name: Hawthorne Substation Project No.: 188336 File No. Title: Pre vs. Post Stormwater Runoff Analysis Page: 4 .
4.1.1. C value (C) 4.1.1.1. Western Subbasin
Asphalt Paving area = 0.06 acres CASPHALT = 0.95 Roof Surface area = 0.03 acres CROOF = 0.95 Aggregate Surface area = 0.24 acres CAGGREGATE = 0.60 Unimproved Surface area = 1.16 acres CUNIMPROVED = 0.20 Total drainage area = 1.49 acre CWEIGHTED = 0.31
4.1.1.2. Eastern Subbasin Asphalt Paving area = 0.20 acres CASPHALT = 0.95 Roof Surface area = 0.05 acres CROOF = 0.95 Aggregate Surface area = 0.30 acres CAGGREGATE = 0.60 Unimproved Surface area = 0.76 acres CUNIMPROVED = 0.20 Total drainage area = 1.31 acre CWEIGHTED = 0.43
4.1.2. Time of Concentration (Tc) Time of Concentration is considered the time for runoff to travel from the hydraulically most distant point of the drainage area to a point of interest within the drainage area. Time of concentration is assumed to be the minimum due to the short flow paths and combination of surfacing. Per reference 1.1, minimum time of concentration is 5 minutes. The following values were used to determine Tc:
Tc = 5 min (minimum Tc per Reference 1.1) to be used
4.1.3. Rainfall Intensity Time of Concentration will be used to determine the rainfall intensity. Time of Concentration (Tc) = 5 minutes Rainfall intensity will be determined using the method from the ConnDOT Drainage Manual Table B-2.1 (per reference 1.1) for 10 YR, 25 YR, and 100 YR storms. I10 = 6.0 in/hr I25 = 6.7 in/hr I100=7.8 in/hr

Client: The United Illuminating Company Project Name: Hawthorne Substation Project No.: 188336 File No. Title: Pre vs. Post Stormwater Runoff Analysis Page: 5 .
4.1.4. Flow Calculation
The Rational Method will be used to determine the 10-YR, 25-YR and 100-YR peak flow rates. The calculation tables are shown in Attachment D. Q = Cw x Cf x I x A Q = Discharge, ft3/s Cw = Weighted runoff coefficient Cf = Correction factor From reference 1.1, Table 6.2: Cf10 = 1.00 Cf25 = 1.10
Cf100=1.25 I = Rainfall intensity, in/hr A = Total Drainage Area, ft2
WESTERN SUBBASIN Q10 = 0.31x (1.0) x (6.0 in/hr) x (1.49 ac) = 2.77 cfs Q100 = 0.31x (1.25) x (7.8 in/hr) x (1.49 ac) = 4.50 cfs EASTERN SUBBASIN Q10 = 0.43 x (1.0) x (6.0 in/hr) x (1.31 ac) = 3.38 cfs Q25 = 0.43 x (1.10) x (6.7 in/hr) x (1.31 ac) = 4.15 cfs Q100 = 0.43 x (1.25) x (7.8 in/hr) x (1.31 ac) = 5.49 cfs
4.2. FLOW CALCULATION - POST CONSTRUCTION The drainage area of the site is such that the minimum time of concentration can be used. Chapter 6 of the ConnDOT Drainage Manual (Ref 1.1) states that a minimum Time of Concentration is 5 minutes. A schematic of the site including runoff area and time of concentration path can be found in Attachment A. Calculation results for CWEIGHTED are shown in Attachment C.

Client: The United Illuminating Company Project Name: Hawthorne Substation Project No.: 188336 File No. Title: Pre vs. Post Stormwater Runoff Analysis Page: 6 .
4.2.1. C value (C) 4.2.1.1. Western Subbasin
Asphalt Paving area = 0.06 acres CASPHALT = 0.95 Roof Surface area = 0.03 acres CROOF = 0.95 Aggregate Surface area = 0.89 acres CAGGREGATE = 0.60 Unimproved Surface area = 0.51 acres CUNIMPROVED = 0.20 Total drainage area = 1.49 acre CWEIGHTED = 0.48
4.2.1.2. Eastern Subbasin Asphalt Paving area = 0.18 acres CASPHALT = 0.95 Roof Surface area = 0.05 acres CROOF = 0.95 Aggregate Surface area = 0.53 acres CAGGREGATE = 0.60 Unimproved Surface area = 0.55 acres CUNIMPROVED = 0.20 Total drainage area = 1.31 acre CWEIGHTED = 0.49
4.2.2. Time of Concentration (Tc) Time of Concentration is considered the time for runoff to travel from the hydraulically most distant point of the drainage area to a point of interest within the drainage area. Time of concentration is assumed to be the minimum due to the short flow paths and combination of surfacing. Per reference 1.1, minimum time of concentration is 5 minutes. The following values were used to determine Tc:
Tc = 5 min (minimum Tc per Reference 1.1) to be used
4.2.3. Rainfall Intensity Time of Concentration will be used to determine the rainfall intensity. Time of Concentration (Tc) = 5 minutes Rainfall intensity will be determined using the method from the ConnDOT Drainage Manual Table B-2.1 (per reference 1.1) for 10 YR, 25 YR, and 100 YR storms. I10 = 6.0 in/hr I25 = 6.7 in/hr I100=7.8 in/hr

Client: The United Illuminating Company Project Name: Hawthorne Substation Project No.: 188336 File No. Title: Pre vs. Post Stormwater Runoff Analysis Page: 7 .
4.2.4. Flow Calculation
The Rational Method will be used to determine the 10-YR and 100-YR design storm discharge. The calculation tables are shown in Attachment D. Q = Cw x Cf x I x A Q = Discharge, ft3/s Cw = Weighted runoff coefficient Cf = Correction factor From reference 1.1, Table 6.2: Cf10 = 1.00 Cf25 = 1.10
Cf100=1.25 I = Rainfall intensity, in/hr A = Total Drainage Area, ft2
WESTERN SUBBASIN Q10 = 0.48 x (1.0) x (6.0 in/hr) x (1.49 ac) = 4.29 cfs Q100 = 0.48 x (1.25) x (7.8 in/hr) x (1.49 ac) = 6.97 cfs EASTERN SUBBASIN Q10 = 0.49 x (1.0) x (6.0 in/hr) x (1.31 ac) = 3.85 cfs Q25 = 0.49 x (1.0) x (6.7 in/hr) x (1.31 ac) = 4.73 cfs Q100 = 0.49 x (1.25) x (7.8 in/hr) x (1.31 ac) = 6.26 cfs
Pre Q Post Q Pre Q Post Q10 2.77 4.29 3.38 3.8525 - - 4.15 4.73
100 4.50 6.97 5.49 6.26
West EastSummary of Peak Flow Rates - Q (cfs)
Rainfall Event (yr)
Client: The United Illuminating Company Project Name: Hawthorne Substation Project No.: 188336 File No. Title: Pre vs. Post Stormwater Runoff Analysis Page: 8 . 5. CATCH BASIN PIPE SIZE DESIGN
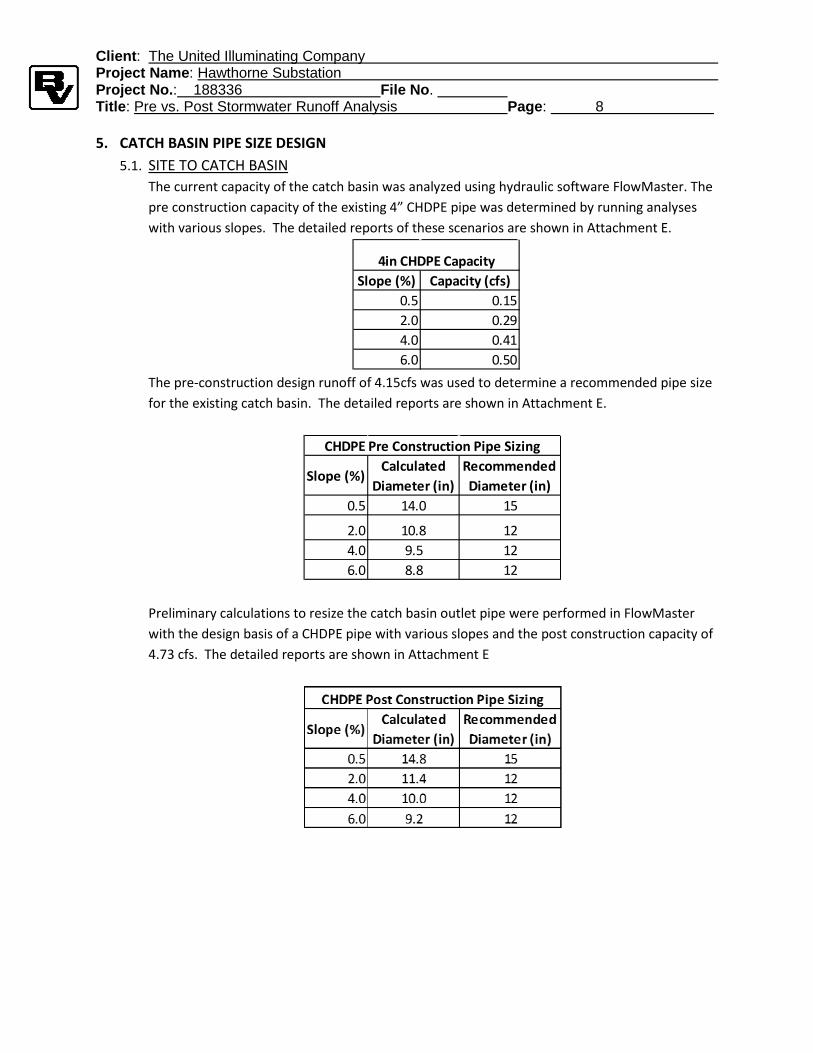
5.1. SITE TO CATCH BASIN The current capacity of the catch basin was analyzed using hydraulic software FlowMaster. The pre construction capacity of the existing 4” CHDPE pipe was determined by running analyses with various slopes. The detailed reports of these scenarios are shown in Attachment E.
The pre-construction design runoff of 4.15cfs was used to determine a recommended pipe size for the existing catch basin. The detailed reports are shown in Attachment E.
Preliminary calculations to resize the catch basin outlet pipe were performed in FlowMaster with the design basis of a CHDPE pipe with various slopes and the post construction capacity of 4.73 cfs. The detailed reports are shown in Attachment E
Slope (%) Capacity (cfs)0.5 0.152.0 0.294.0 0.416.0 0.50
4in CHDPE Capacity
Slope (%)Calculated
Diameter (in)Recommended Diameter (in)
0.5 14.0 15
2.0 10.8 124.0 9.5 126.0 8.8 12
CHDPE Pre Construction Pipe Sizing

Client: The United Illuminating Company Project Name: Hawthorne Substation Project No.: 188336 File No. Title: Pre vs. Post Stormwater Runoff Analysis Page: 9 .
Attachment A Schematic of Drainage Area and Proposed Surfacing


Client: The United Illuminating Company Project Name: Hawthorne Substation Project No.: 188336 File No. Title: Pre vs. Post Stormwater Runoff Analysis Page: 10 .
Attachment B ConnDOT Drainage Manual: Select Pages


Client: The United Illuminating Company Project Name: Hawthorne Substation Project No.: 188336 File No. Title: Pre vs. Post Stormwater Runoff Analysis Page: 11 .
Attachment C CWEIGHTED Calculations

Client: The United Illuminating Company Project Name: Hawthorne Substation Project No.: 188336 File No. Title: Pre vs. Post Stormwater Runoff Analysis Page: 12 .
ASPHALT PAVING AGGREGATE SURFACING ROOF UNIMPROVED TOTAL WEIGHTED Cc 0.95 0.60 0.95 0.20 0.31AREA (ac) 0.06 0.24 0.03 1.16 1.49
ASPHALT PAVING AGGREGATE SURFACING ROOF UNIMPROVED TOTAL WEIGHTED Cc 0.95 0.60 0.95 0.20 0.43AREA (ac) 0.20 0.30 0.05 0.76 1.31
ASPHALT PAVING AGGREGATE SURFACING ROOF UNIMPROVED TOTAL WEIGHTED Cc 0.95 0.60 0.95 0.20 0.48AREA (ac) 0.06 0.89 0.03 0.51 1.49
ASPHALT PAVING AGGREGATE SURFACING ROOF UNIMPROVED TOTAL WEIGHTED Cc 0.95 0.60 0.95 0.20 0.49AREA (ac) 0.18 0.53 0.05 0.55 1.31
West Pre-Construction Weighted C (Cw)
West Post-Construction Weighted C (Cw)
East Pre-Construction Weighted C (Cw)
East Post-Construction Weighted C (Cw)
𝐶𝑊𝐸𝐼𝐺𝐻𝑇𝐸𝐷= 𝐶𝐴𝑆𝑃𝐻𝐴𝐿𝑇 𝐴𝐴𝑆𝑃𝐻𝐴𝐿𝑇 + 𝐶𝑅𝑂𝑂𝐹 𝐴𝑅𝑂𝑂𝐹 + 𝐶𝐴𝐺𝐺𝑅𝐸𝐺𝐴𝑇𝐸 𝐴𝐴𝐺𝐺𝑅𝐸𝐺𝐴𝑇𝐸 + 𝐶𝑈𝑁𝐼𝑀𝑃𝑅𝑂𝑉𝐸𝐷(𝐴𝑈𝑁𝐼𝑀𝑃𝑅𝑂𝑉𝐸𝐷)
𝐴𝑇𝑂𝑇𝐴𝐿

Client: The United Illuminating Company Project Name: Hawthorne Substation Project No.: 188336 File No. Title: Pre vs. Post Stormwater Runoff Analysis Page: 13 .
Attachment D Flow Rate Calculations

Client: The United Illuminating Company Project Name: Hawthorne Substation Project No.: 188336 File No. Title: Pre vs. Post Stormwater Runoff Analysis Page: 14 .
West Pre-Construction Peak Flow Rates - Q(cfs)
Rainfall Event (yr) Cw Cf I (in/hr) A (ac) Q (cfs)
10-yr 0.31 1.00 6.00 1.49 2.77 100-yr 0.31 1.25 7.80 1.49 4.50
East Pre-Construction Peak Flow Rates - Q(cfs) Rainfall Event
(yr) Cw Cf I (in/hr) A (ac) Q (cfs)
10-yr 0.49 1.00 6.00 1.31 3.85 25-yr 0.49 1.10 6.70 1.31 4.73
100-yr 0.49 1.25 7.80 1.31 6.26
West Post Construction Peak Flow Rates - Q(cfs)
Rainfall Event (yr) Cw Cf I (in/hr) A (ac) Q (cfs)
10-yr 0.48 1.00 6.00 1.49 4.29 100-yr 0.48 1.25 7.80 1.49 6.97
East Post Construction Peak Flow Rates - Q(cfs) Rainfall Event
(yr) Cw Cf I (in/hr) A (ac) Q (cfs)
10-yr 0.43 1.00 6.00 1.31 3.38 25-yr 0.43 1.10 6.70 1.31 4.15
100-yr 0.43 1.25 7.80 1.31 5.49

Client: The United Illuminating Company Project Name: Hawthorne Substation Project No.: 188336 File No. Title: Pre vs. Post Stormwater Runoff Analysis Page: 15 .
Attachment E FlowMaster Results

Client: The United Illuminating Company Project Name: Hawthorne Substation Project No.: 188336 File No. Title: Pre vs. Post Stormwater Runoff Analysis Page: 16 .
Worksheet for 4 in CHDPE 0.5% Slope Project Description
Friction Method Manning Formula
Solve For Full Flow Capacity
Input Data
Roughness Coefficient 0.012
Channel Slope 0.00500 ft/ft
Normal Depth 0.33 ft
Diameter 0.33 ft
Discharge 0.15 ft³/s
Results
Discharge 0.15 ft³/s
Normal Depth 0.33 ft
Flow Area 0.09 ft²
Wetted Perimeter 1.05 ft
Hydraulic Radius 0.08 ft
Top Width 0.00 ft
Critical Depth 0.21 ft
Percent Full 100.0 %
Critical Slope 0.00897 ft/ft
Velocity 1.67 ft/s
Velocity Head 0.04 ft
Specific Energy 0.38 ft
Froude Number 0.00
Maximum Discharge 0.16 ft³/s
Discharge Full 0.15 ft³/s
Slope Full 0.00500 ft/ft
Flow Type SubCritical
GVF Input Data
Downstream Depth 0.00 ft
Length 0.00 ft
Number Of Steps 0
GVF Output Data
Upstream Depth 0.00 ft
Profile Description
Profile Headloss 0.00 ft
Average End Depth Over Rise 0.00 %
Bentley Systems, Inc. Bentley FlowMaster V8i (SELECTseries 1) [08.11.01.03] 7/9/2015 8:24:41 AM 27 Siemons Company Drive Suite 200 W Watertown, CT 06795 USA +1-203-755-1666 Page 1 of 2

Client: The United Illuminating Company Project Name: Hawthorne Substation Project No.: 188336 File No. Title: Pre vs. Post Stormwater Runoff Analysis Page: 17 . Worksheet for 4 in CHDPE 2.0% Slope Project Description
Friction Method Manning Formula
Solve For Full Flow Capacity
Input Data
Roughness Coefficient 0.012
Channel Slope 0.02000 ft/ft
Normal Depth 0.33 ft
Diameter 0.33 ft
Discharge 0.29 ft³/s
Results
Discharge 0.29 ft³/s
Normal Depth 0.33 ft
Flow Area 0.09 ft²
Wetted Perimeter 1.05 ft
Hydraulic Radius 0.08 ft
Top Width 0.00 ft
Critical Depth 0.30 ft
Percent Full 100.0 %
Critical Slope 0.01778 ft/ft
Velocity 3.34 ft/s
Velocity Head 0.17 ft
Specific Energy 0.51 ft
Froude Number 0.00
Maximum Discharge 0.31 ft³/s
Discharge Full 0.29 ft³/s
Slope Full 0.02000 ft/ft
Flow Type SubCritical
GVF Input Data
Downstream Depth 0.00 ft
Length 0.00 ft
Number Of Steps 0
GVF Output Data
Upstream Depth 0.00 ft
Profile Description
Profile Headloss 0.00 ft
Average End Depth Over Rise 0.00 %
Bentley Systems, Inc. Bentley FlowMaster V8i (SELECTseries 1) [08.11.01.03] 7/9/2015 8:25:32 AM 27 Siemons Company Drive Suite 200 W Watertown, CT 06795 USA +1-203-755-1666 Page 1 of 2

Client: The United Illuminating Company Project Name: Hawthorne Substation Project No.: 188336 File No. Title: Pre vs. Post Stormwater Runoff Analysis Page: 18 . Worksheet for 4 in CHDPE 4.0% Slope Project Description
Friction Method Manning Formula
Solve For Full Flow Capacity
Input Data
Roughness Coefficient 0.012
Channel Slope 0.04000 ft/ft
Normal Depth 0.33 ft
Diameter 0.33 ft
Discharge 0.41 ft³/s
Results
Discharge 0.41 ft³/s
Normal Depth 0.33 ft
Flow Area 0.09 ft²
Wetted Perimeter 1.05 ft
Hydraulic Radius 0.08 ft
Top Width 0.00 ft
Critical Depth 0.32 ft
Percent Full 100.0 %
Critical Slope 0.03502 ft/ft
Velocity 4.72 ft/s
Velocity Head 0.35 ft
Specific Energy 0.68 ft
Froude Number 0.00
Maximum Discharge 0.44 ft³/s
Discharge Full 0.41 ft³/s
Slope Full 0.04000 ft/ft
Flow Type SubCritical
GVF Input Data
Downstream Depth 0.00 ft
Length 0.00 ft
Number Of Steps 0
GVF Output Data
Upstream Depth 0.00 ft
Profile Description
Profile Headloss 0.00 ft
Average End Depth Over Rise 0.00 %
Bentley Systems, Inc. Bentley FlowMaster V8i (SELECTseries 1) [08.11.01.03] 7/9/2015 8:26:20 AM 27 Siemons Company Drive Suite 200 W Watertown, CT 06795 USA +1-203-755-1666 Page 1 of 2

Client: The United Illuminating Company Project Name: Hawthorne Substation Project No.: 188336 File No. Title: Pre vs. Post Stormwater Runoff Analysis Page: 19 . Worksheet for 4 in CHDPE 6.0% Slope Project Description
Friction Method Manning Formula
Solve For Full Flow Capacity
Input Data
Roughness Coefficient 0.012
Channel Slope 0.06000 ft/ft
Normal Depth 0.33 ft
Diameter 0.33 ft
Discharge 0.50 ft³/s
Results
Discharge 0.50 ft³/s
Normal Depth 0.33 ft
Flow Area 0.09 ft²
Wetted Perimeter 1.05 ft
Hydraulic Radius 0.08 ft
Top Width 0.00 ft
Critical Depth 0.33 ft
Percent Full 100.0 %
Critical Slope 0.05420 ft/ft
Velocity 5.78 ft/s
Velocity Head 0.52 ft
Specific Energy 0.85 ft
Froude Number 0.00
Maximum Discharge 0.54 ft³/s
Discharge Full 0.50 ft³/s
Slope Full 0.06000 ft/ft
Flow Type SubCritical
GVF Input Data
Downstream Depth 0.00 ft
Length 0.00 ft
Number Of Steps 0
GVF Output Data
Upstream Depth 0.00 ft
Profile Description
Profile Headloss 0.00 ft
Average End Depth Over Rise 0.00 %
Bentley Systems, Inc. Bentley FlowMaster V8i (SELECTseries 1) [08.11.01.03] 7/9/2015 8:27:22 AM 27 Siemons Company Drive Suite 200 W Watertown, CT 06795 USA +1-203-755-1666 Page 1 of 2

Client: The United Illuminating Company Project Name: Hawthorne Substation Project No.: 188336 File No. Title: Pre vs. Post Stormwater Runoff Analysis Page: 20 . Worksheet for Pre-Construction CHDPE 0.5% Slope, 25YR Storm Project Description
Friction Method Manning Formula
Solve For Full Flow Diameter
Input Data
Roughness Coefficient 0.012
Channel Slope 0.00500 ft/ft
Normal Depth 1.17 ft
Diameter 1.17 ft
Discharge 4.15 ft³/s
Results
Diameter 1.17 ft
Normal Depth 1.17 ft
Flow Area 1.08 ft²
Wetted Perimeter 3.68 ft
Hydraulic Radius 0.29 ft
Top Width 0.00 ft
Critical Depth 0.84 ft
Percent Full 100.0 %
Critical Slope 0.00669 ft/ft
Velocity 3.86 ft/s
Velocity Head 0.23 ft
Specific Energy 1.40 ft
Froude Number 0.00
Maximum Discharge 4.46 ft³/s
Discharge Full 4.15 ft³/s
Slope Full 0.00500 ft/ft
Flow Type SubCritical
GVF Input Data
Downstream Depth 0.00 ft
Length 0.00 ft
Number Of Steps 0
GVF Output Data
Upstream Depth 0.00 ft
Profile Description
Profile Headloss 0.00 ft
Average End Depth Over Rise 0.00 %
Bentley Systems, Inc. Bentley FlowMaster V8i (SELECTseries 1) [08.11.01.03] 7/15/2015 11:33:26 AM 27 Siemons Company Drive Suite 200 W Watertown, CT 06795 USA +1-203-755-1666 Page 1 of 2

Client: The United Illuminating Company Project Name: Hawthorne Substation Project No.: 188336 File No. Title: Pre vs. Post Stormwater Runoff Analysis Page: 21 . Worksheet for Pre-Construction CHDPE 2.0% Slope, 25YR Storm Project Description
Friction Method Manning Formula
Solve For Full Flow Diameter
Input Data
Roughness Coefficient 0.012
Channel Slope 0.02000 ft/ft
Normal Depth 0.90 ft
Diameter 0.90 ft
Discharge 4.15 ft³/s
Results
Diameter 0.90 ft
Normal Depth 0.90 ft
Flow Area 0.64 ft²
Wetted Perimeter 2.83 ft
Hydraulic Radius 0.23 ft
Top Width 0.00 ft
Critical Depth 0.84 ft
Percent Full 100.0 %
Critical Slope 0.01729 ft/ft
Velocity 6.49 ft/s
Velocity Head 0.65 ft
Specific Energy 1.56 ft
Froude Number 0.00
Maximum Discharge 4.46 ft³/s
Discharge Full 4.15 ft³/s
Slope Full 0.02000 ft/ft
Flow Type SubCritical
GVF Input Data
Downstream Depth 0.00 ft
Length 0.00 ft
Number Of Steps 0
GVF Output Data
Upstream Depth 0.00 ft
Profile Description
Profile Headloss 0.00 ft
Average End Depth Over Rise 0.00 %
Bentley Systems, Inc. Bentley FlowMaster V8i (SELECTseries 1) [08.11.01.03] 7/15/2015 11:33:45 AM 27 Siemons Company Drive Suite 200 W Watertown, CT 06795 USA +1-203-755-1666 Page 1 of 2

Client: The United Illuminating Company Project Name: Hawthorne Substation Project No.: 188336 File No. Title: Pre vs. Post Stormwater Runoff Analysis Page: 22 . Worksheet for Pre-Construction CHDPE 4.0% Slope, 25YR Storm Project Description
Friction Method Manning Formula
Solve For Full Flow Diameter
Input Data
Roughness Coefficient 0.012
Channel Slope 0.04000 ft/ft
Normal Depth 0.79 ft
Diameter 0.79 ft
Discharge 4.15 ft³/s
Results
Diameter 0.79 ft
Normal Depth 0.79 ft
Flow Area 0.49 ft²
Wetted Perimeter 2.49 ft
Hydraulic Radius 0.20 ft
Top Width 0.00 ft
Critical Depth 0.78 ft
Percent Full 100.0 %
Critical Slope 0.03585 ft/ft
Velocity 8.42 ft/s
Velocity Head 1.10 ft
Specific Energy 1.89 ft
Froude Number 0.00
Maximum Discharge 4.46 ft³/s
Discharge Full 4.15 ft³/s
Slope Full 0.04000 ft/ft
Flow Type SubCritical
GVF Input Data
Downstream Depth 0.00 ft
Length 0.00 ft
Number Of Steps 0
GVF Output Data
Upstream Depth 0.00 ft
Profile Description
Profile Headloss 0.00 ft
Average End Depth Over Rise 0.00 %
Bentley Systems, Inc. Bentley FlowMaster V8i (SELECTseries 1) [08.11.01.03] 7/15/2015 11:34:04 AM 27 Siemons Company Drive Suite 200 W Watertown, CT 06795 USA +1-203-755-1666 Page 1 of 2

Client: The United Illuminating Company Project Name: Hawthorne Substation Project No.: 188336 File No. Title: Pre vs. Post Stormwater Runoff Analysis Page: 23 . Worksheet for Pre-Construction CHDPE 6.0% Slope, 25YR Storm Project Description
Friction Method Manning Formula
Solve For Full Flow Diameter
Input Data
Roughness Coefficient 0.012
Channel Slope 0.06000 ft/ft
Normal Depth 0.73 ft
Diameter 0.73 ft
Discharge 4.15 ft³/s
Results
Diameter 0.73 ft
Normal Depth 0.73 ft
Flow Area 0.42 ft²
Wetted Perimeter 2.31 ft
Hydraulic Radius 0.18 ft
Top Width 0.00 ft
Critical Depth 0.73 ft
Percent Full 100.0 %
Critical Slope 0.05539 ft/ft
Velocity 9.80 ft/s
Velocity Head 1.49 ft
Specific Energy 2.23 ft
Froude Number 0.00
Maximum Discharge 4.46 ft³/s
Discharge Full 4.15 ft³/s
Slope Full 0.06000 ft/ft
Flow Type SubCritical
GVF Input Data
Downstream Depth 0.00 ft
Length 0.00 ft
Number Of Steps 0
GVF Output Data
Upstream Depth 0.00 ft
Profile Description
Profile Headloss 0.00 ft
Average End Depth Over Rise 0.00 %
Bentley Systems, Inc. Bentley FlowMaster V8i (SELECTseries 1) [08.11.01.03] 7/15/2015 11:34:20 AM 27 Siemons Company Drive Suite 200 W Watertown, CT 06795 USA +1-203-755-1666 Page 1 of 2

Client: The United Illuminating Company Project Name: Hawthorne Substation Project No.: 188336 File No. Title: Pre vs. Post Stormwater Runoff Analysis Page: 24 . Worksheet for CHDPE 0.5% Slope, 25YR Storm Project Description
Friction Method Manning Formula
Solve For Full Flow Diameter
Input Data
Roughness Coefficient 0.012
Channel Slope 0.00500 ft/ft
Normal Depth 1.23 ft
Diameter 1.23 ft
Discharge 4.73 ft³/s
Results
Diameter 1.23 ft
Normal Depth 1.23 ft
Flow Area 1.19 ft²
Wetted Perimeter 3.86 ft
Hydraulic Radius 0.31 ft
Top Width 0.00 ft
Critical Depth 0.89 ft
Percent Full 100.0 %
Critical Slope 0.00662 ft/ft
Velocity 3.99 ft/s
Velocity Head 0.25 ft
Specific Energy 1.48 ft
Froude Number 0.00
Maximum Discharge 5.09 ft³/s
Discharge Full 4.73 ft³/s
Slope Full 0.00500 ft/ft
Flow Type SubCritical
GVF Input Data
Downstream Depth 0.00 ft
Length 0.00 ft
Number Of Steps 0
GVF Output Data
Upstream Depth 0.00 ft
Profile Description
Profile Headloss 0.00 ft
Average End Depth Over Rise 0.00 %
Bentley Systems, Inc. Bentley FlowMaster V8i (SELECTseries 1) [08.11.01.03] 7/9/2015 10:05:43 AM 27 Siemons Company Drive Suite 200 W Watertown, CT 06795 USA +1-203-755-1666 Page 1 of 2
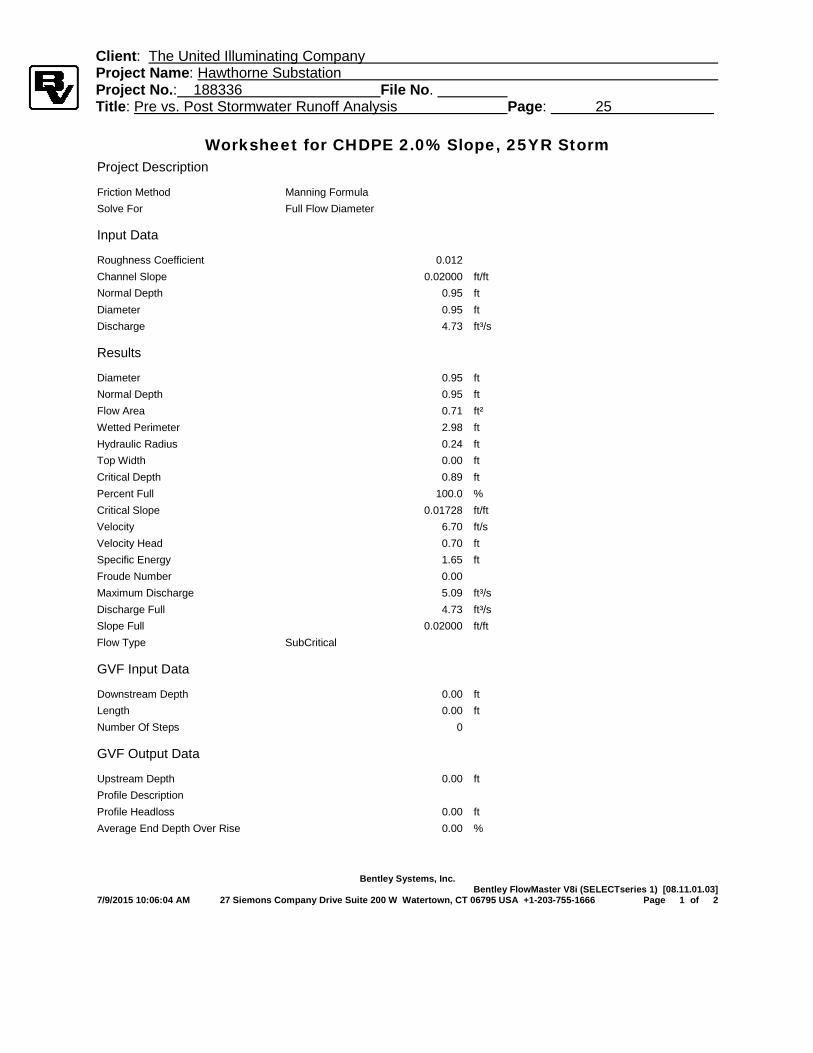
Client: The United Illuminating Company Project Name: Hawthorne Substation Project No.: 188336 File No. Title: Pre vs. Post Stormwater Runoff Analysis Page: 25 . Worksheet for CHDPE 2.0% Slope, 25YR Storm Project Description
Friction Method Manning Formula
Solve For Full Flow Diameter
Input Data
Roughness Coefficient 0.012
Channel Slope 0.02000 ft/ft
Normal Depth 0.95 ft
Diameter 0.95 ft
Discharge 4.73 ft³/s
Results
Diameter 0.95 ft
Normal Depth 0.95 ft
Flow Area 0.71 ft²
Wetted Perimeter 2.98 ft
Hydraulic Radius 0.24 ft
Top Width 0.00 ft
Critical Depth 0.89 ft
Percent Full 100.0 %
Critical Slope 0.01728 ft/ft
Velocity 6.70 ft/s
Velocity Head 0.70 ft
Specific Energy 1.65 ft
Froude Number 0.00
Maximum Discharge 5.09 ft³/s
Discharge Full 4.73 ft³/s
Slope Full 0.02000 ft/ft
Flow Type SubCritical
GVF Input Data
Downstream Depth 0.00 ft
Length 0.00 ft
Number Of Steps 0
GVF Output Data
Upstream Depth 0.00 ft
Profile Description
Profile Headloss 0.00 ft
Average End Depth Over Rise 0.00 %
Bentley Systems, Inc. Bentley FlowMaster V8i (SELECTseries 1) [08.11.01.03] 7/9/2015 10:06:04 AM 27 Siemons Company Drive Suite 200 W Watertown, CT 06795 USA +1-203-755-1666 Page 1 of 2

Client: The United Illuminating Company Project Name: Hawthorne Substation Project No.: 188336 File No. Title: Pre vs. Post Stormwater Runoff Analysis Page: 26 . Worksheet for CHDPE 4.0% Slope, 25YR Storm Project Description
Friction Method Manning Formula
Solve For Full Flow Diameter
Input Data
Roughness Coefficient 0.012
Channel Slope 0.04000 ft/ft
Normal Depth 0.83 ft
Diameter 0.83 ft
Discharge 4.73 ft³/s
Results
Diameter 0.83 ft
Normal Depth 0.83 ft
Flow Area 0.54 ft²
Wetted Perimeter 2.61 ft
Hydraulic Radius 0.21 ft
Top Width 0.00 ft
Critical Depth 0.82 ft
Percent Full 100.0 %
Critical Slope 0.03589 ft/ft
Velocity 8.69 ft/s
Velocity Head 1.17 ft
Specific Energy 2.01 ft
Froude Number 0.00
Maximum Discharge 5.09 ft³/s
Discharge Full 4.73 ft³/s
Slope Full 0.03999 ft/ft
Flow Type SubCritical
GVF Input Data
Downstream Depth 0.00 ft
Length 0.00 ft
Number Of Steps 0
GVF Output Data
Upstream Depth 0.00 ft
Profile Description
Profile Headloss 0.00 ft
Average End Depth Over Rise 0.00 %
Bentley Systems, Inc. Bentley FlowMaster V8i (SELECTseries 1) [08.11.01.03] 7/9/2015 10:06:49 AM 27 Siemons Company Drive Suite 200 W Watertown, CT 06795 USA +1-203-755-1666 Page 1 of 2

Client: The United Illuminating Company Project Name: Hawthorne Substation Project No.: 188336 File No. Title: Pre vs. Post Stormwater Runoff Analysis Page: 27 . Worksheet for CHDPE 6.0% Slope, 25YR Storm Project Description
Friction Method Manning Formula
Solve For Full Flow Diameter
Input Data
Roughness Coefficient 0.012
Channel Slope 0.06000 ft/ft
Normal Depth 0.77 ft
Diameter 0.77 ft
Discharge 4.73 ft³/s
Results
Diameter 0.77 ft
Normal Depth 0.77 ft
Flow Area 0.47 ft²
Wetted Perimeter 2.42 ft
Hydraulic Radius 0.19 ft
Top Width 0.00 ft
Critical Depth 0.76 ft
Percent Full 100.0 %
Critical Slope 0.05545 ft/ft
Velocity 10.12 ft/s
Velocity Head 1.59 ft
Specific Energy 2.36 ft
Froude Number 0.00
Maximum Discharge 5.09 ft³/s
Discharge Full 4.73 ft³/s
Slope Full 0.05999 ft/ft
Flow Type SubCritical
GVF Input Data
Downstream Depth 0.00 ft
Length 0.00 ft
Number Of Steps 0
GVF Output Data
Upstream Depth 0.00 ft
Profile Description
Profile Headloss 0.00 ft
Average End Depth Over Rise 0.00 %
Bentley Systems, Inc. Bentley FlowMaster V8i (SELECTseries 1) [08.11.01.03] 7/9/2015 10:07:14 AM 27 Siemons Company Drive Suite 200 W Watertown, CT 06795 USA +1-203-755-1666 Page 1 of 2