Site scale remote sensing of mixing zone water quality
12
MWWD 2008 P_MWWD2008_Doneker_Site scale remote sensing - page 1 of 12 Site scale remote sensing of mixing zone water quality Robert L. Doneker (1) , Todd Sanders (2) , Adi Ramachandran (3) Keywords Mixing zones, remote sensing, water quality management, CORMIX model validation, outfall inspection, NPDES permit, multiport diffusers, wastewater discharge, acoustic camera Introduction Wastewater discharges in the US are required to have a National Pollution Discharge Elimination System (NPDES) permit. Ambient water quality standards need not be met at end of pipe if a mixing zone is allowed by the regulatory authority[1]. A mixing zone is a limited region or area around the discharge where the initial dilution occurs. Figure 1 shows a plan view representation of a regulatory mixing zone for a point source discharge. Dischargers must demonstrate sufficient dilution at the edge of the mixing zone to comply with water quality standards. Mixing zones are typically determined by mathematical modeling, however sometimes field dilution studies are required[2]. With USEPA support, we have developed an integrated remote sensing system for water quality monitoring in riverine mixing zones. This system includes an aerial platform and several boat-mounted sensors. Our patent-pending system includes a tethered-balloon aerial platform with several sensors including infrared (IR) and visual cameras to collect site scale data in near-real time. This platform uses sensor data to assess plume behavior and outfall mixing performance. To augment our aerial system for monitoring point source mixing and hydrodynamic model validation, we have recently integrated several additional boat-mounted sonar sensors: i) a 1200kHz Acoustic Doppler Current Profiler (ADCP) to collect velocity profiles, ii) a 60kHz depth sounder for bathymetry readings, and iii) a Dual Frequency Identification Sonar (DIDSON) acoustic camera to assess physical outfall condition and mixing zone dilution modeling. Aerial Sensors for Water Quality Monitoring Aerial remote sensing has the potential to collect data over large regions in real time without disturbing or influencing the properties measured. 1 Robert L. Doneker, Prof., Dr., P.E., MixZon Inc. 1033 SW Yamhill St, Suite 301, Portland, OR 97205 USA, - +503-222-1022 - mailto:[email protected] – http://www.mixzon.com 2 Todd Sanders Prof. Dr. Portland Community College, Portland, OR 97280-mailto:[email protected] 3 Adi Ramachadran Mr., Senior Software Engineer, MixZon Inc. 1033 SW Yamhill St, Suite 301, Portland, OR 97205 USA, -+503-222-1022 - mailto:[email protected] – http://www.mixzon.com Figure 1. Regulatory Mixing Zones. The discharge must meet minimum dilution at the edge of the regulatory mixing zone.
Transcript of Site scale remote sensing of mixing zone water quality

MWWD 2008
P_MWWD2008_Doneker_Site scale remote sensing - page 1 of 12
Site scale remote sensing of mixing zone water quality
Robert L. Doneker (1), Todd Sanders (2), Adi Ramachandran (3)
Keywords
Mixing zones, remote sensing, water quality management, CORMIX model validation, outfall inspection, NPDES permit, multiport diffusers, wastewater discharge, acoustic camera Introduction Wastewater discharges in the US are required to have a National Pollution Discharge Elimination System (NPDES) permit. Ambient water quality standards need not be met at end of pipe if a mixing zone is allowed by the regulatory authority[1]. A mixing zone is a limited region or area around the discharge where the initial dilution occurs. Figure 1 shows a plan view representation of a regulatory mixing zone for a point source discharge. Dischargers must demonstrate sufficient dilution at the edge of the mixing zone to comply with water quality standards. Mixing zones are typically determined by mathematical modeling, however sometimes field dilution studies are required[2].
With USEPA support, we have developed an integrated remote sensing system for water quality monitoring in riverine mixing zones. This system includes an aerial platform and several boat-mounted sensors. Our patent-pending system includes a tethered-balloon aerial platform with several sensors including infrared (IR) and visual cameras to collect site scale data in near-real time. This platform uses sensor data to assess plume behavior and outfall mixing performance. To augment our aerial system for monitoring point source mixing and hydrodynamic model validation, we have recently integrated several additional boat-mounted sonar sensors: i) a 1200kHz Acoustic Doppler Current Profiler (ADCP) to collect velocity profiles, ii) a 60kHz depth sounder for bathymetry readings, and iii) a Dual Frequency Identification Sonar (DIDSON) acoustic camera to assess physical outfall condition and mixing zone dilution modeling. Aerial Sensors for Water Quality Monitoring Aerial remote sensing has the potential to collect
data over large regions in real time without disturbing or influencing the properties measured.
1 Robert L. Doneker, Prof., Dr., P.E., MixZon Inc. 1033 SW Yamhill St, Suite 301, Portland, OR 97205 USA, -+503-222-1022 - mailto:[email protected]– http://www.mixzon.com 2 Todd Sanders Prof. Dr. Portland Community College, Portland, OR 97280-mailto:[email protected] 3 Adi Ramachadran Mr., Senior Software Engineer, MixZon Inc. 1033 SW Yamhill St, Suite 301, Portland, OR 97205 USA, -+503-222-1022 - mailto:[email protected]– http://www.mixzon.com
Figure 1. Regulatory Mixing Zones. The dischargemust meet minimum dilution at the edge of theregulatory mixing zone.

P_MWWD2008_Doneker_Site scale remote sensing - page 2 of 12
However, currently available alternative aerial remote sensing platforms are very expensive or not well suited for many mixing zone management issues [3]. Direct measurement of biophysical information such as temperature is dependent on the scale of the phenomena. To properly resolve riverine mixing zone spatial scales with the Nyquist frequency limits requires resolution not readily available through space-based platforms and is limited to low-altitude helicopter or fixed-wing aircraft operations [4]. Both the helicopter and fixed-wing aircraft platform have enjoyed widespread successful application in remote sensing of the spatial distribution of surface water temperature values in mixing zones [5, 6]. However availability is limited, extensive operator training is required, and their costs are relatively high. Often, airborne platforms need to be reserved months in advance. Because of high costs and limited availability, helicopters and fixed-wing aircraft are not well-suited for rapid or routine deployment at a fixed location where hourly sampling may be required over a period of several days or weeks. Extended platform deployment scenarios are likely to be necessary in analyzing impacts of mixing zones in regulatory management. Figure 2A shows a conceptual diagram of our tethered helium balloon remote sensing platform for site scale observation. Figure 2B details platform sensors which include a digital compass (platform x-y-z position and bearing to true and magnetic north), Global Positioning System (GPS) receiver, temperature/humidity sensor, and laser rangefinder (distance to target). Our laptop ground station uses a custom developed application called ZoneView to monitor the aerial platform. ZoneView positions the pan/tilt camera mount and captures sensor data over an 802.11g wireless network. We transmit visual and infrared images to the ground station in “near” real time. The ZoneView ground application updates the visual and IR image pair and sensor data about once every second [7]. All captured image data is stored locally on the laptop and is tagged with platform GPS position information and other sensor readings. Aerial IR sensors detect surface temperatures only. Thus, the variation in subsurface temperatures which may occur in deeper stratified flows cannot be detected. Therefore, our system concentrates on remote sensing of shallow layer flows. We focus on mixing zones in rivers, where the shallow depth causes discharges to mix vertically rapidly, but can exhibit large downstream distances for full lateral mixing[8]. However, our platform may still be used in other situations such as coastal areas with surfacing plumes. There are several advantages to using balloons or blimps as platforms for aerial remote sensing data collection. One of the most significant advantages is that balloons can be deployed quickly and data collected immediately. Extensive operator training is not required. For instance, balloons could be sent up quickly to monitor chemical spills or accidental releases. Balloons may also be able to collect data that current helicopter or fixed wing cameras cannot. A balloon system could be deployed to monitor a specific site for hours or days which would be logistically difficult or even impossible with current airborne imagery. Tethered balloons can be moved and relocated easily, providing a more flexible method to collect data. For instance, tethered balloons could be deployed on small boats in rivers to conduct water quality surveys over several stream miles. Tethered balloon systems are limited in the height at which they can be deployed. In the USA, current FAA regulations limit most unmanned tethered balloon heights to 500 ft or less [9]. This altitude is sufficient for gathering data on most regulatory mixing zones. Also, tethered balloons are not suitable for deployment under high wind conditions. Tethered balloon may withstand winds up to 50 mph, however high winds may affect safety, payload capacity, and detection capability. Figure 3 is an example geo-rectified infrared image taken from our aerial platform of a mixing zone resulting from submerged multiport diffuser discharge into a shallow river. The temperature scale shown is a true surface temperature reading and not a relative scale. For the short time scales of the mixing zone (<1 minute), surface heat transfer to the atmosphere is limited; to that plume temperature decrease can be used as a tracer for physical dilution. Important details of the mixing
P_MWWD2008_Doneker_Site scale remote sensing - page 3 of 12
zone are readily observed such as upstream buoyant spreading, lateral boundary interaction, and plume width. CORMIX modeling of this mixing zone and upstream density current prompted the acoustic camera inspection as noted in the figure caption and described below. Although the discharge shown in Figure 3 is treated municipal wastewater, other sources can be monitored where a ∆T exists such as industrial discharges, mine drainage, or power plant cooling water [10]. There are many examples where measurement of mixing zones by tethered balloon remote sensing would be beneficial in environmental management [3, 11-38]. For example, the platform could be used to monitor spatial impacts from a contaminated groundwater source if a temperature differential exists.

P_MWWD2008_Doneker_Site scale remote sensing - page 4 of 12
Figure 2A. Balloon remote sensing platform (patent pending).
Figure 2B. Balloon platform mount details (patent pending).

P_MWWD2008_Doneker_Site scale remote sensing - page 5 of 12
Figure 3. Geo-referenced IR image of a municipal wastewater diffuser mixing zone in a small river taken from our tethered balloon platform. Temperature can be used as a dilution tracer. In this case, “as built” drawings indicated a “unidirectional” diffuser. However CORMIX modeling predicted the observed 25 m upstream density current only if an “alternating” diffuser is specified. Subsequent DIDSON acoustic camera inspection of the diffuser confirmed an “alternating” diffuser type as predicted by CORMIX analysis. Remote Sensing Boat Survey of Velocity and Bathymetry
In addition to the aerial remote sensing, additional data is often needed for mixing model validation and monitoring regulatory compliance. Specifically, site bathymetry and velocity field data is desired for regions near the discharge. Bathymetry data is needed to asses plume boundary interaction. To plot plume behavior in the far-field, cumulative discharge data is also needed. For these reasons, we have integrated several boat-mounted sonar sensors into our field data collection protocol. All boat survey data is tagged with Differential GPS coordinates for sub-meter accuracy of latitude and longitude position. Figure 4 shows our survey boat configured for an ADCP survey in conjunction with our aerial remote
Figure 4. Survey boat configuration.

P_MWWD2008_Doneker_Site scale remote sensing - page 6 of 12
sensing platform. For shallow riverine applications, we employ a Teledyne RDI Workhorse Rio Grande ADCP 1200 kHz unit mast-mounted on our survey boat. Depending upon site conditions, we also employ a 60 kHz sonar depth sounder for bottom tracking. The ADCP unit also has a temperature sensor which correlates closely to the aerial IR image data.
Figure 5 shows typical cross-section velocity profile and bathymetry data produced by the survey using Teledyne’s ADCP WinRiver application. In conjunction with our aerial survey, we complete several upstream and downstream transects collecting velocity and bathymetry data. The detailed vertical and lateral velocity profile information provided by the ADCP survey enables detailed specification of input data for simulation modeling of plume behavior.
The ZoneView application gives boat survey crews an aerial perspective to monitor boat sensor location in relation to the discharge plume to facilitate monitoring. This feedback allows us to indentify critical monitoring locations for data collection within the mixing zone, as illustrated in Figure 6. Important plume properties and mixing zone behavior such as the upstream density current, plume boundaries, shoreline interaction, discharge canal leaks, and subsequent downstream mixing can be observed in “real time” and recorded for subsequent modeling and analysis. Remote Sensing of Outfall Physical Condition Physical condition of the outfall structure can influence mixing zone behavior. Diffuser structures may be damaged due to flooding, or ports may be blocked or buried due to sedimentation. Sometimes, the “as built” configuration of a diffuser may differ from the design drawings. When simulating mixing zone behavior with models such as CORMIX, outfall physical condition can influence dilution prediction. For
these reasons, physical inspection of the outfall is often required as part of NPDES permit renewal.
Presently, outfall inspection is commonly conducted by a scuba diver with a hand held video camera. Turbidity in rivers is often so high that divers must in essence “hand inspect” the outfall. Most divers have little experience or knowledge of multiport diffuser design so that inspection and reporting of the physical condition of the outfall is generally less than optimal. Underwater video
Figure 5. A typical ADCP velocity and bathymetry cross-section providedby RDI WinRiver software. In shallow mode (depth < 4 m, velocity ismeasured in 0.05 m bins to ±2.5 cm/s.
Figure 6. ZoneView software allows boatcrews to monitor the IR aerial image in realtime to assist in survey measurements.

P_MWWD2008_Doneker_Site scale remote sensing - page 7 of 12
may be of poor quality because of high turbidity. Video images are not typically geo-referenced so it is difficult to assess physical condition of the diffuser spatially along the diffuser line.
Because underwater video imaging is often limited by high turbidity, we have evaluated the DIDSON
4 (Dual frequency IDentification SONar)
acoustic camera to produce high quality images of outfall condition. The DIDSON is a high-definition imaging sonar. This device is an identification sonar, and gives near video quality images for inspection and identification of objects underwater. It is a surrogate for optical systems in turbid water. We deploy the DIDSON from our survey boat on a pole-mount as shown in Figure 7. The camera connects to a laptop computer for real time acoustic video imaging. In addition,
DGPS coordinates and camera position is recorded. An example of a DIDSON image of a multiport
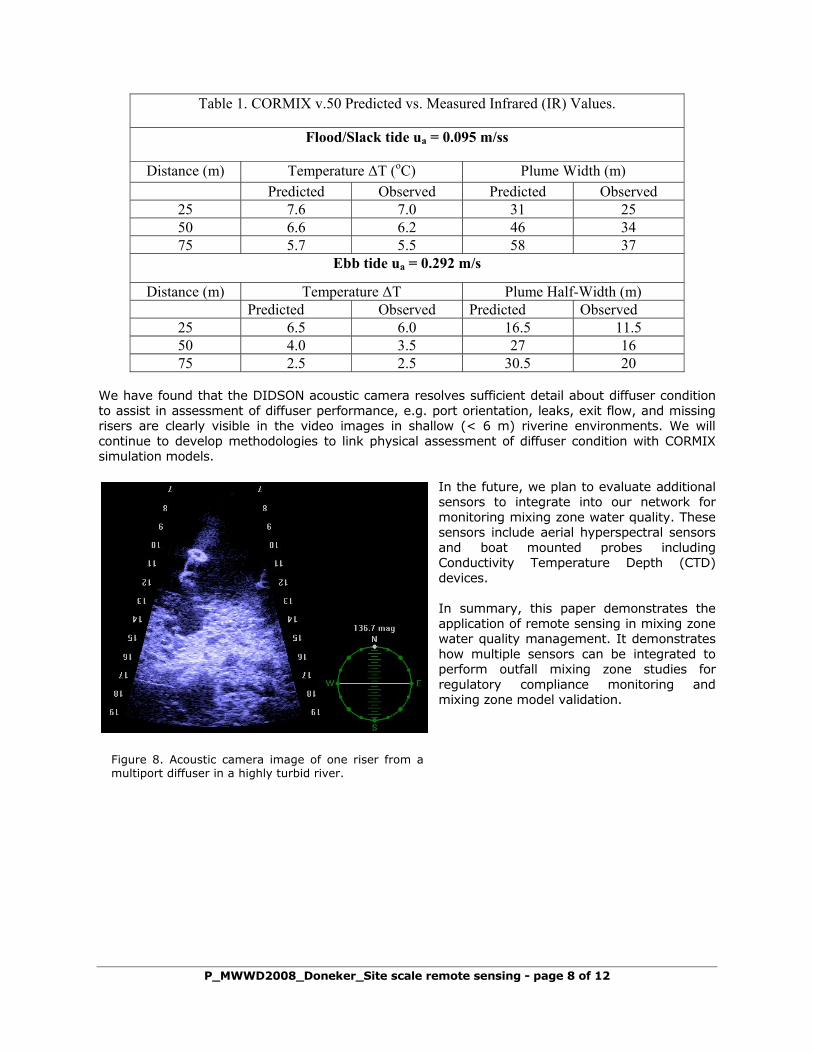
diffuser in a highly turbid river appears in Figure 8. In this case, the condition, operation, and orientation of individual diffuser nozzles were confirmed for a large multiport diffuser. Information from the DIDSON physical condition assessment can be used for data input for CORMIX simulations and model validation, e.g. the specification of diffuser type as noted in Figure 3. Conclusions We have developed the technology and demonstrated the deployment of a lightweight aerial remote sensing platform to collect geo-referenced water quality monitoring data within mixing zones. Field survey data collected by our sensors is broadcast via an A 802.11g wireless network using our ZoneView software to coordinate and facilitate data collection among the survey crew. We have integrated boat mounted sensors to collect site velocimetry, bathymetry, temperature, and outfall physical condition to augment our aerial remote sensing data for mixing zone regulatory management. Temperature measurements from aerial IR images correlate well with boat mounted temperature sensors. The mixing zone dilution data provided by the aerial sensors provide high quality spatial relationships which would be difficult to discern with traditional mixing zone dye studies. For example the subsurface discharge canal leak shown in Figure 6 was not apparent through visible inspection. This leak would be extremely difficult to identify with a synoptic dye measurement; however it is readily apparent with IR images. In addition, real time measurements provided by the aerial sensors can provide transitory spatial mixing zone data in unsteady environments, e.g. mixing zone properties during tidal reversal episodes which would be difficult (if not impossible) to capture with a synoptic measurement. Along with an aerial remote sensing platform, we have developed data management and information systems needed to document mixing zone water quality for NPDES permit application. The field data collected support ongoing CORMIX mixing zone simulation model development and validation. An example comparison of CORMIX v5.0 predictions with aerial remote sensing measurement for a 1 m3/s shoreline discharge of non-contact cooling water appears in Table 1.
4 http://www.soundmetrics.com
Figure 7. Acoustic camera on boat mast mount.Camera is submerged during operation.
P_MWWD2008_Doneker_Site scale remote sensing - page 8 of 12
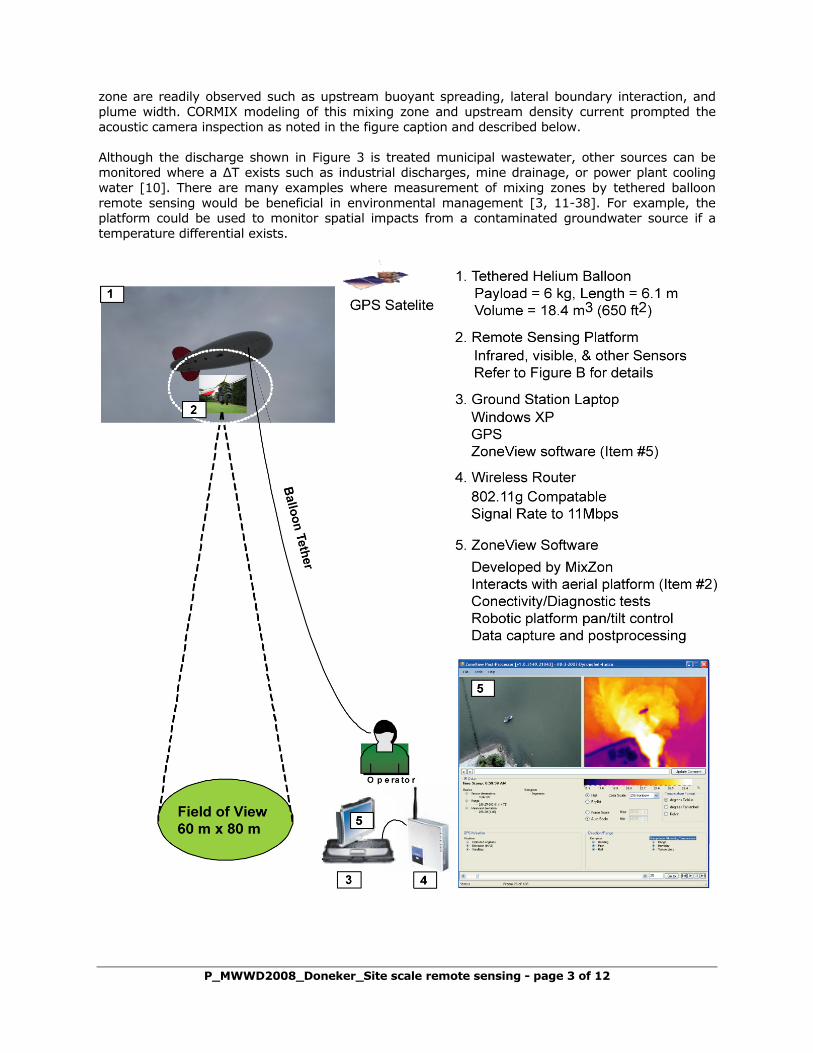
We have found that the DIDSON acoustic camera resolves sufficient detail about diffuser condition to assist in assessment of diffuser performance, e.g. port orientation, leaks, exit flow, and missing risers are clearly visible in the video images in shallow (< 6 m) riverine environments. We will continue to develop methodologies to link physical assessment of diffuser condition with CORMIX simulation models.
In the future, we plan to evaluate additional sensors to integrate into our network for monitoring mixing zone water quality. These sensors include aerial hyperspectral sensors and boat mounted probes including Conductivity Temperature Depth (CTD) devices. In summary, this paper demonstrates the application of remote sensing in mixing zone water quality management. It demonstrates how multiple sensors can be integrated to perform outfall mixing zone studies for regulatory compliance monitoring and mixing zone model validation.
Table 1. CORMIX v.50 Predicted vs. Measured Infrared (IR) Values.
Flood/Slack tide ua = 0.095 m/ss
Distance (m) Temperature ΔT (oC) Plume Width (m) Predicted Observed Predicted Observed
25 7.6 7.0 31 25 50 6.6 6.2 46 34 75 5.7 5.5 58 37
Ebb tide ua = 0.292 m/s
Distance (m) Temperature ΔT Plume Half-Width (m) Predicted Observed Predicted Observed
25 6.5 6.0 16.5 11.5 50 4.0 3.5 27 16 75 2.5 2.5 30.5 20
Figure 8. Acoustic camera image of one riser from amultiport diffuser in a highly turbid river.
P_MWWD2008_Doneker_Site scale remote sensing - page 9 of 12
Acknowledgements This work was supported in part by USEPA SBIR Grant Numbers EP-D-07-086 and EP-D-06-049.
P_MWWD2008_Doneker_Site scale remote sensing - page 10 of 12
Robert L. Doneker is the president of MixZon and has over 25 years experience in research and consulting in environmental engineering, systems analysis, simulation modeling, environmental research, and point source emission analysis. Dr. Doneker also maintains a faculty appointment as a research assistant professor in the Department of Civil and Environmental Engineering at Portland State University. Prof. Doneker is one of the primary developers of the CORMIX system for mixing zone modeling and outfall design. Todd Sanders is a Senior Scientist with MixZon and an Engineering faculty member with Portland Community College, Portland Oregon, USA. He has over 17 years of experience in fluid dynamics, mapping and Geographic Information Systems. He has a Bachelor Science degree in Water Resources Engineering from Michigan State University and Master’s and Doctoral degrees in Coastal Physical Oceanography from the University of Delaware. Adi S. Ramachandran is a senior software engineer at MixZon Inc and has over 6 years of experience in designing and developing Environmental Information Management Systems and application software. Mr. Ramachandran specializes in design and development of CAD tools for environmental management. Mr. Ramachandran completed his Masters in Computer Science & Engineering - Data Intensive Systems from the OGI School of Science and Engineering at OHSU in March 2002.
P_MWWD2008_Doneker_Site scale remote sensing - page 11 of 12
References 1. USEPA, Water Quality Standards Handbook. 1984, USEPA: Washington, D.C. 2. USEPA, Technical Support Document for Water Quality-based Toxics Control. 1991, USEPA:
Washington, D.C. 3. Wu, C., Methodologies for Mixing Zone Model Validation of Surface Thermal Discharges in Large Rivers,
in Department of Environmental Engineering. 2002, Oregon Graduate Institute, OHSU: Portland. p. 168.
4. Jensen, J.R., Introductory Digital Image Processing: A Remote Sensing Perspective. 1996, Upper Saddle River NJ: Prentice Hall.
5. Torgersen, C.E., et al., Airborne thermal remote sensing for water temperature assessment in rivers and streams. Remote Sensing of Environment, 2001. 76: p. 386-398.
6. Torgersen, C.E., et al., Multiscale Thermal Refugia and Stream Habitat Associations of Chinook Salmon in Northeastern Oregon. Ecological Applications, 1999. 9(1): p. 301-319.
7. Doneker, R.L. and T. Sanders. Balloon Remote Sensing Platform For Site Scale Water Quality Management of Mixing Zones. in 5th International Symposium on Environmental Hydraulics. 1997. Temper, AZ USA.
8. Holley, E.R. and G.H. Jirka, Mixing In Rivers. 1986, U.S. Army Corps of Engineers: Washington, D.C. 9. FAA. FAR Section 101. 2005 [cited; Available from:
http://www.faa.gov/avr/afs/faa/8700/8700_vol2/2_044_02.pdf. 10. Doneker, R.L. and G.H. Jirka, CORMIX User Manual. 2007, USEPA. 11. Akar, P.J. and G.H. Jirka, CORMIX2: An Expert System for Hydrodynamic Mixing Zone Analysis of
Conventional and Toxic Submerged Multiport Diffuser Discharges. 1991, USEPA: Athens, GA. 12. Akar, P.J. and G.H. Jirka, Hydrodynamic Classification of Multiport Diffuser Discharges. Journal of
Hydraulic Engineering, 1991. 117(HY9): p. 1113-1128. 13. Akar, P.J. and G.H. Jirka, Buoyant Spreading Processes in Pollutant Transport and Mixing. Part 1:
Lateral Spreading in Strong Ambient Current. Journal of Hydraulic Research, 1994. 32: p. 815-831. 14. Akar, P.J. and G.H. Jirka, Buoyant Spreading Processes in Pollutant Transport and Mixing Part 2:
Upstream Spreading in Weak Ambient Current. Journal of Hydraulic Research, 1995. 33: p. 87-100. 15. Baumgartner, D.J., W.E. Frick, and P.J. Roberts, Dilution Models for Effluent Discharges (3rd Ed.).
1994, USEPA: Newport, OR. 16. Berman, C.H. and a.T.P. Quinn, Behavioral Thermoregulation and Homing by Spring Chinook Salmon,
Oncorhynchus Tshawytscha (Walbaum) in the Yakima River. Journal of Fish Biology, 1991. 39: p. 301-312.
17. Bilby, R.E., Characteristics and Frequency of Cool-water Areas in a Western Washington Stream. Journal of Freshwater Ecology., 1984. 2: p. 593-602.
18. Campbell, C.W. and A.G. Keith. Karst Groundwater Hydrologic Analysis Based on Aerial Thermography. in 2000 Annual Meeting and International Conference of the American Institute of Hydrology. 2000. Abstracts: Atmospheric, Surface and Subsurface Hydrology and Interactions.
19. Davies, P.A., L.A. Mofor, and M.J. Neves, Comparisons of Remotely Sensed Observations with Modeling Predictions for the Behaviour of Wastewater Plumes from Coastal Discharges. International Journal of Remote Sensing, 1997. 18(9): p. 1987-2019.
20. Doneker, R.L. and G.H. Jirka, CORMIX1: An Expert System for Mixing Zone Analysis of Conventional and Toxic Single Port Aquatic Discharges. 1990, USEPA: Athens, GA.
21. Doneker, R.L. and G.H. Jirka, Expert Systems for Design and Mixing Zone Analysis of Aqueous Pollutant Discharges. Journal of Water Resources Planning and Management, 1991. 117(6): p. 679-697.
22. Doneker, R.L. and G.H. Jirka, Discussion of "Mixing In Inclined Dense Jets" by P.W. Roberts, A. Ferrier, and G. Daviero. , 1999. 125(3): p. 317-318. Journal of Hydraulic Engineering, 1999. 125(3): p. 317-318.
23. Doneker, R.L. and G.H. Jirka, Schematization in Regulatory Mixing Zone Analysis. Journal of Water Resources Planning and Management, ASCE, 2002. 128(1): p. 46-56.
24. Doneker, R.L., J.D. Nash, and G.H. Jirka, Pollutant Transport and Mixing Zone Simulation of Sediment Density Currents. Journal Hydraulic Engineering, 2004. 30(4): p. 349-359.
25. Faux, R.N., et al., Thermal Remote Sensing of Water Temperature, Annual Report. 1998, USEPA. 26. Jirka, G.H., Multiport Diffusers for Heat Disposal: A Summary. Journal of Hydraulics Division, ASCE,
1982. HY12: p. 1423-68. 27. Jirka, G.H., Use of Mixing Zone Models in Estuarine Waste Load Allocation, in Part III of Technical
Guidance Manual for Performing Waste Load Allocations, Book III:, R.A. Ambrose, Editor. 1992, USEPA: Washington, D.C.

P_MWWD2008_Doneker_Site scale remote sensing - page 12 of 12
28. Jirka, G.H. and P.J. Akar, Hydrodynamic Classification of Submerged Multiport Diffuser Discharges. Journal Hydraulic Engineering, 1991. 117(HY9): p. 1113-1128.
29. Jirka, G.H. and R.L. Doneker, Hydrodynamic Classification of Submerged Single Port Discharges. Journal of Hydraulic Engineering, 1991. 117(6): p. 1095-1112.
30. Jirka, G.H. and R.L. Doneker, Discussion of "Field Observations of Ipanema Beach Outfall". Journal Hydraulic Engineering, 2002. 128(2): p. 151-160.
31. Jirka, G.H., R.L. Doneker, and S.W. Hinton, User's Manual for CORMIX: A Hydrodynamic Mixing Zone Model and Decision Support System for Pollutant Discharges into Surface Waters. 1996, DeFrees Hydraulics Laboratory, Cornell University: Ithaca, NY.
32. Jirka, G.H. and H.L.M. Fong, Dynamics and Bifurcation of Buoyant Jets in Crossflow. J. Engineering Mechanics Division, 1981. 107: p. 479-499.
33. Jirka, G.H. and D.R.F. Harleman, The Mechanics of Submerged Multiport Diffusers for Buoyant Discharges in Shallow Water. 1973, M.I.T., Ralph M. Parsons Laboratory: Boston, MA.
34. Jirka, G.H.a.J.L., Waste Disposal in the Ocean, in Water Quality and its Control: Hydraulic Structures Design Manual, M. Hino, Editor. 1994, Balkema: Rotterdam.
35. Jones, G.R., et al., Buoyant Surface Discharges into Water Bodies. I: Flow Classification and Prediction Methodology. ASCE Journal Hydraulic Engineering, 2005. Submitted April 2005.
36. Jones, G.R., J.D. Nash, and G.H. Jirka, CORMIX3: An Expert System for Mixing Zone Analysis and Prediction of Buoyant Surface Discharges. 1996, DeFrees Hydraulics Laboratory, Cornell University.
37. Mendez Diaz, M.M. and G.H. Jirka, Trajectory of Buoyant Plumes from Multiport Diffuser Discharges in Deep Co-Flow. Journal of Hydraulic Engineering, 1996. 122(8).
38. Nash, J.D. and G.H. Jirka, Buoyant Surface Discharges into Unsteady Ambient Flows. Dynamics of Atmospheres and Oceans, 1996. 24: p. 75-84.