Site investigation SFR - PFL-f linking to Boremap data ...
26
Svensk Kärnbränslehantering AB Swedish Nuclear Fuel and Waste Management Co Box 250, SE-101 24 Stockholm Phone +46 8 459 84 00 P-10-01 Site investigation SFR PFL-f linking to Boremap data KFR101, KFR102A, KFR102B, KFR103, KFR104, KFR105, KFR106 and KFR27 Johan Öhman, Malin Sträng, Jessica Moverare Golder Associates AB February 2010
Transcript of Site investigation SFR - PFL-f linking to Boremap data ...
Svensk Kärnbränslehantering ABSwedish Nuclear Fueland Waste Management Co
Box 250, SE-101 24 Stockholm Phone +46 8 459 84 00
P-10-01
Site investigation SFR
PFL-f linking to Boremap data KFR101, KFR102A, KFR102B, KFR103, KFR104, KFR105, KFR106 and KFR27
Johan Öhman, Malin Sträng, Jessica Moverare Golder Associates AB
February 2010
CM
Gru
ppen
AB
, Bro
mm
a, 2
010

Tänd ett lager:
P, R eller TR.
Site investigation SFR
PFL-f linking to Boremap data KFR101, KFR102A, KFR102B, KFR103, KFR104, KFR105, KFR106 and KFR27
Johan Öhman, Malin Sträng, Jessica Moverare Golder Associates AB
February 2010
ISSN 1651-4416
SKB P-10-01
Keywords: P-report SKBDoc id 1243812, Appendix SKBDoc id 1243813, Re-view statement SKBDoc id 1243814, Hydrogeology, Hydraulic tests, Difference flow measurements, Fractures, Crush, KFR101, KFR102A, KFR102B, KFR103, KFR104, KFR105, KFR106, KFR27, Project SFR extension.
This report concerns a study which was conducted for SKB. The conclusions and viewpoints presented in the report are those of the authors. SKB may draw modified conclusions, based on additional literature sources and/or expert opinions.
Data in SKB’s database can be changed for different reasons. Minor changes in SKB’s database will not necessarily result in a revised report. Data revisions may also be presented as supplements, available at www.skb.se.
A pdf version of this document can be downloaded from www.skb.se.
P-10-01 3
Abstract
During the Site Investigation programme for the expansion of SFR, eight core-drilled boreholes have been mapped geologically and hydraulically tested: KFR27, KFR101, KFR102A, KFR102B, KFR103, KFR104, KFR105, and KFR106. This report presents the linking of hydraulic PFL-f data to geologic Boremap data. Altogether 676 such PFL-f records have been inferred by the Posiva Flow Logging, Difference Flow Method. The analysis follows the methodology adopted during the Site Investigations for spent nuclear fuel (Forsmark and Laxemar). A major component of this methodology is visual inspection of BIPS imagery within a geometric uncertainty range +/– 0.2 m around the length measure-ment of the PFL-f data. Another key component is the mapping geologist’s confidence classification of Boremap features.
The purpose of linking PFL-f data to Boremap features is to provide essential input data for the hydro-geological modelling of SFR, which in turn will provide input for Safety Analysis and Design.

4 P-10-01
Sammanfattning
Inom ramen för platsundersökningarna för SFR utbyggnad har åtta kärnborrhål borrats, karterats geolo-giskt och undersökts hydrauliskt: KFR27, KFR101, KFR102A, KFR102B, KFR103, KFR104, KFR105, and KFR106. Denna rapport beskriver hur hydrauliska PFL-f-data har sammankopplats med geologiska Boremap-data. Sammanlagt 676 PFL-f-mätningar har tolkats med PFL-metoden (Posiva Flow Logging, Difference Flow Method). Analysen följer den metodik som utvecklats under platsundersökningarna för djupförvar av uttjänt kärnbränsle (Forsmark och Laxemar). En viktig komponent i detta arbete är visuell bedömning av BIPS bilden inom ett geometriskt osäkerhetsintervall på +/– 0,2 m kring PFL-f-mätningens längdangivelse. En annan viktig komponent är den karterande geologens klassning av konfidensen för Boremap-data.
Syftet med att koppla hydrauliska PFL-f-data till Boremap strukturer är att erhålla data för para-meterisering av den hydrogeologiska modellen för SFR, som i sin tur skall användas för att ta fram underlag för säkerhetsanalys och tunneldesign.
P-10-01 5
Contents
1 Introduction 7
2 Objective and scope 9
3 Equipment 113.1 Data used 113.2 Boremap data 11
3.2.1 Borehole length reference 113.2.2 BIPS and BDT files 113.2.3 Candidate Boremap features 133.2.4 Boremap and core mapping 13
3.3 PFL data 153.3.1 Borehole position of PFL-f data, LA 163.3.2 Flow anomaly uncertainty 17
3.4 Description of interpretation tools 17
4 Execution 214.1 General 214.2 Ranking of PFL-f candidates in Boremap 224.3 Calculation of “PFL-anom. Confidence” 23
4.3.1 Low-αtraces 24
5 Results 255.1 Summary of results 255.2 Exceptions made 27
6 References 29
P-10-01 7
1 Introduction
This document reports the results gained by the correlation of Posiva Flow Log/Difference Flow Method (PFL DIFF) to features in Boremap, which is one of the activities performed within the site investigation at SFR. The work was carried out in accordance with activity plan AP SFR-09-007. In Table 1-1 controlling documents for performing this activity are listed. Both activity plan and method descriptions are SKB’s internal controlling documents.
The repository for low and middle level radioactive operational waste (SFR) was constructed and taken into operation by 1987. An investigation programme for its future expansion was undertaken in 2008 by the Swedish Nuclear Fuel and Waste Management Company (SKB). This expansion of SFR is necessitated by the pending demolition waste from the closed reactors Barsebäck, Studsvik and Ågesta, the additional amounts of operational waste associated with the extended operating time of the remaining nuclear power plants, as well as the future demolition of running nuclear power plants Oskarshamn, Forsmark, and Ringhals / SKB 2008/.
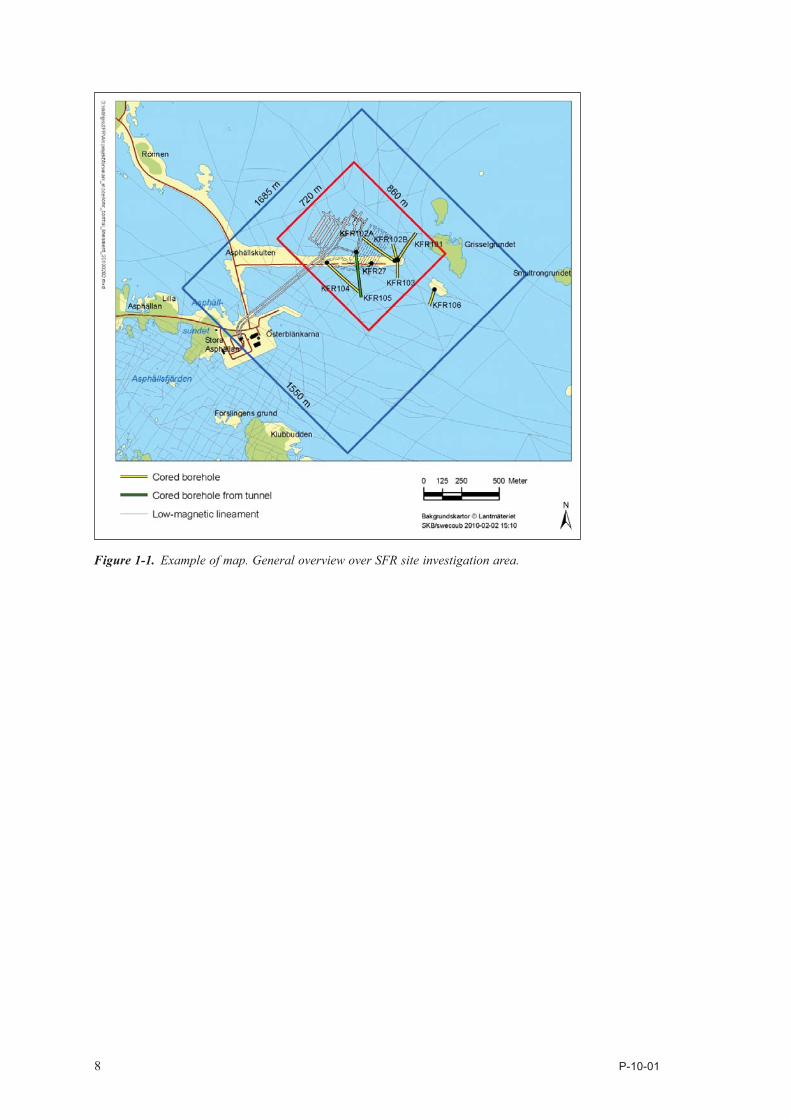
The current investigation program involves field investigations, such as Difference flow logging and core mapping according to the Boremap system, inside the target area (Figure 1-1). The results from the Posiva Flow Log/Difference Flow (PFL) method in core boreholes KFR27, KFR101, KFR102A-B, KFR103-6 are reported in / Hurmerinta and Väisäsvaara 2009a-b, Kristiansson and Väisäsvaara 2008, Kristiansson et al. 2009, Pekkanen et al. 2008, Väisäsvaara 2010/. The investiga-tion program also involves modelling in the disciplines: geology, rock mechanics, hydrogeology and hydrogeochemistry. A fundamental component of the hydrogeological model is its parameterisation of the hydraulically connected Discrete Fracture Network (DFN). This parameterisation requires that the hydraulic data are inferred to discrete geologic features. The method to associate geologic features to PFL data follows the principles that were established during the Site Investigation programmes e.g. /Forssman et al. 2008/. All data from PFL, Boremap and BIPS images were obtained from the SICADA database.
Table 1-1. Controlling documents for the performance of the activity.
Activity plan Number VersionPlatsmodellering, Hydrogeologi version 0.2 AP SFR-09-007 1.0
Method descriptions Number VersionMethodology developed during the Site Investigations e.g. / Forssman et al. 2008/ NA
8 P-10-01
Figure 1-1. Example of map. General overview over SFR site investigation area.

P-10-01 9
2 Objective and scope
The purpose of this study was to identify the geological features mapped as fractures or crush zones that correspond to flow anomalies identified with the Posiva Flow Log/Difference Flow (PFL) method. The identification of these geological features was made in all core boreholes drilled during the Site Investigation for the SFR expansion (Table 2-1).
The results are presented in this report and have also been delivered as to SKB’s database Sicada (pfl_anom_fract_id.xls, respectively, pfl_anom_crush_id.xls).
Table 2-1. Overview of core data analysed.
Sample size PFL-logged interval (m) Vertical extent (RHB70, m)IDCODE No. Data From1) To2) Length From To
KFR101 52 13.72 332.20 318.5 –8.9 –255.4KFR102A 104 71.95 589.51 517.6 –63.0 –527.4KFR102B 89 13.95 174.77 160.8 –8.9 –138.6KFR103 44 13.33 195.03 181.7 –8.5 –154.5KFR104 84 8.73 240 231.3 –4.3 –189.1
KFR1043) 8 240 443.18 203.2 –189.1 –343.3KFR105 150 2.97 305.88 302.9 –107.3 –156.5KFR106 69 9.13 294.25 285.1 –7.5 –274.3
KFR274) 9 99.3 1355) 30.7 –96.4 –127.1
KFR27 67 135.0 496.61 366.6 –127.1 –491.9Total 676 2,598.4
1) PFL-logged interval inside casing excluded.2) SECLOW from 5 m differential PFL-logging.3) Only covered by 0.5 m resolution PFL-f data.4) Transmissivity not evaluated for PFL-f data. Reference logging without pumping only available from 5 m differential logging.5) Actually extends down to 144.85 m, but the interval below 135 m is overlapped by 0.1 m resolution data.

P-10-01 11
3 Equipment
Hydraulically conductive features (flow anomalies) have been correlated to mapped geological features (fractures and/or crush zones). The method to associate geologic features to PFL data follows the principles that were established during the Site Investigation programmes in Laxemar and Forsmark. Consequently, some of the content in Chapters 3 and 4 is taken from or modified from / Forssman et al. 2008/.
3.1 Data usedThree types of data have been used in the PFL-f coupling to Boremap features:
1) Hydraulic data: interpreted Posiva Flow Logg anomalies from the overlapping measurements (PFL-f data).
2) Geological data: mapped core data (Boremap).
3) BIPS imagery with superimposed mapped features (BDT data).
The actual data files are specified in Table 3-1.
3.2 Boremap dataCore boreholes are documented by geological core mapping, using the Boremap system and a borehole image of the borehole wall from BIPS (Borehole Image Processing System). Accurate determination of location is critical when comparing different data types, e.g. when relating PFL-f data to BIPS or Boremap data. Therefore, all borehole loggings, including BIPS, are length-corrected to make the correlation between core and PFL-f data possible.
3.2.1 Borehole length referenceTwo length references are available for Boremap data:
a) Recorded borehole length. This is the raw length measurement of the BIPS imagery, and the origi-nal reference for all Boremap features. It is stored as raw, non-modified, data in Sicada. Owing to stretching of the camera cable, it is not a correct measure of borehole length, but nonetheless, it provides an essential original link to Boremap data (see Section 3.4).
b) Adjusted borehole length. This is a calculated value that is the (currently) best length estimate along the actual borehole. During drilling, reference marks are made in the borehole wall approximately at every 50 m. These marks are used as calibration points in all length corrections of borehole logging and borehole mapping (see Figure 3-4). A caliper tool fitted to the logging unit is used to get a reference for the length correction.
3.2.2 BIPS and BDT filesThe Boremap data of geological features in SICADA can be superimposed onto the BIPS image using a file with extension BDT. The image of the borehole wall from the BIPS-file may deviate somewhat from the trace shown with the BDT file, due to the linear correction between the drilling reference marks. The PFL-f and Boremap data are always geometrically compared in terms of corrected length (“ADJUSTEDSECUP”, not “RECORDED_SECUP”). However, it was discovered that the BIPS image viewer is incapable of extrapolating ADJUSTEDSECUP below the last refer-ence mark. Therefore, all figures in the appendices are shown in the original Boremap reference system “RECORDED_SECUP” (i.e. after transforming the corrected PFL-f length, LA, into the “RECORDED_SECUP” reference system, see Section 3.4 and Chapter 4). It should be emphasised that the uncorrected PFL-f length and uncorrected core length are not directly comparable, as differ-
12 P-10-01
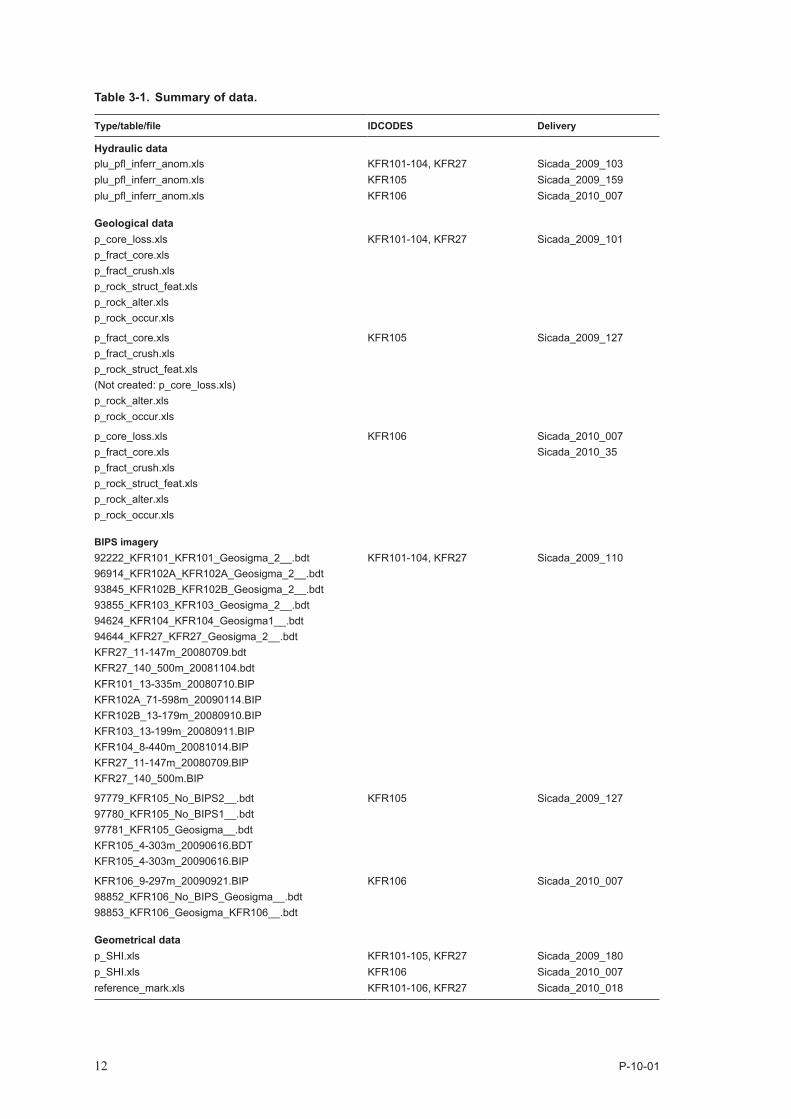
Table 3-1. Summary of data.
Type/table/file IDCODES Delivery
Hydraulic dataplu_pfl_inferr_anom.xls KFR101-104, KFR27 Sicada_2009_103plu_pfl_inferr_anom.xls KFR105 Sicada_2009_159plu_pfl_inferr_anom.xls KFR106 Sicada_2010_007
Geological datap_core_loss.xlsp_fract_core.xlsp_fract_crush.xlsp_rock_struct_feat.xlsp_rock_alter.xlsp_rock_occur.xls
KFR101-104, KFR27 Sicada_2009_101
p_fract_core.xlsp_fract_crush.xlsp_rock_struct_feat.xls(Not created: p_core_loss.xls)p_rock_alter.xlsp_rock_occur.xls
KFR105 Sicada_2009_127
p_core_loss.xlsp_fract_core.xlsp_fract_crush.xlsp_rock_struct_feat.xlsp_rock_alter.xlsp_rock_occur.xls
KFR106 Sicada_2010_007Sicada_2010_35
BIPS imagery92222_KFR101_KFR101_Geosigma_2__.bdt96914_KFR102A_KFR102A_Geosigma_2__.bdt93845_KFR102B_KFR102B_Geosigma_2__.bdt93855_KFR103_KFR103_Geosigma_2__.bdt94624_KFR104_KFR104_Geosigma1__.bdt94644_KFR27_KFR27_Geosigma_2__.bdtKFR27_11-147m_20080709.bdtKFR27_140_500m_20081104.bdt
KFR101-104, KFR27 Sicada_2009_110
KFR101_13-335m_20080710.BIPKFR102A_71-598m_20090114.BIPKFR102B_13-179m_20080910.BIPKFR103_13-199m_20080911.BIPKFR104_8-440m_20081014.BIPKFR27_11-147m_20080709.BIPKFR27_140_500m.BIP
97779_KFR105_No_BIPS2__.bdt97780_KFR105_No_BIPS1__.bdt97781_KFR105_Geosigma__.bdtKFR105_4-303m_20090616.BDTKFR105_4-303m_20090616.BIP
KFR105 Sicada_2009_127
KFR106_9-297m_20090921.BIP98852_KFR106_No_BIPS_Geosigma__.bdt98853_KFR106_Geosigma_KFR106__.bdt
KFR106 Sicada_2010_007
Geometrical datap_SHI.xls KFR101-105, KFR27 Sicada_2009_180p_SHI.xls KFR106 Sicada_2010_007reference_mark.xls KFR101-106, KFR27 Sicada_2010_018

P-10-01 13
ent measurement error factors are involved. It should also be noted that the features visualised by the BDT-file does not only correspond to fractures; rock contacts, structures, etc. are displayed in the same way. Unfortunately, the BIPS viewer does not distinguish between the different types of objects that are projected onto the BIPS image.
The BIPS resolution, in a borehole with diameter 76 mm with SKB standard logging procedure, is approximately 1 mm in the vertical direction and 0.66 mm in the horizontal direction. The lower detection limit is more or less 1 mm. However, in many cases the apertures of “Open” and “Partly open” fractures are set to a value within 0.5–1.0 mm; these are based on a joint geologic interpretation of the BIPS image and the core. In these cases the fracture may be mapped as “1=visible in BIPS” or “0= not visible in BIPS” in column VISIBLE_IN_BIPS(code). The aperture in percussion holes are also estimated from BIPS and should normally be 0 (Sealed) or 1 mm or larger. In some cases the geologist has even estimated apertures as small as 0.5 mm for percussion holes.
3.2.3 Candidate Boremap featuresIn the general case, only Crush zones, Open fractures and Partly open fractures are considered possible candidates for PFL-f coupling. In other words, Sealed fractures and Sealed networks are – by definition – assumed to be non-conductive features. In a few cases there are no good candidates available within the geometrical interval of a PFL-f record (the PFL geometric interval discussed in Section 3.3.1). In these cases, a few geologic structures/rock types have been considered possible explanations for low-transmissivity records. These include: Quartz dissolution, Breccia, Argillization, and Cataclastic rock. If these, exceptional cases, cannot be explained by geology, one of the following error sources must be assumed:
Erroneous PFL-f interpretation of the back-ground noise (if transmissivity is low and commented as “uncertain”). In other words, it may be assumed that in reality no flowing feature exists at a given borehole location, if no credible candidates can be found.
Underestimation of the uncertainty in the length measurement of the PFL-f record. This assumption is considered if a credible candidate is close outside the standard geometric PFL-f interval, and if this assumption appears reasonable in relation to the position of surrounding PFLf records.
Errors in Boremap data. A fracture mapped as Sealed could, possibly, in reality be an Open conduc-tive fracture. Either a fracture may have been erroneously mapped in the geologic interpretation, or – possibly – a Partly open fracture could appear as Sealed in the core, but Open at the circumference of the borehole.
3.2.4 Boremap and core mappingIn the geologic mapping of core data, each fracture is first documented as “Broken” or “Unbroken” – depending on how it is found in the core. In a second step, each fracture is then classified as “Sealed”, “Open” or “Partly open”, together with a judgement of how certain the geologist is of this classifica-tion: “Certain”, “Probable” or “Possible”.
The geologic classification of Open/Sealed fractures can be summarised by the following steps:
1) If the fracture splits the core it is mapped as Broken, otherwise Unbroken.
2) If an aperture is seen in BIPS and the core is Unbroken, the fracture is mapped as Partly open. If an aperture is seen in BIPS and the core is Broken the fracture is mapped as Open. The aperture is mapped in BIPS and is intended to represent an approximate mean aperture. This mean aperture, as seen on the borehole wall, may not have much to do with hydraulic aperture.
3) In some cases the core is Broken, but no aperture is seen in BIPS. If the core pieces fit badly the aperture is set to 0.5 mm and the fracture is mapped as Open and Probable. If it is a good fit between the pieces and the surfaces are not fresh, the aperture is set to 0.5 mm and the fracture is mapped as Open and Possible. If there is a good fit between the pieces and the surfaces are fresh, the aperture is set to 0 mm and the fracture is mapped as Sealed.
14 P-10-01
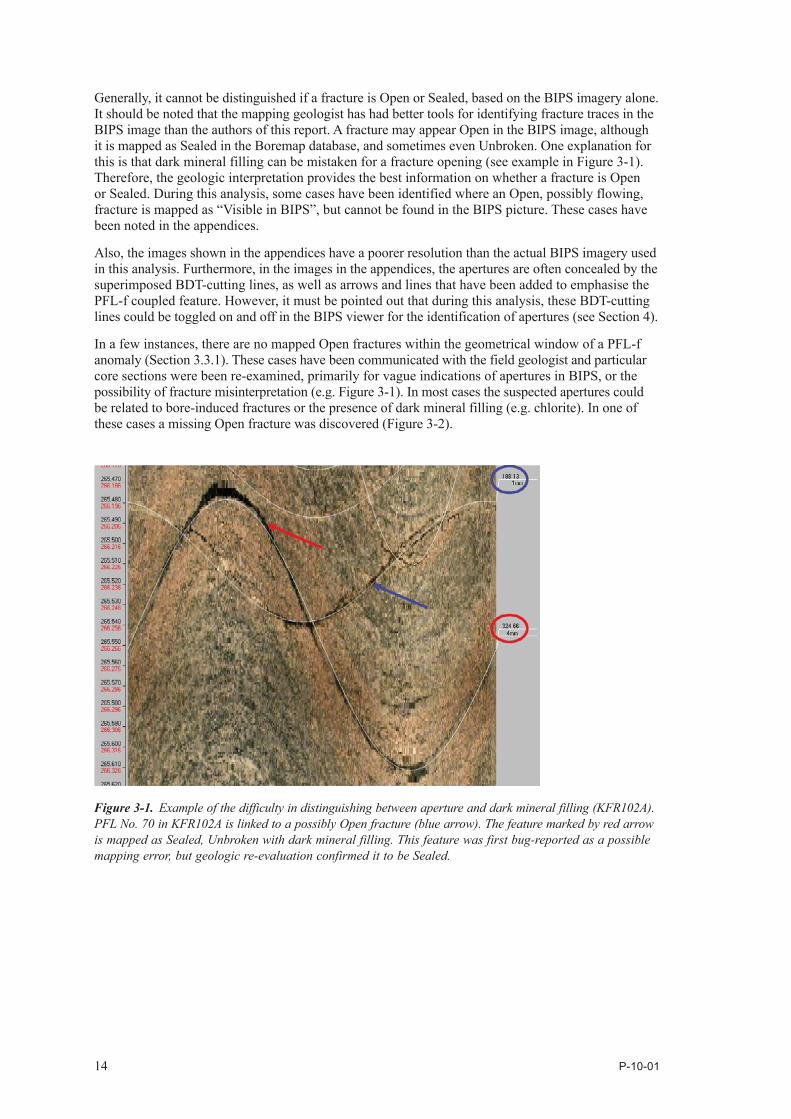
Generally, it cannot be distinguished if a fracture is Open or Sealed, based on the BIPS imagery alone. It should be noted that the mapping geologist has had better tools for identifying fracture traces in the BIPS image than the authors of this report. A fracture may appear Open in the BIPS image, although it is mapped as Sealed in the Boremap database, and sometimes even Unbroken. One explanation for this is that dark mineral filling can be mistaken for a fracture opening (see example in Figure 3-1). Therefore, the geologic interpretation provides the best information on whether a fracture is Open or Sealed. During this analysis, some cases have been identified where an Open, possibly flowing, fracture is mapped as “Visible in BIPS”, but cannot be found in the BIPS picture. These cases have been noted in the appendices.
Also, the images shown in the appendices have a poorer resolution than the actual BIPS imagery used in this analysis. Furthermore, in the images in the appendices, the apertures are often concealed by the superimposed BDT-cutting lines, as well as arrows and lines that have been added to emphasise the PFL-f coupled feature. However, it must be pointed out that during this analysis, these BDT-cutting lines could be toggled on and off in the BIPS viewer for the identification of apertures (see Section 4).
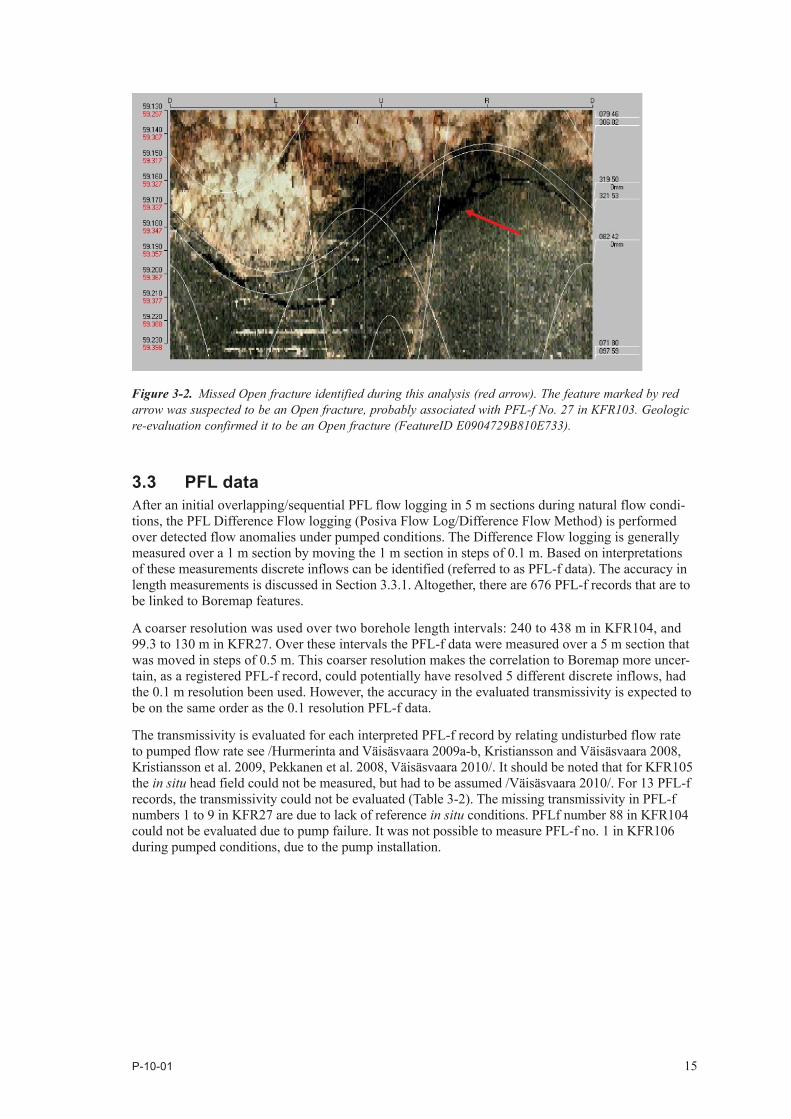
In a few instances, there are no mapped Open fractures within the geometrical window of a PFL-f anomaly (Section 3.3.1). These cases have been communicated with the field geologist and particular core sections were been re-examined, primarily for vague indications of apertures in BIPS, or the possibility of fracture misinterpretation (e.g. Figure 3-1). In most cases the suspected apertures could be related to bore-induced fractures or the presence of dark mineral filling (e.g. chlorite). In one of these cases a missing Open fracture was discovered (Figure 3-2).
Figure 3-1. Example of the difficulty in distinguishing between aperture and dark mineral filling (KFR102A). PFL No. 70 in KFR102A is linked to a possibly Open fracture (blue arrow). The feature marked by red arrow is mapped as Sealed, Unbroken with dark mineral filling. This feature was first bug-reported as a possible mapping error, but geologic re-evaluation confirmed it to be Sealed.
P-10-01 15
3.3 PFL dataAfter an initial overlapping/sequential PFL flow logging in 5 m sections during natural flow condi-tions, the PFL Difference Flow logging (Posiva Flow Log/Difference Flow Method) is performed over detected flow anomalies under pumped conditions. The Difference Flow logging is generally measured over a 1 m section by moving the 1 m section in steps of 0.1 m. Based on interpretations of these measurements discrete inflows can be identified (referred to as PFL-f data). The accuracy in length measurements is discussed in Section 3.3.1. Altogether, there are 676 PFL-f records that are to be linked to Boremap features.
A coarser resolution was used over two borehole length intervals: 240 to 438 m in KFR104, and 99.3 to 130 m in KFR27. Over these intervals the PFL-f data were measured over a 5 m section that was moved in steps of 0.5 m. This coarser resolution makes the correlation to Boremap more uncer-tain, as a registered PFL-f record, could potentially have resolved 5 different discrete inflows, had the 0.1 m resolution been used. However, the accuracy in the evaluated transmissivity is expected to be on the same order as the 0.1 resolution PFL-f data.
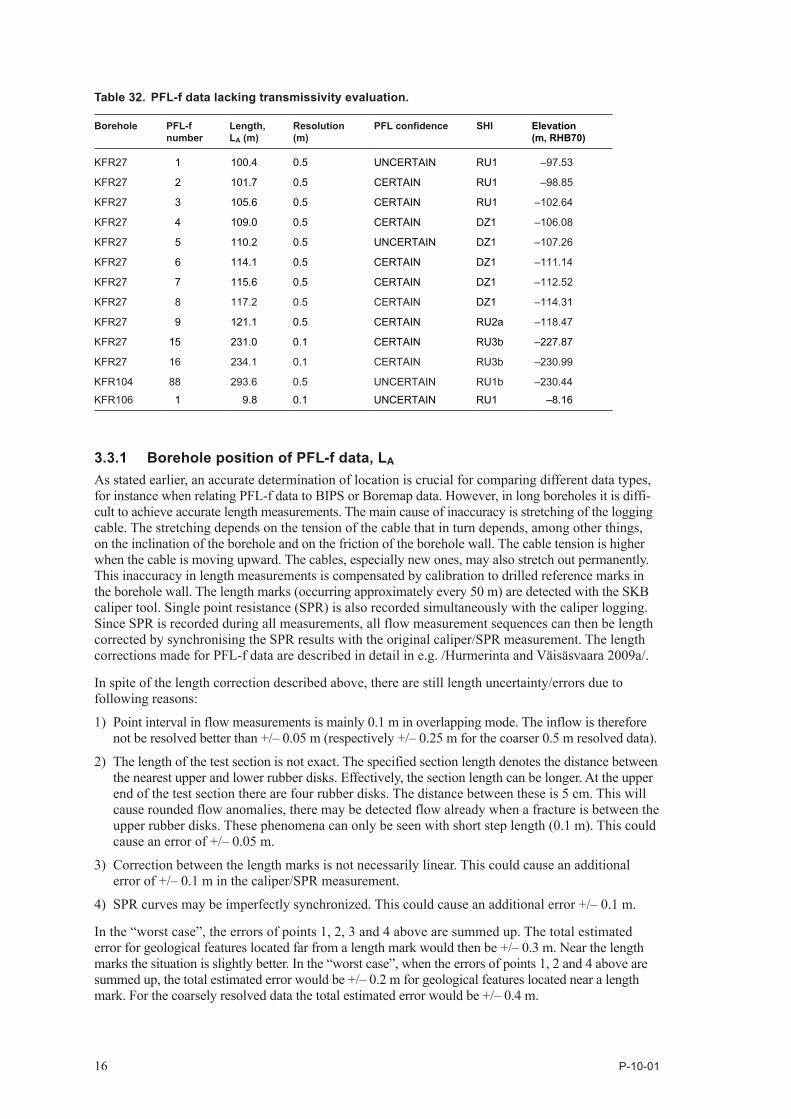
The transmissivity is evaluated for each interpreted PFL-f record by relating undisturbed flow rate to pumped flow rate see /Hurmerinta and Väisäsvaara 2009a-b, Kristiansson and Väisäsvaara 2008, Kristiansson et al. 2009, Pekkanen et al. 2008, Väisäsvaara 2010/. It should be noted that for KFR105 the in situ head field could not be measured, but had to be assumed / Väisäsvaara 2010/. For 13 PFL-f records, the transmissivity could not be evaluated (Table 3-2). The missing transmissivity in PFL-f numbers 1 to 9 in KFR27 are due to lack of reference in situ conditions. PFLf number 88 in KFR104 could not be evaluated due to pump failure. It was not possible to measure PFL-f no. 1 in KFR106 during pumped conditions, due to the pump installation.
Figure 3-2. Missed Open fracture identified during this analysis (red arrow). The feature marked by red arrow was suspected to be an Open fracture, probably associated with PFL-f No. 27 in KFR103. Geologic re-evaluation confirmed it to be an Open fracture (FeatureID E0904729B810E733).
16 P-10-01
3.3.1 Borehole position of PFL-f data, LA
As stated earlier, an accurate determination of location is crucial for comparing different data types, for instance when relating PFL-f data to BIPS or Boremap data. However, in long boreholes it is diffi-cult to achieve accurate length measurements. The main cause of inaccuracy is stretching of the logging cable. The stretching depends on the tension of the cable that in turn depends, among other things, on the inclination of the borehole and on the friction of the borehole wall. The cable tension is higher when the cable is moving upward. The cables, especially new ones, may also stretch out permanently. This inaccuracy in length measurements is compensated by calibration to drilled reference marks in the borehole wall. The length marks (occurring approximately every 50 m) are detected with the SKB caliper tool. Single point resistance (SPR) is also recorded simultaneously with the caliper logging. Since SPR is recorded during all measurements, all flow measurement sequences can then be length corrected by synchronising the SPR results with the original caliper/SPR measurement. The length corrections made for PFL-f data are described in detail in e.g. / Hurmerinta and Väisäsvaara 2009a/.
In spite of the length correction described above, there are still length uncertainty/errors due to following reasons:
1) Point interval in flow measurements is mainly 0.1 m in overlapping mode. The inflow is therefore not be resolved better than +/– 0.05 m (respectively +/– 0.25 m for the coarser 0.5 m resolved data).
2) The length of the test section is not exact. The specified section length denotes the distance between the nearest upper and lower rubber disks. Effectively, the section length can be longer. At the upper end of the test section there are four rubber disks. The distance between these is 5 cm. This will cause rounded flow anomalies, there may be detected flow already when a fracture is between the upper rubber disks. These phenomena can only be seen with short step length (0.1 m). This could cause an error of +/– 0.05 m.
3) Correction between the length marks is not necessarily linear. This could cause an additional error of +/– 0.1 m in the caliper/SPR measurement.
4) SPR curves may be imperfectly synchronized. This could cause an additional error +/– 0.1 m.
In the “worst case”, the errors of points 1, 2, 3 and 4 above are summed up. The total estimated error for geological features located far from a length mark would then be +/– 0.3 m. Near the length marks the situation is slightly better. In the “worst case”, when the errors of points 1, 2 and 4 above are summed up, the total estimated error would be +/– 0.2 m for geological features located near a length mark. For the coarsely resolved data the total estimated error would be +/– 0.4 m.
Table 32. PFL-f data lacking transmissivity evaluation.
Borehole PFL-f number
Length, LA (m)
Resolution (m)
PFL confidence SHI Elevation (m, RHB70)
KFR27 1 100.4 0.5 UNCERTAIN RU1 –97.53
KFR27 2 101.7 0.5 CERTAIN RU1 –98.85
KFR27 3 105.6 0.5 CERTAIN RU1 –102.64
KFR27 4 109.0 0.5 CERTAIN DZ1 –106.08
KFR27 5 110.2 0.5 UNCERTAIN DZ1 –107.26
KFR27 6 114.1 0.5 CERTAIN DZ1 –111.14
KFR27 7 115.6 0.5 CERTAIN DZ1 –112.52
KFR27 8 117.2 0.5 CERTAIN DZ1 –114.31
KFR27 9 121.1 0.5 CERTAIN RU2a –118.47
KFR27 15 231.0 0.1 CERTAIN RU3b –227.87
KFR27 16 234.1 0.1 CERTAIN RU3b –230.99
KFR104 88 293.6 0.5 UNCERTAIN RU1b –230.44
KFR106 1 9.8 0.1 UNCERTAIN RU1 –8.16
P-10-01 17
In the PFL-f correlation to BIPS or Boremap data the situation may not be as severe as the worst case above, as some error types are systematic and the length error is nearly constant for fractures near each other. However, the uncertainty of point 1 is of random error type. Special consideration must be taken to fractures nearly parallel with the borehole.
3.3.2 Flow anomaly uncertaintyThe existence of a flow anomaly is sometime uncertain and in such a case the anomaly is marked as “UNCERTAIN” in the database and in the appendices.
3.4 Description of interpretation toolsThe software BIPS Imageviewer v.2.51 (RaaX co. ltd) is a central tool for the identification of PFL-f features. This software displays the borehole imagery (BIPS) as well as Boremap features (BDT). During this project, the following four errors were identified and reported to Sicada:
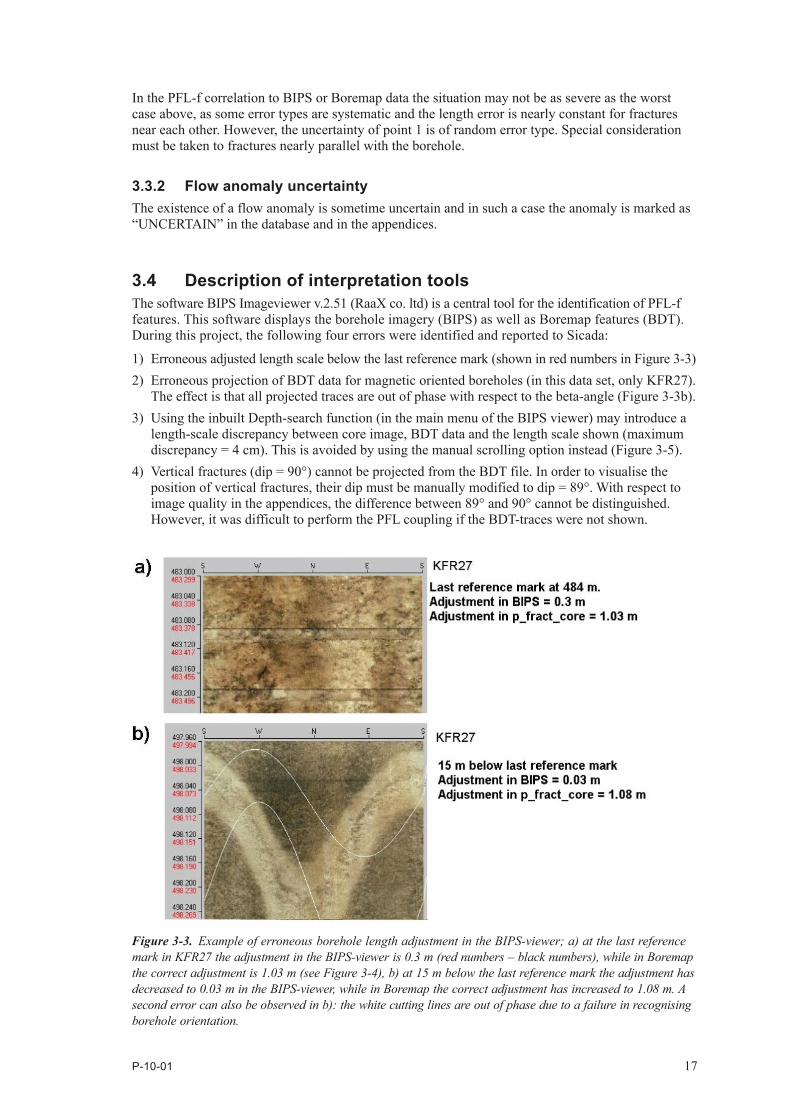
1) Erroneous adjusted length scale below the last reference mark (shown in red numbers in Figure 3-3)2) Erroneous projection of BDT data for magnetic oriented boreholes (in this data set, only KFR27).
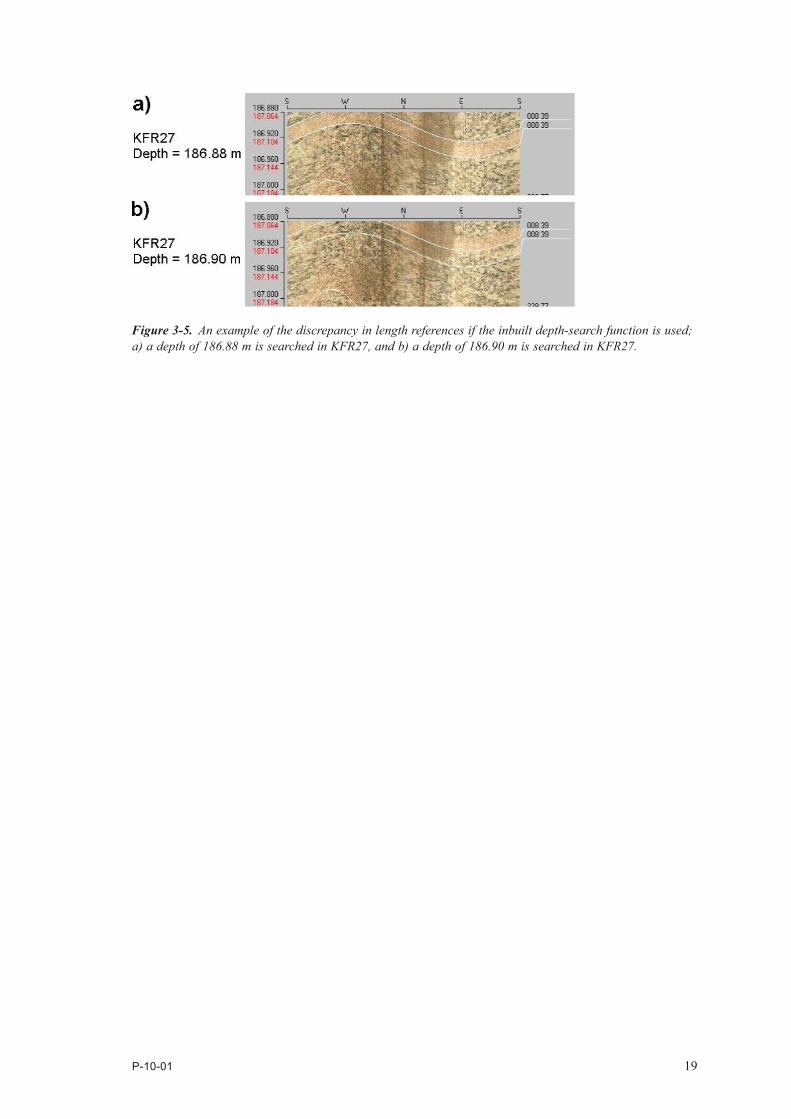
The effect is that all projected traces are out of phase with respect to the beta-angle (Figure 3-3b).3) Using the inbuilt Depth-search function (in the main menu of the BIPS viewer) may introduce a
length-scale discrepancy between core image, BDT data and the length scale shown (maximum discrepancy = 4 cm). This is avoided by using the manual scrolling option instead (Figure 3-5).
4) Vertical fractures (dip = 90°) cannot be projected from the BDT file. In order to visualise the position of vertical fractures, their dip must be manually modified to dip = 89°. With respect to image quality in the appendices, the difference between 89° and 90° cannot be distinguished. However, it was difficult to perform the PFL coupling if the BDT-traces were not shown.
Figure 3-3. Example of erroneous borehole length adjustment in the BIPS-viewer; a) at the last reference mark in KFR27 the adjustment in the BIPS-viewer is 0.3 m (red numbers – black numbers), while in Boremap the correct adjustment is 1.03 m (see Figure 3-4), b) at 15 m below the last reference mark the adjustment has decreased to 0.03 m in the BIPS-viewer, while in Boremap the correct adjustment has increased to 1.08 m. A second error can also be observed in b): the white cutting lines are out of phase due to a failure in recognising borehole orientation.
18 P-10-01
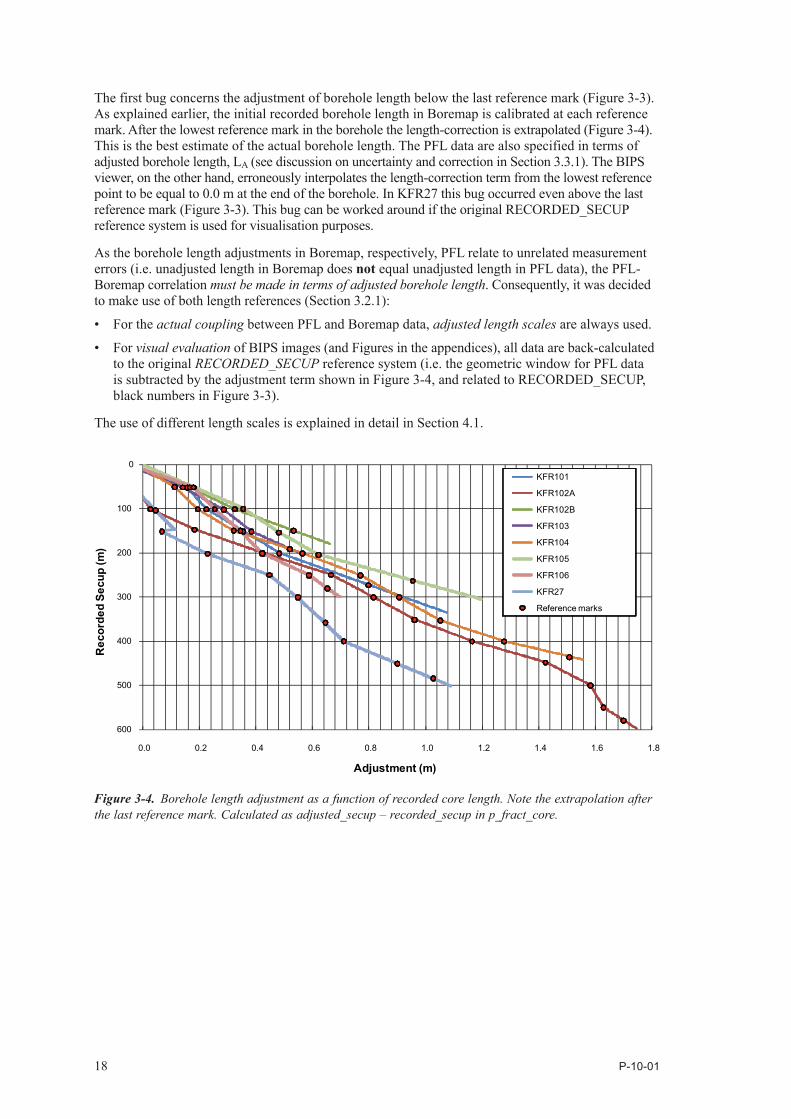
The first bug concerns the adjustment of borehole length below the last reference mark (Figure 3-3). As explained earlier, the initial recorded borehole length in Boremap is calibrated at each reference mark. After the lowest reference mark in the borehole the length-correction is extrapolated (Figure 3-4). This is the best estimate of the actual borehole length. The PFL data are also specified in terms of adjusted borehole length, LA (see discussion on uncertainty and correction in Section 3.3.1). The BIPS viewer, on the other hand, erroneously interpolates the length-correction term from the lowest reference point to be equal to 0.0 m at the end of the borehole. In KFR27 this bug occurred even above the last reference mark (Figure 3-3). This bug can be worked around if the original RECORDED_SECUP reference system is used for visualisation purposes.
As the borehole length adjustments in Boremap, respectively, PFL relate to unrelated measurement errors (i.e. unadjusted length in Boremap does not equal unadjusted length in PFL data), the PFL-Boremap correlation must be made in terms of adjusted borehole length. Consequently, it was decided to make use of both length references (Section 3.2.1):
• Fortheactual coupling between PFL and Boremap data, adjusted length scales are always used.
• Forvisual evaluation of BIPS images (and Figures in the appendices), all data are back-calculated to the original RECORDED_SECUP reference system (i.e. the geometric window for PFL data is subtracted by the adjustment term shown in Figure 3-4, and related to RECORDED_SECUP, black numbers in Figure 3-3).
The use of different length scales is explained in detail in Section 4.1.
Figure 3-4. Borehole length adjustment as a function of recorded core length. Note the extrapolation after the last reference mark. Calculated as adjusted_secup – recorded_secup in p_fract_core.
0
100
200
300
400
500
600
0.0 0.2 0.4 0.6 0.8 1.0 1.2 1.4 1.6 1.8
Rec
orde
d Se
cup
(m)
Adjustment (m)
KFR101
KFR102A
KFR102B
KFR103
KFR104
KFR105
KFR106
KFR27
Reference marks
P-10-01 19
Figure 3-5. An example of the discrepancy in length references if the inbuilt depth-search function is used; a) a depth of 186.88 m is searched in KFR27, and b) a depth of 186.90 m is searched in KFR27.
P-10-01 21
4 Execution
4.1 GeneralThis analysis is based on the visual evaluation of BIPS borehole imagery and on the geometric correla-tion between PFL-f data and Boremap data. For a given PFL-f record, it is time-consuming to identify its suitable candidates directly in the data tables [p_fract_core] and [p_fract_crush]. The reason for this is that it is difficult to get a satisfactory overview of possible features in the proximity of a PFL-f record in the data tables. Also, all steps involving manual editing of large data files infallibly risks to introduce errors that are difficult to trace. Therefore, in order to improve the data overview and to minimize the manual steps, all the relevant Boremap data for a given PFL-f record were condensed into an automati-cally generated form. Thus, the PFL coupling method could be reduced into only using two types of information sources:
1) The BIPS borehole imagery with all mapped features as fractures, crush, foliation etc. The user is able to scroll along the borehole, zoom in on particular features, and toggle the mapped features on or off. This is the primary tool for identifying credible PFL-f candidates.
2) A form listing possible PFL-f features within the geometric window and their characteristics as interpreted in Boremap. This form also contains a basic description of on the PFL-f data as well as a BIPS picture centred on the section of interest. This is the tool for presenting and comparing Boremap interpretations of available candidates. The user selects one or more feature for PFL correlation by filling in the field “Best choice”, and also marks the choice(s) made in the picture.
If one (or more) aperture(s) can be clearly identified in the BIPS image, then the Best choice is made based on visual inspection of the BIPS image and expert judgement. If no apertures can be identified, or if apertures are judged uncertain (with respect to dark mineral infill), then the selection of Best choice is instead based on the ranking system of Boremap candidates. This ranking system relies primarily on the field geologist’s interpretation and secondarily on the geometric match, at decimetre-scale, between PFL-f and Boremap features (see Section 4.2). In the general case, the judgements based on BIPS imagery are in full consistency with the ranking of Boremap data (Figure 4-1).
In a few cases the BIPS image analysis suggested a feature that was not even listed as a candidate in the condensed data form. In each of these cases the feature suggested by visual inspection was found to be mapped as a Sealed/Unbroken fracture with dark chlorite filling in Boremap. Some of these cases were presented to the mapping field geologist, who re-evaluated data and confirmed that those fractures were indeed Sealed/Unbroken (Sofia Winell, personal comm.). This demonstrates that mineral filling can be mistaken for Open aperture in the BIPS image. On the other hand, the core and the borehole wall have different diameters. Therefore, such a fracture could possibly be Partly open, which appears Sealed in the core (Unbroken), but with an indistinguishable Open aperture in the borehole wall, particularly if transmissivity is low.
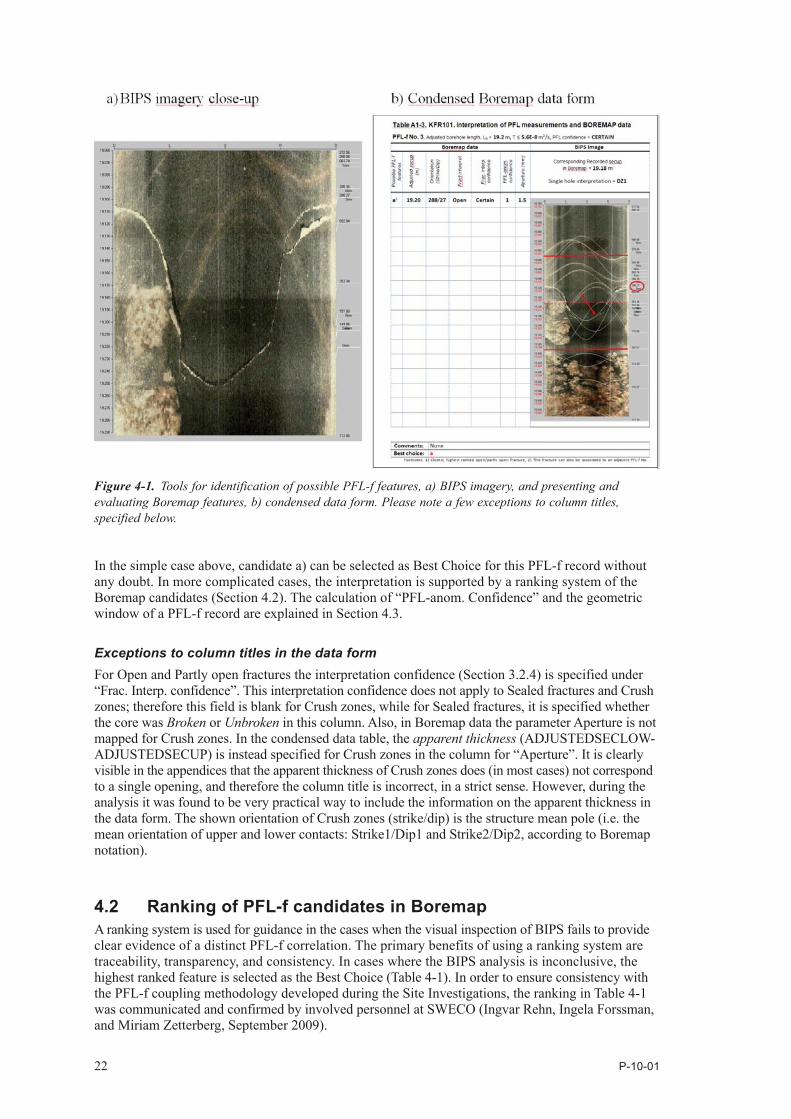
• Forexample:PFL-fNo.3inKFR101isrecordedat19.2madjustedboreholelength,whichcor-responds to 19.18 recorded borehole length in Boremap (i.e. Figure 3-3). The BIPS image is there for analysed within the interval 19.18 +/– 0.2 m (red lines in Figure 4-1b). RECORDED_SECUP is used as reference scale (black numbers in Figure 4-1a,b).
• Onlyoneclearapertureisobservedwithinthisinterval(Figure4-1).Basedonvisualinspectionof BIPS, this feature (orientation 288/27) is judged to be the suitable candidate for KFR101, PFL-f No. 3. The condensed data form (Figure 4-1b) shows the relevant BIPS and Boremap data for this PFL-f record. There are several white “cutting lines” projected in the proximity of LA +/– 0.2 m (i.e. inside the red lines). Most of these reflect Sealed fractures and geologic structures (i.e. not candidates for PFL correlation). In this case, the only Boremap candidate in the proximity of LA +/– 0.2 m is listed: a) an Open fracture at ADJUSTED_SECUP = 19.20 m, mapped as Certain, orientated (288°/27°), and with an aperture of 1.5 mm.
• Thecouplingismadebygraphicallyindicatingthefeaturewitharedarrowandaredoval,andentering a comment and the corresponding letter at the bottom of the form. These letters are directly coupled to FEATURE_ID in Boremap data. Geological features are indicated by blue arrows. The extent of Crush zones are indicated by two red arrows.
22 P-10-01
In the simple case above, candidate a) can be selected as Best Choice for this PFL-f record without any doubt. In more complicated cases, the interpretation is supported by a ranking system of the Boremap candidates (Section 4.2). The calculation of “PFL-anom. Confidence” and the geometric window of a PFL-f record are explained in Section 4.3.
Exceptions to column titles in the data formFor Open and Partly open fractures the interpretation confidence (Section 3.2.4) is specified under “Frac. Interp. confidence”. This interpretation confidence does not apply to Sealed fractures and Crush zones; therefore this field is blank for Crush zones, while for Sealed fractures, it is specified whether the core was Broken or Unbroken in this column. Also, in Boremap data the parameter Aperture is not mapped for Crush zones. In the condensed data table, the apparent thickness (ADJUSTEDSECLOW-ADJUSTEDSECUP) is instead specified for Crush zones in the column for “Aperture”. It is clearly visible in the appendices that the apparent thickness of Crush zones does (in most cases) not correspond to a single opening, and therefore the column title is incorrect, in a strict sense. However, during the analysis it was found to be very practical way to include the information on the apparent thickness in the data form. The shown orientation of Crush zones (strike/dip) is the structure mean pole (i.e. the mean orientation of upper and lower contacts: Strike1/Dip1 and Strike2/Dip2, according to Boremap notation).
4.2 Ranking of PFL-f candidates in BoremapA ranking system is used for guidance in the cases when the visual inspection of BIPS fails to provide clear evidence of a distinct PFL-f correlation. The primary benefits of using a ranking system are traceability, transparency, and consistency. In cases where the BIPS analysis is inconclusive, the highest ranked feature is selected as the Best Choice (Table 4-1). In order to ensure consistency with the PFL-f coupling methodology developed during the Site Investigations, the ranking in Table 4-1 was communicated and confirmed by involved personnel at SWECO (Ingvar Rehn, Ingela Forssman, and Miriam Zetterberg, September 2009).
Figure 4-1. Tools for identification of possible PFL-f features, a) BIPS imagery, and presenting and evaluating Boremap features, b) condensed data form. Please note a few exceptions to column titles, specified below.
P-10-01 23
If there are two or more features with the same rank, then one of the features is selected as “Best choice”, while all other equally ranked features are classed as “Alternative best choices”. Unless one of the alternative features can be judged as more probable, the closest feature to LA is chosen as “Best choice”. This group of equally ranked features are analysed, and if any feature somehow appears to be a less likely candidate, it is excluded from the list of “Alternative best choices”. The group of highest ranked features are marked in bold in the Appendices.
4.3 Calculation of “PFL-anom. Confidence”The position of a fracture in Boremap is defined by adjusted borehole length, Ladj, which is the mid-point of its borehole intersection. However, a planar fracture generally appears as a sinus trace along a borehole wall. The extent of a trace along the borehole (i.e. amplitude of the sinus curve) depends onitsα-angle,thesolidanglebetweenafractureplaneandtheborehole.Aperpendicularfracture(α=90°)hasacleancut,whilethetraceofalow-αextendsoveralongersectionoftheborehole.A trace extends over the following borehole interval:
L*adj = Ladj ± r0 tan (90 – α), (4-1)
where Ladj is the mapped position of the fracture (adjusted borehole length), r0 is outer radius of the borehole(0.038m)andαisthesolidanglebetweenthefractureplaneandtheborehole.Inreality,fracture planes are not planar, and the borehole radius is not constant. By inspection in BIPS, eq (4-1) seemstooverestimatetheboreholeextentoftracesforverylowαwithafewcentimters.Thus,theequation is considered to be conservative, in the sense that it does not exclude possible candidates from manual inspection.
The PFL-f data are recorded at decimetre precision, and therefore it is consistent use a decimetre-scaled parameter to evaluate the geometric match between PFL and Boremap data. For this pupose, a param-eter “PFL-anom. Confidence” was established by / Forssman et al. 2008/. “PFL-anom. Confidence” is an integer value which represents the minimum distance between LA and the fracture trace sinus wave (in decimetres, rounded upwards):
PFL - anom. Confidence = int (min | LA – L*adj | ×10 [dm/m] + 1), (4-2)
where LA is the is adjusted borehole length of the PFL-f. In case there are several equally ranked can-didates (Table 4-1), the feature closest to LA is denoted by footnote 1 in the Appendices. In the normal case (PFL-f data with 0.1 m resolution), only Boremap features with “PFL-anom. Confidence” = 1 or 2 are considered to be possible candidates (i.e. the closest part of the intersected fracture is at most 0.2 m from LA). However, for the coupling of 0.5 m-resolution PFL data, “PFL-anom. Confidence” should be less than, or equal to, 4. These two criteria are considered to be the most likely geometric window for PFL-f coupling. In a few cases, no candidates are found within this geometric window. In exceptional cases the geometric window is then expanded, if it seems realistic to include credible candidate features just in the vicinity of this window.
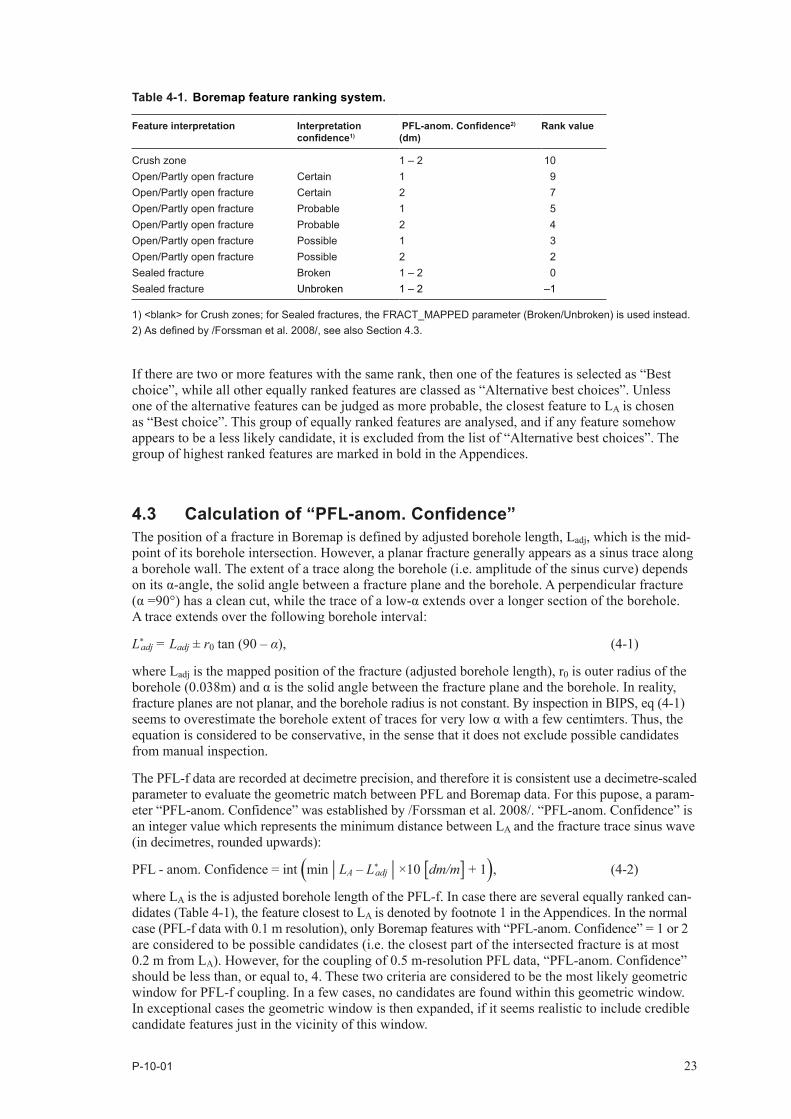
Table 4-1. Boremap feature ranking system.
Feature interpretation Interpretation confidence1)
PFL-anom. Confidence2) (dm)
Rank value
Crush zone 1 – 2 10Open/Partly open fracture Certain 1 9Open/Partly open fracture Certain 2 7Open/Partly open fracture Probable 1 5Open/Partly open fracture Probable 2 4Open/Partly open fracture Possible 1 3Open/Partly open fracture Possible 2 2Sealed fracture Broken 1 – 2 0Sealed fracture Unbroken 1 – 2 –1
1) <blank> for Crush zones; for Sealed fractures, the FRACT_MAPPED parameter (Broken/Unbroken) is used instead.2) As defined by / Forssman et al. 2008/, see also Section 4.3.

24 P-10-01
4.3.1 Low-αtracesTheboreholeinterceptswithfracturesthataresemi-paralleltotheboreholeorientation(low-αfractures)result in traces that extend along a long interval of borehole length (say 0.5 m to 2 m). Such features are judged less likely to form distinct PFL-f records, at least in competition with equally ranked low-alpha traces.However,insomecasesalow-αtracemayintersecttwo,ormore,adjacentPFL-frecords.Thesefeatures are marked by footnote 2 in the condensed data form. In these cases both the PFL-f records are analysedandjudgedonajointbasis.Ifthesemi-parallellow-αtraceisjudgedtobethebestcandidateinboth cases, the feature is coupled to both PFL-f records.
Inotherwords,low-αtracesaregenerallyinferredas,either:a)correlatedtotwo or more PFL-f records, or, b) not correlated to any PFL-f record. Fractures with possible linkage to more than one PFL record are denoted by footnote 2 in the Appendices.
P-10-01 25
5 Results
5.1 Summary of resultsThe PFL-f linking methodology depends largely on the geometric matching and geologic interpretation. Given the various error sources and the element of subjective judgment of this method (discussed in Section 3), the confidence in the results may be expected to be low. However, the overall impression during the analysis is that for the major part of the data set, the links made to Boremap data are realistic and credible.
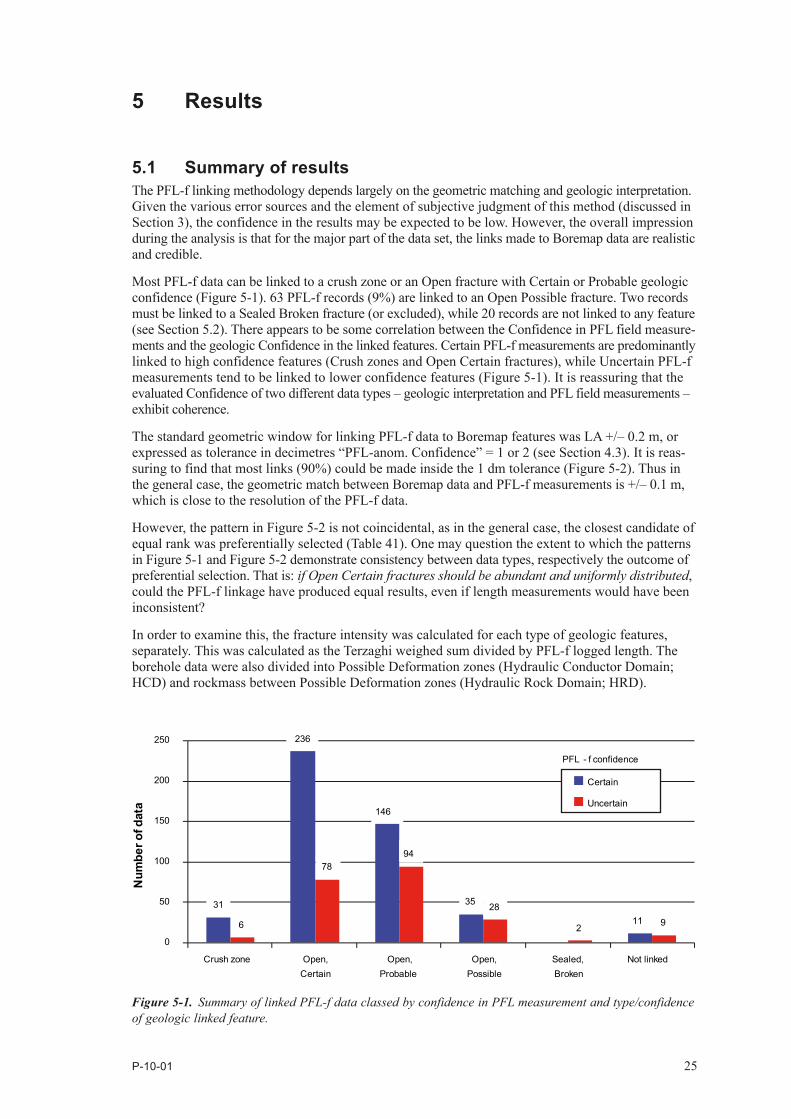
Most PFL-f data can be linked to a crush zone or an Open fracture with Certain or Probable geologic confidence (Figure 5-1). 63 PFL-f records (9%) are linked to an Open Possible fracture. Two records must be linked to a Sealed Broken fracture (or excluded), while 20 records are not linked to any feature (see Section 5.2). There appears to be some correlation between the Confidence in PFL field measure-ments and the geologic Confidence in the linked features. Certain PFL-f measurements are predominantly linked to high confidence features (Crush zones and Open Certain fractures), while Uncertain PFL-f measurements tend to be linked to lower confidence features (Figure 5-1). It is reassuring that the evaluated Confidence of two different data types – geologic interpretation and PFL field measurements – exhibit coherence.
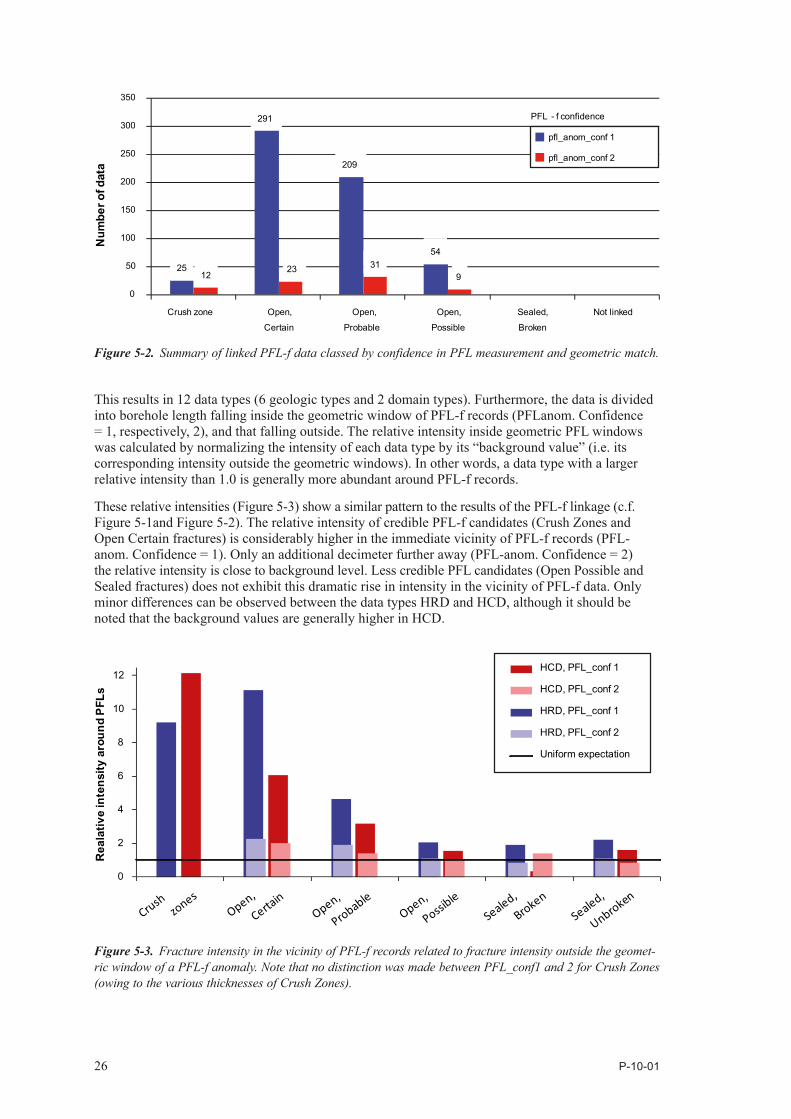
The standard geometric window for linking PFL-f data to Boremap features was LA +/– 0.2 m, or expressed as tolerance in decimetres “PFL-anom. Confidence” = 1 or 2 (see Section 4.3). It is reas-suring to find that most links (90%) could be made inside the 1 dm tolerance (Figure 5-2). Thus in the general case, the geometric match between Boremap data and PFL-f measurements is +/– 0.1 m, which is close to the resolution of the PFL-f data.
However, the pattern in Figure 5-2 is not coincidental, as in the general case, the closest candidate of equal rank was preferentially selected (Table 41). One may question the extent to which the patterns in Figure 5-1 and Figure 5-2 demonstrate consistency between data types, respectively the outcome of preferential selection. That is: if Open Certain fractures should be abundant and uniformly distributed, could the PFL-f linkage have produced equal results, even if length measurements would have been inconsistent?
In order to examine this, the fracture intensity was calculated for each type of geologic features, separately. This was calculated as the Terzaghi weighed sum divided by PFL-f logged length. The borehole data were also divided into Possible Deformation zones (Hydraulic Conductor Domain; HCD) and rockmass between Possible Deformation zones (Hydraulic Rock Domain; HRD).
Figure 5-1. Summary of linked PFL-f data classed by confidence in PFL measurement and type/confidence of geologic linked feature.
31
236
146
35
116
7894
28
2 9
0
50
100
150
200
250
Crush zone Open, Certain
Open, Probable
Open, Possible
Sealed, Broken
Not linked
Num
ber o
f dat
a
Certain
Uncertain
PFL - f confidence
26 P-10-01
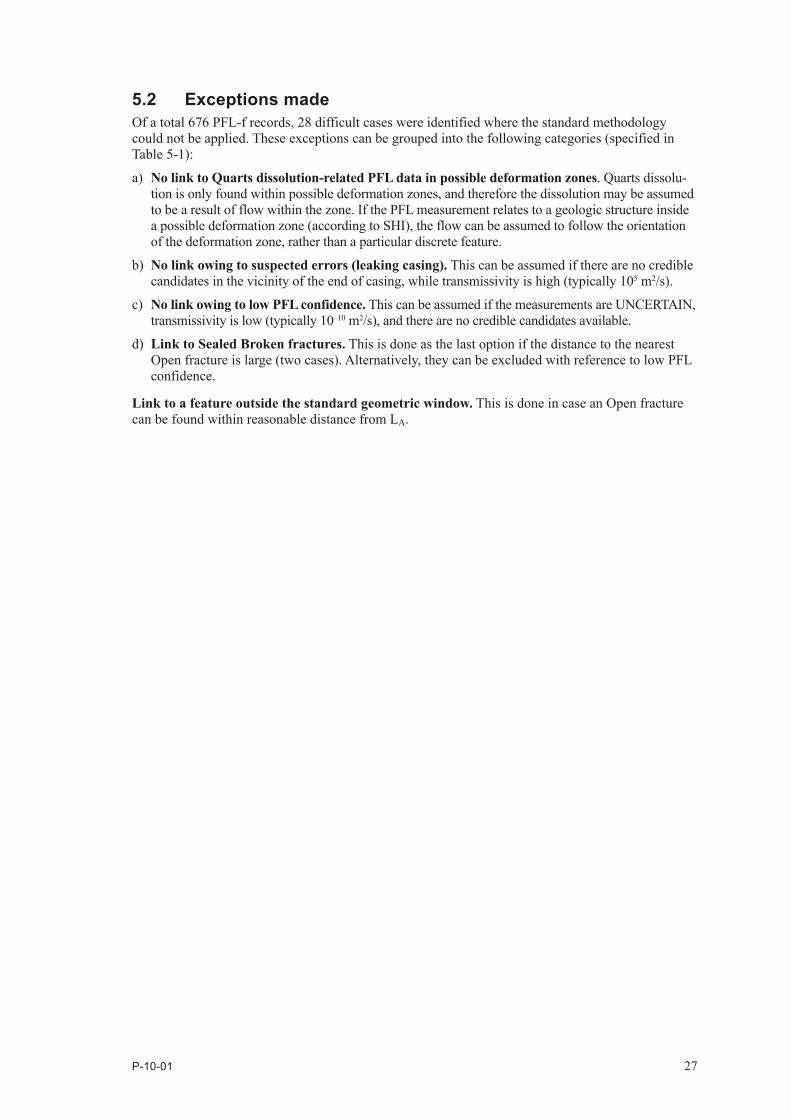
This results in 12 data types (6 geologic types and 2 domain types). Furthermore, the data is divided into borehole length falling inside the geometric window of PFL-f records (PFLanom. Confidence = 1, respectively, 2), and that falling outside. The relative intensity inside geometric PFL windows was calculated by normalizing the intensity of each data type by its “background value” (i.e. its corresponding intensity outside the geometric windows). In other words, a data type with a larger relative intensity than 1.0 is generally more abundant around PFL-f records.
These relative intensities (Figure 5-3) show a similar pattern to the results of the PFL-f linkage (c.f. Figure 5-1and Figure 5-2). The relative intensity of credible PFL-f candidates (Crush Zones and Open Certain fractures) is considerably higher in the immediate vicinity of PFL-f records (PFL-anom. Confidence = 1). Only an additional decimeter further away (PFL-anom. Confidence = 2) the relative intensity is close to background level. Less credible PFL candidates (Open Possible and Sealed fractures) does not exhibit this dramatic rise in intensity in the vicinity of PFL-f data. Only minor differences can be observed between the data types HRD and HCD, although it should be noted that the background values are generally higher in HCD.
Figure 5-2. Summary of linked PFL-f data classed by confidence in PFL measurement and geometric match.
25
291
209
54
1223 31
9
0
50
100
150
200
250
300
350
Crush zone Open,
Certain
Open,
Probable
Open,
Possible
Sealed,
Broken
Not linked
Num
ber o
f dat
a
pfl_anom_conf 1
pfl_anom_conf 2
PFL - f confidence
Figure 5-3. Fracture intensity in the vicinity of PFL-f records related to fracture intensity outside the geomet-ric window of a PFL-f anomaly. Note that no distinction was made between PFL_conf1 and 2 for Crush Zones (owing to the various thicknesses of Crush Zones).
0
2
4
6
8
10
12
Rea
lativ
e in
tens
ity a
roun
d P
FLs
HCD, PFL_conf 1
HCD, PFL_conf 2
HRD, PFL_conf 1
HRD, PFL_conf 2
Uniform expectation
P-10-01 27
5.2 Exceptions madeOf a total 676 PFL-f records, 28 difficult cases were identified where the standard methodology could not be applied. These exceptions can be grouped into the following categories (specified in Table 5-1):
a) No link to Quarts dissolution-related PFL data in possible deformation zones. Quarts dissolu-tion is only found within possible deformation zones, and therefore the dissolution may be assumed to be a result of flow within the zone. If the PFL measurement relates to a geologic structure inside a possible deformation zone (according to SHI), the flow can be assumed to follow the orientation of the deformation zone, rather than a particular discrete feature.
b) No link owing to suspected errors (leaking casing). This can be assumed if there are no credible candidates in the vicinity of the end of casing, while transmissivity is high (typically 105 m2/s).
c) No link owing to low PFL confidence. This can be assumed if the measurements are UNCERTAIN, transmissivity is low (typically 10–10 m2/s), and there are no credible candidates available.
d) Link to Sealed Broken fractures. This is done as the last option if the distance to the nearest Open fracture is large (two cases). Alternatively, they can be excluded with reference to low PFL confidence.
Link to a feature outside the standard geometric window. This is done in case an Open fracture can be found within reasonable distance from LA.

28 P-10-01
Table 5-1. Exceptions to PFL-f linkage to Boremap.
IDCODE PFL. No.
PFLCONF.
TRANSMISSIVITY (m2/s)
SHI COMMENT
NOT LINKED TO FEATURE, WITH REFERENCE TO GEOLOGYKFR102A 94 CERTAIN 2.1E-9 DZ3 Assumed to reflect faint quartz dissolution
(449.901–451 m)
KFR102A 95 CERTAIN 3.8E-9 DZ3 Medium Quartz dissolution (451.302–455.382 m)
KFR102A 96 CERTAIN 1.6E-8 DZ3 Same as above
KFR102A 97 CERTAIN 2.8E-8 DZ3 Same as above
KFR102A 98 CERTAIN 2.1E-8 DZ3 Same as above
KFR102A 99 CERTAIN 1.1E-8 DZ3 Faint Quartz dissolution (455.383–455.751 m)
KFR102A 101 CERTAIN 1.0E-8 DZ3 Medium quartz dissolution (455.75–457.65 m), Faint quartz dissolution (457.65–458.65 m)
KFR102A 102 UNCERTAIN 4.5E-9 DZ3 Medium Quartz dissolution (473.151–474.138 m)
KFR104 69 CERTAIN 3.9E-9 DZ2/RU1b
No visible aperture. Faint argillization (153.623–153.666 m), breccia occurrence (153.639–153.805 m), weak brecciated structure (153.716–153.716 m)
KFR27 60 CERTAIN 6.6E-8 DZ2 Faint quartz dissolution (375.716–376.256 m), Weak argillization (375.72–376.238 m)
KFR27 75 CERTAIN 4.3E-8 DZ4 Faint quartz dissolution (433.66–435.46 m), strong quartz dissolution (435.46–435.6 m), faint quartz dissolution (435.6–441.28 m), med. argillization (435.7–435.71 m)
NOT LINKED TO FEATURE, WITH REFERENCE TO SUSPECTED LEAKING CASINGKFR101 1 CERTAIN 1.1E-5 DZ1 Assumed to reflect leaking casing
KFR103 1 UNCERTAIN 6.6E-5 RU1 Assumed to reflect leaking casing
KFR102A 1 UNCERTAIN 8.6E-8 RU1 Assumed to reflect leaking casing.
NOT LINKED TO FEATURE, WITH REFERENCE TO LOW CONFIDENCEKFR102B 81 UNCERTAIN 1.1E-9 RU3 Uncertain PFL measurement. No open fracture within
1.25 m from LA
KFR27 1 UNCERTAIN N/A RU1 Uncertain PFL-f, not linked to feature
KFR105 35 UNCERTAIN 7.7E-11 RU3 Uncertain PFL record, low T, closest Probably Open fracture = 75 cm from LA
KFR105 42 UNCERTAIN 1.8E-10 RU3 Low T and Uncertain PFL-f record. Closest PFL-f record 0.5 m above LA, and closest Possibly Open fracture 1 m below LA
KFR105 71 UNCERTAIN 4.6E-10 RU3 Closest open fracture 0.7 m from LA
KFR105 126 UNCERTAIN 8.2E-11 DZ4 Not linked to any feature
LINKED TO SEALED/BROKEN FEATUREKFR102A 4 UNCERTAIN 2.5E-9 RU2a No visible aperture, closest Possibly Open fracture
0.6 m from LA
KFR105 9 UNCERTAIN 4.4E-9 RU2 Linked to Sealed/Broken fracture. Closest Probably Open fracture 0.6 m above LA, or PFL No. 10, which is 0.6 m below LA
LINKED TO FEATURE OUTSIDE STANDARD GEOMETRIC WINDOWKFR102A 21 UNCERTAIN 3.1E-9 RU3 Closest Open fracture, distance to LA = 0.23 m
KFR103 7 CERTAIN 3.1E-8 RU1 Clearest visible aperture. Distance from LA = 0.31 m
KFR103 30 CERTAIN 1.8E-8 RU3a Uncertain linkage. Closest probable open fracture 0.46 m from LA. Sealed network (71.764 – 72.668 m)Weak foliated structure (106/87) at 72.467 m
KFR105 13 UNCERTAIN 8.3E-10 RU1b 0.25 m from LA
KFR105 14 UNCERTAIN 8.7E-11 RU1b Distance to LA = 0.26 m. Also linked to PFL No 15
KFR105 140 UNCERTAIN 2.8E-10 RU6 Uncertain. Distance to LA = 0.29 m. Also linked to PFL No. 141
P-10-01 29
6 References
Forssman I, Forsmark T, Rhén I, 2008. Forsmark site investigation. Correlation of Posiva Flow Log anomalies to core mapped features in KFM02B, KFM08D and KFM11A, SKB P07128, Svensk Kärnbränslehantering AB.
Hurmerinta E, Väisäsvaara J, 2009a. Site investigation SFR. Difference flow logging in boreholes KFR104 and KFR27 (extension). SKB P-09-20, Svensk Kärnbränslehantering AB.
Hurmerinta E, Väisäsvaara J, 2009b. Site investigation SFR. Difference flow logging in borehole KFR102A. SKB P-09-21, Svensk Kärnbränslehantering AB.
Kristiansson S, Väisäsvaara J, 2008. Site investigation SFR. Difference flow logging in boreholes KFR102B and KFR103. SKB P-08-99, Svensk Kärnbränslehantering AB.
Kristiansson S, Pekkanen J, Väisäsvaara J, 2009. Site investigation SFR. Difference flow logging in borehole KFR106. SKB P-09-73.
Pekkanen J, Pöllänen J, Väisäsvaara, J, 2008. Site investigation SFR. Difference flow logging in boreholes KFR101 and KFR27. SKB P-08-98, Svensk Kärnbränslehantering AB.
SKB, 2008. Geovetenskapligt undersökningsprogram för utbyggnad av SFR. SKB R-08-67, Svensk Kärnbränslehantering AB.
Väisäsvaara J, 2010. Site investigation SFR. Difference flow logging in borehole KFR105. SKB P-09-09, Svensk Kärnbränslehantering AB.