Site 5 Coastal Plain · Web view2A Table Rock (Mountains) 5B Santee Cooper Project (Engineering &...
92
SECTION 5 COASTAL PLAIN REGION / OVERVIEW Index Map to Study Sites 2A Table Rock (Mountains) 5B Santee Cooper Project (Engineering & Canals) 2B Lake Jocassee Region (Energy Production) 6A Congaree Swamp (Pristine Forest) 3A Forty Acre Rock (Granite Outcropping)7A Lake Marion (Limestone Outcropping) 3B Silverstreet (Agriculture) 8A Woods Bay (Preserved Carolina Bay) 3C Kings Mountain (Historical Battleground) 9A Charleston (Historic Port) 4A Columbia (Metropolitan Area) 9B Myrtle Beach (Tourist Area) 4B Graniteville (Mining Area) 9C The ACE Basin (Wildlife & Sea Island Culture) 4C Sugarloaf Mountain (Wildlife Refuge) 10A Winyah Bay (Rice Culture) 5A Savannah River Site (Habitat Restoration) 10B North Inlet (Hurricanes)
Transcript of Site 5 Coastal Plain · Web view2A Table Rock (Mountains) 5B Santee Cooper Project (Engineering &...

SECTION 5
COASTAL PLAIN REGION / OVERVIEW
Index Map to Study Sites
2A Table Rock (Mountains) 5B Santee Cooper Project (Engineering & Canals)
2B Lake Jocassee Region (Energy Production) 6A Congaree Swamp (Pristine Forest)
3A Forty Acre Rock (Granite Outcropping) 7A Lake Marion (Limestone Outcropping)
3B Silverstreet (Agriculture) 8A Woods Bay (Preserved Carolina Bay)
3C Kings Mountain (Historical Battleground) 9A Charleston (Historic Port)
4A Columbia (Metropolitan Area) 9B Myrtle Beach (Tourist Area)
4B Graniteville (Mining Area) 9C The ACE Basin (Wildlife & Sea Island Culture)
4C Sugarloaf Mountain (Wildlife Refuge) 10A Winyah Bay (Rice Culture)
5A Savannah River Site (Habitat Restoration) 10B North Inlet (Hurricanes)


TABLE OF CONTENTS FOR SECTION 5
COASTAL PLAIN REGION / OVERVIEW
- Index Map to Coastal Plain Overview Study Sites
- Table of Contents for Section 5
- Power Thinking Activity - "Reservoir Referendum"
- Performance Objectives
- Background Information
- Description of Landforms, Drainage Patterns, and Geologic Processesp. 5-2 . . . . . . - Characteristic Landforms of the Coastal Plainp. 5-3 . . . . . . - Geographic Features of Special Interestp. 5-3 . . . . . . - Coastal Plain Once an Ocean Floorp. 5-4 . . . . . . - Soils of the Coastal Plain
- Influence of Topography on Historical Events and Cultural Trendsp. 5-5 . . . . . . - Native Americansp. 5-5 . . . . . . - Revolutionary War Campaigns in the Coastal Plainp. 5-6 . . . . . . - Origin of South Carolina's State Flag p. 5-6 . . . . . . . . . - figure 5-1- "South Carolina State Flag"p. 5-7 . . . . . . - Compromise of 1808p. 5-7 . . . . . . - Early Railroadsp. 5-9 . . . . . . . . . - figure 5-2- "Bill of Fare for the Best Friend of Charleston" (Front)p. 5-10 . . . . . . . . . - figure 5-3- "Bill of Fare for the Best Friend of Charleston" (Back)p. 5-11 . . . . . - Slaveryp. 5-11 . . . . . - King Cottonp. 5-12 . . . . . . . . . - figure 5-4- "Map of 1860 Cotton Distribution"p. 5-12 . . . . . . . . . - figure 5-5- "Map of 1981 Cotton Distribution"p. 5-13 . . . . . - Wise Sayings, Folk Ways, and Good Luck Charmsp. 5-13 . . . . . . . . . - story - "Wise Sayings and Good Luck Charms"p. 5-14 . . . . . - Strange Stories and Legendsp. 5-14 . . . . . . . . . - story - "The Vanishing Girl"
- Natural Resources, Land Use and Environmental Concernsp. 5-15 . . . . . - Climate and Water Resourcesp. 5-15 . . . . . - Soils and Land Usep. 5-15 . . . . . - The Timber Industry of the Coastal Plainp. 5-16 . . . . . - Agriculture of the Coastal Plainp. 5-16 . . . . . - Unique Natural Habitats in the Coastal Plainp. 5-17 . . . . . - Freshwater Fisheriesp. 5-17 . . . . . - Phosphate, Limestone, and Other Rock Resources
- Summary
- Places to Visit
5-i
- References and Resources- STUDY AREA 5 : COASTAL PLAIN OVERVIEW
(ICONS) Overv = Q Sci = R Math = : Hist = : Lang Arts = ?- Activity 5-1 : Overview
- Materials
- Performance Tasksp. 5-21. . . . . . . . . 1. describe topography of Coastal Plain Qp. 5-21 . . . . . . . . . 2. examine land use in Coastal Plain Qp. 5-22 . . . . . . . . . 3. compare drainage patterns of Upper and Lower Coastal Plains Rp. 5-22 . . . . . . . . . 4. estimate amount of swampland in Barnwell vs. Marion counties Rp. 5-22 . . . . . . . . . 5. compare Coastal Plain soils Rp. 5-22 . . . . . . . . . 6. locate major crop belt in South Carolina Rp. 5-23 . . . . . . . . . 7. analyze changes in cotton production Rp. 5-23 . . . . . . . . . 8. trace route of The Best Friend of Charleston R:p. 5-24 . . . . . . . . . 9. make time table for railroad using the Bill of Fare ::p. 5-24 . . . . . . . . . 10. distinguish between out of date terms and printing errors ?p. 5-24 . . . . . . . . . 11. make up a strange tale or legend like "The Vanishing Girl" ?p. 5-25 . . . . . . . . . 12. design flags for your county and state :p. 5-25 . . . . . . . . . 13. make list of wise sayings and folk ways ?:p. 5-25 . . . . . . . . . 14. locate Marion's military engagement :p. 5-25 . . . . . . . . . 15. list places using Francis Marion's name or nickname :p. 5-25 . . . . . . . . . 16. explain why Coastal Plain houses do not have basements R
- Enrichmentp. 5-26 . . . . . . . . . 1. research Eli Whitney and George Washington Carver :p. 5-26 . . . . . . . . . 2. research list of unique natural areas in Coastal Plain Rp. 5-26 . . . . . . . . . 3. collect song versions of "The Vanishing Girl" and similar legends ?p. 5-26 . . . . . . . . . 4. visit county agent to discuss cash crops R:p. 5-26 . . . . . . . . . 5. interview family members and list wise sayings ?p. 5-26 . . . . . . . . . 6. plan class presentation on The Best Friend of Charleston :
- STUDY SITE 5A : SAVANNAH RIVER SITE (HABITAT RESTORATION)(ICONS) Overv = Q Sci = R Math = : Hist = : Lang Arts = ?- Newspaper Article - "SRS Cleanup Could Harm Ecosystem, Scientist Said"- Rationale
- Brief Site Descriptionp. 5A-2 . . . . . - Introductionp. 5A-3 . . . . . - Old Ellenton and New Ellentonp. 5A-3 . . . . . . . . . - story - "The Move of Ellenton"p. 5A-5 . . . . . . . . . - story - "The Sign at Ellenton "p. 5A-6 . . . . . . . . . - figure 5A-1- "Topographic Map of Old Ellenton"p. 5A-7 . . . . . . . . . - figure 5A-2- "Topographic Map of New Ellenton"
5-ii
p. 5A-8 . . . . . - Geology and Potential for Pollutionp. 5A-9 . . . . . . . . . - figure 5A-3- "Geologic Cross Section of SRS"p. 5A-9 . . . . . . . . . - figure 5A-4- "Map View of SRS Showing Location of Faults"p. 5A-10 . . . . - Environmental Restoration Efforts
5-iii

- Activity 5A-1 : Surface and Subsurface Geology- Materials
- Performance Tasksp. 5A-12 . . . . . . . . 1. locate the study site Q Rp. 5A-12 . . . . . . . . 2. locate features and place names Qp. 5A-12 . . . . . . . . 3. categorize four types of lakes found on site. Rp. 5A-13 . . . . . . . . 4. examine the Savannah River floodplain Rp. 5A-13 . . . . . . . . 5. trace drainage patterns within the Savannah River Site Rp. 5A-13 . . . . . . . . 6. examine influence of fault lines on topography Rp. 5A-13 . . . . . . . . 7. determine number of fire towers needed to view all of the SRS :p. 5A-13 . . . . . . . . 8. analyze the circular shape of the Savannah River Site : :p. 5A-14 . . . . . . . . 9. compare land use inside and outside of the site boundaries R : :p. 5A-14 . . . . . . . . 10. plot earthquake danger zone and analyze damage potentialR : :p. 5A-14 . . . . . . . . 11. analyze the highway network within the Savannah River Site :
- Enrichmentp. 5A-14 . . . . . . . . 1. research earthquake hazard potential in your local area R :p. 5A-14 . . . . . . . . 2. research security procedures at the Savannah River Site :
- Activity 5A-2: Land Use Changes- Materials
- Performance Tasksp. 5A-15 . . . . . . . . 1. correlate land use to topography R : Qp. 5A-15 . . . . . . . . 2. analyze land use changes through time Q R :p. 5A-15 . . . . . . . . 3. compare old Ellenton town site with current landscape :p. 5A-16 . . . . . . . . 4. write story about proposed archeological dig ? :p. 5A-16 . . . . . . . . 5. compare towns of old Ellenton and New Ellenton : :p. 5A-16 . . . . . . . . 6. explain distribution of cemeteries R :p. 5A-16 . . . . . . . 7. create poster expressing emotions of leaving home town ?p. 5A-17 . . . . . . . . 8. interpret and use the Savannah River Site grid system : :p. 5A-17 . . . . . . . . 9. design site layout for new tritium reactor R :p. 5A-17 . . . . . . . . 10. calculate average cost per acre of land bought by SRS : :p. 5A-18 . . . . . . . . 11. select alternate SC site with characteristics as SRS R Q :p. 5A-18 . . . . . . . . 12. plan use for Savannah River Site after government returns it : ?
- Enrichmentp. 5A-18 . . . . . . . . 1. research stories of other abandoned towns within the SRS : ?p. 5A-18 . . . . . . . . 2. list artifacts already discovered at SRS :p. 5A-18 . . . . . . . . 3. compare earnings in 1951 with today's value :
- Activity 5A-3: Contamination and Remediation- Materials
5-iv

- Performance Tasksp. 5A-19 . . . . . . . . 1. analyze the newspaper article ?p. 5A-19 . . . . . . . . 2. trace cycle of water use for reactors at SRS Q : Rp. 5A-19 . . . . . . . . 3. recommend locations for monitoring and treatment wells Rp. 5A-19 . . . . . . . . 4. analyze the pollution potential for tritium in groundwater R :p. 5A-20 . . . . . . . . 5. locate evidence of hot water discharge R :p. 5A-20 . . . . . . . . 6. trace route by which contamination entered Par Pond : R :p. 5A-20 . . . . . . . . 7. calculate amount of newly exposed land from lake drainage : Rp. 5A-20 . . . . . . . . 8. document environmental effects of lowering lake level R ?p. 5A-20 . . . . . . . . 9. list potential pollution problems for animals R ?
- Enrichmentp. 5A-21 . . . . . . . . 1. research tasks of reactors at SRS R :p. 5A-21 . . . . . . . . 2. research the process of vitrification of waste in borosilicate glass Rp. 5A-21 . . . . . . . . 3. compare reactors at SRS with those at Chernobyl : Rp. 5A-21 . . . . . . . . 4. investigate the properties and uses of tritium R
- STUDY SITE 5B : SANTEE COOPER PROJECT (ENGINEERING & CANALS)(ICONS) Overv = Q Sci = R Math = : Hist = : Lang Arts = ?- Newspaper Article - "Swamp Fox Battalion Returns With Pride"- Rationale
- Brief Site Descriptionp. 5B-2 . . . . . - The Old Santee Canal p. 5B-2 . . . . . - Santee Cooper Projectp. 5B-4 . . . . . . . . . - story - "Bubba and the Big Fishing Hole"
- Activity 5B-1 : Engineering Impact of the Santee Cooper Project- Materials
- Performance Tasksp. 5B-6 . . . . . . . . . 1. locate the study site Q Rp. 5B-6 . . . . . . . . . 2. compare Coastal Satellite Image with State Base Map Qp. 5B-7 . . . . . . . . . 3. analyze land use changes through time Rp. 5B-7 . . . . . . . . . 4. analyze the newspaper article ? :p. 5B-7 . . . . . . . . . 5. trace navigation route, Charleston to Lake Marion R :p. 5B-7 . . . . . . . . . 6. trace Santee River System, calculate travel distance R :p. 5B-8 . . . . . . . . . 7. write story about legendary superhero ?
- Enrichmentp. 5B-8 . . . . . . . . . 1. research Old Santee Canal route options :p. 5B-8 . . . . . . . . . 2. research literary examples of superheroes ?:
5-v

SECTION 5
COASTAL PLAIN REGION / OVERVIEW
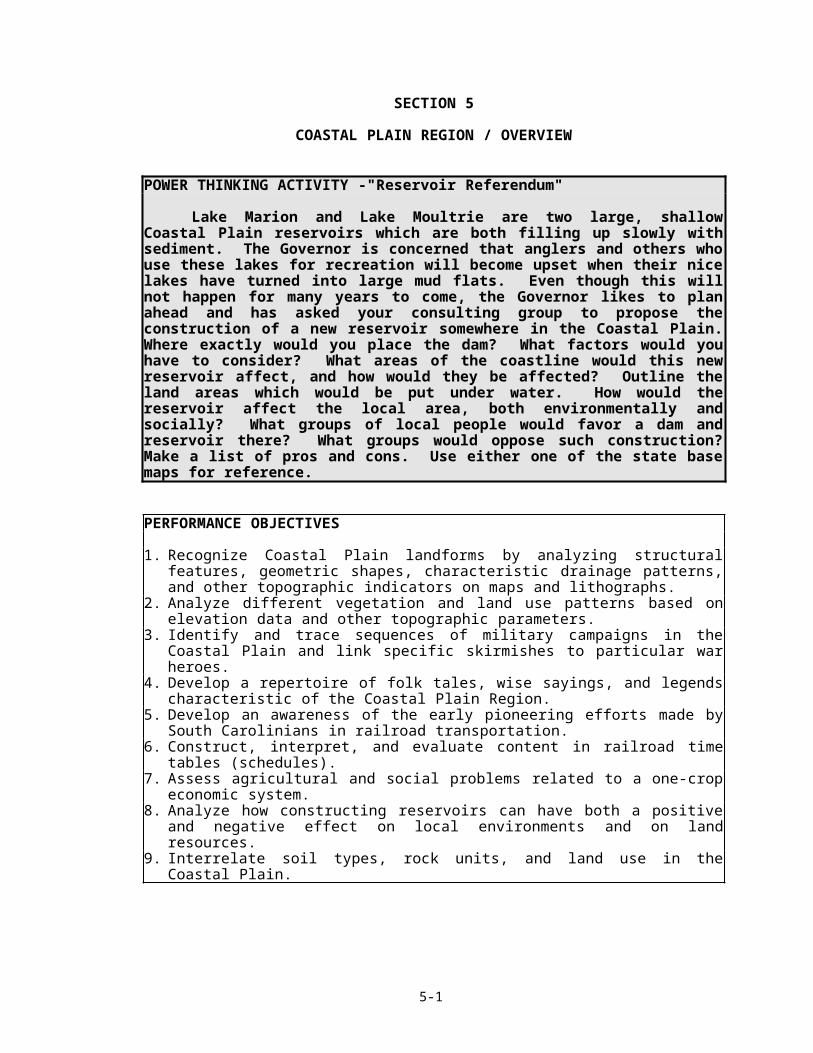
POWER THINKING ACTIVITY -"Reservoir Referendum"
Lake Marion and Lake Moultrie are two large, shallow Coastal Plain reservoirs which are both filling up slowly with sediment. The Governor is concerned that anglers and others who use these lakes for recreation will become upset when their nice lakes have turned into large mud flats. Even though this will not happen for many years to come, the Governor likes to plan ahead and has asked your consulting group to propose the construction of a new reservoir somewhere in the Coastal Plain. Where exactly would you place the dam? What factors would you have to consider? What areas of the coastline would this new reservoir affect, and how would they be affected? Outline the land areas which would be put under water. How would the reservoir affect the local area, both environmentally and socially? What groups of local people would favor a dam and reservoir there? What groups would oppose such construction? Make a list of pros and cons. Use either one of the state base maps for reference.
PERFORMANCE OBJECTIVES
1. Recognize Coastal Plain landforms by analyzing structural features, geometric shapes, characteristic drainage patterns, and other topographic indicators on maps and lithographs.
2. Analyze different vegetation and land use patterns based on elevation data and other topographic parameters.
3. Identify and trace sequences of military campaigns in the Coastal Plain and link specific skirmishes to particular war heroes.
4. Develop a repertoire of folk tales, wise sayings, and legends characteristic of the Coastal Plain Region.
5. Develop an awareness of the early pioneering efforts made by South Carolinians in railroad transportation.
6. Construct, interpret, and evaluate content in railroad time tables (schedules).
7. Assess agricultural and social problems related to a one-crop economic system.
8. Analyze how constructing reservoirs can have both a positive and negative effect on local environments and on land resources.
9. Interrelate soil types, rock units, and land use in the Coastal Plain.
5-1

BACKGROUND INFORMATION
Description of Landforms, Drainage Patterns, and Geologic Processes
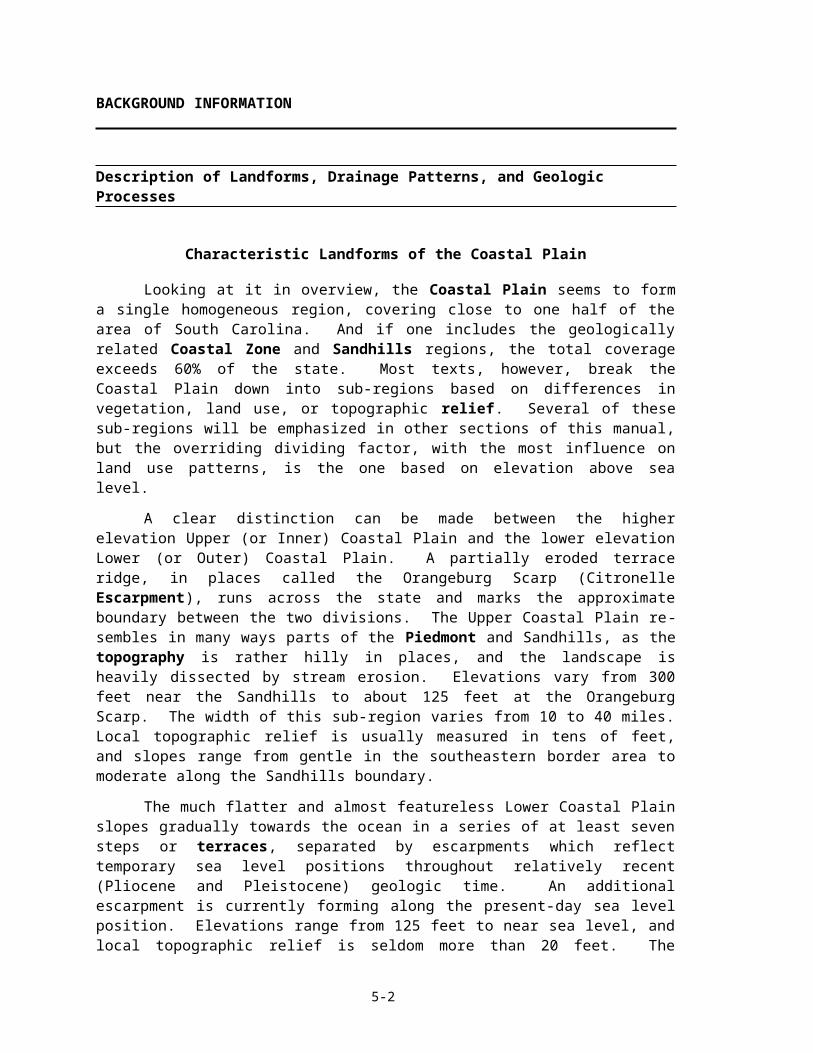
Characteristic Landforms of the Coastal Plain
Looking at it in overview, the Coastal Plain seems to form a single homogeneous region, covering close to one half of the area of South Carolina. And if one includes the geologically related Coastal Zone and Sandhills regions, the total coverage exceeds 60% of the state. Most texts, however, break the Coastal Plain down into sub-regions based on differences in vegetation, land use, or topographic relief. Several of these sub-regions will be emphasized in other sections of this manual, but the overriding dividing factor, with the most influence on land use patterns, is the one based on elevation above sea level.
A clear distinction can be made between the higher elevation Upper (or Inner) Coastal Plain and the lower elevation Lower (or Outer) Coastal Plain. A partially eroded terrace ridge, in places called the Orangeburg Scarp (Citronelle Escarpment), runs across the state and marks the approximate boundary between the two divisions. The Upper Coastal Plain resembles in many ways parts of the Piedmont and Sandhills, as the topography is rather hilly in places, and the landscape is heavily dissected by stream erosion. Elevations vary from 300 feet near the Sandhills to about 125 feet at the Orangeburg Scarp. The width of this sub-region varies from 10 to 40 miles. Local topographic relief is usually measured in tens of feet, and slopes range from gentle in the southeastern border area to moderate along the Sandhills boundary.
The much flatter and almost featureless Lower Coastal Plain slopes gradually towards the ocean in a series of at least seven steps or terraces, separated by escarpments which reflect temporary sea level positions throughout relatively recent (Pliocene and Pleistocene) geologic time. An additional escarpment is currently forming along the present-day sea level position. Elevations range from 125 feet to near sea level, and local topographic relief is seldom more than 20 feet. The nearly level modern plain is characterized by a large number of meandering streams and rivers with broad floodplains.
A surprisingly wide variety of landscape features can be found in the Coastal Plain Region, an area not usually given much credit for spectacular scenery. Many of these diverse landforms are only visible up close as they tend to blend in with the predominately flat terrain and dense vegetation characteristic of most of the region. Most of these landforms have features which reveal the particular environment in which they were formed. For example, wide, level plains mark former sandy ocean bottom shelf deposits; low, linear hills and adjacent depressions imply ancient barrier island deposits and adjacent marshes; gravel deposits on top of low hills mark locations of former river beds; and rapid drops in elevation (escarpments)
5-2

indicate positions of former shorelines where wave scour eroded into older terraces. These boundaries are particularly easy to recognize, as they outline broad, nearly flat depositional surfaces which tilt slightly towards the Atlantic Ocean and create a series of landform belts roughly parallel to the present coastline.
Geographic Features of Special Interest
The most notable Coastal Plain geographic features, visible on any statewide map, are the two large lakes, Marion and Moultrie, located almost in the center of the region. Both of these lakes are actually reservoirs which were constructed in the 1930's. These lakes have had a profound influence on the type of land use, especially tourism, found in the surrounding areas. Remnants of the Old Santee Canal are visible in several places near Lake Moultrie, but they are best seen at Old Santee Canal State Park, near Monck's Corner. Another large reservoir, Par Pond, on the Savannah River Site in Barnwell County, is closed to tourism because of concerns about industrial pollution. Several other hazardous waste sites have been located in the Coastal Plain Region, creating major environmental concerns about potential groundwater and surface water contamination. More localized sites with characteristic landforms or specific natural features are covered in more detail in other sections of this manual.
Coastal Plain Once an Ocean Floor
All parts of the Coastal Plain are underlain by nearly horizontal sedimentary rock layers, primarily of marine origin, that were formed from underwater deposits of mud, silt, and limestone which were buried and later experienced both compaction and cementation. Although much of the area is now above sea level, allowing a limited amount of erosion to take place, the large percentage of land occupied by floodplains of both major and minor rivers characterizes the region as primarily a depositional area.
All Coastal Plain sediments, other than modern floodplain material, were originally deposited when sea level was much higher than its present position. But the Coastal Plain has also experienced several periods of much lower sea level when significant stream erosion took place throughout the region. Geologic evidence from wells and surface exposures indicates that sea level has fluctuated through many such cycles during the Cenozoic Era of geologic time. The greatest flooding episode probably occurred during the Eocene Epoch, about 40 million years ago, when the Santee Limestone was deposited in a marine continental shelf environment far from the shoreline. At that time, the shoreline was located well north of Columbia and perhaps reached as far as the Blue Ridge Region. During the succeeding Oligocene and Miocene Epochs, sea level fell dramatically as ice caps began to form in Antarctica and Greenland, and the Appalachian Mountains began to rise higher. The shoreline location at that time was probably situated many miles seaward of the present coastline.
Most of the marine sediments were deposited on top of an older surface of igneous and metamorphic rocks identical to that exposed in the Piedmont. Closer to the source, these sedimentary layers took on a more
5-3
terrestrial depositional pattern, showing characteristics more common to river and floodplain deposits. Because the land surface slopes gradually seaward, both now and in the past, the Coastal Plain sediments are much thicker near the coast (averaging about 3,000 feet thick), than they are near the Fall Line Zone, where they thin to practically nothing. Deeper water sediments are found closer to the present coastline, while more shallow water and terrestrial types of deposition are found near the Fall Line Zone. Even along the coast, sediment thicknesses vary. Tectonic uplift near the North Carolina state line, along what is called the Cape Fear Arch, has allowed only about 400 feet of Coastal Plain sediment to
5-4
accumulate on top of the Piedmont crystalline rocks near Myrtle Beach. In comparison, Hilton Head Island, near the Georgia border, where subsidence continued uninterrupted, has sediment thicknesses exceeding 4,000 feet.
The Quaternary Period ice ages caused several more sea level fluctuations during the last million years of geologic time, producing many of the terraces found on the Lower Coastal Plain. Although the ice sheets did not reach as far south as South Carolina, expansion and retreat of continental glaciers alternately lowered and raised sea level as ice formed on the continents and then melted. Some of the terraces and associated escarpments near the present coast represent interglacial ages of higher sea level when features such as marshes, deltas, beaches, and barrier islands formed somewhat inland from the modern ocean. Although erosion has modified these features, sometimes considerably, they can often be recognized by their distinctive soil types. Several river paths in South Carolina appear to have been diverted by such old terrace features. Examples of these include the Lynches, Black, and Edisto rivers. Modern deposition, because of a relatively stable sea level, is essentially limited to floodplain sediments, alluvial deposits, and the filling in of marsh areas closer to the coastline.
Soils of the Coastal Plain
Coastal Plain soils develop primarily on sandy and clayey coastal sediments which have a tendency to be strongly acidic. The resulting chemical weathering and leaching processes tend to dissolve ions from soil minerals readily and contribute to the rapid development of clearly defined soil profiles. Many of these ions accumulate in the 'B' soil horizon layer and impart a distinctive color to the subsoil. The geographic origin of many of these sediments was the Piedmont Region so the mineralogy of Coastal Plain soils is often similar to that found in the crystalline source rocks. Some soils form on floodplain deposits composed of alluvial sediment. These transported soils have very different properties from the residual soils. The abundant moisture and thick vegetative cover common in the Coastal Plain provide a source of replenishment of soil minerals lost to weathering so the quality of the 'A' soil horizon layer can be maintained.
Soil wetness varies from well drained to very poorly drained, partly due to differences in the original sediment layers and partly due to the elevation of the soil above the ground water table. The best drained soils are found on elevated sandy marine and fluvial deposits in the Upper Coastal Plain. The most poorly drained soils are found near the coast where broad expanses of muddy marsh and floodplain deposits are barely above the water table. Many of these soils with high water tables develop a mottled clay-like layer called a gley layer.
5-5

Influence of Topography on Historical Events and Cultural Trends
Native Americans
When Europeans first came to the South Carolina area in the 1500's, beginning with the Spanish under Lucas Vasquez de Ayllon in 1521, they met a variety of Native Americans (the term that has come to replace the word "Indian" which was in use from first contact until the 1970's). The earliest pattern of trade relations between the two groups centered around deerskins and European goods like firearms, pots, pans and other metalware. This earliest interaction was characterized by wariness on the part of both parties: it brought great profit to the Europeans and terrible epidemics (smallpox, measles) to the Native Americans.
The Native Americans were described as a people at a stone age technological level, lacking knowledge of metallurgy, the wheel, pack animals, sails and husbandry but possessing instead agricultural skills and relatively sophisticated political and social organizations and customs that emphasized voluntary rather than coerced behavior. Most of the nations lived in semi-permanent villages surrounded by fields of corn, beans, squash, pumpkins and melons. Nations held land in permanent use, rather than ownership but otherwise quickly adapted to European trade patterns. In recent years, it has become fashionable to view the native people as environmental purists. Reality demands a more balanced perspective. The truth is that they quickly exploited and depleted the deer of the Carolina woods for trading purposes, with more than 40,000 skins going through Charles Towne's harbor in 1690. This number reached a maximum of 150,000 a year during the 18th century. For Native Americans, participation in the white man's economy required finding a tradable commodity -- deerskins. Participation in that economy, however, could not protect them from the land hunger which was exhibited by the Europeans moving out slowly along the coast and up the rivers. However important the trade in deerskins may have been to Europeans, it was always secondary to the desire for more land. In the hands of the Europeans, trade was a useful club that forced various nations into alliances with the Europeans. As a result, Native Americans often fought other Native Americans on behalf of their trading partners; in 1712-13, Yemassees versus Tuscaroras; and in 1715, Cherokees versus Yemassees and then Creeks. The result of such behavior was that a small number of whites, only 1500 men in 1715, managed to force all Native Americans out of the Coastal Plains by 1730. After that date, only the Cherokees and Catabaws remained a major factor in South Carolina's development.
Revolutionary War Campaigns in the Coastal Plain
In addition to the "Indian Wars," the Coastal Plain was the locale of several important battles during the Revolutionary War. Many of these battles involved one of South Carolina's most famous military heroes, General Francis Marion. He became a popular folk hero because of the unconventional tactics he used to win battles. Many of
5-6

those tactics are similar to what we would call guerrilla warfare today, and were very different from what the British army expected to face.
While most of the fighting in 1780 was in the Piedmont Region, by 1781, most of the action had shifted to Coastal Plain battlefields. On May 11, 1781, Patriot General Thomas Sumter was defeated at Orangeburg by British Lieutenant Colonel Lord Francis Rawdon. On September 8, 1781, Patriot Major General Nathanael Greene and Francis Marion lost the Battle of Eutaw Springs, the final Revolutionary War battle in South Carolina, to Lord Rawdon, but in the process the British army was so depleted that they were forced to withdraw to Charles Town a short time afterwards. After the end of the war, on December 14, 1782, the British army left Charles Town for the last time, along with close to 4,000 South Carolina loyalists and 5,000 slaves.
Origin of South Carolina's State Flag
South Carolina soldiers have marched under many different flags since colonial times, but only one of them has received official endorsement as the designated state flag. The official flag has a long and colorful history behind it. It was designed by Colonel William Moultrie who was asked by the Revolutionary Council of Safety to design a flag for the state's troops in the fall of 1775. Armies had to fly flags so that friendly forces would recognize their allies and not attack. At that time there was no other efficient way of communicating from a distance between armies. The original flag was a navy blue color with a silver crescent in the upper left hand corner. Moultrie got his ideas for this flag from the uniforms of the South Carolina troops. These troops wore dark blue jackets and had hats with a silver crescent attached.
Figure 5-1: South Carolina State Flag
5-7

Colonel Moultrie was commanding the unfinished palmetto log fort built on Sullivan's Island when a British fleet attacked on June 28, 1776. Throughout the heavy bombardment, the spongy palmetto logs absorbed many of the British shells and protected the South Carolina troops. During the battle, Sergeant William Jasper became a hero by retrieving the flag when it was shot down. The British were unable to force the fort to surrender and had to withdraw. The fort was re-named Moultrie in honor of its victorious commander. Later, a grateful state added the palmetto tree to Moultrie's flag. Partly as a result of its role in this battle, the palmetto tree was named as the state's official tree. However, it was not until January 28, 1861, that the state legislature adopted Moultrie's flag as the official state flag of South Carolina.
Compromise of 1808
During the period when the growing of rice and indigo provided much of the base for South Carolina's prosperity (pre-1790), the geographical requirements of those two crops favored the development of plantations, slavery, genteel living and aristocracy in the area near the coast. This was in stark contrast to the subsistence agriculture practiced by yeoman farmers and the rough life style characterizing the Back Country. The Low Country aristocrats feared being overwhelmed and out-voted by anti-slavery, anti-aristocracy forces from the Back Country and therefore kept the control of South Carolina's state government in their own hands. But the advent of the cotton gin and the subsequent spread of the cotton culture throughout the state lessened those fears. Slaves, plantations, aristocrats and genteel living now began to dominate the Piedmont as they had the coastal plains, convincing Low Country leaders that the perceived threats to their comfortable way of life had vanished. Representation in the legislature was now determined on a proportional basis, meaning that the more densely populated areas above the Coastal Plain now became equal participants in the governmental process. This acceptance by all sections of the state of this power-sharing arrangement signaled an end to many of the fundamental regional political differences within the state and is called the Compromise of 1808.
Early Railroads
The transportation system through South Carolina in the early 1800's was in need of great improvement. Charleston was the center of trade, but most crops were grown elsewhere. It was thought that canals would make the rivers more accessible to the farmers for commerce, but the canal system ultimately proved to be impractical and unprofitable. It was easier for the average person to travel from Philadelphia to Charleston than to go from Greenville to Charleston. Farmers in the Up Country needed a means of transportation in order to get their products to Charleston, and the merchants needed more trade to compete with other port cities. A prospective solution was to build a railroad that would provide easy transportation to the port city.
5-8
In response to these concerns, private investors in Charleston built the first railroad in South Carolina, extending 136 miles from Charleston to Hamburg, which is located on the Savannah River near the present-day city of North Augusta. At the time, this track was the longest railroad in the world. Their goal was to provide a convenient transportation link between the western counties of South Carolina and the Charleston port in order to siphon off a lot of the growing trade which had been using the Savannah River to reach the Georgia port in the city of Savannah.
The inaugural run of its first train, The Best Friend of Charleston, took place on Christmas Day, 1830, following three years of planning and construction by the South Carolina Canal and Railroad Company. At that time, one passenger described the inaugural trip with these words: "On the wings of the wind at the speed of fifteen to twenty-five miles an hour annihilating time and space and leaving all the world behind" (taken from the Resource and reference guide: American spirit and South Carolina history, by Pipes et. al.). The steam engine used for The Best Friend of Charleston was the first locomotive built in America for use in regular passenger service. It was constructed at West Point, New York, and then shipped to Charleston.
Only six months after its inaugural run, an explosion on board the Best Friend blew out the boiler and destroyed the engine. Apparently, a railroad worker was annoyed by the hissing of steam escaping from the boiler's safety valve and proceeded to stop the noise by holding down the valve, an action which allowed steam pressure to build up within the boiler until it finally exploded. The unfortunate worker did not understand the scientific principles which governed the workings of the steam engine and as a result was killed in the accident. A new locomotive, named the Phoenix was brought in to replace the Best Friend. The Southern Railway Company built a scale model of the Best Friend in 1928 to celebrate the hundredth anniversary of the South Carolina Canal and Railroad Company. Today, a replica of The Best Friend of Charleston is permanently housed at the South Carolina State Museum.
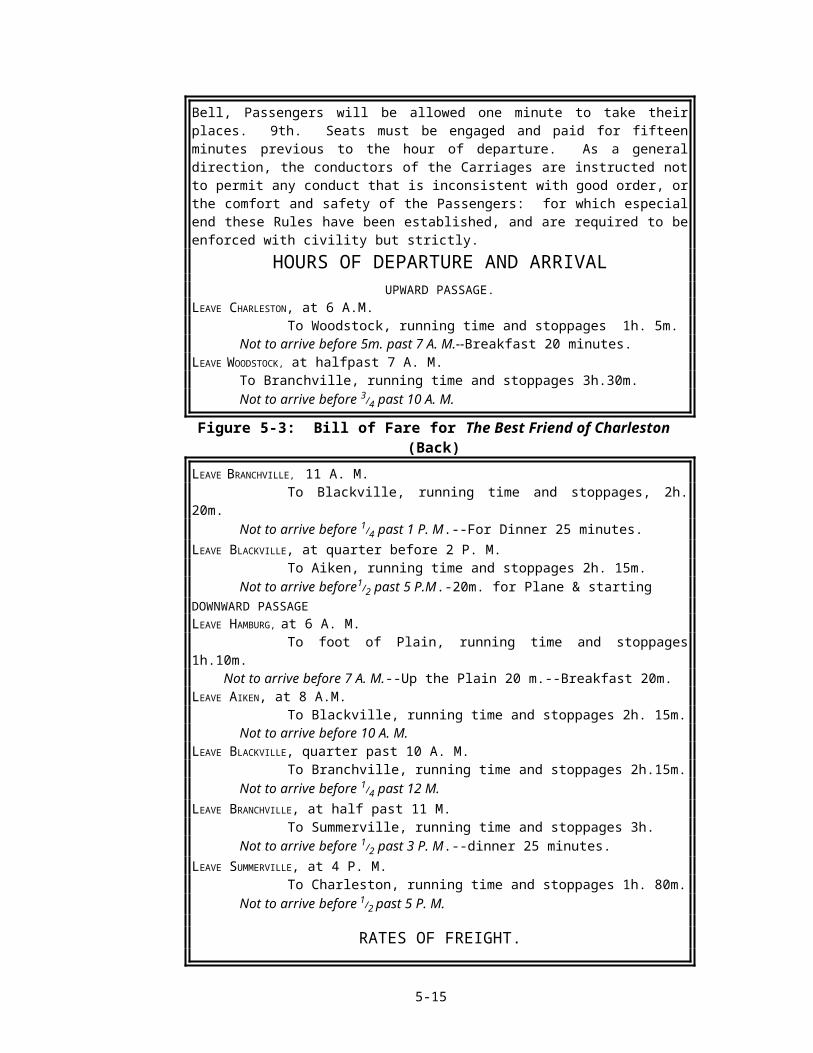
As railroad lines were added to crisscross South Carolina, many towns sprang up at junction points. One of the earliest of these towns was Branchville, in Orangeburg County, where a separate track to Columbia and Camden "branched off" the main railroad line. This location was selected because it was halfway between Charleston and Aiken. Even now, every September, a "Railroad Daze" festival is held in Branchville. These early railroads provided an important transportation link for farmers to market their products, miners to ship fertilizer made from phosphate, and loggers to transport harvested timber. An advertisement that appeared in Miller's Almanac describes arrival and departure times, charges, freight rates, and regulations for both the passengers and the freight carried aboard The Best Friend of Charleston. It is interesting to compare these items with current day transportation regulations in South Carolina.
5-9

Figure 5-2: Bill of Fare for The Best Friend of Charleston (Front)
SOUTH-CAROLINA RAILROAD,Between Charleston and Hamburg, S. C. opposite Augusta (Geo.)
Distance 136 miles, performed in daylight, from 6 A.M. to 6 P.M. President, John Ravenel. Directors--Wm Aiken, A. Black, Wm. Bell, J. J. Bulow, Dr. S. H. Dickson, John Dixon, H. F. Faber, John Haslett, B. J. Howland, Dr. Joseph Johnson, T. Tupper. Auditor. Henry Ravenel. Secretary, J. T. Robertson, Principal Engineer, H. Allen.
RATES OF PASSAGE. Miles $ Cts. Miles $ Cts. From Charleston to From Hamburg to Woodstock, -- 15 50 Aiken, - -- 16 75Summerville, -- 21 75 Blackville, -- 46 2 25Inabnet's, -- 321/2 1 621/2 Midway, -- 64 3 25Branchville, -- 62 3 00 Branchville, -- 74 3 75Midway, - -- 72 3 50 Inabnet's, -- 1031/2 5 121/2Blackville, -- 90 4 50 Summerville, -- 115 6 00Aiken, -- 120 6 00 Woodstock, -- 121 6 25Hamburg, -- 136 6 75 Charleston, -- 136 6 75 And from one intermediate Station to another, FIVE CENTS per Mile. Children under 12 years and Coloured persons, half price.
Regulations for the Passenger Carriage. 1st. All baggage at owner's risk--75 lbs. allowed. 2d. servants the not admitted, unless having the care of children, without the consent of all the Passengers. 3d. Passengers not allowed to stand on the outside platform. 4th. moking prohibited. 5th. No Gun or Fowling Piece shall be permitted to enter the Car unless examined by the Conductor. 6th. The feet not to be put on the Cushions, nor the cars to be soiled, defaced or injured in any way. 7th. Dogs not admitted into the Passenger Cars. 8th. At the ringing of the Bell, Passengers will be allowed one minute to take their places. 9th. Seats must be engaged and paid for fifteen minutes previous to the hour of departure. As a general direction, the conductors of the Carriages are instructed not to permit any conduct that is inconsistent with good order, or the comfort and safety of the Passengers: for which especial end these Rules have been established, and are required to be enforced with civility but strictly.
HOURS OF DEPARTURE AND ARRIVALUPWARD PASSAGE.
LEAVE CHARLESTON, at 6 A.M.To Woodstock, running time and stoppages 1h. 5m.
Not to arrive before 5m. past 7 A. M.--Breakfast 20 minutes.LEAVE WOODSTOCK, at halfpast 7 A. M.
5-10
To Branchville, running time and stoppages 3h.30m.Not to arrive before 3/4 past 10 A. M.
Figure 5-3: Bill of Fare for The Best Friend of Charleston (Back)LEAVE BRANCHVILLE, 11 A. M.
To Blackville, running time and stoppages, 2h. 20m.Not to arrive before 1/4 past 1 P. M.--For Dinner 25 minutes.
LEAVE BLACKVILLE, at quarter before 2 P. M.To Aiken, running time and stoppages 2h. 15m.
Not to arrive before1/2 past 5 P.M.-20m. for Plane & startingDOWNWARD PASSAGELEAVE HAMBURG, at 6 A. M.
To foot of Plain, running time and stoppages 1h.10m. Not to arrive before 7 A. M.--Up the Plain 20 m.--Breakfast 20m.LEAVE AIKEN, at 8 A.M.
To Blackville, running time and stoppages 2h. 15m.Not to arrive before 10 A. M.
LEAVE BLACKVILLE, quarter past 10 A. M.To Branchville, running time and stoppages 2h.15m.
Not to arrive before 1/4 past 12 M.LEAVE BRANCHVILLE, at half past 11 M.
To Summerville, running time and stoppages 3h.Not to arrive before 1/2 past 3 P. M.--dinner 25 minutes.
LEAVE SUMMERVILLE, at 4 P. M.To Charleston, running time and stoppages 1h. 80m.
Not to arrive before 1/2 past 5 P. M.
RATES OF FREIGHT.Per foot Per 100 lbs. Per foot Per 100 lb.
To Branchville, 7 cents 25 cents To Aiken, 23 " 45 " Midway, 8 " 28 " Hamburg 14 " 50 " Blackville, 10 " 25 " The above embraces all charges, (including Insurance from Fire while traveling) and one week's Storage.
CHARGES For labour and storage (not exceeding one week) 31/2 cents per hun-dred pounds, or 1 cent per cubic foot. After which storage to be charged at Charleston rates. N. B.--Hollow Ware not taken loose. Demijons, Jugs, and every description of Glass or Earthen Ware, not securely packed, to be at the owner's risk.
REGULATIONS 1st. Freight will be forwarded agreeably to the order of time it is received. That intended for the morning trip must be at the Depository by two o'clock the day previous, in good order, and marked the name of the station on the line it is to be left at, or it will not be received. 2d. Freight for Jerico and the other stations up to, and including Reeves', is payable at the Charleston Depository, and to be left at the place directed, at the risk of the owner. 3d. All freight must be paid for at the respective Depositories on its delivery.
5-11

4th. No package of any description, for any of the stations, entered on the freight list for less than 121/2 cents, and no receipt given for a less amount of frieght than 50 cents. 5th. GUNPOWDER prohibited.
5-12

Slavery
Slavery is a system of labor in which certain people are owned by other people as property, deprived of their rights and forced to work for their owners. Slavery was brought to South Carolina by the first white settlers in 1670 and quickly became an essential part of the agriculture of South Carolina, continuing until emancipation in 1865. In South Carolina, as in the rest of the Western Hemisphere, slavery took on a racial dimension. Only descendants of Africans were enslaved, and the presumption for almost 200 years was that everyone with brown or black skin hues was a slave. The labor of generations of slaves made possible the prosperity of South Carolina in the years before the Civil War.
Traditionally, historians have viewed slaves and slave life from the point of view of individuals who were treated as dehumanized creatures subject to the will of their owners and white society. In recent years, historians have begun to emphasize social development and community building in their discussions of slavery. Some argue that in spite of the oppressiveness of slave life, slaves were still able to create a life and a society for themselves independent of their masters. Building that community structure enabled slaves to be supported psychologically and to survive some of the difficulties of slavery. The typical slave community was founded on distinct customs and strong religious experiences. These values helped to balance, somewhat, the typically poor treatment slaves received and ensure that a population of more than 400,000 would be around to welcome freedom in 1865.
King Cotton
Cotton cultivation did not take over South Carolina agriculture and life until the 1790's when, with the invention of the cotton gin, the age-old problem of finding a labor-effective way to separate the seeds from the fibers was solved. Previous to that time, rice and indigo were the only staple crops for South Carolina farmers. By 1810, cotton had expanded until it was grown in every section of the state. At that time over 50% of the cotton grown in the country came from South Carolina, and total acreage put into cotton continued to expand. In 1920, cotton production peaked in the state with a total of 1.6 million bales produced. The growing, processing, selling, transporting, and thinking about cotton by so many people created a type of "cotton culture" that dominated the lives of South Carolinians until the 1960's. Growing cotton always meant more than just making money from the crop, for as Ben Roberston said in Red Hills and Cotton, "Cotton with us is almost human...Sometimes I think a Southerner's idea of heaven is a fine cotton-growing country. . . ." Although cotton is no longer King in South Carolina, its legacy remains in the exhausted fields and severely eroded gullies found in many parts of the state. For better or worse, cotton has been an essential part of South Carolina culture and history.
5-13

Figure 5-4: Map of 1860 Cotton Distribution
Figure 5-5: Map of 1981 Cotton Distribution
5-14

Wise Sayings, Folk Ways, and Good Luck Charms
Wise sayings, folk ways, and good luck charms are as old as civilization itself. Different parts of the world and different cultures have many different customs and associated fables, proverbs, and sayings. In the United States, because it is made up of so many different cultures, we have a wide variety of sources of sayings and folk ways. In South Carolina, you will even find significant differences between beliefs held in the Up Country and beliefs held in the Low Country.
Often there is an element of “truth” or common sense in these sayings, many of which are still prevalent today. For example, local farmers still say that the best time to plant a spring vegetable garden is on Good Friday, the Friday before Easter. We’ve all heard the story about the groundhog coming out on February 2nd. If he sees his shadow, then the backbone of winter will not be broken, and cold weather will continue for another six weeks. Or, "a cold winter is followed by a long, hot summer," and "when large drops of rain fall, it will not rain for long."
There are, of course, lots of good luck and bad luck sayings. We have all heard of, and probably used, lucky charms. The old folks say that to have the best kind of luck a person should always have about him the left hind foot of a rabbit that has been killed at midnight in a graveyard in the dark of the moon. Folks even made a living selling luck charms in the old days. Rebecca Godbold, a nineteen year old girl, used to peddle her good luck charms in Marion to make extra money. For 50 cents you could buy "Lucky Perfume Drops," "Courtin’ Powder," "Follow Me Boys," or "Follow Me Girls." And if those worked too well, you could also buy "Get Away Powder"! The two super duper deluxe one-dollar charms were "Lucky Bags" and "Sure Luck Oil." Both of these were supposed to keep you “in the money.”
Wise sayings, folk ways, and luck charms are interesting to collect and research. More often than not, there’s a story behind that saying or charm. Just ask! You’ll find out! Here are some other examples of what folks living in South Carolina in the late 1800’s were saying. Who knows how many generations back they might have been saying these very same things. Someone that you know might have even said one of these phrases to you lately.
Wise Sayings and Good Luck CharmsBy Lyn Zalusky Mueller
* Small children sweeping will bring visitors.* Company is sure to come if a rooster crows on the doorstep.* If the palm of your hand itches, scratch it by rubbing it on wood, and you will get money.* A dream told before breakfast will come true.* Throw a kiss at a redbird, and you will see your sweetheart within
an hour.* When you have killed a snake, hang it with its belly to the sun, if
you need rain, and you will get what you need.* To avert the bad luck of a rabbit crossing your path, turn your hat
around.
5-15
Strange Stories and Legends
Most rural areas have a host of legends and folk tales about both real and imaginary people who have had an impact on a small town or a local neighborhood. Like stories about UFO's (unidentified flying objects), most involve some semblance or aspect of a non-scientific occurrence or supernatural event. Often these stories involve reports of strange sightings along dark rural roads or in abandoned houses. They rarely take place in crowded rooms or populated public places. Some of these tales are funny while others are supposed to be scary. But some of the best are the ones local folks claim are true, like this one.
The Vanishing GirlRetold by Libby W. Carnohan
The road from Charleston to Columbia was especially dark except for the single stream of light from a shadowy moon. The couple drove on eager to get home and go to bed. They had been visiting a sick relative in Charleston. Their conversation was abruptly interrupted when the man driving the car swerved to miss a young girl walking along the edge of the road. She was dressed in pink satin and white lace and carried only a single rose. The sight of her was so unusual that at first the wary travelers thought that they were mistaken. They slowed, and there in the moonlight the girl stood motioning for them to stop. The couple immediately stopped and asked if the girl needed to be taken somewhere. She replied, "Yes, I must get to the hospital in Columbia. My boyfriend was in an accident, and they took him there. I have to see him." The couple explained that they were going to Columbia and would be glad to help. The wife leaned forward to allow the young girl to get in the back seat. The couple tried, but couldn't get the girl to answer any of their questions. All they heard from the back was a faint whimpering. Finally, the soft noise stopped and the couple tried again to find out more about the accident. This time when the girl did not respond, they stopped and turned around to see if she was all right. Much to their amazement, the seat was empty. The girl had vanished.
So shaken by the incident, the wife insisted that they go to the hospital in Columbia to check on the condition of the young man. No one at the hospital knew anything about an accident. No young man had been admitted that evening or the evening before. The couple grew more and more frightened. They returned to their car and carefully checked the interior. There under the front passenger's seat, they found a single white rose.
Years later, the couple's grandchildren were visiting with them. The children told them a ghost story they had heard at school. As they told it, there is this young girl who wanders the roads between Charleston and Columbia searching for her boyfriend who was killed in a car accident on the night of their senior prom. Only the truth is, both the
5-16

young man and the young girl were killed in that accident that night on that lonely road.
5-17
Natural Resources, Land Use, and Environmental Concerns
Climate and Water Resources
The climate of the Coastal Plain Region is classified as temperate, with a 200-- 250 day growing season and an average annual rainfall of 46 inches. As the rivers enter the Coastal Plain from the Piedmont, they begin to meander and to form broad floodplains or bottomlands. These areas are often seasonally flooded and serve as important water storage and aquifer recharge areas. Groundwater is easily and uniformly available from the deep coastal sedimentary rock layers and wells commonly yield up to 200 gallons per minute. Some flowing (artesian) wells also occur, particularly in the Upper Coastal Plain. Although the quantity of water is not a problem, the quality of both ground and surface water is a concern in many areas of the Coastal Plain.
Soils and Land Use
Coastal Plain soils form on top of a variety of sediment types, from coarse sand to fine clay. Most have a loamy to sandy clay subsoil and good surface drainage but possess only moderate to poor internal drainage. The inherent fertility and organic content of these soils are classified as moderate, but where drainage is good, favorable soil texture exists. This makes the Coastal Plain soils some of the best farmland in the state. At lower elevations soils are excellent, as long as sufficient drainage is provided, and this area has become South Carolina's major agricultural belt. In the very lowest areas drainage can become a major problem, making such areas unsuitable for regular agricultural use but very favorable for the growth of floodplain forests.
Agricultural practices have developed somewhat differently in the Upper and Lower Coastal Plain sub-regions. In the higher elevation Upper Coastal Plain, approximately 24% of the land is considered to be prime farmland. About half of this is covered in cropland and about half in forest. The major cash crops are cotton, corn, and soybeans. Farms tend to be large and cover a variety of Coastal Plain landscape features with the exception of river floodplain swamps.
In the lower elevation Lower Coastal Plain, poor drainage makes large acreages of land unsuitable for row crops. This land, however, is very well suited for the bottomland hardwoods and pines which have been planted extensively throughout the region. Farmland is usually restricted to isolated upland regions which act as broad drainage divides between the very wet coastal marshes and floodplain swamps. About 15% of the area is considered to be prime farmland, and approximately half of this total is open land with the remainder being forested.
The Timber Industry of the Coastal Plain
5-18

From the beginning of European settlement, South Carolina's great forests of longleaf pine and cypress invited entrepreneurs to turn trees into commodities for sale in the West Indies and the British Isles. From as early as 1680, timber was an important trade item in the state, and a large number of auxiliary enterprises were supported by the lumber industry from 1680 to 1830. During that period, merchants, sawmill operators, teamsters and rivermen all prospered from the cutting of the forests. However, by 1830 much of the forest land had been turned into cotton fields. For decades after, little interest was shown in re-developing a lumber industry in South Carolina. But as cotton lands wore out and became useless for agriculture, growing trees on that land for commercial use became an attractive alternative. By the 1890's, when professional forestry had become established in the United States, cutting trees had again become a prosperous enterprise in the state. The industry has since expanded greatly so that it now represents a substantial portion of South Carolina's economy. The orderly plantings of long miles of pine trees along Coastal Plain highways testify to this recent economic resurgence.
Agriculture of the Coastal Plain
Although farming as a way of life has declined in importance in many parts of South Carolina over the past fifty years, it is still a very important land use in certain counties. Almost 50 percent of the Coastal Plain Region is used as cropland or pastureland. This area is the largest row crop farming area of the state, with corn, soybeans, melons, peanuts, and cotton being the favored crops. Closer to the coast, where the low elevation of the land has prevented farmers from draining the wet soils, the primary land use is timber and pulpwood production. This area is commonly known as the flatwoods. It includes large expanses of longleaf and loblolly pine forest which support one of the state's most productive and popular deer and turkey hunting areas.
In farmland areas which are no longer profitable, many of the old fields have been allowed to return to native pines or have been planted in loblolly pines by private individuals or timber companies. These practices have resulted in the pine dominated Coastal Plain landscape we see today.
Unique Natural Habitats in the Coastal Plain
When colonists first arrived in South Carolina, millions of acres of pristine bottomland hardwood forest existed within the state. Today, the preserved natural habitat is measured in thousands of acres and even that amount is under increasing pressure from timber and agricultural interests for development. Several parks, preserves, and wildlife refuges in the Coastal Plain region serve to highlight unique environments as well as to protect rare or endangered plant and animal species. In addition to the Congaree Swamp National Monument in Richland County, other protected areas include the Webb Wildlife Center in Hampton County, Savannah National Wildlife Refuge in Jasper County, Wambaw Creek Wilderness Area in Berkeley and Charleston counties, and the Francis Beidler Forest located in Four Holes Swamp, Dorchester County. These last two wilderness areas highlight swamp regions,
5-19

which are now protected from increasing development pressures, forming a last refuge for a host of endangered plants and animals. All of these areas serve as reminders of the Coastal Plain's greatest natural resources: extensive forests, fertile soil, and abundant wildlife.
Although Coastal Plain forests are dominated by pines, many other kinds of trees contribute to the region's natural landscape. On higher ground in the Upper Coastal Plain, especially on bluffs overlooking rivers, a pine-hardwood forest dominates. This classification consists of primarily loblolly pine, hickory, and various oaks. On lower slopes, the wetter conditions are preferred by white oak, laurel oak, water hickory, overcup oak, cypress, and tupelo gum. True swamps, particularly in the Lower Coastal Plain, are dominated by baldcypress and tupelo gum stands. Swamp trees often have flared bases for support, and cypress knees project above the water or wet soil.
Even though the Coastal Plain is largely forested, there are scattered areas of open grasslands called savannahs, most notably in the Lower Coastal Plain. Dominated by various grasses and sedges, and longleaf pine or pond cypress, savannahs usually are associated with a high water table or ponding of water for considerable periods of time. Forest fires during dry periods are another important factor contributing to savannah formation, because fire destroys competing vegetation and encourages the growth of fire-tolerant species.
Freshwater Fisheries
In recent years impoundments within the state, especially lakes Marion and Moultrie, have become the sites of significant recreational fishing. Striped bass, hybrid and large mouth bass, and catfish are important fish for recreational purposes. The rise of fisheries is a reminder that until 1830 the rivers of South Carolina provided a supplementary income to large numbers of people who caught sturgeon, salmon, bass, and shad in great quantities. But overfishing and the large amount of sediment carried by streams eroding topsoil from agricultural fields ended hopes for a significant fishing industry. Only within the past six decades, with careful management practices, has fishing been restored to an important place in South Carolina life.
Phosphate, Limestone, and Other Rock Resources
Sand and gravel production is the most common mining activity in all of South Carolina, but it is particularly widespread in the Coastal Plain Region. The primary industrial use of sand and gravel is as an aggregate in concrete and asphalt. Other uses include sandblasting, filtration, glassmaking (pure sand only), and fill material. Clay is also mined extensively in the Coastal Plain. Clays are used in the manufacture of bricks and cement. A particular type of silica-rich clay, opaline claystone, also known as fuller's earth, is found in Sumter County, near Pinewood. Fuller's earth is a highly absorbent form of clay which becomes even more absorbent when heated to very high temperatures. It is marketed as an oil and grease absorbing agent in the
5-20
rubber, plastics, and cleaning industries, but is perhaps best known as the major absorbing component of kitty litter.
Limestone quarries dot the landscape in the central area of the Coastal Plain surrounding Lakes Marion and Moultrie. This is the region where the Santee Limestone formation is exposed at or near the surface of the land. In 1993, limestone products were the most valuable mineral commodity in the state, with total sales exceeding 100 million dollars. Much of the limestone is actually a mixture of lime and clay, called marl, which is ideal for the production of portland cement. South Carolina produces more portland cement per year than any other Southeastern state. The largest production facility is the Giant Portland Cement plant near Harleyville in Dorchester County.
The phosphate industry was once important in some Coastal Plain counties but has not been active during the past fifty years. In the late 1800's and early 1900's phosphate sands and pebbles were dredged from river basins of several Coastal Plain rivers, primarily the Wando, Cooper, and Ashley. The primary use of this material was for agricultural fertilizer. Although huge amounts of phosphate reserves probably still exist in both onshore and offshore sediments of South Carolina, most beds are only a few inches thick and mining is no longer economically feasible.
A very small peat industry exists in South Carolina, primarily in Colleton County. The peat is extracted from bog and floodplain deposits along coastal rivers. It is marketed as a soil conditioner and can also be used in wastewater treatment as a filter. Uranium-rich sands in Dillon County may be a future economic resource, but no mining operations are currently planned.
Summary
The Coastal Plain landform comprises the largest geographical division in South Carolina. Geologically, 20 to 30 million years ago it was covered by waters of the Atlantic Ocean. During this time, rivers deposited a variety of materials from the Piedmont and Blue Ridge regions, sediments that, after the ocean retreated, formed a diversity of landforms on this generally flat plain. The soils are of excellent quality and support the major agriculture belt of the state. Several river systems draining the state form floodplain swamps which contain abundant hardwood forests and wildlife.
Native Americans found the Coastal Plain to be hospitable to their way of life, but their ways did not sustain them in the conflict with the technologically superior European culture. Other conflicts played themselves out on this large, fertile plain: battles of the Revolutionary War, slavery, the rise of railroads and the demise of canals, cotton as King and its fall, progress and conservation, and the costs and benefits of major developments such as the Santee Cooper Project, which provides electricity and recreation for many residents of South Carolina. Historically, the need to get produce to the markets of Charleston, the flat topography of this region, and the slow-
5-21

moving, meandering rivers contributed to the pioneering efforts made towards early transportation systems, both canals and railroads.
Now there are concerns that prime farm land is disappearing to developers, timber is being cut at alarming rates, and wildlife habitat is decreasing dramatically. Even with the large number of national and state wildlife preserves, the public must become aware of proper conservation practices so that the ecological balance is not disturbed to the point that future generations can no longer enjoy the unique environments and productive farm land of this region.
5-22

PLACES TO VISIT (
Webb Wildlife Center. For information and directions call 803-625-3569.
Wambaw Creek Wilderness Area, Francis Marion National Forest. For information call 803-336-3248, 803-825-3387 or 803-887-3311.
Old Santee Canal State Park. Off R.C. Dennis Boulevard in Moncks Corner, at 900 Stony Landing Road. For information call 803-899-5200.
REFERENCES AND RESOURCES :
Derrick, S.M., (1930). Centennial History of South Carolina Railroad. Columbia, SC: The State.
Fairey, D. A. (1988). South Carolina's Land Resources: A Regional Overview. Columbia, SC: South Carolina Land Resources Conservation Commission.
Jones, L. P. (1985). South Carolina: One of the Fifty States. Orangeburg, SC: Sandlapper Publishing Co., Inc.
Kovacik, C. F. and Winberry, J. J. (1989) South Carolina: The Making of a Landscape. Columbia, SC: University of South Carolina Press.
Mancke, Rudy. ETV (Producer). (1983). Nature Scene. (Videotape Series). Lesson 13, "Savannah National Wildlife Refuge." Columbia, SC: SC ETV.
Mancke, Rudy. ETV (Producer). (1979). Nature Scene. (Videotape Series). Lesson 19, "Wildlife Refuge." Columbia, SC: SC ETV.
Murphy, Carolyn Hanna. (1995). Carolina Rocks. Orangeburg, SC: Sandlapper Publishing Co., Inc.
Pipes, D. H., Weir, R., Bridwell, R., Ford, L., and Jones, L.P. (1982). Resource and Reference Guide: American Spirit and South Carolina History. Chicago, IL: Follet.
William Stephen Harley from Memories of Home: Reminiscences of Ellenton (1996) by Tonya Algerine Browder and Richard David Brooks.
Pipes, D. H. ETV (Producer). (1988). South Carolina Geography (Videotape Series). Lesson 6, "The coastal plain." Columbia, SC: SC ETV.
Pipes, D. H. ETV (Producer). (1988). South Carolina Geography (Videotape Series). Lesson 2, "Railroads, rivers, roads, highways, and regions." Columbia, SC: SC ETV.
5-23

WPA Files, South Carolina:
"Luck Charms." Prepared by Annie Ruth Davis, Marion, December 29, 1936.
"Luck Charms." Prepared by Annie Ruth Davis, Marion, February 2, 1937.
"Folk Ways (Lancaster County)." Prepared by Mrs. B.M. Paul, not dated.
"Superstitions." Prepared by C.H. Webster, March 8, 1936.
5-24

STUDY AREA 5: COASTAL PLAIN OVERVIEW
Activity 5-1: Overview
Materials
6 STATE BASE MAP #1, SHADED RELIEF 1 : 500,0006 STATE BASE MAP #2, WITH HIGHWAYS 1 : 500,0006 LAND USE/LAND COVER MAP 1 : 500,0006 GENERAL SOIL MAP 1 : 594,0006 GEOLOGIC AND MINERAL RESOURCE MAP 1 :1,000,0001 Revolutionary War Campaigns in South
CarolinaFigure 1-10
1 Map of 1860 Cotton Distribution Figure 5-41 Map of 1981 Cotton Distribution Figure 5-51 Map of Antebellum Railroads - 1860 Figure 1-121 Bill of Fare for Best Friend of Charleston Figure 5-2, 5-36 Wipe-off Pens
PERFORMANCE TASKS(Icon Key) Overview = Q; Science = R; Math = :; History = :; Language Arts = ?
1. Describe topography of Coastal Plain. QUsing the STATE BASE MAP #1, SHADED RELIEF, trace with a wipe-off pen the boundaries of the Coastal Plain Region. Describe the typical landscape appearance of the Coastal Plain. Name the major reservoirs, watersheds, and urban areas in the Coastal Plain Region. Identify and locate at least two river systems that originate in the Coastal Plain Region of South Carolina. Compare the paths and features associated with these rivers to river systems that originate in the mountains, such as the Santee and the Pee Dee. Trace the paths of all these river systems and record any name changes as they flow seaward. Which category of river system contains the most name changes? Why do some South Carolina rivers change their names so often? Is a good idea to have different names for the same river? Explain.
2. Examine land use in Coastal Plain. QTrace the Coastal Plain boundaries with a wipe-off pen onto the LAND USE/LAND COVER MAP. What land use/land cover is concentrated around Coastal Plain rivers and streams? Some maps and texts divide the Coastal Plain into an Upper and a Lower region. What evidence would you use to make this division? What land use dominates the Upper Coastal Plain? What land use dominates the Lower Coastal Plain? Trace your best estimate of the Upper / Lower Coastal Plain boundary onto the map with a wipe-off pen.
Draw in the approximate position of the Orangeburg Scarp (Citronelle Escarpment) with a different color wipe-off pen. You may have to refer to
5-25

the STATE BASE MAP #1, SHADED RELIEF, to help you locate this feature. The line should go through the towns of Allendale, Orangeburg, Sumter, Hartsville, and Bennettsville. How closely does the Orangeburg Scarp line up with your land use boundary line? Compare your results with those of other groups. Explain any significant differences in the placement of your boundary lines.
3. Compare drainage patterns of Upper and Lower Coastal Plains. RAssign each group one of the following drainage patterns to trace with a wipe-off pen on the STATE BASE MAP #1, SHADED RELIEF. Compare the map tracings, identify major differences, and explain why such differences exist.Group I Lower Coastal PlainLocate Williamsburg and Georgetown counties. Trace the drainage pattern of the Black River and its tributaries within these counties. Note the sharp bend in the Black River in Georgetown County. This deflection marks the location of a former marine terrace which has diverted the normal drainage. Using this drainage pattern as your key, locate similar terraces or escarpments in Dorchester and Berkeley counties. How would you describe such a drainage pattern? Why is this drainage pattern more common in the Lower Coastal Plain? Compare your results with other groups. What conclusions can you draw?Group II Upper Coastal PlainLocate Aiken County. This county is mostly in the Upper Coastal Plain Region and shows a typical Coastal Plain drainage pattern. Trace the stream drainage patterns of the South Fork Edisto River and its tributaries within Aiken County. This resulting dendritic (branching) pattern is typical of flat homogeneous landscapes. Using this drainage pattern as your key, locate similar drainage patterns in Sumter and Darlington counties. Why is the dendritic pattern more common in the Upper Coastal Plain? Compare your results with other groups.
4. Estimate amount of swampland in Barnwell vs. Marion counties. RLocate Barnwell and Marion counties on the STATE BASE MAP #1, SHADED RELIEF. Note that these two counties are approximately the same size even though they are shaped differently. Use the map symbols to locate the swamp land in each county. Estimate the percentage of swampland in each county. Which county has the most swampland? Which county is in the Upper Coastal Plain? Which county is in the Lower Coastal Plain? Why is there a difference in the amount of swampland?
5. Compare Coastal Plain soils. RUsing the GENERAL SOIL MAP, identify the soils of the Sandhills and the Upper and Lower Coastal Plains. Do soil types cross boundaries? Use the GEOLOGIC AND MINERAL RESOURCE MAP to relate each soil type to the underlying geology. Which soil differences can be attributed to geological differences? How can you explain other soil differences? How have soil characteristics affected the vegetation and land use of each region?
6. Locate major crop belt in South Carolina. R
5-26

The Upper Coastal Plain contains the most extensive and most concentrated crop belt in South Carolina. In this region, farming is the major source of income for the majority of the population. On the GENERAL SOIL MAP of South Carolina this region is called the Southern Coastal Plain. Make a list of all the counties which contain at least some "Southern Coastal Plain" soil. Next, look at the LAND USE/LAND COVER MAP and notice that yellow is assigned to Agricultural/Grassland land use. For each of the Upper Coastal Plain counties on your list, estimate the percentage of the county which is designated yellow on the map. Select the top ten Coastal Plain counties, in terms of agricultural productivity and list them, in order, on a separate piece of paper. Use a wipe-off pen to shade in those ten counties on the STATE BASE MAP #1, SHADED RELIEF. What do all these counties have in common? Are they bunched together geographically or widely separated? Why are these counties good places for agricultural production? Why is the Lower Coastal Plain not as productive for cropland? Relate the crop belt area to the landform regions of South Carolina.
7. Analyze changes in cotton production. RStudent groups should complete one of the investigations listed below. Compare results and draw conclusions about cotton production in South Carolina. Use these questions as a guide for group discussion. Explain the meaning of the phrase "King Cotton." When was cotton "King"? Discuss advantages and disadvantages of South Carolina's one crop economy system. What are some problems associated with a one crop economy system? In which of the five landform regions was cotton grown in the 1860's? In 1981?
Group I Which counties produced cotton in 1860?Carefully examine Figure 5-4, "Map of 1860 Cotton Distribution." On this map the data were collected based on bales per capita and divided into five categories. On the STATE BASE MAP #2, WITH HIGHWAYS, use different colored wipe-off pens to indicate which counties were included in each of the five categories. Make a list of your data. Why did the map makers select five categories instead of seven or eight or two or three? Is your school located in the old cotton belt of South Carolina (.60 bales per capita or greater)?
Group II Which counties produced cotton in 1981?Carefully examine Figure 5-5, "Map of 1981 Cotton Distribution." The data on this map are reported as harvested acres as percent of land. The four categories are indicated by the intensity of shading. On the STATE BASE MAP # 2, WITH HIGHWAYS, use different colored wipe-off pens to indicate which counties were included in each of the four categories. Make a list of your data. Why did the map maker select four categories instead of five or six or two or three? Is your school located in the 1981 cotton belt of South Carolina (equal to or greater than .5% harvested acreage)?
8. Trace route of The Best Friend of Charleston. R:South Carolina's first railroad locomotive, The Best Friend of Charleston, began running in 1830 from Charleston to the town of Hamburg, which is located on the Savannah River near the present-day site of North Augusta. Trace with a wipe-off pen the Charleston-Hamburg railroad track on the STATE BASE MAP #1, SHADED RELIEF, using the data from Figure 1-12, "Map of Antebellum Railroads--1860." Locate as many station stops as
5-27

possible, listed on Figures 5-2 and 5-3, the "Bill of Fare for The Best Friend of Charleston." Estimate the percentage of stations not listed on the map. A second line was soon added at Branchville, connecting Columbia and Camden with Charleston. Use a wipe-off pen to trace this railroad line. Identify the rivers and swamps that had to be crossed. Is there a railroad running along the same route today?
5-28

9. Make time table for railroad using the Bill of Fare. ::Look at the list of stations shown on Figures 5-2 and 5-3, the "Bill of Fare for The Best Friend of Charleston." How many of these places are listed on the STATE BASE MAP # 2, WITH HIGHWAYS? Why are some of these stations not shown on the map? Calculate the average distance between stops. What factors determine how far apart stations should be and how many total stations there should be? How much was a one-way fare from Charleston to Hamburg? How have passenger and freight regulations changed since 1833? What do you think a "Demijon" might be? Why would gunpowder be prohibited on the train? Fill in the time chart below using the information contained on the Bill of Fare. Determine the average speed of The Best Friend of Charleston. Notice that freight rates on the Bill of Fare were quoted per cubic foot or per 100 lbs. Customers paid the higher of the two computed amounts. In 1835, what would it have cost for you to travel to Hamburg with a box weighing 50 pounds and measuring 12" by 18" by 24"? Would you receive a receipt for this package? Where do you think boxes were placed while you traveled?
TIME TABLE FOR THE BEST FRIEND OF CHARLESTON
STATION MILESFARE
(CENTS)
DEPARTURE
TIME
RUNNING
TIME
ARRIVALTIME SPEED
Charleston 0 0 6:00 AM --------- --------- ---------WoodstockSummervilleInabnetBranchvilleMidwayBlackvilleAikenHamburg
10.Distinguish between out of date terms and printing errors. ?The "Bill of Fare for The Best Friend of Charleston," Figures 5-2 and 5-3, contains several apparent mistakes according to modern English usage. Some of these are old phrases, spellings, and terms which were in common usage in 1835 but are no longer in use today. Others are actually mistakes. Read through the Bill of Fare carefully and find at least one example of a printing error and at least three examples of out of date spellings or phrases. How can you distinguish between mistakes and former usage?
11.Make up a strange tale or legend like "The Vanishing Girl." ?Divide into groups. Read aloud the story of the "The Vanishing Girl," on page 5-14. Use your own school setting to make up a similar story using
5-29

characters and landmarks familiar to students in your group. Take turns sharing your story with other groups.
12.Design flags for your county and state. :Explain the historical reasons for including certain symbols on the official South Carolina state flag. Then, using your South Carolina history textbook as a resource, design a new modern flag for South Carolina that would represent a variety of events or objects which have made a significant impact on the state's history and diverse cultures. Prepare a statement explaining the symbols you selected and the way items represented by these icons have played a part in the state's development.
Share your ideas and flag with your classmates. Also design a County Flag or a School Flag for your local area. Again, explain your use of symbols. How many of your symbols are specifically related to landforms or natural features?
13.Make list of wise sayings and folk ways. ?:Read through the list of "Wise Sayings and Goodluck Charms" on page 5-13. Brainstorm in small groups for ten minutes, with one student serving as scribe for each group, to see how many additional wise sayings or folk ways you can list. If you can remember the source of the wise saying, have the scribe make a note of that. Review the lists across groups to come up with a complete class list. How many of these wise sayings are common in your neighborhood or local area? Invent additional wise sayings or proverbs and create short tales to accompany them. Write the list of new wise sayings on the board. Divide into new teams. Have each team member tell a tale and see if his or her teammates can guess the corresponding wise saying from the list on the board.
14.Locate Marion's military engagement. :Using a wipe-off pen, locate on the STATE BASE MAP #2, WITH HIGHWAYS, the site of Francis Marion's Revolutionary War engagement at Eutaw Springs. What were Francis Marion's contributions to the Revolutionary War? Why is he remembered as the Swamp Fox? How did you think specific landforms and landscape features might have affected the planning of his military strategy in South Carolina?
15.List places using Francis Marion's name or nickname. :Make a list of all the places, cities, streets, and companies in South Carolina that use Francis Marion's name or "Swamp Fox" as their nickname or mascot. Refer to the STATE BASE MAP #2, WITH HIGHWAYS, and any other cartographic products or other resources you may have available. What other famous persons have been memorialized in South Carolina place names, either locally or state wide?
16.Explain why Coastal Plain houses do not have basements. R
5-30
In contrast with buildings in other regions, houses in the Coastal Plain Region almost never have basements. Based on the geology and topography of the area, explain why basements are not usually desirable or possible for most Coastal Plain houses.
5-31

ENRICHMENT
1. Research Eli Whitney and George Washington Carver.:Find out how Eli Whitney's invention of the cotton gin provided South Carolina with a new staple crop, cotton, and why the cotton culture would not have been able to thrive without it. Cotton, as one of our main fabrics, can be used in a variety of ways. Research the many uses of cotton. What are the contributions that George Washington Carver made towards finding major uses for cotton by-products? Explain his impact on the cotton industry.
2. Research list of unique natural areas in Coastal Plain.RLocate the following natural sites and explain how each area represents a unique resource of the Coastal Plain.Webb Wildlife Center, Hampton Co.; Savannah National Wildlife Refuge, Jasper Co.; Wambaw Creek Wilderness Area, Berkeley and Charleston counties; Francis Beidler Forest (Four Holes Swamp), Dorchester Co.; Cathedral Bay Heritage Preserve, Bamberg Co.; Santee National Wildlife Refuge, Clarendon Co.
3. Collect song versions of "The Vanishing Girl" and similar legends. ?Strange tales like "The Vanishing Girl" on page 5-14 are common in cultures all around the world. Collect as many different versions of such tales as you can find and identify similarities and differences in characters and settings. Such stories sometimes end up as popular songs. Locate recordings of "Bringing Mary Home" (by The Country Gentleman), (Phantom 309 (by Dave Dudley), and "The Ride" (by David Allen Coe). Try writing your own short song about a "The Vanishing Girl."
4. Visit county agent to discuss cash crops. R:Telephone or visit the County Agent's Office to find out the total dollar value of all cash crops sold in South Carolina last year. Among tobacco, cotton, corn, and soybeans, which is the largest cash crop? What other cash crops are significant? How are each of these crops used? If cotton is grown in your county, determine how much cotton is currently planted in your area. How has local cotton production changed over the last twenty years? How does the cotton allotment system work? What part did the boll weevil play in the growing of cotton? Explain the boll weevil eradication program. How effective has this program been? Where is most of the cotton grown today in the United States?
5. Interview family members and list wise sayings. ?Create a community list of wise sayings and proverbs and publish it in the local or school newspaper. Ask readers to add comments about your list so that you can continue to expand it. Interview family members to compile a list of folk ways, proverbs and good luck charms. Publish it and give it to relatives as a holiday gift.
6. Plan class presentation on The Best Friend of Charleston. :
5-32

Visit the State Museum in Columbia and make a video or slides of the replica of South Carolina's first train, The Best Friend of Charleston. Research the history of this train and give an audio-visual presentation to the rest of the class.
5-33

STUDY SITE 5A: SAVANNAH RIVER SITE (HABITAT RESTORATION)
The StateThe State May 8, 1991
SRS Cleanup Could Harm Ecosystem, Scientist Said An environmental expert at the Savannah River Site opposes cleaning up part of the facility because it might cause more damage than the radiation. "Somewhere, we need to decide when to draw the line at cleanup. You can't clean up everything that has been contaminated," said Ward Whicker, a researcher at Savannah River Ecology Lab, operated by the University of Georgia. "I would argue, even though there are measurable levels of
to the public "because of the potential for lawsuits from people saying they got sick." "On the other hand, I am very much opposed to cleaning it up," he said. "Cleaning it would destroy the ecosystem. A bulldozer would do far more damage than the radiation." Whicker bases his conclusions in part on research at Pond B, a reactor cooling reservoir system abandoned about 25 years ago. The pond has fish and plant life, as well as some radioactive materials. "I agree with the
watchdog group, Energy Research Foundation. "But the question is long-term use." Whicker said much of the concern over cleaning up the nation's nuclear defense complex--estimated at more than $200 billion--is based partly on ignorance of what radiation can do. He said not all such sites are dangerous. Costner said not enough is known about radioactive contamination to make cleanup decisions. The Savannah River Site is the
RATIONALE
The Savannah River Site is a 300 square mile region of restricted access in the Coastal Plain of South Carolina that was chosen by the U.S. Atomic Energy Commission in the early 1950’s to be the primary manufacturing site for the government’s atomic weapons program. The original facilities produced plutonium-239 and tritium for the nation’s defense needs. As a result of this highly unusual and unique land use, a variety of hazardous materials, including radionuclides, volatile organic compounds, and trace metals, have been stored or disposed of on site. Over the last decade, under direction from the U.S. Department of Energy, the primary role of this facility has shifted from nuclear materials production to waste management and environmental restoration. Groundwater contamination is a continuing concern in this area due to the porous nature of some of the Coastal Plain geologic formations and the presence of buried faults. Areas of restored habitat are important test sites for demonstrating the use of advanced technology to clean up pollution.
5A-1

Brief Site Description
Introduction
The U.S. Department of Energy’s Savannah River Site (SRS) encompasses approximately 300 square miles of formerly private forest and farmlands in portions of three South Carolina counties. The largest portions lie in Aiken and Barnwell counties, with a much smaller section in Allendale County. The Savannah River, marking the boundary between Georgia and South Carolina, lies along the western edge of this large, nearly circular region that has been designated as a restricted area with limited public access because of the sensitive and dangerous nature of the work performed there. Visitors to the Savannah River Site must check in at a visitor center and receive a temporary entry permit which must be returned upon departure. They must also remain in the presence of an official escort the entire time they are on site. Away from the river floodplain, the remainder of the Site consists of fairly typical landforms of the upper or western edge of the Coastal Plain in South Carolina. The area is well drained by four major stream systems, plus the Savannah River. Many of the streams are unusually clear and straight, similar to Piedmont streams, because of the relatively high relief in this region.
Most of the Savannah River Site is currently covered by forests, with less than ten percent of the area actually used for buildings and facilities, such as the reactor areas and waste management operations. Forests of mixed types provide shelter and food for numerous animals, including some endangered species such as Rafinesques’ big-eared bat, found in habitats ranging from well-drained uplands to swamps. Timber operations throughout the site have had an important impact on habitat distribution. In 1972, the U.S. Department of Energy named the SRS an Environmental Research Park, and forestry and wildlife research took on a more important role in site management plans. Even with the presence of extensive forest tracts, over twenty percent of the area is actually classified as wetland. This designation includes streams, artificial reservoirs used to cool reactors, bottomland hardwood swamps, and Carolina Bays. Both wetlands and forests harbor a rich assortment of plants and animals.
Born out of the global tensions of the Cold War in the 1950’s, the Savannah River Site was originally conceived as a facility to manufacture nuclear weapons to support the nation’s defense effort. The secretive nature of this work, as well as the potential safety hazards, required that access to site facilities be heavily restricted and that people then living within the site boundaries be relocated. The original facilities produced plutonium-239 and tritium using high-capacity nuclear production reactors moderated and cooled by heavy water. Other functions of SRS have included chemical separation and purification of reactor products, storage and processing of nuclear wastes, environmental restoration activities, and development and transfer of experimental waste disposal technologies. The original private sector partner at SRS was Du Pont, although Westinghouse has managed operations since 1988. Major processing facilities consist of five nuclear materials production reactors (all of which were shut down at the time of printing - 1997), two separation areas capable of processing irradiated materials, a closed heavy water extraction plant, and a fuel and target fabrication facility.
5A-2

Old Ellenton and New Ellenton
Locating the Savannah River Site in this part of South Carolina was a purposeful decision by the management of the DuPont Company. This area had a very large and dependable flow of water, a relatively flat terrain that would permit quick construction, good transportation facilities, and a relatively small number of people who would have to be relocated. Only about 1,500 families lived on the property that was destined to become the Savannah River Plant (as it was first named). The town of Ellenton contained the largest population, 739 people, followed by Dunbarton with 231 people and a few even smaller communities. Most of the people were farmers, although there was one small industry, a banana crate factory, in the village of Leigh. A brand new town, New Ellenton, was established just north of the SRS boundary and displaced families were encouraged to move there. Some moved their houses intact to the new location, while others used the money they received for their property to build completely new homes there. The old school building at Ellenton was used for several years by the DuPont Company to train employees and develop specialized equipment, but most other buildings on the site were torn down. However, house foundations, street curbing, and sidewalks can still be seen in the former town areas. Flowering shrubs and other landscaping still provide clues to the location of the old home sites.
The initial allocation of 260 million dollars and the need for workers led to the belief that the construction and operation of the facility would bring many much-needed jobs to the region. Many of these people were disappointed when it became clear that everyone living on the site would be required to move. The uprooting of families from their land created some hard feelings, but most residents accepted their loss as a necessary contribution to the defense of their country. Some news media of the time took a sympathetic view of their position. “There’s a lot of bitterness in Ellenton and the people don’t mind letting you know it,” wrote Manuel J. Rogers in The News (Dec. 2, 1950). “Their lives are deeply rooted in the sandy soils of the section and they are unhappy at being uprooted and moved like crumbs brushed from a table.” Of course the people were paid fair value for their land and assistance was provided to those families unable to relocate themselves. Although many local residents were offered employment on site, the majority of skilled labor positions, especially during the construction phase, went to outsiders with prior work experience in technical fields.
The Move of Ellentoncompiled by Erik Caldwell
On November 28, 1952, a little after 12 noon, a radio announcement sealed the fate of the town of Ellenton, South Carolina.
"The United States Atomic Energy Commission today announced that its new production plants to be designed, built, and operated by the E.I. du Pont de Nemours Company of Wilmington, Delaware, will be located in Aiken and Barnwell counties, South Carolina, near the Savannah River. About 250,000 acres will be acquired for the site. Exact boundaries remain to be determined.
5A-3

The new site will be known as the Savannah River Plant. . . . To make way for the plants and the surrounding security and safety zone, it will be necessary for about 1,500 families to relocate in the next 18 months."
In her book, The Unexpected Exodus (1971), Louise Cassels, an elementary school teacher in Ellenton, remembers asking her sister, “Do you feel like someone in the family has just died?” Her sister, Mamie, replied “Yes, I do; and doom is certainly upon every home in Ellenton.” Later Ms. Cassels was asked about the move by a photographer, she responded, “We’re heartsick at being displaced; but if it’s for the good of the country, we’ll co-operate 100 per cent.”
When the country heard the news, people from all over came running to see the doomed town of Ellenton. William Stephen Harley described some of the events that followed.
"I’ll tell you this, the very first Sunday after the news broke, you could see a tag from just about every state in the Union coming down there to look. . . . when du Pont told us that, “ We are going to take ya’ll over,” they had a meeting in the gym. They had the meeting to kind of cool our nerves, you know. There was a du Pont official there telling us how good they were going to be to us and how much money they were going to pay us for our land and everything. We were just going to have heaven right here on earth! We had heaven already. We just didn’t know it, but I knew it."
The government agreed to buy the houses and property at fair market value as determined by appraisers. Once paid, the owners had to leave Ellenton. They could, however, buy their homes back at salvage prices, well below market value, with the difference in moneys being some compensation for moving. Some of the Ellentoians moved their reaquired homes north of the site to a new town called New Ellenton.
Phyllis Tisdale Boyd, a young child at the time of the move, reminisces about an early memory of home in the pages of Browder’s book.
"The only thing I remember about Old Ellenton is being put in the back of a Chevrolet we had, an old black Chevrolet. I had to watch the procession . . . from there, because they were afraid I’d get run over. . . But I wanted to watch it. I can even see it now, see these huge houses moving down the road. It was just amazing, a whole big chunk of houses moving."
March 1, 1952 was designated as evacuation day, but not all the moves went smoothly. The Cassels were unable to move into their new home in Aiken by the evacuation deadline because their new home was not completed. They notified a government official that they could not leave. He replied, “ Lock up your house just as it is, and get a boarding place.” Mamie Cassels responded, “You know as well as we do, there’d be nothing left in the house or on the premises by April. We’re not leaving.” They stayed until their home was completed, and Ellenton was finally vacated completely within the next month or two.
Louise Cassels concludes her book with an expression of ligering sadness mixed with pride and patriotism:
"Today, our little town of Ellenton is just a beautiful memory, one I’ll keep forever; no human agent can take that away from me. The sacrifice required
5A-4
was heartbreaking, but in no way is it comparable to the lives that have been given on battlefields for our Country. So we small town folk are proud to have played a part in helping to preserve and protect our United States of America."
The Sign at Ellentonby Jody Tinsley
A newspaper article in The Columbia Record on November 28th, 1950, announced in its large headline “GIANT ATOMIC PROJECT TO RISE NEAR AIKEN.” Smaller headlines continued, saying that “H-Bomb” material would be made at the plant and that 1,500 families would have to move. Additionally, the article stated that the United States Congress had appropriated $260,000,000 for the construction of the site. All of these facts mixed to form an uncertain or ambiguous attitude about the plant. Patriotic pride at being selected, the money and jobs brought by the huge construction project, the awe and wonder of the atomic age, and the sadness at being forced to move from old home sites and old home ways--these are all expressed beautifully in a photograph taken in Ellenton (on the SRS) a short time later.
This black and white photograph is of the Ellenton town limit sign. No houses or buildings of any kind are seen in the background, just empty fields and a two-lane road, equally empty except for an old man walking in the distance with a cane in one hand and a parcel of some sort in the other. Hand-painted signs on scraps of wood have been added above and below the town limit sign so that the whole sign reads as follows:
It is hard to understand why our town must be destroyed to make a bomb that will destroy someone else’s town that they love as much as we love ours, but we feel that they picked not just the best spot in the U.S. but in the world. ELLENTON; INCORPORATED. We love these dear hearts and gentle people who live in our home town.
These 64 words (if you count U.S. as 1) speak volumes, a 64 word poem about loss, but colored with hope and determination.
5A-5

Figure 5A-1: Topographic Map of Old Ellenton
5A-6
Figure 5A-2: Topographic Map of New Ellenton
5A-7
5A-8
Geology and Potential for Pollution
The Coastal Plain sediments beneath the Savannah River Site consist of Tertiary and Upper Cretaceous age gravels, sands, and clays, with small amounts of limestone. These layers form a wedge of sediments that thickens from the Fall Line toward the Atlantic coast. The depositional environments of these units have been interpreted as marine and near-marine conditions at a period of geologic time when the shoreline was thought to be positioned near the present day Sand Hills region along the Fall Line. Erosion by the Savannah River and its tributaries has exposed most of the thin sedimentary layers in the SRS area so that contacts between units can be mapped easily. Several of the sand and gravel units are highly porous and transmit significant quantities of water so they are referred to as aquifers. These aquifers may be susceptible to many types of pollution from operations at the SRS and are the focus of numerous ongoing studies to determine the possible presence and movement of contaminants.
One way that groundwater pollution spreads in the subsurface is through faults. Several faults have been discovered beneath the SRS which could possibly provide conduits for groundwater flow and permit the spread of pollution to uncontaminated aquifers that are not directly connected. Several of the major faults discovered at SRS are associated with the Dunbarton Basin, a previously downfaulted block of the earth’s crust that has preserved terrestrial sediments deposited during the Triassic Period of geologic time. Most of those original deposits were stream and lake sediments which accumulated in a rift basin (an elongated trough bounded by faults) formed by extensional tectonic forces related to the opening of the Atlantic Ocean and the beginning of continental drift between North America and Africa.
The previously downfaulted Triassic sedimentary rocks are wedged in between crystalline rocks of the Piedmont. Both the Dunbarton Basin and the adjacent crystalline rocks are overlain and buried by the typical Cretaceous and Tertiary sedimentary layers found throughout the SRS. The Pen Branch fault, which forms the northwestern boundary of the Dunbarton Basin, has been reactivated in a reverse sense due to compressional stresses after the initial normal faulting associated with extension. This reactivation occurred after the Triassic normal faulting but does not affect the Martin fault. The Martin fault, which forms the southeastern boundary of the Dunbarton Basin, has apparently not been reactivated but conclusive data concerning this fault has not been found. Some Cretaceous and Tertiary age northeast-trending faults, that indicate tectonic compression, have also been discovered on site. Only a small number of the faults have been located at the surface, but their position underground has been confirmed through test drilling of cores and by seismic-reflection profiling technology which uses sound waves to view the subsurface. This method works by bouncing sound waves off rock boundaries and picking them up at specified distances from the sound source. The sound waves are created at regular intervals and are recorded at regular intervals away from the the source and then analyzed. The analysis of the seismic data leads to the production of a seismic section which is very similar to a geologic cross section.
5A-9
Figure 5A-3: Geologic Cross Section of SRS
Figure 5A-4: Map View of SRS Showing Location of Faults
Environmental Restoration Efforts
5A-10
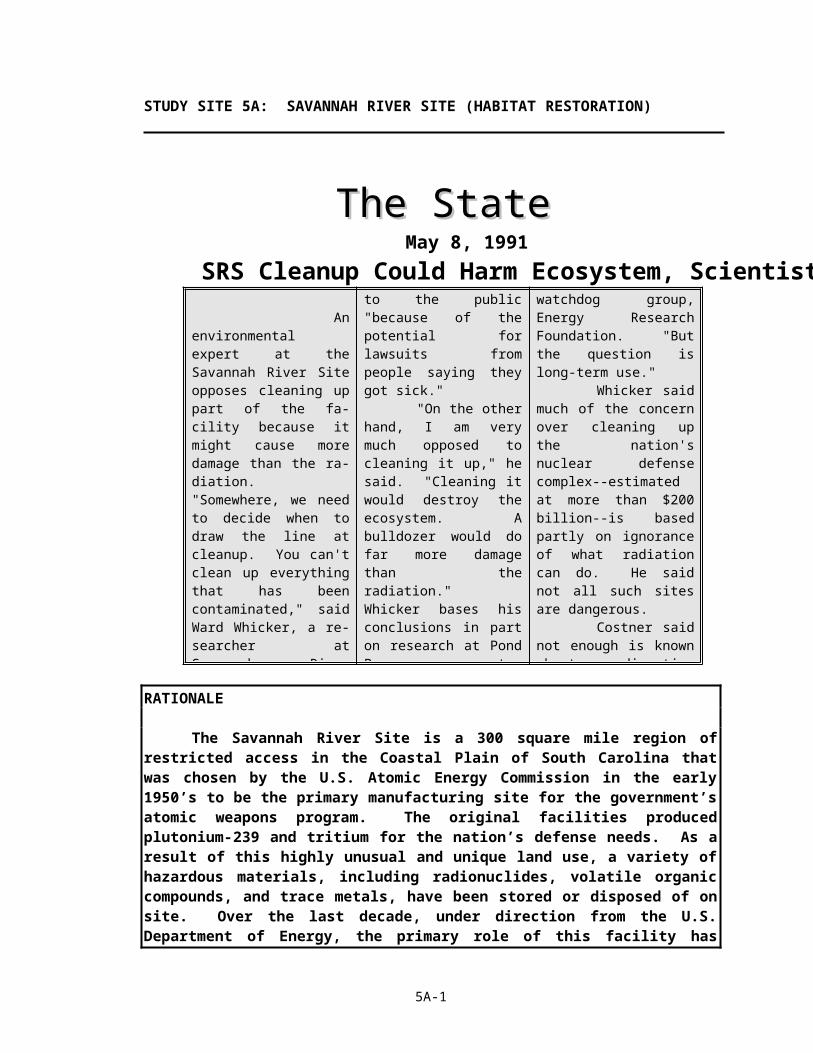
Over the past 40 years, researchers at the Savannah River Site have greatly advanced the study of waste disposal technologies and their impact on the environment. Radioactive wastes require a unique set of processing and storage methods. In recent years, the facility’s expanded roles of nuclear waste management, environmental cleanup, and environmental technology transfer have actually become more important than its original purpose of producing nuclear material. This research has also identified instances of localized contamination of soil and water at some of the site’s previous disposal facilities. Even though existing regulations were followed during the construction and operation of the site, both nuclear and non-nuclear contamination occurred. In addition, even though no nuclear reactors are currently in operation, nuclear material from other states and countries is still being sent to SRS for safe storage and protection. The current policy seeks to prevent accidental mishandling or intentional misuse of these potentially dangerous nuclear wastes by stockpiling these materials at SRS. Although accepting nuclear waste from outside the state has an economic benefit, some South Carolinians have questioned the use of their state as the “dumping ground for the world.” The courts have been forced to deal with the issue of nuclear waste shipments bound for the SRS on an individual basis, trying to balance the often conflicting wants and needs of state and federal agencies, business and environmental groups, and the local community.
The U.S. Department of Energy uses the term “environmental restoration” to refer to the assessment and cleanup of inactive waste sites. “Cleanup” means actions taken to deal with release or potential release of hazardous substances. This may mean complete removal of the substance; it also may mean stabilizing, containing, or otherwise treating the substance so that it does not affect human health or the environment. Determining the most environmentally sound method of cleaning up each waste unit is a major component of the site’s environmental restoration program. Over 400 inactive waste and groundwater units are included in the SRS restoration program. Sites range in size from several yards to tens of acres and include basins, pits, piles, burial grounds, landfills, tanks and groundwater contamination. Waste types include liquid and solid radioactive, hazardous, and mixed wastes. An example of novel waste disposal techniques is the attempt to immobilize high level radioactive waste within beads of borosilicate glass, a tough, impermeable and insoluble substance that can solidify radioactive waste. Examples of remediation methods range from traditional “pump-and-treat” systems where groundwater is pumped out of the ground, treated, and then re-injected into the ground, to more exotic technologies like bioremediation, which uses soil microorganisms that can actually digest some pollutants as a food source. In the past few years, the SRS has successfully remediated and closed six waste units, among the largest closures in the world totaling over 80 acres.
An example of a recently completed project is the M-Area Settling Basin, which received a combination of wastewater and organic degreasing solvents. It was closed with a clay cap blanketed with geosynthetic material, covered with a gravel/sand drainage layer and topped with soil and grass. The surrounding Lost Lake wetlands area is now being restored to its natural habitat. Another example is Par Pond, which was built in the late 1950’s as a cooling reservoir for P and R reactors. These were two of the original five production reactors used to make materials for atomic weapons. Scientists have found low levels of gaseous tritium in pondwater as well as radioactive cesium in the pond sediment. In 1991, Par Pond was discovered to be leaking through
5A-11
breaks in its earthen dam. SRS engineers wanted to lower the lake level by 20 feet so they could repair the dam and guard against the possibility of a catastrophic flood, but others raised concerns about possible fish kills, exposure of cesium-contaminated mud, and release of toxic substances to the environment. To allay some of these fears, when the drawdown was begun, much of the water was pumped to L Lake, another nearby impoundment. Some water was also discharged into other on-site streams that eventually flowed into Lower Three Runs Creek and then the Savannah River. Despite a temporary increase in levels of radioactive cesium reported in streams, the project proceeded without incident and the dam was repaired successfully.
5A-12

Activity 5A-1: Surface and Subsurface Geology
Materials6 STATE BASE MAP #2: WITH HIGHWAYS 1: 500,0006 LAND USE/LAND COVER MAP 1: 500,0006 GENERAL SOIL MAP 1: 594,0006 GEOLOGIC AND MINERAL RESOURCE MAP 1: 1,000,0006 SAVANNAH RIVER SITE TOPOGRAPHIC MAP 1: 48,0006 SAVANNAH RIVER SITE LITHOGRAPH 1: 100,0001 State Map of Major Drainage Basins Figure 1-26 Wipe-off Pens
PERFORMANCE TASKS(Icon Key) Overview = Q; Science = R; Math = :; History = :; Language Arts = ?
1. Locate the study site. Q RLocate the Savannah River Site Study Site on the STATE BASE MAP #2, WITH HIGHWAYS, on the LAND USE/LAND COVER MAP, on the GEOLOGIC AND MINERAL RESOURCE MAP, and on the GENERAL SOIL MAP by drawing a small box around the correct site on each map using a wipe-off pen. Briefly summarize the one or two most important land uses at this site, the age (Geologic Period), the type of rock at the site, and the predominant soil type at the site. Use the scale bar on the base map to estimate the straight-line distance between this study site and your school. In which local river drainage basin (watershed) is this site located? Through which of the major river systems, Savannah, Santee, Pee Dee, or Coastal Plain, does this site drain? Refer to Figure 1-2 "State Map of Major Drainage Basins."
2. Locate features and place names. QLocate the following well-known landscape features on the SAVANNAH RIVER SITE TOPOGRAPHIC MAP: Par Pond, L Lake, Savannah River, Lower Three Runs Creek, Upper Three Runs Creek, site of old Ellenton, town of New Ellenton (unlabeled, but just north of Johnson Crossroads on the top border of the map, just left of center), the five reactor sites (C, L, K, P, and R), and the pump stations near the Savannah River. How many of these features can you find on the SAVANNAH RIVER SITE LITHOGRAPH? Explain how you were able to locate each feature. Using the topographic map, determine the elevation of the highest and lowest points shown on the map. Use the scale bar on the map to determine how far the town of New Ellenton (use the location of Johnson Crossroads) is from the town of old Ellenton.
3. Categorize four types of lakes found on site. RFour different types of lakes occur within the boundaries of the Savannah River Site: oxbow lakes, Carolina Bay lakes, artificial reservoirs, and rectangular holding ponds. Using the SAVANNAH RIVER SITE TOPOGRAPHIC MAP, locate twelve bodies of water contained completely within the SRS and categorize each as one of the four types. Each group should calculate the percentage abundance of each type based on their own data. Groups should then combine their data to form a class dataset (being sure to eliminate duplicate lakes) from which percentage abundances can
5A-13
again be calculated. Which calculation, group or entire class, will produce the most reliable conclusion? Explain why.
4. Examine the Savannah River floodplain. RExamine the Savannah River floodplain on both the SAVANNAH RIVER SITE LITHOGRAPH and the SAVANNAH RIVER SITE TOPOGRAPHIC MAP. Note how the state boundary shifts. Which side of the river floodplain has high bluffs? Examine other streams in the area and note on which side bluffs occur. Is there a pattern to the location of bluffs? If so, try to explain it. If not, explain why bluffs occur at all in this area. Locate the town named for the bluffs.
5. Trace drainage patterns within the Savannah River Site. RUse a wipe-off pen to trace all drainage paths on the SAVANNAH RIVER SITE TOPOGRAPHIC MAP within the SRS boundaries. Into what large river do most of these streams flow? Divide your drainage pattern into individual watersheds for all of the major named streams using the larger tip wipe-off pens. Which stream (other than the Savannah River) has the largest watershed? Which has the smallest? What percentage of the rain falling on the SRS stays within the site boundaries all the way to the Savannah River? Is this answer higher or lower than you expected? Why?
6. Examine influence of fault lines on topography. RRefer to Figure 5A-3, "Geologic Cross Section of SRS" and Figure 5A-4 "Map View of SRS Showing Location of Faults." Trace with a wipe-off pen the approximate surface position of the major geologic rock unit contacts (boundaries) and all major fault lines onto the SAVANNAH RIVER SITE TOPOGRAPHIC MAP and the SAVANNAH RIVER SITE LITHOGRAPH. Is there any evidence that surface landform features are affected by contacts between rock units or by faults? Can you locate a particular rock unit or a fault by looking for characteristic landscape features or other surface evidence? If so, explain how; if not, explain why there is no such evidence.
7. Determine number of fire towers needed to view all of the SRS. :You are in charge of fire prevention at the Savannah River Site. This is an important function in an area so heavily forested. As part of your job, you need to construct a series of fire towers so that the entire area (except for Lower Three Runs Creek Corridor) is protected. Fire towers obviously need to be located on high ground so the observer can get a good view. Assume that on an average day, an observer can see 15 miles. Determine how many towers you will need to build to completely cover the land within the SRS. Locate these points on the SAVANNAH RIVER SITE TOPOGRAPHIC MAP and use a compass to draw circles, with a 15 mile radius, around each tower. Could you get by with fewer towers if you positioned them differently? Is it absolutely necessary that every square foot of SRS be covered? Discuss within your group and then debate with the rest of the class the question, "How many towers do we really need to build?"
8. Analyze the circular shape of the Savannah River Site. : :Examine the shape of the Savannah River Site as shown on the SAVANNAH RIVER SITE TOPOGRAPHIC MAP, the SAVANNAH RIVER SITE LITHOGRAPH, and the LAND USE/LAND COVER MAP. Speculate as to why the site appears circular.
5A-14

Determine the area of the Site (ignoring the Lower Three Runs Creek Corridor section) by one of the suggested methods. Compare your answers. Which answer do you think is more precise? Explain. Then calculate the approximate percentage
of South Carolina covered by the Savannah River Site (recall that the total area of the state is 31,000 square miles).
Group I - use transparent grid overlay, count squares and convert to square milesGroup II - use the formula for area of a circle (A= r2) to calculate square miles
9. Compare land use inside and outside of the site boundaries. R : :Use the transparent grid overlay and the SAVANNAH RIVER SITE LITHOGRAPH to determine the percentage of the site that is covered by water, the percentage covered by buildings and other artificial facilities, and the percentage covered by forest. Are these percentages similar to what you would find outside of the site boundaries in nearby sections of the Coastal Plain Region?
10. Plot earthquake danger zone and analyze damage potential. R : :Locate the Pen Branch Fault on Figure 5A-4, "Map View of SRS Showing Location of Faults." With a wipe-off pen, draw this fault as a solid line on the SAVANNAH RIVER SITE TOPOGRAPHIC MAP. Also draw two dashed parallel lines one mile away from the fault on each side. This corridor between the dashed lines represents the major danger zone if an earthquake should occur along this particular fault. How many reactors fall within the danger corridor? What types of damage would you expect here if an earthquake did occur? What other artificial and natural land features might be affected?
11. Analyze the highway network within the Savannah River Site. :Examine the highway system on the SAVANNAH RIVER SITE TOPOGRAPHIC MAP. How are different routes designated on site? Locate the security gates (barricades) at either end of the main highway and along side roads entering the site. Why are there so many gates? Why didn't they just close all of the roads except one or two? Locate the cloverleaf intersection near Reactor B. This was the first cloverleaf intersection ever constructed in South Carolina. Why does the Savannah River Site need a cloverleaf intersection?
ENRICHMENT
1. Research earthquake hazard potential in your local area. R :Contact the state geological survey or local agencies to find out your local area's earthquake hazard potential. Consult geologic maps to locate any fault lines or fault zones that pass through your town or county. Consult historical records to determine if earthquakes have ever been recorded in your town. Are there any landforms in the area that resulted from earthquake or fault activity?
2. Research security procedures at the Savannah River Site. :Write to the Savannah River Site to ask about their security procedures and why they need to be so careful about unauthorized people entering the site. Find out the
5A-15

requirements for obtaining a visitor's pass to visit the facility and make a list of buildings and areas open to visitors versus those that are not. Find out whether security measures have increased or decreased over the past ten years and what they expect security levels to be in the next ten years.
Activity 5A-2: Land Use Changes
Materials6 STATE BASE MAP #2: WITH HIGHWAYS 1: 500,0006 LAND USE/LAND COVER MAP 1: 500,0006 GENERAL SOIL MAP 1: 594,0006 GEOLOGIC AND MINERAL RESOURCE MAP 1: 1,000,0006 SAVANNAH RIVER SITE TOPOGRAPHIC MAP 1: 48,0006 SAVANNAH RIVER SITE LITHOGRAPH 1: 100,0006 Wipe-off Pens
PERFORMANCE TASKS (Icon Key) Overview = Q; Science = R; Math = :; History = :; Language Arts = ?
1. Correlate land use to topography. R : QLook carefully at the SAVANNAH RIVER SITE LITHOGRAPH . Identify farm fields, small towns or communities, roads, and developed and undeveloped land. See how well you can identify the same features on the SAVANNAH RIVER SITE TOPOGRAPHIC MAP. Look at the pattern of agricultural fields in the infrared lithograph. Why are these fields located where they are? Are most fields generally located next to streams or farther away from them? Refer to the LAND USE/LAND COVER MAP. How many of the land use categories can be recognized on the state map? Identify sources of non-point source pollution associated with each land use. Look at the GENERAL SOIL MAP and determine if the soil categories inside the Savannah River Site are any different from soil categories outside its boundaries.
2. Analyze land use changes through time. Q R :Compare physical features (man-made) found on the SAVANNAH RIVER SITE TOPOGRAPHIC MAP and the SAVANNAH RIVER SITE LITHOGRAPH. Some features will appear on the map but not on the satellite image. Other features appear on the satellite image but not on the map. What date was the map printed? What date was the satellite image obtained? Use a wipe-off pen to circle as many features as you can find that are visible on the satellite image but are not shown on the map. Next use a different color wipe-off pen to circle as many features as you can find on the map that are not visible on the satellite image. Select any four of your circled features and explain why you think each change occurred and how that change might have affected the natural environment.
3. Compare old Ellenton town site with current landscape. :Locate the site of the old town of Ellenton on the SAVANNAH RIVER SITE TOPOGRAPHIC MAP and the SAVANNAH RIVER SITE LITHOGRAPH. Look at the lithograph inset maps and compare the old black & white photograph with the modern color infrared photograph. Identify any 1951 structures that are still visible in the 1994 photo. Also refer to Figure 5A-1, "Topographic Map of Old Ellenton." How
5A-16
much of the former town is still visible on the lithograph inset? How has the surrounding natural landscape changed during that same time? Do you see any evidence of reforestation? Use a magnifying glass to focus on the color infrared inset of the town. List any evidence of past civilization that you can see. Trace with a wipe-off pen the street pattern of old Ellenton from Figure 5A-1, "Topographic Map of Old Ellenton," onto the color infrared lithograph inset. Use the pond and the railroad tracks as guides for tracing. Which streets still exist? Which ones were abandoned? What happened to the structures (buildings, etc.)? What determined which structures would be moved and which would simply be abandoned? Are there any new streets or buildings in the old town site?
4. Write story about proposed archeological dig. ? :Your school archeology club is making plans to perform an archeological dig at the old town site of Ellenton, inside the Savannah River Site. Predict the types of artifacts you might find there. Then write a story about your prospective trip to Ellenton and include a detailed description of the people you think might have used the artifacts you found. Try to recount some event in the lives of those people that might have related to the relocation of the town.
5. Compare towns of old Ellenton and New Ellenton. : :Locate the site of the abandoned town of Ellenton on the SAVANNAH RIVER SITE TOPOGRAPHIC MAP and on the SAVANNAH RIVER SITE LITHOGRAPH. Also locate the Town of New Ellenton on the lithograph and on Figure 5A-2, "Topographic Map of New Ellenton" (note that New Ellenton is just off the north edge of the SAVANNAH RIVER SITE TOPOGRAPHIC MAP). Compare information about the two town sites and then fill in the following chart. Make intelligent guesses when you are unable to get exact data. How far apart are these two town sites?
specific feature old Ellenton New Ellentonnumber of streets in towngeometric pattern of streets (describe)total number of buildings in townaverage sizes of buildings (in general terms)proximity to railroad (land transportation)access to river (water transportation)% of buildings that are business/commercialestimated total population of town(assume average of 2.5 people per house)
6. Explain distribution of cemeteries. R :Look carefully at the SAVANNAH RIVER SITE TOPOGRAPHIC MAP. Locate as many cemeteries as your group can find in two minutes and mark these locations on the map. Are the cemeteries clustered in one geographic area or are they more spread out over the entire site? Explain the reason for this distribution. Why are there so many cemeteries here? Why were the cemeteries near Ellenton not moved when the town of Ellenton was moved?
7. Create poster expressing emotions of leaving home town. ?
5A-17

Think about what your family and community would do if you were forced to sell your home and relocate because of a major public project such as a reservoir, power plant, nuclear waste depository, or environmental preserve. How would you feel? How would you react? Would it make a difference if you agreed with the need for the public project? What things would you take with you? What things would you have to leave behind? Read some of the comments of the citizens of Ellenton recorded in the two stories "The Move of Ellenton" on page 5A-3 and "The Sign at Ellenton" on page 5A-5. Compose some short slogans or phrases that might fit on a banner or a poster expressing your feelings about leaving your home town. Why do you think that the relocated citizens chose the name "New Ellenton" for their town, instead of giving it a completely new and completely different name?
8. Interpret and use the Savannah River Site grid system. : :The Savannah River Site uses a unique grid system to identify exact locations of buildings and other features. Place the transparent grid overlay on top of the SAVANNAH RIVER SITE TOPOGRAPHIC MAP so that a center line on the overlay exactly lines up with the railroad track near the former town of Ellenton. Notice how all of the facilities and most of the roads line up parallel to this grid system. Mark these features on the overlay with a wipe-off pen. Examine the numbering system used for the grid and locate the origin line (zero line) for both the vertical and horizontal directions. In what state (Georgia or South Carolina) does the origin point (zero, zero) lie? Why do you think they chose this point as an origin? Why do you think they needed a separate grid system for the Savannah River Site? Why do you think the main railroad line ended up parallel to the vertical grid direction?
Locate the following features and give coordinates in the SRS systemfeature Savannah River Site coordinates
center of town of old Ellentonsite of reactor Lcenter of Pond Blocation of Johnson Crossroads (near New Ellenton)area Happroximate center of the Savannah River Site
9. Design site layout for new tritium reactor. R :Make plans to add a new tritium reactor at the Savannah River Site. Select the best spot to locate the facility and mark it on the map with a wipe-off pen. Be sure you are at least three miles from any existing site. Add roads, railroad sidings, etc. as needed. Be sure your facility, roads, etc. all line up properly with the Savannah River Site coordinate system (grid). Why is it important to be at least three miles from other sites? Justify your specific site selection. Compare it with other groups.
10. Calculate average cost per acre of land bought by Savannah River Site. : :The Federal Government spent 19 million dollars to purchase all of the land now part of the Savannah River Site. Calculate the average cost per acre of this land using an estimated value for total land area of 300 square miles. Would you expect all land to have the same value? Outline areas on the SAVANNAH RIVER SITE LITHOGRAPH that you would expect to have much higher than average land value. Using a different color wipe-off pen, outline areas you would expect to have the
5A-18

lowest land values. Refer to the black & white photo lithograph inset to determine the area of the average size farm at the time the land was purchased.
11. Select an alternate site in SC with same characteristics as SRS. R Q :The Savannah River Site was chosen for four major reasons: it had a large and dependable water supply, it had a large, relatively flat land area, it had good transportation (railroads and river) available, and it was sparsely populated land but yet close to some large cities and towns. If the Department of Energy had to locate a similar facility somewhere else in South Carolina today, where would they put it? Use the LAND USE/LAND COVER MAP and the two SATELLITE IMAGES to determine the location that would best meet the four conditions listed above. Share your results and your reasons with the class or other groups.
12. Plan best use for Savannah River Site after government returns it. : ?Sometime in the future, the United States government may wish to completely shut down the Savannah River Site. If this happens, the land will be given back to South Carolina. What use would you recommend for this land? Study the topographic map and lithograph carefully before writing down your plan. Be prepared to debate your plan with other groups.
ENRICHMENT
1. Research the stories of other abandoned towns located within the SRS. : ?Research the history of the Savannah River Site to identify other towns that were abandoned and/or relocated during the time this facility was being built. List similarities and differences between the experiences of these other towns and the Ellenton situation.
2. List artifacts already discovered at SRS. :Contact the Savannah River Site to find out what artifacts have really been discovered at the site.
3. Compare earnings in 1951 with today's value. :Consult an almanac or other resources to determine how much money an average family earned on an average size farm. Assuming that a 1951 dollar is worth two hundred of today's dollars estimate what that amount of money would be worth today. Would that be enough money to relocate your home to a different place? Explain your answer.
5A-19

Activity 5A-3: Contamination and Remediation
Materials6 SAVANNAH RIVER SITE TOPOGRAPHIC MAP 1: 48,0006 SAVANNAH RIVER SITE LITHOGRAPH 1: 100,0001 Geologic Cross Section of SRS Figure 5A-36 Wipe-off Pens
PERFORMANCE TASKS (Icon Key) Overview = Q; Science = R; Math = :; History = :; Language Arts = ?
1. Analyze the newspaper article. ?Read the newspaper article on page 5A-1, "SRS Cleanup Could Harm Ecosystem, Scientist Said." Explain how the story relates to the Coastal Plain Landform Region. Identify a possible location on the SAVANNAH RIVER SITE TOPOGRAPHIC MAP (refer to the SAVANNAH RIVER SITE LITHOGRAPH if needed) where the story could have taken place. Explain why the publisher thought this story would be of interest to newspaper readers. Using the same people as characters and the same location as your setting, write another newspaper article related to this incident, but date it either before or after the given story occurred. Choose a title and draw an appropriate picture to illustrate your main point.
2. Trace cycle of water use for reactors at SRS. Q : ROne of the reasons the Savannah River Site is located where it is relates to the availability of large quantities of water. Originally, water was pumped from the Savannah River through a series of pipes to the different reactor buildings. The waste water was then contained in a holding pond until it cooled and was then released through the natural stream drainage system back to the Savannah River. Divide into groups. Each group should select one of the reactor sites (R, P, K, L, C) and trace on the SAVANNAH RIVER SITE TOPOGRAPHIC MAP with a wipe-off pen the route of the cooling water circulation system beginning at the Savannah River.
3. Recommend locations for monitoring and treatment wells. RWhere would you place a well to remove water and reinject it into a seepage area? How far from the pollution source would the remediation well have to be placed in order to effectively deal with the problem? Refer to Figure 5A-3, "Geologic Cross Section of SRS."
4. Analyze the pollution potential for tritium in groundwater. R :Locate Burial Ground in 'E' area and also the 'F' and 'H' Seepage Basins on the SAVANNAH RIVER SITE TOPOGRAPHIC MAP. Assume that most of this seepage ends up in the groundwater system. The average flow rate for groundwater in these rock units is 2 meters per day. Assuming that most of this groundwater will eventually reach the Savannah River, calculate the amount of time it will take the contaminant to reach the Savannah River. If the pollutant is tritium, which has a half-life of 12.3 years, how much tritium will actually reach the Savannah River, and will there be a significant pollution problem once it gets there? Explain and justify your answer.
5A-20
5. Locate evidence of hot water discharge. R :In 1990 scalding hot water was accidentally released from Reactor K into Pen Branch Creek. Locate this reactor and trace on the SAVANNAH RIVER SITE TOPOGRAPHIC MAP the flow of hot water down the creek to the Savannah River. What effect would the hot water have on stream habitat? How would it affect the animals in the creek and the surrounding area? Look at the SAVANNAH RIVER SITE LITHOGRAPH to see if you can determine any difference in vegetation along this creek compared to surrounding areas. How long would you expect complete recovery to take? Justify your answer.
6. Trace route by which contamination entered Par Pond. : R :Locate Par Pond on the SAVANNAH RIVER SITE TOPOGRAPHIC MAP and the SAVANNAH RIVER SITE LITHOGRAPH. Trace the route by which you think contamination entered Par Pond. What type of contamination would you expect to occur, based on surrounding land use? Trace the outflow of Par Pond all the way to the Savannah River. Why was the small strip of land on either side of the creek included as part of the Savannah River Site? How far (average distance) from the creek does the Savannah River Site own? Why didn't they need to buy up land farther from the stream? Could they have purchased an even smaller amount of land? Explain.
7. Calculate amount of newly exposed land from lake drainage. : RThe Savannah River Site lowered the water level in Par Pond in 1991 in order to repair the earthen dam. If they lowered the water level a total of 10 feet, how much new land would be exposed? Outline on the SAVANNAH RIVER SITE TOPOGRAPHIC MAP the new shoreline representing the new lake level. Then, use the transparent grid overlay, or other method, to calculate the area of the newly exposed land.
8. Document environmental effects of lowering lake level. R ?Discuss the environmental effects of lowering the level of Par Pond. Divide into groups and list the pros and cons of cleaning up the sediment exposed by lowered lake level versus leaving it alone and raising lake level back to normal. Write up a 'position paper' summarizing your group's consensus in solving this problem. Use a technical writing style to convey the most amount of information in the shortest narrative.
9. List potential pollution problems for animals. R ?You are an animal (pick one of your choice) living on the Savannah River Site. Pick a location on the SAVANNAH RIVER TOPOGRAPHIC MAP where you might likely be living. Outline your day’s activities and explain where and when you might run into possible soil or water contamination. Mark these spots on the topographic map and make a list of potential problems and how to avoid them. How many will your chosen animal be able to avoid?
5A-21

ENRICHMENT
1. Research tasks of reactors at SRS. R :Write to the Savannah River Site for information on what tasks each reactor performed. Categorize the reactors based on their function. Which reactors are still actively functioning today? Which are expected to become active in the future?
2. Research the process of vitrification of waste in borosilicate glass. ROne of the methods for storing nuclear waste is vitrification, encapsulating the waste into glass pellets. Some of this work is done at the Savannah River Site. Research this method to determine the requirements for vitrification and explain why the facilities at the Savannah River Site are appropriate for this project.
3. Compare reactors at SRS with those at Chernobyl. : RThe Chernobyl reactor incident in the former Soviet Union was one of the worst nuclear accidents anywhere on earth. Compare the reactors at the Savannah River Site to the reactors at Chernobyl. Could such a disaster happen at the Savannah River Site? Research your answer and present your findings to the class.
4. Investigate the properties and uses of tritium. RTritium is important for the production of thermonuclear weapons. Investigate the properties of tritium. Why is it dangerous? How long will tritium remain radioactive? What are the products of its decay? What safety precautions are being taken at the Savannah River Site to deal with tritium contamination of water?
5A-22
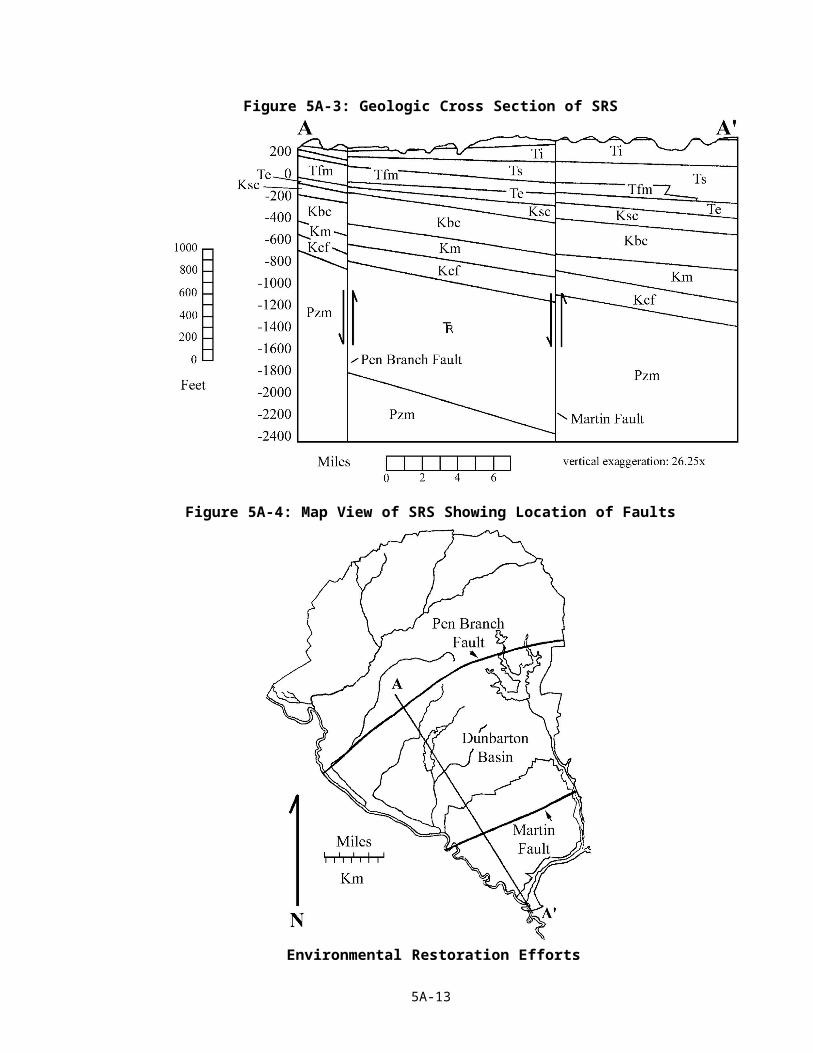

STUDY SITE 5B: SANTEE COOPER PROJECT (ENGINEERING & CANALS)
THE ITEM THE ITEM March 10, 1991
Swamp Fox Battalion Returns With Prideby Erika Bolstad
Three cannon shots, a few whoops and a round of artillery punch marked the return of the Swamp Fox battalion, part of the 151st Field Artillery Brigade headquartered in Sumter. “Two years and one month ago we assembled here and the atmosphere was very solemn,” said National Guard Col. Ray Geddings, commander of the 151st Field Artillery Brigade. “Two years and one month later, we assemble again and the atmosphere is much more festive." After a two-year absence, the 4th Battalion of the South Carolina National
“Swamp Fox” for out- maneuvering British troops in the swamps west of Charleston. Marion’s battalion was made up of parti-san volunteers from Georgetown, Andrews, Lake City, Hemingway and Manning. Today, the battalion’s units are located in the same towns. The battalion was decommissioned and reorganized as the 178th Combat Engineer Battalion two years ago. “There was much wailing and gnashing of teeth,” said battalion commander Lt. Col. Henry Richardson of Sumter, a member of the National Guard since 1969 and part of the Swamp Fox battalion
politicking for the historic unit’s return, Richardson said, and it paid off. The unit doubled to about 900 strong, and it will re-ceive and train with new weapons. During Sunday’s ceremony, the battalion’s colors were uncased and returned to service. Richardson’s daughter, Elisa, returned the streamers, evidence of the unit’s 200-year history. It’s also one of the few units on the Army’s rolls that is allowed to have a “nom de guerre,” its Swamp Fox nickname, Richardson said, which reflects the “spirit of the 4th.” The battalion boasts the most sustained days in
RATIONALE
The Santee Cooper Study Site encompasses an unusually large area of South Carolina's Coastal Plain, but this level of coverage is necessary to highlight the importance of the role of engineering in managing the state's water resources and water transportation routes. From the early days of canal building, when the Old Santee Canal was constructed to provide a water connection between the Cooper and Santee rivers, to the modern Diversion and Rediversion canals connected to Lakes Marion and Moultrie, South Carolinians have tried to connect the city of Columbia, at the Fall Line Zone, with the port of Charleston, at the Atlantic Ocean. Today, this effort is more likely to be focused on tourism than on commerce, but the need is still present. The Santee Cooper site provides perspective on both the natural and geologic obstacles to constructing reservoirs and canals and the cultural and historical implications of such large projects. Brief Site Description
5B-1
The Old Santee Canal
Part of the appeal that canals have always had for South Carolina lay in completing a dream that had persisted since Maurice Matthews noted in 1683, "the rivers are roads into the interior of this world." From such dreams came the thought and the notion that Columbia could be a port open to ocean-going ships, a notion that had existed from that city's founding. Merchants in Charleston also had a vested interest in providing a shorter route for goods from the upstate to reach their port. Historian David Duncan Wallace observed in 1934 that "grown men have dreamed of sailing ocean-going ships on streams that they waded across as children."
The first attempt to link Columbia and Charleston by connecting the Santee River with the Cooper River occurred during the 1790's when Charleston merchants finally agreed on a route which would allow commercial boat traffic to bypass the Santee Delta and Atlantic Ocean on the way from Columbia to Charleston. They contracted with Swedish immigrant Col. J. C. Senf to oversee the engineering work for the 22 mile long, 35 foot wide canal. Although only a few feet deep in most places, the canal was designed to accommodate vessels carrying up to 22 tons of freight. Construction took seven years (1793-1800) and cost $650,000. The canal was finally opened to boat traffic in 1801 and cotton boats began to take full advantage of the new route almost immediately. Commercial use of the canal peaked around 1830. After that date, the rapid construction of new railroad lines began to siphon off much of the cotton traffic bound for Charleston. The canal was finally rendered obsolete by the construction of even more efficient railroad lines and its charter was revoked in 1850.
Today, parts of the canal are preserved in Old Santee Canal State Park near Monck's Corner. The original locks and much of the original canal itself have been destroyed by the construction of Lake Moultrie and the modern Tailrace Canal in the Santee Cooper project, but a replica of one of the locks is preserved in the Visitor Center and canoe rentals are available for visitors wishing to paddle along a short stretch of the original route. Also, a small portion of the upper reaches of the canal is visible between Lake Marion and Lake Moultrie near Eadytown, but it no longer holds enough water to be navigable.
Santee Cooper Project
The dream of connecting Columbia and Charleston was resurrected in the early 1930's during the Great Depression. As a result of publicity about the success of the government sponsored Tennessee Valley Authority (TVA), the backlash against private utility companies unleashed by the economic collapse of 1929, and the demand to spread the use of electricity into rural areas, the 1930's saw many plans for power plants drafted throughout the country. Most of these plans never materialized because the thought of
5B-2

public power agencies raised the specter of socialism in the minds of many political critics. Of the three such projects planned for South Carolina (on the Savannah River, on the Broad River, and to connect the Santee River with the Cooper River), only the Santee Cooper Project, authorized in 1934, was ever built. In this project the United States Army Corps of Engineers retraced in part the route of the original Santee Cooper Canal that had gone into service in 1801. This time, however, the massive project that was to produce power and to divert both water and, hopefully, water transport, from the Santee River to the Cooper River (and, ultimately, to Charleston's harbor), proved much more successful.
The Santee Cooper complex, operated by the South Carolina Public Service Authority since 1942, originally consisted of Lake Marion, Lake Moultrie, the Diversion Canal which connects them, and the Tailrace Canal. Two major purposes of the project were to bring affordable electric power to the rural population and to provide flood control. A side benefit would be the expansion of recreational opportunities for the region. The project was financed with federal grants and federally-backed loans. In 1934, the state legislature chartered the South Carolina Public Service authority which was to supervise the construction and operation of the Santee Cooper project. Private utilities attempted to block the new project but failed, and construction began in April of 1939. Near Pinopolis, workers built 42 miles of dams and dikes, including a 26 mile long earthen dike. The waters impounded by this system of dams became Lake Moultrie. The Pinopolis dam also included a hydroelectric station capable of generating 128 megawatts of electricity and a navigation lock. A lock was built to lift barges and boats from the Tailrace Canal to Lake Moultrie.
A further goal of flood control on the Santee River was accomplished just to the north of Lake Moultrie by constructing an eight mile long earthen dam across the river channel with a 3,400 foot long spillway. Lake Marion was created behind this dam. A six and one-half mile Diversion Canal was built to connect the two lakes and to allow excess water from the Santee to enter the Cooper River system. Over time, however, the Santee Cooper project led to increased silting in Charleston's harbor, and a Rediversion Canal was later built from Lake Moultrie back into the original Santee River bed downstream from the dam.
The entire Santee Cooper project was completed in only two years, six months, and twenty-one days. In completing the project 171,000 acres of swamp and timberland had been cleared, 42 million cubic yards of earth had been moved, and 3.1 million cubic yards of concrete had been poured. The Santee Cooper project was the largest earth clearing project in the history of the United States. The completion of the project dramatically improved the lives of thousands of South Carolinians. Before Santee Cooper, less than 2.5 percent of rural citizens had electricity, but, by the late 1940's, 91 percent of rural residents had electricity in their homes and Santee Cooper was providing electricity for 35 of the state's 46 counties. Moreover, the construction of Lake Marion and Lake Moultrie created new recreational and business opportunities for an economically depressed part of the state. Even though
5B-3

large locks were made a part of the dam complex at Pinopolis, few commercial boats ever use them.
Bubba and the Big Fishing HoleBy Jody Tinsley
When Bubba was a baby, he was a big, big baby. It took a whole herd of cows to keep him in milk. A cotton mill near the Fall Line Zone ran extra shifts to make his diapers. When he’d cry, folks thought it was a hurricane; his laugh was a thunderstorm.
As he grew up, thank goodness, he learned to control himself. He smiled instead of laughing and frowned instead of crying. He’d nod his head gently or shake it softly rather than saying “yes” or "no" just to keep the noise down around the house. He walked slowly and carefully so as not to bump into the church and knock off the steeple or squash the farm animals.
But one thing he couldn’t control was his appetite. It wasn’t big. It wasn’t huge. It was enormous. His family had a special corn field just to grow his grits. He got permission to pick poke salad and blackberries from the roadsides in five surrounding counties (which saved the counties a lot of money in road maintenance fees). And Bubba hunted and fished to keep himself fed.
He had a dozen hunting dogs which he kept in a box in his shirt pocket. He’d let them out, and they would help him catch about 25 deer or 150 rabbits or so, which was just enough to make him a nice lunch or light supper. But the other hunters in the area didn’t much care for Bubba’s hunting trips. They liked Bubba, but they didn’t like him hunting out all the game.
So Bubba turned to fishing more and more. He’d go to the river and catch about 50 big old catfish and make a catfish stew. But he trampled the banks so much while fishing that he began to feel bad about it. “I need a boat,” he said, softly, “a little canoe.”
He walked to the coast, which took most of the afternoon, and looked for the smallest boat he could fit in. A tug boat was much too little. An old coast guard ship didn’t give him room to stretch out his legs. But a cargo ship was just big enough for him. He threw it over his shoulder, which was a little bit of a strain, and carried it up to his favorite fishing river.
But the boat wouldn’t fit. It was so wide it blocked the river from bank to bank, and when he sat in it the boat stuck fast on the river’s bottom. Even the biggest rivers in the state were too small. He wasn’t getting any fishing done. He was getting hungry and a little angry. “I need some big fishing holes,” he said. “Something really big.” He forgot to whisper, and windows rattled in houses for miles around at the sound of his voice. (One man complained, “Must be one of them danged sonic booms,” but he was wrong.)
Sitting in his boat, blocking the river, watching the water back up upstream of him, Bubba got an idea: "Maybe I can make me some fishing holes, something even big enough for me."
5B-4

About the same time, the Army Corps of Engineers and the state of South Carolina decided that South Carolina needed some large reservoirs for power production, flood control, and recreation. The plan was huge, and no one was sure the task could be done. “Can it be done?” they asked. “Can we move that much dirt? Cut that many trees? Build those giant dams and canals?”
These questions were discussed in the newspapers of the day, which Bubba could read using a large magnifying glass, and Bubba knew that he could do the work. He special ordered, by mail, an extra large shovel, the biggest ever made, which was just his size, and he offered his help to the people in charge.
Over the next few months, Bubba worked hard and all the reservoirs anyone could ask for were built. He dug holes; he made dams; he moved earth; he built canals to connect the reservoirs and rivers together. And finally, when the work was done, Bubba slid his boat from Lake Moultrie into Lake Marion, carving out a ditch and creating the Diversion Canal in the process, and he finally relaxed on the open water with his fishing pole. (After all, Bubba was getting older and it wasn’t as easy for him to carry his boat on his shoulder from place to place.) Thanks to Bubba’s invaluable work, the state of South Carolina has the benefits that come from having reservoirs, and Bubba can fish in comfort all he wants. And if you're ever on Lake Moultrie late at night and hear loud noises like thunder, but without any storm, you've probably heard Bubba grumbling about the big one that got away.
5B-5

Activity 5B-1: Engineering Impact of the Santee Cooper Project
Materials
6 STATE BASE MAP #1, SHADED RELIEF 1: 500,0006 STATE BASE MAP #2: WITH HIGHWAYS 1: 500,0006 LAND USE/LAND COVER MAP 1: 500,0006 GENERAL SOIL MAP 1: 594,0006 GEOLOGIC AND MINERAL RESOURCE MAP 1: 1,000,0006 COASTAL SATELLITE IMAGE 1: 332,6401 State Map of Major Drainage Basins Figure 1-26 Wipe-off Pens
PERFORMANCE TASKS(Icon Key) Overview = Q; Science = R; Math = :; History = :; Language Arts = ?
1. Locate the study site. Q RLocate the Santee Cooper Project Study Site on the STATE BASE MAP #2, WITH HIGHWAYS, on the LAND USE/LAND COVER MAP, on the GEOLOGIC AND MINERAL RESOURCE MAP, and on the GENERAL SOIL MAP by drawing a small box around the correct site on each map using a wipe-off pen. Briefly summarize the one or two most important land uses at this site, the age (Geologic Period), the type of rock at the site, and the predominant soil type at the site. Use the scale bar on the base map, to estimate the straight-line distance between this study site and your school. In which local river drainage basin (watershed) is this site located? Through which of the major river systems, Savannah, Santee, Pee Dee, or Coastal Plain, does this site drain? Refer to Figure 1-2, "State Map of Major Drainage Basins."
2. Compare Coastal Satellite Image with State Base Map. QCompare the lithograph entitled COASTAL SATELLITE IMAGE with the STATE BASE MAP #2, WITH HIGHWAYS. Locate Lake Moultrie, Lake Marion, the Pinopolis Dam, and the Diversion Canal. Locate the earthen dams that hold back the waters of Lake Marion and Lake Moultrie. How long is the straight segment of the Lake Marion Dam? Use the scale bar on the lithograph to determine your answer. Locate the Tailrace Canal, which connects Lake Moultrie with the Cooper River. This canal replaced most of the original Old Santee Canal. Why do you think they needed to build a new canal? From the Lake Marion Dam, follow the Santee River floodplain to the Rediversion Canal (only visible on the satellite image) coming off the north side of Lake Moultrie. Trace on the map, with a wipe-off pen, the pathway of the Rediversion Canal (passing a little to the north of Russellville near St. Stephens). How long is the Rediversion Canal? Why was it built?
Identify the city of Charleston and the Ashley and Cooper rivers. Follow the Cooper River up to the Tailrace Canal, Lake Moultrie, and Lake Marion. Continue on down the Santee River to the Santee Delta, which is the largest delta on the East Coast. North Island, Waccamaw Neck, and Georgetown are on the right edge of the lithograph. Look for the junction
5B-6
point of the Wateree and Congaree rivers. Part of the city of Columbia is just visible in the upper left-hand corner of the lithograph. Also visible on the top edge of the satellite image is Shaw Air Force Base. Interstates such as I-26 and I-95 can be readily identified along with a number of US highways
and secondary roads. Along the Coastal Zone notice the striations. These are remnants of beach ridges caused by wave action along coastal shorelines a long time ago.
3. Analyze land use changes through time. RLook in the margins of the COASTAL SATELLITE IMAGE and the STATE BASE MAP #2, WITH HIGHWAYS, to determine the year the map was printed and the year the satellite image was produced. Examine each cartographic product carefully to identify any changes which have occurred during the interval. How many of these changes are manmade? How many have occurred naturally? Does the small scale of both the map and satellite image make it easier or harder to recognize changes? Explain your answer.
4. Analyze the newspaper article. ? :Read the newspaper article on page 5B-1, "Swamp Fox Battalion Returns With Pride." Explain how the story relates to the Coastal Plain Landform Region. Identify on the STATE BASE MAP #2, WITH HIGHWAYS, (refer to the COASTAL SATELLITE IMAGE if needed) where the places and events named in the story might be located. Explain why the publisher thought this story might be of interest to newspaper readers. Using the same people as characters and the same location as your setting, write another newspaper article related to the same situation, but date it far enough in either the future or the past so that you will have some changes to report. Choose an appropriate title (headline) and draw an appropriate picture to illustrate your main point.
5. Trace navigation route, Charleston to Lake Marion. R :Trace with a wipe-off pen on the STATE BASE MAP #2, WITH HIGHWAYS, the route a ship captain would have to follow to get his cargo from the port of Charleston to the I-95 bridge over Lake Marion. List of all the man-made improvements, and other changes from the natural setting, that you would see from the ship while traveling this route. What kind of cargo might this ship be carrying? What kind of cargo might a similar ship have been carrying 50 years ago? 100 years ago? 150 years ago?
6. Trace Santee River System, calculate travel distance. R:Using the STATE BASE MAP #1, SHADED RELIEF, and beginning with the head-waters, review names of the rivers flowing through South Carolina that make up the Santee River system. Outline with a wipe-off pen the approximate boundaries of the watershed area that depends on the Santee System for drainage. List several ways that water from the Santee system is used. The Santee River system has several prominent reservoirs. Identify the tributary river systems for each reservoir. Why were the reservoirs built and how are they used? What effects do these reservoirs
5B-7

have on the Santee delta? Where are the sediments deposited that would have normally been deposited in the delta?
Once water in the Santee River system reaches Lake Marion, there are three pathways by which that water can reach the Atlantic Ocean. Divide into three groups to trace the different pathways on the COASTAL SATELLITE IMAGE. Describe what you will see on your way to the coast. How much of what you see is natural versus man-made? How fast would you be able to travel? What is your total distance from Lake Marion to the Ocean? What obstacles might you run across in your journey? Each group should report its conclusions to the rest of the class. Discuss why these different courses exist. Which pathway would you choose if you were paddling to the ocean in a canoe? Explain your answer.
Group I Over Lake Marion spillway, down Santee River to Ocean
Group II Through Diversion Canal to Lake Moultrie to Tailrace Canal to Cooper River to Ocean
Group III Through Diversion Canal to Lake Moultrie to Rediversion Canal to Santee River to Ocean
7. Write story about legendary superhero. ?Using the story "Bubba and the Big Fishing Hole" on page 5B-4 as a model for your group, select a public works project either in your neighborhood or somewhere within South Carolina and create a legendary superhero who can do the job quickly and easily. Construct a story in which your superhero comes to save the day and finish the project. Be sure to give your superhero an appropriate name. Why do we like stories about people who can quickly accomplish things that would take regular workers a very long time to finish? Share your stories with other groups both in writing and orally. Make a list of character traits that all of your different superheroes have in common.
ENRICHMENT
1. Research Old Santee Canal route options. :Write to the Old Santee Canal State Park office and ask for information about the different original routes proposed for the project. List the pros and cons of each route and explain why the selected route was chosen.
2. Research literary examples of superheroes. ?:Go to your local school or community library and look up as many legends and stories about superheroes as you can find. Match the superheroes with the particular industry or occupation they represent. Obvious examples would be Paul Bunyan with the timber industry, or John Henry, the "steel driving man," with railroads. See how many others you can identify. Give class reports about the most interesting examples you find.
5B-8