SIROCCO: Silent rotors by acoustic optimisation International Meeting on Wind Turbine Noise Lyon...
24
ECN-M--07-064 SIROCCO: Silent rotors by acoustic optimisation J.G. Schepers A. Curvers S. Oerlemans K. Braun T. Lutz A. Herrig W. Wuerz A. Mantesanz L. Garcillán M. Fischer K. Koegler T. Maeder This paper will be presented at the Second International Meeting on Wind Turbine Noise, Lyon, France, September 20-21, 2007
Transcript of SIROCCO: Silent rotors by acoustic optimisation International Meeting on Wind Turbine Noise Lyon...
ECN-M--07-064
SIROCCO:Silent rotors by acoustic optimisation
J.G. SchepersA. Curvers
S. OerlemansK. BraunT. Lutz
A. Herrig
W. WuerzA. MantesanzL. GarcillánM. FischerK. KoeglerT. Maeder
This paper will be presented at the Second International Meeting on Wind Turbine Noise,Lyon, France, September 20-21, 2007

Second International Meeting on
Wind Turbine Noise Lyon France September 20 – 21 2007
SIROCCO: SILENT ROTORS BY ACOUSTIC OPTIMISATION
J. G. Schepers, A. Curvers1 S. Oerlemans2
K. Braun, T. Lutz, A. Herrig, W. Wuerz3 A. Matesanz, L Garcillán4
M. Fisher, K. Koegler, T. Maeder 5
1Energy Research Centre of the Netherlands, ECN {schepers,curvers}@ecn.nl
2 National Aerospace Laboratory NLR
3University of Stuttgart {braun,lutz,herrig,wuerz}@iag.uni-stuttgart.de
4Gamesa Eólica
{Amatesanz,lmgarcillan}@gamesacorp.com
5GE Wind Energy/GE Global Research {murray.fisher,klaus.koegler}@ge.com, [email protected]
Abstract In this paper the results from the European 5th Framework project 'SIROCCO' are described. The project started in January 2003 and will end in August 2007. This project is coordinated by the Energy Research Centre of the Netherlands (ECN) with the following participants: National Aerospace Laboratory (NLR, the Netherlands), the University of Stuttgart (USTUTT) from Germany and Gamesa Eólica from Spain. GE Wind Energy joined the project in May 2005. The main aim of the SIROCCO project is to reduce wind-turbine aerodynamic noise significantly while maintaining the aerodynamic performance. This is achieved by designing new acoustically and aerodynamically optimised airfoils for the outer part of the blade. The project focussed primarily on reducing trailing edge noise, which was broadly believed to be the dominant noise mechanism of modern wind turbines. 1. Introduction Wind turbine noise is still one of the major obstacles for the widespread use of wind energy in Europe. For this reason the European 5th Framework project SIROCCO is performed with the aim to obtain a significant noise reduction on full-scale wind turbines, without negative effects on the aerodynamic performance. The project's

main focus is on the reduction of trailing edge noise, which, before the project started, was broadly believed to be the dominant noise mechanism of modern wind turbines. For that purpose silent airfoils are designed which replace the existing airfoils at the outer part of a baseline blade. Only the outer part of the blade needs to be considered, because this part is exposed to the maximum flow velocities and consequently produces the highest aero-acoustic noise levels. The SIROCCO project started in January 2003 with 6 participants: the Energy Research Centre of the Netherlands (ECN), the National Aerospace Laboratory (NLR) and Composite Technology Centre (CTC) from the Netherlands, the University of Stuttgart (USTUTT) and NOI Rotortechnik from Germany and Gamesa Eólica from Spain. Since then the project consortium has undergone some changes: In 2004 NOI and CTC withdrew and in 2005 GE Wind Energy joined the project. The project is scheduled to end in August 2007. The activities in the SIROCCO project were carried out on two reference turbines: A three bladed Gamesa 850 kW turbine (D=58 m) which is located near Zaragoza (Spain) and a three bladed 2.3 MW turbine (D=94 m) from GE Wind Energy, which is located on ECN’s Wind Turbine Test Site Wieringermeer, EWTW (the Netherlands), see the figures 1 and 2. Having results from two different turbines is believed to give much more general insights on the validity of the applied methods. The project's first phase was to characterise the noise sources on the existing wind turbines with acoustic field measurements. Thereto a new acoustic array measurement technique, developed in the former DATA project [1] has been extended and utilised to localise and quantify noise sources on the rotating blades. The aim of this task was to verify that trailing edge noise is indeed the dominant noise source for the baseline turbine so that it is worthwhile to continue the project and spend further effort on the reduction of this noise mechanism. These activities were mainly carried out by NLR, where as a spin-off activity, ECN compared the measurements with calculations. Within the second phase, a combined aero-acoustic design methodology that was developed in DATA has been extended and improved to design low-noise airfoils for the outer part of the rotor blade taking into account the constraints imposed by the manufacturers. This activity was mainly carried out by the University of Stuttgart with support from the manufacturers. Subsequently, in a third phase the acoustic and aerodynamic performance of the new airfoils were tested in a two-dimensional wind tunnel environment. This activity was mainly carried out by the University of Stuttgart in their Laminar Wind Tunnel. Part of the acoustic measurements were performed by NLR in the AWB anechoic wind tunnel from DLR. After the airfoils have been designed and their behaviour was validated in the 2D wind tunnel environment, the fourth phase was executed in which the airfoils were implemented into full-scale rotor blades by Gamesa and GE. These blades were then mounted on the wind turbines and ECN and NLR carried out extensive field measurements of noise, power and loads at different operational conditions to assess the performance of these airfoils under 3D, rotating and atmospheric conditions.
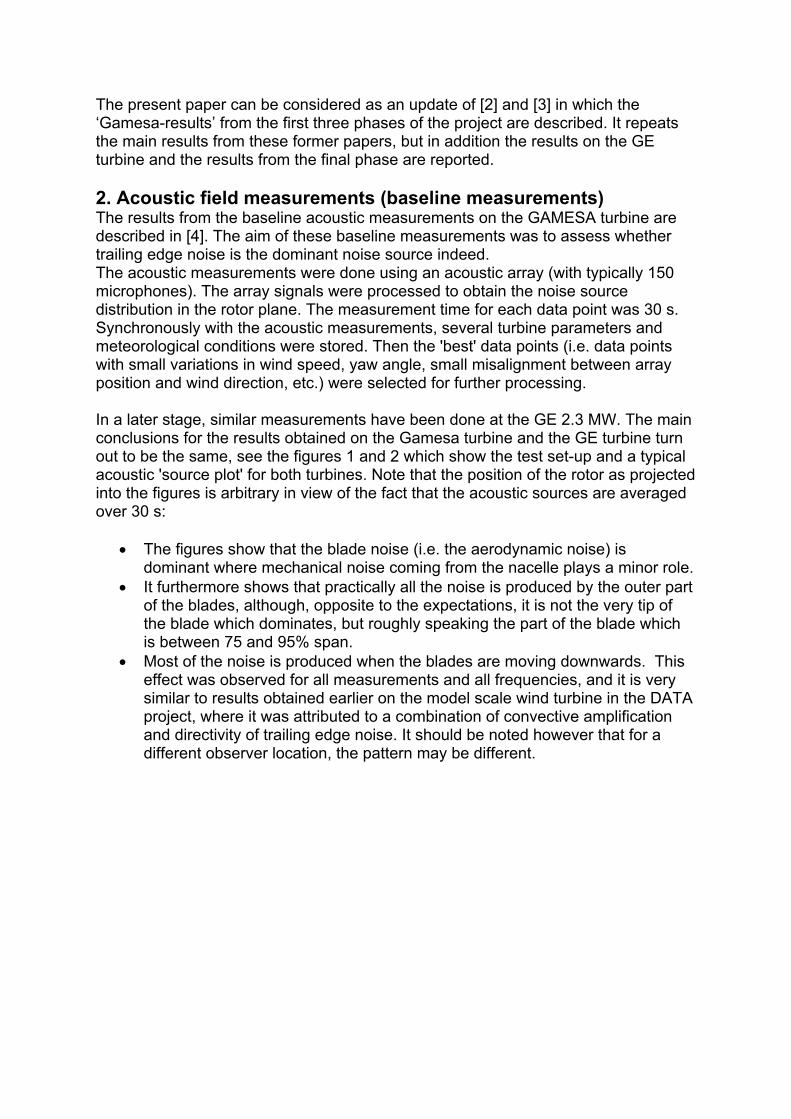
The present paper can be considered as an update of [2] and [3] in which the ‘Gamesa-results’ from the first three phases of the project are described. It repeats the main results from these former papers, but in addition the results on the GE turbine and the results from the final phase are reported. 2. Acoustic field measurements (baseline measurements) The results from the baseline acoustic measurements on the GAMESA turbine are described in [4]. The aim of these baseline measurements was to assess whether trailing edge noise is the dominant noise source indeed. The acoustic measurements were done using an acoustic array (with typically 150 microphones). The array signals were processed to obtain the noise source distribution in the rotor plane. The measurement time for each data point was 30 s. Synchronously with the acoustic measurements, several turbine parameters and meteorological conditions were stored. Then the 'best' data points (i.e. data points with small variations in wind speed, yaw angle, small misalignment between array position and wind direction, etc.) were selected for further processing. In a later stage, similar measurements have been done at the GE 2.3 MW. The main conclusions for the results obtained on the Gamesa turbine and the GE turbine turn out to be the same, see the figures 1 and 2 which show the test set-up and a typical acoustic 'source plot' for both turbines. Note that the position of the rotor as projected into the figures is arbitrary in view of the fact that the acoustic sources are averaged over 30 s:
• The figures show that the blade noise (i.e. the aerodynamic noise) is dominant where mechanical noise coming from the nacelle plays a minor role.
• It furthermore shows that practically all the noise is produced by the outer part of the blades, although, opposite to the expectations, it is not the very tip of the blade which dominates, but roughly speaking the part of the blade which is between 75 and 95% span.
• Most of the noise is produced when the blades are moving downwards. This effect was observed for all measurements and all frequencies, and it is very similar to results obtained earlier on the model scale wind turbine in the DATA project, where it was attributed to a combination of convective amplification and directivity of trailing edge noise. It should be noted however that for a different observer location, the pattern may be different.
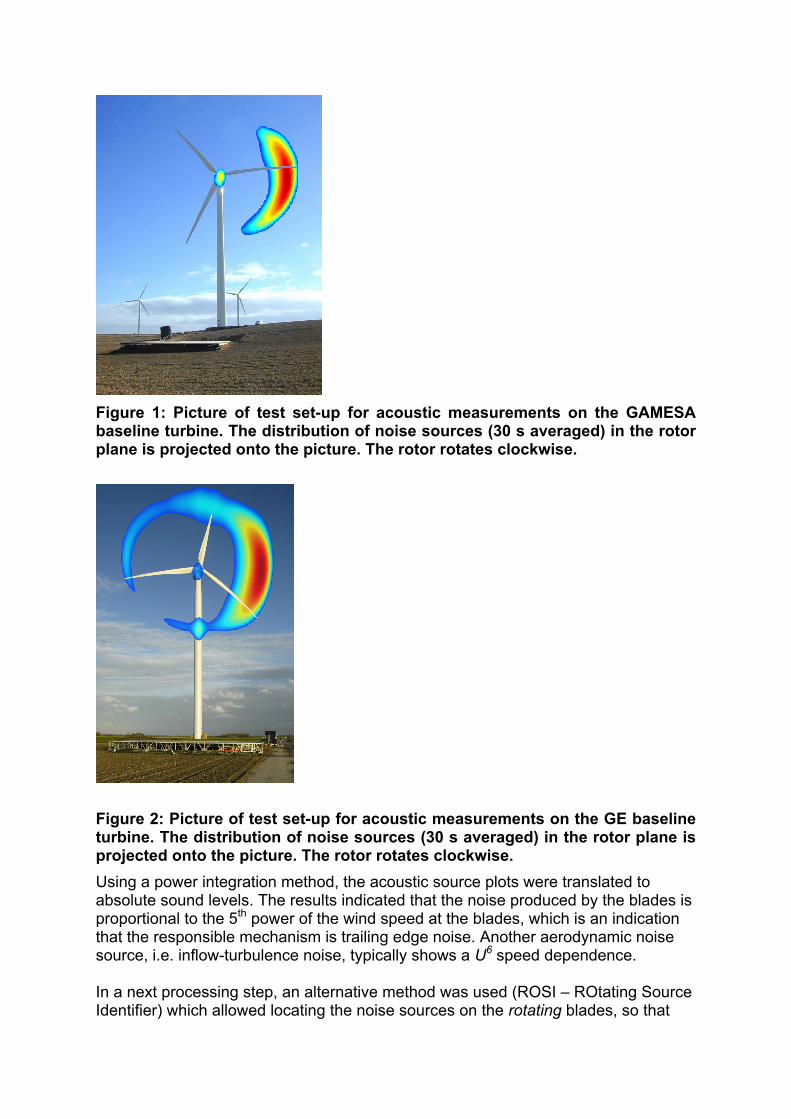
Figure 1: Picture of test set-up for acoustic measurements on the GAMESA baseline turbine. The distribution of noise sources (30 s averaged) in the rotor plane is projected onto the picture. The rotor rotates clockwise.
Figure 2: Picture of test set-up for acoustic measurements on the GE baseline turbine. The distribution of noise sources (30 s averaged) in the rotor plane is projected onto the picture. The rotor rotates clockwise. Using a power integration method, the acoustic source plots were translated to absolute sound levels. The results indicated that the noise produced by the blades is proportional to the 5th power of the wind speed at the blades, which is an indication that the responsible mechanism is trailing edge noise. Another aerodynamic noise source, i.e. inflow-turbulence noise, typically shows a U6 speed dependence. In a next processing step, an alternative method was used (ROSI – ROtating Source Identifier) which allowed locating the noise sources on the rotating blades, so that
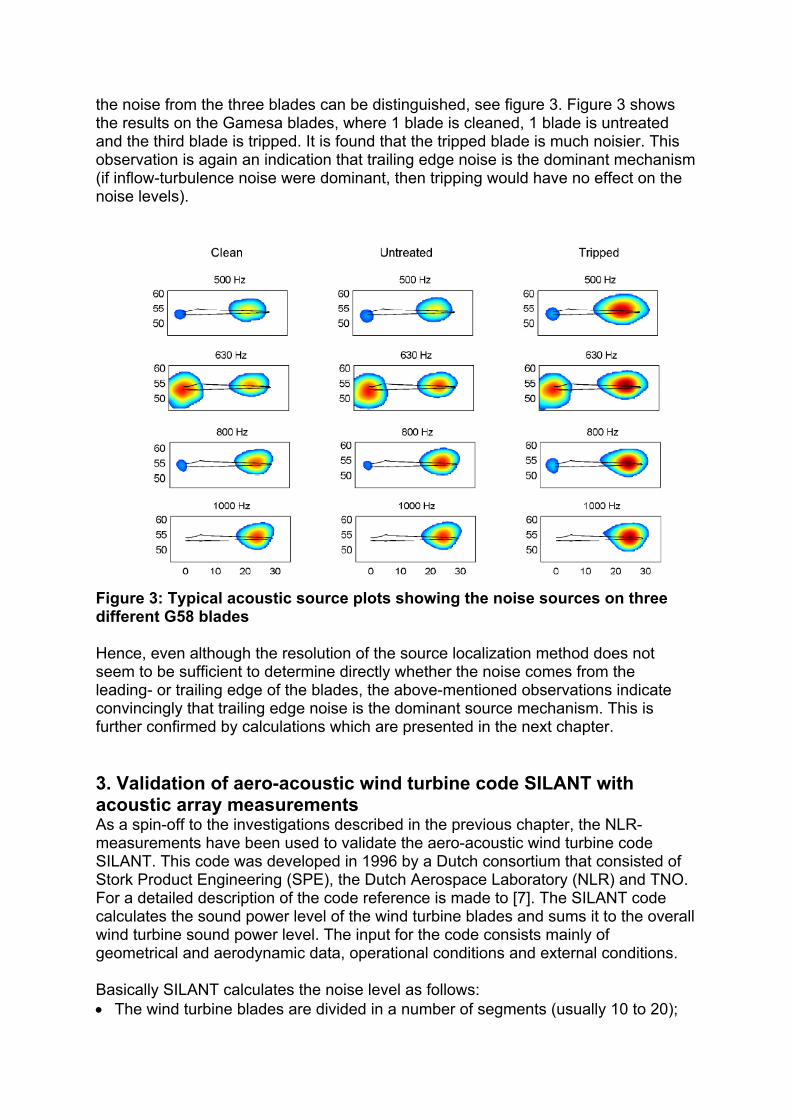
the noise from the three blades can be distinguished, see figure 3. Figure 3 shows the results on the Gamesa blades, where 1 blade is cleaned, 1 blade is untreated and the third blade is tripped. It is found that the tripped blade is much noisier. This observation is again an indication that trailing edge noise is the dominant mechanism (if inflow-turbulence noise were dominant, then tripping would have no effect on the noise levels).
Figure 3: Typical acoustic source plots showing the noise sources on three different G58 blades Hence, even although the resolution of the source localization method does not seem to be sufficient to determine directly whether the noise comes from the leading- or trailing edge of the blades, the above-mentioned observations indicate convincingly that trailing edge noise is the dominant source mechanism. This is further confirmed by calculations which are presented in the next chapter. 3. Validation of aero-acoustic wind turbine code SILANT with acoustic array measurements As a spin-off to the investigations described in the previous chapter, the NLR-measurements have been used to validate the aero-acoustic wind turbine code SILANT. This code was developed in 1996 by a Dutch consortium that consisted of Stork Product Engineering (SPE), the Dutch Aerospace Laboratory (NLR) and TNO. For a detailed description of the code reference is made to [7]. The SILANT code calculates the sound power level of the wind turbine blades and sums it to the overall wind turbine sound power level. The input for the code consists mainly of geometrical and aerodynamic data, operational conditions and external conditions. Basically SILANT calculates the noise level as follows: • The wind turbine blades are divided in a number of segments (usually 10 to 20);

• For every blade segment two noise sources are calculated: o Trailing edge noise: According to the model of Brooks, Pope and Marcolini
[8]. o Inflow noise: According to the model of Amiet and Lowson [9]
The noise sources are ('acoustically') summed over the segments in order to obtain the total blade and turbine sound power level.
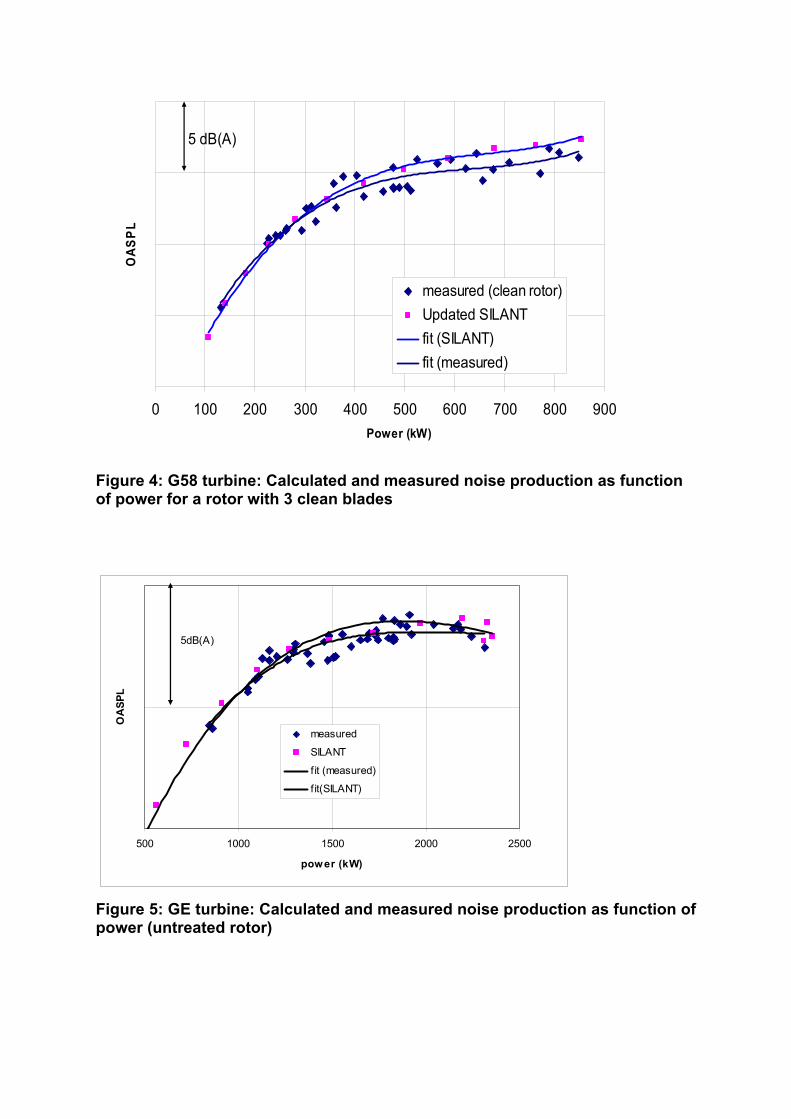
The above-mentioned models from Amiet and Lowson and the model from Brooks, Pope and Marcolini require the following data for each blade segment: • Reynolds number; • Pressure and suction side boundary layer displacement thicknesses. The displacement thicknesses come from a database, which was created a-priori and delivered along with the SILANT program. These displacement thicknesses were calculated with the RFOIL airfoil design and analysis code [11] for a number of angles of attacks, Reynolds numbers and airfoils. RFOIL is developed by ECN, NLR and DUT. It is an extension of XFOIL [10], taking into account rotational effects. The Reynolds number and angle of attack for each blade segment are obtained from an aerodynamic wind turbine model, based on the blade element momentum theory. The comparison between the SILANT results and the G58 measurements is already presented in [2] and [3]. At a later stage some refinements were made to the SILANT code and the results from the updated code are presented in the figures 4 and 5. They show the SILANT calculated and measured overall sound power level as function of the electrical power (The G58 calculated power is aerodynamic power). It is noted that no results can be presented for above rated conditions due to the fact that the noise-power curve becomes multi-valued at constant rated power. Generally speaking a very good agreement is found. A slight overprediction is found in the G58 calculations, but it must be noted that the measured overall sound power level as detected from an array of microphones will be too low in the order of 2 dB(A). This is due to the fact that the noise levels as measured by the array of microphones will not be fully coherent over the array area [21]. The measured values for the GE turbine have been corrected for this effect.
0 100 200 300 400 500 600 700 800 900Power (kW)
OAS
PL
measured (clean rotor)Updated SILANTfit (SILANT)fit (measured)
5 dB(A)
Figure 4: G58 turbine: Calculated and measured noise production as function of power for a rotor with 3 clean blades
500 1000 1500 2000 2500
power (kW)
OA
SPL
measured
SILANT
fit (measured)
fit(SILANT)
5dB(A)
Figure 5: GE turbine: Calculated and measured noise production as function of power (untreated rotor)
Furthermore SILANT has been used to compare the inflow noise to the trailing edge noise. For both turbines the trailing edge noise exceeds the inflow noise with at least 8 dB(A) for all wind speeds. This is a further indication that trailing edge noise is dominant. A more detailed comparison of the calculated and measured noise predictions is described in [21]. In this paper the source strengthes as calculated by SILANT at different radial segments of the wind turbine blade are input to the same acoustic array processing code as in the experiments, which then enables a direct comparison to the measured results. 4. Aero-acoustic design methodology The main aim of the SIROCCO project is to design low-noise blades. Thereto the airfoils at the noisiest outer part of the blade are replaced by acoustically optimised airfoils with the same aerodynamic performance. The low noise airfoils were designed with a combined (2D) aerodynamic/aero-acoustic model, which was implemented into a numerical optimisation tool, see also [5], [20]. The basic philosophy in the design of low noise airfoils relies on the idea to modify the boundary layer state at the trailing edge. This is mainly accomplished by adjusting the main pressure recovery at the rear part of the airfoil. For this purpose an aero-acoustic design methodology, which is capable of modelling the boundary layer around an airfoil and the resulting noise levels was required. As described in [5] it was originally attempted to design airfoils using the noise prediction scheme developed by TNO-TPD in the EU project DRAW [12]. This TNO-TPD model is based on the theory proposed by Chandiramani [13] and Blake [14]. It essentially calculates the spectrum of the trailing edge noise from several boundary layer properties, one of which is the mean velocity profile u(y) at the trailing edge. This profile is approximated from an integral boundary layer procedure based on integral parameters like displacement thickness, momentum thickness or skin friction, where the boundary layer profiles were assumed to behave according to the Coles law of the wall profile in combination with the law of the wake. The integral boundary layer parameters were calculated by the airfoil design and analysis code XFOIL [10]. Apart from the mean boundary layer profile u(y), the TNO-TPD model requires a number of turbulence quantities across the boundary layer at the trailing edge, which are calculated from a mixing length approach. Furthermore the integral length scale Λ2 of the vertical velocity fluctuations in the boundary layer is required, which was found by multiplication of a specific turbulence length scale with an empirical constant. It was found that such methodology is not suitable for designing low noise airfoils. This is mainly due to the assumption of the boundary layer being in equilibrium, where the low noise airfoils, due the adjustment of the main pressure recovery at the rear part of the airfoils, have flow regions with a significant acceleration/deceleration. Such flow regions violate the equilibrium boundary layer approach, which forms the basis for the Coles velocity profile, the mixing length approach, and the assumption of a constant scaling factor to calculate the Λ2 from a given turbulence length scale.
The fact that the equilibrium approach is not valid, was among others proven by an extensive experimental program in the Laminar Wind Tunnel from the University of Stuttgart where boundary layer measurements on an airfoil with a variable trailing edge (and consequent pressure recovery) were carried out, see section 5. Hence it was necessary to take into account the history and anisotropy effects in the boundary layer. Therefore the aero-acoustic design method was changed. Although the acoustic part remained essentially the same, the boundary layer was represented with the finite-difference EDDYBL procedure in combination with a stress-ω turbulence model [15]. In this way the boundary layer and the turbulence equations are solved on a computational grid with discretisation in streamwise and wall normal direction. The stress-ω turbulence model provides a direct estimate of the turbulent properties at the grid points, in which the anisotropy and history effects of the boundary layer are automatically taken into account. The stress-ω turbulence model also calculates a turbulence length scale, which is then used to derive the Λ2 scale. The relation between the 'stress-ω turbulence length scale' and the Λ2 is determined semi-empirically from the experimental database with measurements on the airfoil with variable trailing edge (section 5). Opposite to the previously used scaling factors it takes into account the boundary layer development. In this way the scaling factor has become variable instead of constant. The combined aero-acoustic models have been implemented into the numerical optimisation environment POEM [5]. This made it possible to generate airfoil shapes with a minimal noise production in an automatic way. The resulting design methodology produced airfoils which were indeed quieter, as demonstrated in the wind tunnel measurements (see section 5.1 and 5.2). It must be noted that the inclusion of the constraints imposed by the manufacturer played an important role. This holds among others for aerodynamic and geometric requirements. One can think of constraints on cl,max, α0, cl/cd, stall characteristics, parts of the airfoil geometry which should remain unchanged etc. It is noted that for the GE airfoil, a challenge arose due to an additional constraint on clmax compared to the baseline airfoil. To meet this constraint, it was necessary to introduce a sharp suction peak that consequently produces an increase in noise above the design cl. As a result, if the airfoil operates above the intended design point, a reduction in the noise gain is to be expected. It should be emphasized that these constraints are a result of the fact that the present project aims to modify existing blades. It is only the outer part of the blade that will be equipped with new airfoils and in order to fit the outer and inner part, constraints should be imposed on the aerodynamic behaviour of the new airfoils. If low noise blades were designed from 'scratch', many constraints could be released, which, by definition, yields better performance.
5. 2D wind tunnel measurements In the previous section, it was already pointed out that 2D wind tunnel measurements have been carried out which supported and validated the theoretical design efforts. Several types of wind tunnel measurements have been performed. Roughly speaking they can be distinguished into the following categories: 1. Measurements on an airfoil with a variable trailing edge (VTE). The upper airfoil
shape has been made variable between x/c = 0.4 and x/c =1.0, leading to different pressure recoveries at the rear part of the suction side. These measurements aimed to understand the effect of different pressure recoveries on the trailing edge boundary layer properties. They proved, among others, that the equilibrium approach was not valid for low noise airfoils and it led to the selection of appropriate turbulence models for the noise models (see section 4);
2. Measurements of aerodynamic polars cl, cd (α) etc. on the reference airfoils and the optimised airfoils. These measurements aimed to verify the aerodynamic performance of the optimised airfoils in comparison with the performance of the reference airfoil;
3. Acoustic measurements on the reference airfoils and the optimised airfoils. These measurements aimed to verify the acoustic behaviour of the optimised airfoils in comparison with the behaviour of the reference airfoils.
Most of these measurements were done in the Laminar Wind Tunnel (LWT) of the Institute of Aerodynamics and Gas Dynamics, University of Stuttgart. The exception lies in the acoustic measurements on the G58 airfoils, which were also done in DLR's Aeroacoustic Wind Tunnel AWB, which is located in Braunschweig. The AWB measurements were performed under supervision of NLR. The acoustic measurements on the GE airfoils were only carried out by USTUTT in their LWT using the new Coherent Particle Velocimetry Method (CPV) technique, which is described in [16, 17, 18]. This method is comparable to the COP method by Hutcheson and Brooks [19], but instead of microphones special hot wire sensors are used to measure the particle velocity of the sound wave. Due to the high directional sensitivity of the hot wires it is possible to improve significantly the SNR with respect to parasitic background noise. The use of cross-correlation technique for the signal processing further suppresses uncorrelated noise sources. Numerical simulation of the sensitivity of the whole experimental set-up with respect to the sound radiated by a line source located at the trailing edge finally leads to quantitative sound pressure levels at a selected observer position. Within the framework of SIROCCO the CPV method was applied for TE-noise measurements on cambered airfoil sections for the first time. Detailed comparisons with array measurements performed in the AWB on the same wind tunnel models showed a very good quantitative agreement. Therefore the GE airfoils could be validated aerodynamically and acoustically in a single test campaign in the LWT. Beside a significant speed up of the validation procedure, the drawback of open jet effects [6] present in the AWB are completely avoided and the consistency of the data increased.
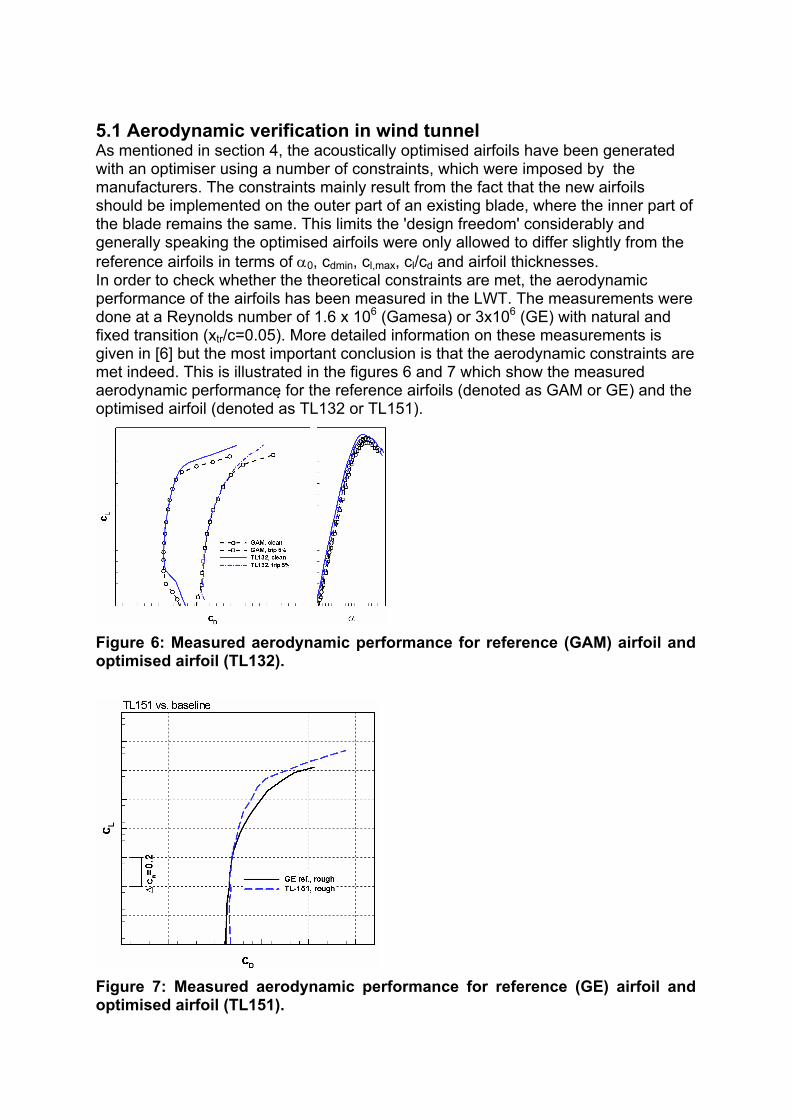
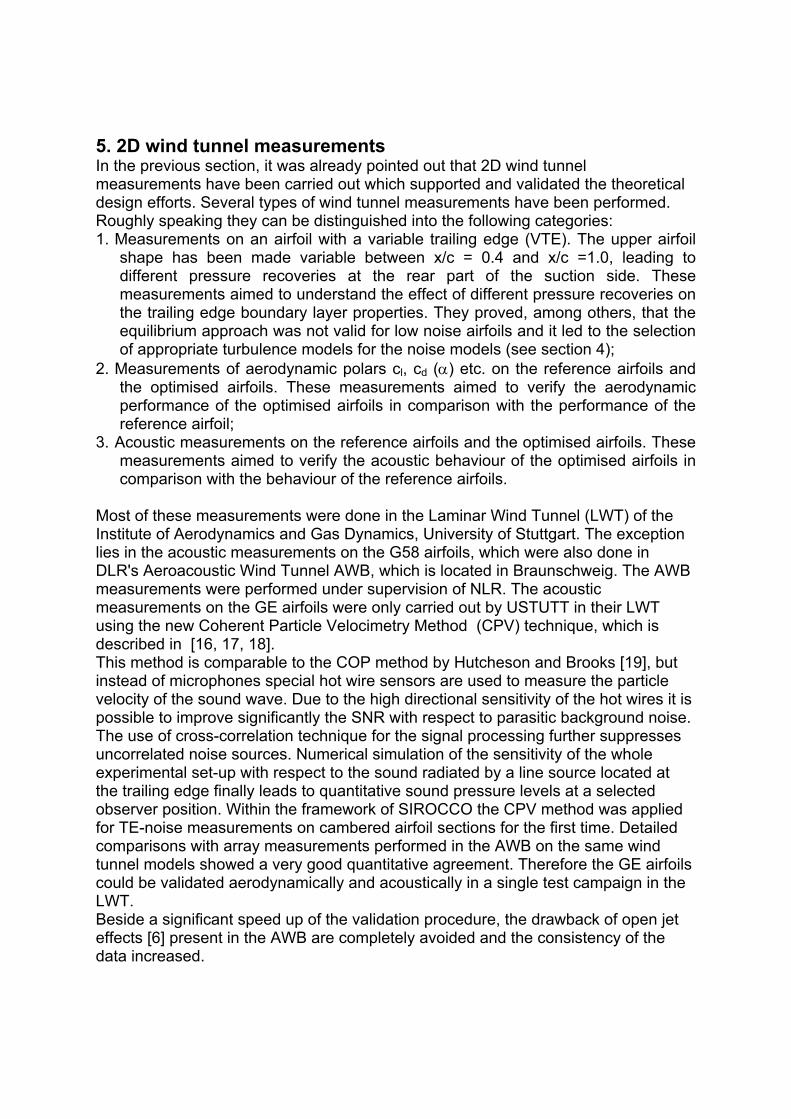
5.1 Aerodynamic verification in wind tunnel As mentioned in section 4, the acoustically optimised airfoils have been generated with an optimiser using a number of constraints, which were imposed by the manufacturers. The constraints mainly result from the fact that the new airfoils should be implemented on the outer part of an existing blade, where the inner part of the blade remains the same. This limits the 'design freedom' considerably and generally speaking the optimised airfoils were only allowed to differ slightly from the reference airfoils in terms of α0, cdmin, cl,max, cl/cd and airfoil thicknesses. In order to check whether the theoretical constraints are met, the aerodynamic performance of the airfoils has been measured in the LWT. The measurements were done at a Reynolds number of 1.6 x 10⁶ (Gamesa) or 3x10⁶ (GE) with natural and fixed transition (xtr/c=0.05). More detailed information on these measurements is given in [6] but the most important conclusion is that the aerodynamic constraints are met indeed. This is illustrated in the figures 6 and 7 which show the measured aerodynamic performance for the reference airfoils (denoted as GAM or GE) and the optimised airfoil (denoted as TL132 or TL151).
Figure 6: Measured aerodynamic performance for reference (GAM) airfoil and optimised airfoil (TL132).
Figure 7: Measured aerodynamic performance for reference (GE) airfoil and optimised airfoil (TL151).

5.2 Acoustic verification of optimised airfoils in wind tunnel In order to validate the noise reduction, which was expected from the combined aerodynamic/aero-acoustic design method, wind tunnel measurements were performed of the noise production of the optimised airfoils and the reference airfoils. The acoustic measurements on the G58 airfoils were carried out in both the AWB tunnel of DLR and the LWT tunnel [6], where the acoustic measurements on the GE airfoils were only carried out in the LWT tunnel. The measurements on the G58 airfoils were mostly done at a Reynolds number of 1.6x10⁶ with natural and fixed transition (xtr/c=0.05) and the measurements on the GE airfoils were done at a Reynolds number of 3x10⁶ (xtr/c=0.05) For the G58 airfoils, generally speaking a noise reduction is found between 1.0 and 1.5 dB(A), see figure 8. This figure shows the total sound pressure levels of the two airfoils (the reference airfoil, GAM and the optimised airfoil TL132) for tripped conditions (for clean conditions a slightly larger reduction is found) for both the AWB and the LWT wind tunnel. It is noted that the noise reduction is mainly obtained at the lower frequencies (say f < 1500 Hz), where the higher frequencies show a noise increase. Figure 6 shows the expected noise reduction for the GE airfoils. The noise reduction turns out to be in the order of 2-3 dB(A). This noise reduction too, is mainly reached at the low frequencies.
Figure 8: Total sound pressure level for reference (GAM) and optimised (TL132) airfoil as function of cl ); tripped conditions

Figure 9: Total sound pressure level for reference (GE) and optimised (TL151) airfoil as function of cl
6. Field measurements As described in the previous chapter, the 2D wind tunnel measurements on the newly designed airfoils, led to a noise reduction at the same aerodynamic performance. In order to assess the possible noise reduction from these airfoils in the 3D environment, i.e. on a full scale rotating blade, the industrial partners (Gamesa and GE) incorporated the new airfoils in the outer part of the blade. The optimised blade (denoted as SIR blade in the sequel of this paper) then replaced one of the baseline blades. This results in a ‘hybrid’ rotor with one SIR blade and two baseline blades. The question whether or not a noise reduction is achieved is answered with acoustic array measurements from NLR. This measurement technique (see section 2) makes it possible to distinguish the noise production of the separate blades. Hence the use of a hybrid rotor enables a direct comparison of the noise production on the different blades at (almost) similar conditions, and as such the achieved noise reduction from the acoustic airfoils can be assessed in a direct way. The remaining question, i.e. the question whether the aerodynamic performance of the SIR blade is similar to the performance of the baseline blades is more difficult to answer. Thereto ECN measured the blade root bending moments on the GE turbine. The use of a hybrid rotor then makes it possible to compare directly the loading of the separate blades at almost similar conditions. It must be realised however that these blades loads are not a ‘pure’ aerodynamic quantity since they are also affected by the structural dynamic behaviour of the blade. Therefore additional information (for the G58 turbine: The only information) is searched from a comparison of the measured rotor performance on the baseline rotor and the Sirocco rotor. It should be realized that such procedure is far from ideal when trying to assess a possible difference in aerodynamic performance from the acoustic airfoils. This is partly due to the fact that the overall performance is not very sensitive to the aerodynamics of the silent airfoil: Only one blade on the Sirocco turbine will be affected by a difference from the silent airfoils and the other two blades (which also contribute to the overall power) are unaffected. An additional problem lies in the fact that a

relatively small difference needs to be assessed from results, which are measured at different periods of time in the free atmosphere. Such comparison is obviously complicated due to the expected small differences and by the stochastic nature of the wind conditions. 6.1 Field measurements on G58 turbine The measurement program on the G58 turbine can roughly be characterised as follows:
• Between October 2005 and April 2006 long term power performance measurements were carried out on the baseline turbine.
• Subsequently in April 2006 dedicated acoustic measurements were carried out in different phases, see table 1. In this table, the SIR blade denotes the optimised blade and the G58_1 and G58_2 blades denote the original Gamesa blades. It can be seen that three states have been measured where all three blades are treated differently. Among others blades have been cleaned and/or tripped. Furthermore two types of brushes have been applied at the trailing edge of the blade. These brushes are acoustic devices which are expected to reduce the noise level. The purpose of state 1 was to assess the acoustic performance of the SIR blade for clean conditions, and to get an indication of the aerodynamic state of the untreated blade. The purpose of state 2 was to assess the acoustic performance of the SIR blade for tripped conditions, and to determine the acoustic effect of brush 1. The purpose of state 3 was to test the effect of brush 2, and to obtain a comparison between the two nominally identical tripped G58 blades, as a reference for the brush 1 effect in State 2.
o All blade treatments, except the cleaning of the G58_1 blade (which was done when the rotor was on the ground), were carried out by climbers.
o The state of the three blades was inspected prior to the acoustic measurements, when the rotor was on the ground, directly before the acoustic measurements. Unfortunately, due to the handcraft manufacturing techniques employed in order to keep the price of the blade within the budget, the surface quality of the new SIROCCO blade was found to be rougher than those of the two G58 blades, manufactured using industrial processes and techniques. Moreover, in contrast to the G58 blades the SIROCCO blade was equipped with an anti-erosion band on the leading edge of the blade, which effectively acts as a trip. Due to these observations it was decided to adjust the turbulator positions to the anti-erosion band on the SIR blade in order to make a fair comparison. Finally the actual SIR blade contour was found to deviate from the prescribed TL-132 airfoil, as a result of the positive manufacturing technique used.
o The 'trip*' entry for the G58_2 blade, see table 1, indicates that at some point during state 2 this blade started to whistle (most of the time). After removal of the brush for state 3 the whistle was still present, so it was probably caused by a partially loose trip.
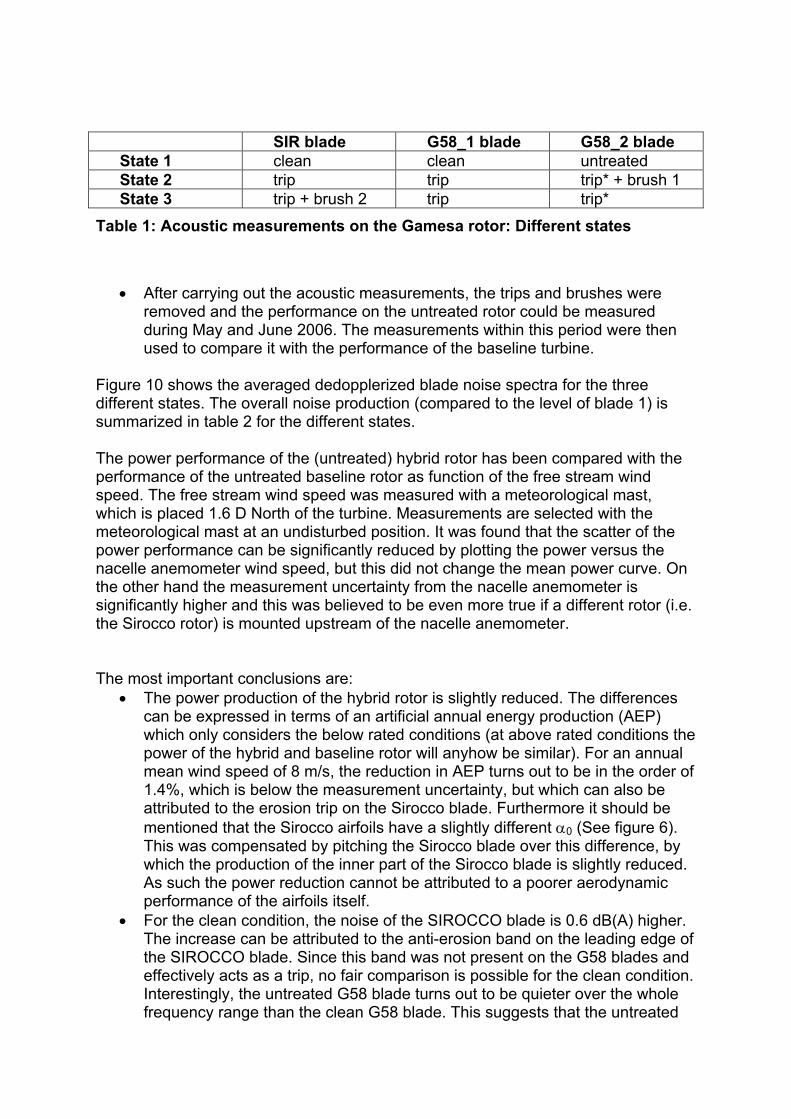
SIR blade G58_1 blade G58_2 blade State 1 clean clean untreated State 2 trip trip trip* + brush 1 State 3 trip + brush 2 trip trip*
Table 1: Acoustic measurements on the Gamesa rotor: Different states
• After carrying out the acoustic measurements, the trips and brushes were removed and the performance on the untreated rotor could be measured during May and June 2006. The measurements within this period were then used to compare it with the performance of the baseline turbine.
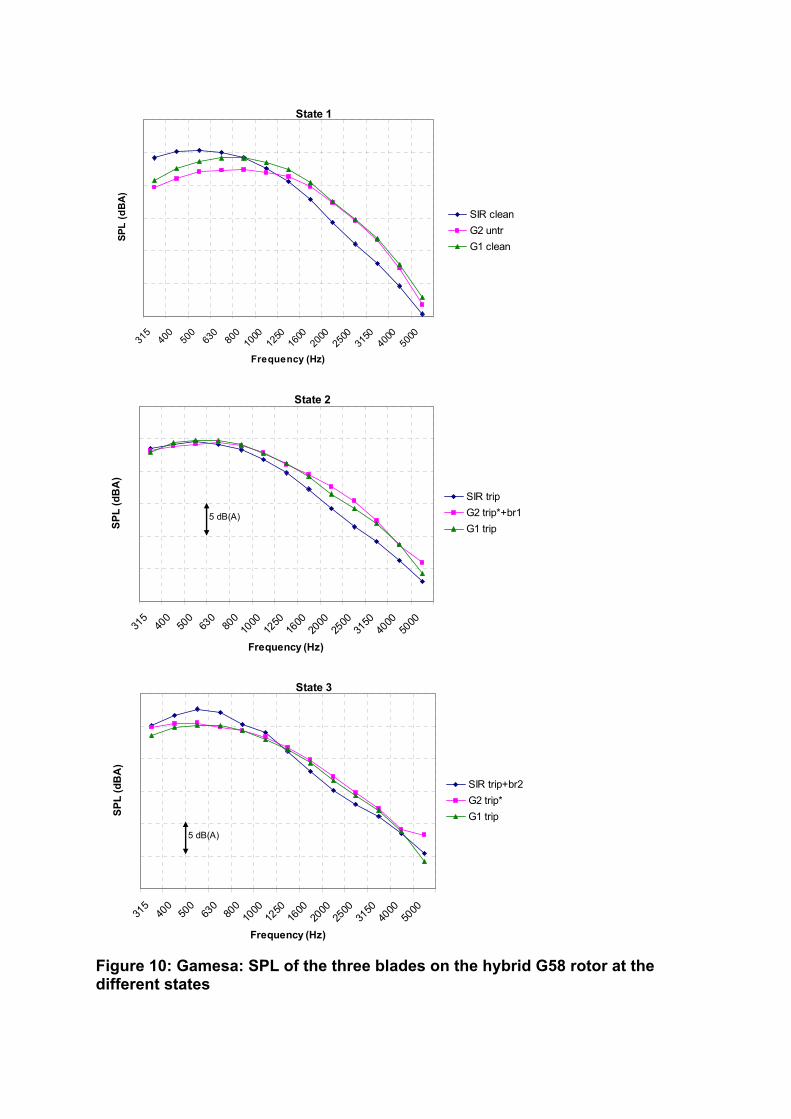
Figure 10 shows the averaged dedopplerized blade noise spectra for the three different states. The overall noise production (compared to the level of blade 1) is summarized in table 2 for the different states. The power performance of the (untreated) hybrid rotor has been compared with the performance of the untreated baseline rotor as function of the free stream wind speed. The free stream wind speed was measured with a meteorological mast, which is placed 1.6 D North of the turbine. Measurements are selected with the meteorological mast at an undisturbed position. It was found that the scatter of the power performance can be significantly reduced by plotting the power versus the nacelle anemometer wind speed, but this did not change the mean power curve. On the other hand the measurement uncertainty from the nacelle anemometer is significantly higher and this was believed to be even more true if a different rotor (i.e. the Sirocco rotor) is mounted upstream of the nacelle anemometer. The most important conclusions are:
• The power production of the hybrid rotor is slightly reduced. The differences can be expressed in terms of an artificial annual energy production (AEP) which only considers the below rated conditions (at above rated conditions the power of the hybrid and baseline rotor will anyhow be similar). For an annual mean wind speed of 8 m/s, the reduction in AEP turns out to be in the order of 1.4%, which is below the measurement uncertainty, but which can also be attributed to the erosion trip on the Sirocco blade. Furthermore it should be mentioned that the Sirocco airfoils have a slightly different α0 (See figure 6). This was compensated by pitching the Sirocco blade over this difference, by which the production of the inner part of the Sirocco blade is slightly reduced. As such the power reduction cannot be attributed to a poorer aerodynamic performance of the airfoils itself.
• For the clean condition, the noise of the SIROCCO blade is 0.6 dB(A) higher. The increase can be attributed to the anti-erosion band on the leading edge of the SIROCCO blade. Since this band was not present on the G58 blades and effectively acts as a trip, no fair comparison is possible for the clean condition. Interestingly, the untreated G58 blade turns out to be quieter over the whole frequency range than the clean G58 blade. This suggests that the untreated
blade was aerodynamically clean and that small deviations from the nominal blade contour can have a significant effect on the noise.
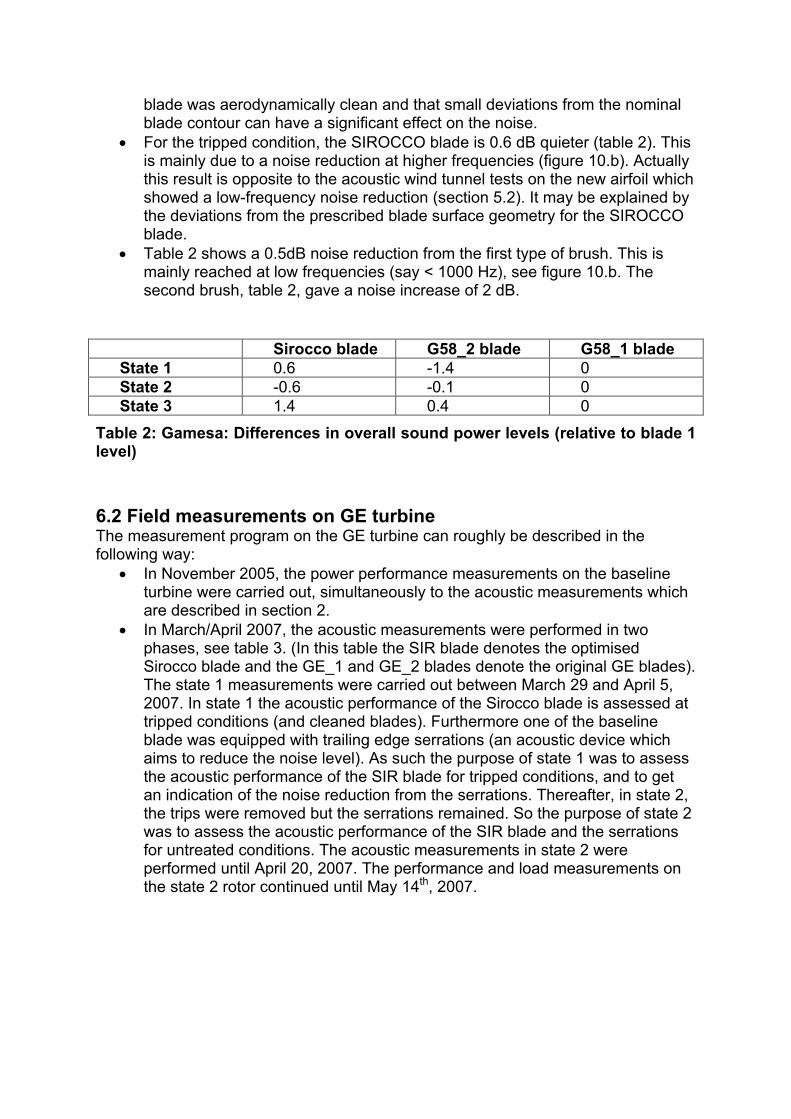
• For the tripped condition, the SIROCCO blade is 0.6 dB quieter (table 2). This is mainly due to a noise reduction at higher frequencies (figure 10.b). Actually this result is opposite to the acoustic wind tunnel tests on the new airfoil which showed a low-frequency noise reduction (section 5.2). It may be explained by the deviations from the prescribed blade surface geometry for the SIROCCO blade.
• Table 2 shows a 0.5dB noise reduction from the first type of brush. This is mainly reached at low frequencies (say < 1000 Hz), see figure 10.b. The second brush, table 2, gave a noise increase of 2 dB.
Sirocco blade G58_2 blade G58_1 blade State 1 0.6 -1.4 0 State 2 -0.6 -0.1 0 State 3 1.4 0.4 0
Table 2: Gamesa: Differences in overall sound power levels (relative to blade 1 level) 6.2 Field measurements on GE turbine The measurement program on the GE turbine can roughly be described in the following way:
• In November 2005, the power performance measurements on the baseline turbine were carried out, simultaneously to the acoustic measurements which are described in section 2.
• In March/April 2007, the acoustic measurements were performed in two phases, see table 3. (In this table the SIR blade denotes the optimised Sirocco blade and the GE_1 and GE_2 blades denote the original GE blades). The state 1 measurements were carried out between March 29 and April 5, 2007. In state 1 the acoustic performance of the Sirocco blade is assessed at tripped conditions (and cleaned blades). Furthermore one of the baseline blade was equipped with trailing edge serrations (an acoustic device which aims to reduce the noise level). As such the purpose of state 1 was to assess the acoustic performance of the SIR blade for tripped conditions, and to get an indication of the noise reduction from the serrations. Thereafter, in state 2, the trips were removed but the serrations remained. So the purpose of state 2 was to assess the acoustic performance of the SIR blade and the serrations for untreated conditions. The acoustic measurements in state 2 were performed until April 20, 2007. The performance and load measurements on the state 2 rotor continued until May 14th, 2007.
State 1
315
400
500
630
800
1000
1250
1600
2000
2500
3150
4000
5000
Frequency (Hz)
SPL
(dB
A)
SIR cleanG2 untrG1 clean
State 2
315
400
500
630
800
1000
1250
1600
2000
2500
3150
4000
5000
Frequency (Hz)
SPL
(dB
A)
SIR tripG2 trip*+br1G1 trip
5 dB(A)
State 3
315
400
500
630
800
1000
1250
1600
2000
2500
3150
4000
5000
Frequency (Hz)
SPL
(dB
A)
SIR trip+br2G2 trip*G1 trip
5 dB(A)
Figure 10: Gamesa: SPL of the three blades on the hybrid G58 rotor at the different states

o The first blade treatments needed for state 1 (i.e. the mounting of the serrations and the cleaning of the blade) were done when the rotor was on the ground. The removal of the trips was carried out by climbers.
o The state of the three blades was inspected prior to the acoustic measurements, when the rotor was on the ground. Generally speaking the blade quality turned out to be very acceptable although some deviations occurred in the shape of the pressure side of both reference blades at one radial position.
o Due to persisting low wind speeds from the wrong direction, the pre-defined criteria for the acoustic measurements (see section 2) could only be met for state 2, which was considered to be most important state. For state 1, measurements were only obtained for the lowest three wind speed bins, with the array facing the back side of the rotor. Such 'back side' measurements were also done in state 2, but they will not be reported in this paper. As such the present paper only discusses the clean results with the array upstream of the turbine.
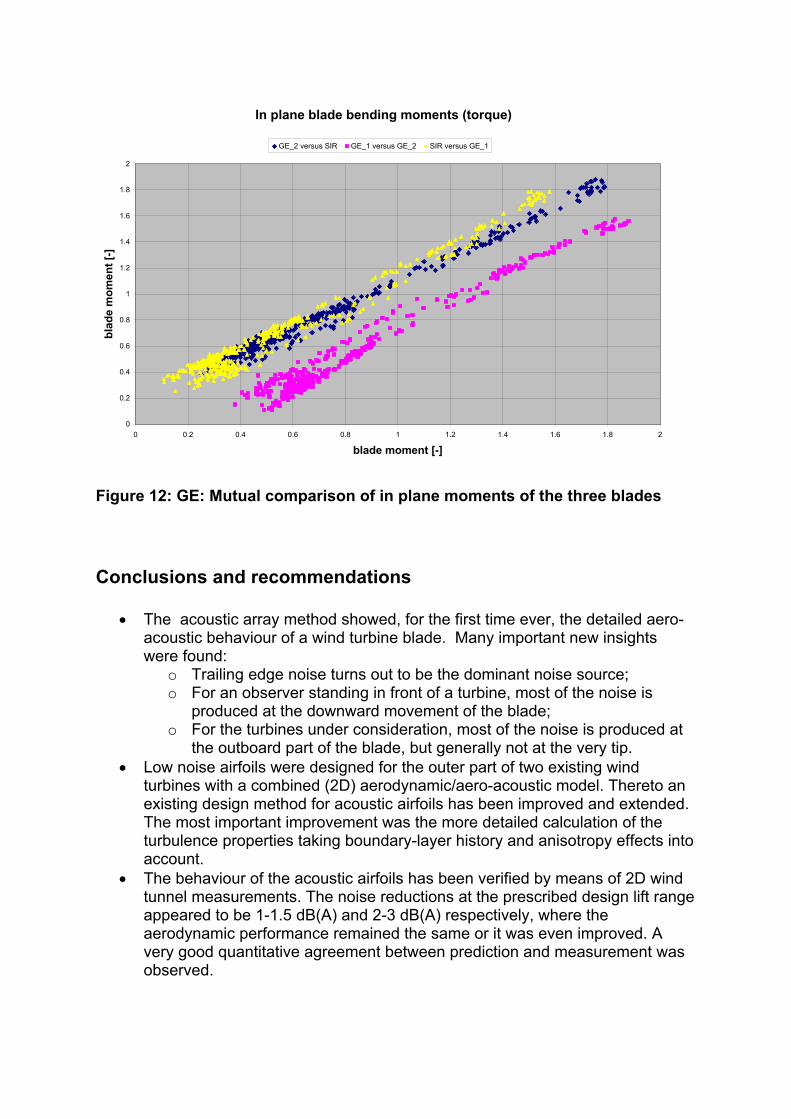
The power performance of the (untreated) hybrid rotor is compared with the production of the untreated baseline rotor as function of the free stream wind speed. The free stream wind speed is measured with a meteorological mast placed 2.36 D from the turbine where wind directions are selected with the met-mast beside the turbine. The figures 11 and 12 show the mutual comparison of the out-of-plane and in-plane moments on the different blades (averaged values per data point), where the latter shows the contribution of the blade to the rotor shaft torque (note that the sum of these three blade moments resulted in the rotor shaft torque indeed). In table 4 the differences in overall sound power levels are presented.
SIR blade GE_1 blade GE_2 blade State 1 clean with trip clean with trip clean with trip +
serrations State 2 untreated untreated serrations
Table 3: Acoustic measurements on the GE rotor: Different states The most important conclusions are as follows:
• The power production of the hybrid rotor turns out to be slightly higher than the production of the baseline turbine. The differences can again be expressed in terms of an artificial annual energy production (AEP) which only takes into account the below rated conditions. For an annual mean wind speed of 8 m/s the increase in Annual Energy Production is in the order of 2.8%. The figures 11 and 12 show the moments of the Sirocco blade to be similar to the moments on the blade with serrations, but at a level which is slightly higher than the loads on the baseline blade. The differences in blade loads may be caused by a slightly higher performance of the modified blades. It must be mentioned however that, in particular for the mean in-plane loads, the measurement uncertainty is large and the differences are within the
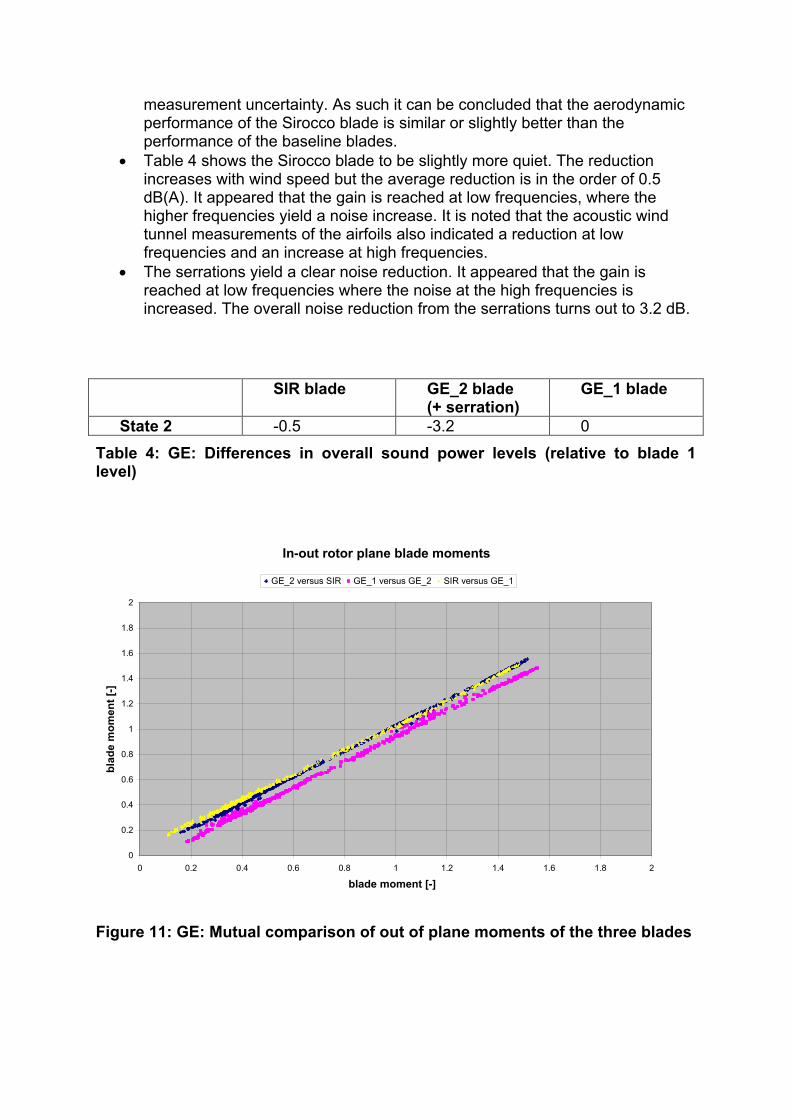
measurement uncertainty. As such it can be concluded that the aerodynamic performance of the Sirocco blade is similar or slightly better than the performance of the baseline blades.
• Table 4 shows the Sirocco blade to be slightly more quiet. The reduction increases with wind speed but the average reduction is in the order of 0.5 dB(A). It appeared that the gain is reached at low frequencies, where the higher frequencies yield a noise increase. It is noted that the acoustic wind tunnel measurements of the airfoils also indicated a reduction at low frequencies and an increase at high frequencies.
• The serrations yield a clear noise reduction. It appeared that the gain is reached at low frequencies where the noise at the high frequencies is increased. The overall noise reduction from the serrations turns out to 3.2 dB.
SIR blade GE_2 blade
(+ serration) GE_1 blade
State 2 -0.5 -3.2 0
Table 4: GE: Differences in overall sound power levels (relative to blade 1 level)
In-out rotor plane blade moments
0
0.2
0.4
0.6
0.8
1
1.2
1.4
1.6
1.8
2
0 0.2 0.4 0.6 0.8 1 1.2 1.4 1.6 1.8 2
blade moment [-]
blad
e m
omen
t [-]
GE_2 versus SIR GE_1 versus GE_2 SIR versus GE_1
Figure 11: GE: Mutual comparison of out of plane moments of the three blades
In plane blade bending moments (torque)
0
0.2
0.4
0.6
0.8
1
1.2
1.4
1.6
1.8
2
0 0.2 0.4 0.6 0.8 1 1.2 1.4 1.6 1.8 2
blade moment [-]
blad
e m
omen
t [-]
GE_2 versus SIR GE_1 versus GE_2 SIR versus GE_1
Figure 12: GE: Mutual comparison of in plane moments of the three blades Conclusions and recommendations
• The acoustic array method showed, for the first time ever, the detailed aero-acoustic behaviour of a wind turbine blade. Many important new insights were found:
o Trailing edge noise turns out to be the dominant noise source; o For an observer standing in front of a turbine, most of the noise is
produced at the downward movement of the blade; o For the turbines under consideration, most of the noise is produced at
the outboard part of the blade, but generally not at the very tip. • Low noise airfoils were designed for the outer part of two existing wind
turbines with a combined (2D) aerodynamic/aero-acoustic model. Thereto an existing design method for acoustic airfoils has been improved and extended. The most important improvement was the more detailed calculation of the turbulence properties taking boundary-layer history and anisotropy effects into account.
• The behaviour of the acoustic airfoils has been verified by means of 2D wind tunnel measurements. The noise reductions at the prescribed design lift range appeared to be 1-1.5 dB(A) and 2-3 dB(A) respectively, where the aerodynamic performance remained the same or it was even improved. A very good quantitative agreement between prediction and measurement was observed.
• Field measurements showed the noise reduction from these airfoils to be in the order of 0.5 dB(A) where the aerodynamic performance remains the same.
• It is not fully understood yet why the noise reduction in the field is lower than the noise reduction in the wind tunnel. Apart from blade quality, it is possible that instationary inflow conditions in the field lead to lift fluctuations well beyond the prescribed design lift range. This will further be investigated in order to include the off design behaviour into the airfoil design methodology.
• The present project showed that it is possible to design airfoils which fully maintain their aerodynamic behaviour but which at the same time can meet additional acoustic criteria. As such it is recommended to add, if relevant, these acoustic criteria in the future designs of airfoils.
• Acoustic devices have been added to the trailing edge of a wind turbine blade. It was shown that these devices can lead to an additional noise reduction
• A very good agreement was found between the wind turbine noise prediction code SILANT and acoustic measurements
. Acknowledgement Financial support for this research was given in part by the European Commission's Fifth Framework Programme. Project Reference: ENK5-CT-2002-00702 Sirocco: SIlent ROtors by Acoustic Optimisation. ECN and NLR received additional funding from SenterNovem under project number 400003700 References [1]. S. Oerlemans, J. G. Schepers, G. Guidati, S. Wagner: 'Experimental demonstration of wind
turbine noise reduction through optimized airfoil shape and trailing-edge serrations', European Wind Energy Conference, Copenhagen, July 2001.
[2]. J.G. Schepers et al: Sirocco Silant Rotors bij Acoustic Optimisation, First International Meeting on Wind Turbine Noise: Perspectives for Control”, Berlin, 17-18 October 2005
[3]. J.G. Schepers et al Sirocco, Silent Rotors by Acoustic Optimisation, European Wind Energy Conference, Athens, February 2006
[4]. S. Oerlemans, B. Méndez López: Localisation and quantification of noise sources on a wind turbine, First International Meeting on Wind Turbine Noise: Perspectives for Control”, Berlin, 17-18 October 2005
[5]. Th. Lutz, A. Herrig, W. Würz, K. Braun, E. Krämer: Constrained Aerodynamic & Aeroacoustic Design of Wind-Rotor Airfoils, First International Meeting on Wind Turbine Noise: Perspectives for Control”, Berlin, 17-18 October 2005
[6]. A. Herrig, W. Würz, Th. Lutz , K. Braun and E. Krämer, S. Oerlemans: Trailing-Edge Noise Measurements of Wind Turbine Airfoils in Open and Closed Test Section Wind Tunnel First International Meeting on Wind Turbine Noise: Perspectives for Control”, Berlin, 17-18 October 2005
[7]. F. Hagg: User's documents SILANT (in Dutch), Stork Product Engineering, Amsterdam, December 1996
[8]. T.F. Brooks, D.S. Pope and M.A. Marcolini Airfoil Self Noise and prediction NASA, Reference publication1218, 1989
[9]. R.K Amiet, Acoustic radiation for an airfoil in a turbulent stream, Journal Sound Vib, Volume 41,
number 4, 1985, page 407 [10]. Drela, XFOIL: An analysis and design system for low Reynolds number airfoils, Low
Reynolds number aerodynamics, T. J. Mueller, Ed., University of Notre Dame, Paris, 1989 [11]. B. Montgomerie, A. Brand, J. Bosschers, R. van Rooij Three-dimensional effects in stall,
ECN-C--96-079, The Energy Research Center of the Netherlands, ECN, 1997
[12]. R. Parchen: Progress report DRAW: A prediction scheme for trailing edge noise based on detailed boundary layer characteristics. TNO-Report HAG-RPT-980023, TNO Institute of Applied Physics The Netherlands, 1998
[13]. K. Chandiramani: Diffraction of evanescent wave with application to aerodynamically scattered sound and radiation from unbaffled plates, J. Acoust. Soc. Amer. Vol. 55, 1974
[14]. W. Blake: Mechanics of Flow Induced Sound and Vibration Vol I and II, Acad. Press, 1986
[15]. D.C. Wilcox: Turbulence modelling for CFD. DCW Industries Inc., 2nd edition, ISBN 0-9636051-5-1, 1998
[16]. Wűrz, W.; Guidati, S.; Herrig, A.; Lutz, T.; Wagner, S.: Measurement of Trailing Edge Noise by a Coherent Particle Velocimetry Method. ICMAR Novosibirsk, 28.06.-02.07. 2004
[17]. Herrig A., Würz W., Lutz Th., Krämer E.: Trailing-Edge Noise Measurements using a Hot-Wire Based Coherent Particle Velocity Method, 24th AIAA Applied Aerodynamics Conference, San Francisco,5.-8.June 2006
[18]. Herrig A., Würz W., Lutz T,. Krämer E., Wagner S.: Measurement of Airfoil Trailing Edge Noise with the Coherent Particle Velocity Method, 33rd German Annual Conference on Acoustic, DAGA 2007
[19]. Hutcheson F.V. and Brooks T.F.: Measurement of Trailing Edge Noise using Directional Array and Coherent Output Power Methods, AIAA-paper 2002-2472, 8th AIAA/CEAS Aeroacoustics Conference, Colorado
[20]. Th. Lutz, W. Würz; A. Herrig; K. Braun, S. Wagner: Numerical Optimization of Silent Airfoil Sections, DEWEK 2004, 7th German wind energy conference, Wilhelmshaven, October 20/21, 2004
[21]. S. Oerlemans and J.G. Schepers ‘Prediction of Wind Turbine Noise and comparison to experiment Second International Meeting on Wind Turbine Noise’, Lyon, September 2007