SIPRI 2004 Military Expenditure 2003 Military expenditure and arms production project.
14
SIPRI 2004 Military Expenditure 2003 Military expenditure and arms production project
-
Upload
jerome-ellis -
Category
Documents
-
view
222 -
download
0
Transcript of SIPRI 2004 Military Expenditure 2003 Military expenditure and arms production project.

SIPRI 2004
Military Expenditure
2003
Military expenditure and arms production project

SIPRI 2004
World military spending 2003
• Increased by 11 % over 2002• Increased by 18 % over 2001• Amounted to $956 billion
SIPRI 2004
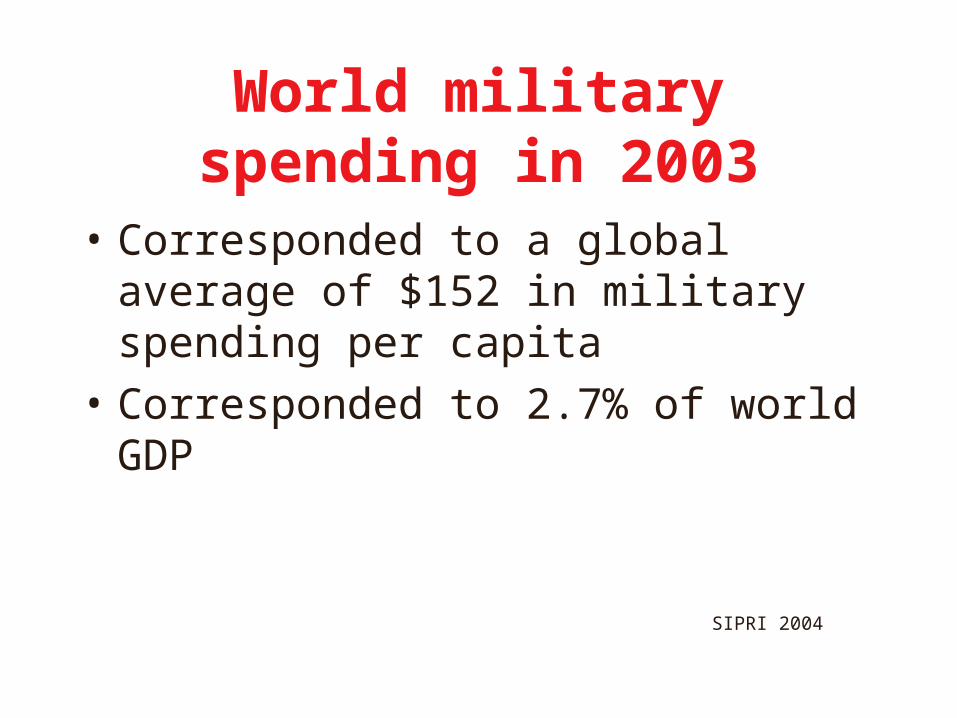
World military spending in 2003
• Corresponded to a global average of $152 in military spending per capita
• Corresponded to 2.7% of world GDP

SIPRI 2004
Global distribution of military spending, population and GDP
Military expenditure
High-income (32 countries)
75 %
Low- and middle income (126 countries)
Population High income (32 countries)
16 %
Low and middle income (126 countries)
84 %
Gross domestic product (GDP)
High income(32 countries)
81 %
Low and middle income(126 countries)
19 %

SIPRI 2004
The 32 high-income countries
• Spend 10 times more on the military sector than on official development aid
• Their military spending is roughly equal to the combined foreign debt of all 126 low and middle income countries

SIPRI 2004
The 126 low and middle income countries
• Account for a small share of world military expenditure
• But military spending still imposes a heavy burden on their economies

SIPRI 2004
0
100
200
300
400
500
600
700
800
900
1000
1994 1995 1996 1997 1998 1999 2000 2001 2002 2003
World
Year
Constant (2000) $ billion
World military expenditure 1994-2003

SIPRI 2004
World and regional military expenditure, 1994-2003
0
100
200
300
400
500
600
700
800
900
1000
1994 1995 1996 1997 1998 1999 2000 2001 2002 2003
Constant (2000) US$ billion
World
Americas
Europe
Asia & Oceania
Middle East
Africa

SIPRI 2004
0
100
200
300
400
500
600
700
800
900
1000
1994 1995 1996 1997 1998 1999 2000 2001 2002 2003
USA
World
Year
Constant (2000) $ billion
World and US military expenditure 1994-2003

SIPRI 2004
Global distribution of world military spending 2003
USA
47 %
Japan5 %
UK4 %
France4%
China 4%
The rest of the world(143 countries)18%
The next 10major spenders18 %

SIPRI 2004
US military expenditure 1950-2005 Figures are for outlays on National Defense
0
50
100
150
200
250
300
350
400
450
1950195219541956195819601962196419661968197019721974197619781980198219841986198819901992199419961998200020022004
Year
Constant (2000) $ billion
Source: The Budget of the United States Government, Historical Tables, March 2004.

SIPRI 2004
The 5 major spenders, 1994-2003
0
50
100
150
200
250
300
350
400
450
1994 1995 1996 1997 1998 1999 2000 2001 2002 2003
USA
JapanUKFranceChina
Year
Constant (2000) $ billion

SIPRI 2004
0
5
10
15
20
25
30
35
40
45
50
1994 1995 1996 1997 1998 1999 2000 2001 2002 2003
Japan
UK
France
China
Russia
India
Brazil
Constant (2000) $ billion
Year
Seven major spendersmilitary spending 1994-2003

SIPRI 2004
Global distribution of world military spending 2003
USA
47 %
Japan5 %
UK4 %
France4%
China 4%
The rest of the world(143 countries)18%
The next 10major spenders18 %