
Sintex Industries Ltd. - Rakesh...
9
Sintex Industries Ltd. Sintex Industries Ltd. Stock Idea Plastic and Textile Rating: BUY Date February 22, 2017 CMP (Rs.) 93 Target (Rs.) 128 Potential Upside 37% BSE Sensex 28865 NSE Nifty 8927 Scrip Code Bloomberg SINT IN Reuters SNTXBO BSE Group A BSE Code 502742 NSE Symbol SINTEX Market Data Market Cap.(Rs. Cr) 4926 Equity Sh. Cap. (Rs Cr) 52.3 52 Wk High/Low 98/63 Avg. Quarterly Volume 4427669 Face Value (Rs.) 1 Shareholding Pattern (Dec-16) Comparative Price Chart Varsha Bang Research Analyst [email protected] Arun Gopalan Vice President – Research [email protected] Sintex Industries Limited (Sintex) is one of the leading players in plastics and composites manufacturing space in India, with a presence also in high-end textile business. Sintex has 38 manufacturing facilities and a global footprint span across 9 countries and 4 continents. The demerger of the plastics and textiles businesses into two separate entities removes a long overhang of capital allocation worries and will unlock the value of each business division. Sintex has commenced commercial production of its spinning plant (Phase 1) of 3.3 lakhs spindles capacity and also in process of setting up additional capacity (Phase 2) of 3.0 lakhs spindles unit for blended yarn with a capex of Rs. 2100. With this expansion, we expect the textile segment to report a revenue growth of 47%. The plastics division has continued to witness steady growth on back of improved performance of custom moulding and building segment division. Sintex continues to retain its focus on reaping benefits from its prefab business, storage tanks and custom moulding business at a CAGR of 16% during the period of FY16-FY19E. Demerger to unlock value of diversified businesses of the company Sintex Industries is planning to demerger of business into two separate entities namely, Sintex Industries Ltd (Sintex) and Sintex Plastics Technology Ltd (SPTL). The shareholders of Sintex will be getting one equity share of SPTL to every equity share held in Sintex industries. The proposed demerger of business is before SEBI for its approval and process is expected to be completed by March 2017E. The demerger is expected to unlock shareholder value by separating the various business segments in different entities which is playing at high margin with significant growth rate. Sintex will carry textile & spinning business whereas, SPTL will have custom moulding and building products segments. Both the segments are very different as plastics segment generates ROCE of 15-16% whereas textile segment generates very low ROE and ROCE due to high debt. We expect textile division to post a CAGR of 47% in revenue over the period of FY16-FY19E as the spinning project will be commissioned by period. The plastic segment is expected to grow at a CAGR of 16% in revenue over the period of FY16-FY19E which will be aid mix performance in the segment. Textile segment on the cusp of a turnaround, to drive growth in future Sintex’s fiber-to-fabric business is the one of the oldest segment which contributes ~12% to the total revenue of the company. This segment is more focused on high end, value driven, and margin accretive products in the niche markets of the textile industry. In Q1FY17, Sintex has commenced commercial production of Phase 1 spinning plant (compact cotton yarn) at Pipavav with a capacity of 3.3 lakhs spindles running at ~80-85% capacity utilization in 9MFY17. The company is also in process of setting up another 3 lakhs spindles unit for blended yarn with a CAPEX of Rs. 2100 crs with an expected IRR of ~16-18%. The textile segment has the advantages of raw material cost, government textile policy, attractive power rates available at plant and many other benefits from the government which may resulting in healthy return ratios. Plastic segment offers a good mix with high growth and high return The plastic and infrastructure verticals which together accounts for 88% of the revenues of the company. The segment is divided into two verticals that are custom moulding and building products. Custom moulding business contributes 51% to the total sales of the company of which ~45% is from domestic business whereas 55% if from overseas subsidiaries. We expect custom moulding business to report a CAGR of 16% for FY16-FY19E aid by low capex, high focus on domestic business with high margin and high return ratios kind of business with Fortune 500 customers. The revenue from building products segment contributes 49% to the total sales of the company and consists of three business vertical viz. storage tanks, prefabs and monolithic construction. We expect building product segment to report a CAGR of 14% during FY16-FY19E led by prefab and tanks segments steady demand and growth. Valuation With higher growth expectation from Custom Moulding, Prefabs and Textile segment, we expect revenue to grow a CAGR of 19% over the period of FY16-FY19E. The EBITDA margin is expected to improve by 98bps to reach 17.8% by FY19E. At the current price the stock is trading at a P/E of 8x and 5.7x and an EV/EBIDTA of 7.1x and 5.9x for FY17E and FY18E respectively. We value Sintex at a P/E of 6x for FY19E recommend a BUY with a target price of Rs. 128, with an upside of 37% in a year. Year Sales (Rs.cr) Growth (%) EBITDA (Rs.cr) Margin (%) PAT (Rs.cr) Margin (%) Adj EPS (Rs) P/E (x) EV/EBITDA ROE FY16 7733.5 10.4% 1,297.3 16.8% 632.6 8.2% 14.2 6.6 7.4 11.4 FY17E 9015.6 16.6% 1,509.4 16.7% 612.1 6.8% 11.7 8.0 7.1 9.4 FY18E 10703.3 18.7% 1,829.3 17.1% 856.2 8.0% 16.4 5.7 5.9 11.7 FY19E 12902.0 20.5% 2,292.3 17.8% 1,221.8 9.5% 23.3 4.0 4.5 14.3 Prom oter, 32.5 FII, 29.7 DII, 4.9 Other s, 32.9 40 80 120 160 26-Feb-16 26-May-16 26-Aug-16 26-Nov-16 Sintex BSE Sensex
Transcript of Sintex Industries Ltd. - Rakesh...
Sintex Industries Ltd.
Sintex Industries Ltd. Stock Idea
Plastic and Textile Rating: BUY
Date February 22, 2017 CMP (Rs.) 93 Target (Rs.) 128 Potential Upside 37% BSE Sensex 28865 NSE Nifty 8927
Scrip Code Bloomberg SINT IN Reuters SNTXBO BSE Group A BSE Code 502742 NSE Symbol SINTEX Market Data Market Cap.(Rs. Cr) 4926 Equity Sh. Cap. (Rs Cr) 52.3 52 Wk High/Low 98/63 Avg. Quarterly Volume 4427669 Face Value (Rs.) 1 Shareholding Pattern (Dec-16)
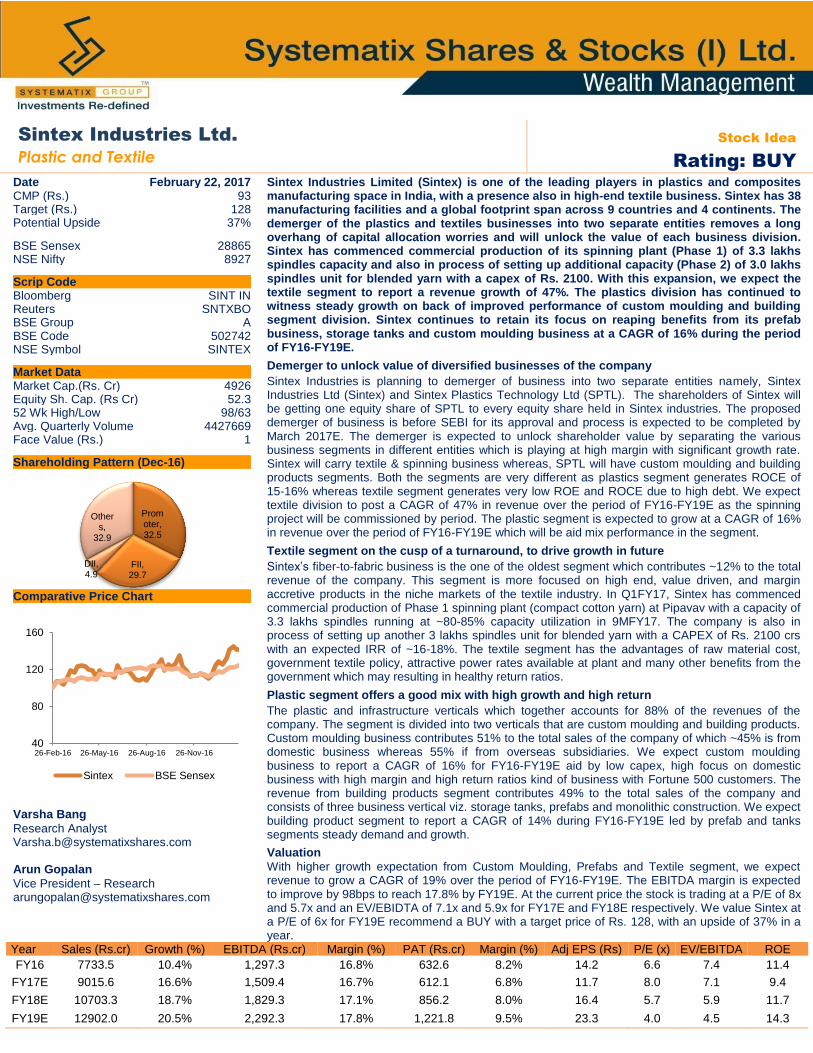
Comparative Price Chart
Varsha Bang
Research Analyst [email protected] Arun Gopalan
Vice President – Research [email protected]
Sintex Industries Limited (Sintex) is one of the leading players in plastics and composites manufacturing space in India, with a presence also in high-end textile business. Sintex has 38 manufacturing facilities and a global footprint span across 9 countries and 4 continents. The demerger of the plastics and textiles businesses into two separate entities removes a long overhang of capital allocation worries and will unlock the value of each business division. Sintex has commenced commercial production of its spinning plant (Phase 1) of 3.3 lakhs spindles capacity and also in process of setting up additional capacity (Phase 2) of 3.0 lakhs spindles unit for blended yarn with a capex of Rs. 2100. With this expansion, we expect the textile segment to report a revenue growth of 47%. The plastics division has continued to witness steady growth on back of improved performance of custom moulding and building segment division. Sintex continues to retain its focus on reaping benefits from its prefab business, storage tanks and custom moulding business at a CAGR of 16% during the period of FY16-FY19E.
Demerger to unlock value of diversified businesses of the company
Sintex Industries is planning to demerger of business into two separate entities namely, Sintex Industries Ltd (Sintex) and Sintex Plastics Technology Ltd (SPTL). The shareholders of Sintex will be getting one equity share of SPTL to every equity share held in Sintex industries. The proposed demerger of business is before SEBI for its approval and process is expected to be completed by March 2017E. The demerger is expected to unlock shareholder value by separating the various business segments in different entities which is playing at high margin with significant growth rate. Sintex will carry textile & spinning business whereas, SPTL will have custom moulding and building products segments. Both the segments are very different as plastics segment generates ROCE of 15-16% whereas textile segment generates very low ROE and ROCE due to high debt. We expect textile division to post a CAGR of 47% in revenue over the period of FY16-FY19E as the spinning project will be commissioned by period. The plastic segment is expected to grow at a CAGR of 16% in revenue over the period of FY16-FY19E which will be aid mix performance in the segment.
Textile segment on the cusp of a turnaround, to drive growth in future
Sintex’s fiber-to-fabric business is the one of the oldest segment which contributes ~12% to the total revenue of the company. This segment is more focused on high end, value driven, and margin accretive products in the niche markets of the textile industry. In Q1FY17, Sintex has commenced commercial production of Phase 1 spinning plant (compact cotton yarn) at Pipavav with a capacity of 3.3 lakhs spindles running at ~80-85% capacity utilization in 9MFY17. The company is also in process of setting up another 3 lakhs spindles unit for blended yarn with a CAPEX of Rs. 2100 crs with an expected IRR of ~16-18%. The textile segment has the advantages of raw material cost, government textile policy, attractive power rates available at plant and many other benefits from the government which may resulting in healthy return ratios.
Plastic segment offers a good mix with high growth and high return
The plastic and infrastructure verticals which together accounts for 88% of the revenues of the company. The segment is divided into two verticals that are custom moulding and building products. Custom moulding business contributes 51% to the total sales of the company of which ~45% is from domestic business whereas 55% if from overseas subsidiaries. We expect custom moulding business to report a CAGR of 16% for FY16-FY19E aid by low capex, high focus on domestic business with high margin and high return ratios kind of business with Fortune 500 customers. The revenue from building products segment contributes 49% to the total sales of the company and consists of three business vertical viz. storage tanks, prefabs and monolithic construction. We expect building product segment to report a CAGR of 14% during FY16-FY19E led by prefab and tanks segments steady demand and growth.
Valuation
With higher growth expectation from Custom Moulding, Prefabs and Textile segment, we expect revenue to grow a CAGR of 19% over the period of FY16-FY19E. The EBITDA margin is expected to improve by 98bps to reach 17.8% by FY19E. At the current price the stock is trading at a P/E of 8x and 5.7x and an EV/EBIDTA of 7.1x and 5.9x for FY17E and FY18E respectively. We value Sintex at a P/E of 6x for FY19E recommend a BUY with a target price of Rs. 128, with an upside of 37% in a year.
Year Sales (Rs.cr) Growth (%) EBITDA (Rs.cr) Margin (%) PAT (Rs.cr) Margin (%) Adj EPS (Rs) P/E (x) EV/EBITDA ROE
FY16 7733.5 10.4% 1,297.3 16.8% 632.6 8.2% 14.2 6.6 7.4 11.4
FY17E 9015.6 16.6% 1,509.4 16.7% 612.1 6.8% 11.7 8.0 7.1 9.4
FY18E 10703.3 18.7% 1,829.3 17.1% 856.2 8.0% 16.4 5.7 5.9 11.7
FY19E 12902.0 20.5% 2,292.3 17.8% 1,221.8 9.5% 23.3 4.0 4.5 14.3
Promoter, 32.5
FII, 29.7
DII, 4.9
Others,
32.9
40
80
120
160
26-Feb-16 26-May-16 26-Aug-16 26-Nov-16
Sintex BSE Sensex

Sintex Industries Ltd.
Business Mix Geographical Presence
Revenue (Rs. Cr) and Revenue Growth (%) EBITDA (Rs. Cr) and EBITDA Margin (%)
PAT (Rs. Cr) and PAT Margin (%) ROE and ROCE
Source: Company, Systematix Research
Plastic/ Infra , 88
Textiles, 12
Domestic, 75
International, 25
0%
5%
10%
15%
20%
25%
500
2,500
4,500
6,500
8,500
10,500
12,500
14,500
FY13 FY14 FY15 FY16 FY17E FY18E FY19E
Sales Growth
0%
2%
4%
6%
8%
10%
12%
14%
16%
18%
20%
250
750
1,250
1,750
2,250
2,750
FY13 FY14 FY15 FY16 FY17E FY18E FY19E
EBITDA EBITDA Margin
0.0%
1.0%
2.0%
3.0%
4.0%
5.0%
6.0%
7.0%
8.0%
9.0%
10.0%
50
250
450
650
850
1,050
1,250
1,450
FY13 FY14 FY15 FY16 FY17E FY18E FY19E
PAT PAT Margin
4.0
6.0
8.0
10.0
12.0
14.0
16.0
FY13 FY14 FY15 FY16 FY17E FY18E FY19E
ROE ROCE

Sintex Industries Ltd.
INDUSTRY OVERVIEW
The plastic processing industry
The Indian plastic processing sector comprises over 30,000 units engaged in producing a variety of products using multiple polymer variants (polystyrene, LDPE, PVC, HDPE and polypropylene, among others) and diverse technologies (injection moulding, blow moulding, roto moulding, extrusion and calendaring, among others).
Technology and product applications
Plastic products are positioned as a cost-effective substitute to traditional metallic and wooden variants. The plastics industry has made a significant contribution to the economic development and growth of various key sectors in the country such as automotive, construction, electronics, healthcare, textiles and FMCG, among others. For example, the usage of engineering plastics in four-wheelers has more than doubled over the last decade (yet remains significantly lower than the per capita consumption in developed nations) – this trend holds true for a number of other plastic product applications. Nevertheless, the per capita consumption of plastics in India (~9 kilos) is much lower than that of China (45 kilos).
The way forward
Burgeoning disposable incomes, accelerating urbanization and increasing substitution of plastic products in favour of traditional variants are some of the key factors driving the growth of the plastic processing sector in India.
According to a paper released by the Minister of State for Chemicals and Fertilizers, the Indian plastics processing industry is expected to grow by more than 50% to reach Rs. 1.37 lakh crs by FY2017-18 (from about Rs.0.90 lakh crs at the end of FY2013-14). This growth will be propelled by an increased growth accelerating among end-user industries, greater penetration of plastics via various existing and an ever-growing range of new applications.
The Indian plastic industry has set a ‘20-20-20’ vision. According to this, it is expected that the plastic processing in India could reach the 20 MT mark by 2020 from the current 8.5 MT. And, with plastic products becoming increasingly ubiquitous across household and industrial applications, the per capita consumption of plastic in India is expected to touch 20 kilos by 2020 from about 9 kilos currently.
Custom Moulding Industry Overview- Globally
In FY15, the total worldwide composite materials shipment reached 10,448.5 Kilotonnes (kt) with a value of USD 27.7bn and is expected to grow to USD 37.4bn with an average CAGR of 5.1% until FY21. The major drivers of growth till date has been due to sectors like wind energy, aerospace, transportation, marine and construction markets with Asia being the top continent in terms of total consumption in 2015. Stricter government regulations on fuel efficiency and carbon emissions in the automotive sector, higher composite adoption in aerospace are just some of the other driving factors in the industry. The industry is also seeing a shift towards automation in composite processes to minimize labour costs and increase efficiency and quality.
Global Mkt size of Composites by value (USD Bn) Global Mkt size of Composites by Shipment Volume (kt)
Extrusion
•Films amd sheets
•Fibres and filament pipes
•conuits and profiles
•Miscellaneous applications
Injection Moulding
•Industrial injection moulding
•Household injection moulding
•Thermoware/ Moulded lugguage
Blow Moulding
•Bottles
•Containers
•Toys
•Houseware
Roto Moulding
•Large circular tanks for varied applicants
0
10
20
30
40
FY15 FY16 FY21E 0
5000
10000
15000
FY15 FY16 FY21E

Sintex Industries Ltd.
Custom Moulding Industry Overview- India
The future of the Indian composites market looks attractive with opportunities in the electrical and electronic, wind energy, pipe and tank, transportation, and construction industries. The major driver for market growth is the rise in demand for electrical and electronic, wind energy, and pipe and tank applications due to increase in the number of government projects like smart cities development, eco-friendly energy generation, fresh water transportation, sewage treatment system, rehabilitation of water and sewage pipe lines.
Indian plastics industry is set to buck the global trend of sluggish growth by emerging as one of the fastest growing markets with 12 percent growth rate this year. By 2020, plastics consumption of the country is expected to increase from the current 12 MMTPA to 20 MMTPA. India will deploy 180,000 machines by 2020 as compared to the current 113,000, according to Plastindia Foundation. The domestic industry is undergoing a major transition with various new technologies being adopted. Going forward new applications are being developed to replace wood and metals with composites and plastics. Industries like Aerospace and defense are a potentially large opportunity as indigenization gains momentum. The make-in-India initiatives will go a long way in expanding the plastics and composites custom moulding Industry potential.
Second largest textile manufacturing
India is the second largest producer of textiles and garments in the world and one of the mainstays of the national economy. Abundant availability of raw materials such as cotton, wool, Sintex and jute as well as a skilled workforce has allowed the country to emerge as a global sourcing hub. It’s also a major contributor to the national economy in terms of direct and indirect employment generation and net foreign exchange earnings accounting for about 11% of India’s total exports The textiles sector (including dyed and printed) has witnessed a spurt in investment during the last five years. Case in point: the industry attracted FDI worth US$ 1.77 billion between April 2000 and September 2015.
The Indian textiles industry, currently estimated at around US$ 108 bn, is expected to reach US$ 223 bn by 2021. The industry is the second largest employer after agriculture, providing employment to over 45 mn people directly and 60 mn people indirectly. The Indian Textile Industry contributes approximately 5% to India’s GDP, and 14% to overall IIP.The Indian textile industry has the potential to reach US$ 500 bn in size according to a study. The growth implies domestic sales to rise to US$ 315 bn from currently US$ 68 bn. At the same time, exports are implied to increase to US$ 185 bn from approximately US$ 41 bn currently. The textiles sector has witnessed a spurt in investment during the last five years. The industry (including dyed and printed) attracted Foreign Direct Investment (FDI) worth US$ 1.85 billion during April 2000 to March 2016.
Government Incentives
The Indian Government has come up with a number of policies to promote exports in the textiles sector. It has allowed 100% FDI in the Indian textiles sector under the automatic route. Some important initiatives taken by the Central Government to promote the industry are i) Started promoting of its ‘India Handloom’ initiative on social media. ii) The new policy aims at creating 35 mn vacancies leveraging the investments made by foreign companies. Announced subsidies on the purchase of machinery and infrastructure:
The RR-TUFS covers manufacturing of major machinery or technical textiles for 5% interest reimbursement and 10% capital subsidy in addition to 5% interest reimbursement also provided to the specified technical textile machinery under RRTUFS.
Under the SITP, the Government of India provides assistance for infrastructure creation to the extent of 40% (up to Rs. 40 crore).
Major machineries for production of technical textiles receive customs duty concession of 5% and many more.
Yarn Industry:
• India has approximately 24% of the world’s spindle capacity. • Indian yarn production grew to 4,136 million kg FY16 from 3,549 million kg in FY13, growing at a CAGR of 5.23%. • Growing global yarn demand coupled with increasing competitiveness of Indian manufacturers globally to drive growth in the segment.
Fabric Industry:
• The total fabric production in India is expected to grow to 69 bn sq.mts by 2017- 18 from 66 bn sq.mts in 2015-16. • Cotton is a major product of the Indian textile industry and over 65% of total mill fibre consumption in country is Cotton. Among all the fabrics and yarns produced, cotton is the main fabric. Its share in the spun yarn segment stayed at 73% in FY15.
India's Textile market Size (USD Bn)
Cotton Production (Mn Bales)
0
50
100
150
200
250
2009 2010 2011 2014 2021E
30
32
34
36
38
40
42
2012 2013 2014 2015 2016

Sintex Industries Ltd.
Company Background
Founded in 1931, Sintex Industries Limited (“Sintex”) enjoys a strong presence across diverse sectors and has made a name for it by foreseeing trends and accordingly evolving and developing suitable products. Its plastic-based products have gained currency across fast-growing segments while the textile business has propelled itself by focusing on manufacturing premium structured fabrics. Consequently, Sintex has been able to ink mutually beneficial agreements with leading global fashion brands. Besides structured fabrics, Sintex is also a leading domestic manufacturer of corduroy fabrics. Plastic processing
Since the launch of the water tanks that revolutionized water storage in India three decades ago, Sintex has traversed a long and winding road. Today it’s a ‘Superbrand’, making its presence felt in hitherto uncharted territories – steadily replacing conventional metallic variants with cost effective, plastic-based solutions. It’s on the back of this qualitative excellence, that Sintex has been able to extend its presence from water storage to power distribution, automobiles, electrical products, sanitation, building interiors and warehousing segments, and a host of other verticals. The Company enjoys a pan-India presence with 38 cutting-edge plastic processing facilities and a global footprint spanning 9 countries with a strong presence in the European, American, African, and Asian markets including countries like France, Germany and the USA. The Company has divided its plastic business into two major verticals namely building products and custom moulding to ensure equal, undivided attention to each of them.
Building Products Segment – The Company offers prefabricated structures, storage and water tanks,
sub-ground structures, containers, doors, windows, and plastic sections, as well as packaged waste water treatment solution and environmental products. Revenues from the building products segment contribute ~49% (as per 9MFY17) to the total sales of the company and consist of three businesses, viz. monolithic construction, prefabs and storage tanks.
The Monolithic Construction: The monolithic construction business caters to low cost mass housing
solutions like slum rehabs, Janta housing and LIG (low income group) houses which are affordable, quick to construct, low maintenance. Sintex is leading player in monolithic construction in India. Under this segment, the company offers holistic solutions comprising of engineering, designing, drawing and manufacturing. The segment contributes ~34% to the building products segment sales with EBITDA margin of 14% in FY16. This segment saw an impressive growth in the past, however since FY11 monolithic construction has seen a slowdown with revenues fallen at a CAGR of 4% from FY11 to FY16. This is on account of conscious effort to focus on receivables management. The company is planning on reducing the contribution of the monolithic in the overall revenue pie, which will dropped from 34% in FY16 to 16% in FY19E. Monolithic Revenue (Rs. Crs) and EBITDA Margin
6%
8%
10%
12%
14%
16%
18%
20%
50
250
450
650
850
1050
1250
1450
FY13 FY14 FY15 FY16 9MFY17
Plastic Processing
Building Products
Custom Moulding
Large Volume Business
Largely B2G and B2C Business Model
Reasonable to low margins
Medium to large volume business with a high gestation period
Largely B2B business model
High margins and strong customer loyalty
Q9FY17 Business Mix
Custom Mouldin
g, 42.6%
Prefab, 23.0%
Monolithic,
8.2%
Tanks and
others, 4.9%
Textiles, 21%

Sintex Industries Ltd. The Prefabs Business: Sintex has pioneered itself into Prefab segment in India with 25% growth in
revenue and EBITDA margin at 23%. It comprises 24% of total consolidated revenues, as on FY16. The multifarious benefits of prefabricated structures position them as the preferred solution in India’s efforts towards strengthening social infrastructure comprising of toilet blocks, Mid-day meal kitchens, health care centers, classrooms and hostels, police chowkis, Labour camps, Army shelters among others. The company’s products cover 80% of India’s geography for execution with different materials for climatic conditions, utility structures, sanitation programs and various other requirements. The company has pan India network along with dedicated installation team that provides readymade solutions for speedy implementation. Prefabs Revenue (Rs. Crs) and EBITDA Margin
The Storage Tanks and Other retail Business: Storage tanks and other retail segment contributes
remaining ~11% to the total building products segment sales and ~5% to total sales of the company, involves manufacturing of water storage tanks, pallets, doors. Storage Tanks and Other retail Business Revenue (Rs. Crs) and EBITDA Margin
Custom molding segment – In custom moulding business, Sintex operates in India through its domestic
business and in the US and Europe through its subsidiaries. This segment contributes ~51% to the total sales of the company of which ~45% is from the domestic business and ~55% from overseas subsidiaries. The segment is most diversified division of Sintex geographically. The company is equipped with diverse capabilities of customized moulding which find applications in many industries such as Automotives, Aerospace & Defence, Electrical, Mass Transit and Off-the-Road Vehicles, Medical imaging products etc. Sintex caters to diverse sectors with majority of its business obtained from Automotive, Electrical, Mass rapid transportation, Aerospace and Medical Imaging. Sintex, custom moulding division has grown inorganically through the following acquisitions. The overall contribution of domestic business has increased at a CAGR of 18% from FY11-FY16. Management will continues to focus on the domestic side of custom moulding business mainly due to higher growth and margins. Custom molding (Rs. Crs) and EBITDA Margin FY16 Geographical Revenue Breakup
0%
5%
10%
15%
20%
25%
30%
500
700
900
1100
1300
1500
1700
1900
2100
FY13 FY14 FY15 FY16 9MFY17
0%
2%
4%
6%
8%
10%
12%
14%
16%
0
50
100
150
200
250
300
350
400
FY13 FY14 FY15 FY16 9MFY17
5%
7%
9%
11%
13%
15%
17%
500
1000
1500
2000
2500
3000
3500
4000
FY13 FY14 FY15 FY16 9MFY17
Domestic, 45%
Exports, 55%

Sintex Industries Ltd. Textile Business – The textile division of Sintex is one of the oldest business segment which was
incorporated as a BVM at Kalol (Gujarat). Segment contributes ~12% to the total revenue of the company. Sintex has focused on niche market, high end, extensively creative, low volume and high margin products, in a segment of the textiles industry which has low competition. Sintex textile division can be categorized into Fabric division and yarn division. Sintex has recently commercialized an ultra modern, highly automated, world class compact cotton yarn spinning plant at Pipavav, Gujarat with an capacity of 3.3 lakh spindles of compact cotton yarn and is in the process of setting up another spindle unit for blended yarn as well with a capacity of 3 lakh spindles with an CAPEX of 2100 crs. The project is economically incentivized from the state government. The company will enjoy a 7% interest subsidy over and above 4% TUFS from the central government. Gujarat state has surplus power which will be available for spinning units at a subsidized rate (Rs 1/unit less than standard rates), Duty exemption @ 15% on power tariff is also possible and VAT refund till cost of project is recovered. The spinning facility will also be benefited from proximity to Pipavav port leading to lower logistics cost (Exports will account for 50% – 60% of its volumes). Textiles Revenue (Rs. Crs) and EBITDA Margin
0%
20%
40%
60%
80%
100%
120%
0
200
400
600
800
1000
1200
1400
FY12 FY13 FY14 FY15 FY16 9MFY17

Sintex Industries Ltd. FINANCIAL PERFORMANCE (Rs. In Crs)
Profit and Loss (Rs. Cr) FY16 FY17E FY18E FY19E Balance Sheet (Rs. Cr) FY16 FY17E FY18E FY19E
Net sales 7733.5 9015.6 10703.3 12902.0 Share Capital 44.7 52.3 52.3 52.3
% Growth 10.4% 16.6% 18.7% 20.5% Reserve & Surplus 5467.9 6489.7 7307.7 8489.4
Operating Expenses 6,436.2 7,506.2 8,874.0 10,610.7 Networth 5512.5 6542.0 7360.1 8541.8
EBITDA 1297.3 1509.4 1829.3 2292.3 Net deffered tax Liab 619.0 619.0 619.0 619.0
EBITDA Margin 16.8% 16.7% 17.1% 17.8% Long term Borrowings 5150.8 5800.8 5300.8 4800.8
Depn & Amort 304.8 422.3 464.3 489.3 Long term Provision 61.8 66.8 72.3 78.3
Other Income 133.2 146.5 161.1 177.2 Total Loans 5212.6 5867.6 5373.1 4879.1
Interest 281.7 417.5 384.5 351.5 Trade payable 960.6 1137.3 1345.5 1615.6
Loss on FC 0.00 0.00 0.00 0.00 Provisions 143.1 180.3 214.1 258.0
PBT 843.9 816.1 1,141.6 1,628.7 Current Liab 823.0 853.4 886.8 923.6
Tax 211.3 204.0 285.4 406.9 Short term Borr 688.9 638.9 588.9 539.9
Adj PAT 632.6 612.1 856.2 1,221.8 Capital Deployed 13959.7 15838.6 16387.5 17377.1
PAT Margin 8.2% 6.8% 8.0% 9.5% Net Fixed Assets 7542.6 8470.3 8756.1 8766.8
Shares o/s ( No.in Cr.) 44.7 52.3 52.3 52.3 Capital Work In progress 192.9 150.0 150.0 150.0
Adj EPS 14.2 11.7 16.4 23.3 Investments and Goodwill 236.8 236.8 236.8 236.8
Cash EPS 21.0 19.8 25.2 32.7 LT Loans & Adv 1426.7 1569.0 1725.5 1897.6
Qterly (Rs. Cr) Q4FY16 Q1FY17 Q2FY17 Q3FY17 Other Non Curr assets 49.59 54.55 60.00 66.00
Revenue 2323.8 1695.3 2261.8 2075.0 Cash & Bank 936.3 1,173.3 551.8 428.6
EBITDA 453.8 290.0 412.9 347.8 Inventories 606.4 719.3 850.4 1,016.9
Depn & Amort 81.4 96.0 95.8 96.2 Debtors 2,241.8 2,629.5 3,121.8 3,763.1
Other Income 33.7 6.1 17.4 6.1 Loans & Advances 596.8 656.5 722.1 794.4
Loss on FC 0.0 0.0 0.0 0.0 Other Current assets 130.9 180.3 214.1 258.0
EBIT 406.1 200.1 334.5 257.7 Capital Employed 13,959.7 15,838.6 16,387.5 17,377.1
Interest 91.6 84.0 87.4 82.0 Cash Flow FY16 FY17E FY18E FY19E
PBT 314.5 116.1 247.1 175.7 PBT 838.3 816.1 1,141.6 1,627.7
Tax 81.5 40.3 82.4 65.1 Add:Depreciation 304.8 422.3 464.3 489.3
PAT 233.0 75.8 164.7 110.6 Add:Interest 281.7 417.5 384.5 351.5
EPS 4.5 1.4 3.1 2.1 Less: Other Income (133.2) (146.5) (161.1) (177.2)
Performance Ratio FY16 FY17E FY18E FY19E Change in WC (56.5) (506.6) (602.6) (744.0)
EBITDA Margin (%) 16.8% 16.7% 17.1% 17.8% Tax (211.3) (204.0) (285.4) (406.9)
PAT Margin (%) 8.1% 6.8% 8.0% 9.5% CF from Operations 1,023.8 798.7 941.2 1,140.4
ROE (%) 11.4 9.4 11.7 14.3 CAPEX (2,699.2) (1,350.0) (750.0) (500.0)
ROCE (%) 9.9 9.5 11.4 14.1 WIP 219.7 42.9 - -
Sales Growth (%) 10.4% 16.6% 18.7% 20.5% Others Income 133.2 146.5 161.1 177.2
PAT Growth (%) 19.0% -2.4% 39.9% 42.6% CF from Investing (2,346.3) (1,160.6) (588.9) (322.8)
Per Share Data FY16 FY17E FY18E FY19E Change in equity capital 167.2 455.7 - -
BV Per Share 123.4 125.0 140.6 163.2 Change in borrowings 1,706.3 600.0 (550.0) (550.0)
Cash Per Share 14.8 18.7 6.8 4.5 Dividend paid (39.32) (39.32) (39.32) (39.32)
Dividend Per Share 0.7 0.6 0.6 0.6 Interest paid (281.7) (417.5) (384.5) (351.5)
Valuation Ratio FY16 FY17E FY18E FY19E Others 4.2 - - -
Price Earnings (x) 6.6 8.0 5.7 4.0 CF from Financing 1,556.6 598.8 (973.9) (940.9)
EV/EBITDA (x) 7.4 7.1 5.9 4.5 Net Chg in cash 234.1 237.0 (621.5) (123.2)
Price/BV (x) 0.8 0.7 0.7 0.6 Cash at beginning 425.0 740.9 977.8 356.3
Mkt cap/Sales (x) 0.5 0.5 0.5 0.4 Cash at end 659.1 977.8 356.3 233.1
EV/Sales (x) 1.2 1.2 1.0 0.8 Turnover Ratio (x) FY16 FY17E FY18E FY19E
Valuation Ratio FY16 FY17E FY18E FY19E Debtors Days 3.5 3.5 3.5 3.5
D/E (x) 1.0 0.9 0.8 0.6 Creditors Days 2.4 2.5 2.5 2.5
Interest Coverage (X) 4.0 3.0 4.0 5.6 Inventory Days 1.1 1.2 1.2 1.2

DISCLOSURES/ APPENDIX
I. ANALYST CERTIFICATION We, Varsha Bang and Arun Gopalan, hereby certify (1) that the views expressed in this research report accurately reflect our personal views about any or all of the subject securities or issuers referred to in this research report, (2) No part of our compensation was, is, or will be directly or indirectly related to the specific recommendations or views expressed in this research report by Systematix Shares & Stocks (I) Limited or its Group/associates companies. (3) has taken reasonable care to achieve and maintain independence and objectivity in making any recommendations.
Disclosure of Interest Statement Response
Analyst holding in the stock No
Served as an officer, director or employee No
II. ISSUER SPECIFIC REGULATORY DISCLOSURES, UNLESS SPECIFICALLY MENTIONED IN POINT NO. 9 BELOW:
1. The Research Analyst(s), Systematix Shares & Stocks(I) Limited (SSSIL), Associate of Analyst or his relative does not have any financial interest in the company(ies) covered in this report. 2. The Research Analyst, SSSIL or its associates or relatives of the Research Analyst affiliates collectively do not hold more than 1% of the securities of the company (ies) covered in this report as of the end of
the month immediately preceding the distribution of the research report. 3. The Research Analyst, his associate, his relative and SSSIL do not have any other material conflict of interest at the time of publication of this research report. 4. The Research Analyst, SSSIL and its associates have not received compensation for investment banking or merchant banking or brokerage services or for any other products or services from the
company(ies) covered in this report, in the past twelve months. 5. The Research Analyst, SSSIL or its associates have not managed or co-managed in the previous twelve months, a private or public offering of securities for the company (ies) covered in this report. 6. SSSIL or its associates have not received compensation or other benefits from the company(ies) covered in this report or from any third party, in connection with the research report. 7. The Research Analyst has not served as an Officer, Director or employee of the company (ies) covered in the Research report. 8. The Research Analyst and SSSIL has not been engaged in market making activity for the company(ies) covered in the Research report. 9. Details SSSIL, Research Analyst and its associates pertaining to the companies covered in the Research report:
Sr. No.
Particulars Yes / No.
1 Whether compensation has been received from the company(ies) covered in the Research report in the past 12 months for investment banking transaction by SSSIL No
2 Whether Research Analyst, SSSIL or its associates or relatives of the Research Analyst affiliates collectively hold more than 1% of the company(ies) covered in the Research report No
3 Whether compensation has been received by SSSIL or its associates from the company(ies) covered in the Research report No
4 SSSIL or its affiliates have managed or co-managed in the previous twelve months a private or public offering of securities for the company(ies) covered in the Research report No
5 Research Analyst, his associate, SSSIL or its associates have received compensation for investment banking or merchant banking or brokerage services or for any other products or services from the company(ies) covered in the Research report, in the last twelve month
No
10. There are no material disciplinary action that been taken by any regulatory authority impacting equity research analysis activities. 11. Systematix Shares & Stocks (I) Limited is in a process of seeking registration under SEBI (Research Analyst) Regulations, 2014.
EXPLANATION TO RATINGS: BUY: TP>15%; ACCUMULATE: 5%<TP<15%; HOLD: -5%<TP<5%; REDUCE: -15%<TP<-5%; SELL: TP<-15%
III. DISCLAIMER The information and opinions contained herein have been compiled or arrived at, based upon information obtained in good faith from sources believed to be reliable. Such information has not been independently verified and no guaranty, representation of warranty, express or implied, is made as to its accuracy completeness or correctness.
This document is for information purposes only. This report is based on information that we consider reliable, but we do not represent that it is accurate or complete, and one should exercise due caution while acting on it. Descriptions of any company or companies or their securities mentioned herein are not complete and this document is not, and should not be construed as an offer or solicitation of an offer to buy or sell any securities or other financial instruments. Past performance is not a guide for future performance, future returns are not guaranteed and a loss of original capital may occur. All opinions, projections and estimates constitute the judgment of the author as on the date of the report and these, plus any other information contained in the report, are subject to change without notice. Prices and availabili ty of financial instruments also are subject to change without notice.
This report is not directed to or intended for display, downloading, printing, reproducing or for distribution to or use by, any person or entity that is a citizen or resident or located in any locality, state, country or other jurisdiction where such distribution, publication, reproduction, availability or use would be contrary to law or regulation or what would subject to SSSIL or its affiliates to any registration or licensing requirement within such jurisdiction. If this report is inadvertently send or has reached any individual in such country, especially, USA, the same may be ignored and brought to the attention of the sender. Neither this document nor any copy of it may be taken or transmitted into the United State (to U.S.Persons), Canada, or Japan or distributed, directly or indirectly, in the United States or Canada or distributed or redistributed in Japan or to any resident thereof. Any unauthorized use, duplication, redistribution or disclosure of this report including, but not limited to, redistribution by electronic mail, posting of the report on a website or page, and/or providing to a third party a link , is prohibited by law and will result in prosecution. The information contained in the Report is intended solely for the recipient and may not be further distributed by the recipient to any third party.
SSSIL generally prohibits its analysts, persons reporting to analysts, and members of their households from maintaining a financial interest in the securities or derivatives of any companies that the analysts cover. Additionally, SSSIL generally prohibits its analysts and persons reporting to analysts from serving as an officer, director, or advisory board member of any companies that the analysts cover. Our salespeople, traders, and other professionals or affiliates may provide oral or written market commentary or trading strategies to our clients that reflect opinions that are contrary to the opinions expressed herein. Our proprietary trading and investing businesses may make investment decisions that are inconsistent with the recommendations expressed herein. The views expressed in this research report reflect the personal views of the analyst(s) about the subject securities or issues, and no part of the compensation of the research analyst(s) was, is, or will be directly or indirectly related to the specific recommendations and views expressed by research analyst(s) in this report. The compensation of the analyst who prepared this document is determined exclusively by SSSIL however, compensation may relate to the revenues of the Systematix Group as a whole, of which investment banking, sales and trading are a part. Research analysts and sales persons of SSSIL may provide important inputs to its affiliated company(ies).
Foreign currencies denominated securities, wherever mentioned, are subject to exchange rate fluctuations, which could have an adverse effect on their value or price, or the income derived from them. In addit ion, investors in securities such as ADRs, the values of which are influenced by foreign currencies effectively assume currency risk.
MUTUAL FUND INVESTMENTS ARE SUBJECT TO MARKET RISKS, READ ALL SCHEME RELATED DOCUMENTS CAREFULLY. SSSIL, its directors, analysts or employees do not take any responsibility, financial or otherwise, of the losses or the damages sustained due to the investments made or any action taken on basis of this report including but not restricted to fluctuation in the prices of shares and bonds, changes in the currency rates, diminution in the NAVs, reduction in the dividend or income, etc.
SSSIL and its affiliates, officers, directors, and employees subject to the information given in the disclosures may: (a) from time to time, have long or short positions in, and buy or sell the securities thereof, of company (ies) mentioned herein or (b) be engaged in any other transaction involving such securities and earn brokerage or other compensation (financial interest) or act as a market maker in the financial instruments of the company (ies) discussed herein or act as advisor or lender / borrower to such company (ies) or have other potential material conflict of interest with respect to any recommendation and related information and opinions. The views expressed are those of the analyst and the Company may or may not subscribe to the views expressed therein.
SSSIL, its affiliates and any third party involved in, or related to, computing or compiling the information hereby expressly disclaim all warranties of originality, accuracy, completeness, merchantability or fitness for a particular purpose with respect to any of this information. Without limiting any of the foregoing, in no event shall SSSIL, any of its affiliates or any third party involved in, or related to, computing or compiling the information have any liability for any damages of any kind. The Company accepts no liability whatsoever for the actions of third parties. The Report may provide the addresses of, or contain hyperlinks to, websites. Except to the extent to which the Report refers to website material of the Company, the Company has not reviewed the linked site. Accessing such website or following such link through the report or the website of the Company shall be at your own risk and the Company shall have no liability arising out of, or in connection with, any such referenced website
SSSIL shall not be liable for any delay or any other interruption which may occur in presenting the data due to any technical glitch to present the data. In no event shall the SSSIL be liable for any damages, including without limitation, direct or indirect, special, incidental, or consequential damages, losses or expenses arising in connection with the data presented by SSSIL through this presentation.
Neither SSSIL, nor any of its other group companies or associates, shall be responsible for any decisions taken on the basis of this report. Investors are advised to consult their Investment and Tax consultants before taking any investment decisions based on this report. Systematix Shares & Stocks (I) Ltd. CIN: U65993TN1995PLC031285 : SEBI Regn. No.: BSE: INB/F011132736 Member Code: 182 | NSE: INB/F/E231132730 Member Code : 11327 | MCX-SX: INB/F261132733 Member Code: 17560 | PMS SEBI Reg No. : INP000002692 | Depository Participant: IN-DP-CDSL-246-2004 | AMFI: ARN No. 64917 Corporate Office Address: A 603-606 , The Capital, BKC, Bandra (E), Mumbai, India - 400051


