SINTER HARDENING LOW-ALLOY STEELS Robert J. …yunamedia.com/ · Robert J. Causton Hoeganaes...
33
SINTER HARDENING LOW-ALLOY STEELS Robert J. Causton Hoeganaes Corporation Riverton, NJ 08077 John J. Fulmer Burgess-Norton Manufacturing Company Geneva, IL 60134 Presented at the 1992 Powder Metallurgy World Congress San Francisco, CA, June 21-26, 1992 ABSTRACT The availability of prealloyed steel powders employing molybdenum as the major alloying element offers new levels of compressibility and mechanical properties. When the prealloyed powders are combined with conventional P/M additives such as copper, nickel and graphite, it is possible to develop high strength martensitic microstructures directly from the sintering cycle. The impact and tensile properties of copper, nickel, graphite premixes based upon the prealloyed molybdenum steels are compared under controlled cooled conditions. The ability to balance tensile strength, toughness and hardness by control of alloy chemistry is illustrated. INTRODUCTION This paper presents the results of an investigation into the effects of copper and nickel additions upon the properties of low-alloy steel powder premixes. This investigation is part of a broader program to develop “High Performance” P/M materials and as such complements other recently published papers. (1) The aim of the work is develop tensile strengths in a single pressed compact that match, if not surpass, those previously obtained by double pressing techniques. If successful, such work offers P/M parts’ designers a significantly more efficient route to high strength/high performance P/M components. PRINCIPLES OF PROGRAM The strength of a porous P/M material depends upon many factors including:
Transcript of SINTER HARDENING LOW-ALLOY STEELS Robert J. …yunamedia.com/ · Robert J. Causton Hoeganaes...

SINTER HARDENING LOW-ALLOY STEELS
Robert J. CaustonHoeganaes CorporationRiverton, NJ 08077
John J. FulmerBurgess-Norton Manufacturing Company
Geneva, IL 60134
Presented at the 1992 Powder Metallurgy World CongressSan Francisco, CA, June 21-26, 1992
ABSTRACT
The availability of prealloyed steel powders employing molybdenumas the major alloying element offers new levels ofcompressibility and mechanical properties.
When the prealloyed powders are combined with conventional P/Madditives such as copper, nickel and graphite, it is possible todevelop high strength martensitic microstructures directly fromthe sintering cycle.
The impact and tensile properties of copper, nickel, graphitepremixes based upon the prealloyed molybdenum steels are comparedunder controlled cooled conditions.
The ability to balance tensile strength, toughness and hardnessby control of alloy chemistry is illustrated.
INTRODUCTION
This paper presents the results of an investigation into theeffects of copper and nickel additions upon the properties oflow-alloy steel powder premixes. This investigation is part of abroader program to develop “High Performance” P/M materials andas such complements other recently published papers. (1) The aimof the work is develop tensile strengths in a single pressedcompact that match, if not surpass, those previously obtained bydouble pressing techniques. If successful, such work offers P/Mparts’ designers a significantly more efficient route to highstrength/high performance P/M components.
PRINCIPLES OF PROGRAM
The strength of a porous P/M material depends upon many factorsincluding:

The relative density or porosity levelThe matrix strengthMicrostructure
To investigate these factors, test materials were made frompremixes of molybdenum prealloyed low-alloy steel powders thatemployed copper, nickel and graphite as alloying elements.
Molybdenum
Molybdenum was tested at two levels by using 1Ancorsteel® 85HPand Ancorsteel 1 50H P, these steel powders contain 0.85 and 1.5%molybdenum, respectively. Molybdenum has very little solutionhardening effect in iron, thus, it is possible to obtain highrelative density by single compaction. However, molybdenumsignificantly increases hardenability once carbon is dissolved.Thus, it should be possible to develop high strength martensiticor bainitic microstructures on cooling from sinteringtemperature.
Copper and Nickel
The normal alloying additions in P/M materials are copper andnickel. Both tend to reduce compressibility if prealloyed butenhance strength and hardenability once dissolved duringsintering. The program examined their combined effects upon finalmaterial properties.
Accelerated Cooling to Develop Martensite
Sintered P/M parts are often heat treated to develop a temperedmartensitic micro-structure possessing high tensile strength. Thealloy steel formed by solution of copper and nickel in theprealloyed matrix should improve the hardenability of the testmaterials. Rapidly cooling the compact from sintering temperatureshould develop high strength martensitic or bainiticmicrostructures. As described previously,(2) this may enable aseparate heat treatment operation to be omitted given favorablepart geometry. The program attempted to quantify the effects ofcopper and nickel with molybdenum upon the microstructure andhence the properties developed in the sintered materials.
The test materials were produced using the ANCORBOND® (3,4,5)process to suppress micro and macro segregation. Areas deficientin admixed copper, nickel or graphite could reduce strengthcompared to the overall matrix of the material.
EXPERIMENTAL PROCEDURE
A series of 500-pound test premixes was prepared using the

ANCORBOND process. The premix compositions, shown in Table I,were designed to assess the influence of alloy steel matrix,copper and nickel contents upon the properties of the finalsintered material.
TABLE IPremix Compositions
Material Low-alloy Base Copper(%)
Nickel(%)
Graphite(%)
ZincStearate
(%)A Ancorsteel 85HP 0 2 0.5 0.5B Ancorsteel 85HP 1 2 0.5 0.5C Ancorsteel 85HP 0 4 0.5 0.5D Ancorsteel 85HP 1 4 0.5 0.5E Ancorsteel 150HP 0 2 0.5 0.5F Ancorsteel 150HP 1 2 0.5 0.5G Ancorsteel 150HP 0 4 0.5 0.5H Ancorsteel 150HP 1 4 0.5 0.5
Note: Copper: Alcan 8081Nickel: Inco 123Graphite: Asbury 3203Zinc Stearate: Mallinckrodt “HiDense”
The sintered chemistry and basic sintered properties, measuredfollowing standard Hoeganaes test procedures, are shown in TablesII and III.
The copper, nickel and molybdenum contents were measured byoptical emission spectroscopy. The sintered carbon content wasdetermined by LECO carbon analysis.
These preliminary QC tests confirmed that the materialcompositions could develop high strength. There was evidence ofthe favorable interaction of copper and nickel upon transverserupture strength and dimensional change.
TEST PIECE PREPARATION
Following these standard laboratory tests, the test pieces fordetermination of mechanical properties were pressed and sinteredunder industrial conditions at Burgess-Norton ManufacturingCompany.
Tensile properties were measured using ASTM E 8 “Dog-bone”tensile test pieces. Charpy impact testing was performed usingun-notched test pieces as shown in ASTM E 23. The test pieceswere compacted at pressures of 30, 40 and 50 tsi to determine theeffect of density upon mechanical properties. Test piece

densities were measured by the immersion technique following MPIFStandard 42,1985-1986 Edition, on impregnated sections cut fromthe impact and tensile test pieces.
Sintering
The basic sintering cycle is indicated below.Sintering temperature: 2050°FAtmosphere: Endothermic with carbon
potential controlDewpoint: 32-35°FEquilibration temperature: 1550°FSintering time: 20 minutes
TABLE IISintered Chemistry of Test Materials
Premix Copper (%) Nickel (%) Molybdenum(%)
SinteredCarbon (%)
A -- 2.26 0.83 0.49B 0.99 2.17 0.83 0.47C -- 4.04 0.81 0.47D 1.06 4.44 0.81 0.46E -- 2.22 1.41 0.45F 1.14 2.37 1.38 0.52G -- 4.44 1.39 0.51H 1.13 4.10 1.38 0.53
TABLE IIIProperties of Test Premixes
Premix A.D.(g/cm3)
Flow(sec/50g)
SinteredDensity(g/cm3)
Dimen.Change(%)
TRS(psi x 103)
Hardness(HRB)
A 3.16 26 7.01 -0.07 174.8 86B 3.18 27 6.96 +0.10 193.5 91C 3.25 26 7.05 -0.23 213.5 94D 3.18 26 6.99 0.00 216.9 96E 3.29 24 7.02 -0.08 178.6 85F 3.27 26 6.96 +0.14 200.4 92G 3.33 25 7.04 -0.20 225.3 96H 3.30 25 7.00 0.00 235.4 98
Notes: 1. Test bars compacted to 7.0 g/cm3 green density.2. Sintering: 2050°F, 25% N2/75% H2, 30 minutes.3. Dimensional change from die size.
The sintering furnace was equipped with a controlled cooling zonesuch that cooling from equilibration to room temperature could beaccelerated. For the work quoted below, the mean cooling rate

from 1550°F to 930°F was 70°F/minute.
The standard test pieces have limited cross section. Theyexperience very high cooling rates under accelerated coolingconditions. A series of test pieces was prepared to simulate theeffect of increased section size upon mechanical properties. Thiswas achieved by placing the test pieces on one-half inch thicksintered sheets. All test pieces were tempered at 450°F for onehour.
Testing
Tensile testing was performed using an Instron testing machinewith a cross head speed of 0.1 “/minute. The Charpy test pieceswere broken on a Baldwin impact test machine. Hardnessmeasurements were made using a Wilson hardness test machine.
Metallography
Sections for metallographic examination were cut from the tensileand impact test pieces compacted at 40 tsi. These were preparedaccording to procedures in Reference 6. Quantitativemetallography was conducted to estimate the distribution ofmicrostructural phases within the test pieces using a “pointcount” technique as described in Reference 9.
RESULTS
The properties of the sintered test pieces met the aims of theresearch program in that the test materials attained very highdensity and, consequently, very high tensile strength levels. Thedetailed results are given in Tables IV and V and illustratedbriefly below.
Density
The premix compositions attained the first objective of theprogram. They developed high green densities (Figure 1) whencompacted to standard green density test pieces at pressures of30 to 50 tsi.
TABLE IVResults of Quantitative Metallography of Test Materials Compacted
at 40 tsiAccelerated Cooling Rate
0.85% Molybdenum Prealloy 1.5% Molybdenum PrealloyPhase 2 Ni,
0 Cu2 Ni,1 Cu
4 Ni,0 Cu
4 Ni,1 Cu
2 Ni,0 Cu
2 Ni,1 Cu
4 Ni,0 Cu
4 Ni,1 Cu
Temp.Martensite
77.0 75.0 75.0 74.8 82.3 83.0 78.8 79.3

Nickel-Rich 5.0 5.8 9.3 13.5 5.8 8.5 12.5 12.8Bainite 0 7.3 1.5 3.3 0.3 0 0.5 0.3Pearlite 9.8 3.5 5.0 0.3 3.0 2.0 1.8 0.8Porosity 8.3 8.5 9.3 8.3 8.8 6.5 6.5 7.0
Reduced Cooling Rate0.85% Molybdenum Prealloy 1.5% Molybdenum Prealloy
Phase 2 Ni,0 Cu
2 Ni,1 Cu
4 Ni,0 Cu
4 Ni,1 Cu
2 Ni,0 Cu
2 Ni,1 Cu
4 Ni,0 Cu
4 Ni,1 Cu
Temp.Martensite
44.8 51.5 64.5 60.5 51.8 64.0 67.5 69.0
Nickel-Rich 3.3 1.0 7.5 6.8 5.0 8.3 12.3 10.8Bainite 2.0 0 2.5 0 1.5 1.3 1.0 0Pearlite 43.3 39.5 17.0 28.3 31.5 16.5 11.0 15.8Porosity 6.8 8.0 8.5 4.5 10.3 10.0 8.3 4.5
Figure 1: Compressibility of Test Materials
The high green densities translated into high sintered densities,Figure 2. This was especially noticeable in the case of thematerials that contained only nickel additions. Slight shrinkageoccurred on sintering to produce sintered densities approaching7.3 g/cm3.
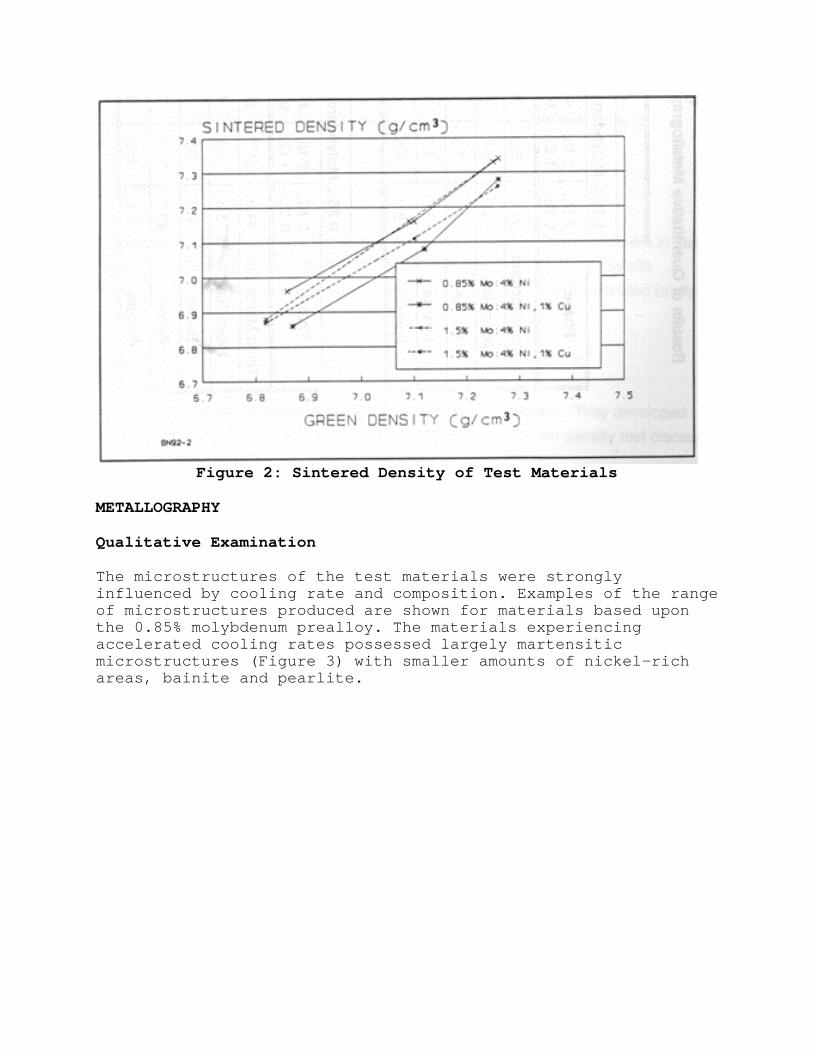
Figure 2: Sintered Density of Test Materials
METALLOGRAPHY
Qualitative Examination
The microstructures of the test materials were stronglyinfluenced by cooling rate and composition. Examples of the rangeof microstructures produced are shown for materials based uponthe 0.85% molybdenum prealloy. The materials experiencingaccelerated cooling rates possessed largely martensiticmicrostructures (Figure 3) with smaller amounts of nickel-richareas, bainite and pearlite.

Figure 3: Microstructure of material B following acceleratedcooling from the sintering temperature. Etched with a combination
of 2% nital/4% picral. Original magnification 750X.
The microstructures of the test pieces that experienced reducedcooling rates (Figures 4 to 7) consisted of tempered martensiteand pearlite plus quantities of nickel-rich areas and bainite.
Quantitative Examination
The qualitative findings were confirmed by the quantitativemetallography with results shown in Table IV and illustrated inFigures 8 and 9.

Figure 4: Microstructure of material A produced at reducedcooling rate from the sintering temperature. Etched with a
combination of 2% nital/4% picral. Original magnification 750X.

Figure 5: Microstructure of material B produced at reducedcooling rate from the sintering temperature. Etched with a
combination of 2% nital/4% picral. Original magnification 750X.

Figure 6: Microstructure of material C produced at reducedcooling rate from the sintering temperature. Etched with a
combination of 2% nital/4% picral. Original magnification 750X.
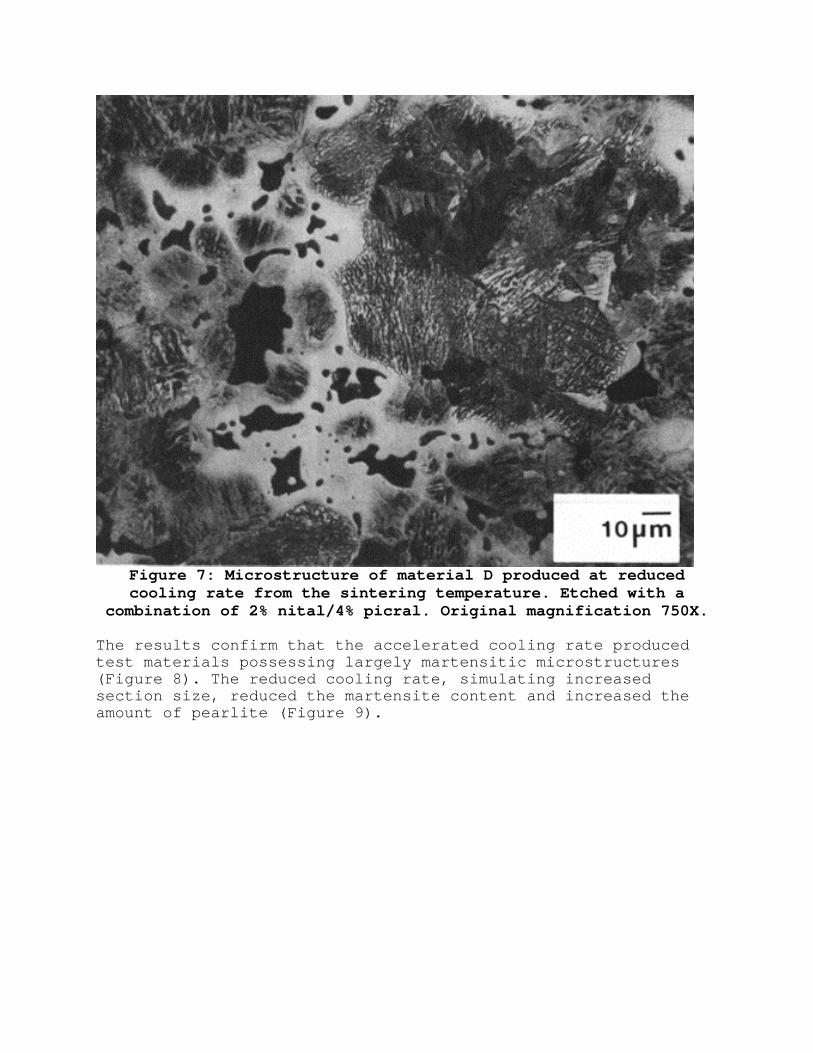
Figure 7: Microstructure of material D produced at reducedcooling rate from the sintering temperature. Etched with a
combination of 2% nital/4% picral. Original magnification 750X.
The results confirm that the accelerated cooling rate producedtest materials possessing largely martensitic microstructures(Figure 8). The reduced cooling rate, simulating increasedsection size, reduced the martensite content and increased theamount of pearlite (Figure 9).

Figure 8: Microstructure of Test Materials ExperiencingAccelerated Cooling Rate
Figure 9: Microstructure of Test Materials Experiencing ReducedCooling Rate
The quantitative data indicate that the proportion of nickel-richareas increases with increasing nickel content under both coolingconditions. The quantitative data confirm that the

microstructures have very low bainite contents with the exceptionof the material containing 2% nickel and 1% copper made with the0.85% molybdenum prealloy.
Tensile Strength
The mechanical properties of the test materials are given inTable V and discussed subsequently. The properties of materialsexperiencing accelerated cooling are illustrated below toindicate overall trends.
The materials developed high tensile strengths, illustrated inFigures 10 and 11 for the 0.85% and 1.5% molybdenum prealloys,respectively.
Figure 10: Effect of Accelerated Cooling Upon UTS of TestMaterials with 0.85% Mo Prealloy
TABLE VMechanical Properties of Test Materials with 0.85% Molybdenum
Prealloy Accelerated CoolingNickel(%)
Copper(%)
CompactionPressure(tsi)
SinteredDensity(g/cm3)
YieldStrength(psi x103)
UltimateTensileStrength(psi x103)
Elongation(%)
Impact(ft•lbf)
Hardness(HRC)
2 0 3040
6.927.19
----
120.75143.9
0.70.7
710
22.928.1

50 7.31 -- 164.5 0.9 12 30.72 1 30
4050
6.827.107.26
----
152.2
122.7151.1167.5
0.81.01.0
71013
24.130.333.0
4 0 304050
6.967.167.34
111.0135.0155.9
123.2148.2176.1
0.91.01.8
81114
23.028.432.4
4 1 304050
6.867.087.28
104.9135.3162.0
104.9135.3162.0
0.91.11.2
91113
24.428.132.8
TABLE VMechanical Properties of Test Materials with 0.85% Molybdenum
Prealloy Reduced CoolingNickel(%)
Copper(%)
CompactionPressure(tsi)
SinteredDensity(g/cm3)
YieldStrength(psi x103)
UltimateTensileStrength(psi x103)
Elongation(%)
Impact(ft•lbf)
Hardness(HRC)
2 0 304050
6.927.197.31
89.0101.3109.2
105.3121.9131.8
1.01.31.3
71012
13.618.818.6
2 1 304050
6.827.107.26
96.8117.8123.0
111.7135.8148.0
1.01.11.2
71014
19.422.626.2
4 0 304050
6.967.167.34
102.3111.9146.3
114.9141.4162.4
0.91.41.1
81214
19.426.127.4
4 1 304050
6.867.087.28
87.7111.1126.4
104.7135.9143.9
0.91.31.0
91215
17.120.726.1
TABLE VMechanical Properties of Test Materials with 1.50% Molybdenum
Prealloy Accelerated CoolingNickel(%)
Copper(%)
CompactionPressure(tsi)
SinteredDensity(g/cm3)
YieldStrength(psi x103)
UltimateTensileStrength(psi x103)
Elongation(%)
Impact(ft•lbf)
Hardness(HRC)
2 0 304050
6.867.127.32
------
110.6145.8180.2
0.60.71.0
6912
25.330.335.5
2 1 304050
6.837.107.25
108.7133.5--
118.0151.4156.5
0.81.01.1
71113
25.230.233.8
4 0 304050
6.887.167.33
113.0139.6165.3
124.1163.4187.9
0.91.21.5
71113
24.329.934.9
4 1 30 6.87 93.8 104.5 0.9 8 23.6
4050
7.117.26
119.7142.1
135.8166.4
1.11.7
1213
29.832.1
TABLE VMechanical Properties of Test Materials with 1.50% Molybdenum
Prealloy Reduced CoolingNickel(%)
Copper(%)
CompactionPressure(tsi)
SinteredDensity(g/cm3)
YieldStrength(psi x103)
UltimateTensileStrength(psi x103)
Elongation(%)
Impact(ft•lbf)
Hardness(HRC)
2 0 304050
6.867.127.32
--116.9141.9
101.0134.8161.1
0.70.81.1
61011
20.124.329.6
2 1 304050
6.837.107.25
103.9126.2128.4
110.4143.6142.8
0.81.01.1
7812
20.927.327.3
4 0 304050
6.887.167.33
104.9129.3146.5
118.5151.8174.6
0.91.11.6
71213
23.327.934.7
4 1 304050
6.877.117.26
--112.7128.6
104.0130.1154.6
1.01.11.6
81214
21.425.830.3
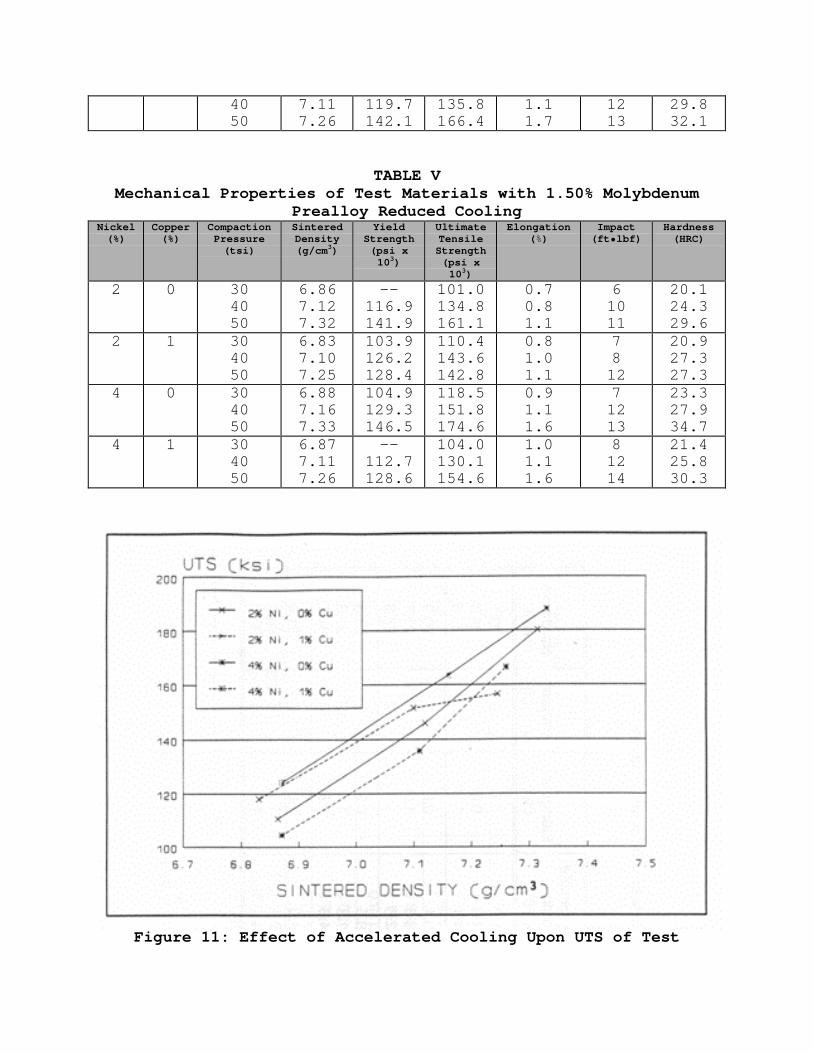
Figure 11: Effect of Accelerated Cooling Upon UTS of Test
Materials with 1.5% Mo Prealloy
For the materials based upon the 0.85% molybdenum prealloy,tensile strength varied from approximately 110,000 psi, atsintered densities of approximately 6.9 g/cm3, to over 160,000psi for materials with sintered densities approaching 7.3 g/cm3.Similar trends were observed for materials based upon the 1.5%molybdenum prealloy where an ultimate tensile strength in excessof 180,000 psi was obtained in material G containing 4% admixednickel.
However, the strength data indicate clear interactions betweencopper and nickel contents and tensile properties. These arediscussed in further below.
Impact
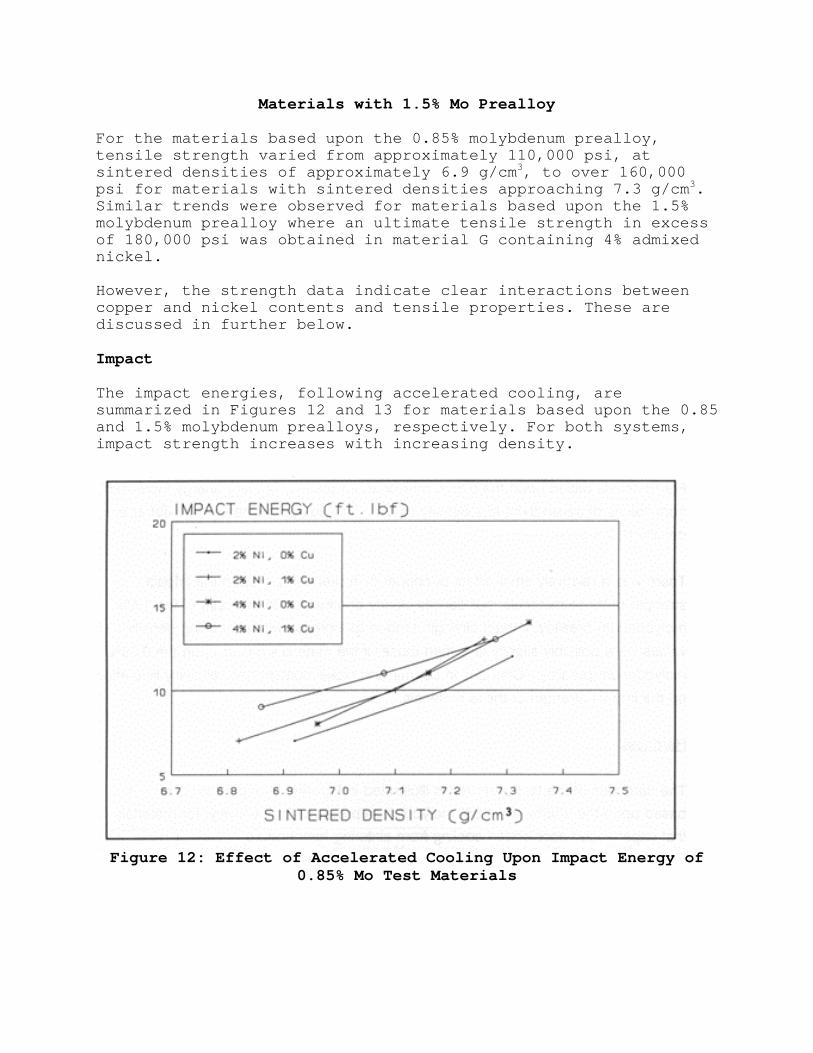
The impact energies, following accelerated cooling, aresummarized in Figures 12 and 13 for materials based upon the 0.85and 1.5% molybdenum prealloys, respectively. For both systems,impact strength increases with increasing density.
Figure 12: Effect of Accelerated Cooling Upon Impact Energy of0.85% Mo Test Materials

Figure 13: Effect of Accelerated Cooling Upon Impact Energy of1.5% Mo Test Materials
For materials based upon the 0.85% molybdenum prealloy, impactenergy increased from values of seven ft•lbf at a density of 6.8g/cm3 to approximately 14 ft•lbf at a density of 7.3 g/cm3.
There was a relatively small effect of copper or nickel contentupon the impact strength of these materials, but density clearlydominates. In the case of the 1.5% molybdenum prealloy, impactstrength tended to increase with increasing density. The valueswere possibly slightly less than those of the materials basedupon the 0.85% molybdenum prealloy. Changes in copper and nickelcontent had relatively little effect on the impact strength ofthese materials.
Hardness
The hardness of the test premixes is illustrated in Figures 14and 15 for premixes based upon the 0.85% and 1.5% molybdenumprealloys, respectively, for materials that experiencedaccelerated cooling from sintering temperature.

Figure 14: Effect of Accelerated Cooling Upon Hardness of 0.85%Mo Test Materials
Figure 15: Effect of Accelerated Cooling Upon Hardness of 1.5% MoTest Materials
The processing produced some variation in hardness between

tensile and impact test pieces. For convenience, the hardnessplotted is the mean of 15 to 25 determinations per testcondition. The materials developed relatively high hardnesslevels from 15 to 35 HRC depending on density and composition.
For those materials based on the 0.85% molybdenum prealloy,hardness increases with increasing density from approximately 22HRC at 6.8 g/cm3 to high values of 33 HRC at 7.3 g/cm3. Thematerials based upon the 1.5% molybdenum prealloy generallyattain higher hardnesses than the equivalent material based uponthe 0.85% molybdenum prealloy. Hardness increases fromapproximately 23 HRC at a density of 6.8 g/cm3 to approximately35 HRC at a density of 7.3 g/cm3. There are clear interactionsbetween the matrix compositions, and the relative additions ofcopper and nickel content upon hardness that are discussedfurther below.
DISCUSSION
The results above illustrate that the program attained its goals.By control of composition, processing and microstructure,materials were developed that attained properties comparable tothose of double pressed, double sintered P/M materials but bysingle compaction processing. When compacted at 50 tsi, the low-alloy nickel, graphite materials achieved sintered densities inexcess of 7.3 g/cm3 with ultimate tensile strengths of 180,000psi. The low-alloy copper, nickel, graphite materials possessedslightly lower sintered densities and ultimate tensile strengthsof 7.25 g/cm3 and 185,000 psi, respectively.
The results confirmed the benefits of employing compressiblemolybdenum prealloyed steel powders for the matrix of the testmaterials. Very high green and, hence, sintered densities of 7.25to 7.3 g/cm3 were attained by single compaction in productionpresses. In materials containing 2 or 4% nickel, slight shrinkageoccurred on sintering to produce materials with ultimate tensilestrengths above 175,000 psi following accelerated cooling. Evenat the reduced cooling rate, simulating increased section size,it proved possible to develop an ultimate tensile strength inexcess of 170,000 psi at a sintered density of 7.33 g/cm3 in the1.5% molybdenum prealloy with 4% added nickel.
Alternatively, by controlled additions of copper and nickel,materials were produced that achieved ultimate tensile strengthabove 160,000 psi at sintered densities of 7.2 g/cm3, followingaccelerated cooling that show less size change in sintering.
The results indicate interactions of composition and processingin controlling the microstructure and hence properties of thetest materials. Certain of these were anticipated, such as the
beneficial effects of molybdenum in improving the hardenabilityand strength of materials processed at lower cooling rates.Others were not anticipated, particularly the apparent adverseinfluence of copper on the properties of materials with highernickel content. These are discussed below with reference to theoriginal themes of:
relative densitymicrostructurematrix
Relative Density
The results confirm that all materials’ properties, UTS, impactenergy and hardness increased with increasing sintered density.It appears that increasing the molybdenum content of the prealloypowder slightly reduces green density (Figures 1 and 2),particularly at lower compaction pressures. The effect is muchless significant at higher compaction pressures.
It is possible that the higher molybdenum content slightly favorsshrinkage on sintering. The sintered densities of test pieces ofequivalent composition are almost identical (Figure 2), althoughthe green densities of materials made with the 1.5% molybdenumprealloy are lower than those of their 0.85% molybdenumequivalent.
As is common in ferrous P/M, adding nickel to the test piecesfavored shrinkage on sintering. Adding 1% copper to the testmaterials favored growth from die size on sintering. Thus,dimensional change on sintering can be used to increase sintereddensity and properties.
Microstructure
The metallography indicated that the materials possessedmicrostructures consisting of tempered martensite, pearlite,nickel-rich areas and small quantities of bainite (Figures 3 -7). Overall, reducing the cooling rate suppressed martensiteformation and increased pearlite contents (Figure 16). The lowercooling rate reduced the mean tempered martensite content of thetest materials from 78% to 59%.
The tempered martensite content of the accelerated cooledmaterials was relatively consistent. It varied only from 75% to83% indicating that the cooling rate was sufficiently rapid toform martensite independently of alloy content in the materialstested. Thus, under accelerated cooling, increasing themolybdenum content of the prealloy from 0.85% to 1.5% produces asmall increase in the mean tempered martensite content from 75.5%
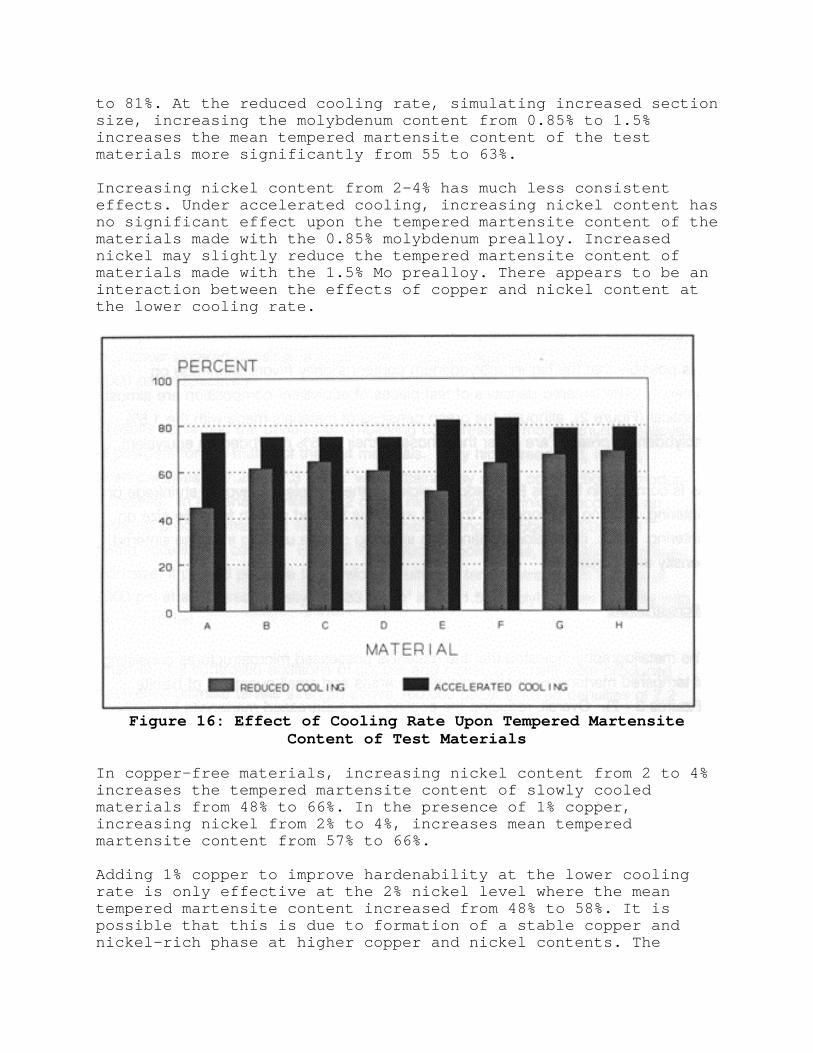
to 81%. At the reduced cooling rate, simulating increased sectionsize, increasing the molybdenum content from 0.85% to 1.5%increases the mean tempered martensite content of the testmaterials more significantly from 55 to 63%.
Increasing nickel content from 2-4% has much less consistenteffects. Under accelerated cooling, increasing nickel content hasno significant effect upon the tempered martensite content of thematerials made with the 0.85% molybdenum prealloy. Increasednickel may slightly reduce the tempered martensite content ofmaterials made with the 1.5% Mo prealloy. There appears to be aninteraction between the effects of copper and nickel content atthe lower cooling rate.
Figure 16: Effect of Cooling Rate Upon Tempered MartensiteContent of Test Materials
In copper-free materials, increasing nickel content from 2 to 4%increases the tempered martensite content of slowly cooledmaterials from 48% to 66%. In the presence of 1% copper,increasing nickel from 2% to 4%, increases mean temperedmartensite content from 57% to 66%.
Adding 1% copper to improve hardenability at the lower coolingrate is only effective at the 2% nickel level where the meantempered martensite content increased from 48% to 58%. It ispossible that this is due to formation of a stable copper andnickel-rich phase at higher copper and nickel contents. The
proportion of nickel-rich areas increases significantly in the 4%nickel and 4% nickel, 1% copper materials (Table IV). Given themutual solid solubility of copper and nickel, it is possible thatthese areas contain both copper and nickel. The presence ofdissolved nickel in copper would raise the melting point of thecopper to delay solution of copper in the matrix. The alloys,particularly copper, contained in the nickel-rich areas wouldreduce the concentration of alloy dissolved in the iron matrix atthe end of sintering. Hence, the contribution of copper andnickel to strength and hardenability improvements would be lessthan anticipated from the chemical composition.
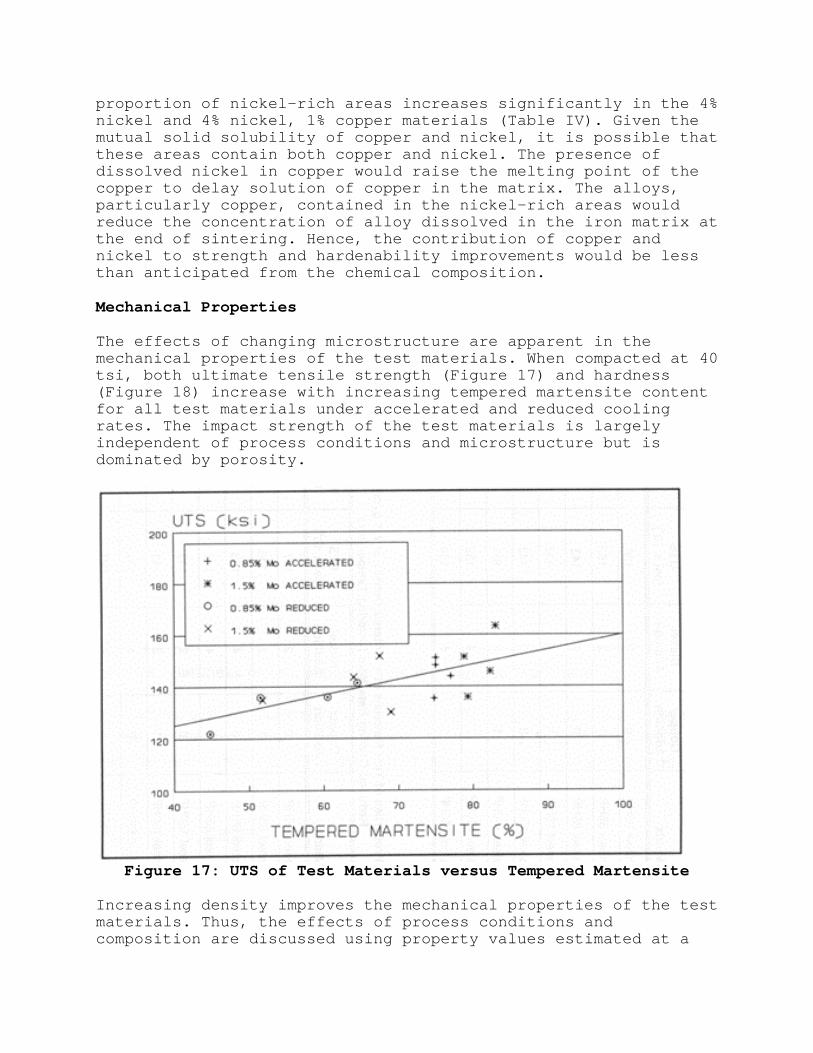
Mechanical Properties
The effects of changing microstructure are apparent in themechanical properties of the test materials. When compacted at 40tsi, both ultimate tensile strength (Figure 17) and hardness(Figure 18) increase with increasing tempered martensite contentfor all test materials under accelerated and reduced coolingrates. The impact strength of the test materials is largelyindependent of process conditions and microstructure but isdominated by porosity.
Figure 17: UTS of Test Materials versus Tempered Martensite
Increasing density improves the mechanical properties of the testmaterials. Thus, the effects of process conditions andcomposition are discussed using property values estimated at a
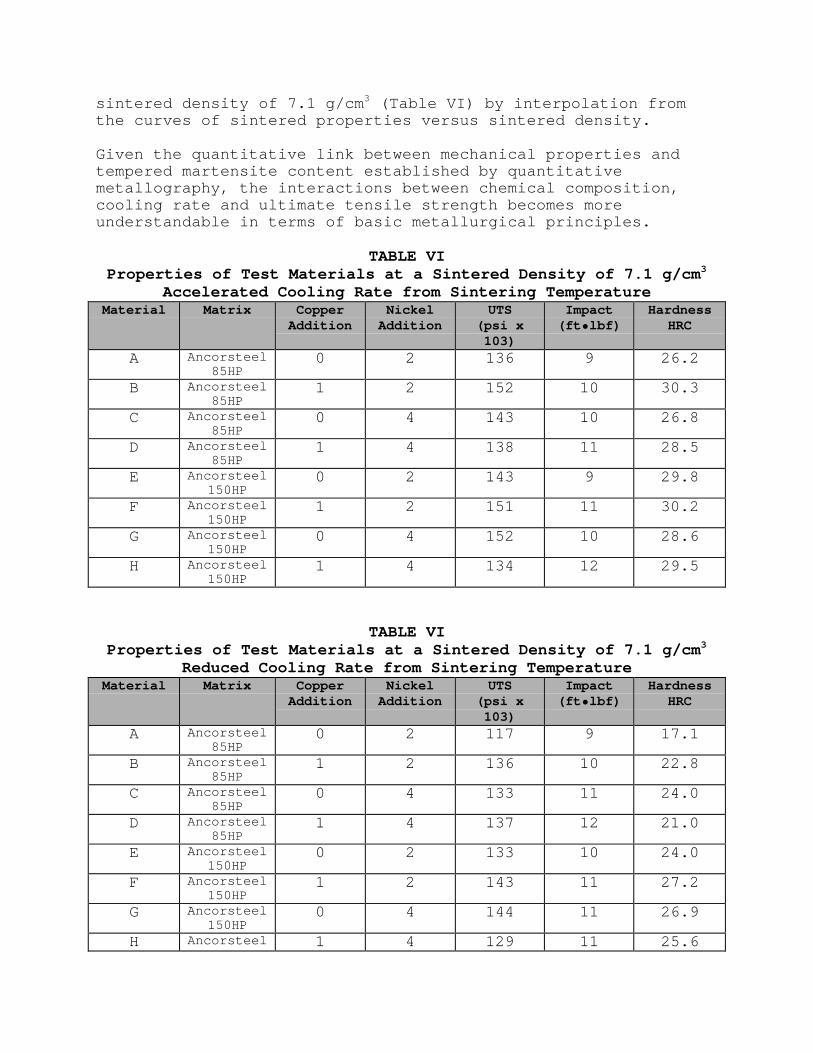
sintered density of 7.1 g/cm3 (Table VI) by interpolation fromthe curves of sintered properties versus sintered density.
Given the quantitative link between mechanical properties andtempered martensite content established by quantitativemetallography, the interactions between chemical composition,cooling rate and ultimate tensile strength becomes moreunderstandable in terms of basic metallurgical principles.
TABLE VIProperties of Test Materials at a Sintered Density of 7.1 g/cm3
Accelerated Cooling Rate from Sintering TemperatureMaterial Matrix Copper
AdditionNickelAddition
UTS(psi x103)
Impact(ft•lbf)
HardnessHRC
A Ancorsteel85HP
0 2 136 9 26.2
B Ancorsteel85HP
1 2 152 10 30.3
C Ancorsteel85HP
0 4 143 10 26.8
D Ancorsteel85HP
1 4 138 11 28.5
E Ancorsteel150HP
0 2 143 9 29.8
F Ancorsteel150HP
1 2 151 11 30.2
G Ancorsteel150HP
0 4 152 10 28.6
H Ancorsteel150HP
1 4 134 12 29.5
TABLE VIProperties of Test Materials at a Sintered Density of 7.1 g/cm3
Reduced Cooling Rate from Sintering TemperatureMaterial Matrix Copper
AdditionNickelAddition
UTS(psi x103)
Impact(ft•lbf)
HardnessHRC
A Ancorsteel85HP
0 2 117 9 17.1
B Ancorsteel85HP
1 2 136 10 22.8
C Ancorsteel85HP
0 4 133 11 24.0
D Ancorsteel85HP
1 4 137 12 21.0
E Ancorsteel150HP
0 2 133 10 24.0
F Ancorsteel150HP
1 2 143 11 27.2
G Ancorsteel150HP
0 4 144 11 26.9
H Ancorsteel 1 4 129 11 25.6
150HP
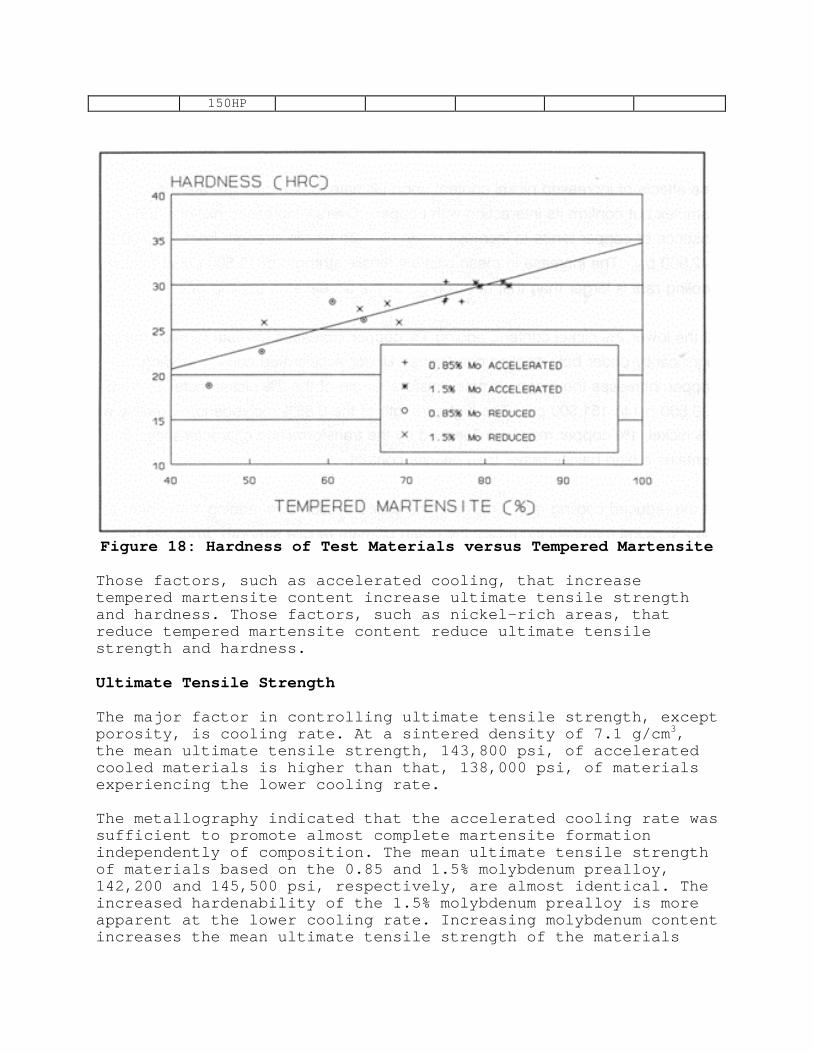
Figure 18: Hardness of Test Materials versus Tempered Martensite
Those factors, such as accelerated cooling, that increasetempered martensite content increase ultimate tensile strengthand hardness. Those factors, such as nickel-rich areas, thatreduce tempered martensite content reduce ultimate tensilestrength and hardness.
Ultimate Tensile Strength
The major factor in controlling ultimate tensile strength, exceptporosity, is cooling rate. At a sintered density of 7.1 g/cm3,the mean ultimate tensile strength, 143,800 psi, of acceleratedcooled materials is higher than that, 138,000 psi, of materialsexperiencing the lower cooling rate.
The metallography indicated that the accelerated cooling rate wassufficient to promote almost complete martensite formationindependently of composition. The mean ultimate tensile strengthof materials based on the 0.85 and 1.5% molybdenum prealloy,142,200 and 145,500 psi, respectively, are almost identical. Theincreased hardenability of the 1.5% molybdenum prealloy is moreapparent at the lower cooling rate. Increasing molybdenum contentincreases the mean ultimate tensile strength of the materials

experiencing the lower cooling rate from 130,700 to 137,200 psi.
The effects of increased nickel content upon ultimate tensilestrength are more complex but confirm its interaction withcopper. Overall, increased nickel in the absence of copper tendsto increase mean ultimate tensile strength from 132,400 to142,900 psi. The increase in mean ultimate tensile strength of13,500 psi at the lower cooling rate is larger than that of 8,500psi at the accelerated cooling rate.
At the lower 2% nickel content, adding 1% copper increasesultimate tensile strength significantly under both coolingconditions. Under accelerated cooling, adding 1% copper increasesthe mean ultimate tensile strength of the 2% nickel materialsfrom 139,800 psi to 151,500 psi. The high strength of the 0.85%molybdenum prealloy with 2% nickel, 1% copper may be influencedby the transformation characteristics. It contains a high bainiterather than pearlite content.
At the reduced cooling rate, simulating increased section size,adding 1% copper to the 2% nickel materials increases the meanultimate tensile strength from 125,000 psi to 139,400 psi.
In contrast, adding 1% copper to the 4% nickel material tends toreduce ultimate tensile strength, particularly in the highermolybdenum materials. The result confirms the metallography. Thecopper and nickel tend to form a stable solid solution discretefrom the matrix such that the strengthening effects of increasedcopper and nickel are less than anticipated from the chemicalcomposition alone. It is possible that longer sintering times orhigher sintering temperatures could increase solution of copperand nickel in the ferrous matrix as discussed in Reference 1.
Hardness
The effects of processing and composition upon the hardness ofthe test pieces are very similar to their effects upon ultimatetensile strength . As indicated by the metallography andillustrated in Figure 19, increasing tempered martensite contentfavors increasing hardness. Thus, those factors that favorincreased martensite content increased cooling rate, increasingmolybdenum, increasing nickel in the absence of copper, andadding 1% copper to 2% nickel materials increase the hardness ofthe test materials. Factors such as reduced cooling rate,increased section size and the addition of 1% copper to 4% nickelmaterials that reduce martensite content reduce hardness.
As indicated in Figure 20, cooling rate has the most significanteffect upon the hardness of the test materials at a sintereddensity of 7.1 g/cm3. The mean hardness, 28.7 HRC of the
accelerated cooled materials is higher than that 23.6 HRC ofmaterials experiencing lower cooling rate. The accelerated cooledmaterials have very similar martensite contents. Thus, theirhardness varies much less, from 26.2 HRC to 30.3 HRC at 7.1 g/cm3
than that of the more slowly cooled materials.
The increased hardenability of the 1.5% molybdenum prealloyincreases the hardness of the materials that experienced thereduced cooling rate. Increasing the molybdenum content of thesematerials from 0.85 to 1.5% increases the mean hardness from 21.2HRC to 25.9 HRC at a sintered density of 7.1 g/cm3.
Increasing the nickel content, from 2% to 4%, in the absence ofcopper increased the hardness of the test materials. The increasewas most significant at the reduced cooling rate, where the meanhardness of the test materials at a density of 7.0 g/cm3
increased from 20.5 HRC to 25.5 HRC with increased nickelcontent.
There is a similar interaction between the effects of copper andnickel upon hardness to that observed upon tensile strength. Theeffects are most apparent at the reduced cooling rate where thereis much more variation in martensite content and hardness. At the2% nickel level, adding 1% copper increases the mean hardness ofthe slowly cooled materials from 20.5 to 25 HRC. In contrast,introducing 1% copper slightly reduces the mean hardness of the4% nickel materials from 25.4 HRC to 23.3 HRC, at a sintereddensity of 7.1 g/cm3.
The data show that by combining these factors correctly, itshould be possible to develop sinter-hardening compositions fromthe test materials. The 27 HRC hardness of the 1.5% molybdenumprealloy with 2% nickel and 1% copper at the reduced cooling ratecompares favorably with the values of 26 to 30 HRC obtained inthe accelerated cooled materials.

Figure 19: Effect of Cooling Rate Upon UTS of Test Materials, 7.1g/cm3
Figure 20: Effect of Cooling Rate Upon Hardness of TestMaterials, 7.1 g/cm3
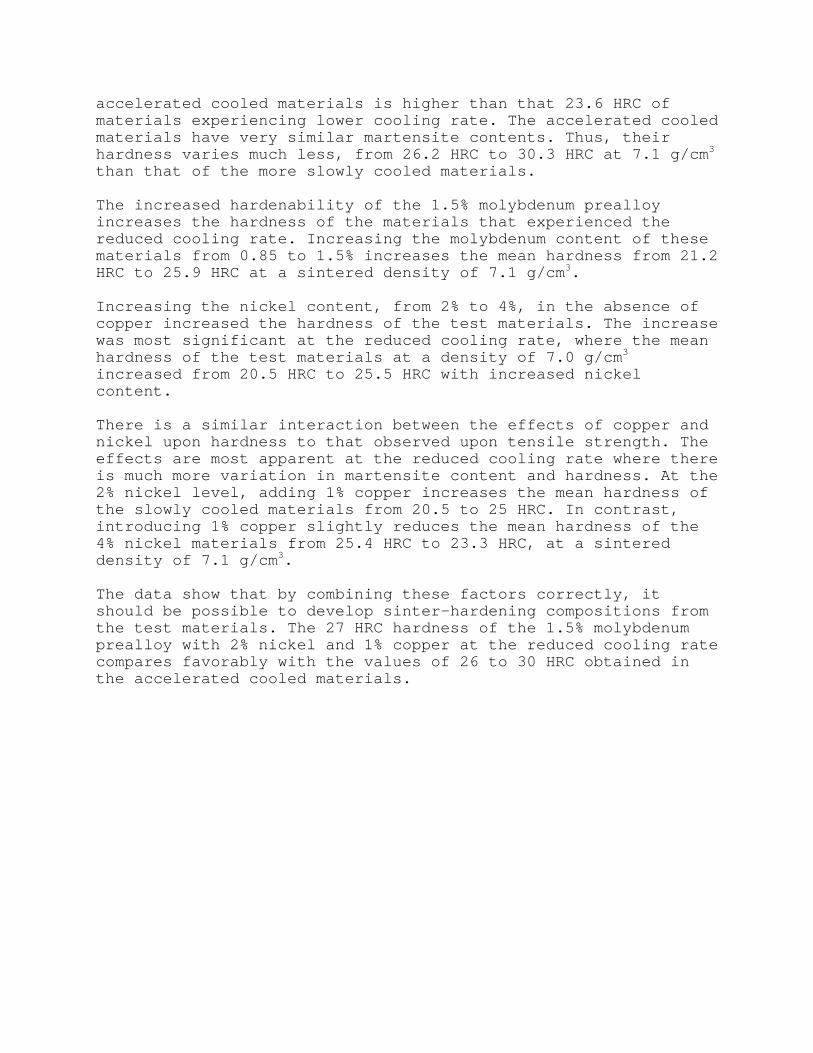
Impact Energy
As discussed above, porosity has the greatest influence uponimpact energy (Figure 21). The curves of impact energy versussintered density for the materials based upon the 0.85%molybdenum prealloy show that other factors have almost noinfluence on impact energy.
With the exception of material F, that contains 2% nickel and 1%copper in the 1.5% molybdenum prealloy, cooling rate has nosignificant effect upon impact energy. It is possible thatincreasing alloy content may increase the impact energy of thetest materials slightly. At a sintered density of 7.1 g/cm3, theimpact energy of materials containing 4% nickel and 1% copper isslightly higher than that of the materials that contain only 2%nickel. This may indicate that the presence of discrete nickel-rich areas in P/M materials tends to improve toughness (7,8)
Figure 21: Effect of Cooling Rate Upon Impact of Test Materials,7.1 g/cm3
COMPARISON WITH DOUBLE PRESSED MATERIALS
The aim of this work was to achieve mechanical propertiescomparable to existing double pressed, double sintered (DPDS),materials by single compaction. The data indicate that the

sintered density, 7.2 to 7.3 g/cm3, and ultimate tensile strengthof the test materials compare favorably with published data forDPDS materials (Figures 22 and 23), such as FN-0405HT publishedin MPIF Standard 35,1990-1991 Edition. The figures show that inthe rapidly cooled condition (Figure 22), the ultimate tensilestrengths of test materials based upon both the 0.85% and 1.5%molybdenum prealloys are equivalent or superior to those of theheat treated FN-0405HT at densities of 6.8 to 7.2 g/cm3.
However, MPIF Standard 35 indicates that densities above 7.0g/cm3 were achieved by double pressing. Thus, the test materialsoffer a significantly more efficient route to high performancethan conventional alternatives.
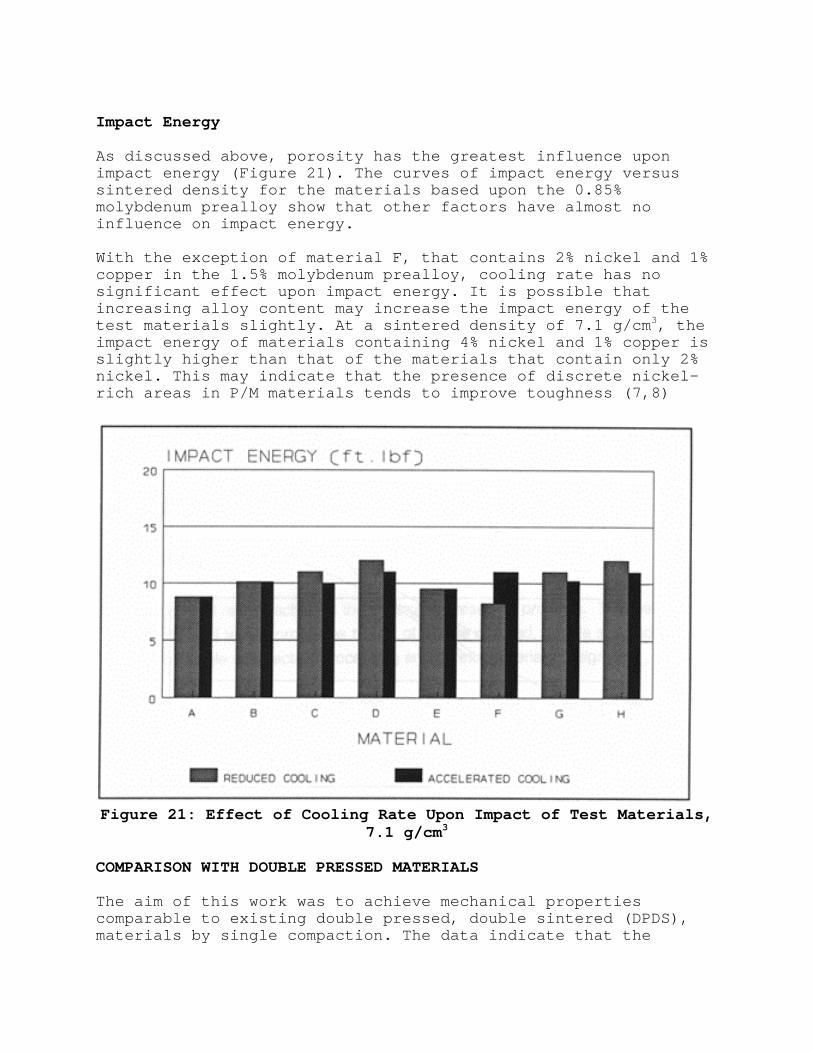
The comparison is more favorable if the properties obtained atthe reduced cooling rate are compared to those of as-sintered FN-0405.
Figure 22: Comparison of Rapidly Cooled Test Materials with FN-0405HT
The ultimate tensile strength of test materials that were singlecompacted to a density of 6.85 g/cm3, then slowly cooled fromsintering temperature exceeds that quoted for FN-0405 at asintered density of 7.2 g/cm3 achieved by repressing.
Figure 23: Comparison of Test Materials with FN-0405
CONCLUSION
The experimental results achieved the aims of the researchprogram. The test -materials attained tensile properties typicalof double pressed, double sintered materials by single compactionprocessing and careful materials design.
Ultimate tensile strengths above 170,000 psi can be achieved, atsintered densities of 7.25 g/cm3, following accelerated coolingfrom sintering temperature. Strengths in excess of 160,000 psican be developed at reduced cooling rates simulating increasedsection size.
The results confirmed the basic principles of the program.
The molybdenum prealloy steel powders offer an attractive basisfor developing high performance materials.
Increasing the molybdenum content of the prealloy from 0.85 to1.5% has a beneficial effect on hardenability.
Controlled introduction of copper and nickel into the molybdenumprealloy powder produces high sintered density and ultimatetensile strengths.
Accelerated cooling from sintering temperature can be employed to
develop martensitic microstructures in the test materials.
ACKNOWLEDGMENTS
The authors wish to acknowledge the support of the Burgess-NortonManufacturing Company and Hoeganaes Corporation. They would liketo thank the staff of Burgess-Norton Manufacturing Company and,in particular, Mr. T. J. Krave for his assistance in producingand processing the test specimens. They are particularly gratefulfor the cooperation of the following Hoeganaes personnel: Messrs.R. Fitzpatrick and C. Gamble for measurement of mechanicalproperties along with G. Golin and S. Kolwicz for metallography.
REFERENCES
1. Hamill, J.A., Jr., Causton, R. J., Shah, S., “HighPerformance Ferrous P/M Materials Utilizing High TemperatureSintering,” to be published, Advances in Powder Metallurgy, 1992,published by Metal Powder Industries Federation, Princeton, NJ.
2. Causton, R. J., James, W. B., Fulmer, J. J., “PerformanceCharacteristics of a New Sinter-Hardening Low-Alloy Steel,”Advances in Powder Metallurgy, 1991, Vol. 5, p 91, published byMetal Powder Industries Federation, Princeton, NJ.
3. McDermott, M.J., “P/M Parts Fabrication with ANCORBOND(Binder-Treated) Premixes,” Advances in Powder Metallurgy, 1990,Vol. 1, p 209, published by Metal Powder Industries Federation,Princeton, NJ
4. U.S. Patent 4,483,906, “Homogeneous Iron-Based PowderMixtures”.
5. U.S. Patent 4,834,800, “Iron-Based Powder Mixtures”.
6. Causton, R.J., Murphy, T.F. et al, “Non-Metallic InclusionMeasurement of Powder Forged Steels Using an Automatic ImageAnalysis System,” Hodzons of Powder Metallurgy, 1986, Part II, p727, published by Verlag Schmid, GmbH, Freiburg, Germany.
7. O’Brien, R.C., “Fatigue Properties of P/M Materials,” SAE,Technical Paper 880165, 1988, Society of Automotive Engineers,Cobo Hall, Detroit, Michigan.
8. O’Brien, R.C., “Impact and Fatigue Characterization ofSelected Ferrous P/M Materials,” Progress in Powder Metallurgy,1987, Vol. 43, pp 749, published by Metal Powder IndustriesFederation, Princeton, NJ.
9. Potter, V.C., James, W.B. and Murphy, T.F., “Steering Column

Tilt Lever - P/M Material Development,” SAE Technical Paper900381, Society of Automotive Engineers, Cobo Hall, Detroit, Ml,1990.
Notes:
1Ancorsteel and ANCORBOND are registered trademarks of HoeganaesCorporation.