Single Technology Appraisal Naldemedine for treating ...
587
© National Institute for Health and Care Excellence 2020. All rights reserved. See Notice of Rights. The content in this publication is owned by multiple parties and may not be re-used without the permission of the relevant copyright owner. Single Technology Appraisal Naldemedine for treating opioid-induced constipation [ID1189] Committee Papers
Transcript of Single Technology Appraisal Naldemedine for treating ...
© National Institute for Health and Care Excellence 2020. All rights reserved. See Notice of Rights. The content in this publication is owned by multiple parties and may not be re-used without the permission of the relevant copyright owner.
Single Technology Appraisal
Naldemedine for treating opioid-induced constipation [ID1189]
Committee Papers

© National Institute for Health and Care Excellence 2020. All rights reserved. See Notice of Rights. The content in this publication is owned by multiple parties and may not be re-used without the permission of the relevant copyright owner.
NATIONAL INSTITUTE FOR HEALTH AND CARE EXCELLENCE
SINGLE TECHNOLOGY APPRAISAL
Naldemedine for treating opioid-induced constipation [ID1189] Contents: The following documents are made available to consultees and commentators: The final scope and final stakeholder list are available on the NICE website.
1. Company submission from Shionogi Ltd 2. Company response to NICE’s request for clarification
3. Patient group, professional group and NHS organisation submission
from: a. British Society of Gastroenterology, endorsed by the Royal College of
Physicians
4. Expert personal perspectives from: a. Dr Andrew Davies, clinical expert, nominated by Kyowa Kirin b. Dr AF, clinical expert, nominated by the British Society of
Gastroenterology
5. Evidence Review Group report prepared by Kleijnen Systematic Reviews Ltd
6. Evidence Review Group – factual accuracy check
7. Technical Report sent out for engagement
8. Technical engagement response from Shionogi Ltd
a. Response form b. Additional response
Technical engagement responses from experts: None
9. Technical engagement response from consultees and commentators:
a. Kyowa Kirin
10. Evidence Review Group critique of company response to technical engagement prepared by Kleijnen Systematic Reviews Ltd
Any information supplied to NICE which has been marked as confidential, has been
redacted. All personal information has also been redacted.

1
NATIONAL INSTITUTE FOR HEALTH AND CARE EXCELLENCE
Single technology appraisal
Constipation (opioid-induced) - naldemedine (RIZMOIC) [ID1189]
Document B
Company evidence submission
June 2019
File name Version Contains confidential information
Date
Naldemedine ID1189
3 Yes June 2019

2
Contents
NATIONAL INSTITUTE FOR HEALTH AND CARE EXCELLENCE ........................... 1 Single technology appraisal ........................................................................................ 1 Constipation (opioid-induced) - naldemedine (RIZMOIC) [ID1189] ............................. 1 Document B ................................................................................................................ 1 Company evidence submission .................................................................................. 1 Contents ...................................................................................................................... 2 List of tables ................................................................................................................ 4 List of figures ............................................................................................................... 5 B.1 Decision problem, description of the technology and clinical care pathway .......... 7
B.1.1 Decision problem .......................................................................................................... 7 B.1.2 Description of the technology being appraised ....................................................... 12 B.1.3 Health condition and position of the technology in the treatment pathway .................. 13 B1.4. Burden of OIC ............................................................................................................. 25 B.1.5 Equality considerations ............................................................................................... 26
B.2 Clinical effectiveness .......................................................................................... 28 B.2.2 List of relevant clinical effectiveness evidence ....................................................... 29 B.2.3 Summary of methodology of the relevant clinical effectiveness evidence .............. 31 B.2.4 Quality assessment of the relevant clinical effectiveness evidence ....................... 36 B.2.4 Clinical effectiveness results of the relevant trials .................................................. 38 B.2.6 Subgroup analysis .................................................................................................. 43 B.2.8 Meta-analysis ......................................................................................................... 49 B.2.9 Indirect and mixed treatment comparisons ............................................................ 51 B.2.10 Adverse reactions .................................................................................................. 53 B.2.11 Interpretation of clinical effectiveness and safety evidence .................................... 58 B.2.12 Ongoing studies ..................................................................................................... 59 B.2.13 Innovation............................................................................................................... 59 B.2.14 Interpretation of clinical effectiveness and safety evidence .................................... 59
B.3 Cost effectiveness .............................................................................................. 60 B.3.1 Published cost-effectiveness studies ..................................................................... 60 B.3.2 Economic analysis ................................................................................................. 64 B.3.3 Clinical parameters and variables .......................................................................... 69 B.3.4 Measurement and valuation of health effects ......................................................... 75 B.3.5 Cost and healthcare resource use identification, measurement and valuation ...... 88 B.3.6 Summary of base-case analysis inputs and assumptions ...................................... 93 B.3.7 Base-case results ................................................................................................... 97 B.3.8 Sensitivity analyses ................................................................................................ 97 B.3.9 Subgroup analysis ................................................................................................ 105 B.3.10 Validation ............................................................................................................. 106 B.3.11 Interpretation and conclusions of economic evidence .......................................... 106
B.4 References ....................................................................................................... 108 B.5 Appendices ....................................................................................................... 122 Appendix C: Summary of product characteristics (SmPC) and European public assessment report (EPAR) ......................................................................................................... 122 Appendix E: Subgroup analysis .............................................................................. 122 Appendix F: Adverse reactions ............................................................................... 122 Appendix G: Published cost-effectiveness studies .................................................. 122 Appendix H: Health-related quality-of-life studies ................................................... 123 Appendix I: Cost and healthcare resource identification, measurement and valuation146 Appendix K: Estimated resource use and budget impact ........................................ 170 Appendix L:Checklist of Confidential Information ................................................... 170 Appendix M:CPRD Study Report C Morgan 2019 .................................................. 170

3
Appendix N:Communication from Prof Dickenson ................................................. 170 Appendix O:Outputs from Clinical Advisory Board Sept 2018 ................................. 170

4
List of tables
Table 1. The COMPOSE clinical trial program ...................................................................................................... 8 Table 2. The decision problem ............................................................................................................................. 10 Table 3. Technology being appraised ................................................................................................................. 12 Table 4. Rome IV opioid induced constipation definition (20) .......................................................................... 14 Table 5. Effects of opioids on gastrointestinal functioning .............................................................................. 14 Table 6. Barriers to OIC diagnosis (20) ............................................................................................................... 16 Table 7. Types of therapy used to treat OIC ....................................................................................................... 21 Table 8. Recommendations for Treatment of Opioid Induced Constipation ................................................... 22 Table 9. Clinical effectiveness evidence ............................................................................................................. 29 Table 10. Summary of trials design ..................................................................................................................... 31 Table 11. Characteristics of participants in the studies across treatment groups. ........................................ 34 Table 12. Quality assessment results for parallel group RCTs. ....................................................................... 37 Table 13. Clinical effectiveness of naldemedine 0.2 mg vs. placebo ............................................................... 38 Table 14. Time to onset of action ......................................................................................................................... 46 Table 15. Quality of life .......................................................................................................................................... 46 Table 16. Proportion of SBM Responders from the COMPOSE studies .......................................................... 47 Table 17. League table of results for failure to achieve an average of >=3BMs per week with an increase of >=1BM per week over baseline or an average of >=3BMs per week ................................................................ 50 Table 18. Summary of the trials used to carry out ITC for response rate at Week 4 (LIR population) ......... 51 Table 19. Data used in ITC for response rate at Week 4 (LIR population) ....................................................... 51 Table 20. Summary of the trials used to carry out ITC for response rate at Week 12 (LIR population) ....... 52 Table 21. Adverse reactions (n [%]) experienced with naldemedine 0.2 mg vs. placebo in the COMPOSE program .................................................................................................................................................................. 54 Table 22. Summary list of published cost-effectiveness studies ..................................................................... 61 Table 23. Features of the economic analysis ..................................................................................................... 68 Table 24. Proportion of patients in ‘non-OIC(treatment)’ state at Week 4 and Week 12, trial-based and ITC-derived .................................................................................................................................................................... 69 Table 25. Functions used to estimate transition A (Week 4 onwards) ............................................................. 72 Table 26. Disease fluctuation (between ‘OIC’ and ‘non-OIC[untreated]’) ........................................................ 74 Table 27. Summary of quality of life measurements in clinical trial programme ............................................ 76 Table 28. Repeated measures mixed model of determinants of SF-6D utility in pooled COMPOSE-1 & -2 dataset .................................................................................................................................................................... 77 Table 29. Repeated measures mixed model of determinants of mapped EQ-5D utility in pooled COMPOSE-1 & -2 dataset .......................................................................................................................................................... 77 Table 30. Pooled analysis of Week 12 non-OIC patients in COMPOSE-1 & -2 ............................................... 80 Table 31. Summary of health-related quality-of-life studies reporting constipation status and utility ........ 81 Table 32. Summary of utility values for cost-effectiveness analysis ............................................................... 88 Table 33. Unit costs associated with the technology in the economic model (GBP2019) ............................. 90 Table 34. NHS costs of managing OIC (£2019) .................................................................................................. 90 Table 35 Overall AE Costs .................................................................................................................................... 91 Table 36. Summary of variables applied in the economic model. .................................................................... 93 Table 37. List of assumptions used in the economic model ............................................................................. 95 Table 38. Base-case results .................................................................................................................................. 97 Table 39: Deterministic results – health state utilities (direct EQ-5D) ........................................................... 103 Table 40. Deterministic results – health state utilities (mapped from SF-12) ................................................ 103 Table 41: Deterministic results - time horizon .................................................................................................. 104 Table 42: Deterministic results - Maintenance of response distribution (Transition A) .............................. 105
5
List of figures
Figure 1. A suggested pragmatic stepwise management suggestion for the management of opioid-induced constipation (OIC) in clinical practice(20) ............................................................................................ 23 Figure 2. Proportions (± SE) of responders in the naldemedine and placebo groups in COMPOSE-1 and COMPOSE-2 (intent-to-treat population) ............................................................................................................. 39 Figure 3. Proportions (± SE) of responders in the naldemedine and placebo groups in COMPOSE-4 (full analysis set) ........................................................................................................................................................... 39 Figure 4. Proportions (± SE) of responders in the naldemedine and placebo groups in V9321 and COMPOSE-2 (intention-to-treat population) ....................................................................................................... 40 Figure 5. Changes from baseline in frequency of bowel movements in V9325 (intent-to-treat population; LSM and SE, *P≤0.0001 vs placebo; BL, baseline; BM, bowel movement; LSM, least squares mean; SE, standard error.) ...................................................................................................................................................... 41 Figure 6. Kaplan-Meier curve of time to first SBM (intent-to-treat population) ............................................... 41 Figure 7. Kaplan-Meier curve of time to first SBM (intent-to-treat population) ............................................... 42 Figure 8. Proportion of subjects with ≥1 SBM at specific time points after the initial dose of the study drug in COMPOSE-4 (% ± 95% CI; full analysis set, *P<0.0001 versus placebo. ..................................................... 42 Figure 9. Change from baseline in (A) Patient Assessment of Constipation Symptoms and (B) Patient Assessment of Constipation Quality of Life scores (intent-to-treat population; LSM and SE; *P≤0.0001 vs placebo). ................................................................................................................................................................. 43 Figure 10. [enter description] ............................................................................................................................... 44 Figure 11. [enter description] ............................................................................................................................... 44 Figure 12. Difference of Proportion of SBM Responders with its 95% Confidence Interval (Studies COMPOSE-1 and COMPOSE-2), ITT Population ................................................................................................. 45 Figure 13. Difference of Proportion of SBM Responders with its 95% Confidence Interval (Studies V9222 and COMPOSE-4) ................................................................................................................................................... 45 Figure 14. Change in the Frequency of SBMs/week from Baseline to Each Week by LIR/Non-LIR Subgroups: LS Mean ± SE (Studies COMPOSE-1 and COMPOSE-2), ITT Population ................................... 48 Figure 15. Change in the Frequency of CSBMs/week from Baseline to Each Week by LIR/Non-LIR Subgroups: LS Mean ± SE (Studies COMPOSE-1 and COMPOSE-2), ITT Population ................................... 49 Figure 16. Findings from the independent network meta-analysis. Forest plot of the indirect evidence for failure to achieve an average of ≥3 BMs per week with an increase of ≥1 BM per week over baseline. I2 for global statistical heterogeneity was 70.6%. ........................................................................................................ 50 Figure 17. ITC results for response rate at Week 4 (LIR population) ............................................................... 52 Figure 18. ITC results for response rate at Week 12 (LIR population) ............................................................. 53 Figure 19. Assessments of opioid withdrawal: Clinical Opiate Withdrawal Scale (A) and Subjective Opiate Withdrawal Scale (B). ............................................................................................................................................ 55 Figure 20. Assessment of pain intensity using the Numeric Rating Scale Safety population (mean and SD). .......................................................................................................................................................................... 56 Figure 21. Mean (± SE) Numeric Rating Scale scores (safety population) ...................................................... 56 Figure 22. Total daily dose of opioid (safety population) .................................................................................. 57 Figure 23. Decision-tree schema for first model cycle (response assessment) ............................................. 66 Figure 24. Markov model structure from second model cycle ......................................................................... 67 Figure 25. Parametric survival models of treatment response fitted to subgroup data from pooled COMPOSE-1 & -2 data (Scenario 1). .................................................................................................................... 71 Figure 26. Parametric survival models of treatment response fitted to stable laxative subgroup data from COMPOSE-3 (Scenario 2) ...................................................................................................................................... 73 Figure 27. Parametric survival models of treatment response fitted to LIR subgroup from pooled COMPOSE-1 & -2 data (Scenario 3) ..................................................................................................................... 73 Figure 28 : Probabilistic sensitivity analysis - Cost-effectiveness Acceptability curve - Scenario 1 (base case) ........................................................................................................................................................................ 98 Figure 29: Probabilistic sensitivity analysis - Cost effectiveness plane - Scenario 1 (base case) ............... 98 Figure 30: Probabilistic sensitivity analysis - Cost-effectiveness Acceptability curve - Scenario 2 (base case) ........................................................................................................................................................................ 99 Figure 31: Probabilistic sensitivity analysis - Cost effectiveness plane - Scenario 2 (base case) ............... 99

6
Figure 32:Probabilistic sensitivity analysis - Cost-effectiveness Acceptability curve - Scenario 3 (base case) ...................................................................................................................................................................... 100 Figure 33: Probabilistic sensitivity analysis - Cost effectiveness plane - Scenario 3 .................................. 100 Figure 34: One-way sensitivity analysis– Tornado diagram - Scenario 1 (base case) ................................. 101 Figure 35: One-way sensitivity analysis– Tornado diagram - Scenario 2...................................................... 101 Figure 36: One-way sensitivity analysis – Tornado diagram - Scenario 3 .................................................... 102 Figure 37: Probabilistic sensitivity analysis - Cost-effectiveness Acceptability curve - Scenario 1 – health state utilities (direct EQ-5D) ................................................................................................................................ 104 Figure 38: Probabilistic sensitivity analysis - Cost effectiveness Acceptability Curve - Scenario 1 – health state utilities (mapped from SF-12) .................................................................................................................... 104

7
B.1 Decision problem, description of the technology and clinical care
pathway
B.1.1 Decision problem
The submission focuses on the technology’s marketing authorisation naldemedine is indicated for the treatment of
opioid-induced constipation (OIC) in adult patients who have previously been treated with a laxative (Appendix C).
Naldemedine is a member of the peripheral acting mu opioid receptor antagonist (PAMORA) class of drugs with a
permanent binding action on the Mu opioid receptor resulting in blocking the action of opioid drugs in the gut to
alleviate their gastrointestinal side effects.
Naldemedine has been extensively studied in the treatment of opioid induced constipation (OIC) in patients with
chronic pain and cancer pain taking strong opioid therapy in the COMPOSE studies (1–11).
Naldemedine should be used in patients who are being treated with opioids and diagnosed with OIC having
previously been treated laxative. The product should be considered after the trial of one laxative either as an
alternative monotherapy or as an adjuvant where appropriate, such as multiple causation of constipation symptoms.
Naldemedine therapy must be discontinued if treatment with the opioid analgesic is discontinued.
This submission will present the economic case for naldemedine for the following three scenarios to support its
licensed use in NHS England & Wales.
1. An alternative to second-line laxative monotherapy in patients with OIC;
2. An alternative to combination-laxative therapy in patients with mixed aetiology constipation (which includes
OIC) when combined with existing laxative therapy; and as
3. An alternative to naloxegol in patients with OIC who have previously had an inadequate response to laxative
treatment/s.
These scenarios are based on the analysis strategy of the previous TA345 for naloxegol (12).
The clinical effectiveness and safety of naldemedine has been demonstrated in an extensive programme of RCTs
(Table 1):
The clinical and economic case for naldemedine is focused on routine primary and secondary care OIC
management. Longer term management of non-cancer and cancer pain can be initiated by a specialist but is
in the majority managed in primary care (13).
Opioid-induced bowel disfunction (OBD) can be considered to occur at some stage in all patients that continue
opioid therapy for pain relief over an extended period. A systematic review in chronic non-cancer pain patients
(14), found that the overall prevalence rate of OBD was 41% of RCT-enrolled patients being treated with oral
opioids. When actively questioned about opioid side effects, at least 90% of patients report constipation as a
major side effect of their opioid regimen and may worsen over time (15,16).

8
Table 1. The COMPOSE clinical trial program
Study Setting Design
COMPOSE 11
Chronic non-cancer pain
12-week efficacy and safety study in subjects receiving OAT
COMPOSE 21
12-week efficacy and safety study in subjects receiving OAT
COMPOSE 32
52-week long-term safety and efficacy study in subjects receiving OAT
COMPOSE 43,4
Cancer pain
14-day treatment study evaluating efficacy and safety in subjects receiving OAT
COMPOSE 53,4
12-week extension study evaluating safety and efficacy in subjects receiving OAT
COMPOSE 6*
Chronic non-cancer pain
48-week long-term study evaluating safety, efficacy, and PK in subjects receiving OAT
COMPOSE 7* 48-week long-term study evaluating safety, efficacy, and PK in subjects receiving oxycodone
POOLED DATA
Chronic non-cancer pain
Pooled data from the COMPOSE 1 and COMPOSE 2 12-week efficacy and safety studies in subjects receiving OAT
OAT – Opioid Antagonist Therapy
Patients requiring opioids over an extended period for either chronic pain or cancer pain usually require long-
term management of their consequent constipation symptoms. A variety of laxatives are routinely used to
relieve constipation symptoms caused by opioids. While the choice of laxative is often dependent on clinician
background and preferences, these agents do not treat the underlying cause of Mu opioid agonism effects on
gut motility (Appendix N). This approach, especially when opioids are initiated in primary care, can lead to
compromised pain control, coping and bowel evacuation self-management techniques, resulting in lower
patient quality of life (14).
Constant cycling between laxatives (unstable laxative therapy) consumes routine NHS resources and is costlier
in comparison to a stable laxative regime. An examination of CPRD conducted by Shionogi has demonstrated
that unstable laxative therapy (defined as either escalating dose of -, addition of-, or switching of laxative therapy
leads to much higher NHS resource costs (Appendix M). Unstable laxative therapy in OIC also results in patient
dissatisfaction and lower patient quality of life (17).
It is important to distinguish chronic functional constipation from OIC as common medical problem with relevant
impact on the patients' quality of life. Modern definitions recognize constipation as a polysymptomatic disorder,
including various aspects of disturbed defaecation. Current guidelines recommend a stepwise approach in the
management of chronic constipation and OIC. New international guidance for OIC and specialist clinicians now
recognise that earlier intervention for patients with opioid-induced constipation, using peripherally acting Mu
opioid antagonists has shown to successfully improve this specific medical problem and even to potentially
increase survival time in terminally ill patients on opioid therapy (18,19). The UEG has recently published a
simple algorithm for OIC management (18,20) which recommends the use of the PAMORA class of drug after
the use of a single laxative trial at opioid initiation. Naldemedine can be initiated at the first clinical review stage
after opioid initiation, or at the next patient review if opioid therapy is expected to extend beyond acute pain
therapy treatment.
The clinical evidence base for naldemedine is based on treatment in patients receiving opioids who have
chronic pain or cancer pain (1–11). The license reflects the trial data demonstrating clinical effectiveness and
safety of naldemedine in patients previously treated with a laxative. OIC will often persist for as long as patient
is taking the opioid. (Appendix C).

9
Naldemedine has demonstrated clinical effectiveness and persistently improved quality of life in a 52-week
placebo-controlled RCT without compromising pain control (2).
Naldemedine has demonstrated its largest clinical effect vs placebo in the COMPOSE-4 RCT in cancer patients
(4).
Naldemedine is a simple once daily oral therapy that has demonstrated effectiveness regardless of opioid dose
based on its permanent binding capacity at the receptor level (Appendix C).
Naldemedine has demonstrated superior clinical efficacy to all other Mu receptor antagonists (central or
peripherally acting) in an independent network meta-analysis (21).
Naldemedine is cost-effective in chronic pain patients, either: as monotherapy vs second-line laxative therapy;
in combination with stable laxative therapy; or as an alternative to naloxegol in patients with a previous
inadequate response to laxative/s. Naldemedine is assumed to be cost-effective in cancer pain patients not
only as this was accepted in TA345 (22), but also because naldemedine has shown greatest treatment effect
in its cancer patients (4). In addition, the economic analysis shows shorter model time horizons to have
negligible effect on perceived cost-effectiveness in the base case.
Naldemedine offers clinicians a well-tolerated, once daily oral treatment for OIC; its ease-of-use lends itself to
prescribing in primary care where UEG guidance suggests the majority of OIC management should take
place (23). As patients do not have to meet criteria for laxative failure to be eligible for treatment,
naldemedine is the only PAMORA that can fulfil the stepwise approach to OIC laid out in the UEG guidelines.
It is important to note that naldemedine is the only licensed medication that aligns to the new UEG Guidelines
as it does not require prior laxative inadequate response and its license supports its addition to an existing
laxative regime.
Although the use of naldemedine is not precluded in acute pain, the current clinical and economic evidence
base has been developed in chronic non-cancer populations managed with opioids, and these remain the
focus of the current submission.
10
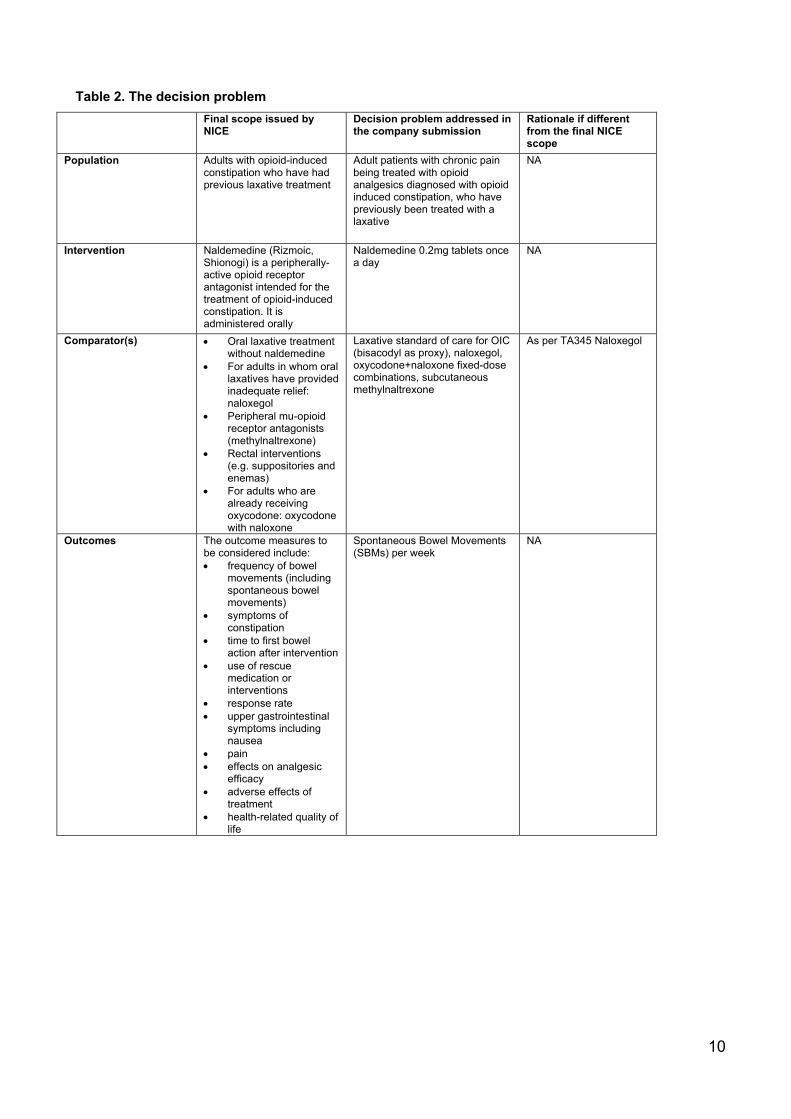
Table 2. The decision problem
Final scope issued by NICE
Decision problem addressed in the company submission
Rationale if different from the final NICE scope
Population Adults with opioid-induced constipation who have had previous laxative treatment
Adult patients with chronic pain being treated with opioid analgesics diagnosed with opioid induced constipation, who have previously been treated with a laxative
NA
Intervention Naldemedine (Rizmoic, Shionogi) is a peripherally-active opioid receptor antagonist intended for the treatment of opioid-induced constipation. It is administered orally
Naldemedine 0.2mg tablets once a day
NA
Comparator(s) Oral laxative treatment without naldemedine
For adults in whom oral laxatives have provided inadequate relief: naloxegol
Peripheral mu-opioid receptor antagonists (methylnaltrexone)
Rectal interventions (e.g. suppositories and enemas)
For adults who are already receiving oxycodone: oxycodone with naloxone
Laxative standard of care for OIC (bisacodyl as proxy), naloxegol, oxycodone+naloxone fixed-dose combinations, subcutaneous methylnaltrexone
As per TA345 Naloxegol
Outcomes The outcome measures to be considered include: frequency of bowel
movements (including spontaneous bowel movements)
symptoms of constipation
time to first bowel action after intervention
use of rescue medication or interventions
response rate upper gastrointestinal
symptoms including nausea
pain effects on analgesic
efficacy adverse effects of
treatment health-related quality of
life
Spontaneous Bowel Movements (SBMs) per week
NA

11
Economic analysis The reference case stipulates that the cost-effectiveness of treatments should be expressed in terms of incremental cost per quality-adjusted life year. If the technology is likely to provide similar or greater health benefits at similar or lower cost than technologies recommended in published NICE technology appraisal guidance for the same indication, a cost-comparison may be carried out.
NA NA
Subgroups to be considered
If the evidence allows the following subgroup will be considered: reason for taking opioids (cancer pain or non-cancer pain) Guidance will only be issued in accordance with the marketing authorisation. Where the wording of the therapeutic indication does not include specific treatment combinations, guidance will be issued only in the context of the evidence that has underpinned the marketing authorisation granted by the regulator.
The economic case for naldemedine is presented through three main subgroups covering the main therapeutic positions for the product in the treatment of OIC 1. An alternative to second-line
laxative monotherapy in patients with OIC;
2. An alternative to
combination-laxative therapy in patients with mixed aetiology constipation (including OIC) when combined with existing laxative therapy; and as
3. An alternative to naloxegol
in patients with OIC who have previously had an inadequate response to laxative treatment/s.
The economic case for cancer patients will not be presented in this submission as per TA345 Naloxegol

12
B.1.2 Description of the technology being appraised
The Summary of Product Characteristics and European Public Assessment Report for
naldemedine are included in Appendix C.
Table 3. Technology being appraised
UK approved name and brand name
Naldemedine (RIZMOIC®)
Mechanism of action The active substance, naldemedine (as the tosylate), works by attaching to and blocking receptors in the gut (mu-, delta- and kappa-opioid receptors), through which opioid medicines cause constipation.
Because molecules of naldemedine were designed not be able to enter into the brain, the medicine does not prevent opioids from working on pain receptors in the brain and therefore does not interfere with pain relief.
Naldemedine belongs to the therapeutic agent class, peripherally acting Mu opioid receptor antagonist (PAMORA).
Marketing authorisation EU MA granted on the 18/02/2019
Indications and any restriction(s) as described in the summary of product characteristics (SmPC)
Naldemedine is indicated for the treatment of opioid-induced constipation (OIC) in adult patients who have previously been treated with a laxative
Method of administration and dosage
The recommended dose of naldemedine is 200 micrograms (one tablet) daily, orally administered.
Additional tests or investigations
No specific additional tests are required whilst on this medication. Clearly the use of opioids in patients is a requirement of therapy and when opioids are stopped this medication should be stopped
List price and average cost of a course of treatment
The list price is £41.72 for a 28-tablet pack. The cost of a course of treatment will be governed by the continued duration of opioid therapy.
Patient access scheme (if applicable)
NA

13
B.1.3 Health condition and position of the technology in the treatment
pathway
B.1.3.1: Opioid induced constipation as a consequence of opioid therapy
Opioids are routinely used as analgesics in the United Kingdom. Physicians are guided to use analgesics by the
WHO pain ladder approach (18).This indicates that opioids are the mainstay of longer-term pain management as
other options as NSAIDs are associated with severe side effects such that they are now often restricted to short
term use. The use of opioid analgesics has increased in recent years, although a recent CPRD study has indicated
a slowing of this growth (Appendix M). It is very important that opioids are prescribed appropriately in selected and
supervised pain patients as part of a comprehensive, multi-disciplinary approach to treatment (20).
Opioids are associated with a variety of side effects such as sedation, lethargy and pruritus, and a considerable
risk of addiction (18,24). Opioids also adversely impact the function of the gastrointestinal (GI) tract, via the action
of exogenous opioid agonists, on the enteric nervous system (25–27).
These adverse effects can limit dose escalation and can necessitate a switch in opioids or even cessation of therapy
(18,28). The term ‘opioid-induced bowel dysfunction’ (OIBD) encompasses a spectrum of symptoms including
nausea, vomiting, bloating, and gastro-oesophageal reflux.
Opioid-induced constipation (OIC) is the most common subtype of OIBD that occurs in 51–87% of patients receiving
opioids for cancer and between 41–57% patients receiving opioids for chronic non-cancer pain (29–31). OIC is
associated with reduced work productivity, a decrease in quality of life and increased healthcare utilisation (32).
OIC is under-recognised and likely to be a greater problem in younger rather than older patients (33,34).
The Rome Foundation has outlined a definition of OIC (20) (the Rome IV criteria) as:
‘New or worsening symptoms of constipation when initiating, changing or increasing opioid therapy, which must
include two or more of the symptoms defining functional constipation (i.e. straining, lumpy or hard stools,
sensation of incomplete evacuation and/or anorectal blockage, need for manual defaecation, <3 SBM per week)
with the same frequency cut off (25%)’ (35)
There are three types of opioid receptors – the Mu, Delta and Kappa receptors – which are G-protein coupled
receptors widely distributed through the central nervous system (CNS) and peripheral tissues (36–39). The Mu and
Delta receptors are the principal opioid receptors in the gastrointestinal tract: when bound to an opiate, they activate
potassium channels (causing membrane hyperpolarization), block calcium channels, and inhibit the production of
adenylate cyclase, which results in decreased neurotransmitter release (37). The clinical effects of these activities
in the GI tract include: a reduction in gut motility (and hence delayed gastric emptying, increased pyloric sphincter
tone, and prolonged intestinal transit times) and greater resorption of fluid from the bowel contents (36,39,40).
These effects are summarised in Table 5

14
Table 4. Rome IV opioid induced constipation definition (20)
New, or escalating, symptoms of constipation when initiating, changing or increasing opioid therapy that must
include two or more of the following:
(a) Straining during more than one quarter of defaecations.
(b) Lumpy or hard stools (BSFS 1–2) more than one-quarter of the time.
(c) Sensation of incomplete evacuation more than one-quarter of the time.
(d) Sensation of anorectal blockage/obstruction in more than one-quarter of defaecations.
(e) Manual manoeuvres to facilitate more than one-quarter of defaecations.
(f) Fewer than three spontaneous bowel movements per week. 2. Loose stools rarely present without the use
of laxatives.
BSFS: Bristol Stool Form Scale
Table 5. Effects of opioids on gastrointestinal functioning
Pharmacologic Action Clinical Effect
Decreased gastric motility, emptying Increased gastroesophageal reflux
Inhibition of small intestinal propulsion Decreased absorption of medications
Inhibition of large intestinal propulsion Straining, incomplete evacuation, bloating,
abdominal distension
Increased amplitude of non-propulsive segmental
contractions
Spasm, abdominal cramps, pain
Constriction of sphincter of Oddi Biliary colic, epigastric discomfort
Increased anal sphincter tone, impaired reflex
relation with rectal distension
Impaired ability to evacuate the bowel
Diminished gastric, biliary, pancreatic, and
intestinal secretions
Hard, dry stools
Increased absorption of water from bowel contents Hard, dry stools
Constipation has been shown to be more common in patients with at least 2 years of opioid use that those with
fewer than 6 months (30). Moreover, there is no (or extremely slow) development of tolerance to the constipating

15
effects of opioid therapy, particularly with codeine, dihydrocodeine, morphine, fentanyl, oxycodone, and
hydromorphone (41).
The majority of data is derived from animal studies which demonstrate that the highest densities of mu and kappa
receptors are located in the stomach and proximal colon (42).
B1.3.4: Effects of opioids on GI motility
GI motility is dependent on a balance between excitatory and inhibitory neurotransmitters/neuromodulators mainly
released by myenteric neurons that result in smooth muscle contraction and relaxation. The excitatory motor
neurons release acetylcholine and tachykinins (e.g. substance P), which evoke longitudinal smooth muscle
contraction. This is in contrast to inhibitory motor neurons, which induce smooth muscle relaxation via nitric oxide
and vasoactive intestinal polypeptide. (43,44)
Opioids inhibit the release of the neurotransmitters, which results in abnormal coordination of motility reflected by
an increase in muscular tone and a decrease in the normal propulsive activity.
Human studies have shown that opioids effect the entire GI tract including dysmotility from the oesophagus and
gallbladder, increased gastric tone, as well as retardation of gastric emptying, oro-caecal and colonic transit time.
(44–48).
B1.3.5: Effects of opioids on GI secreto-absorptive function
The GI tract secretes approximately 9 to 10 litres of fluid per day (approximately 2L saliva, 2.5L gastric juice, 1 to
1.5L bile, 2L pancreatic juice and 1.5 to 2L enteric secretion). (49)
Opioids exert a profound influence in the secretory and absorptive function of the GI tract through a number of
mechanisms. For instance, opioids bind to receptors on secretomotor neurons in the submucosa of the GI tract and
suppress acetylcholine and vasoactive intestinal peptide release, resulting in a decrease in chloride and water
secretion into the lumen.(44,50)
In addition to secretory impairment, opioids may increase water absorption mainly via the prolonged stasis of
intestinal content due to inhibition of gut motility. In the colon, a decreased faecal volume has a negative effect on
motility – which results in propulsive contractions – as the intrinsic reflexes are dependent on mechanoreceptor
activation. (40) These effects can explain why patients in opioid therapy typically complain of harder, drier faeces
and straining difficulties.
B1.3.6: Effect of opioids on GI sphincters
In the human GI tract there are at least six anatomically or functionally characterised sphincters, i.e. the upper and
lower oesophageal sphincters, pylorus, sphincter of Oddi, the ileo-caecal valve and the anal sphincters. Although
the function of each these sphincters can be modulated by opioids, it is beyond the scope of this paper to examine
all of these in detail, but we will highlight evidence around the anal sphincters. Opioid-induced dysfunction of
anorectal function is characterised by increased contraction of the internal anal sphincter which, in turn, results in
straining, haemorrhoids and/or a sense of incomplete evacuation. Taken together, this can lead to severe problems
with defaecation and in the worst-case scenario colonic perforation may occur. (51)For instance, loperamide has

16
been shown to increase the tone of the internal anal sphincter and a third of patients treated with opioids report a
sensation of anal blockage despite laxative treatment. (30,52) In a recent study, Poulsen et al. reproduced these
findings demonstrating that oxycodone inhibits anal sphincter relaxation, an effect that can be reversed by slow-
release naloxone. (53)
B1.3.7: Clinical evaluation
For most patients on opioids who present with ‘constipation’, it is likely that there are multiple potential factors
contributing to the problem and it may not be easy, on initial assessment, to determine what contribution, if any, the
opioid might be making to the overall symptom burden.
As a basic principle, the assessing clinician must take a comprehensive history with particular focus on the baseline
bowel habit and any changes that may have occurred subsequent to the introduction of an opioid. A detailed drug
history is mandatory to identify medications that might be contributing to the problem. Where possible, the diagnosis
of OIC should be made according the to the Rome criteria and in this regard, patients need to be questioned about
bowel frequency, stool consistency and symptoms suggestive of disordered defaecation such as straining at stool,
sense of incomplete evacuation and faecal incontinence. (54)
In addition to physical symptoms, addressing psychological aspects, such as a patient's underlying ideas and
appreciation of their symptoms is also beneficial. (55) Additional symptoms such as bloating, abdominal pain,
nausea and vomiting suggestive of OIBD also need to be addressed. Causes of secondary constipation should be
sought from the past medical history (e.g. prolonged physical inactivity, Parkinson's disease, advanced diabetes,
etc.). A digital rectal examination is suggested in all patients consulting for OIC to exclude anorectal malignancy,
faecal impaction and minor anal pathologies (e.g. anal fissure) which potentially may aggravate symptoms. (56)
Given the prevalence of OIC, we suggest that all patients initiating opioids, and those who are maintained on
opioids, should have a regular systematic review of their bowel function. However, there remain a number of factors
that act as barriers to the diagnosis of OIC being made (see Table 6)
Table 6. Barriers to OIC diagnosis (20)
1. Lack of awareness among clinicians about OIC in patients on opioid therapy.
2. If clinicians are aware, they may not ask patients about constipation.
3. When considering constipation, most clinicians only ask questions about frequency of bowel movements,
but symptoms such as bloating, straining, hard stool consistence, incomplete bowel movements and
abdominal discomfort are more prevalent and bothersome, features reflecting the pan-enteric effects of
OIBD.
4. Patients might feel ashamed to disclose their symptoms to clinicians.
5. Efforts to screen patients based on Rome IV criteria may not cover the whole spectrum of OIC.
6. Absence of a standard protocol for the treatment of OIC.

17
B1.3.8: Diagnosis
OIC is often under-diagnosed and under-treated with health care professionals frequently under-estimating the
severity of constipation as perceived by the patient. (33,57)
Since OIC is defined by symptoms rather than by pathophysiologic features or biomarkers, it imitates many other
medical conditions such as chronic idiopathic constipation (functional constipation), obstructing colon cancer,
Parkinson’s disease, diabetes, and constipating medications, such as antidepressants or iron supplements.(37,58)
Therefore, it is important to exclude comorbid conditions that may either may be responsible for or may exacerbate
constipation. Furthermore, patients should be evaluated for underlying rectal evacuation disorders (e.g. dyssynergic
defaecation or large rectocele) that can aggravate constipation.
According to the guideline for the long-term use of opioids in chronic non-tumor pain (LONTS), the basic diagnosis
of chronic constipation should be a detailed history with analysis of: the stool behavior, the drug intake, concomitant
symptoms and diseases and possible causative diseases, including a physical examination anus inspection and
rectal digital examination with examination of sphincter, the squeeze pressure and defaecation test. (59)
Attempts should be made to try to record the bowel movement as accurately as possible and, if possible, as well to
quantify, e.g. Bristol Stool Form Scale (BSFS).
Current methods for diagnosing OIC include both objective and subjective criteria: (37,58)
Objective measures,
o bowel movement frequency or change in bowel movement frequency,
o time to laxation; laxation within four hours;
o gastrointestinal (or short bowel) transit time;
o BSFS;
Patient-related outcome measures,
o Bowel Function Index (BFI),
o Patient Assessment of Constipation Symptoms (PAC-SYM), and
o global clinical impression of change; and
Patient-reported global burden measures:
o constipation distress, and
o Patient Assessment of Constipation Quality of Life (PAC-QOL).

18
B1.3.9: Classification / classification of severity
The Bowel Function Index (BFI) is a measurement instrument, validated for OIC, to classify the strength of the
disease. (60)The index captures three areas using a numeric analogue scale:
(1) Easiness of defaecation (NAS: "0 = easy" to "100 = with the greatest difficulty"),
(2) Feeling of incomplete evacuation (NAS: "0 = not at all" to "100 = very strong"),
(3) Personal assessment of obstipation (NAS: "0 = not at all" to "100 = very strong”)
The mean BFI is the mean of the three variables. A value <28.8 is considered normal bowel movement. However,
the higher the value increases, the stronger the constipation. The BFI is often used as a measurement tool in OIC
clinical studies. In this case, changes of 12 points count as a clinically meaningful difference. (60)
The BFI is a simple assessment tool with a validated threshold of clinically significant constipation. (61)
B1.3.10: OIC in relation to chronic constipation
When the Rome Foundation updated its criteria for colorectal disorders in 2016, OIC was included as a separate
diagnosis for the first time and recognised that, unlike other forms of constipation, OIC is a direct result of the
pharmacological effects of opioid therapy. (35)
B1.3.11: Effect of OIC on quality of life (QoL)
Bell et al (2009) (32) found that OIC negatively impacts pain management, productivity, and health-related quality
of life based on the findings from the National Health and Wellness Survey. There is a negative impact of OIC on
individuals' HRQOL and on society in terms of healthcare resource use and work productivity beyond that imposed
by patients' pain conditions. These findings indicate a need for effective treatment for opioid-induced constipation
in patients receiving chronic opioid therapy. Respondents with OIC reported significantly higher percentages of time
missed from work, more physician visits, impairment while working, over-all work impairment, and activity
impairment, compared with those without OIC. (32)
Patients suffering from OIC have low quality of life and remaining symptoms despite use of two or more laxatives
are a vulnerable patient group in need of optimized healthcare management, who also might benefit from more
specific and innovative therapy.(17)
Both cancer and non-cancer patients suffering from OIC might have higher associated costs compared to those
without OIC. (62)
Treating OIC effectively may help prevent inadequate pain management secondary to opioid therapy modification,
help increase QoL, lessen OIC symptoms, decrease productivity loss, and improve adherence to opioid and OIC
treatments. (57)
According to a patient survey conducted in the UK, the use of laxatives to treat OIC is often ineffective and
associated with side effects Instead of relieving the burden of opioid-induced constipation, laxative use was
associated with a negative impact.(23)

19
B1.3.12: Current therapy options and treatment
Prophylactic treatment of OIC with laxatives should be initiated at initiation of opioid, although there is minimal
evidence to support their effectiveness in OIC. (63–65)
Often than not laxatives are not co-prescribed; for instance. (65) This finding is confirmed by Shionogi’s
commissioned CPRD study on the utilisation of opioids and laxatives (Appendix M)
Initial general measures should be considered at initiation of opioid therapy. These include patient education,
examining lifestyle factors (fluid intake and activity) and where possible identifying and modifying concurrent
medications (such as iron supplements, calcium-channel blockers, anti-cholinergic agents, 5-hydroxytryptamine M
(5-HT)3 receptor antagonists or diuretics) which may exacerbate OIC. Switching the opioid or changing the route
of administration can be useful. (20)
In addition, the incidence of OIC may be numerically less with transcutaneous preparations of fentanyl in
comparison to equipotent doses of oral morphine. (66)
B1.3.13: Use of standard laxatives
Standard laxatives, such as osmotic agents (macrogol) and stimulants (bisacodyl, picosulphate and senna) are
first-line choices in the management of OIC (20). These are commonly used in the treatment of functional
constipation, despite little evidence to support this clinical strategy (63–65)
A study reported that laxative side effects, such as gas, bloating/fullness and defaecatory urgency, are seen in up
to 75% of patients and are more common in those under 40 years of age. Nonabsorbable sugars, such as lactulose,
can be fermented within the colon and exacerbate bloating and distension in OIC and therefore should be avoided.
(67)
B1.3.14: Examples of commonly used laxatives for OIC
Bisacodyl: For use in constipation, in diseases that require easier defaecation, and in defaecation during diagnostic
and therapeutic procedures on the gut. Bisacodyl should not be taken daily or for prolonged periods without
differential diagnosis of constipation (68).
Macrogol: The period for treatment of chronic constipation with Macrogol does not normally exceed 2 weeks. If
necessary, however, Macrogol can be used repeatedly. As with all laxatives, prolonged use is usually not
recommended. (69)
However, long-term use may be necessary in the treatment of patients with severe chronic or refractory
constipation. This is also the case with constipation caused secondary to multiple sclerosis or Parkinson's disease
or by the regular use of medication that causes constipation, in particular opioids and anticholinergics.
Sodium picosulfate: For use in constipation and in conditions requiring easier defaecation. Like other laxatives,
should not be taken daily or for prolonged periods without differential diagnosis of constipation.

20
Mu-opioid receptor antagonists
Opioid-receptor antagonists can alleviate the adverse effects of opioids on GI functions, but their central analgesic
effects may also be antagonised if they cross the blood-brain barrier. (70)
The most readily well-known example is naloxone, commonly used as an intravenous reversal agent in the context
of opioid over-dosing.
Oxycodone/naloxone
A fixed-ratio dose combination of oxycodone with extended-release naloxone is approved for the treatment of
chronic pain, aiming at decreasing occurrence of OIC.60,61 The rationale for this approach is based on the slow
release of naloxone allowing it to exert a local antagonist effect on opioid receptors in the GI tract, with a minimal
impact on analgesia due to extensive first-pass metabolism in the liver. (71)
Several randomized placebo-controlled trials have shown the superiority of oxycodone/naloxone combination in
comparison to oxycodone alone in maintaining bowel function, as quantified by the BFI, with equal analgesic
efficacy and comparable safety. (72–75) There are reports of loss of selectivity with rapid dose up titration or
crushing of tablets.
Agents that block Mu-opioid receptors in the GI tract, but do not enter the central nervous system (CNS), are
expected to treat OIBD without diminishing central analgesic actions.
There are three licensed opioid antagonists with local action within the gut or (outside the CNS) these are the
peripherally-acting -opioid receptor antagonists (PAMORAs), with naldemedine being the latest to gain a license
for use in the EMA in Feb 2019.
Methylnaltrexone and naloxegol are both indicated for use in patients that have had an inadequate response to
prior laxatives. In contrast, naldemedine has an alternative license indication that requires prior treatment, not prior
inadequate response to/with laxatives. Also, methylnaltrexone and naloxegol are not indicated as adjuvant therapy,
naldemedine has a license that includes adjuvant therapy with laxatives.
Table 7 summarises the therapy options for treatment of OIC.
B1.3.15: Other Agents for Chronic Constipation
The mechanism by which lubiprostone and prucalopride exert their clinical effects also does not target the opioid
receptors in the gastrointestinal tract; (61,76) however, peripherally acting µ-opioid receptor antagonists do address
the underlying mechanism of OIC () without compromising the analgesic effects of opioids.(20,63,76)
B1.3.16: Position in Therapeutic Pathway
The most recent guidelines for the management of OIC are the European Expert Consensus Statement published
in the United European Gastroenterology Journal(20)
Table 8 describes the recommended therapeutic pathway.

21
Table 7. Types of therapy used to treat OIC
Type of therapy Examples Mode of action References
Laxatives Gastrointestinal stimulants
Anionic surfactants
Osmotic laxatives
Bulk-forming laxatives
Increase smooth muscle activity, increased fluid secretion / decreased resorption, increase stool size, softness and frequency
Gordon, 2013; Rumman et al, 2016; Farmer et al, 2018; and Andresen & Layer, 2018.
Locally-acting chloride channel activator
Lubiprostone Activates chloride type 2 channels in the GI tract to enhance fluid secretion. Results in softer stools and increased motility
Farmer et al, 2018; Amitiza PI, 2012; and Amitiza SPC, 2016.
GC-C agonist Linaclotide, plecanatide Upregulates cGMP in enterocytes resulting in intraluminal secretion of chloride and bicarbonate inand, hence, increased intestinal fluid and accelerated transit
Farmer et al, 2018; Linzess PI, 2017; and Trulance PI, 2017.
Serotonin 5HT4 receptor agonist
Prucalopride Stimulates smooth muscle activity resulting in enhanced colonic contractility
Rumman et al, 2016; and Diederen, 2015.
Peripherally acting mu-opioid receptor antagonists
Alvimopan, methylnatrexone bromide, naldemedine (Rizmoic), naloxegol
Antagonize peripheral µ-opioid receptors without reducing analgesic properties of opioids
Müller-Lissner et al, 2017; Farmer et al, 2018; Relistor SPC, 2013, Moventig SPC, 2014; and Rizmoic SPC
5-HT4, 5-hydroxytryptamine (serotonin) type 4; cGMP, cyclic guanosine monophosphate.

22
Table 8. Recommendations for Treatment of Opioid Induced Constipation
“The first stage of managing OIC is appropriate counselling and education of patients as to the side-effects of
opioids. We advocate co-prescription of a standard laxative, such as an osmotic or stimulant, when an opioid is
commenced, escalated or switched which the patient can commence himself or herself should they develop
constipation.
Similarly, where possible, simple measures such as increasing fibre, exercise and fluid intake should be
advised. Patients should be specifically asked about problematic opioid side effects, such as constipation, at
each clinical review. Concurrently, alternative reasons for constipation symptoms should be considered such
as inactivity, metabolic derangements and other medications. Although the clinical history is important,
utilisation of the BFI is a useful tool in helping to identify OIC as well as monitoring response to any particular
intervention.
It is useful to ascertain whether the constipation is related to the commencement, escalation or switch in opioid
therapy. If the constipation is considered to be unrelated to the opioid then the switching to another class of
simple laxatives may be appropriate, or introduction of a combination such as a stimulant and a stool softener.
Should patients not respond to these measures then a test treatment with methylnaltrexone or a short trial of
an opioid antagonist is useful.
In contrast, if the constipation is considered to be secondary to the opioid therapy then treatment should be
started with an opioid antagonist. The choice of the specific antagonist depends on the diagnosis, life
expectancy, drug availability and patient preference.
Although there is no absolute consensus, we would suggest an early review (no more than one month) of the
patient after the initiation of a treatment for OIC (independent of the frequency of pain management review),
although this is clearly dependent on local resources. If at this point there is treatment failure and the patient is
being managed in primary care, then referral to specialist/secondary care may be appropriate.
Here escalation to more intensive laxative treatment or the addition of lubiprostone, linaclotide or prucalopride
is advised. If these measures do not result in an improvement in constipation, the clinician should consider
switching the opioid and/or changing the route of administration. Finally, if there is a lack of response, referral
of such patients should be considered to tertiary centres where more detailed evaluation of GI physiology, such
as anorectal manometry or other tests, can be undertaken. These management steps, summarised in Figure 1,

23
Figure 1. A suggested pragmatic stepwise management suggestion for the management of opioid-
induced constipation (OIC) in clinical practice(20)
Shionogi thus supports the introduction of naldemedine after the initial use of a laxative initiated at the time of
initiation of the opioid therapy. This should be done, as recommended at first review, or as early as possible.
To summarise: there are three situations when naldemedine should be considered: after initial trial with a laxative
on initiation of opioid therapy, as an adjunctive therapy when multiple causes for constipation might be present
including OIC after there has been an inadequate response to prior laxatives.
B1.3.17: Choice of PAMORA
Shionogi propose that naldemedine is the most appropriate choice for the treatment of OIC in the NHS in England
and Wales.
It is the only PAMORA whose license aligns to the latest guidelines for treatment of OIC and an independent
network meta-analysis found naldemedine to be the most efficacious PAMORA for the treatment of OIC when
compared to placebo. (21)

24
Naldemedine has demonstrated its effectiveness in patients with OIC and cancer and non-cancer pain in
the COMPOSE study series (1,2,5)
Statistically significant and clinically meaningful improvement in symptoms of constipation compared with
placebo (1,2,5)
Rapid response to treatment (within 48 hours) (75)
Effects were durable in the long-term (up to 52 weeks in patients with non-cancer pain) (2)
Statistically significant improvements in constipation symptoms and quality of life scores that were
sustained up to 52 weeks in patients with chronic non-cancer pain and up to 12 weeks in patients with pain
associated with cancer (2)
Naldemedine is designed to optimise the relief of OIC without compromising pain relief
There was no evidence of centrally mediated opioid withdrawal, no reduction in the therapeutic response to
OAT and no unexpected AEs in the COMPOSE program
The American Gastroenterological Association Institute Guideline on the Medical Management of Opioid-
Induced Constipation states “The overall quality of evidence supporting use of naldemedine for management
of OIC was considered high.” The AGA issued a strong recommendation for use of naldemedine vs no treatment
in patients with OIC refractory to laxatives. However, patient and provider use of this medication may be limited
by its cost.”
The treatment duration depends on the duration of the opioid-treatment. Discontinue Naldemedine if treatment
with the opioid pain medication is also discontinued
Shionogi therefore propose that naldemedine should be the preferred formulary option for PAMORAs for the
management of OIC in both primary and secondary care. Naldemedine should be made available for GP
prescribing, without specialist initiation as per the treatment algorithm in Figure 1
25
B1.4. Burden of OIC
B1.4.1 Prevalence and incidence of OIC
According to international literature, the incidence of OIC in opioid patients varies between 3 to 66 % (20). Recording
of incidence and prevalence from patient survey data gives higher numbers. According to an US and European
Patient Survey, constipation is the most prevalent opioid-induced side effect affecting 81% of all patients (14)
Between 15% to 60% of patients with opioid treatment receive a laxative to an ongoing opioid therapy (77–79)
Another review stated that the incidence of OIC is estimated to 41% of patients taking an oral opioid for up to 8
weeks in a meta-analysis of 11 placebo-controlled, randomized studies in non-malignant pain.(78,79)
Many of the OIC patients (27-94%) have an inadequate response to laxatives and therefore could be treated with
therapies that address the underlying mode of the disease such as PAMORAs.
In a retrospective cohort study conducted in two university affiliated outpatient departments in 2013 the overall
incidence of constipation was 49% in patient treated with opioids of at least 4 weeks duration.(80)
The data is, thus highly variable and thus Shionogi have been pragmatic in its assumptions in our budget impact
modelling.
B1.4.2 Prevalence opioid prescriptions
Among chronic non-cancer pain patients with OIC in the USA, Canada, Germany and UK 60% were taking at least
one OTC laxative; and 19% were taking at least one prescription laxative. The prevalence of inadequate response
to one laxative agent was 94% and 27% to 2 or more laxatives(81).
In a prospective longitudinal study conducted in United States, Canada, Germany and UK with non-cancer pain
patients, 48% (n=234) were categorized as sufficient laxative users (sufficient laxative use was defined as at least
one laxative remedy four or more times in the prior 2 weeks) (82).
A Clinical Practice Research Datalink (CPRD) study conducted in the UK (Shionogi), shows that patients receiving
strong opioids in primary care in the UK increased from 230,612 in 2011 to 379,027 in 2017, an increase of 64%.
(Appendix M)
B1.2.3 Prevalence of laxative inadequate response (LIR) patients
There is only rare literature which focuses on the prevalence of LIR in patients with OIC
In the Clinical Practice Research Datalink (CPRD) study conducted in the UK (Shionogi) the number of switch
patients among patients taking weak and strong opioids was n=19,080 (42.6%) and the prevalence of patients with
laxative stable treatment ranged between 45.9% to 60.2%, depending on the strengths of the opioids they were
treated with.
The CPRD study uses a primary care data set with, where available, linked HES Admitted Patient Care
(Inpatient) and Outpatient data.

26
Patients were classed by CPRD as being of acceptable research quality having an episode of opioid treatment
initiating within the study period and having a minimum duration of therapy of 28 days (14 days where the
indication is cancer), comprising at least two prescriptions
According to Coyne et al. the prevalence of non-cancer and cancer patients with laxative inadequate response
to one or more laxative class in the German subsample (n=115) of the study ranges between 22.4% - 89.7%.
LIR was defined with < 3BM and ≥ 1 PAC-SYM scored moderate, severe or very severe.
In this subsample, 68,4% (n=52) patients had 1xLIR (inadequate response to one laxative agent). 1xLIR was
defined as sufficient laxative use (use of at least one laxative agent from a class ≥ 4 times in the last 2 weeks).
Moreover, 25% (n=13) of the patients had 2xLIR (inadequate response to ≥ 2 agents from ≥ 2 different laxative
classes). 2xLIR was defined as sufficient laxative use of agents from two different classes (use of at least two
laxative agents from at least two different classes ≥ 4 times each in the last 2 weeks). Therapeutic Need for
Naldemedine
B.1.5 Equality considerations
The use of naldemedine is directly related to the use of opioids in chronic non-cancer and cancer pain. Several
ethical issues have been raised in relation to chronic pain management and treatment of side effects.
Appropriate management of chronic pain is now considered a human right. The recognition and treatment of the
chronic pain patient has considered a problem by experts in this treatment field.
Patients with chronic pain are often vulnerable, unheard and mis-understood in society. Patients often report a
breakdown in the understanding of their pain with their clinician which includes a lack of recognition of their OIC
symptoms.
The barriers to good pain management are numerous and complex. Often-cited impediments include
1) the lack of education and training on state-of-the-art pain management,
2) the lack of institutional mechanisms for standardizing the assessment and treatment of pain,
3) the lack of accountability for the undertreatment of pain, and
4) federal and state statutes and regulations designed to fight a “war on drugs and addiction” that negatively
affect the legitimate use of controlled substances. (83)
Shionogi would propose that untreated chronic pain, both cancer-related and not, remains unacceptably prevalent
and costly.
A multidisciplinary approach combining cognitive and drug treatments in the setting of multidisciplinary treatment
programs, has been demonstrated efficacious in more than 60 studies.(84)
Data to date suggest that opioids are to some degree efficacious for reducing pain and improving quality of life,
with acceptable safety, for those with various chronically painful conditions and there are few other options for
these patients.

27
Shionogi would suggest that the use of naldemedine should support optimisation of chronic pain management
and potentially improve the dialogue between patient and clinician both in the multidisciplinary and general
prescribing environments.

28
B.2 Clinical effectiveness
B.2.1 Identification and selection of relevant studies
See appendix D for full details of the process and methods used to identify and select the clinical
evidence relevant to the technology being appraised.
B.2.1.1 Primary endpoint SBM response rates
Data pool Endpoint definition Results
Trials COMPOSE-1, COMPOSE-2, and the pool (non-cancer)
SBM responder during the 12-week treatment period was defined as at least 3 SBMs/week with at least 1 SBM/week increase over baseline for at least 9 out of 12 weeks and at least 3 of the last 4 weeks, and CSBM responders were defined similarly
The treatment difference for naldemedine relative to placebo was 13%, 18.9%, and 16.0% respectively for proportion of SBM responders, and 10.6%, 13.3%, and 11.9% for proportion of CSBM responders, all statistically significant
Trials V9222, COMPOSE-4, and the pool (cancer)
SBM responder during the 2-week treatment period was defined as at least 3 SBMs/week with at least 1 SBM/week increase over baseline during the treatment period, and CSBM responders were defined similarly
The treatment difference for naldemedine relative to placebo was 40.1%, 36.8%, and 38.0% respectively for proportion of SBM responders, and 32.3%, 27.7%, and 29.4% for proportion of CSBM responders, all statistically significant
The treatment effects on both SBM and CSBM responders are 2–3 fold higher in the cancer studies than
in the non-cancer studies.
The following SBM responder at 2 weeks definition has been developed post hoc to better compare cancer
and non-cancer trials:
Data pool Endpoint definition Results
Trials COMPOSE-1, COMPOSE-2, and the pool (non-cancer)
SBM responders for the first 2 weeks: at least 3 SBMs/week (on average) with at least 1 SBM/week (on average) increase from baseline at both Week 1 and 2 of the treatment period
Treatment difference: 20.8%, 21.8%, and 21.3% for COMPOSE-1, COMPOSE-2, and the pool respectively
Trials V9222, COMPOSE-4, and the pool (cancer)
Treatment difference: 38.7%, 34.8%, and 36.3% for V9222, COMPOSE-4, and the pool respectively.
Company evidence submission template for [Constipation (opioid-induced) - naldemedine [ID1189]
© Shionogi 2019. All rights reserved Page 29 of 170
B.2.2 List of relevant clinical effectiveness evidence
The efficacy and safety of naldemedine has been investigated in an extensive clinical study program involving
1,644 subjects with OIC, comprising 1,364 with chronic non-cancer pain and 280 with cancer. The programme
comprised:
Three Phase 2, randomised, double-blind, placebo-controlled dose-finding studies, two in patients with
chronic non-cancer pain (V9214 and V9221), and one in patients with cancer (V9222).
Four pivotal, randomised, double-blind, placebo-controlled studies, three in patients with chronic non-
cancer pain (COMPOSE-1, COMPOSE-2, and COMPOSE-3), and one in patients with cancer
(COMPOSE-4). Study COMPOSE-4 was the first Phase 3 trial to evaluate the efficacy and safety of an
oral PAMORA for OIC specifically in patients with cancer.
Three Phase 3 supportive single-arm, open-label studies (COMPOSE-5, COMPOSE-6 and COMPOSE-
7).
B.2.2.1 Dose-finding studies
Study V9214 was a small, randomized, double-blind, placebo-controlled study evaluating six single doses of 0.01
mg, 0.03 mg, 0.1 mg, 0.3 mg, 1 mg and 3 mg naldemedine. The primary efficacy endpoint was change from
baseline to 24 hours post-dose in the number of spontaneous bowel movements (SBMs). This study indicated
that only doses of 0.3 mg and higher had an effect. Study V9221 subsequently investigated doses of
naldemedine of 0.1 mg, 0.2 mg, or 0.4 mg QD. In this randomized, double-blind, placebo-controlled study, the
primary endpoint was change in the frequency of SBMs/week from baseline to the last 2 weeks of the treatment
period. Study V9222 was a multinational (Japan and Korea), multicenter, randomized, double-blind, placebo-
controlled, parallel-group study evaluating 0.1 mg, 0.2 mg and 0.4 mg naldemedine in patients with cancer and
OIC. Basing on the results of these Phase 2 trials, a dose of 0.2 mg QD was subsequently chosen for testing in
Phase 3.
Studies COMPOSE-1, COMPOSE-2, COMPOSE-3, COMPOSE-4 and COMPOSE-5 were used to support the
marketing authorization in Europe (Table 9). Data from studies Compose-1, -2 and -3, have been used in the
economic model. Data from studies Compose-4 and Compose-5 were not included in the economic model
because instructions were received only recently from NICE to evaluate data from these studies that are cancer-
related.
Table 9. Clinical effectiveness evidence
Study (Phase)
Patients treated with naldemedine
Patient population
Treatment duration
Primary endpoint and results Ref
Dose-finding studies
V9214 (II) 54 Non-cancer pain with OIC
Single dose Safety

Company evidence submission template for [Constipation (opioid-induced) - naldemedine [ID1189]
© Shionogi 2019. All rights reserved Page 30 of 170
V9221 (IIb) 182 Non-cancer pain with OIC
4 weeks
Change from baseline to last 2 weeks of the treatment period in the number of SBMs per week: LS mean change ± SE (p value vs placebo)
0.1 mg group: 1.98 ± 0.42 (0,3504)
0.2 mg group: 3.37 ± 0.43 (0,0014)
0.4 mg group: 3.64 ± 0.44 (0,0003)
Placebo group: 1.42 ± 0.42
(1)
V9222 (IIb) 170 Cancer pain with OIC
2 weeks
Change from baseline in number of SBMs per week: LS mean change (p value vs placebo)
0.1 mg group: 3.43 (0.0465)
0.2 mg group: 4.75 (<0.001)
0.4 mg group: 7.29 (<0.001)
Placebo group: 1.50
(2)
Pivotal studies
COMPOSE-1 (III)
271 Non-cancer pain with OIC
12 weeks
SBM Responder rate: % (p value vs placebo)
Naldemedine 0.2 mg group: 47.6% (0.002)
Placebo group: 34.6%
(3)
COMPOSE-2 (III)
271 Non-cancer pain with OIC
12 weeks
SBM Responder rate: % (p value vs placebo)
Naldemedine 0.2 mg group: 52.5% (<0.0001)
Placebo group: 33,6%
(3)
COMPOSE-3 (III)
621 Non-cancer pain with OIC
52 weeks Safety (4)
COMPOSE-4 (III)
97 Cancer pain with OIC
2 weeks
SBM Responder rate: %, 95% CI (p value vs placebo)
Naldemedine 0.2 mg group: 71.1%, 61.0–79.9% (<0.0001)
Placebo group: 34.4%, 25.0–44.8%
(5) (6)
Open label supportive studies
COMPOSE-5 (III)
131 Cancer pain with OIC
12 weeks Safety (5) (6)
COMPOSE-6 (III)
40 Non-cancer pain with OIC
48 weeks Safety (7)
COMPOSE-7 (III)
10 Non-cancer pain with OIC
48 weeks Safety (7)

Company evidence submission template for [Constipation (opioid-induced) - naldemedine [ID1189]
© Shionogi 2019. All rights reserved Page 31 of 170
B.2.3 Summary of methodology of the relevant clinical effectiveness evidence
Pivotal studies - methodology for pivotal study is shown in Table 10. In all studies:
A SBM was defined as a BM occurring in the previous 24 hours without the use of rescue laxative medication. A
BM occurring ≤24 hours after rescue laxative therapy was not considered to be an SBM. A TEAE was considered
possible opioid withdrawal syndrome if ≥3 events potentially related to opioid withdrawal occurred within the same
day or the next day. COWS scores were totaled to assess overall severity of withdrawal (5-12 = mild; 13-24 =
moderate; 25-36 = moderately severe; and >36 = severe). A score ≥5 was considered elevated and clinically
significant. Patients assessed level of opioid withdrawal with SOWS; the rating scale for each question ranged from
0 to 4 (0=not at all; 1=a little; 2=moderate; 3=quite a bit; and 4=extreme). Pain intensity was assessed by patients
using the 11-point NRS with 0 indicating no pain and 10 representing the worse pain possible. Constipation-related
symptoms and QoL were assessed using the Patient Assessment of Constipation Symptoms (PAC-SYM) and
Patient Assessment of Constipation Quality of Life (PAC-QOL) questionnaires.
In studies COMPOSE-3, COMPOSE-4 and COMPOSE-5, patients on a routine laxative regimen (defined as using
an over-the-counter [OTC] laxative at least once per week) at screening were allowed to remain on this regimen for
the duration of the study. Patients were not required to be on a routine laxative regimen for study inclusion. All
patients had access to rescue laxatives.
Table 10. Summary of trials design
Trial number
(acronym)
V9231
COMPOSE-1
V9232
COMPOSE-2
V9235
COMPOSE-3
V9236
COMPOSE-4
V9237
COMPOSE-5
V9238
COMPOSE-6
V9239
COMPOSE-7
Location Multicentre in the USA and Europe
Multicentre in the USA and Europe
Multicentre worldwide
Multicentre in Japan
Multicentre in Japan
Multicentre in Japan
Multicentre in Japan
Trial design Phase III, randomised, double-blind, placebo-controlled, parallel group
Phase III, randomised, double-blind, placebo-controlled, parallel group
Phase III, randomised, double-blind, placebo-controlled, parallel group
Phase III, randomised, double-blind, placebo-controlled, parallel group
Phase III, single arm, open-label extension of study COMPOSE-4
Phase III, single arm, open-label
Phase III, single arm, open-label
Eligibility criteria for participants
Aged 18–80; confirmed diagnosis of OIC; chronic non-cancer pain treated with opioids for ≥3 mths; stable opioid regimen for ≥1 mth before screening;
Aged 18–80; confirmed diagnosis of OIC; chronic non-cancer pain treated with opioids for ≥3 mths; stable opioid regimen for ≥1 mth before screening;
Aged 18–80; confirmed diagnosis of OIC; chronic non-cancer pain treated with opioids for ≥3 mths; stable opioid regimen for ≥1 mth before screening.
Aged >20; ECOG performance status ≤2; stable cancer that did not affect GI function; stable daily dose of opioids for ≥2 weeks prior to screening; confirmed
Aged >20; ECOG performance status ≤2; stable cancer that did not affect GI function; stable daily dose of opioids for ≥2 weeks prior to screening; confirmed
Confirmed diagnosis of OIC; chronic non-cancer pain treated with regular opioids
Confirmed diagnosis of OIC; chronic non-cancer pain treated with PR oxycodone
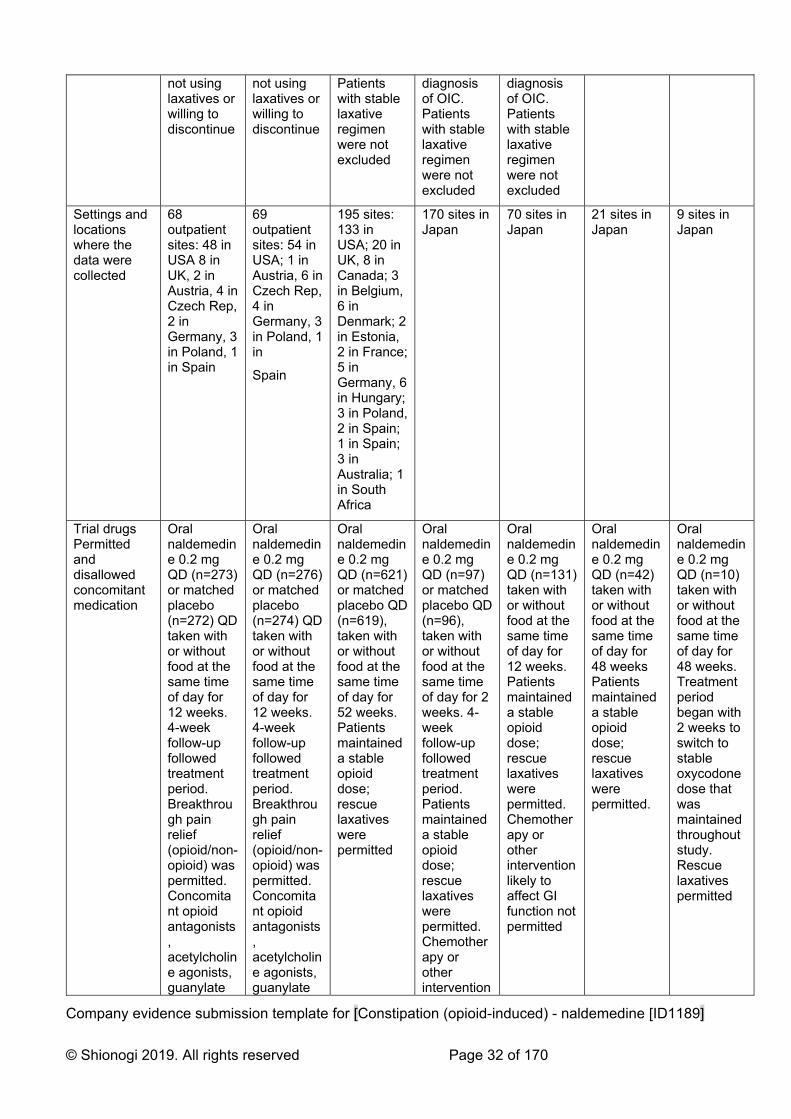
Company evidence submission template for [Constipation (opioid-induced) - naldemedine [ID1189]
© Shionogi 2019. All rights reserved Page 32 of 170
not using laxatives or willing to discontinue
not using laxatives or willing to discontinue
Patients with stable laxative regimen were not excluded
diagnosis of OIC. Patients with stable laxative regimen were not excluded
diagnosis of OIC. Patients with stable laxative regimen were not excluded
Settings and locations where the data were collected
68 outpatient sites: 48 in USA 8 in UK, 2 in Austria, 4 in Czech Rep, 2 in Germany, 3 in Poland, 1 in Spain
69 outpatient sites: 54 in USA; 1 in Austria, 6 in Czech Rep, 4 in Germany, 3 in Poland, 1 in
Spain
195 sites: 133 in USA; 20 in UK, 8 in Canada; 3 in Belgium, 6 in Denmark; 2 in Estonia, 2 in France; 5 in Germany, 6 in Hungary; 3 in Poland, 2 in Spain; 1 in Spain; 3 in Australia; 1 in South Africa
170 sites in Japan
70 sites in Japan
21 sites in Japan
9 sites in Japan
Trial drugs Permitted and disallowed concomitant medication
Oral naldemedine 0.2 mg QD (n=273) or matched placebo (n=272) QD taken with or without food at the same time of day for 12 weeks. 4-week follow-up followed treatment period. Breakthrough pain relief (opioid/non-opioid) was permitted. Concomitant opioid antagonists, acetylcholine agonists, guanylate
Oral naldemedine 0.2 mg QD (n=276) or matched placebo (n=274) QD taken with or without food at the same time of day for 12 weeks. 4-week follow-up followed treatment period. Breakthrough pain relief (opioid/non-opioid) was permitted. Concomitant opioid antagonists, acetylcholine agonists, guanylate
Oral naldemedine 0.2 mg QD (n=621) or matched placebo QD (n=619), taken with or without food at the same time of day for 52 weeks. Patients maintained a stable opioid dose; rescue laxatives were permitted
Oral naldemedine 0.2 mg QD (n=97) or matched placebo QD (n=96), taken with or without food at the same time of day for 2 weeks. 4-week follow-up followed treatment period. Patients maintained a stable opioid dose; rescue laxatives were permitted. Chemotherapy or other intervention
Oral naldemedine 0.2 mg QD (n=131) taken with or without food at the same time of day for 12 weeks. Patients maintained a stable opioid dose; rescue laxatives were permitted. Chemotherapy or other intervention likely to affect GI function not permitted
Oral naldemedine 0.2 mg QD (n=42) taken with or without food at the same time of day for 48 weeks Patients maintained a stable opioid dose; rescue laxatives were permitted.
Oral naldemedine 0.2 mg QD (n=10) taken with or without food at the same time of day for 48 weeks. Treatment period began with 2 weeks to switch to stable oxycodone dose that was maintained throughout study. Rescue laxatives permitted

Company evidence submission template for [Constipation (opioid-induced) - naldemedine [ID1189]
© Shionogi 2019. All rights reserved Page 33 of 170
cyclase-C agonist, 5-HT-4 agonists, prostaglandin, mu receptor partial agonist opioids, nalorphine-like agonist/antagonist opioids, antispasmodics, antidiarrheals, prokinetics, and chloride channel activators were prohibited. Rescue laxatives were permitted
cyclase-C agonist, 5-HT-4 agonists, prostaglandin, mu receptor partial agonist opioids, nalorphine-like agonist/antagonist opioids, antispasmodics, antidiarrheals, prokinetics, and chloride channel activators were prohibited. Rescue laxatives were permitted
likely to affect GI function not permitted
Primary outcomes (including scoring methods and timings of assessments)
Proportion of SBM responders as recorded in an ediary (responders were patients with ≥9/12 positive-response weeks and ≥3 positive-response weeks out in last 4 weeks. (Positive response week defined as ≥3 SBM/week and ≥1 SBM/week increase from baseline). Patients were
Proportion of SBM responders as recorded in an ediary (responders patients with ≥9/12 positive-response weeks and ≥3 positive-response weeks out in last 4 weeks. (Positive response week defined as ≥3 SBM/week and ≥1 SBM/week increase from baseline)
Patients were
Summary measures of TEAEs
Proportion of SBM responders as recorded in a patient diary. (Responders were patients with ≥3 SBMs/week and an increase of ≥1 SBM/week from baseline (average number SBMs/week in 2 weeks prior to screening). Patients were assessed on Days 1, 8, 15 and 43 (28 days
Summary measures of TEAEs.
Summary measures of TEAEs
Summary measures of TEAEs

Company evidence submission template for [Constipation (opioid-induced) - naldemedine [ID1189]
© Shionogi 2019. All rights reserved Page 34 of 170
assessed at baseline and Weeks 1, 2, 4, 8, 12 and 16
assessed at baseline and Weeks 1, 2, 4, 8, 12 and 16
after study end)
Other outcomes used in the economic model/specified in the scope
Changes in COWS, SOWS and NRS scores; BM frequency; and PAC-SYM and PAC-QOL scores
Changes in COWS, SOWS and NRS scores; BM frequency; and PAC-SYM and PAC-QOL scores
Changes in COWS, SOWS and NRS scores; BM frequency; and PAC-SYM and PAC-QOL scores
Changes in frequency of SBM, CSBM and SBM without straining and in COWS and NRS scores
?? ?? ??
Pre-planned subgroups
Patients with daily opioid dose 30–100 mg or >100 mg equivalents of oral morphine sulphate
Patients with daily opioid dose 30–100 mg or >100 mg equivalents of oral morphine sulphate
Patients with daily opioid dose 30–100 mg or >100 mg equivalents of oral morphine sulphate
None None None None
Table 11. Characteristics of participants in the studies across treatment groups.
Naldemedine 0.2 mg QD
Placebo QD
COMPOSE-1 (N=545) (n=273) (n=272) Median age, yrs (SD) 53·0 (47·0–60·0) 53·0 (46·0–60·5)Females, n (%) 161 (59%) 168 (62%) Mean BMI, kg/m2 (SD) 31·3 (7·4) 31·3 (6·8)
Region, n (%) USA Europe
230 (84%) 43 (16%)
229 (84%) 43 (16%)
Race, n (%) White Black/African American
216 (79%) 53 (19%)
220 (81%) 48 (18%)
Bowel movements at baseline, n (SD) Mean SBMs/week Mean CSBMs/week Mean SBMs/week without straining
1·3 (0·7) 0·4 (0·6) 0.1 (0.3)
1·3 (0·7) 0·4 (0·6) 0.1 (0.3)
Mean duration of opioid therapy, mths (SD) 61·1 (62·0) 61·8 (58·3)
MTDD opioid* at baseline, mg (SD) 108·1 (104·0) 128·4 (162·9)
MTDD opioid, mg (SD) 30–100 >100
155 (57%) 118 (43%)
153 (56%) 119 (44%)
COMPOSE-2 (N=550) (n=276) (n=274) Median age, yrs (SD) 54·0 (47·5–61·0) 54·0 (47·0–60·0)
Females, n (%) 165 (60%) 168 (61%) Mean BMI, kg/m2 (SD) 31·4 (7·0) 31·3 (7·5) Region, n (%)

Company evidence submission template for [Constipation (opioid-induced) - naldemedine [ID1189]
© Shionogi 2019. All rights reserved Page 35 of 170
USA Europe
241 (87%) 35 (13%)
239 (87%) 35 (13%)
Race, n (%) White Black/African American
222 (80%) 49 (18%)
227 (83%) 39 (14%)
Bowel movements at baseline, n (SD) Mean SBMs/week Mean CSBMs/week Mean SBMs/week without straining
1·2 (0·8) 0·4 (0·5) 0·1 (0·3)
1·2 (0·7) 0·4 (0·6) 0·1 (0·4)
Mean duration of opioid therapy, mths (SD) 61·2 (61·5) 56.7 (55.8)MTDD opioid* at baseline, mg (SD) 106·9 (127·2) 113·2 (145·4)MTDD opioid, mg (SD) 30–100 >100
169 (61%) 107 (39%)
167 (61%) 107 (39%)
COMPOSE-3 (n=1240) (n=621) (n=619) Mean age, yrs (SD) 53.4 (11.7) 52.7 (10.6)Females, n (%) 383 (61.7) 402 (64.9) Mean BMI, kg/m2 (SD) 31.7 (7.6) 31.5 (7.7) Race, n (%) White Black
492 (79.2) 120 (19.3)
496 (80.1) 108 (17.4)
Mean SBMs/week, n (SD) 1.59 (0.67) 1.62 (0.62)Mean duration of opioid therapy, mths (SD) 62.6 (68.7) 57.0 (55.8)MTDD opioid* at baseline, mg (SD) 123.0 (146.1) 121.2 (163.4)MTDD opioid, mg (SD) 30–100 >100
378 (60.9) 233
368 (59.5) 240
COMPOSE-4 (n=193) (n=97) (n=96) Mean age, yrs (SD) 63.8 (9.4) 64.6 (11.8)Females, n (%) 38 (39.2) 36 (37.5) Race, n (%) Asian
97 (100%)
96 (100%)
ECOG PS, n (%) 0 1 2
28 (28.9) 55 (58.8) 14 (14.4)
33 (34.0) 49 (51.0) 14 (14.6)
Primary tumour Lung Breast Large intestine Other
42 (43.3) 22 (22.7) 3 (3.1) 30 (30.9)
45 (46.9) 17 (17.7 3 (3.1) 31 (32.3)
Bowel movements at baseline, n (SD) Mean SBMs/week Mean CSBMs/week
1.01 (0.76) 0.52 (0.64)
1.10 (0.85) 0.48 (0.67)
MTDD opioid at baseline, mg (SD) 57.3 (46.4) 69.5 (99.5)Mean overall PAC-SYM score at baseline, n (SD) 1.06 (0.60) 1.15 (0.62)Mean overall PAC-QOL score at baseline, n (SD) 1.22 (0.51) 1.31 (0.60)COMPOSE-5 (N=131) (N=131) Mean age, yrs (SD) 63.5 (10.4) Females, n (%) 57 (43.5) Race, n (%) Asian
131 (100%)
ECOG PS, n (%) 0 1 2
43 (32.8) 71 (54.2) 17 (13.0)
Primary tumour Lung Breast
51 (38.9) 29 (22.1)
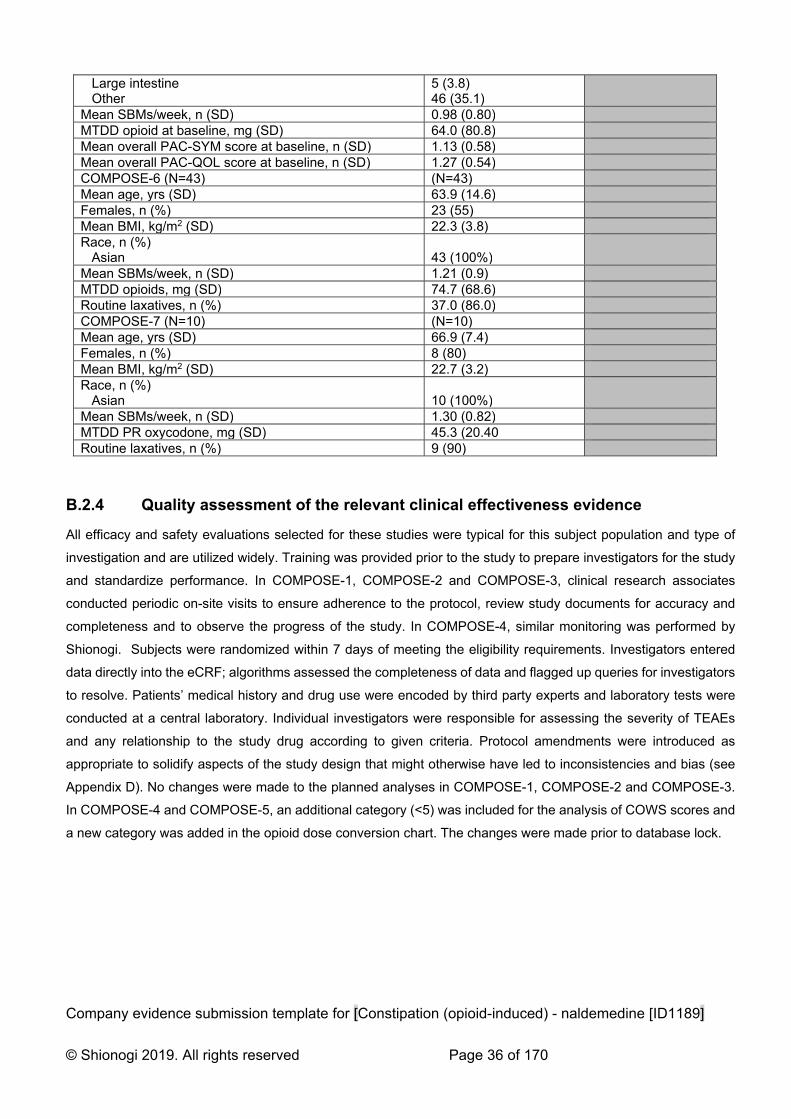
Company evidence submission template for [Constipation (opioid-induced) - naldemedine [ID1189]
© Shionogi 2019. All rights reserved Page 36 of 170
Large intestine Other
5 (3.8) 46 (35.1)
Mean SBMs/week, n (SD) 0.98 (0.80) MTDD opioid at baseline, mg (SD) 64.0 (80.8) Mean overall PAC-SYM score at baseline, n (SD) 1.13 (0.58) Mean overall PAC-QOL score at baseline, n (SD) 1.27 (0.54) COMPOSE-6 (N=43) (N=43) Mean age, yrs (SD) 63.9 (14.6) Females, n (%) 23 (55) Mean BMI, kg/m2 (SD) 22.3 (3.8) Race, n (%) Asian
43 (100%)
Mean SBMs/week, n (SD) 1.21 (0.9) MTDD opioids, mg (SD) 74.7 (68.6) Routine laxatives, n (%) 37.0 (86.0) COMPOSE-7 (N=10) (N=10) Mean age, yrs (SD) 66.9 (7.4) Females, n (%) 8 (80) Mean BMI, kg/m2 (SD) 22.7 (3.2) Race, n (%) Asian
10 (100%)
Mean SBMs/week, n (SD) 1.30 (0.82) MTDD PR oxycodone, mg (SD) 45.3 (20.40 Routine laxatives, n (%) 9 (90)
B.2.4 Quality assessment of the relevant clinical effectiveness evidence
All efficacy and safety evaluations selected for these studies were typical for this subject population and type of
investigation and are utilized widely. Training was provided prior to the study to prepare investigators for the study
and standardize performance. In COMPOSE-1, COMPOSE-2 and COMPOSE-3, clinical research associates
conducted periodic on-site visits to ensure adherence to the protocol, review study documents for accuracy and
completeness and to observe the progress of the study. In COMPOSE-4, similar monitoring was performed by
Shionogi. Subjects were randomized within 7 days of meeting the eligibility requirements. Investigators entered
data directly into the eCRF; algorithms assessed the completeness of data and flagged up queries for investigators
to resolve. Patients’ medical history and drug use were encoded by third party experts and laboratory tests were
conducted at a central laboratory. Individual investigators were responsible for assessing the severity of TEAEs
and any relationship to the study drug according to given criteria. Protocol amendments were introduced as
appropriate to solidify aspects of the study design that might otherwise have led to inconsistencies and bias (see
Appendix D). No changes were made to the planned analyses in COMPOSE-1, COMPOSE-2 and COMPOSE-3.
In COMPOSE-4 and COMPOSE-5, an additional category (<5) was included for the analysis of COWS scores and
a new category was added in the opioid dose conversion chart. The changes were made prior to database lock.

Company evidence submission template for [Constipation (opioid-induced) - naldemedine [ID1189]
© Shionogi 2019. All rights reserved Page 37 of 170
Table 12. Quality assessment results for parallel group RCTs.
Trial number (acronym)
V9231
COMPOSE-1
V9232
COMPOSE-2
V9235
COMPOSE-3
V9236
COMPOSE-4
V9237
COMPOSE-5
V9238
COMPOSE-6
V9239
COMPOSE-7
Was randomisation carried out appropriately?
Yes Yes Yes Yes N/a N/a N/a
Was the concealment of treatment allocation adequate?
Yes Yes Yes Yes N/a N/a N/a
Were the groups similar at the outset of the study in terms of prognostic factors?
Not clear Yes Not clear Not clear N/a N/a N/a
Were the care providers, participants and outcome assessors blind to treatment allocation?
Yes Yes Yes Not clear N/a N/a N/a
Were there any unexpected imbalances in drop-outs between groups?
No No No No N/a N/a N/a
Is there any evidence to suggest that the authors measured more outcomes than they reported?
No No No No No No N0
Did the analysis include an intention-to-treat analysis? If so, was this appropriate and were appropriate methods used to account for missing data?
Yes
Yes
Yes
Yes
Yes
Yes
Yes
Yes
Not clear
No No No No
Adapted from Systematic reviews: CRD’s guidance for undertaking reviews in health care (University of York Centre for Reviews and Dissemination)

Company evidence submission template for [Constipation (opioid-induced) - naldemedine [ID1189]
© Shionogi 2019. All rights reserved Page 38 of 170
B.2.4 Clinical effectiveness results of the relevant trials
Efficacy results from COMPOSE-1, COMPOSE-2, COMPOSE-3 and COMPOSE-4 are shown in Table 13. These
results show consistent efficacy of once-daily oral naldemedine 0.2 mg in treating opioid-induced constipation in
patients with cancer and chronic non-cancer pain, including in the long term.
Table 13. Clinical effectiveness of naldemedine 0.2 mg vs. placebo
Trial number (acronym) V9231
COMPOSE-1
V9232
COMPOSE-2
V9235
COMPOSE-3
V9236
COMPOSE-4
Treatment group NAL PLA NAL PLA NAL PLA NAL PLA
Number of patients 271 272 271 274 621 620 97 96
SBM responders, n (%) 130 (48)a
94 (35)a 145 (53)a
92 (34)a N/a 69 (71)b 33 (34)b
Change (95% CI); P-value
13.0% (4.8, 21.2) P=0.0020
18.9% (10.8, 27.0); P<0.0001
36.8% (23.7, 49.9); P<0.0001
Incr freq SBMs, n/week (SE)
3.42 (0.93)
2.12 (0.92)
3.56 (0.17)
2.56 (0.17)
3.92 (0.18)
2.92 (0.19)
5.16 (0.53)
1.54 (0.54)
Change (95% CI); P-value
1.30 (0.77, 1.83) P<0.0001
1.40 (0.92, 1.88); P<0.0001
1.00 (0.49, 1.51); P<0.0001
3.62 (2.13, 5.12); P<0.0001
Incr freq CSBMs, n/week (SE)
2.58 (0.17)
1.57 (0.17)
2.77 (0.17)
1.62 (0.17)
N/a 2.76 (0.27)
0.71 (0.27)
Change (95% CI); P-value
1.01 (0.54, 1.48) P<0.0001
1.15 (0.7, 1.61); P<0.0001
2.05 (1.29, 2.81); P<0.0001
Incr freq SBMs without straining, n/week (SE)
1.46 (0.14)
0.73 (0.14)
1.85 (0.16)
1.10 (0.16)
N/a 3.85 (0.53)
1.17 (0.53)
Change (95% CI); P-value
0.73 (0.34, 1.12) P=0.0002
0.75 (0.3, 1.19); P=0.0011
2.67 (1.20, 4.15)
P=0.0005
Change in PAC-QOL, n (SE)
-0.92 (0.06)
-0.66 (0.06)
-1.08 (0.06)
-0.8 (0.06)
-1.24 (0.04)
-0.82 (0.04)
-0.28 -0.15
Change in PAC-SYM, n (SE)
-0.92 (0.06)
-0.62 (0.06)
-1.01 (0.06)
-0.69 (0.06)
-1.22 (0.04)
-0.98 (0.04)
-0,25 -0.18
Notes: a≥9 positive-response weeks out of the 12-week treatment period and 3 positive-response weeks out of the last 4 weeks of the 12-
week treatment period. A positive-response week was defined as ≥3 SBMs per week and an increase from baseline of ≥1 SBM per week for
that week. Results shown for intention-to-treat population. b≥3 SBMs per week and an increase of ≥1 SBM per week from baseline. Results
shown for full analysis set. In COMPOSE-1, COMPOSE-2 and COMPOSE-4, the primary outcome was the proportion of patients achieving a
response. In all three studies, a statistically significantly higher proportion of responders was observed in the naldemedine group relative to
the placebo group (Figures 2 and 3).

Company evidence submission template for [Constipation (opioid-induced) - naldemedine [ID1189]
© Shionogi 2019. All rights reserved Page 39 of 170
Figure 2. Proportions (± SE) of responders in the naldemedine and placebo groups in COMPOSE-1 and
COMPOSE-2 (intent-to-treat population)
Figure 3. Proportions (± SE) of responders in the naldemedine and placebo groups in COMPOSE-4 (full
analysis set)
The proportions of SBM and CSBM responders by week were also significantly greater with naldemedine versus
placebo (all P<0.0001) in all three efficacy studies. Treatment with naldemedine resulted in significant and
sustained improvements in the frequency of SBMs CSBMs and SBMs without straining, relative to placebo in
V9321, COMPOSE-2, COMPOSE-3 and COMPOSE-4. (P≤0.0005; Figure 3 and Figure 4).

Company evidence submission template for [Constipation (opioid-induced) - naldemedine [ID1189]
© Shionogi 2019. All rights reserved Page 40 of 170
Figure 4. Proportions (± SE) of responders in the naldemedine and placebo groups in V9321 and
COMPOSE-2 (intention-to-treat population)

Company evidence submission template for [Constipation (opioid-induced) - naldemedine [ID1189]
© Shionogi 2019. All rights reserved Page 41 of 170
Figure 5. Changes from baseline in frequency of bowel movements in V9325 (intent-to-treat population;
LSM and SE, *P≤0.0001 vs placebo; BL, baseline; BM, bowel movement; LSM, least squares mean; SE,
standard error.)
Exploratory analyses in COMPOSE-1, COMPOSE-2 and COMPOSE-4 found that the onset of relief with
naldemedine was rapid and durable throughout the treatment period. In COMPOSE-1, COMPOSE-2 and
COMPOSE-4 the median times to first SBM with naldemedine were 16.1, 18.3 and 4.7 hours, respectively, and the
median times to first SBM with placebo were 46.7, 45.9 and 26.6 hours (Figures 6, 7 and 8).
Figure 6. Kaplan-Meier curve of time to first SBM (intent-to-treat population)

Company evidence submission template for [Constipation (opioid-induced) - naldemedine [ID1189]
© Shionogi 2019. All rights reserved Page 42 of 170
Figure 7. Kaplan-Meier curve of time to first SBM (intent-to-treat population)
Figure 8. Proportion of subjects with ≥1 SBM at specific time points after the initial dose of the study
drug in COMPOSE-4 (% ± 95% CI; full analysis set, *P<0.0001 versus placebo.
In COMPOSE-3, the proportion of patients on a routine laxative regimen at baseline who required rescue laxatives
during the treatment period was numerically lower with naldemedine vs placebo (8.0% vs 14.0%). A similar trend
was observed for patients not on a routine laxative regimen at baseline (7.0% vs 13.1%).

Company evidence submission template for [Constipation (opioid-induced) - naldemedine [ID1189]
© Shionogi 2019. All rights reserved Page 43 of 170
Significant and sustained improvements in mean overall PAC-SYM and PAC-QOL scores with naldemedine and
placebo (Figure 9), but the improvement was greater with naldemedine (nominal P<0.0001 at all assessments).
Figure 9. Change from baseline in (A) Patient Assessment of Constipation Symptoms and (B) Patient
Assessment of Constipation Quality of Life scores (intent-to-treat population; LSM and SE; *P≤0.0001
vs placebo).
B.2.6 Subgroup analysis
Naldemedine has been studied in combination with both strong and weak opioids for pain treatment at various
daily doses, and in both OIC patients with adequate response to laxatives (non-LIR) and in patients with
inadequate respond to laxatives (LIR). The LIR and non-LIR subgroups were defined post-hoc (since the current
guideline was published after the trials had been designed). Nevertheless, the definitions are in line with the
guideline. Based on these findings, naldemedine was approved by the EMA for “treatment of opioid-induced
constipation (OIC) in adult patients who have previously been treated with a laxative”.
Non-cancer studies COMPOSE-1 and COMPOSE-2, and the pool
Primary endpoint: proportion of SBM responders defined as at least 3 SBMs/week with at least 1 SBM/week
increase over baseline for at least 9 out of 12 weeks and at least 3 of the last 4 weeks. In the non-cancer studies,

Company evidence submission template for [Constipation (opioid-induced) - naldemedine [ID1189]
© Shionogi 2019. All rights reserved Page 44 of 170
subgroup analysis for the primary endpoint showed no difference as regards to differences in age, gender, BMI,
region, opioid dose strata, average TDD, and eGFR at baseline.
It is reassuring that patients who are treated with MED higher than 200 mg show convincing treatment effect of
naldemedine relative to placebo, although it is noted that only few patients received more than 400 mg MED.
Figure 10. [enter description]
Figure 11. [enter description]

Company evidence submission template for [Constipation (opioid-induced) - naldemedine [ID1189]
© Shionogi 2019. All rights reserved Page 45 of 170
Figure 12. Difference of Proportion of SBM Responders with its 95% Confidence Interval (Studies
COMPOSE-1 and COMPOSE-2), ITT Population
Cancer studies: V9222 and COMPOSE-4, and the pool
Primary endpoint: proportion of SBM responders, defined as at least 3 SBMs/week and an increase in frequency
of SBM from baseline of at least 1 SBM/week during the 2-week treatment period.
Figure 13. Difference of Proportion of SBM Responders with its 95% Confidence Interval (Studies
V9222 and COMPOSE-4)
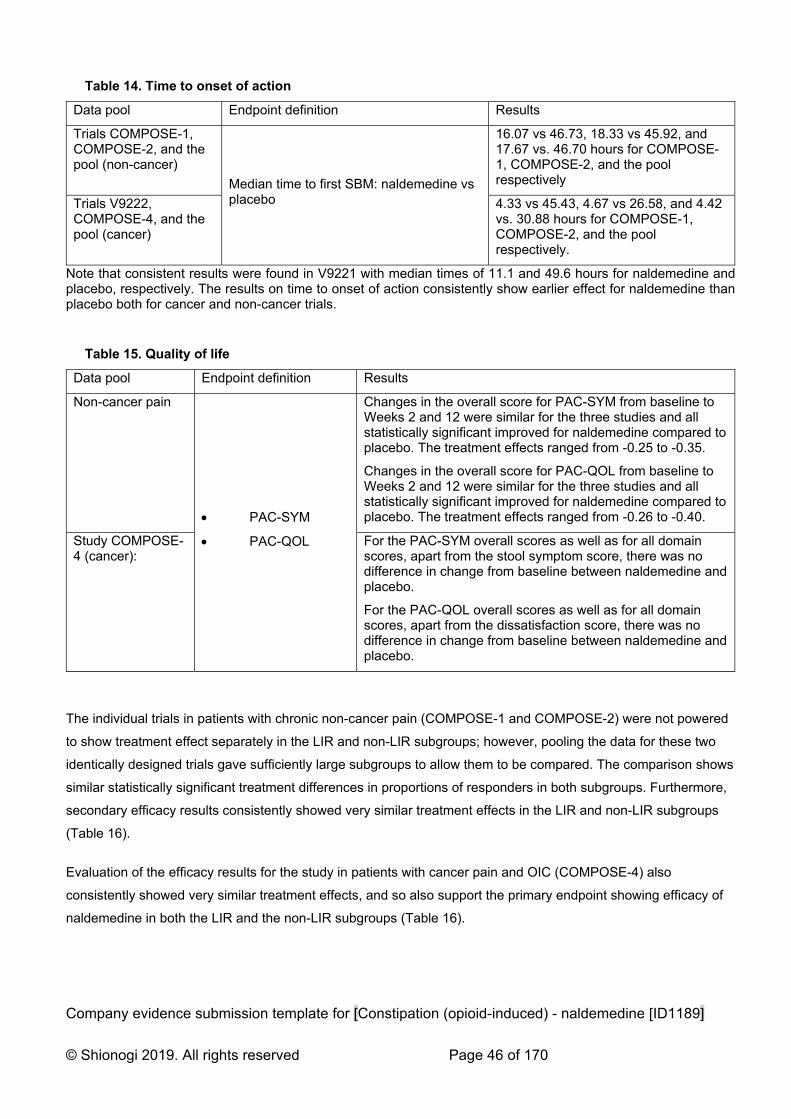
Company evidence submission template for [Constipation (opioid-induced) - naldemedine [ID1189]
© Shionogi 2019. All rights reserved Page 46 of 170
Table 14. Time to onset of action
Data pool Endpoint definition Results
Trials COMPOSE-1, COMPOSE-2, and the pool (non-cancer)
Median time to first SBM: naldemedine vs placebo
16.07 vs 46.73, 18.33 vs 45.92, and 17.67 vs. 46.70 hours for COMPOSE-1, COMPOSE-2, and the pool respectively
Trials V9222, COMPOSE-4, and the pool (cancer)
4.33 vs 45.43, 4.67 vs 26.58, and 4.42 vs. 30.88 hours for COMPOSE-1, COMPOSE-2, and the pool respectively.
Note that consistent results were found in V9221 with median times of 11.1 and 49.6 hours for naldemedine and placebo, respectively. The results on time to onset of action consistently show earlier effect for naldemedine than placebo both for cancer and non-cancer trials.
Table 15. Quality of life
Data pool Endpoint definition Results
Non-cancer pain
PAC-SYM
PAC-QOL
Changes in the overall score for PAC-SYM from baseline to Weeks 2 and 12 were similar for the three studies and all statistically significant improved for naldemedine compared to placebo. The treatment effects ranged from -0.25 to -0.35.
Changes in the overall score for PAC-QOL from baseline to Weeks 2 and 12 were similar for the three studies and all statistically significant improved for naldemedine compared to placebo. The treatment effects ranged from -0.26 to -0.40.
Study COMPOSE-4 (cancer):
For the PAC-SYM overall scores as well as for all domain scores, apart from the stool symptom score, there was no difference in change from baseline between naldemedine and placebo.
For the PAC-QOL overall scores as well as for all domain scores, apart from the dissatisfaction score, there was no difference in change from baseline between naldemedine and placebo.
The individual trials in patients with chronic non-cancer pain (COMPOSE-1 and COMPOSE-2) were not powered
to show treatment effect separately in the LIR and non-LIR subgroups; however, pooling the data for these two
identically designed trials gave sufficiently large subgroups to allow them to be compared. The comparison shows
similar statistically significant treatment differences in proportions of responders in both subgroups. Furthermore,
secondary efficacy results consistently showed very similar treatment effects in the LIR and non-LIR subgroups
(Table 16).
Evaluation of the efficacy results for the study in patients with cancer pain and OIC (COMPOSE-4) also
consistently showed very similar treatment effects, and so also support the primary endpoint showing efficacy of
naldemedine in both the LIR and the non-LIR subgroups (Table 16).
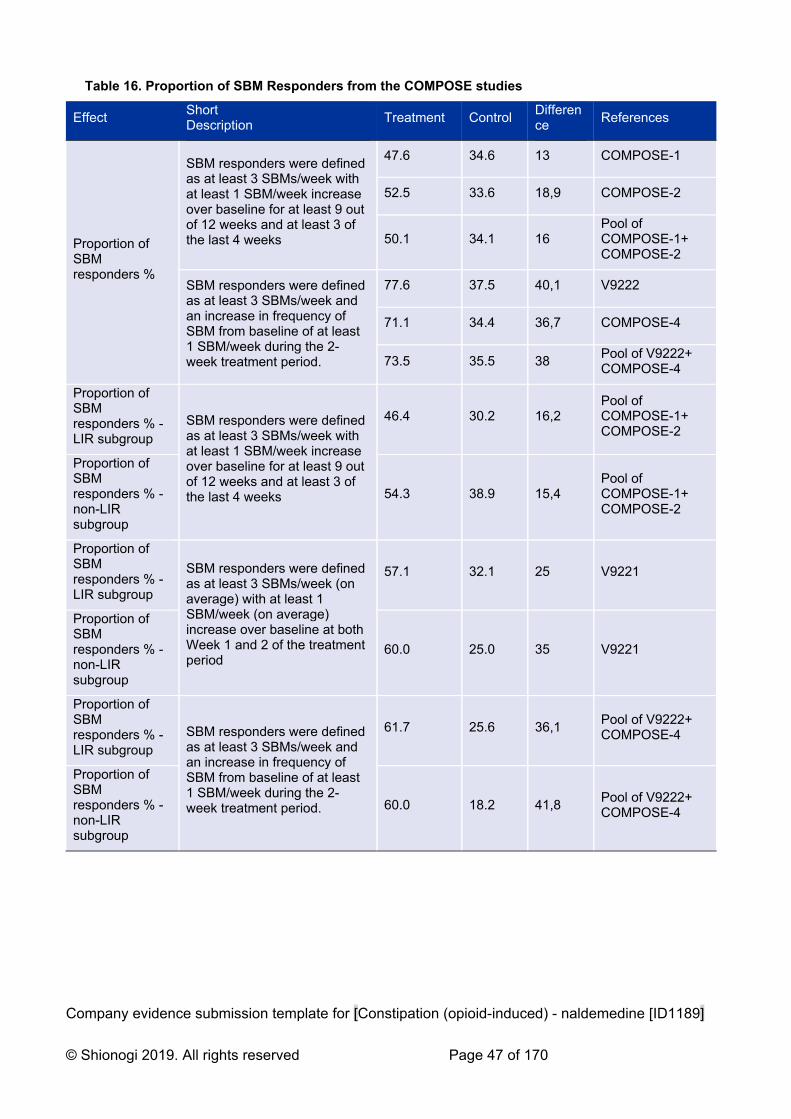
Company evidence submission template for [Constipation (opioid-induced) - naldemedine [ID1189]
© Shionogi 2019. All rights reserved Page 47 of 170
Table 16. Proportion of SBM Responders from the COMPOSE studies
Effect Short Description
Treatment Control Difference
References
Proportion of SBM responders %
SBM responders were defined as at least 3 SBMs/week with at least 1 SBM/week increase over baseline for at least 9 out of 12 weeks and at least 3 of the last 4 weeks
47.6 34.6 13 COMPOSE-1
52.5 33.6 18,9 COMPOSE-2
50.1 34.1 16 Pool of COMPOSE-1+ COMPOSE-2
SBM responders were defined as at least 3 SBMs/week and an increase in frequency of SBM from baseline of at least 1 SBM/week during the 2-week treatment period.
77.6 37.5 40,1 V9222
71.1 34.4 36,7 COMPOSE-4
73.5 35.5 38 Pool of V9222+ COMPOSE-4
Proportion of SBM responders % - LIR subgroup
SBM responders were defined as at least 3 SBMs/week with at least 1 SBM/week increase over baseline for at least 9 out of 12 weeks and at least 3 of the last 4 weeks
46.4 30.2 16,2 Pool of COMPOSE-1+ COMPOSE-2
Proportion of SBM responders % - non-LIR subgroup
54.3 38.9 15,4 Pool of COMPOSE-1+ COMPOSE-2
Proportion of SBM responders % - LIR subgroup
SBM responders were defined as at least 3 SBMs/week (on average) with at least 1 SBM/week (on average) increase over baseline at both Week 1 and 2 of the treatment period
57.1 32.1 25 V9221
Proportion of SBM responders % - non-LIR subgroup
60.0 25.0 35 V9221
Proportion of SBM responders % - LIR subgroup
SBM responders were defined as at least 3 SBMs/week and an increase in frequency of SBM from baseline of at least 1 SBM/week during the 2-week treatment period.
61.7 25.6 36,1 Pool of V9222+ COMPOSE-4
Proportion of SBM responders % - non-LIR subgroup
60.0 18.2 41,8 Pool of V9222+ COMPOSE-4
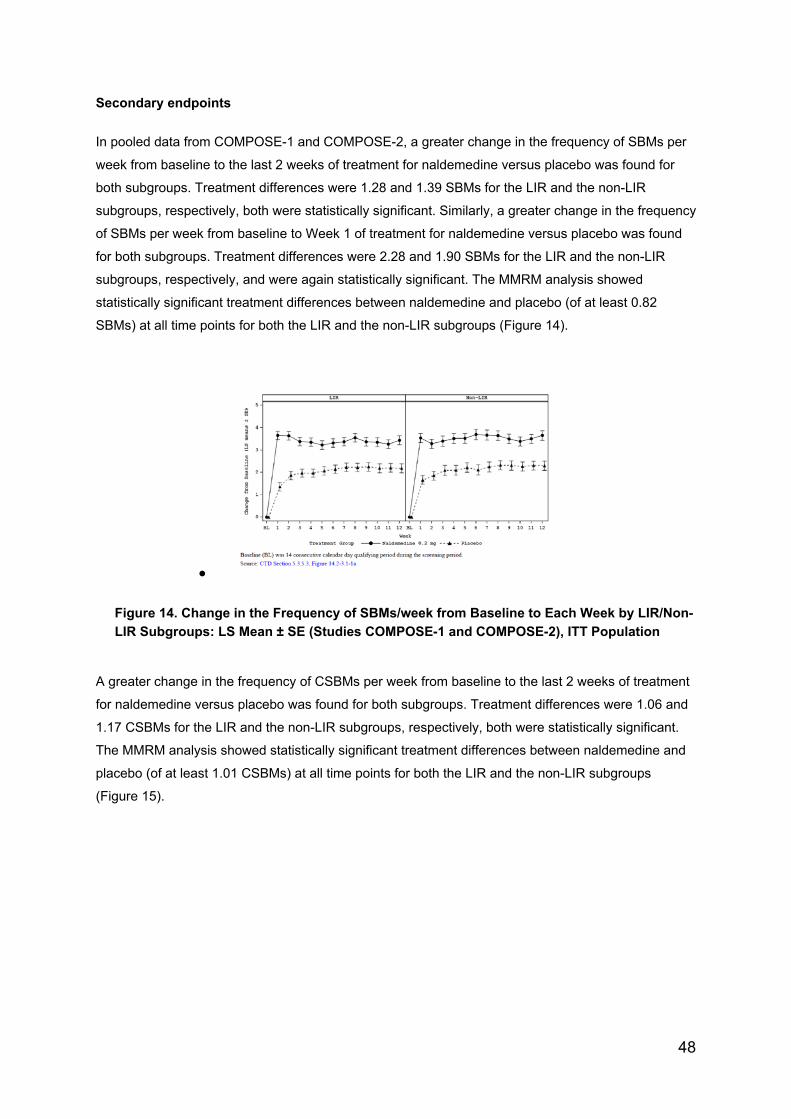
48
Secondary endpoints
In pooled data from COMPOSE-1 and COMPOSE-2, a greater change in the frequency of SBMs per
week from baseline to the last 2 weeks of treatment for naldemedine versus placebo was found for
both subgroups. Treatment differences were 1.28 and 1.39 SBMs for the LIR and the non-LIR
subgroups, respectively, both were statistically significant. Similarly, a greater change in the frequency
of SBMs per week from baseline to Week 1 of treatment for naldemedine versus placebo was found
for both subgroups. Treatment differences were 2.28 and 1.90 SBMs for the LIR and the non-LIR
subgroups, respectively, and were again statistically significant. The MMRM analysis showed
statistically significant treatment differences between naldemedine and placebo (of at least 0.82
SBMs) at all time points for both the LIR and the non-LIR subgroups (Figure 14).
Figure 14. Change in the Frequency of SBMs/week from Baseline to Each Week by LIR/Non-
LIR Subgroups: LS Mean ± SE (Studies COMPOSE-1 and COMPOSE-2), ITT Population
A greater change in the frequency of CSBMs per week from baseline to the last 2 weeks of treatment
for naldemedine versus placebo was found for both subgroups. Treatment differences were 1.06 and
1.17 CSBMs for the LIR and the non-LIR subgroups, respectively, both were statistically significant.
The MMRM analysis showed statistically significant treatment differences between naldemedine and
placebo (of at least 1.01 CSBMs) at all time points for both the LIR and the non-LIR subgroups
(Figure 15).

49
Figure 15. Change in the Frequency of CSBMs/week from Baseline to Each Week by LIR/Non-LIR
Subgroups: LS Mean ± SE (Studies COMPOSE-1 and COMPOSE-2), ITT Population
When durability of effect is considered for the change in frequency of BMs, the MMRM analysis
showed statistically significant treatment differences between naldemedine and placebo (of at least
1.03 BMs) at Week 12 for both the LIR and the non-LIR subgroups in pooled data from COMPOSE-1
and COMPOSE-2 and data from study COMPOSE-3. Nothing indicated a different treatment effect in
the LIR and non-LIR subgroups in the long-term study.
B.2.8 Meta-analysis
Indirect comparisons were performed to estimate the relative efficacy of naldemedine to the key
comparator naloxegol (see Section B.2.9). As such, formal meta-analyses were not performed as a
recently published NMA identified 27 randomised controlled trials of pharmacological therapies in
opioid-induced constipation (OIC), containing 9,149 patients has been conducted.
The Mu opioid receptor antagonists naloxone, naldemedine, alvimopan and subcutaneous
methylnaltrexone, as well as the prokinetic prucalopride, were all more effective than placebo for the
treatment of OIC (Figure 2.1).

50
Table 17. League table of results for failure to achieve an average of >=3BMs per week with
an increase of >=1BM per week over baseline or an average of >=3BMs per week
Naldemedine was the second-best drug after naloxone in the primary analysis and was significantly
superior to naloxegol and methylnaltrexone in the indirect comparison. When failure to achieve an
average of ≥3 BMs per week with an increase of ≥1 BM over baseline was used to define non-
response to therapy, which is a more rigorous endpoint, naldemedine was the drug ranked first.
Relative risk with 95% CI in parentheses. Comparisons, column versus row, should be read from left
to right and are ordered relative to their overall efficacy. The treatment in the top left position is ranked
as best after the network meta-analysis of indirect effects. Green shaded boxes denote statistically
significant differences between treatments (Table 17).
Figure 16. Findings from the independent network meta-analysis. Forest plot of the indirect
evidence for failure to achieve an average of ≥3 BMs per week with an increase of ≥1 BM
per week over baseline. I2 for global statistical heterogeneity was 70.6%.
Note: the P-score is the probability of each treatment being ranked as best in the network analysis. A higher score equates to a greater probability of being ranked first. Direct comp. is the number of direct comparisons of the indicated medication versus placebo. BM, bowel movement; RR, relative risk.

51
B.2.9 Indirect and mixed treatment comparisons
Two separate indirect comparison analyses were performed to inform the efficacy inputs of the cost-
effectiveness model (Section B.3). The results of the analyses used to inform response rate at Week 4
and response rate at Week 12 in the laxative inadequate response (LIR) population are presented
separately in the sections that follow. The methodology of the two analyses is presented in Appendix
D.
B.2.9.1 Response rate at Week 4
A summary of the trials and data used to inform response rate at Week 4 in the LIR population is
presented in Table 18 and Table 19. The methodology of the feasibility assessment conducted prior to
the analysis, and the rationale for excluding studies captured in the clinical SLR but not included in the
analysis is presented in Appendix D.4. The results of the analysis are presented in Figure 17.
Table 18. Summary of the trials used to carry out ITC for response rate at Week 4 (LIR
population)
Trial Interventions
Naldemedine 0.2 mg Naloxegol 25 mg
COMPOSE-1 Y N
COMPOSE-2 Y N
KODIAC-4 N Y
KODIAC-5 N Y Abbreviations: ITC: indirect treatment comparison; LIR: laxative inadequate response; NMA: network meta-
analysis. Note: Pooled data between COMPOSE-1 and COMPOSE-2, and KODIAC-4 and KODIAC-5, were used
in this analysis.
Table 19. Data used in ITC for response rate at Week 4 (LIR population)
Study Treatment Subjects with outcome
N
COMPOSE-1&2 (pooled) (1)
Naldemedine
(no rescue)
27 30
Placebo+bisacodyl 105 166
KODIAC-4&5 (pooled)(22)
Naloxegol 25mg
(no rescue)
141 †215
Placebo+bisacodyl 144 †233
† estimated from standard error published in TA345 (manufacturer’s submission)

52
Figure 17. ITC results for response rate at Week 4 (LIR population)
The results from the ITC show a numerical advantage favouring naldemedine monotherapy over that
with naloxegol 25mg in patients with laxative inadequate response, though wide credibility intervals
indicate this is not statistically significant. As this is analysis is closest in definition to Scenario 3
outlined in the decision problem, these results are used to define the clinical effect in the
correspondent economic analysis.
B.2.9.2 Response rate at Week 12 (LIR population)
A summary of the trials used to inform response rate at Week 12 in the LIR population is presented in
Error! Reference source not found.. The methodology of the feasibility assessment conducted prior
to the analysis, and the rationale for excluding studies captured in the clinical SLR but not included in
the analysis is presented in Appendix D.4.
Table 20. Summary of the trials used to carry out ITC for response rate at Week 12 (LIR
population)
Trial Interventions
Naldemedine 0.2 mg Naloxegol 25 mg
COMPOSE-1 Y N
COMPOSE-2 Y N
KODIAC-4 N Y
KODIAC-5 N Y Abbreviations: ITC: indirect treatment comparison; LIR: laxative inadequate response; NMA: network meta-
analysis. Note: Pooled data between COMPOSE-1 and COMPOSE-2, and KODIAC-4 and KODIAC-5, were used
in this analysis
The results of the analysis are presented in Error! Reference source not found.. They suggest that
there is no statistically significant difference in response rate between naldemedine 0.2 mg QD and
naloxegol 25 mg QD at Week 12 in the LIR population.

53
Figure 18. ITC results for response rate at Week 12 (LIR population)
Abbreviations: ITC: indirect treatment comparison; LIR: laxative inadequate response; OR: odds ratio; QD: once
daily; RR: risk ratio.
B.2.9.3 Uncertainties in the indirect and mixed treatment comparisons
This analysis is associate with some uncertainty. With regards to data availability, only pooled
outcome data between trials were available for the LIR population: pooled COMPOSE-1/2 trial data
were compared with pooled KODIAC-04/05 trial data. Therefore, randomisation of patients in these
trials was not preserved in the data used, which may have introduced some selection bias into the
analysis. The comparison between the two treatments is reliant upon the results of these few, specific
studies. There was also limited information on baseline characteristics of the LIR population from the
COMPOSE-1/2 and KODIAC-04/05 trials. The baseline characteristics and analysis of these is
presented in Appendix D.4. Only age, gender and ethnicity data were available for all of the studies
include in this analysis, with some variation observed in terms of prior opioid treatment between
KODIAC-4 and KODIAC-5, as well as OIC and LIR definitions between all four trials. The observed
heterogeneity among clinical characteristics was not deemed sufficiently large to prevent an
informative analysis. Due to the small amount of data availability among the four studies, it was not
possible to make any statistical adjustments for these minor differences or to perform any sensitivity
analyses to exclude certain trials.
B.2.10 Adverse reactions
B.2.10.1 Adverse reactions in the safety population
Adverse reactions were assessed in the safety population (i.e. all randomized patients who received
≥1 dose of the study drug) in all COMPOSE studies. The concomitant use of naldemedine with
opioids was generally well tolerated and did not impede the analgesic benefits of opioids or precipitate
opioid-withdrawal syndrome in this study population. In studies in patients with chronic non-cancer
pain, the proportions of patients who reported a TEAE were similar in the naldemedine and placebo
groups. In COMPOSE-4, a significantly higher proportion of patients treated with naldemedine had
TEAEs vs. placebo (P=0.01). In all trials, most events were mild to moderate in severity and patients

54
receiving naldemedine experienced a higher incidence of gastrointestinal adverse events, such as
diarrhea, than those receiving placebo (Table 21).
Table 21. Adverse reactions (n [%]) experienced with naldemedine 0.2 mg vs. placebo in the
COMPOSE program
Trial number (acronym)
V9231
COMPOSE-1
V9232
COMPOSE-2
V9235
COMPOSE-3
V9236
COMPOSE-4
V9237
COMPOSE-5
V9238
COMPOSE-6
V9239
COMPOSE-7
Nal Pla Nal Pla Nal Pla Nal Pla Nal Nal Nal
Any TEAE 132 (49
123 (45)
136 (50)
132 (48)
425 (68)
446 (72)
43 (44)
25 (26)
105 (80) 38 (88) 9 (90)
Drug-related TEAE 59 (22)
45 (17)
54 (20)
31 (11)
149 (24)
121 (20)
18 (19)
9 (9) 20 (15) 12 (28) 5 (50)
Serious TEAE 14 (5)
5 (2) 9 (3) 13 (5)
60 (10)
73 (12)
- - - 4 (9) 0
Drug-related serious TEAE
2 (1) 0 2 (1) 1 (<1)
3 (<1)
6 (1) - - - - -
TEAE leading to study discontinuation
13 (5)
4 (2) 14 (5)
9 (3) 39 (6)
36 (6)
9 (9) 1 (1) 12 (9) 3 (7) 1 (10)
Serious TEAE leading to study discontinuation
3 (1) 0 3 (1) 3 (1) 7 (1) 12 (2)
- - - - -
Deaths 0 0 1 (<1)
0 4 (<1)
4 (<1)
2 (2) 0 15 (12) 1 (2) 0
TEAEs occurring in ≥5% of patients
Infections & infestations
Gastroenteritis - - - - - - - - 9 (7)
URTIs 36 (6)
33 (5)
- - - - -
UTIs 7 (£) 8 (3) 6 (2) 14 (5)
35 (6)
51 (8)
- - - - -
GI disorders
Abdominal pain 17 (6)
5 2) 15 (5)
3 (1) 51 (8)
19 (3)
- - - 2 (5) -
Diarrhoea 18 (7)
8 (3) 24 (9)
5 (2) 68 (11)
33 (5)
19 (20)
7 (7) 24 (18) 10 (23) 4 (40)
Nausea 13 (5)
7 (3) 13 (5)
9 (3) 49 (8)
35 (6)
1 (1) 2 (2) 17 (13) 5 (12) 1 (10)
Vomiting - - - - 37 (6)
19 (3)
3 (3) 1 (1) 16 (22) 4 (9) 1 (10)
Others
Anaemia - - - - - - - - 8 (6) - -
Anxiety - - - - - - - - - 2 (5) 2 (20)
Back pain 6 (2) 9 (3) 10 (4)
6 (2) 36 (6)
31 (5)
- - - - -
Decreased appetite - - - - - - - - 14 (11) - -
Dizziness - - - - - - - - - 2 (5) 0
Eczema - - - - - - - - - 2 (5) 0
Malaise - - - - - - - - 13 (10) - -
Somnolence - - - - - -- - - - 3 (7) 1 (10)
TEAEs of special interest
MACE 1 (<1)
0 0 1 (<1)
4 (<1)
5 (<1)
0 1 (1) 1 (1) 3 (7) 0
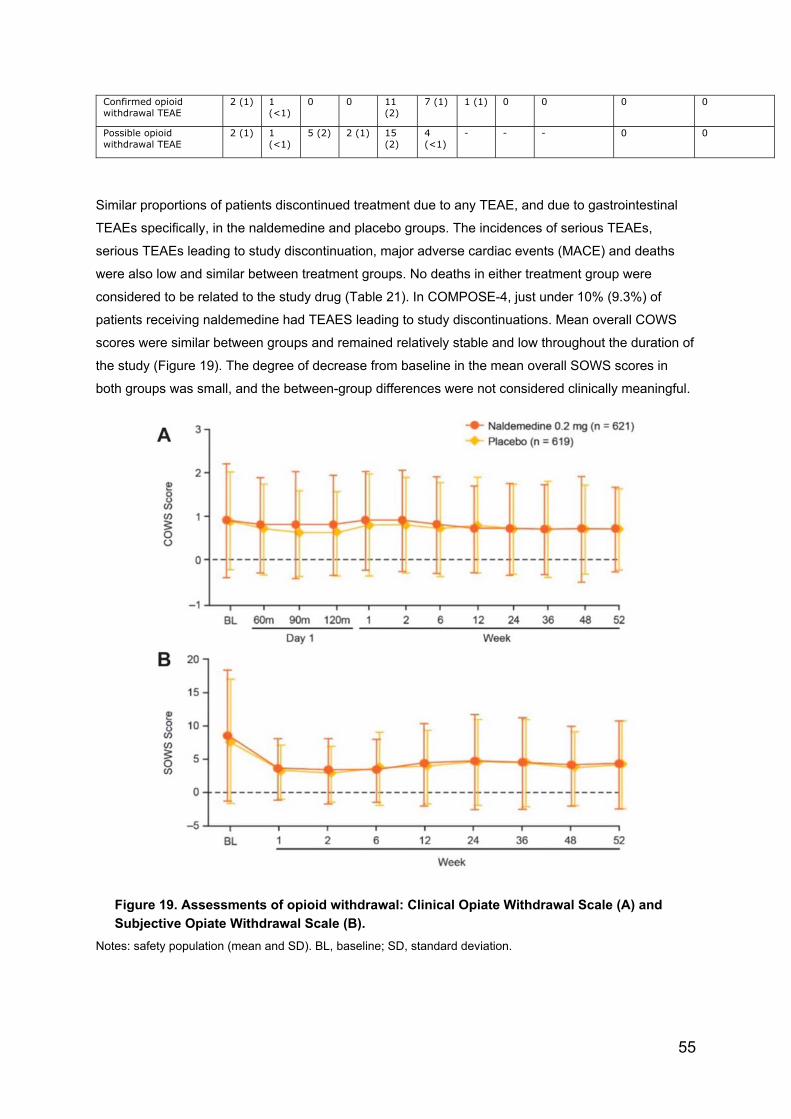
55
Confirmed opioid withdrawal TEAE
2 (1) 1 (<1)
0 0 11 (2)
7 (1) 1 (1) 0 0 0 0
Possible opioid withdrawal TEAE
2 (1) 1 (<1)
5 (2) 2 (1) 15 (2)
4 (<1)
- - - 0 0
Similar proportions of patients discontinued treatment due to any TEAE, and due to gastrointestinal
TEAEs specifically, in the naldemedine and placebo groups. The incidences of serious TEAEs,
serious TEAEs leading to study discontinuation, major adverse cardiac events (MACE) and deaths
were also low and similar between treatment groups. No deaths in either treatment group were
considered to be related to the study drug (Table 21). In COMPOSE-4, just under 10% (9.3%) of
patients receiving naldemedine had TEAES leading to study discontinuations. Mean overall COWS
scores were similar between groups and remained relatively stable and low throughout the duration of
the study (Figure 19). The degree of decrease from baseline in the mean overall SOWS scores in
both groups was small, and the between-group differences were not considered clinically meaningful.
Figure 19. Assessments of opioid withdrawal: Clinical Opiate Withdrawal Scale (A) and
Subjective Opiate Withdrawal Scale (B).
Notes: safety population (mean and SD). BL, baseline; SD, standard deviation.

56
Mean NRS scores for pain assessment were similar between treatment groups and were generally
stable throughout the studies. (Figures 20 and 21).
Figure 20. Assessment of pain intensity using the Numeric Rating Scale Safety population
(mean and SD).
Figure 21. Mean (± SE) Numeric Rating Scale scores (safety population)
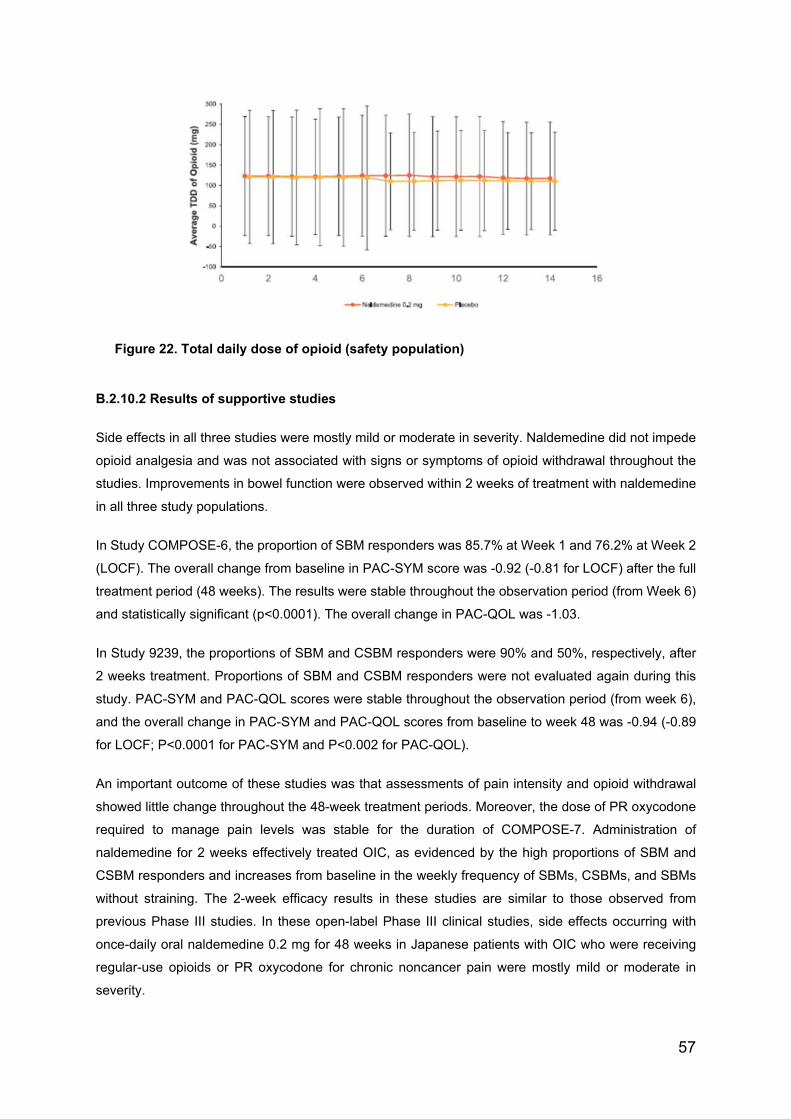
57
Figure 22. Total daily dose of opioid (safety population)
B.2.10.2 Results of supportive studies
Side effects in all three studies were mostly mild or moderate in severity. Naldemedine did not impede
opioid analgesia and was not associated with signs or symptoms of opioid withdrawal throughout the
studies. Improvements in bowel function were observed within 2 weeks of treatment with naldemedine
in all three study populations.
In Study COMPOSE-6, the proportion of SBM responders was 85.7% at Week 1 and 76.2% at Week 2
(LOCF). The overall change from baseline in PAC-SYM score was -0.92 (-0.81 for LOCF) after the full
treatment period (48 weeks). The results were stable throughout the observation period (from Week 6)
and statistically significant (p<0.0001). The overall change in PAC-QOL was -1.03.
In Study 9239, the proportions of SBM and CSBM responders were 90% and 50%, respectively, after
2 weeks treatment. Proportions of SBM and CSBM responders were not evaluated again during this
study. PAC-SYM and PAC-QOL scores were stable throughout the observation period (from week 6),
and the overall change in PAC-SYM and PAC-QOL scores from baseline to week 48 was -0.94 (-0.89
for LOCF; P<0.0001 for PAC-SYM and P<0.002 for PAC-QOL).
An important outcome of these studies was that assessments of pain intensity and opioid withdrawal
showed little change throughout the 48-week treatment periods. Moreover, the dose of PR oxycodone
required to manage pain levels was stable for the duration of COMPOSE-7. Administration of
naldemedine for 2 weeks effectively treated OIC, as evidenced by the high proportions of SBM and
CSBM responders and increases from baseline in the weekly frequency of SBMs, CSBMs, and SBMs
without straining. The 2-week efficacy results in these studies are similar to those observed from
previous Phase III studies. In these open-label Phase III clinical studies, side effects occurring with
once-daily oral naldemedine 0.2 mg for 48 weeks in Japanese patients with OIC who were receiving
regular-use opioids or PR oxycodone for chronic noncancer pain were mostly mild or moderate in
severity.

58
Moreover, concomitant treatment with naldemedine did not interfere with the analgesic effects of opioids
or precipitate any signs or symptoms of opioid withdrawal. The results suggest that treatment with
naldemedine can improve bowel function and constipation-related QOL in this study population.
The results in supportive studies are consistent with those reported in pivotal trials. Treatment with
naldemedine 0.2 mg was generally well tolerated both in subjects with chronic non-cancer pain and
OIC and subjects with cancer and OIC. The use of naldemedine is, as expected, associated with
gastrointestinal adverse events, abdominal pain, diarrhoea, vomiting and nausea. However, each of
these events affected less than 10% of the patients and most AEs were not serious. No gastrointestinal
perforations were seen with naldemedine; however, this has been observed with other peripherally-
acting µ-opioid receptor antagonist (PAMORAs) and could be a class effect. This is adequately
addressed in the SmPC and RMP.
Only very few patients had signs of opioid withdrawal indicating that naldemedine does not cross the
blood brain barrier to such a degree that it causes clinically relevant symptoms. A warning to use
naldemedine with caution in patients with a risk of having a compromised blood brain barrier such as
patients with brain metastases is included in the SmPC. Its safety profile in different subgroups (LIR,
non-LIR, regardless of sex, BMI, type and dose of opioids) is consistent with that observed in the overall
population (non-cancer and OIC population and cancer and OIC patients).
B.2.11 Interpretation of clinical effectiveness and safety evidence
A detailed and comprehensive clinical trials program for this product has demonstrated a high level of
clinical effectiveness in alleviation of the symptoms of constipation. Whilst the trials were versus
placebo, rescue medications were available to alleviate symptoms. Clinical benefit was observed in
those without cancer and more so in those with cancer. In indirect analysis of benefit versus naloxegol,
naldemedine has been shown to be superior in all analysis, including a network meta-analysis
conducted independently. Naldemedine has been shown to be a very safe and well-tolerated product.

59
B.2.12 Ongoing studies
There are no Shionogi ongoing studies
B.2.13 Innovation
Appendix N details the mode of action of naldemedine. Shionogi would contend that the permanent
binding capacity and higher receptor affinity of naldemedine makes it a different PAMORA. Its clinical
and safety data outlined in this submission indicate that it has a more beneficial than other PAMORAs.
Because of its permanent binding capacity and higher receptor affinity it is a simple once a day
medication for most patients requiring a wide range of doses of opioid therapy. These features make
naldemedine a potentially key innovation to support patients in primary and secondary care taking
longer term opioids with chronic non-cancer and cancer pain.
B.2.14 Interpretation of clinical effectiveness and safety evidence
Naldemedine is:(1,2,5)
statistically significant and clinically meaningful improvement in symptoms of constipation
compared with placebo
Rapid response to treatment (within 48 hours)
Effects were durable in the long-term (up to 52 weeks in patients with non-cancer pain)
Statistically significant improvements in constipation symptoms and quality of life scores that
were sustained up to 52 weeks in patients with chronic non-cancer pain and up to 12 weeks in
patients with pain associated with cancer
Naldemedine has:
No unexpected safety signals or reduction in opioid analgesic therapy in the COMPOSE
programme
No evidence of centrally mediated opioid withdrawal
No reduction in the therapeutic response to opioid analgesic therapy
As expected, abdominal pain, diarrhoea, and nausea were higher with naldemedine relative to
placebo
Frequency of TEAEs similar to placebo in patients with OIC and pain due to cancer or chronic
non-cancer pain
Been designed not to cross blood–brain barrier
Company evidence submission template for [Constipation (opioid-induced) - naldemedine [ID1189]
© Shionogi 2019. All rights reserved Page 60 of 170
B.3 Cost effectiveness
B.3.1 Published cost-effectiveness studies
A systematic review was conducted to assess the available cost-effectiveness data for naldemedine
and relevant comparators for treatment in OIC patients (Appendix G). Though some published analyses
are evaluable for comparators (Table 22), at the time of writing no economic evaluation has been
identified for naldemedine. Therefore, a de novo economic analysis has been conducted to address the
lack of any published evidence for the cost-effectiveness of naldemedine.

Company evidence submission template for [Constipation (opioid-induced) - naldemedine [ID1189]
© Shionogi 2019. All rights reserved Page 61 of 170
Table 22. Summary list of published cost-effectiveness studies
Study Year Summary of model
Patient population (average age in years)
QALYs (intervention, comparator)
Costs (currency) (intervention, comparator)
ICER (per QALY gained)
Gerlier(85) (abstract)
2009 - Naloxone-oxycodone (intervention; OXN) vs oxycodone alone(comparator; OXY)
- Decision analytical model
- Societal perspective Netherlands and Belgium
- Time horizon: three and 12 months
- No discounting applied
- Clinical data from OXN3001 trial
- Utilities: SF-36
- Deterministic and probabilistic sensitivity analysis conducted
- Patients with moderate/severe non-cancer pain.
- Age NR
QALY gain
- Netherlands 0.0026
- Belgium 0.0026
Incremental drug cost:
- Netherlands €115
- Belgium €153
ICER at 12 months
- Belgium €25,421/QALY
- Netherlands €12,786/QALY
ICER at 3 months
- OXN dominant vs OXY in the Netherlands (data not shown)
- Belgium €16,389/QALY
Earnshaw(86)
(manuscript)
2010 - Me’naltrexone plus SOC (MNTX; intervention) vs SOC (comparator)
- Decision analytical model
- Payer perspective of Netherlands
- Time horizon <12months
- No discounting
- Clinical data: NCT00402038
- Utilities: EQ-5D
- OWSA and PSA conducted
- Advanced illness patients (cancer, cardiovascular disease, chronic obstructive disease and Alzheimer’s disease)
- Median age: 71 years
QALYs gained
- 0.02 (MNTX vs SOC)
Total costs (drug + other medical)
- MNTX: € 7151
- SOC: € 6170
ICER (cost/ QALY):
- MNTX vs SOC: €40,865/QALY

Company evidence submission template for [Constipation (opioid-induced) - naldemedine [ID1189]
© Shionogi 2019. All rights reserved Page 62 of 170
Dunlop(87)
(abstract)
2013 - OXN (intervention) vs OXY (comparator)
- Model: NR
- UK NHS perspective
- Clinical data from an RCT
- Utilities: BFI to EQ-5D
- Deterministic sensitivity analyses
- Patients with moderate/severe non-cancer pain, patients with moderate/severe cancer pain.
QALYs gained
- 0.0524 (OXN vs OXY)
Incremental cost of OXN vs OXY:
- £410
ICER OXN vs. OXY:
- £7,822/QALY
Dunlop(88)
(manuscript)
2012 - OXN (intervention) vs OXY (comparator)
- Cohort model (type not clearly stated)
- UK NHS perspective
- Time horizon 301 days
- Clinical data from RCT
- Utilities: mapped SF-36 to EQ-5D
- Deterministic and probabilistic SA conducted
- Costs estimated from UK primary physicians; duration and resource use not clearly defined
- Assumed QoL and BFI constant after week 12; however, BFI in extension study improved until 12 months
- Patients with moderate/severe non-malignant pain
QALYs gained
- 0.0273 (OXN vs OXY)
Total costs (pain tx+ laxatives + other resources)
- OXN: £873
- OXY: £713
ICER OXN vs. OXY
£5842/QALY

Company evidence submission template for [Constipation (opioid-induced) - naldemedine [ID1189]
© Shionogi 2019. All rights reserved Page 63 of 170
SMC submission Targinact(89)
2009 - OXN (intervention) vs OXY (comparator)
- Decision analytical model
- Scottish NHS perspective
- Time horizon: one year
- Clinical data from RCT
- Utilities: different sources including EQ-5D
- Sensitivity analyses conducted
- Health states defined by laxatives use not constipation. - Utilities from incomparable sources
- Patients with severe pain
QALYs gained
- 0.02 (OXN vs OXY)
Net total cost:
- OXN: £93
- OXY: NR
ICER OXN vs. OXY:
- £4,712/QALY
NICE submission naloxegol(22)
2015 Multiple comparators:
1. Naloxegol 25mg (NLX; intervention) vs placebo (PLB; comparator)
2. NLX vs PLB+bisacodyl (PLB+BCL)
3. NLX+BCL vs PLB+BCL
4. NLX vs subcutaneous (SC) MNTX
5. NLX vs OXN
- Decision tree (1st month) + Markov health state transition model thereafter
- England & Wales NHS perspective
- Time horizon: five years
- Clinical data from two RCTs
- Utilities: EQ-5D from RCTs
- Costs from two GP surveys
- Base case dependent on time-treatment utility interaction for naloxegol arm
- non-cancer chronic pain patients with OIC having had inadequate response to previous laxative treatment
- as per KODIAC4&5 RCTs
QALYs gained:
1. 0.024
2. 0.022
3. 0.028
4. 0.004
5. 0.0026
Incremental costs:
1. £256
2. £272
3. £313
4. -£962
5. £78
ICER (£/QALY):
1. £10,849
2. 12,639
3. £11,175
4. NLX dominant
5. £30,054

Company evidence submission template for [Constipation (opioid-induced) - naldemedine [ID1189]
© Shionogi 2019. All rights reserved Page 64 of 170
Lawson(90)
(manuscript)
2017 As per NICE submission for naloxegol(22):
- Scenarios 1) and 3) presented.
As above As above As above As above
SMC submission Moventig(91)
2015 As per NICE submission(22):
- Scenarios 1), 2), 3) and 4) presented
- Scottish NHS payer perspective
As above Incremental QALYs:
- NLX vs PLB (1), 0.024
- NLX vs BCL (2), 0.022
- NLX+BCL vs BCL (3), 0.028
- NLX vs MNTX SC (4), NR
Incremental costs:
1. £260
2. £275
3. £317
4. NR
ICERs (£/QALY):
1. £11,021
2. £12,762
3. £11,327
4. Naloxegol dominant
Abbreviations: QALYs, quality-adjusted life years; ICER, incremental cost-effectiveness ratio
B.3.2 Economic analysis
In previous economic analysis of fixed-dose combination oxycodone/naloxone versus oxycodone (92)
the Scottish Medicine Consortium highlighted the following weaknesses: health states defined by
laxative use rather than degree of constipation, and poor estimation of utilities from incomparable
sources.
More recently, the modelling approach used in economic analyses of naloxegol submitted to NICE was
considered generally acceptable though questions were raised about: the breadth of the non-OIC health
state with respect to SBM frequency and the assumption of constant utility; the appropriateness of
placebo as the comparator in the base case, being equivalent to no treatment, rarely chosen option in
clinical management of OIC; the appropriateness of treatment-time specific utilities rather than the more
conventional approach of using health state dependent utilities only (22).
Given the relatively broad licence for naldemedine (“for the treatment of [OIC] in adult patients who
have previously been treated with a laxative”), Shionogi has opted for a pairwise approach to the
economic analysis rather a fully incremental model, as the intended populations for each comparator
are different meaning their underpinning clinical data not strictly comparable. The health states are
based on degree of constipation derived from endpoints consistent with not only the registration trial
program but also clinical practice. A similarly conservative approach to that used in the economic
analysis of naloxegol is presented, that is a binary definition of OIC, based on a commonly accepted
threshold of weekly spontaneous bowel movements. Further post hoc analyses of QoL data from the
RCTs has also been undertaken to examine not only the plausibility of any time and treatment
interactions but also to enable comparison with health effects associated with OIC reported in the
published literature.
A de novo economic analysis has been conducted to address the lack of any published evidence for
the cost-effectiveness of naldemedine identified in Section B.3.1 and Appendix G.

Company evidence submission template for [Constipation (opioid-induced) - naldemedine [ID1189]
© Shionogi 2019. All rights reserved Page 65 of 170
Patient population
The patients included in the de novo cost-effectiveness analysis were as described in Section B.2. and
in line with the licence, namely the treatment of OIC in adult patients who have previously been treated
with a laxative. Necessarily, three distinct scenarios are modelled consistent with the principal expected
use cases of naldemedine as:
1. An alternative to second-line laxative monotherapy in patients with OIC;
2. An alternative to combination-laxative therapy in patients with mixed aetiology constipation
(including OIC) when combined with existing laxative therapy; and as
3. An alternative to naloxegol in patients with OIC who have previously had an inadequate
response to laxative treatment/s.
Each of the above use cases are consistent with recently published European guidelines for the
management of OIC(20).
Whilst other use cases are possible (e.g. naldemedine as an alternative to either subcutaneous
methylnaltrexone (MNTX) in patients with advanced illness or to fixed dose combination of
oxycodone/naloxone (OXN) in patients requiring oxycodone), they are not explicitly explored in this
analysis on the logical basis that:
Naloxegol has been shown to dominate MNTX and is cost-effective against OXN(22);
Naldemedine has the same acquisition cost as naloxegol; and
Independent analysis has shown a favourable clinical effectiveness profile for naldemedine
over either naloxegol, MNTX, or OXY(21).
The present analysis focuses on outcomes for non-cancer patients for which the clinical data are most
robust, including both short-term and longer-term studies.
Model structure
Description of the economic model
A decision-analytic model was constructed to compare the cost-effectiveness of relevant treatment
options. The first four weeks of treatment employ a decision-tree structure, thereafter a Markov
structure, with a cycle length of 4 weeks, and time horizon up to a maximum of 5 years (the 90th centile
of opioid analgesic episode duration observed in CPRD (see Appendix M) is used.
Patients enter the model with OIC and commence assigned treatment, either naldemedine-based
treatment or a designated comparator treatment (Figure 23). Response to treatment is assessed after
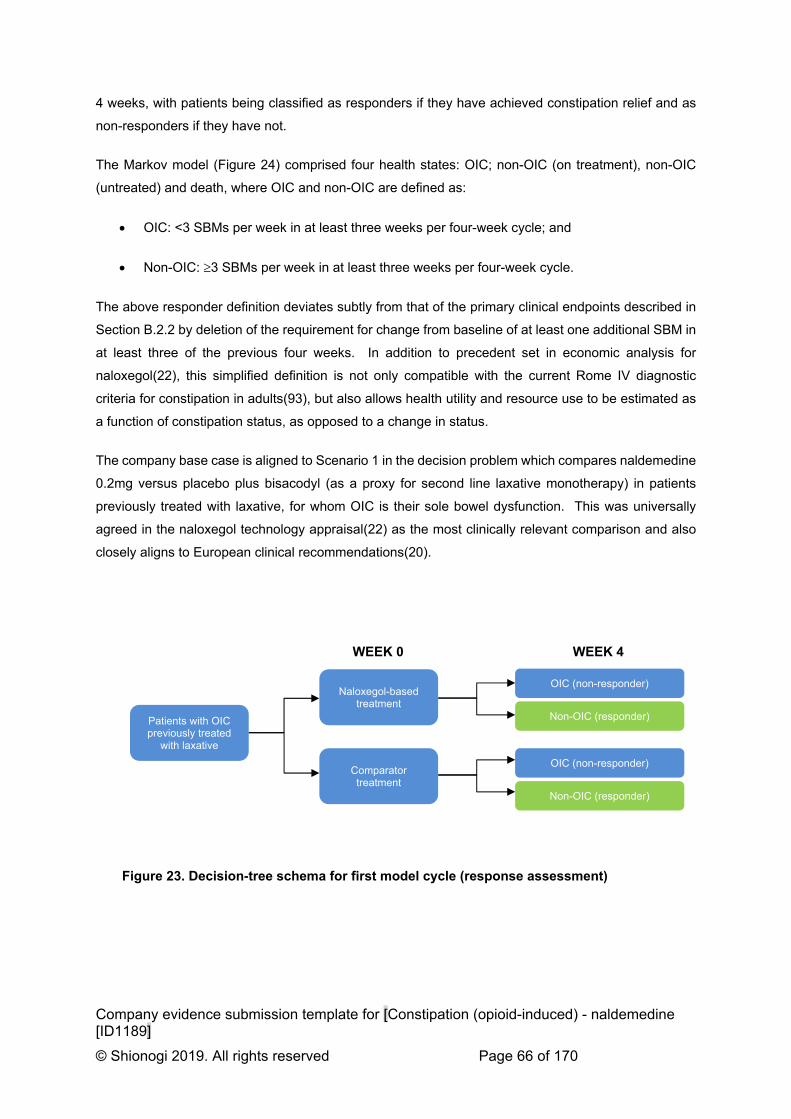
Company evidence submission template for [Constipation (opioid-induced) - naldemedine [ID1189]
© Shionogi 2019. All rights reserved Page 66 of 170
4 weeks, with patients being classified as responders if they have achieved constipation relief and as
non-responders if they have not.
The Markov model (Figure 24) comprised four health states: OIC; non-OIC (on treatment), non-OIC
(untreated) and death, where OIC and non-OIC are defined as:
OIC: <3 SBMs per week in at least three weeks per four-week cycle; and
Non-OIC: 3 SBMs per week in at least three weeks per four-week cycle.
The above responder definition deviates subtly from that of the primary clinical endpoints described in
Section B.2.2 by deletion of the requirement for change from baseline of at least one additional SBM in
at least three of the previous four weeks. In addition to precedent set in economic analysis for
naloxegol(22), this simplified definition is not only compatible with the current Rome IV diagnostic
criteria for constipation in adults(93), but also allows health utility and resource use to be estimated as
a function of constipation status, as opposed to a change in status.
The company base case is aligned to Scenario 1 in the decision problem which compares naldemedine
0.2mg versus placebo plus bisacodyl (as a proxy for second line laxative monotherapy) in patients
previously treated with laxative, for whom OIC is their sole bowel dysfunction. This was universally
agreed in the naloxegol technology appraisal(22) as the most clinically relevant comparison and also
closely aligns to European clinical recommendations(20).
Patients with OIC previously treated
with laxative
Naloxegol-based treatment
OIC (non-responder)
Non-OIC (responder)
Comparator treatment
OIC (non-responder)
WEEK 0 WEEK 4
Non-OIC (responder)
Figure 23. Decision-tree schema for first model cycle (response assessment)

Company evidence submission template for [Constipation (opioid-induced) - naldemedine [ID1189]
© Shionogi 2019. All rights reserved Page 67 of 170
Week 4 response to treatment determines in which health state patients enter the Markov phase of the
model. Responders begin the second cycle in ‘non-OIC (on treatment)’ state whilst non-responders
start in the ‘OIC’ health state, having discontinued their allocated treatment.
Health state transitions
Responders to treatment were conservatively assumed to permanently discontinue treatment from the
second and subsequent cycles at the first re-occurrence of OIC. Scenario analysis of a reverse
transition from OIC to non-OIC on resumption of treatment in the naloxegol submission(22) found
minimal impact on the ICER in any pairwise comparison. The omission of this transition in the present
analysis is also compatible with the NHS’ goal of efficient use of resources and clinical guidelines’
pathway approach to managing OIC(20). Similarly omitted was a transition from non-OIC (on treatment)
to non-OIC(untreated) on the assumption that in the event of spontaneous resolution of the cause of
OIC, the treated patient would be unlikely to detect it. This assumption has previously been shown to
have low impact on health economic conclusions in OIC(22).
The model accounts for the variable nature of OIC by allowing patients to move between the OIC and
non-OIC state, even in the absence of effective treatment.
Constipation in patients with chronic pain has multi-factorial influences, including opioid use, mobility
and diet. As these factors vary, so does the likelihood of remaining constipated. The common view of
clinical experts at an Advisory Board held in September 2018 (Appendix O) was that patients’
experiences of constipation is not stable, and often involves transition between ‘OIC’ and ‘non-OIC’
states over time. This clinical perception is supported by previous analysis of the placebo arms of not
only the naloxegol trial data(22) but also by post hoc of the naldemedine clinical data, both of which
confirm the plausibility of ‘OIC’ to ‘non-OIC’ transitions, (see transitions B and C in section B.3.3). In
this regard the current model addresses the deficiencies of some predecessors that did not allow
temporal variation of the patient experience of OIC(92).
OIC Non-OIC
(on treatment)
Death Non-OIC
(untreated)
A
B
C
Figure 24. Markov model structure from second model cycle

Company evidence submission template for [Constipation (opioid-induced) - naldemedine [ID1189]
© Shionogi 2019. All rights reserved Page 68 of 170
From any of the three Markov health states, non-cancer pain patients may die from any cause at equal
rates specified by UK general population life tables for age and gender(94). In line with other economic
models of OIC treatment(90) it is conservatively assumed that neither constipation status nor related
treatments have an effect on all-cause mortality.
The sources of data informing the transitions described above are discussed in Section B.3.3.
Table 23. Features of the economic analysis
Previous appraisals Current appraisal
Factor TA318
(lubiprostone)
TA345
(naloxegol)
TA468 (methylnaltrexone)
Chosen values
Justification
Time horizon Withdrawn 5 years Terminated 5 years Equivalent to the 90th centile of duration of prescribed opioid use in patients with non-cancer chronic pain (CPRD study)
Treatment waning effect?
Loss of effect extrapolated from survival analysis of 12-week pivotal RCTs
Loss of effect (transition A) extrapolated from survival analysis of both 12-week pivotal RCTs and 52-week RCT
Availability of 52-week RCT data permits validation of extrapolation from 12-week efficacy studies.
Source of utilities Direct EQ-5D from pivotal RCTs
- Treatment-specific utility from TA345
- Health-state specific utility from TA345
- Health-state specific utility from mapping of SF-36 responses to EQ-5D in COMPOSE-1 & -2
- SF-36 relatively insensitive to changes in OIC-related HRQoL
- evidence of additional treatment benefit among responders not captured by binary response definition
Source of costs GP Omnibus survey of OIC
Longitudinal study of constipation and related resource use in chronic opioid users in CPRD.
Observed resource use in target clinical population closer to NICE reference case than that perceived by physicians.
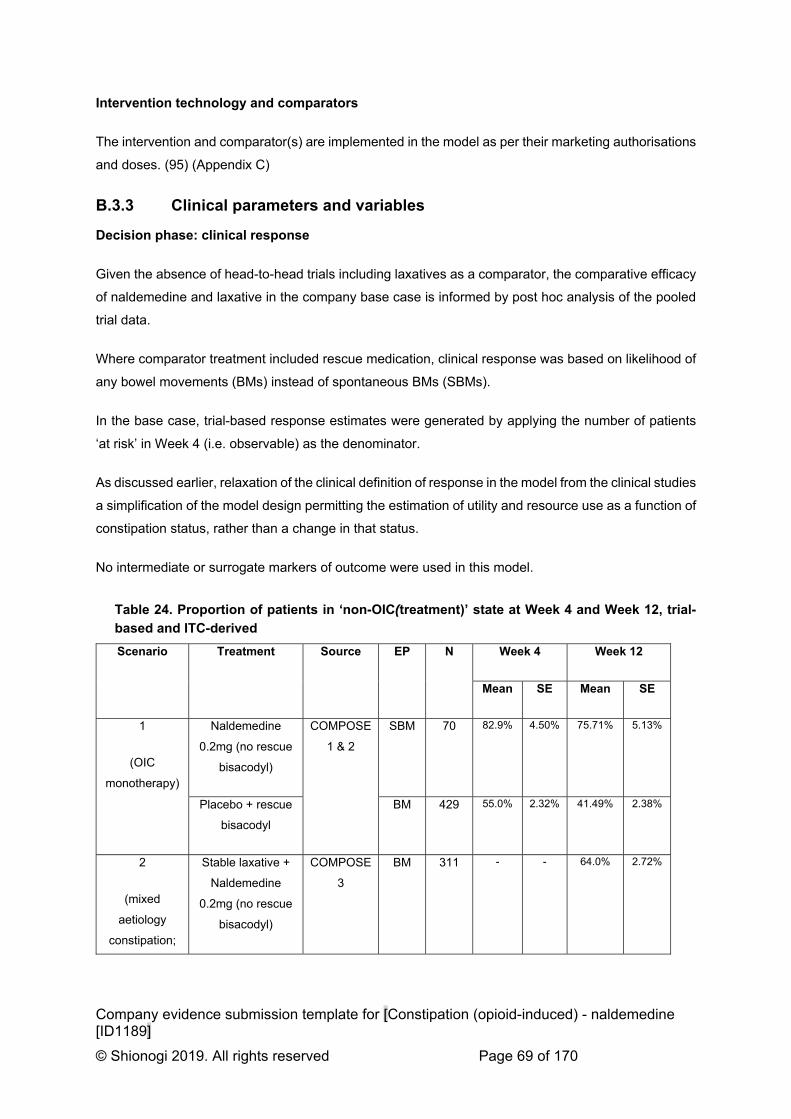
Company evidence submission template for [Constipation (opioid-induced) - naldemedine [ID1189]
© Shionogi 2019. All rights reserved Page 69 of 170
Intervention technology and comparators
The intervention and comparator(s) are implemented in the model as per their marketing authorisations
and doses. (95) (Appendix C)
B.3.3 Clinical parameters and variables
Decision phase: clinical response
Given the absence of head-to-head trials including laxatives as a comparator, the comparative efficacy
of naldemedine and laxative in the company base case is informed by post hoc analysis of the pooled
trial data.
Where comparator treatment included rescue medication, clinical response was based on likelihood of
any bowel movements (BMs) instead of spontaneous BMs (SBMs).
In the base case, trial-based response estimates were generated by applying the number of patients
‘at risk’ in Week 4 (i.e. observable) as the denominator.
As discussed earlier, relaxation of the clinical definition of response in the model from the clinical studies
a simplification of the model design permitting the estimation of utility and resource use as a function of
constipation status, rather than a change in that status.
No intermediate or surrogate markers of outcome were used in this model.
Table 24. Proportion of patients in ‘non-OIC(treatment)’ state at Week 4 and Week 12, trial-
based and ITC-derived
Scenario Treatment Source EP N Week 4 Week 12
Mean SE Mean SE
1
(OIC
monotherapy)
Naldemedine
0.2mg (no rescue
bisacodyl)
COMPOSE
1 & 2
SBM 70 82.9% 4.50% 75.71% 5.13%
Placebo + rescue
bisacodyl
BM 429 55.0% 2.32% 41.49% 2.38%
2
(mixed
aetiology
constipation;
Stable laxative +
Naldemedine
0.2mg (no rescue
bisacodyl)
COMPOSE
3
BM 311 - - 64.0% 2.72%

Company evidence submission template for [Constipation (opioid-induced) - naldemedine [ID1189]
© Shionogi 2019. All rights reserved Page 70 of 170
combination
therapy)
Stable laxative +
placebo + rescue
bisacodyl
BM 335 - - 51.3% 2.73%
3
(OIC
monotherapy;
LIR)
Naldemedine
0.2mg
ITC SBM 30 90.0% 5.50% - -
Naloxegol 25mg SBM §215 68.8% 1.63% - -
Key: § - estimated from published SE
Maintenance phase: health state transitions
Transition A. Loss of response (‘non-OIC[treatment]’ to ‘OIC’).
A survival approach has been used to generate estimates of transition A, consistent (where possible)
with the corresponding source data for clinical response in each scenario.
The base case model (Scenario 1) used the log normal function to extrapolate response over a period
of 5 years. Weekly observations of OIC status in those responding to either naldemedine or placebo
recorded between Weeks 4 and 12 in the pooled COMPOSE 1 & 2 data were used to derive a ‘best-fit’
parametric survival model, from which transition probabilities were calculated from Week 4 onwards.
An event was defined as the first OIC week after Week 4 in those deemed to be treatment responders
at Week 4. Patients with less than 12 weeks’ treatment exposure data were censored at the nearest
week following the last known day of exposure to treatment. Censoring reasons included
discontinuation, loss to follow-up and all-cause mortality, which was modelled separately.
The 5-year time horizon corresponds to the 90th centile of prescribed opioid use in study of chronic non-
cancer diagnosed users from a large representative sample of UK primary care data (CPRD study,
Appendix M). Not only is this horizon consistent with the majority of chronic opioid user experience but
also the model reaches a steady state within this period.
Goodness of fit was assessed by:
Visual inspection of the correspondence between observed (Kaplan-Meier plots) and predicted
responders;
Diagnostic plots associated with each of the distributions under consideration; (Appendix J)
Comparison of the Akaike’s Information Criteria (AIC) and Bayesian Information Criterion (BIC)
with lower values indicating better fit.
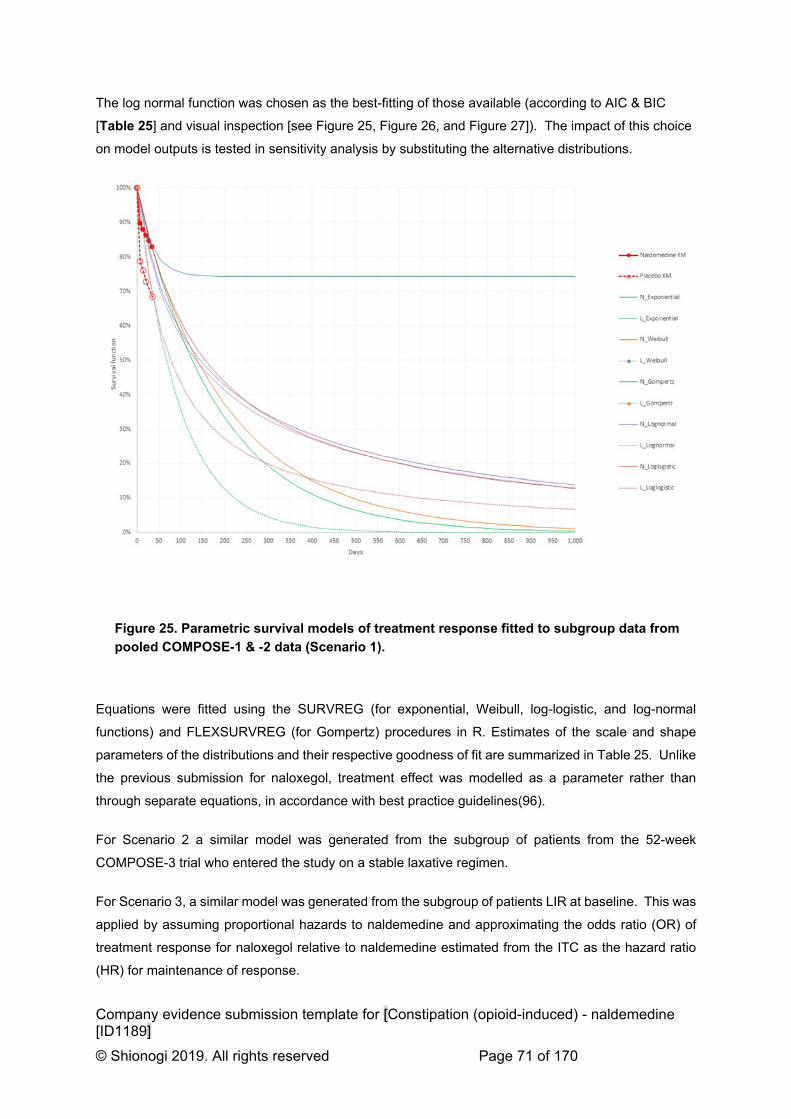
Company evidence submission template for [Constipation (opioid-induced) - naldemedine [ID1189]
© Shionogi 2019. All rights reserved Page 71 of 170
The log normal function was chosen as the best-fitting of those available (according to AIC & BIC
[Table 25] and visual inspection [see Figure 25, Figure 26, and Figure 27]). The impact of this choice
on model outputs is tested in sensitivity analysis by substituting the alternative distributions.
Figure 25. Parametric survival models of treatment response fitted to subgroup data from
pooled COMPOSE-1 & -2 data (Scenario 1).
Equations were fitted using the SURVREG (for exponential, Weibull, log-logistic, and log-normal
functions) and FLEXSURVREG (for Gompertz) procedures in R. Estimates of the scale and shape
parameters of the distributions and their respective goodness of fit are summarized in Table 25. Unlike
the previous submission for naloxegol, treatment effect was modelled as a parameter rather than
through separate equations, in accordance with best practice guidelines(96).
For Scenario 2 a similar model was generated from the subgroup of patients from the 52-week
COMPOSE-3 trial who entered the study on a stable laxative regimen.
For Scenario 3, a similar model was generated from the subgroup of patients LIR at baseline. This was
applied by assuming proportional hazards to naldemedine and approximating the odds ratio (OR) of
treatment response for naloxegol relative to naldemedine estimated from the ITC as the hazard ratio
(HR) for maintenance of response.

Company evidence submission template for [Constipation (opioid-induced) - naldemedine [ID1189]
© Shionogi 2019. All rights reserved Page 72 of 170
Table 25. Functions used to estimate transition A (Week 4 onwards)
Function Exponential Weibull Log-logistic Log-normal Gompertz
Scenario 1: COMPOSE 1&2
Intercept 4.5692 4.6410 4.3412 4.4168 4.1354
Treatment 0.6348 0.6720 0.7057 0.6657 0.6203
Scale 1.0639 0.9710 1.6974
Shape 0.9400
AIC 629.31 631.07 628.69 622.20 626.68
BIC 636.01 641.12 638.74 632.25 636.73
Scenario 2: COMPOSE 3 (stable laxative)
Intercept 6.3651 6.0670 5.8739 5.9273 6.8955
Treatment 0.8430 0.5593 0.5908 0.5796 0.8650
Scale 0.6406 0.5835 1.0443
Shape 1.5611
AIC 851.26 842.79 841.73 837.73 848.15
BIC 857.84 852.67 851.61 847.61 858.03
Scenario 3: COMPOSE 1&2 (LIR population)
Intercept 4.9341 4.9802 4.7575 4.9045 4.5870
Treatment 0.0786 0.0812 0.0785 0.0688 0.0796
Scale 1.0318 0.9675 1.7754
Shape 0.9692
AIC 506.08 508.03 506.92 502.33 505.99
BIC 512.68 517.94 516.83 512.24 515.90

Company evidence submission template for [Constipation (opioid-induced) - naldemedine [ID1189]
© Shionogi 2019. All rights reserved Page 73 of 170
Figure 26. Parametric survival models of treatment response fitted to stable laxative
subgroup data from COMPOSE-3 (Scenario 2)
Figure 27. Parametric survival models of treatment response fitted to LIR subgroup from
pooled COMPOSE-1 & -2 data (Scenario 3)

Company evidence submission template for [Constipation (opioid-induced) - naldemedine [ID1189]
© Shionogi 2019. All rights reserved Page 74 of 170
Transitions B & C. Disease fluctuation (between ‘OIC’ and ‘non-OIC [untreated]’)
To model bi-directional transition between the untreated ‘OIC’ and ‘non-OIC’ states patients in the
placebo arm of the COMPOSE-1, -2, and -3 trials were analysed. Placebo data was chosen as fairly
representing the ‘untreated’ states and were used across all treatments included in the model.
Transition B. (‘OIC’ to ‘non-OIC[untreated]’)
From index, that is entry to the ‘OIC’ state at either at Week 4 (as a non-responder) or the first
subsequent week (having lost response) patients were followed until the next observed week became
non-OIC.
Transition C. (‘non-OIC[untreated]’ to ‘OIC’)
From index, that is entry to ‘non-OIC state’ either at Week 4 or the first subsequent week constipation
had resolved, patients were followed the next observed week that OIC recurred.
In either case the numerators (events) and denominators (number at risk) for each transition were used
to compute 4-week transition probabilities utilised in the economic model (see Table 26).
Table 26. Disease fluctuation (between ‘OIC’ and ‘non-OIC[untreated]’)
Mean SE
Scenario 1: COMPOSE 1&2, placebo (no rescue)
Transition B (OIC to non-OIC[untreated]) 18.2% 2.2%
Transition C (non-OIC[untreated] to OIC) 21.3% 3.3%
Scenario 2: COMPOSE 3, stable laxative + placebo (no rescue)
Transition B 20.6% 3.2%
Transition C 35.5% 3.6%
Scenario 3: COMPOSE 1&2, placebo (no rescue)
Transition B 26.8% 4.5%
Transition C 13.8% 3.7%
Company evidence submission template for [Constipation (opioid-induced) - naldemedine [ID1189]
© Shionogi 2019. All rights reserved Page 75 of 170
All-cause mortality
The same mortality rate, based on the UK general population, was applied to all health states. Mortality
was calculated based on UK life table for the years 2015 to 2017(94) weighted by not only average
cohort age at baseline but also gender distribution of the clinical cohorts modelled. The exponential
function was used to calculate cycle probability of mortality from published annual probability.
Neither treatment selected nor constipation health states were expected to have an impact on mortality.
B.3.4 Measurement and valuation of health effects
Health-related quality-of-life data from clinical trials
The COMPOSE clinical trial programme deployed two instruments for assessing quality of life (QoL);
the PAC-QOL disease-specific questionnaire(97) and the SF-36(v2) generic health-related QoL
tool(98), as summarised in Table 27.
All studies of at least 12 weeks duration found consistent and statistically significant improvements in
PAC-QOL for naldemedine-treated patients not only from baseline, but also over placebo where the
difference was measured (see Table 27 summary, Appendix H detail, and published findings (2,4,6)).
Of note, is the maintenance of QoL benefit for naldemedine-treated patients over placebo observed
from week 4 to week 52 in the COMPOSE-3 long-term safety study(2). These findings are supported
by those of long-term open-label studies of naldemedine(6).
By contrast, neither the COMPOSE-1 nor -2 RCT observed any consistent QoL benefit measurable in
the domains of the SF-361 (see Table 27 summary and Appendix H detail). This supports prior
observations that SF-36 is relatively insensitive to capturing the QoL impact of opioid induced
constipation(99).
1 A statistically significant (but clinically insignificant) difference in change from baseline in the Mental Domain
was observed in COMPOSE-1 but not in COMPOSE-2

Company evidence submission template for [Constipation (opioid-induced) - naldemedine [ID1189]
© Shionogi 2019. All rights reserved Page 76 of 170
Table 27. Summary of quality of life measurements in clinical trial programme
To further test this hypothesis we applied preference-based utility weights to SF-6D health states
derived from the subset of SF-36 responses using the method described by Brazier(100). We used the
non-parametric Bayesian-derived preference weights, shown to have better predictive ability and
reduced floor effects compared to the original parametric method(101,102).
Candidate determinants of SF-6D utility were assessed by a repeated measures mixed model including
constipation status2, treatment allocation, time point (Table 28). Adjusting for time, treatment, and their
interaction term, OIC status was associated with a statistically significant disutility of 0.023, though
somewhat less than the reported minimally important difference for SF-6D of 0.041(103,104).
2 Either OIC, <3S/BMs per week in at least three of the preceding four weeks; or non-OIC, 3S/BMs over same
period
Visit 2 Visit 4 Visit 5 Visit 7
Day 1 Week 2 Week 4 Week 12
PAC-QOL X ***† ***† ***†X
SF-36 X NS (MH*) X
PAC-QOL X ***† ***† **†X
SF-36 X NS X
Visit 2 Visit 4 Visit 6 Visit 8 Visit 10 Visit 13
Day 1 Week 2 Week 12 Week 24 Week 36 Week 52
PAC-QOL X ***† ***† ***† ***† ***†X CSR, Table 9-2
Visit 2 Visit 4
Day 1 Day 15
PAC-QOL X T†X CSR, Table 9-6
Visit 4 Visit 5 Visit 6 Visit 7 Visit 8
Day 1 Day 15 Day 29 Day 57 Day 85
PAC-QOL (***‡) ***‡ ***‡ ***‡ ***‡ CSR, Table 9-5
ETV - Early Termination VisitX - measured; MH - mental health domain*** - p<0.0001; ** - p<0.01; * - p<0.05; T - p<0.1; NS - p>0.1;† - naldemedine vs placebo; ‡ - endpoint versus baseline
COMPOSE 4
ETV
COMPOSE 5
CSR, Table 9-2
COMPOSE 3
CSR, Table 9-2
COMPOSE 1
COMPOSE 2
ETV
ETV
Source

Company evidence submission template for [Constipation (opioid-induced) - naldemedine [ID1189]
© Shionogi 2019. All rights reserved Page 77 of 170
Table 28. Repeated measures mixed model of determinants of SF-6D utility in pooled
COMPOSE-1 & -2 dataset
Estimate SE p
Intercept 0.534 0.0053
<0.0001
Time (Week 12 vs Baseline) 0.009 0.0058 0.1417
Treatment (naldemedine vs placebo) 0.001 0.0075 0.8581
Health state (non-OIC vs OIC) 0.023 0.0062 0.0002
Interaction (Treatment*Time; Naldemedine at week 12 vs other) 0.007 0.0070 0.3043
Given that:
SF-36 domains appear relatively insensitive to change in bowel function status;
SF-6D utility appears insensitive to health status, widely acknowledged to have a
considerable impact on patient QoL; and that
SF-6D lies outwith the NICE reference case for economic analyses,
an empiric decision was made to exclude observed SF-6D utilities from the economic analysis.
Mapping
The SF-12 subset of SF-36 responses were used to predict EQ-5D-3L responses using the response
mapping algorithm developed by Rivero-Arias et al(105). A response mapping algorithm was chosen
as not only do item-based models perform better than those based on summary scores(106) but also
the response method can be implemented to country-specific EQ-5D data with available value sets.
Table 29. Repeated measures mixed model of determinants of mapped EQ-5D utility in pooled
COMPOSE-1 & -2 dataset
Estimate SE p
Intercept 0.470 0.0122 <0.0001
Time (Week 12 vs Baseline) 0.014 0.0123 0.2468
Treatment (naldemedine vs placebo) 0.0002 0.0172 0.9888
Health state (non-OIC vs OIC) 0.040 0.0135 0.0031
Interaction (Treatment*Time; Naldemedine at week 12 vs other) 0.022 0.0148 0.1357
Whilst health state is a statistically significant determinant of mapped EQ-5D utility, neither time nor
treatment (nor their interaction) are. Assuming the parameter estimate to be equivalent to the disutility
of OIC, the observed value of 0.040 is substantially lower than equivalent values published in TA345
Company evidence submission template for [Constipation (opioid-induced) - naldemedine [ID1189]
© Shionogi 2019. All rights reserved Page 78 of 170
(0.066util), providing additional evidence that SF-36 is insensitive to changes in disease-related HRQoL
in OIC.
Health-related quality-of-life studies
Burden of illness
Despite its high prevalence, opioid-induced constipation (OIC) remains under-recognised and
undertreated, and its true impact on wellbeing and quality of life (QoL) may be underestimated. The
most representative current data from a very large multinational survey of adult opioid-analgesic users
in five European countries shows that both weak- and strong-opioid users suffer comparable bother
and decreased QoL from OIC(23). The majority of opioid users reported a preference not to reduce
opioid medication to relieve constipation, yet 40% admitted often doing so, by either decreasing their
doses or frequency of dosing.
These findings are replicated in other observational studies. A decade earlier, Bell et al found that one-
third of US and European opioid-users surveyed reported having either missed, decreased, or stopped
using opioids in order to make it easier to have a bowel movement(14). Consequently, the vast majority
(92%) of patients exhibiting constipation-driven opioid non-adherence also reported increased pain
which had a moderate to great impact on their QoL. In a recent [primarily] UK sample of patients with
cancer pain and OIC, more than forty percent reported that constipation either moderately or completely
interfered with the ability of their opioid medication to control pain(107).
Preference weights
Despite more than a dozen studies reporting societal preference associated with OIC (see Table 31),
few meet the NICE reference case, and a consistent estimate is elusive.
The most recent data arise from TA345, the appraisal of naloxegol for OIC in laxative inadequate
responders(22,90). The company base case rested on a post hoc repeated measures analysis of EQ-
5D data from the KODIAC-4 & -5 studies showing a treatment*time interaction favouring naloxegol
users from week 12 onwards. As applied in the model, from week 12 (cycle 3) onwards responders to
naloxegol (non-OIC[naloxegol]) accrued not only health benefit of 0.112util over non-responders (OIC)
but also an additional benefit over responders to placebo (non-OIC[placebo]) of 0.052util. The given
explanation of health gain mediated outside the state transitions was that naloxegol responders
(nonOIC) in the pivotal studies had not only higher SBMs on average at week 12 but also a greater
change from baseline (approximately +1SBM) than placebo responders.
Removal of the treatment*time interaction resulted in treatment specific utilities of 0.642 for
nonOIC[naloxegol], 0.613 for nonOIC[placebo] and nonOIC[untreated], and 0.553 for OIC, applied in
sensitivity analysis.

Company evidence submission template for [Constipation (opioid-induced) - naldemedine [ID1189]
© Shionogi 2019. All rights reserved Page 79 of 170
In comparison with naloxone-oxycodone and (sc)methylnaltrexone health-state specific utilities were
calculated; 0.630 for non-OIC and 0.564 for OIC – a disutility of 0.066.
The most comparable literature value has recently been reported from Study 1033, a 12-week, double-
blind, randomised study of lubiprostone versus placebo in patients with OIC and chronic non-cancer-
related pain(108). At end-of-treatment visit, patients with 3SBMs per week had an EQ-5D-3L utility of
0.463 while those with <3SBMs reported 0.395util on average; a disutility for OIC of 0.068.
Further literature comparisons are limited by imprecise definitions of constipation. In a community
pharmacy sample of Dutch opioid users(109), those reporting current constipation expressed3 a mean
EQ-5D index utility of 0.423 while versus 0.516 in those not constipated; a disutility for self-reported
constipation of 0.093.
Using standard gamble elicitation, Guest et al reported the preferences of a UK opportunity sample for
constipation-related health states(110); 0.90 for well-managed constipation and 0.74 for symptomatic
constipation; a disutility of 0.16.
Adherence to the reference case
The EQ-5D health state utilities estimated by response mapping from SF-36 data in the COMPOSE-1
& -2 studies suggest a disutility of 0.040, considerably lower than the disutility observed in the naloxegol
and lubiprostone studies for similarly defined health states (</3SBMs per week), of 0.066 and 0.068
respectively. Given the observed insensitivity of SF-36 to change in disease-specific QoL this is to be
expected, and therefore the measurable disutility observed in the naldemedine trials can reasonably be
described as an underestimate of the true disutility associated with OIC.
The plausibility of treatment-specific utilities in TA345 accounting for heterogeneity within the non-
OIC[treated] states(22) suggests that health-state specific utilities in a binary model are also unable
capture the full health benefits of treatment. A pooled analysis of COMPOSE-1 & -2 non-OIC patients
at Week 12 (Table 30) shows a near identical difference between naldemedine and placebo as reported
between naloxegol and placebo in TA345(22), suggesting a reasonable case for imputation of
treatment-specific direct EQ-5D utilities from naloxegol to naldemedine.
3 Estimated post hoc from the reported distributions of EQ-5D.

Company evidence submission template for [Constipation (opioid-induced) - naldemedine [ID1189]
© Shionogi 2019. All rights reserved Page 80 of 170
Table 30. Pooled analysis of Week 12 non-OIC patients in COMPOSE-1 & -2
Mean #SBMs (sd) Mean cfb SBMs (sd)
Naldemedine 6.39 (3.17) ***5.1 (3.16)
Placebo 5.48 (2.38) 4.19 (2.48)
*** p<0.001; cfb, change from baseline

Company evidence submission template for [Constipation (opioid-induced) - naldemedine [ID1189]
© Shionogi 2019. All rights reserved Page 81 of 170
Table 31. Summary of health-related quality-of-life studies reporting constipation status and utility
Study Year Country Population Intervention Method Health state N Characteristics
Utility
mean [median] SD (SE) [IQR] {CI}
Greiner
(111) 2006 Germany
Moderate to
severe, non-
malignant, chronic
pain
Alternative
opioids
Conjoint
analysis
Constipation
(mild) NR NR (disutility) 0.086 {0.083;0.091}
Constipation
(severe) NR NR (disutility) 0.165 {0.149;0.184}
Guest
(110) 2008 UK
General public
opportunity sample None
Standard
gamble for
health states
Successful
treatment
308 53% male
63.8 (9.8) years
1.00 NR
Well managed
constipation 0.90 {0.88;0.93}
Symptomatic
constipation 0.74 {0.71;0.75}
Van der
Linden
(112)
2008 Netherlands Cancer patients
receiving opioids in
public pharmacies
Unspecified
opioids
EQ-5D index Constipated 75 44% male
66.1 (9.8) years
[0.39] [0.19 to 0.69]
Not
constipated
38 50% male
63.8 (12.6) years [0.63] [0.30 to 0.78]
Iyer (113) 2009 USA Chronic non-
malignant pain with
opioid-induced
constipation
MNTX QD EQ-5D index
Baseline
469
40% male
49 years
222mg morph/day
0.45 0.33
Day 14 (cfb) 0.04 (0.02)
Day 28 (cfb) *0.08 NR

Company evidence submission template for [Constipation (opioid-induced) - naldemedine [ID1189]
© Shionogi 2019. All rights reserved Page 82 of 170
(>50 mg oral
morphine
equivalents/day) MNTX QOD
Baseline 0.47 0.33
Day 14 (cfb) 0.06 (0.02)
Day 28 (cfb) *0.08 NR
Placebo
Baseline 0.44 0.33
Day 14 (cfb) 0.02 (0.02)
Day 28 (cfb) -0.01 NR
Guijarro,
Viquera
(114)
2010 Spain Recipients of
opioids for at least
2 months prior to
study entry‡
Unspecified
opioids
CVE-20 Patients with
opioids at least
2 months and
OIC
NR NR
48.0 18.6
EQ-5D VAS 51.3 19.3
EQ-5D VAS
tariff 0.45 0.25
EQ-5D TE
tariff 0.38 0.40
CVE-20
LX responders ***50.8
NR LX non-
responders 40.6
EQ-5D VAS
LX responders **53.0 18.9
LX non-
responders 45.5 18.4
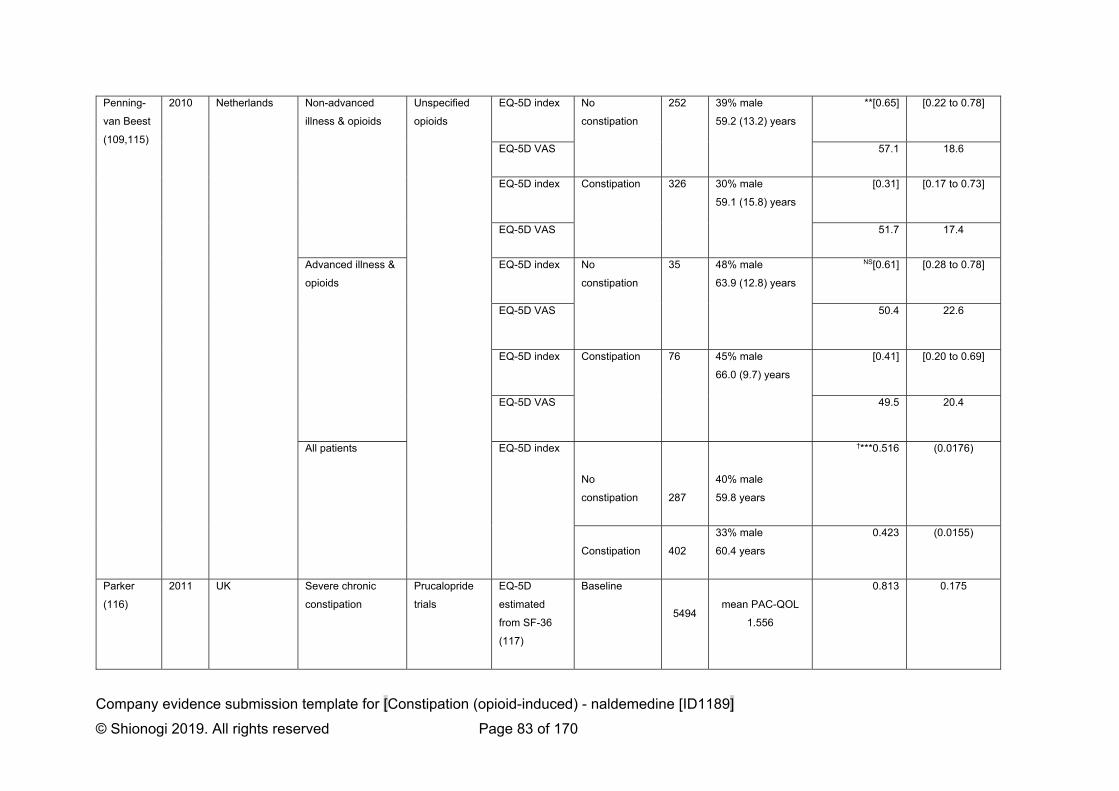
Company evidence submission template for [Constipation (opioid-induced) - naldemedine [ID1189]
© Shionogi 2019. All rights reserved Page 83 of 170
Penning-
van Beest
(109,115)
2010 Netherlands Non-advanced
illness & opioids
Unspecified
opioids
EQ-5D index No
constipation
252 39% male
59.2 (13.2) years
**[0.65] [0.22 to 0.78]
EQ-5D VAS 57.1 18.6
EQ-5D index Constipation 326 30% male
59.1 (15.8) years
[0.31] [0.17 to 0.73]
EQ-5D VAS 51.7 17.4
Advanced illness &
opioids
EQ-5D index No
constipation
35 48% male
63.9 (12.8) years
NS[0.61] [0.28 to 0.78]
EQ-5D VAS 50.4 22.6
EQ-5D index Constipation 76 45% male
66.0 (9.7) years
[0.41] [0.20 to 0.69]
EQ-5D VAS 49.5 20.4
All patients EQ-5D index
No
constipation 287
40% male
59.8 years
†***0.516 (0.0176)
Constipation 402
33% male
60.4 years
0.423 (0.0155)
Parker
(116)
2011 UK Severe chronic
constipation
Prucalopride
trials
EQ-5D
estimated
from SF-36
(117)
Baseline
5494 mean PAC-QOL
1.556
0.813 0.175
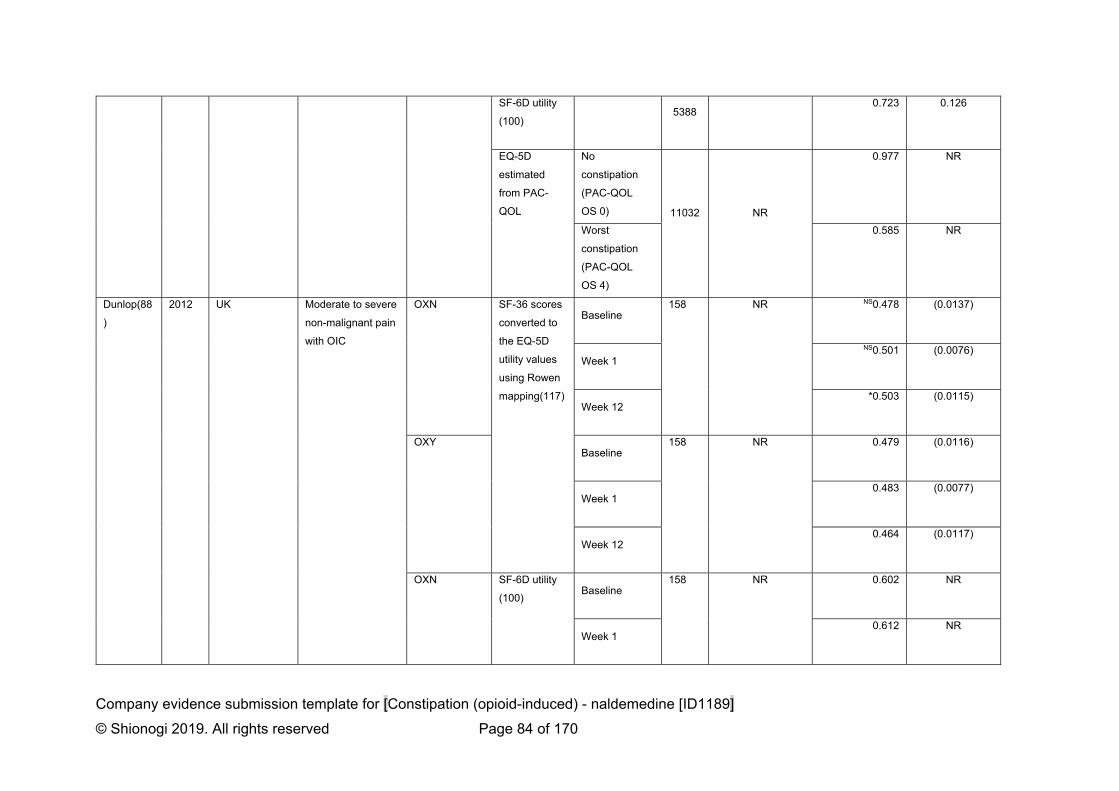
Company evidence submission template for [Constipation (opioid-induced) - naldemedine [ID1189]
© Shionogi 2019. All rights reserved Page 84 of 170
SF-6D utility
(100) 5388
0.723 0.126
EQ-5D
estimated
from PAC-
QOL
No
constipation
(PAC-QOL
OS 0) 11032 NR
0.977 NR
Worst
constipation
(PAC-QOL
OS 4)
0.585 NR
Dunlop(88
)
2012 UK Moderate to severe
non-malignant pain
with OIC
OXN SF-36 scores
converted to
the EQ-5D
utility values
using Rowen
mapping(117)
Baseline 158 NR NS0.478 (0.0137)
Week 1
NS0.501 (0.0076)
Week 12 *0.503 (0.0115)
OXY Baseline
158 NR 0.479 (0.0116)
Week 1 0.483 (0.0077)
Week 12 0.464 (0.0117)
OXN SF-6D utility
(100) Baseline
158 NR 0.602 NR
Week 1 0.612 NR

Company evidence submission template for [Constipation (opioid-induced) - naldemedine [ID1189]
© Shionogi 2019. All rights reserved Page 85 of 170
Week 12 0.619 NR
OXY Baseline
158 NR 0.598 NR
Week 1 0.596 NR
Week 12 0.587 NR
Dunlop
(87)
2013 UK Patients with
moderate to severe
pain and OIC
having failed on ≥2
laxatives
OXN vs OXY Bowel
Function
Index scores
mapped to
EQ-5D utility
w/ constipation 178 NR 0.31 NR
w/o
constipation
0.65 NR
TA345
(22)
2015 UK OIC for chronic
non-cancer-related
pain
EQ-5D index
(treatment-
time specific)
(see Lawson 2017)
Naloxegol EQ-5D index
(treatment-
specific)
non-OIC (see Lawson 2017) 0.642 (0.018)
Placebo non-OIC 0.613 (0.021)
Untreated OIC 0.553 (0.022)
Non-OIC 0.613 (0.021)
NLX vs PLB EQ-5D index
(health state
specific)
Non-OIC (see Lawson 2017) 0.630 (0.017)
OIC 0.564 (0.014)

Company evidence submission template for [Constipation (opioid-induced) - naldemedine [ID1189]
© Shionogi 2019. All rights reserved Page 86 of 170
Hatswell
(118)
2016 Multi-country OIC for chronic
non-cancer-related
pain
Lubiprostone
vs PLB
EQ-5D-3L
utility at EOT
≥3 SBMs per
week
191 37% male
51.7 (11.0) years
*0.463 0.356
<3 SBMs per
week
149 0.395 0.335
Lawson
(90)
2017 UK OIC for chronic
non-cancer-related
pain
Naloxegol EQ-5D index non-OIC, 4
weeks
KOD-4
641
KOD-5
696
(119)
KOD-4
38.7% male
52.4 (10.2) years
KOD-5
36.6% male
52.2 (11.5) years
0.620 (0.025)
non-OIC, 12
weeks
0.665 (0.026)
Placebo non-OIC 0.613 (0.021)
Untreated OIC 0.553 (0.022)
non-OIC 0.613 (0.021)

Company evidence submission template for [Constipation (opioid-induced) - naldemedine [ID1189]
© Shionogi 2019. All rights reserved Page 87 of 170
Further reason to suspect that health benefits associated with successful OIC treatment may not be
fully captured, is prompted by comparing the stable trajectory of opioid use within the COMPOSE-1 & -
2 studies with self-reported non-adherence by patients. The naldemedine RCTs dictated that subjects
had to have been treated with a stable opioid regimen at least 1 month prior to Screening, with no
anticipated changes in the overall opioid regimen throughout the study. Whilst, this design element
increased the efficiency of the trials to detect a treatment-effect it may have precluded their ability to
document disease-effects on opioid usage, pain, and QoL.
Adverse reactions
No direct estimates of the impact of AEs on utility were available to be included in the model. Clinicians
(Appendix O) advised that AEs were unlikely to have a significant impact on the HRQL.
This assumption is supported by network meta-analysis of 12-week safety outcomes for naldemedine
in COMPOSE-1, -2, & -3 with those of naloxegol 25mg OD in KODIAC-4 & -5, showing no statistically
significant differences (see section B.2.; all-cause discontinuation, and discontinuation due to AEs).
Additionally, indirect treatment comparison of AEs observed over 52 weeks in either COMPOSE-3 or
KODIAC-8 showed no statistically significant differences between naldemedine and naloxegol 25mg in
any of: serious AEs; diarrhoea; abdominal pain; nausea; vomiting; and all-cause discontinuation.
Significant 52-week differences favouring naldemedine over naloxegol 25mg were found for flatulence
(RR 0.10 [95%CI 0.03 to 0.41]); discontinuation due to AEs (0.19 [0.07,0.52]); and overall AEs (0.84
[0.75,0.94]).
Health-related quality-of-life data used in the cost-effectiveness analysis
In the absence of directly observed EQ-5D utility from the clinical trials program for naldemedine and
having demonstrated the relative insensitivity of SF-36 to capture disease-specific impairment of QoL
arising from OIC, the company base case imputes the utility values from the company submission for
TA345.
In the case of Scenarios 1 & 2, treatment-specific utilities are deployed on the basis that naldemedine-
treated responders have a greater change from baseline than placebo-treated responders in
COMPOSE-1 & -2. As the analysis of PAC-QOL in COMPOSE-3(2) shows no ‘wearing-off’ of the
difference between naldemedine and placebo over 52 weeks, the model assumes a persistent
treatment benefit.
In Scenario 3, the model deploys the same treatment specific utilities imputed from the manufacturer
submission in TA345, on the assumption that naldemedine and naloxegol responders exhibit similar
change from baseline in weekly SBMs.

Company evidence submission template for [Constipation (opioid-induced) - naldemedine [ID1189]
© Shionogi 2019. All rights reserved Page 88 of 170
Table 32. Summary of utility values for cost-effectiveness analysis
State Utility value: mean (standard error)
95% confidence interval
Reference in submission (section and page number)
Justification
SCENARIOS 1 & 2 (base case)
Non-OIC(naldemedine) 0.642 (0.018) (0.607, 0.678) Page 85 - No direct EQ-5D utility from COMPOSE programme
- Similarity of patient populations
Non-OIC(placebo) 0.613 (0.021) (0.573, 0.655)
Non-OIC(untreated) 0.613 (0.021) (0.573, 0.655)
OIC 0.553 (0.022) (0.511, 0.597)
SCENARIO 3 (base case)
Non-OIC(treated) 0.642 (0.018) (0.607, 0.678) Page 85 - As above
- Similarity in SBM cfb for NLD & NLX over PLB
Non-OIC(untreated) 0.613 (0.021) (0.573, 0.655)
OIC 0.553 (0.022) (0.511, 0.597)
SCENARIOS 1, 2, & 3 (reference case)
Non-OIC 0.630 (0.014) (0.603, 0.658) Page 86 - As above
OIC 0.564 (0.017) (0.531, 0.598)
In separate sensitivity analysis to examine the effect of treatment-specific utility gain, health-state
specific utilities as reported in TA345 are substituted as are those estimated from response mapping
SF-36 to EQ-5D-3L.
B.3.5 Cost and healthcare resource use identification, measurement and
valuation
Comparator costs and health state resource use were derived from an analysis of anonymised
patient-level electronic health record data sourced from the Clinical Practice Research Datalink
(CPRD), linking primary care data with that from the Hospital Episode Statistics (HES) database to
allow more complete characterisation of resource use across care sectors. A full description is
provided in Appendix M.
Patients were selected for study if:
1. They were HES eligible during their period of observation (i.e. had they incurred secondary
care resources it would be detected);
2. They had no diagnosis of constipation in the 90 days prior to their first opioid prescription; and
3. They had no diagnosis of cancer during their period of observation.
Among these patients, an index date was set at either the first diagnosis of constipation or the first
prescription for a laxative during their opioid-treatment episode. Patients were followed from their
index date to the end of their first opioid analgesic episode.

Company evidence submission template for [Constipation (opioid-induced) - naldemedine [ID1189]
© Shionogi 2019. All rights reserved Page 89 of 170
During their period of observation, their use of prescribed treatments for constipation, as well as their
use of primary care and secondary care resources was characterised.
Given that CPRD has been shown to be representative of the UK population(120), health resource use
estimates for the selected population were assumed to be representative, therefore no systematic
review of the literature was undertaken.
Intervention and comparators’ costs and resource use
The intervention and comparator costs are summarised in Table 33.
In Scenario 1, the model assumes treatment acquisition costs of naldemedine monotherapy (£41.72)
versus the weighted cost of second-line laxative monotherapy standard of care (SoC; £4.65; see
Appendix M). The SoC weighted costs were calculated by multiplying the daily NHS costs of each
laxative (identified by international normalised nomenclature [INN];(121)) by their respective proportions
observed in the CPRD analysis.
In Scenario 2, the model assumes naldemedine is added to existing first-line laxative monotherapy
(£4.35; see Appendix M) versus the cost of second-line combination laxative therapy SoC (£5.84).
Scenario 3 assumes that naldemedine and naloxegol are used in monotherapy (£41.72 versus £51.52
respectively).
In all scenarios, following discontinuation of assigned treatment, patients move to last line therapy
assumed to be equivalent to second-line laxative combination.
As all interventions are oral treatments there are no administration costs included in any scenario. None
of the assigned treatments incur monitoring costs.

90
Table 33. Unit costs associated with the technology in the economic model (GBP2019)
Naldemedine Naldemedine +
stable laxative
2nd line laxative
monotherapy
2nd line laxative
combination
Naloxegol
25mg
Cost per OP £41.72 per 28
tablet pack
Nald’ + £4.35
(Appendix I)
(Appendix I) (Appendix I) £55.20 per 30
tablet pack
Cost per
model cycle
£41.72 £46.07 £4.65 £5.84 £51.52
Health-state unit costs and resource use
Incremental cost of managing constipation
Patients were assumed to incur the non-laxative costs of constipation only in the OIC state. These
were derived from the observed frequencies in CPRD of:
Inpatient care – hospital admissions with an ICD-10 primary diagnosis of ‘K59.0.
Constipation’. The mean unit cost was derived by reading all admissions to the NHS HRG
Grouper(122) and applying the Payment by Results (PbR) tariff for 2018/19(123);
Outpatient care – outpatient encounters with specialty code ‘301. Gastroenterology’, costed
by the PbR tariff(123) for ‘first consult’; and
GP visits – all contacts with a Read code for constipation (see Appendix I) costed according
to the PSSRU published tariff(124).
Table 34. NHS costs of managing OIC (£2019)
Unit cost 4-week rate Weighted cost per
cycle
Inpatient care
(1o diagnosis: K59.0)
£1,009 0.8% £8.13
Outpatient care
(Gastroenterology)
£127 0.9% £1.17
GP visit £39 19.1% £7.45
Total cost per cycle £16.75

91
Shionogi believes the base case costs used in the model may be conservative particularly in
comparison to the range of costs cited in previous economic analyses of £24 (125) and £35 (90) per
month.
Opioid costs
Opioid use was assumed to be unaffected by OIC treatment in all comparisons, as observed in the
pivotal studies for naldemedine.
Adverse reaction unit costs and resource use
Adverse events observed in the pivotal studies of Grade 1/2 severity were assumed to be self-limiting
and to result in no additional costs to the NHS. The Advisory Board (Appendix O) agreed that abdominal
pain, flatulence, vomiting, nausea, headache and diarrhoea were the most clinically relevant AEs.
Detailed resource use and unit costs are reported in Appendix I. These provided the typical resource
use associated with treating each event of Grade 3/4 severity. The mean expected cost per AE was
calculated as the weighted average of patients with Grade 3/4 events (and the corresponding unit cost
for a GP visit) and patients with Grade 1/2 events (at a cost of £0). These costs were then summated
to provide an overall total AE cost (see Table ). As Grade 3/4 AE costs were not a driver in the model,
and to aid simplification, all AE costs were assumed to be incurred in cycle 1 only.
Table 35 Overall AE Costs
Adverse Event Costs
Cost (£) var Source/Notes
Abdominal distension 31.00 6.2
Curtis, et al. Unit Costs of Health and Social Care 2018.
Abdominal pain 31.00 6.2
Curtis, et al. Unit Costs of Health and Social Care 2018.
Diarrhoea 31.00 6.2
Curtis, et al. Unit Costs of Health and Social Care 2018.
Flatulence 31.00 6.2
Curtis, et al. Unit Costs of Health and Social Care 2018.
Headache 31.00 6.2
Curtis, et al. Unit Costs of Health and Social Care 2018.
Hot flush 31.00 6.2
Curtis, et al. Unit Costs of Health and Social Care 2018.
Hyperhidrosis 31.00 6.2
Curtis, et al. Unit Costs of Health and Social Care 2018.
Nausea 31.00 6.2
Curtis, et al. Unit Costs of Health and Social Care 2018.
Sinusitis 31.00 6.2
Curtis, et al. Unit Costs of Health and Social Care 2018.

92
Upper respiratory tract infection 31.00 6.2
Curtis, et al. Unit Costs of Health and Social Care 2018.
Vomiting 31.00 6.2
Curtis, et al. Unit Costs of Health and Social Care 2018.
Miscellaneous unit costs and resource use
There are no miscellaneous costs included in the economic analysis.

93
B.3.6 Summary of base-case analysis inputs and assumptions
Summary of base-case analysis inputs
The base case analysis inputs are summarised in Table 36.
Table 36. Summary of variables applied in the economic model.
Variable Value (reference to appropriate table or figure in submission)
Measurement of uncertainty and distribution: CI (distribution)
Reference to section in submission
General settings
Population gender 40% (Table 11) NA C1&2
Population age 54 (Table 11) NA C1&2
Probability of response by 4 weeks
SCENARIO 1 (trial based)
Naldemedine 82.9% (Table 13) 73.2;90.7 (beta) C1&2
2nd-line Lax mono 55.0% 50.3;59.7 (beta) C1&2
SCENARIO 2 (trial based)
Naldemedine + stable laxative
64.0% 58.6;69.2 (beta) C3
2nd-line Lax combi 51.3% 46.1;56.5 (beta) C3
SCENARIO 3 (ITC based)
Naldemedine 90.0% 77.0;97.9% (beta) ITC
Naloxegol 25mg 68.8% 36.3;100% (beta) ITC
Transition probabilities (from week 4)
SCENARIO 1
Transition A See section B.3.
Transition B 18.2% 13.9;23.0 (beta)
Transition C 21.3% 15.2;28.1 (beta)
SCENARIO 2
Transition A See section B.3.
Transition B 20.6% 14.8;27.1 (beta)
Transition C 35.5% 28.5;42.8 (beta)
SCENARIO 3
Transition A See section B.3.
Transition B 26.8% 18.5;36.0 (beta)
Transition C 13.8% 7.4;21.8 (beta)
Mortality (per cycle) 0.034% -

94
Treatment costs per cycle
SCENARIO 1
Naldemedine £41.72 NA
2nd-line Lax mono £4.65 3.72;5.58 (gamma) C1&2
SCENARIO 2
Naldemedine + stable laxative
£46.07 NA C3
2nd-line Lax combi £5.84 4.67;7.01 (gamma) C3
SCENARIO 3
Naldemedine £41.72 NA ITC
Naloxegol 25mg £51.52 NA ITC
Cost of adverse events (grade 3-4), Cycle 1
SCENARIO 1
Naldemedine £0.97 (composite) C1&2
2nd-line Lax mono £0.25 (composite) C1&2
SCENARIO 2
Naldemedine + stable laxative
£0.97 (composite) C3
2nd-line Lax combi £0.25 (composite) C3
SCENARIO 3
Naldemedine £0.97 (composite) ITC
Naloxegol 25mg £1.42 (composite) ITC
Cost of health states
Non-OIC(treated) £0 NA
Non-OIC(untreated) £0 NA
OIC £16.75 13.40;20.09 (gamma)
Utility in health states
SCENARIOS 1 & 2
Non-OIC (naldemedine/+)
0.642 0.607;0.678 (gamma) TA345
Non-OIC
(2nd-line Lax)
0.613 0.573;0.655 (gamma) TA345
Non-OIC (untreated) 0.613 0.573;0.655 (gamma) TA345
OIC 0.553 0.511;0.597 (gamma) TA345
SCENARIO 3
Non-OIC (treated) 0.642 0.607;0.678 (gamma) TA345
Non-OIC (untreated) 0.613 0.573;0.655 (gamma) TA345
OIC 0.553 0.511;0.597 (gamma) TA345
Abbreviations: CI, confidence interval
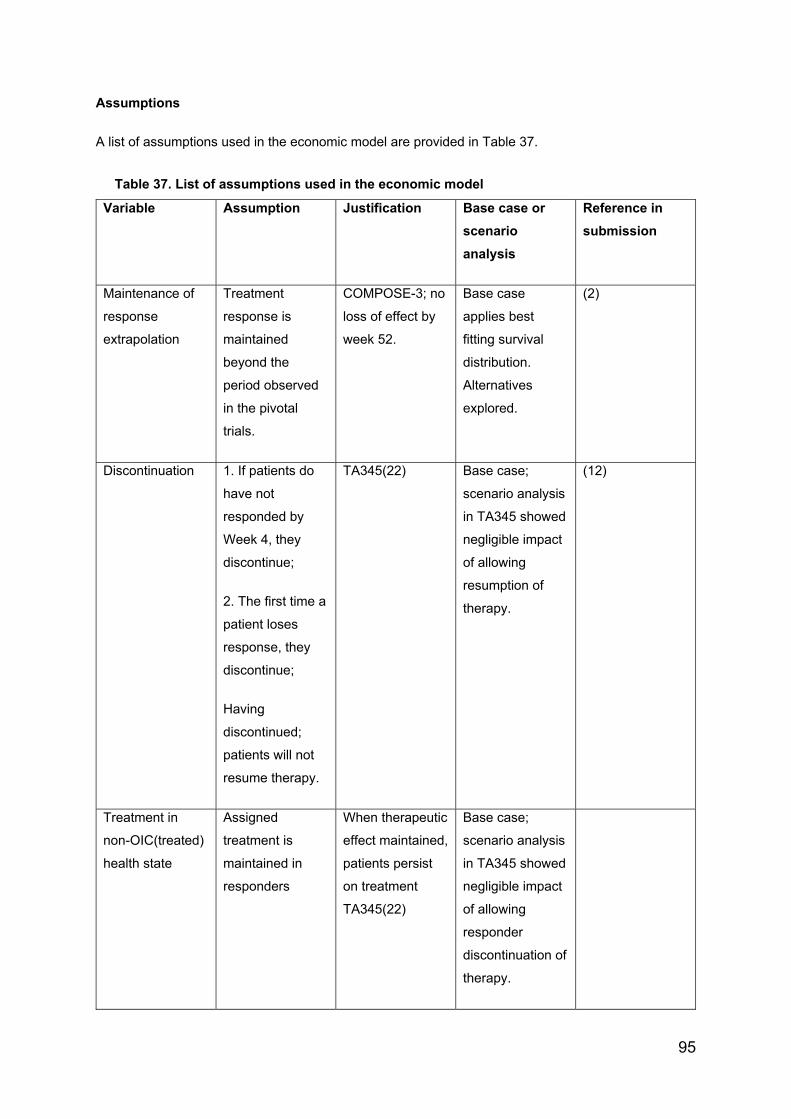
95
Assumptions
A list of assumptions used in the economic model are provided in Table 37.
Table 37. List of assumptions used in the economic model
Variable Assumption Justification Base case or
scenario
analysis
Reference in
submission
Maintenance of
response
extrapolation
Treatment
response is
maintained
beyond the
period observed
in the pivotal
trials.
COMPOSE-3; no
loss of effect by
week 52.
Base case
applies best
fitting survival
distribution.
Alternatives
explored.
(2)
Discontinuation 1. If patients do
have not
responded by
Week 4, they
discontinue;
2. The first time a
patient loses
response, they
discontinue;
Having
discontinued;
patients will not
resume therapy.
TA345(22) Base case;
scenario analysis
in TA345 showed
negligible impact
of allowing
resumption of
therapy.
(12)
Treatment in
non-OIC(treated)
health state
Assigned
treatment is
maintained in
responders
When therapeutic
effect maintained,
patients persist
on treatment
TA345(22)
Base case;
scenario analysis
in TA345 showed
negligible impact
of allowing
responder
discontinuation of
therapy.
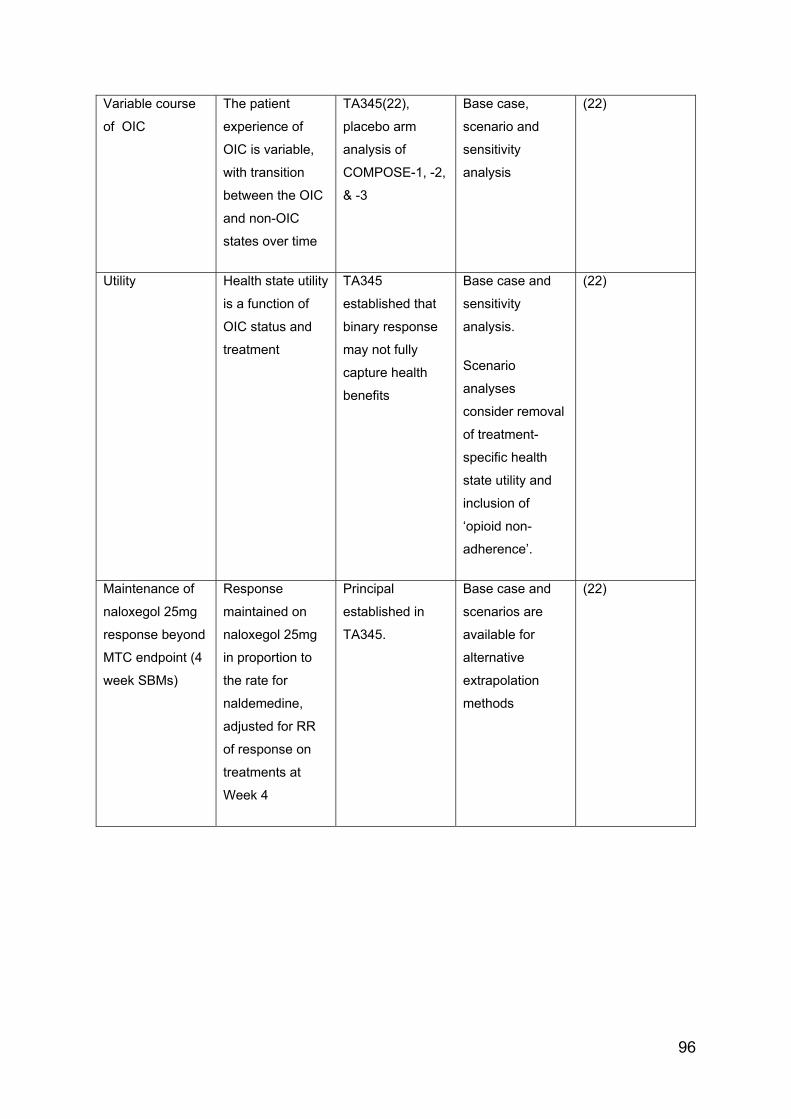
96
Variable course
of OIC
The patient
experience of
OIC is variable,
with transition
between the OIC
and non-OIC
states over time
TA345(22),
placebo arm
analysis of
COMPOSE-1, -2,
& -3
Base case,
scenario and
sensitivity
analysis
(22)
Utility Health state utility
is a function of
OIC status and
treatment
TA345
established that
binary response
may not fully
capture health
benefits
Base case and
sensitivity
analysis.
Scenario
analyses
consider removal
of treatment-
specific health
state utility and
inclusion of
‘opioid non-
adherence’.
(22)
Maintenance of
naloxegol 25mg
response beyond
MTC endpoint (4
week SBMs)
Response
maintained on
naloxegol 25mg
in proportion to
the rate for
naldemedine,
adjusted for RR
of response on
treatments at
Week 4
Principal
established in
TA345.
Base case and
scenarios are
available for
alternative
extrapolation
methods
(22)
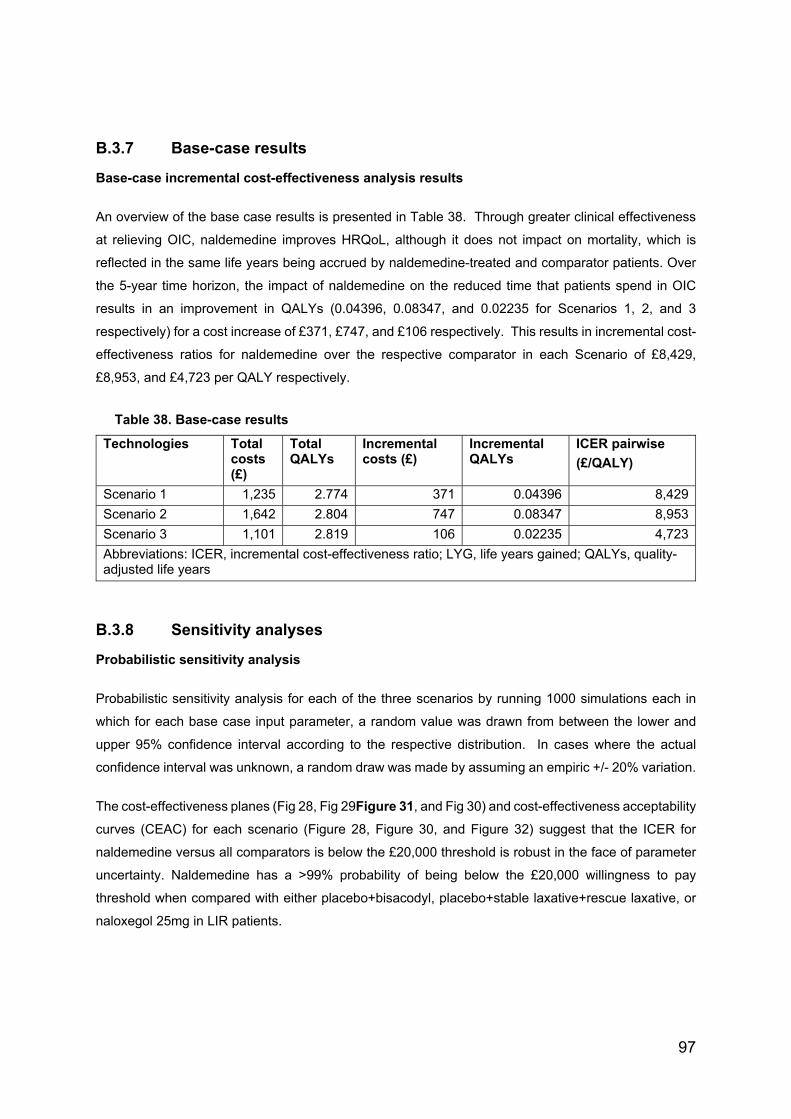
97
B.3.7 Base-case results
Base-case incremental cost-effectiveness analysis results
An overview of the base case results is presented in Table 38. Through greater clinical effectiveness
at relieving OIC, naldemedine improves HRQoL, although it does not impact on mortality, which is
reflected in the same life years being accrued by naldemedine-treated and comparator patients. Over
the 5-year time horizon, the impact of naldemedine on the reduced time that patients spend in OIC
results in an improvement in QALYs (0.04396, 0.08347, and 0.02235 for Scenarios 1, 2, and 3
respectively) for a cost increase of £371, £747, and £106 respectively. This results in incremental cost-
effectiveness ratios for naldemedine over the respective comparator in each Scenario of £8,429,
£8,953, and £4,723 per QALY respectively.
Table 38. Base-case results
Technologies Total costs (£)
Total QALYs
Incremental costs (£)
Incremental QALYs
ICER pairwise
(£/QALY)
Scenario 1 1,235 2.774 371 0.04396 8,429
Scenario 2 1,642 2.804 747 0.08347 8,953
Scenario 3 1,101 2.819 106 0.02235 4,723
Abbreviations: ICER, incremental cost-effectiveness ratio; LYG, life years gained; QALYs, quality-adjusted life years
B.3.8 Sensitivity analyses
Probabilistic sensitivity analysis
Probabilistic sensitivity analysis for each of the three scenarios by running 1000 simulations each in
which for each base case input parameter, a random value was drawn from between the lower and
upper 95% confidence interval according to the respective distribution. In cases where the actual
confidence interval was unknown, a random draw was made by assuming an empiric +/- 20% variation.
The cost-effectiveness planes (Fig 28, Fig 29Figure 31, and Fig 30) and cost-effectiveness acceptability
curves (CEAC) for each scenario (Figure 28, Figure 30, and Figure 32) suggest that the ICER for
naldemedine versus all comparators is below the £20,000 threshold is robust in the face of parameter
uncertainty. Naldemedine has a >99% probability of being below the £20,000 willingness to pay
threshold when compared with either placebo+bisacodyl, placebo+stable laxative+rescue laxative, or
naloxegol 25mg in LIR patients.
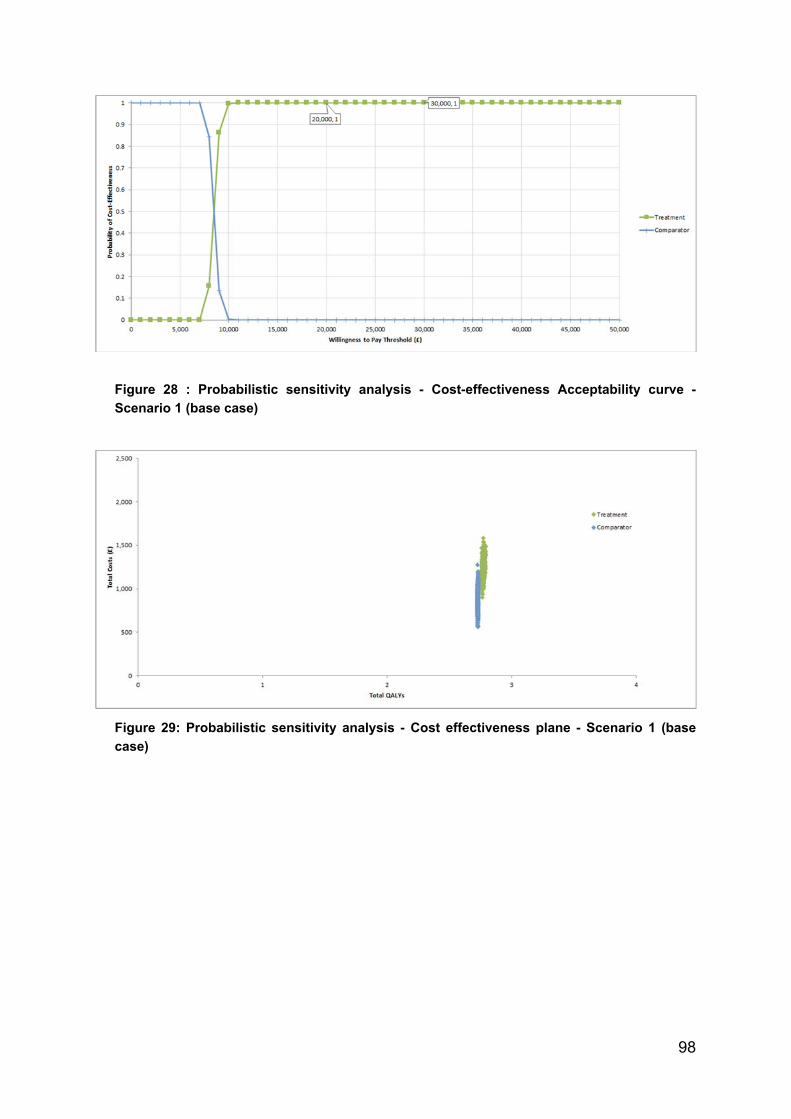
98
Figure 28 : Probabilistic sensitivity analysis - Cost-effectiveness Acceptability curve -
Scenario 1 (base case)
Figure 29: Probabilistic sensitivity analysis - Cost effectiveness plane - Scenario 1 (base
case)

99
Figure 30: Probabilistic sensitivity analysis - Cost-effectiveness Acceptability curve -
Scenario 2 (base case)
Figure 31: Probabilistic sensitivity analysis - Cost effectiveness plane - Scenario 2 (base
case)
100
Figure 32:Probabilistic sensitivity analysis - Cost-effectiveness Acceptability curve -
Scenario 3 (base case)
Figure 33: Probabilistic sensitivity analysis - Cost effectiveness plane - Scenario 3
Deterministic sensitivity analysis
One-way sensitivity analysis (OWSA) was performed for each base case input parameter, by inputting
the lower and upper 95% confidence interval. In cases where the actual confidence interval was
assumed empirically to vary +/- 20% around the mean. In Scenarios 1 and 2, the value for the
naldemedine parameter in the respective survival model had the largest impact on the ICER, though in
neither case did the resulting ICER exceed £20,000 per QALY (Fig 34 and Fig 35). In Scenario 3,
varying the cost of naloxegol, the risk ratio of Week 4 response, and the naloxegol response had the
greatest impact on the ICER, but in no instance was £20,000 per QALY exceeded.
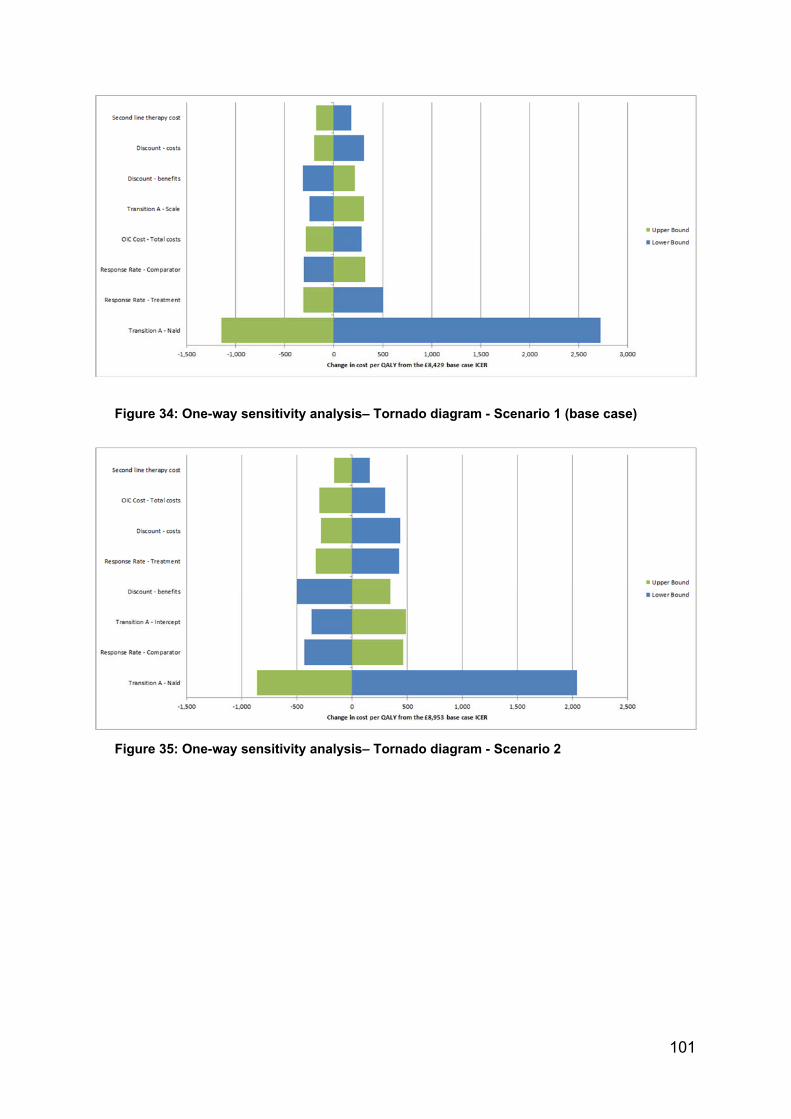
101
Figure 34: One-way sensitivity analysis– Tornado diagram - Scenario 1 (base case)
Figure 35: One-way sensitivity analysis– Tornado diagram - Scenario 2

102
Figure 36: One-way sensitivity analysis – Tornado diagram - Scenario 3
Scenario analysis
The impact of other assumptions has been tested in a series of scenario analyses, namely:
1) deployment of health-state specific utility values instead of treatment specific ones;
2) varying the time horizon of each model from one year to five years by utility value set; and
3) substituting alternative parametric survival distributions for the maintenance of response
(Transition A).
Alternative utility sets
Replacement of treatment-specific utilities with health-state specific utility values has the effect of
decreasing the incremental QALY gain in each scenario and inflating the ICER. Using values from
TA345 (direct EQ-5D utility), no ICER exceeds £20,000 per QALY in any scenario (Table 39). Using
the more conservative utility values mapped from SF-12 in the COMPOSE-1 & -2 data, the ICERs for
Scenarios 1 and 2 exceed £20,000 per QALY but remain within £30,000 per QALY, while that for
Scenario 3 remains within a threshold of £20,000 per QALY (Table 40).
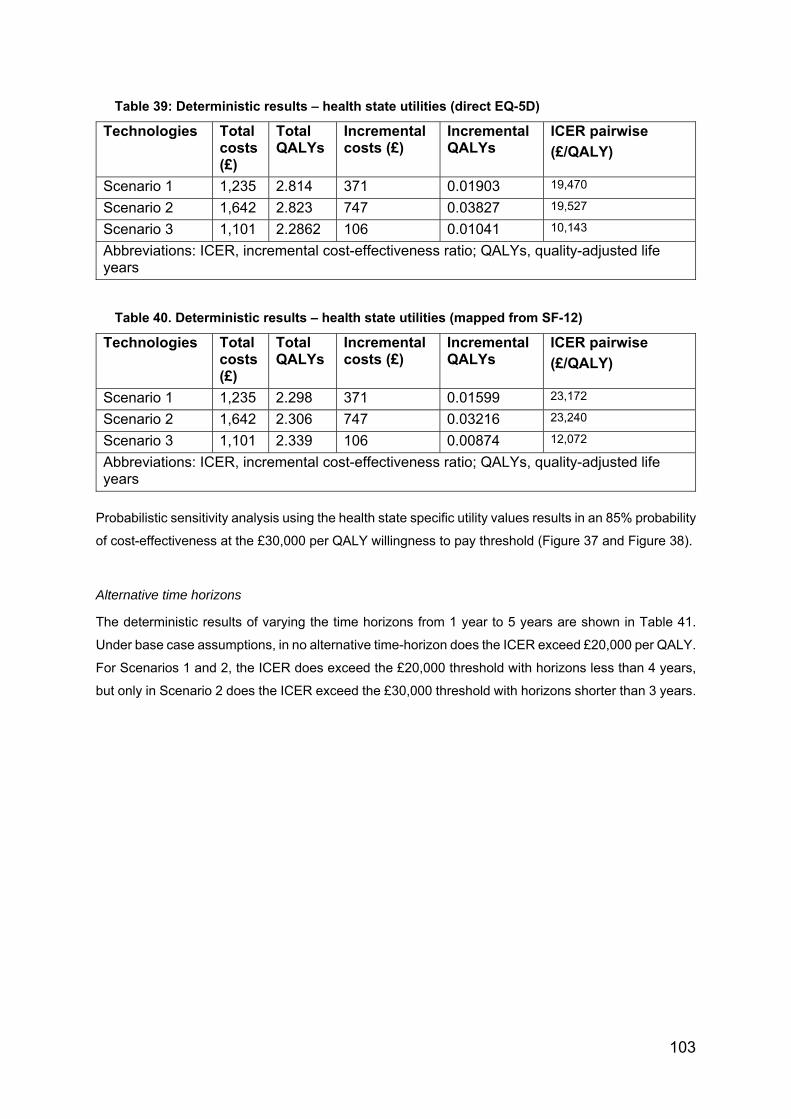
103
Table 39: Deterministic results – health state utilities (direct EQ-5D)
Technologies Total costs (£)
Total QALYs
Incremental costs (£)
Incremental QALYs
ICER pairwise
(£/QALY)
Scenario 1 1,235 2.814 371 0.01903 19,470
Scenario 2 1,642 2.823 747 0.03827 19,527
Scenario 3 1,101 2.2862 106 0.01041 10,143
Abbreviations: ICER, incremental cost-effectiveness ratio; QALYs, quality-adjusted life years
Table 40. Deterministic results – health state utilities (mapped from SF-12)
Technologies Total costs (£)
Total QALYs
Incremental costs (£)
Incremental QALYs
ICER pairwise
(£/QALY)
Scenario 1 1,235 2.298 371 0.01599 23,172
Scenario 2 1,642 2.306 747 0.03216 23,240
Scenario 3 1,101 2.339 106 0.00874 12,072
Abbreviations: ICER, incremental cost-effectiveness ratio; QALYs, quality-adjusted life years
Probabilistic sensitivity analysis using the health state specific utility values results in an 85% probability
of cost-effectiveness at the £30,000 per QALY willingness to pay threshold (Figure 37 and Figure 38).
Alternative time horizons
The deterministic results of varying the time horizons from 1 year to 5 years are shown in Table 41.
Under base case assumptions, in no alternative time-horizon does the ICER exceed £20,000 per QALY.
For Scenarios 1 and 2, the ICER does exceed the £20,000 threshold with horizons less than 4 years,
but only in Scenario 2 does the ICER exceed the £30,000 threshold with horizons shorter than 3 years.

104
Figure 37: Probabilistic sensitivity analysis - Cost-effectiveness Acceptability curve -
Scenario 1 – health state utilities (direct EQ-5D)
Figure 38: Probabilistic sensitivity analysis - Cost effectiveness Acceptability Curve -
Scenario 1 – health state utilities (mapped from SF-12)
Table 41: Deterministic results - time horizon
Time horizon 1-year 2-year 3-year 4-year 5-year
SCENARIO 1
Treatment-specific (base case) 8,704 8,666 8,585 8,518 8,429
Health-state (direct EQ-5D) 20,667 20,509 20,121 19,802 19,470
Health-state (mapped from SF-12) 24,596 24,408 23,946 23,567 23,172
SCENARIO 2
Treatment-specific (base case) 11,326 10,365 9,726 9,298 8,953
Health-state (direct EQ-5D) 33,252 26,618 23,054 20,958 19,527
Health-state (mapped from SF-12) 38,574 31,679 27,437 24,942 23,240

105
SCENARIO 3
Treatment-specific (base case) 2,563 3,725 4,251 4,560 4,723
Health-state (direct EQ-5D) 4,896 7,657 8,960 9,727 10,143
Health-state (mapped from SF-12) 5,827 9,112 10,664 11,576 12,072
Alternative response survival distributions
Under base case assumptions, none of the alternative survival distributions for Transition A result in
an ICER exceeding £20,000 per QALY.
Table 42: Deterministic results - Maintenance of response distribution (Transition A)
Maintenance of response
Technologies Total costs (£)
Total QALYs
Incremental costs (£)
Incremental QALYs
ICER pairwise
(£/QALY)
Exponential Scenario 1 1072 2.744 177 0.02181 8,113
Scenario 2 1642 2.804 747 0.08347 8,953
Scenario 3 885 2.790 32 0.00800 4,027
Weibull Scenario 1 1092 2.748 199 0.02493 8,001
Scenario 2 1450 2.769 525 0.05699 9,217
Scenario 3 894 2.792 35 0.00857 4,107
Log-normal Scenario 1 1235 2.774 371 0.04396 8,429
Scenario 2 1785 2.830 928 0.09860 9,412
Scenario 3 1101 2.819 106 0.02235 4,723
Log-logistic Scenario 1 1220 2.771 352 0.04198 8,381
Scenario 2 1530 2.784 629 0.06491 9,686
Scenario 3 1049 2.812 94 0.01951 4,829
Gompertz Scenario 1 1901 2.898 1187 0.13036 9,106
Scenario 2 1349 2.751 416 0.04147 10,036
Scenario 3 1,790 2.912 110 0.04627 2,369
Abbreviations: ICER, incremental cost-effectiveness ratio; QALYs, quality-adjusted life years
B.3.9 Subgroup analysis
Given that the three base case scenarios represent clinically credible alternative use cases for
naldemedine, no additional subgroup analyses are presented.
B.3.10 Validation
The current model applied a very similar structure to that developed for the manufacturer submission of naloxegol, on the basis that it not only had been
endorsed by NICE but also that the results would allow meaningful comparison. Given the lower acquisition cost of naldemedine relative to naloxegol, similar
comparative effectiveness, and using the same treatment-specific utility values, the lower base case ICERs than those accepted in the NICE reference case
for TA345(12) provide evidence of both internal and external validity of the current model.
The model was initial constructed by expert health economists in the US (RTI) and subsequently reviewed by (Costello Medical) and adapted by
(Pharmatelligence) other UK-based health economists.
B.3.11 Interpretation and conclusions of economic evidence
The economic evidence presented demonstrates that naldemedine is a cost-effective treatment option in the UK for patients with OIC who have previously been
treated with a laxative.
A de novo economic model was constructed to compare the cost-effectiveness of naldemedine based on the patients enrolled in COMPOSE-1, -2 and -3 trials
for the treatment of adult patients with OIC who had previously been treated with a laxative. The model comprised a decision-tree structure for the first four
weeks of treatment, followed by a Markov structure over a time horizon of up to five years. This approach was taken in order to not only represent the natural
history of OIC but also to conservatively model the available data. The modelling approach was in line with previous models and the feedback upon them
(22,86,87,89,90).
The economic analysis reports on the following use cases:
Scenario 1: naldemedine 0.2mg daily (recommended dose) as monotherapy versus placebo in combination with bisacodyl (where bisacodyl was a proxy for
second-line laxative monotherapy)
Scenario 2: naldemedine 0.2mg plus stable laxative versus placebo in combination with stable laxative plus rescue laxative.
Scenario 3: naldemedine 0.2mg versus naloxegol 25mg in patients with inadequate response to previous laxative therapy.

107
These scenarios are considered the most clinically relevant given the multifactorial nature of constipation and contemporary European clinical guidance (17)
for the management of OIC, endorsed by an advisory board of UK expert clinicians (Appendix O).
In the base-case analysis for each of the three scenarios for naldemedine use, the ICERs for naldemedine versus comparator gained for a five-year time horizon
were as follows:
Scenario 1: £8,429 per QALY gained
Scenario 2: £8,953 per QALY gained
Scenario 3: £4,723 per QALY gained
Interestingly, whilst the acquisition cost of naldemedine is 19% lower than that of naloxegol and treatment benefit was shown to be consistently superior,
naldemedine was not ‘dominant’ in the base case. This was due to differential discontinuation patterns between the two PAMORAs, whereby those treated with
naloxegol discontinued at a more rapid rate to relatively inexpensive alternative therapies—a highly conservative assumption.
A large number of sensitivity and scenario analyses were completed in order to investigate the robustness of the model to changes and uncertainty in the
parameters and assumptions. These included analyses of alternative treatment effect extrapolation and utility assumptions. In nearly all of these sensitivity
analyses, naldemedine was found to be cost-effective at a willingness-to-pay threshold of £20,000 per QALY.
Probabilistic sensitivity analysis was undertaken for all the base-case comparisons. Derived from this, naldemedine 0.2mg has a probability of being cost-
effective at a willingness-to-pay threshold of <£20,000 in excess of 99% (all scenarios). The model was most sensitive to the utility associated with OIC.
However, even assuming the most conservative value set, naldemedine has a minimum 85% probability of being cost-effective at a willingness-to-pay threshold
of £30,000 (all scenarios).
Shionogi therefore contends that naldemedine 0.2mg represents a cost-effective alternative to current standard of care, whether used alone or in combination
with laxatives for the management of OIC.

108
B.4 References
1. Hale M, Wild J, Reddy J, Yamada T, Arjona Ferreira JC. Naldemedine versus placebo for opioid-induced constipation (COMPOSE-1 and COMPOSE-
2): two multicentre, phase 3, double-blind, randomised, parallel-group trials. Lancet Gastroenterol Hepatol [Internet]. 2017;2(8):555–64. Available
from: http://dx.doi.org/10.1016/S2468-1253(17)30105-X
2. Webster LR, Nalamachu S, Morlion B, Reddy J, Baba Y, Yamada T, et al. Long-term use of naldemedine in the treatment of opioid-induced
constipation in patients with chronic noncancer pain. Pain [Internet]. 2018 [cited 2019 Feb 15];159(5):987–94. Available from:
http://dx.doi.org/10.1097/j.pain.0000000000001174
3. Baker D. Formulary Drug Review: Naldemedine. Hosp Pharm. 2017;52(7):464–8.
4. Katakami N, Harada T, Murata T, Shinozaki K, Tsutsumi M, Yokota T, et al. Randomized phase III and extension studies: Efficacy and impacts on
quality of life of naldemedine in subjects with opioid-induced constipation and cancer. Ann Oncol. 2018;29(6):1461–7.
5. Katakami N. Randomized phase III and Extension Studies of Naldemedine in Patients with Opioid Induced Constipation and Cancer. J Clin Oncol.
2018;35:3859–66.
6. Saito Y, Yokota T, Arai M, Tada Y, Sumitani M. Naldemedine in japanese patients with opioid-induced constipation and chronic noncancer pain: Open-
label phase III studies. J Pain Res. 2019;12:127–38.
7. Esmadi M, Ahmad D, Hewlett A. Efficacy of Naldemedine for the treatement of Opioid Induced Constipation: A Meta-analysis. J Gastrointestin Liver
Dis2. 2019;28(1):41–6.
8. Song X, Wang D, Qu X. A meta-analysis of naldemedine for the treatement of opioid induced constipation. Expert Rev Clin Pharmacol.
2019;12(2):121–8.
9. Hu K, Bridgeman M. Naldemedine (SYMPROIC) for the treatment of Opioid Induced Constipation. PT. 2018;43(10):601–27.

109
10. Yagi Y, Kosugi K, Tanimoto T. Randomized Phase III and Extension Studies of Naldemedine in Patients with Opioid Induced Constipation and
Cancer. J Clin Oncol. 2018;26(10):1049–50.
11. Brower V. Naldemedine effective in treating opioid induced constipation. Lancet Oncol. 2017;18(6):E306.
12. NICE. Final appraisal determination-naloxegol for treating opioid-induced constipation [Internet]. 2015 [cited 2019 Jun 25]. Available from:
https://www.nice.org.uk/guidance/TA345
13. Mordecai L, Reynolds C, Donaldson L, Willams A. Patterns of regional variation of opioid prescribing in primary care in England: a retrospective
observational study. Br J Gen Pract. 2018;68:e225–33.
14. Bell T, Annunziata K, Leslie JB. Opioid-induced constipation negatively impacts pain management, productivity, and health-related quality of life:
findings from the National Health and Wellness Survey. J Opioid Manag. 2009;5(3):137–44.
15. Robinson C, Fritch M, Hullet L. Development of a protocol to prevent opioid induced-constipation in patients with cancer: a research utilization project.
Clin J Oncol Nurs. 2000;4:79–84.
16. Rauck R, Bookbinder S, Bunker T. Oral Once a day AVINZA (morphine sulfate extended release capsules) vs twice a day OxyContin (Oxycodone
HCL Controlled Release) for the treatment of chronic moderate to severe low back pain: Final Study Results. Am Pain Soc 25th Annu Sci Meet San
Antonio, Tx. 2006;Poster 827.
17. Christensen HN, Olsson U, From J, Breivik H, Christensen HN. Opioid-induced constipation, use of laxatives, and health-related quality of life-NC-ND
license (http://creativecommons.org/ licenses/by-nc-nd/4.0/).-NC-ND license (http://creativecommons.org/licenses/by-nc-nd/4.0/). Scand J Pain.
2016;11:104–10.
18. O’Brien T, Christup L, Dewes A, Fallon M, Kress H, McQuay H, et al. European Pain Federation position paper on appropriate opioid use in chronic
pain management. Eur J Pain. 2017;21(1):3–19.
19. Andresen V, Layer P. Medical Therapy of Constipation:Current Standards and Beyond. Visc Med. 2018;34:123–7.

110
20. Farmer AD, Drewes AM, Chiarioni G, De Giorgio R, O’Brien T, Morlion B, et al. Pathophysiology and management of opioid-induced constipation:
European expert consensus statement. United Eur Gastroenterol J [Internet]. 2019 Feb 14 [cited 2019 Feb 15];7(1):7–20. Available from:
http://journals.sagepub.com/doi/10.1177/2050640618818305
21. Luthra P, Burr NE, Brenner DM, Ford AC. Efficacy of pharmacological therapies for the treatment of opioid-induced constipation: systematic review
and network meta-analysis. Gut [Internet]. 2019 Mar [cited 2019 Apr 10];68(3):434–44. Available from: http://gut.bmj.com/
22. NICE. TA345: Final appraisal determination-naloxegol for treating opioid-induced constipation [Internet]. NICE; 2015 [cited 2019 Feb 12]. Available
from: https://www.nice.org.uk/guidance/TA345
23. Andresen V, Banerji V, Hall G, Lass A, Emmanuel A V. The patient burden of opioid-induced constipation: New insights from a large, multinational
survey in five European countries. United Eur Gastroenterol J [Internet]. 2018 Oct 13 [cited 2019 Apr 10];6(8):1254–66. Available from:
https://www.ncbi.nlm.nih.gov/pmc/articles/PMC6169046/pdf/10.1177_2050640618786145.pdf
24. Lee AA, Hasler WL. Opioids and GI Motility—Friend or Foe? Curr Treat Options Gastroenterol [Internet]. 2016 Dec 2;14(4):478–94. Available from:
http://link.springer.com/10.1007/s11938-016-0112-0
25. Moore RA, McQuay HJ. Prevalence of opioid adverse events in chronic non-malignant pain: systematic review of randomised trials of oral opioids.
Arthritis Res Ther [Internet]. 2005;7(5):R1046-51. Available from: http://www.ncbi.nlm.nih.gov/pubmed/16207320
26. Lee AA, Hasler WL. Opioids and GI Motility—Friend or Foe? Curr Treat Options Gastroenterol. 2016 Dec;14(4):478–94.
27. Benyamin R, Trescot AM DS. Opioid complications and side effects. Pain Physician. 2008;11:s105-120.
28. Porreca F, Ossipov M. Nausea and vomiting side effects with opioid analgesics during treatment of chronic pain: Mechanisms, implications, and
management options. Pain Med. 2009;10(654–662).
29. Glare P, Walsh D, Sheehan D. The adverse effects of morphine: a prospective survey of common symptoms during repeated dosing for chronic
cancer pain. Am J Hosp Palliat Care. 2006;23(229–235).
111
30. Tuteja AK, Biskupiak J, Stoddard GJ, Lipman AG. Opioid-induced bowel disorders and narcotic bowel syndrome in patients with chronic non-cancer
pain. Neurogastroenterol Motil. 2010;22(4):424–31.
31. Drewes AM, Munkholm P, Simren M. Definition, diagnosis and treatment strategies for opioid-induced bowel dysfunction–recommendations of the
Nordic Working Group. Scand J Pain. 2016;11:111–22.
32. Bell TJ, Panchal SJ, Miaskowski C, Bolge SC, Milanova T, Williamson R. The Prevalence, Severity, and Impact of Opioid-Induced Bowel Dysfunction:
Results of a US and European Patient Survey (PROBE 1). Pain Med [Internet]. 2009 Jan 1 [cited 2019 Feb 19];10(1):35–42. Available from:
http://www.ncbi.nlm.nih.gov/pubmed/18721170
33. Ducrotte P, Milce J, Soufflet C. Prevalence and clinical features of opioid-induced constipation in the general population: A French study of 15,000
individuals. United Eur Gastroenterol J. 2017;5:588–600.
34. Gupta A, Coyne K, Datto C. The burden of opioid induced constipation in younger patients with chronic noncancer pain. Pain Med. 2018;10:1093.
35. Simren M. Update on Rome IV criteria for colorectal disorders: implications for clinical practice. Curr Gastroenterol Rep. 2017;15(10):1007.
36. McCarberg B. Overview and Treatment of Opioid Induced Constipation. Postgrad Med. 2013;125(4):7–17.
37. Nelson A, Camilleri M. Chronic opioid induced constipation in patients with non malignant pain: challenges and opportunities. Ther Adv Gastroenterol.
2015;8(4):206–20.
38. Holzer P. New approaches to the treatment of opioid-induced constipation. Eur Rev Med Pharmacol Sci. 2008;12(SUPPL. 1):119–27.
39. Sternini C, Patierno S, Selmer I. The opioid system in the gastrointestinal tract. Neurogastroenterol Motil. 2004;16:3–16.
40. Kurz A, Sessler D. Opioid Induced Bowel Dysfunction: Pathophysiology and potential new therapies. Drugs2. 2003;63:649–71.
41. Clemens K, Quednau I, Klaschik E. Is there a higher risk of respiratory depression in opioid naive palliative care patients during symptomatic therapy
112
of dyspnea with strong opioids? J Palliat Med. 2008;11(2):204–16.
42. Fickel J, Bagnol D, Watson S. Opioid receptor expression in the rat gastrointestinal tract: A quantitative study with comparison to the brain. Brain Res
Mol. 1997;46:1–8.
43. Brock C, Olesen S, Olesen A. Opioid-induced bowel dysfunction: Pathophysiology and management. Drugs. 2012;72:1847–65.
44. Wood J, Galligan J. Function of opioids in the enteric nervous system. Neurogastroenterol Motil. 2004;16:17–28.
45. Kraichely R, Arora A, Murray J. opiate induced oesophageal dysmotility. Aliment Pharmacol Ther. 2010;31:601–6006.
46. Penagini R, Allocca M, Cantu P. Relationship between motor function of the proximal stomach and transient lower oesophageal sphincter relaxation
after morphine. Gut. 53(1227–1231).
47. Sun W, Read N, Verlinden M. Effects of loperamide oxide on gastrointestinal transit time and anorectal funtion in patients with chronic diarrhoea and
faecal incontinence. Scan J Gastroenterol. 1997;32(34–38).
48. Poulsen J, Nilsson M, Brock C. The impact of opioid treatment on regional gastrointestinal transit. J Neurogastroenterol. 2016;22:282–91.
49. Johnson L, Barrett K. Physiology of the gastrointestinal tract. In: Physiology of the gastrointestinal tract. 2006.
50. Galligan J, Akbarali H. Molecular Physiology of enteric opioid receptors. Am J Gastroenterol Suppl. 2014;2:17–21.
51. Poitras R, Warren D, Oyogaoa S. Opioid drugs and stercoral perforation of the colon: case report & review of literature. Int J Surg Case Rep.
2018;42:94–7.
52. Musial F, Enck P, Kalveram K. The effect of loperamide on anorectal function in normal healthy men. J Clin Gastrointerol. 1992;15:321–4.
53. Poulsen J, Mark E, Brock C. Colorectal transit and volume during treatment and prolonged release oxycodone/naloxone versus oxycodone plus
macrogol. J Neurogastroenterol Motil. 2018;24:119–27.

113
54. Mearin F, Lacy B, Chang L. Bowel disorders. Gastroenterology. 2016;02:31.
55. Pasricha P, Willis W, Gebhart G. Chronic abdominal and visceral pain: theory and practice. 1st Ed Boca Raton, Flo US, CRC Press. 2006;
56. Tally N. How to do and interpret a rectal exam in gastroenterology. Am J Gastroenterol. 2008;103:820–2.
57. Gupta M, Patel H, Scopel J, Mody R. Impact of constipation on opioid therapy management among long-term opioid users, based on a patient survey.
INCR Annu Conf. 2015;11(4).
58. Camilleri M, Drossman D, Becker G, Webster L, Davies A, Mawe G. Emerging treatments in neurogastroenterology: a multidisciplinary working group
consensus statement on opioid-induced constipation. Neurogastroenterol Motil. 2014;10:1386–95.
59. EMA/CHMP/336243/2013. Guideline on the evaluation of medicinal products for the treatment of chronic constipation (including opioid induced
constipation) and for bowel cleansing. Comm Med Prod Hum Use. 2015;
60. Ducrotté P, Caussé C. The Bowel Function Index: a new validated scale for assessing opioid-induced constipation. Curr Med Res Opin.
2012;28(3):457–66.
61. Argoff C, Brennan M, Camilleri M, Davies A, Fudin J, Galluzzi K, et al. Consensus Recommendations on Initiating Prescription Therapies for Opioid‐
Induced Constipation. Pain Med. 2015;16(12):2324–2337.
62. Søndergaard J, Christensen H, Ibsen R, Jarbøl D, Kjellberg J. Healthcare resource use and costs of opioid-induced constipation among non-cancer
and cancer patients on opioid therapy: A nationwide register-based cohort study in Denmark. Scand J Pain. 2017;15:83–90.
63. Müller-Lissner S, Bassotti G, Coffin B, Drewes AM, Breivik H, Eisenberg E, et al. Opioid-Induced Constipation and Bowel Dysfunction: A Clinical
Guideline. Pain Med [Internet]. 2017 Oct 1;18(10):1837–63. Available from: http://www.ncbi.nlm.nih.gov/pubmed/28034973
64. Ishihara M, Ikesue H, Matsunaga H, Suemaru K, Kitaichi K, Suetsugu K, et al. A multi-institutional study analyzing effect of prophylactic medication for
prevention of opioid-induced gastrointestinal dysfunction. Clin J Pain [Internet]. 2012 Jun;28(5):373–81. Available from:
114
http://www.ncbi.nlm.nih.gov/pubmed/22156893
65. Skollerud LM, Fredheim OM, Svendsen K, Skurtveit S, Borchgrevink PC. Laxative prescriptions to cancer outpatients receiving opioids: a study from
the Norwegian prescription database. Support Care Cancer [Internet]. 2013 Jan;21(1):67–73. Available from:
http://www.ncbi.nlm.nih.gov/pubmed/22653367
66. Tassinari D, Sartori S, Tamburini E, Scarpi E, Raffaeli W, Tombesi P, et al. Adverse effects of transdermal opiates treating moderate-severe cancer
pain in comparison to long-acting morphine: a meta-analysis and systematic review of the literature. J Palliat Med [Internet]. 2008 Apr;11(3):492–501.
Available from: http://www.ncbi.nlm.nih.gov/pubmed/18363493
67. Basilisco G, Marino B, Passerini L, Ogliari C. Abdominal distension after colonic lactulose fermentation recorded by a new extensometer.
Neurogastroenterol Motil [Internet]. 2003 Aug;15(4):427–33. Available from: http://doi.wiley.com/10.1046/j.1365-2982.2003.00426.x
68. SmPC Bisocodyl. https://www.medicines.org.uk/emc/product/361/smpc.
69. Movicol SmPC. https://www.medicines.org.uk/emc/product/1025/smpc.
70. Annemans L. Pharmacoeconomic Impact of Adverse Events of Long-Term Opioid Treatment for the Management of Persistent Pain. Clin Drug
Investig [Internet]. 2010 Nov;1. Available from: http://content.wkhealth.com/linkback/openurl?sid=WKPTLP:landingpage&an=00044011-900000000-
99948
71. Burness CB, Keating GM. Oxycodone/Naloxone prolonged-release: a review of its use in the management of chronic pain while counteracting opioid-
induced constipation. Drugs [Internet]. 2014 Mar;74(3):353–75. Available from: http://www.ncbi.nlm.nih.gov/pubmed/24452879
72. Vondrackova D, Leyendecker P, Meissner W, Hopp M, Szombati I, Hermanns K, et al. Analgesic efficacy and safety of oxycodone in combination with
naloxone as prolonged release tablets in patients with moderate to severe chronic pain. J Pain [Internet]. 2008 Dec;9(12):1144–54. Available from:
http://www.ncbi.nlm.nih.gov/pubmed/18708300
73. Simpson K, Leyendecker P, Hopp M, Müller-Lissner S, Löwenstein O, De Andrés J, et al. Fixed-ratio combination oxycodone/naloxone compared with

115
oxycodone alone for the relief of opioid-induced constipation in moderate-to-severe noncancer pain. Curr Med Res Opin [Internet]. 2008
Dec;24(12):3503–12. Available from: http://www.ncbi.nlm.nih.gov/pubmed/19032132
74. Löwenstein O, Leyendecker P, Hopp M, Schutter U, Rogers PD, Uhl R, et al. Combined prolonged-release oxycodone and naloxone improves bowel
function in patients receiving opioids for moderate-to-severe non-malignant chronic pain: a randomised controlled trial. Expert Opin Pharmacother
[Internet]. 2009 Mar;10(4):531–43. Available from: http://www.ncbi.nlm.nih.gov/pubmed/19243306
75. Rauck RL, Hale ME, Bass A, Bramson C, Pixton G, Wilson JG, et al. A randomized double-blind, placebo-controlled efficacy and safety study of ALO-
02 (extended-release oxycodone surrounding sequestered naltrexone) for moderate-to-severe chronic low back pain treatment. Pain [Internet].
2015;156(9):1660–9. Available from: http://www.ncbi.nlm.nih.gov/pubmed/25993547
76. Rumman A, Gallinger ZR, Liu LWC. Opioid induced constipation in cancer patients: pathophysiology, diagnosis and treatment. Expert Rev Qual Life
Cancer Care [Internet]. 2016 Jan 2;1(1):25–35. Available from: https://www.tandfonline.com/doi/full/10.1080/23809000.2016.1131595
77. Abramowitz L, Beziaud N, Labreze L, Giardina V, Causse C, Cherberre B, et al. Prevalence and impact of constipation and bowel dysfunction induced
by strong opioids: a cross sectional survey of 520 patients with cancer pain:DYONISOS. J Med Econ. 2013;12:1423–33.
78. Kalso E, Edwards JE, Moore RA, McQuay HJ. Opioids in chronic non-cancer pain: Systematic review of efficacy and safety. Pain. 2004;112(3):372–
80.
79. Camilleri M. Opioid-Induced Constipation: Challenges and Therapeutic Opportunities. Am J Gastroenterol [Internet]. 2011 May;106(5):835–42.
Available from: http://insights.ovid.com/crossref?an=00000434-201105000-00008
80. Tafelski S, Beutlhauser T, Bellin F, Reuter E, Fritzsche T, West C, et al. [Incidence of constipation in patients with outpatient opioid therapy]. Schmerz
[Internet]. 2016 Apr;30(2):158–65. Available from: http://www.ncbi.nlm.nih.gov/pubmed/26115741
81. Coyne KS, Margolis MK, Yeomans K, King FR, Chavoshi S, Payne KA, et al. Opioid-Induced Constipation Among Patients with Chronic Noncancer
Pain in the United States, Canada, Germany, and the United Kingdom: Laxative Use, Response, and Symptom Burden Over Time. Pain Med. 2015
116
Aug;16(8):1551–65.
82. Locasale RJ, Datto C, Mary ;, Margolis K, Coyne KS. Satisfaction with Therapy Among Patients with Chronic Noncancer Pain with Opioid-Induced
Constipation. Vol. 22, Journal of Managed Care & Specialty Pharmacy JMCP March. 2016.
83. Breivik H, Collett B, Ventafridda V, Cohen R, Gallacher D. Survey of chronic pain in Europe: Prevalence, impact on daily life, and treatment. Eur J Pain
[Internet]. 2006 May;10(4):287–287. Available from: http://doi.wiley.com/10.1016/j.ejpain.2005.06.009
84. Flor H, Fydrich T, Turk DC. Efficacy of multidisciplinary pain treatment centers: a meta-analytic review. Pain [Internet]. 1992 May;49(2):221–30.
Available from: http://www.ncbi.nlm.nih.gov/pubmed/1535122
85. Gerlier L, Lamotte M, Van Megen Y. Pg115 Treatment of Moderate To Severe Pain With Oxycodone/ Naloxone To Reduce Opioid-Induced
Constipation: a Cost-Utility Analysis in Belgium and the Netherlands. Value Heal. 2011 Oct;12(7):A348.
86. Earnshaw SR, Klok RM, Iyer S, McDade C. Methylnaltrexone bromide for the treatment of opioid-induced constipation in patients with advanced
illness - A cost-effectiveness analysis. Aliment Pharmacol Ther. 2010 Jan;31(8):911–21.
87. Dunlop W, Neufeld K. Quality of Life Benefits and Cost Impact of Prolonged Release Oxycodone/Naloxone Versus Prolonged Release Oxycodone in
Patients with Moderate to Severe Pain and Opioid-Induced Constipation Despite the Use of 2 Laxatives: A UK Cost Utility Analysis. Value Heal
[Internet]. 2013 Nov 1 [cited 2019 Feb 12];16(7):A384. Available from: https://linkinghub.elsevier.com/retrieve/pii/S1098301513022626
88. Dunlop W, Uhl R, Khan I, Taylor A, Barton G, Dunlop W, et al. Quality of life benefits and cost impact of prolonged release oxycodone/naloxone versus
prolonged release oxycodone in patients with moderate-to-severe non-malignant pain and opioid-induced constipation: a UK cost-utility analysis. J
Med Econ. 2012 Jan;15(3):564–75.
89. Scottish Medicines Consortium. oxycodone / naloxone (Targinact). 2009.
90. Lawson R, Ryan J, King F, Goh JW, Tichy E, Marsh K. Cost Effectiveness of Naloxegol for Opioid-Induced Constipation in the UK.
Pharmacoeconomics [Internet]. 2017 Feb 23;35(2):225–35. Available from: http://link.springer.com/10.1007/s40273-016-0454-4
117
91. Scottish Medicines Consortium. Advice for naloxegol (Moventig) [Internet]. 2015. Available from: https://www.scottishmedicines.org.uk/medicines-
advice/naloxegol-moventig-fullsubmission-110615/
92. Scottish Medicines Consortium. Advice for oxycodone / naloxone (Targinact) [Internet]. 2009. Available from:
https://www.scottishmedicines.org.uk/medicines-advice/oxycodone-naloxone-targinact-fullsubmission-54109/
93. Palsson OS, Whitehead WE, van Tilburg MAL, Chang L, Chey W, Crowell MD, et al. Development and Validation of the Rome IV Diagnostic
Questionnaire for Adults. Gastroenterology [Internet]. 2016 May [cited 2019 Feb 15];150(6):1481–91. Available from:
http://dx.doi.org/10.1053/j.gastro.2016.02.014
94. Office for National Statistics. National life tables, UK: 2015 to 2017 [Internet]. 2018. Available from:
https://www.ons.gov.uk/peoplepopulationandcommunity/birthsdeathsandmarriages/lifeexpectancies/bulletins/nationallifetablesunitedkingdom/2015to20
17
95. https://www.ema.europa.eu/en/documents/product-information/moventig-epar-product-information_en.pdf. SmPC Naloxegol. 2014.
96. Latimer N. NICE DSU TECHNICAL SUPPORT DOCUMENT 14: SURVIVAL ANALYSIS FOR ECONOMIC EVALUATIONS ALONGSIDE CLINICAL
TRIALS-EXTRAPOLATION WITH PATIENT-LEVEL DATA REPORT BY THE DECISION SUPPORT UNIT [Internet]. 2011 [cited 2019 Feb 21].
Available from: www.nicedsu.org.uk
97. Marquis P, De La Loge C, Dubois D, McDermott A, Chassany O. Development and validation of the Patient Assessment of Constipation Quality of Life
questionnaire. Scand J Gastroenterol [Internet]. 2005 [cited 2019 Feb 13];40(5):540–51. Available from:
https://www.tandfonline.com/action/journalInformation?journalCode=igas20
98. Ware J, Kosinski M, Bjorner J, Turner-Bowker D, Gandek B, Maruish M. User’s Manual for the SF-36v2® Health Survey. Lincoln (RI); 2007.
99. Hatswell AJ, Vegter S. Measuring quality of life in opioid-induced constipation: mapping EQ-5D-3 L and PAC-QOL. Health Econ Rev. 2016;6(1).
100. Brazier J, Roberts J, Deverill M. The estimation of a preference-based measure of health from the SF-36. J Health Econ [Internet]. 2002 [cited 2019

118
Mar 12];21(2):271–92. Available from: https://ac.els-cdn.com/S0167629601001308/1-s2.0-S0167629601001308-main.pdf?_tid=b92748a4-4fab-42ae-
9378-a40a1ccc4396&acdnat=1552400738_a4e7ae79f2e55d0b3c3155d21af58ee2
101. Kharroubi SA, O’Hagan A, Brazier JE. Estimating utilities from individual health preference data: a nonparametric Bayesian method. J R Stat Soc Ser
C (Applied Stat [Internet]. 2005 Nov;54(5):879–95. Available from: http://doi.wiley.com/10.1111/j.1467-9876.2005.00511.x
102. Kharroubi SA, Brazier JE, Roberts J, O’Hagan A. Modelling SF-6D health state preference data using a nonparametric Bayesian method. J Health
Econ [Internet]. 2007 May;26(3):597–612. Available from: http://www.ncbi.nlm.nih.gov/pubmed/17069909
103. Walters SJ, Brazier JE. Comparison of the minimally important difference for two health state utility measures: EQ-5D and SF-6D. Qual Life Res. 2005
Aug;14(6):1523–32.
104. Kim S-K, Kim S-H, Jo M-W, Lee S. Estimation of minimally important differences in the EQ-5D and SF-6D indices and their utility in stroke. Health
Qual Life Outcomes [Internet]. 2015;13(1):32. Available from: http://hqlo.biomedcentral.com/articles/10.1186/s12955-015-0227-3
105. Rivero-Arias O, Gray A, Ramos-Goñi J. ESTIMATING THE ASSOCIATION BETWEEN SF-12 RESPONSES TO EQ-5D UTILITY VALUES USING A
RESPONSE MAPPING AND A PARAMETER UNCERTAINTY APPROACH. Value Heal [Internet]. 2010 Nov;13(7):A248. Available from:
https://linkinghub.elsevier.com/retrieve/pii/S1098301511718873
106. Chuang L-H, Kind P. Converting the SF-12 into the EQ-5D: An empirical comparison of methodologies. Pharmacoeconomics [Internet]. 2009
Jun;27(6):491–505. Available from: http://link.springer.com/10.2165/00019053-200927060-00005
107. Coyne KS, Sexton C, LoCasale RJ, King FR, Margolis MK, Ahmedzai SH. Opioid-Induced Constipation among a Convenience Sample of Patients with
Cancer Pain. Front Oncol [Internet]. 2016 Jun 8 [cited 2019 Apr 10];6:1. Available from: www.frontiersin.org
108. Jamal MM, Adams AB, Jansen J-P, Webster LR. A Randomized, Placebo-Controlled Trial of Lubiprostone for Opioid-Induced Constipation in Chronic
Noncancer Pain. Am J Gastroenterol [Internet]. 2015 May;110(5):725–32. Available from: http://insights.ovid.com/crossref?an=00000434-201505000-
00020
119
109. Penning-van Beest FJA, van den Haak P, Klok RM, Prevoo YFDM, van der Peet DL, Herings RMC. Quality of life in relation to constipation among
opioid users. J Med Econ [Internet]. 2010 Mar 3 [cited 2019 Feb 12];13(1):129–35. Available from: http://www.ncbi.nlm.nih.gov/pubmed/20128662
110. Guest JF, Clegg JP, Helter MT. Cost-effectiveness of macrogol 4000 compared to lactulose in the treatment of chronic functional constipation in the
UK. Curr Med Res Opin [Internet]. 2008 Jul 22;24(7):1841–52. Available from: http://www.tandfonline.com/doi/full/10.1185/03007990802102349
111. Greiner W, Lehmann K, Earnshaw S, Bug C, Sabatowski R. Economic evaluation of Durogesic in moderate to severe, nonmalignant, chronic pain in
Germany. Eur J Heal Econ. 2006;7(4):290–6.
112. Van der Linden M, van den Haak P, Penning-van Beest F, Klok R, Herings R. Pcn80 Patient Reported Quality of Life in Cancer Patients on Opioid
Therapy Is Influenced By Constipation. Value Heal [Internet]. 2011 Nov 1;11(6):A485. Available from: https://doi.org/10.1016/S1098-3015(10)66617-X
113. Iyer S, Randazzo B, Tzanis E, Schulman S, Zhang H, Wang W, et al. PG118 EFFECT OF SUBCUTANEOUS (SC) METHYLNALTREXONE ON
GENERIC HEALTH RELATED QUALITY OF LIFE USING THE EQ-5D INDEX SCORES IN PATIENTS WITH CHRONIC NON-MALIGNANT PAIN
AND OPIOID-INDUCED CONSTIPATION. Value Heal [Internet]. 2009 Oct 1 [cited 2019 Feb 12];12(7):A348–9. Available from:
https://linkinghub.elsevier.com/retrieve/pii/S1098301510747148
114. Guijarro P, Viqueira A, Alonso-Babarro A, Fernandez G. PGI28 HEALTH-RELATED QUALITY OF LIFE IN OPIOID INDUCED CONSTIPATION
PATIENTS IN SPAIN. Value Heal [Internet]. 2010 Nov 1 [cited 2019 Feb 12];13(7):A373. Available from:
https://linkinghub.elsevier.com/retrieve/pii/S1098301511725116
115. Georgiev GZ. P-value Calculator.
116. Parker M, Haycox A, Graves J. Estimating the relationship between preference-based generic utility instruments and disease-specific quality-of-life
measures in severe chronic constipation: Challenges in practice. Pharmacoeconomics [Internet]. 2011 Aug [cited 2019 Feb 13];29(8):719–30.
Available from: http://www.ncbi.nlm.nih.gov/pubmed/21635017
117. Rowen D, Brazier J, Roberts J. Mapping SF-36 onto the EQ-5D index: how reliable is the relationship? Health Qual Life Outcomes [Internet]. 2009

120
Jan;7:27. Available from: http://www.pubmedcentral.nih.gov/articlerender.fcgi?artid=2683169&tool=pmcentrez&rendertype=abstract
118. Hatswell AJ, Vegter S. Measuring quality of life in opioid-induced constipation: mapping EQ-5D-3 L and PAC-QOL. Health Econ Rev [Internet]. 2016
[cited 2019 Feb 13];6(1). Available from: https://www.ncbi.nlm.nih.gov/pmc/articles/PMC4839018/pdf/13561_2016_Article_91.pdf
119. Chey WD, Tack J, Webster L, Barker PN, Lappalainen J, Sostek M, et al. Naloxegol for Opioid-Induced Constipation in Patients with Noncancer Pain.
N Engl J Med. 2014;370(25):2387–96.
120. Herrett E, Gallagher AM, Bhaskaran K, Forbes H, Mathur R, Van Staa T, et al. Data Resource Profile: Clinical Practice Research Datalink (CPRD). Int
J Epidemiol [Internet]. 2015 Jun [cited 2019 Feb 8];44(3):827–36. Available from: http://www.ncbi.nlm.nih.gov/pubmed/26050254
121. Drug R, Centre T. Regional Drug and Therapeutics Centre (Newcastle) Cost Comparison Charts. 2019;1–75. Available from:
http://gmmmg.nhs.uk/docs/cost_comparison_charts.pdf
122. Digital N. HRG4+ 2018/19 Local Payment Grouper [Internet]. 2019. Available from: https://digital.nhs.uk/services/national-casemix-office/downloads-
groupers-and-tools/payment---hrg4-2018-19-local-payment-grouper
123. NHS England. National Tariff for 2017/18 and 2018/19 [Internet]. 2019. Available from: https://www.england.nhs.uk/pay-syst/national-tariff/tariff-
engagement/
124. Curtis L, Burns A. Unit Costs of Health and Social Care 2018 | PSSRU [Internet]. University of Kent, Canterbury; [cited 2019 Mar 20]. Available from:
https://www.pssru.ac.uk/project-pages/unit-costs/unit-costs-2018/
125. Dunlop W, Uhl R, Khan I, Taylor A, Barton G. Quality of life benefits and cost impact of prolonged release oxycodone/naloxone versus prolonged
release oxycodone in patients with moderate-to-severe non-malignant pain and opioid-induced constipation: a UK cost-utility analysis. J Med Econ.
2012;15(3):564–75.

121

122
B.5 Appendices
Appendix C: Summary of product characteristics (SmPC) and European public assessment report
(EPAR)
See Separate downloaded file market Appendix C
Appendix E: Subgroup analysis
See clinical section B.2.
Appendix F: Adverse reactions
See clinical section B2.10
Appendix G: Published cost-effectiveness studies
See Cost effectiveness section B3.1

123
Appendix H: Health-related quality-of-life studies
Reference (Country)
Study objective regarding QOL in OIC
Study type (study length if applicable) Methods
Patient population
QOL instrument
Cancer
Coyne et al, 2016a (UK, Canada, Germany)
To describe baseline characteristics, including QOL, of patients with chronic cancer pain and OIC
Cross-sectional, patient survey and chart review data from the baseline assessment of an international, longitudinal study assessing OIC burden Sufficient laxative use defined as at least one laxative, ≥4 times over the past 2 weeks Details for EQ-5D are in Coyne et al, 2014
Patients with chronic cancer pain taking daily opioid therapy ≥30 mg for ≥4 weeks and self-reported OIC, n=31 (UK n=26; Germany n=4; Canada n=1) Laxative use: sufficient (n=22), insufficient (n=2),
EQ-5D PAC-QOL
a The newly identified study by Coyne et al (2016) is from the same AstraZeneca longitudinal study as previously identified studies (Coyne et al, 2014, 2015; Datto
et al, 2015; LoCasale et al, 2015). The previous studies assessed non-cancer pain patients, whereas Coyne et al (2016) assessed patients with cancer pain.

124
none (n=7)
Dhingra et al, 2013 (USA)
To use qualitative research methods to improve understanding of psychological distress and the burden associated with OIC in cancer patients with advanced disease
Semi-structured interviews Thematic content analysis of qualitative data collected from semi-structured interviews
Patients with advanced cancer and daily opioid use for ≥4 weeks being treated in a large urban hospital and who had self-reported constipation and use of oral laxative or enema for ≥3 days/week. Patient’s constipation had to be moderate or severe and distress rated
NA

125
as ‘quite a bit’ or ‘very much’ (n=12)
DYONISOS studya Abramowitz et al, 2013a (France)
To describe the impact of OIC on QOL in patients with cancer pain taking strong opioids
Cross-sectional patient survey Multicentre (77 centres), observational, cross-sectional survey (DYONISOS) at oncology day centres and hospitals, involving 77 physicians (oncologists, pain specialists and palliative care specialists)
Cancer pain patients (adults) taking strong opioids (hospitalized or outpatients), n=520 –Degree of constipation that was problematic for the patient according to KESS (score 9–39), n=321 (61.7%) –Consid
SF-12 PAC-QOL Global impact of bowel dysfunction on patient’s QOL
a Two publications have been included from the same multicentre, observational, cross-sectional study in France (DYONISOS: DYsfonctiONs Intestinales induiteS
par les OpioïdS forts) (Abramowitz et al, 2013a, 2013b). In the context of this study, cross-sectional means at one point in time; the population may be selected on certain characteristics.

126
ered constipated according to the physician's subjective assessment, despite laxative use, n=438 (84.2%)
Abramowitz et al, 2013b (France)
To investigate the correlation of the BFI scale with QOL tools in opioid-requiring cancer patients (for further validation of the BFI)
Cancer pain patients (adults) taking strong opioids (hospitalized or outpatients), n=520
SF-12 PAC-QOL
Non-cancer
Gupta et al, 2015 (USA)
To characterize QOL associated with modifications to opioid therapy
Cross-sectional patient survey Analysis of data from OIC respondents
Non-cancer patients (≥18 y) who experienced pain within
PAC-QOL
127
due to OIC in patients with non-cancer pain, using opioid pain medication for ≥30 days, and OIC
in either the 2012 NHWS (self-administered, cross-sectional, lnternet-based questionnaire survey, n=71,141 adults), or the Lightspeed Research Ailment Panel. OIC respondents were divided into ‘modifiers’ (made modifications to opioid therapy due to OIC) and ‘nonmodifiers’ (made no modifications).c Generalized linear models were adjusted to control for baseline characteristics (e.g. age, gender, comorbidities and opioid strength). For QOL (as well as severity of
the last 1 month, were receiving chronic (≥30 days) prescription opioid treatment, and had OIC, n=504 (2012 NHWS, n=477; Lightspeed Research Ailment Panel, n=27) –OIC respondents analysed, n=491 (modifiers n=244 and nonmodifiers n=247)

128
constipation and treatment satisfaction measures), multivariable generalized linear regression models with a normal distribution were performedd
Rauck et al, 2017 (USA)
To understand the impact (including on QOL) of OIC on patients with chronic non-cancer pain
Patient survey in patient magazine 11-question OIC survey (designed for the study) undertaken by PainPathways magazine conducted between 2014 and 2015 to readers in two campaigns Question 1 asked about QOL in general: ‘How has OIC impacted your quality of life?
Chronic non-cancer patients treated with OIC, n=489 (n=322 online survey, n=167 through business supply cards) Question 1 responders, n=448
Survey question

129
(Select all that apply)’ Impaired work performance/ productivity Inability to perform daily tasks e.g., running errands; household chores; exercise Limits social interactions with friends and family Limits sexual intimacy Impacts dietary choices due to seeking relief or bloating/abdominal discomfort Limits ability to leave house
Tuteja et al, 2010 (USA)
To assess the effect of opioid-induced bowel
Cross-sectional patient survey Patients were
Ambulatory chronic non-cancer pain patient
TOPSa
a Treatment Outcomes in Pain Survey (TOPS) is a validated pain-sensitive QOL instrument that includes the SF-36 questionnaire. In addition to the SF-36 domains,
TOPS comprises a 120-item questionnaire measuring 14 health domains in patients with chronic pain(1) lower body functional limitations; (2) upper body functional limitations; (3) pain symptoms; (4) total pain experience; (5) perceived family/social disability; (6) objective family/social disability; (7) objective work disability; (8) fear avoidance; (9) life control; (10) passive coping; (11) solicitous response; (12) work limitations; (13) patient satisfaction with outcome; and (14) patient satisfaction with healthcare. For each dimension, scores are coded, summed and transformed on a scale from 0 (worst possible health state measured) to 100 (best possible health state).
130
disorder symptoms (including constipation) on QOL in chronic non-cancer pain patients
attending a tertiary care referral clinic Patients’ GI symptoms were classified according to Rome II criteria into groups (chronic constipation, bloating, GERD, chronic abdominal pain, narcotic bowel syndrome), and opioid bowel dysfunction was defined by the presence of constipation, bloating, abdominal distension, GERD, nausea and vomiting
s taking regularly scheduled opioids n=98 OIC, n=46 (46.9%) Laxative use, n=34/46 (74%)
Longitudinal patient survey (24 weeks)a Coyne et al, 2014
To describe baseline
Cross-sectional, patient
Patients with chronic
EQ-5D
a Four publications have been included from the same international longitudinal survey that assessed OIC burden (including QOL) in patients with chronic non-
cancer pain and self-reported OIC (Coyne et al, 2014, 2015; Datto et al, 2015; LoCasale et al, 2015).

131
(USA, Canada, Germany and UK)
characteristics, including QOL, of patients with chronic non-cancer pain and OIC
survey and chart review data from the baseline assessment of an international, longitudinal study assessing OIC burden Patients completed the EQ-5D on site using a paper-based format, and the data were entered into the Internet-based data capture system. Scoring was based on developer guidelines and weighted by country (Rabin et al, 2011)
non-cancer pain taking daily opioid therapy ≥30 mg for ≥4 weeks and self-reported OIC, n=493 (USA n=242; Canada n=38; Germany n=115; UK n=98)
Datto et al, 2015 [A] (USA, Canada, Germany and UK)
To examine the QOL impact of OIC on patients with different types of chronic
Analysis of an international, longitudinal (24-week) web-based survey assessing OIC burden
Patients aged 18–85 years receiving daily opioids for ≥4 weeks for
PAC-QOL
132
non-cancer pain with a focus on patients with chronic back pain
Patients completed a range of instruments. This meeting abstract only reports data from the PAC-QOL with regards to QOL
chronic non-cancer pain Of 489 eligible OIC patients, 89 (18.2%) had back pain, 286 (58.5%) back pain plus other pain and 114 (23.3%) other pain only
Coyne et al, 2015 (USA, Canada, Germany and UK)
To understand the burden of OIC (including QOL) and the experience of constipation treatment over time in patients with chronic non-cancer
Analysis of an international, longitudinal (24-week) web-based survey assessing OIC burden Patients completed an Internet-based survey at Baseline and Weeks 2, 4, 6, 8, 12, 16, 20, and 24
Patients with chronic non-cancer pain taking daily opioid therapy for ≥4 weeks and self-reported OIC in the previous 2 weeks
PAC-QOL
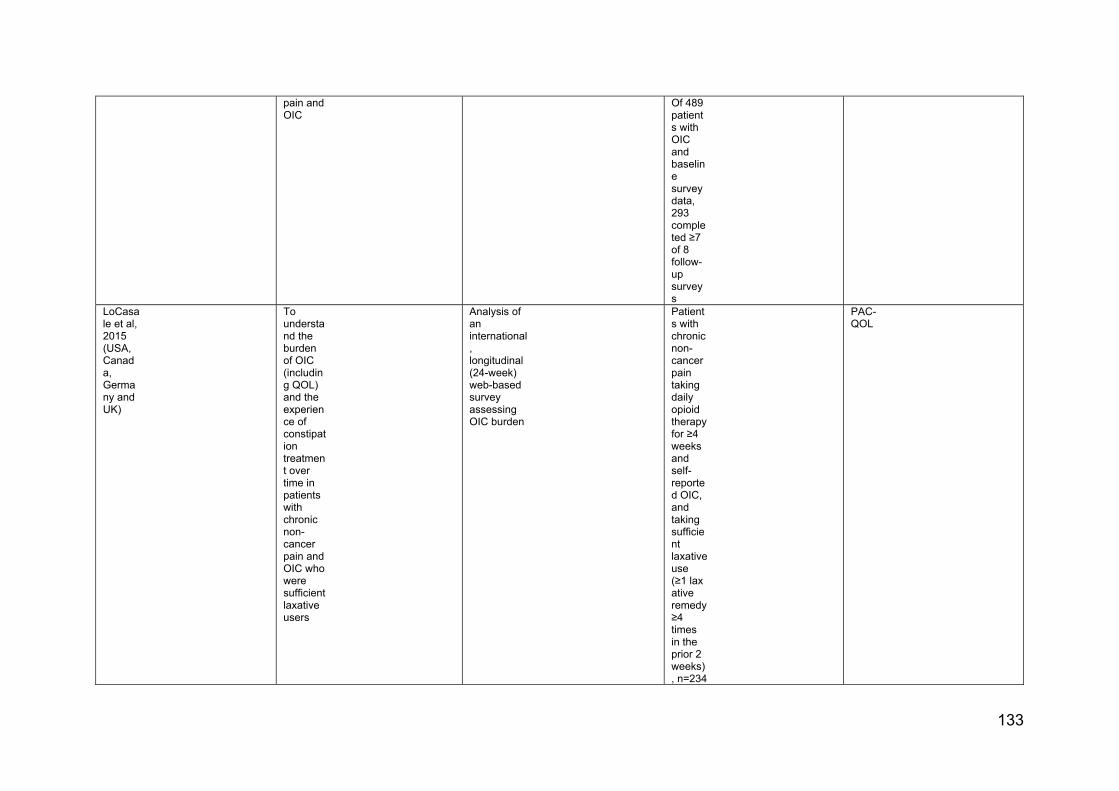
133
pain and OIC
Of 489 patients with OIC and baseline survey data, 293 completed ≥7 of 8 follow-up surveys
LoCasale et al, 2015 (USA, Canada, Germany and UK)
To understand the burden of OIC (including QOL) and the experience of constipation treatment over time in patients with chronic non-cancer pain and OIC who were sufficient laxative users
Analysis of an international, longitudinal (24-week) web-based survey assessing OIC burden
Patients with chronic non-cancer pain taking daily opioid therapy for ≥4 weeks and self-reported OIC, and taking sufficient laxative use (≥1 laxative remedy ≥4 times in the prior 2 weeks), n=234
PAC-QOL

134
Cancer and non-cancer Bell et al, 2009a (USA and Europe [France, Germany, Italy, Spain, UK])
To assess the impact of OBD symptoms, including constipation, on QOL in patients receiving oral opioids for chronic pain, and taking laxatives
Cross-sectional patient survey Multinational, Internet-based survey (PROBE 1)
Patients taking daily oral opioids for self-reported chronic pain (including cancer and non-cancer pain), and taking laxatives, n=322
45-item online questionnaire (not validated) included questions on the impact of patients’ five most bothersome OBD symptoms on QOL
Bell et al, 2009b (USA and Europe [France, Germany, UK])
To characterize the impact of OIC on generic QOL (physical and mental components) in patients receiving chronic opioid therapy
Cross-sectional patient survey Analysis of data from the 2004 NHWS, a large, comprehensive, international, cross-sectional healthcare Internet survey. Responses were compared
Patients (≥18 y) who reported taking opioids for ≥6 months (cancer and non-cancer), n=2430 –With OIC (n=359) and without OIC
SF-8

135
between chronic pain patients with vs without OIC, and between chronic pain patients vs respondents with other chronic conditions
(n=2071) –With other chronic conditions: migraine (n=16,440), CHF (n=1093), diabetes (n=5600), hypertension (n=17,525), depression (n=12,718), IBS (n=5598), GERD (n=7475), arthritis (n=13,174)
Christensen et al, 2016 (Norway)
To describe QOL in chronic pain patients who ever experienced OIC, overall, and accordin
Cross-sectional patient survey Online survey comprised a series of multiple choice, close-ended, and
Patients (>18 y) with chronic pain requiring long-term opioid treatment, with OIC
EQ-5D
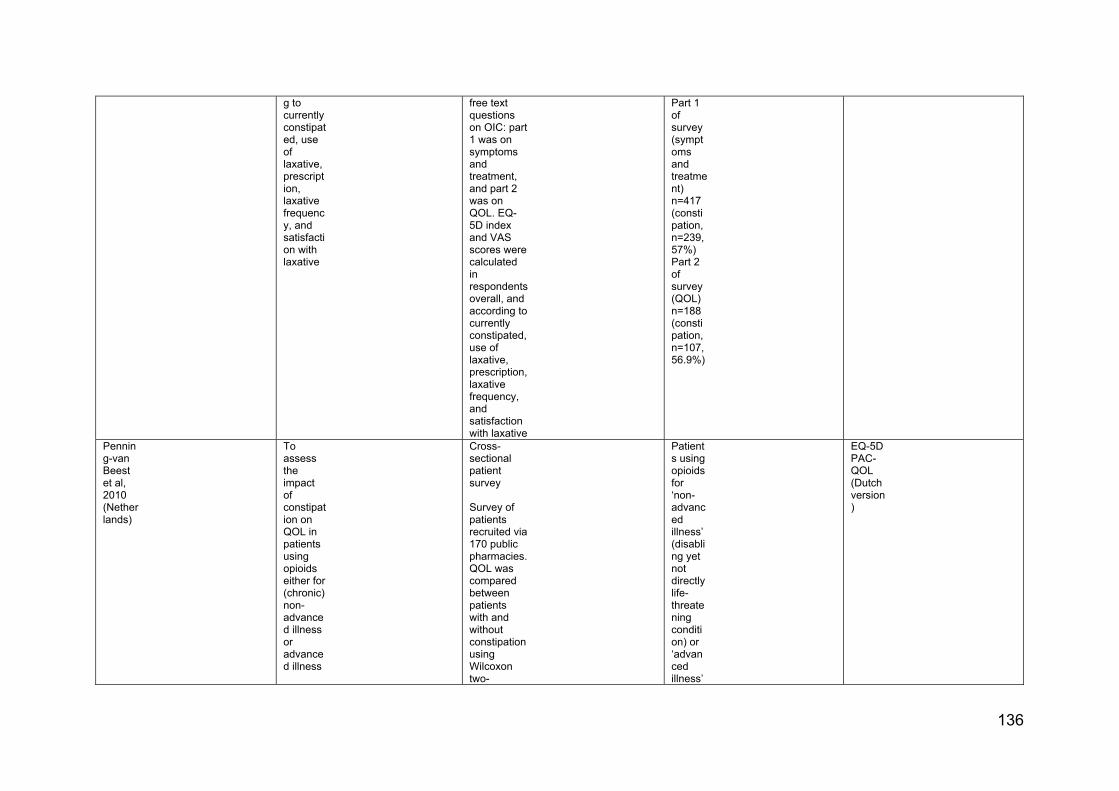
136
g to currently constipated, use of laxative, prescription, laxative frequency, and satisfaction with laxative
free text questions on OIC: part 1 was on symptoms and treatment, and part 2 was on QOL. EQ-5D index and VAS scores were calculated in respondents overall, and according to currently constipated, use of laxative, prescription, laxative frequency, and satisfaction with laxative
Part 1 of survey (symptoms and treatment) n=417 (constipation, n=239, 57%) Part 2 of survey (QOL) n=188 (constipation, n=107, 56.9%)
Penning-van Beest et al, 2010 (Netherlands)
To assess the impact of constipation on QOL in patients using opioids either for (chronic) non-advanced illness or advanced illness
Cross-sectional patient survey Survey of patients recruited via 170 public pharmacies. QOL was compared between patients with and without constipation using Wilcoxon two-
Patients using opioids for ‘non-advanced illness’ (disabling yet not directly life-threatening condition) or ‘advanced illness’
EQ-5D PAC-QOL (Dutch version)

137
samples test
(noncurable disease and relatively short life-expectancy), n=701 –Non-advanced illness (e.g. low back pain), n=588 (constipation, n=326) –Advanced illness (all cancer), n=113 (constipation, n=76)
A, conference abstract; GERD, gastro-esophageal reflux disease; TOPS, Treatment Outcomes in Pain Survey.

138
Table 3. Key findings in relation to QOL burden in patients with OIC Reference Key QOL findingsCancer Coyne et al, 2016
The study showed low QOL scores, both PAC-QOL and EQ-5D, in the cancer pain patients with OIC. The mean (SD) EQ-5D index score was 0.54 (0.28), and the mean (SD) EQ-5D VAS score
was 54.4 (16.3). The mean (SD) PAC-QOL physical discomfort, psychosocial discomfort, and worries and
concerns domain scores were 1.7 (1.0), 1.2 (1.1), and 1.9 (1.1), respectively. Dhingra et al, 2013
In this qualitative study, patients experienced negative ‘affect’ and cognitions associated with OIC. These were classified into three main themes: irrational thoughts and educational needs; psychological distress from constipation; the effects of constipation on the decision to use opioid analgesics
DYONISOS studya
Abramowitz et al, 2013a
Patients taking strong opioids for cancer pain were frequently constipated, despite a high rate of laxative use, and this was associated with significant impairments in most QOL domains (PAC-QOL and SF-12). Patients who were ‘very’ or ‘extremely’ constipated were most severely affected
Abramowitz et al, 2013b
QOL scores (PAC-QOL and SF-12) were significantly worse in constipated vs non-constipated patients, overall and for all QOL domains
Non-cancerGupta et al, 2015
After adjustment, constipation-specific QOL was significantly higher in opioid modifiers than in nonmodifiers (PAC-QOL total score and all domain scores except for the satisfaction domain)
Rauck et al, 2017
In 448 patients who responded to the QOL question, the category with the highest response rate (84.2%) was for OIC impacting dietary choices due to seeking relief or bloating/abdominal discomfort. High rates (ranging 38.2% to 48.9%) were also seen for all other categories, showing that OIC has a wide ranging negative impact on performing daily tasks, sexual intimacy, social interactions, ability to leave the house and work performance/productivity
Tuteja et al, 2010
All QOL domain scores (both SF-36 and the pain sensitive TOPS) were similar in patients with versus without constipation
Longitudinal patient survey (24 weeks)b
a Two publications are from the same multicentre, observational, cross-sectional study in France (DYONISOS: DYsfonctiONs Intestinales induiteS par les OpioïdS
forts) (Abramowitz et al, 2013a, 2013b). b Four publications are from the same international longitudinal survey (Coyne et al, 2014, 2015; Datto et al, 2015; LoCasale et al, 2015).

139
Coyne et al, 2014
At baseline, OIC patients had a low level of generic QOL (EQ-5D) vs previously published values in patients with chronic pain alone or other chronic medical conditions
Datto et al, 2015 [A]
QOL (PAC-QOL) scores were significantly worse among back pain patients vs ‘other pain only’ patients on the psychosocial discomfort domain and the worries and concerns domain (it is not clear from the abstract if this is a baseline or 24-week analysis)
Coyne et al, 2015
QOL (PAC-QOL) was mild-to-moderately impacted by patients’ constipation at baseline (physical discomfort, psychosocial discomfort and worries and concerns domains). Over the 24-week follow-up period, PAC-QOL scores remained relatively unchanged
LoCasale et al, 2015
Despite sufficient laxative use, constipation persisted, and patients’ QOL (PAC-QOL) was moderately impacted by their constipation. Over the 24-week follow-up period, PAC-QOL scores remained relatively unchanged
Cancer and non-cancer Bell et al, 2009a
OBD symptoms, including OIC, persist despite laxatives, and negatively impacted QOL (45-item online questionnaire). Importantly, the QOL burden was present regardless of the frequency of opioid use
Bell et al, 2009b
OIC negatively impacted both physical and mental components of generic QOL (SF-8). The chronic pain patients with OIC had similar or worse QOL than NHWS respondents with chronic conditions and painful conditions
Christensen et al, 2016
Patients with chronic pain who ever experienced OIC had a low QOL (EQ-5D index and VAS scores), especially those who were dissatisfied with their laxative, and those with a high (daily) laxative frequency. Current constipation was associated with a trend towards decreased QOL
Penning-van Beest et al, 2010
Constipation had a negative impact on QOL (EQ-5D and PAC-QOL) in patients using opioids either for non-advanced illness (disabling yet not directly life-threatening condition) or advanced illness (noncurable disease and relatively short life-expectancy; all cancer). The QOL impact of constipation was similar in the two patient groups; thus even in patients with a life-threatening disease, constipation causes a major impairment to QOL
A, conference abstract.

Summary of QOL findings
Coyne et al, 2016
QOL
An international longitudinal survey assessed OIC burden (including QOL) in patients with chronic pain
and self-reported OIC (UK, Canada, Germany). Four publications have been included from this study,
focusing on non-cancer pain patients (Coyne et al, 2014, 2015; Datto et al, 2015; LoCasale et al, 2015).
In contrast, Coyne et al (2016) focused on cancer pain patients with OIC. The study provided a
descriptive analysis of baseline data, including generic QOL (EQ-5D) and constipation-specific QOL
(PAC-QOL), in 31 OIC patients who completed the baseline patient questionnaire. The study showed
low QOL scores, both PAC-QOL and EQ-5D, in the cancer pain patients with OIC (Table 4). The
authors stated that the values reflect the considerable disease burden in these patients.
Table 4. PAC -QOL and EQ-5D scores at baseline (Coyne et al, 2016)
QOL measures Mean (SD)
PAC-QOLa (n=31)
Physical discomfort
Psychosocial discomfort
Worries and concerns
1.7 (1.0)
1.2 (1.1)
1.9 (1.1)
EQ-5D indexb (n=30) 0.54 (0.28)
EQ-5D VASc (n=30) 54.4 (16.3)
a Scores range from 0 to 4, with lower scores indicating better QOL. b Country-specific weights were used to calculate scores. EQ-5D Index scores range from 0 (death) to 1
(full health). c The EQ-5D VAS ranges from 0 (“worst imaginable health state”) to 100 (“best imaginable health
state”).
Observations on this study
The authors compared the findings from this study of 31 cancer pain patients (Coyne et al, 2016) with
one of the earlier studies from the same longitudinal survey in non-cancer pain patients (LoCasale et al,
2015). LoCasale et al (2015) reported PAC-QOL scores at baseline and over 24 weeks in 234 OIC
patients who were sufficient laxative users at baseline. Cancer patients with OIC had slightly better
overall QOL than non-cancer patients with OIC (EQ-5D index 0.54 vs 0.49; EQ-5D VAS 54.4 vs 50.4).
(The authors did not discuss possible reasons.) In addition, cancer pain patients with OIC had a higher
prevalence of sufficient laxative use than non-cancer pain patients with OIC (71% [n=22] vs 48%
[n=234]). The authors suggested this may be because the cancer patients had a higher rate of
discussion about OIC (77% [n=24] vs 63% [n=309]). Another explanation is that the cancer patients
reported shorter durations of pain and opioid use (values in the Discussion of Coyne et al, 2016).
Because non-cancer patients had been coping with OIC for longer, they may perceive a new “normal”

141
regarding OIC. Coyne et al (2016) noted that the cancer pain patients in their study experienced
burdensome constipation despite being more likely to be sufficient laxative users.
The authors also compared their baseline PAC-QOL scores to the baseline PAC-QOL scores in the
study by Abramowitz et al (2013) (the multicentre, observational, cross-sectional survey in France
included in this report). Both studies were in cancer pain patients. The PAC-QOL scores in the OIC
patients in Coyne et al (2016) were similar to those in the OIC patients in Abramowitz et al (2013), and
were substantially worse than the scores in non-OIC patients in Abramowitz et al (2013).
Coyne et al (2016) noted that 43% (n=12) of their cancer pain patients reported that OIC at least
moderately interfered with their pain management.
Limitations of the study were described. The study had a small sample size. The target number of
patients was initially 150, but the investigators found the recruitment of cancer pain patients difficult.
Recruitment was truncated at 13 months, with only 31 patients. The patients were primarily from the UK
(n=26), with some patients from Germany (n=4) and Canada (n=1), and none from the USA. The
authors suggested that cancer pain patients are burdened with research and other treatment
considerations, and this decreased their interest in participating in a non-interventional, observational
study. The authors noted that the small sample size limits the generalizability of the findings and the
precision regarding the reported point estimates. They suggested that challenges in recruiting cancer
pain patients need to be understood and resolved for future studies.
Another limitation was that patients’ current bowel habits could not be compared to those before opioid
use. Therefore, it was not possible to differentiate OIC from long-term constipation for other reasons.
Rauck et al, 2017
QOL
This 11-question OIC survey was undertaken in the USA to assess OIC-related issues in patients with
non-cancer chronic pain. Question 1 asked about QOL in general: ‘How has OIC impacted your quality
of life? (Select all that apply)’. Patients reported that OIC has a wide-ranging impact on QOL, including
dietary choices, performing daily tasks, sexual intimacy, social interactions, ability to leave the house
and work performance/productivity.
A total of 448 patients responded to the QOL question, and results are shown in Figure 1. The category
with the highest response rate (84.2%) was for OIC impacting dietary choices due to seeking relief or
bloating/abdominal discomfort. High rates (ranging 38.2% to 48.9%) were also seen for all other
categories, showing that OIC has a wide ranging negative impact on performing daily tasks, sexual
intimacy, social interactions, ability to leave the house and work performance/productivity.

142
Figure 1. Rate of patients selecting each category from question 1, ‘How has OIC impacted your
quality of life? (Select all that apply)’ (Rauck et al, 2017)
Observations on this study
In this study, there was only one question, which, therefore, yields limited insights. The question was
posed in a way that did not provide any quantitative data, and may have been interpreted in different
ways by different people.
The authors stated that their QOL findings were similar those in previous surveys in chronic non-cancer
pain patients with OIC (Coyne et al, 2014,2015). Although these previous surveys used the PAQ-QOL
instrument, Rauck et al (2017) believe their survey question addressed the major categories in the PAC-
QOL, and in addition provided information on sexual intimacy and dietary choices. These two categories
do not seem to have been studied before, and authors suggest they may need to be included in
standardized assessments for patients on opioids.
Interestingly, one of the other survey questions showed that 57.0% of patients (n=272/477) reported that
they had taken less opioid medication than prescribed or stopped taking it because of side effects. A
follow-up question showed that the main reason for this was constipation and/or discomfort related to
constipation in 90.0% of patients (n=198/381) (Figure 3 in the paper). This was followed by sedation
(22.3% of patients), nausea and vomiting (26.4%) and other (20.5%). The most common ‘other’
responses (n=45) was GI symptoms such as constipation, diarrhoea or symptom suggestive of irritable
bowel syndrome (31%; n=14).
Tuteja et al, 2010
QOL

143
This was a cross-sectional patient survey of 98 patients with chronic non-cancer pain taking regularly
scheduled opioids at a tertiary care referral pain clinic in the USA. The study assessed QOL in patients
with opioid-induced symptoms of constipation (47% of patients), GERD (33%), nausea (27%), vomiting
(9%), and chronic abdominal pain (58.2%) versus patients without each of these symptoms. QOL was
assessed using the Treatment Outcomes in Pain Survey (TOPS), a pain-sensitive QOL instrument that
incorporates the SF-36.
All QOL domain scores (both SF-36 and TOPS) were similar in patients with versus without constipation
(Table 5). Only abdominal pain was significantly associated with decreased QOL on many SF-36 and
TOPS domains (data provided in the paper). The authors concluded that decreased QOL in patients
with chronic non-cancer pain is driven by chronic abdominal pain.
Table 5. QOL scores in patients with and without OIC (Tuteja et al, 2010)
Mean score
OIC (n=46) No OIC (n=52)
SF-36
Physical functioning 39 43
Role physical 11 16
Body pain 27 25
Health perception 38 46
Vitality 24 33
Social functioning 41 42
Role emotional 41 37
Mental health 51 52
Physical health summary 28 32
Mental health summary 38 38
TOPS
Pain symptom 69 73
Lower body functional limitation 60 55
Perceived family/social disability 59 54
Objective family/social disability 73 70
Objective work disability 34 24
Total pain experience 62 59
Life control 46 52
Passive coping 48 45
Solicitous response 53 62
Upper body functional limitations 23 9*
Work limitations 48 42

144
Fear avoidance 54 54
Patient satisfaction with outcomes 52 47
Healthcare satisfaction 65 62
*p<0.05.
Observations on this study
This study used a pain-sensitive QOL instrument (TOPS, which incorporates SF-36), and did not find a
difference in QOL between patients with versus without constipation. Abdominal pain was significantly
associated with decreased QOL, and the authors concluded that decreased QOL was driven by chronic
abdominal pain. They quoted two population-based studies on constipation and functional bowel
disorders that they state also show pain to be the main determinant of QOL rather than other symptoms
(Tuteja et al, 2005; Cain et al, 2006a).
Abramowitz L, Béziaud N, Labreze L, Giardina V, Caussé C, Chuberre B, Allaert FA, Perrot S. Prevalence and impact of constipation and bowel dysfunction induced by strong opioids: a cross-sectional survey of 520 patients with cancer pain: DYONISOS study. J Med Econ 2013a;16:1423–33. Abramowitz L, Béziaud N, Caussé C, Chuberre B, Allaert FA, Perrot S. Further validation of the psychometric properties of the Bowel Function Index for evaluating opioid-induced constipation (OIC). J Med Econ 2013b;16:1434–41. Alemayehu, B., Coyne, K. S. and King, F. Self reported health care resource use and indirect economic burden of opioid induced constipation (OIC). Value Health 2014;17(7): A541. Bell TJ, Panchal SJ, Miaskowski C, Bolge SC, Milanova T, Williamson R. The prevalence, severity, and impact of opioid-induced bowel dysfunction: results of a US and European Patient Survey (PROBE 1). Pain Med 2009a;10:35–42. Bell T, Annunziata K, Leslie JB. Opioid-induced constipation negatively impacts pain management, productivity, and health-related quality of life: findings from the National Health and Wellness Survey. J Opioid Manag 2009b;5:137–44. Caekelbergh K, Lamotte M, Van Megen Y. Management of opioid induced constipation (OIC) in pain patients: a cost of illness study in Belgium and the Netherlands. Value Health 2009;12: A347. Candrilli SD, Davis KL, Iyer S. Impact of constipation on opioid use patterns, health care resource utilization, and costs in cancer patients on opioid therapy. J Pain Pall Care Pharmacother 2009;23:231–41. Christensen HN, Olsson U, From J, Breivik H. Opioid-induced constipation, use of laxatives, and health-related quality of life. Scand J Pain 2016;11:104–10. Coyne KS, LoCasale RJ, Datto CJ, Sexton CC, Yeomans K, Tack J. Opioid-induced constipation in patients with chronic noncancer pain in the USA, Canada, Germany, and the UK: descriptive analysis of baseline patient-reported outcomes and retrospective chart review. Clinicoecon Outcomes Res 2014;6:269–81. Coyne KS, Margolis MK, Yeomans K, King FR, Chavoshi S, Payne KA, LoCasale RJ. Opioid-induced constipation among patients with chronic noncancer pain in the United States, Canada, Germany, and the United Kingdom: Laxative use, response, and symptom burden over time. Pain Med 2015;16:1551–65. Coyne KS, Sexton C, LoCasale RJ, King FR, Margolis MK, Ahmedzai SH. Opioid-Induced Constipation among a convenience sample of patients with cancer pain. Front Oncol 2016;6:131. Datto C, LoCasale R, Wilson H, Coyne K. Does the impact of OIC differ by type of chronic pain? Presented at PainWeek 2015. http://conference.painweek.org/scientificposters/2015-accepted-abstracts. Dean D, Juchniewicz J, Bridgeman M. Unmet needs in opioid induced constipation: Results of a patient survey. Presented at AMCG 2015. Available at: http://acgmeetings.gi.org/pdfs/ACG15_FinalProgram_web.pdf Dhingra L, Shuk E, Grossman B, Strada A, Wald E, Portenoy A, Knotkova H, Portenoy R. A qualitative study to explore psychological distress and illness burden associated with opioid-induced constipation in cancer patients with advanced disease. Palliat Med 2013;27:447–56. Fernandes AW, Kern DM, Datto C, Chen YW, McLeskey C, Tunceli O. Increased burden of healthcare utilization and cost associated with opioid-related constipation among patients with noncancer pain. Am Health Drug Benefits 2016;9:160–70.
a References not obtained to verify statement.

145
Guijarro P, Alonso-Babarro A, Viqueira A, Fernandez G. Economic burden of opioid induced constipation in Spain. Value Health. 2010;13:A369. Gupta A, Coyne KS, Datto C, Venuti C. The burden of opioid-induced constipation in younger patients with chronic pain. PAINWeek Abstract Book 2016, Postgrad Med,128:sup2, 1–105. Gupta S, Patel H, Scopel J, Mody RR. Impact of constipation on opioid therapy management among long-term opioid users, based on a patient survey. J Opioid Manag 2015;11:325–8. Hjalte F, Berggren AC, Bergendahl H, Hjortsberg C. The direct and indirect costs of opioid-induced constipation. J Pain Symptom Manage 2010;40:696–703. Iyer S, Davis KL, Candrilli S. Opioid use patterns and health care resource utilization in patients prescribed opioid therapy with and without constipation. Manag Care 2010;19:44–51. Kwong WJ, Diels J, Kavanagh S. Costs of gastrointestinal events after outpatient opioid treatment for non-cancer pain. Ann Pharmacother 2010;44:630–40. LoCasale RJ, Datto CJ, Margolis MK, Tack J, Coyne KS. The impact of opioid-induced constipation among chronic pain patients with sufficient laxative use. Int J Clin Pract 2015;69:1448–56. Ovanfors A, Kasteng F, Borgstrom F, Iyer S. Resource utilization and costs associated with opioid induced constipation (OIC) in cancer patients in Sweden. Value Health. 2009;12:A348. Penning-van Beest FJ, van den Haak P, Klok RM, Prevoo YF, van der Peet DL, Herings RM. Quality of life in relation to constipation among opioid users. J Med Econ 2010;13:129–35. Rauck RL, Hong KJ, North J. Opioid-induced constipation survey in patients with chronic noncancer pain. Pain Pract. 2017;17:329-335. Suh D-C, Kim MS, Chow W, et al. Use of medications and resources for treatment of nausea, vomiting or constipation in hospitalized patients treated with analgesics. Clin J Pain 2011;27:508–17. Takemoto MLS, Fernandes RA, Almeida GR, et al. Health care resource use and costs in opioid-treated patients with and without constipation in Brazil. Value Health 2011;14:S78–S81. Tuteja AK, Biskupiak J, Stoddard GJ, Lipman AG. Opioid-induced bowel disorders and narcotic bowel syndrome in patients with chronic non-cancer pain. Neurogastroenterol Motil 2010;22:424–30, e96. Wan Y, Corman S, Gao X, et al. Economic burden of opioid-induced constipation among long-term opioid users with noncancer pain. Am Health Drug Benefits 2015;8:93–102. Wee B, Adams A, Thompson K, et al. How much does it cost a specialist palliative care unit to manage constipation in patients receiving opioid therapy? J Pain Symptom Manage 2010;39:644–54. Other references Cain KC, Headstrom P, Jarrett ME, Motzer SA, Park H, Burr RL, Surawicz CM, Heitkemper MM. Abdominal pain impacts quality of life in women with irritable bowel syndrome. Am J Gastroenterol. 2006;101:124–32. Tuteja AK, Talley NJ, Joos SK, Woehl JV, Hickam DH. Is constipation associated with decreased physical activity in normally active subjects? Am J Gastroenterol 2005;100:124–9.

146
Appendix I: Cost and healthcare resource identification, measurement and
valuation
Primary care contacts were identified from the consultation table of the CPRD primary care dataset and
classified according to the combination of staff role and consultation type. Costs were derived from the
Units Costs of Health and Social Care 2017 (1) based on mapping tables derived internally.
Inpatient admissions were identified from the HES admitted subject care dataset and described by
number and cost. Healthcare resource groups (HRGs) were assigned to each inpatient admission and
processed using HRG 4 grouper software (National Casemix Office, Winchester, UK) (2). The allocated
HRG was then linked to the 2017 National Tariff (3) adjusting for the nature of the admission (elective
admissions versus emergency) and excess length of stay.
Outpatient appointments were identified from the HES outpatient dataset described by specialty and
processed using HRG 4 grouper software. The allocated HRG was then linked to the 2017 National
Tariff (3).
Prescriptions issued in primary care, recorded in the CPRD therapy table, were attributed an estimated
cost by applying the net ingredient cost (NIC) per prescription from the Prescription Cost Analysis (PCA)
for England 2017 (4). For prescriptions for discontinued products that were not listed in the PCA 2017,
the most recently published cost was used and adjusted to 2017 prices using the HM Treasury GDP
deflator index. Where an exact match was not made, the British National Formulary (BNF) taxonomy
will be utilized to attribute an average NIC per item for the BNF sub-paragraph, section or chapter.
References
1. Curtis L, Burns A. Unit Costs of Health & Social Care. 2016. Available from:
http://www.pssru.ac.uk/project-pages/unit-costs/2016/index.php (accessed 10 January 2018).
2. Health & Social Care Information Centre. HRG4 2016/17 Local Payment Grouper. National
Casemix Office, Winchester, UK. Available at: https://digital.nhs.uk/National-casemix-
office/downloads-groupers-and-tools (accessed 20 February 2018).
3. Monitor and NHS England. National Tariff Payment System 2016/17. 2013. Available from:
https://www.gov.uk/government/publications/nhs-national-tariff-payment-system-201617 (accessed 20
February 2018).
4. Prescribing & Medicines Team, NHS Digital. Prescription Costs Analysis, England – 2016.
Available from: https://www.gov.uk/government/statistics/prescription-cost-analysis-england-2016
(accessed 20 February 2018).

147
Identification of Employment burden of OIC
The tables below summarize the objectives and methods (Table I1), and the key findings (Table I2) for
the studies on the employment burden of OIC. The new studies are then described in more detail (Coyne
et al, 2016; Rauck et al, 2017; Tuteja et al, 2010).

Table I1. Objectives and methods in the employment burden studies Reference (Country)
Study objective regarding employment burden in OIC
Study type (study length if applicable) Methods
Patient population Method to capture employment or productivity data
Employment burden data (e.g. absenteeism, presenteeism)
Non-cancerGupta et al, 2015 (USA)
To characterise productivity losses associated with modifications to opioid therapy due to OIC in patients with non-cancer pain, using opioid pain medication for ≥30 days, and OIC
Cross-sectional patient survey Analysis of data from OIC respondents in either the 2012 NHWS (self-administered, cross-sectional, lnternet-based questionnaire survey, n=71,141 adults), or the Lightspeed Research Ailment Panel. OIC respondents were divided into ‘modifiers’ (made modifications to opioid therapy due to OIC) and ‘nonmodifiers’ (made no modifications)
Non-cancer patients (≥18 y) who experienced pain within the last 1 month, were receiving chronic (≥30 days) prescription opioid treatment, and had OIC, n=504 (2012 NHWS, n=477; Lightspeed Research Ailment Panel, n=27) OIC respondents analysed, n=491 (modifiers n=244 and nonmodifiers n=247) Modifiers were classified as those who had reported making modifications (reduced dose, changed medication, skipped doses, discontinued) to their OIC medication in the past 6 months Non-cancer patients (≥18 y) who experienced pain within the last 1 month, were receiving chronic (≥30 days) prescription opioid treatment, and had OIC. Nonmodifiers (n=247) were those who not made any of the defined changes to their OIC medication
WPAI questionnaire Administered as part of the NHWS 2012 questionnaire
Absenteeism Presenteeism Overall work impairment

149
Rauck et al, 2017 (USA)
To understand the impact (including on work productivity) of OIC on patients with chronic non-cancer pain
Patient survey in patient magazine
Chronic non-cancer patients treated with OIC, n=489 (n=33 online survey, n=167 through business supply cards)
Survey designed for study, question QOL included impact on work productivity 11-question OIC survey undertaken by PainPathways magazine conducted between 2014 and 2015 to readers in two campaigns
Absenteeism/ Presenteeism at work Question asked about ‘impaired work performance/ Productivity’ – unclear what precisely is being asked
Longitudinal patient survey (24 weeks)a
Alemayehu et al, 2014 [A] (USA, Canada, UK, Germany)
To describe the impact of OIC (diagnosis, treatment, management, attributed events) on job-related activities
Analysis of an international, longitudinal (24-week) web-based patient survey assessing OIC burden
Patients (18–85 years old) with chronic non-cancer pain taking daily oral opioid therapy ≥30 mg for ≥4 weeks, with self-reported OIC, n=489 (US n=238, Canada n=38, Germany n=115, UK n=98) Most common pain diagnosis: back pain (77%), joint pain (52%) Currently employed, 27%
WPAI-SHP questionnaire (administered at baseline and 24 weeks)
Absenteeism Presenteeism Overall work impairment
Coyne et al, 2014 (USA, Canada, Germany and UK)
To describe baseline characteristics, including work productivity, of patients with chronic non-cancer pain and OIC
Cross-sectional, patient survey and chart review data from the baseline assessment of an international, longitudinal study assessing OIC burden
Patients with chronic non-cancer pain taking daily opioid therapy ≥30 mg for ≥4 weeks and self-reported OIC, n=493 (USA n=242; Canada n=38; Germany n=115; UK n=98)
WPAI questionnaire Administered at baseline of a longitudinal patient survey
Absenteeism Presenteeism Overall work impairment
Gupta et al, 2016 [A] (USA, Canada,
To characterize the impact of OIC (including work productivity) in younger vs older non-
Post-hoc analysis of data from the previous international longitudinal observational survey (Coyne et al, 2014) in patients 18–85 years old
Chronic non-cancer pain patients on current opioid therapy (≥4 weeks of daily opioid therapy) with OIC in the past 2 weeks
WPAI questionnaire Administered at baseline of a longitudinal patient survey
Absenteeism Presenteeism Overall work impairment
a Four publications have been included from the same international longitudinal survey that assessed OIC burden (including employment burden) in patients with
chronic non-cancer pain and self-reported OIC (Alemayehu et al, 2014 [A]; Coyne et al, 2014; Gupta et al, 2016 [A]; LoCasale et al, 2015).

150
Germany, UK)
cancer pain patients (<50 vs 50–64 years)
The method is described in Coyne et al, 2014 n=419 <50 years, n=184 50–64 years, n=235
LoCasale et al, 2015 (USA, Canada, Germany and UK)
To understand the impact on work productivity of OIC (including QOL) and the experience of constipation treatment over time in patients with chronic non-cancer pain and OIC who were sufficient laxative users
Analysis of an international, longitudinal web-based survey assessing OIC burden (same study as Coyne et al, 2014)
Patients with chronic non-cancer pain taking daily opioid therapy for ≥4 weeks and self-reported OIC, and taking sufficient laxative use (≥1 laxative remedy ≥4× in the prior 2 weeks), n=234
WPAI questionnaire Longitudinal patient survey (same study as Coyne et al, 2014)
Absenteeism Presenteeism Overall work impairment
Cancer and non-cancer Bell et al, 2009b (USA)
To characterise the impact of OIC on work productivity (among other things, including QOL) in patients receiving chronic opioid therapy
Cross-sectional patient survey Analysis of data from the 2004 NHWS, a large, comprehensive, international, cross-sectional healthcare Internet survey. Responses were compared between chronic pain patients with vs without OIC, and between chronic pain patients vs respondents with other chronic conditions
Patients (≥18 y) who reported taking opioids for ≥6 months (cancer and non-cancer), n=2430 - with OIC (n=359), without OIC (n=2071) Patients (≥18 y) who reported taking opioids for ≥6 months (cancer and non-cancer), without OIC (n=2071)
WPAI questionnaire Administered as part of the NHWS 2004 questionnaire
Absenteeism Presenteeism Overall work impairment
Caekelbergh et al, 2009 [A] (Netherlands and Belgium)
To understand the economic burden of OIC on work productivity (and other costs) as estimated by GPs
Two-round Delphi panel with GPs
Cancer or non-cancer patients with OIC taking opioids, n=NA (Delphi Panel)
% of patients unable to work Estimation by GPs
Absenteeism from work
Dean et al, 2015 [A] (USA)
To understand the impact of OIC (among other things)
Cross-sectional patient survey with both qualitative and quantitative elements
Patients (≥18 y) with OIC currently taking an opioid and
Single question on the amount of time
Absenteeism

151
at least moderately bothered by constipation, n=105
missing work OR another activity Question as part of the online survey
Hjalte et al, 2010 (Sweden)
To estimate the indirect (and direct) costs of OIC in a patient population being treated with strong opioids using data gathered in a Swedish noninterventional study
Noninterventional observational study in patients on strong opioids (6 months)
Cancer and non-cancer patients with mild, moderate, severe constipation and treated with strong opioids, n=197 (n=29 cancer related, n=158 non-cancer related, n=9 combination) Comparison is for same patient cohort in months where there was no reported constipation
Questionnaire designed for the study Patients were asked about their ability to work (note that the disaggregated data are not included in the paper)
Absenteeism from work
A, conference abstract.
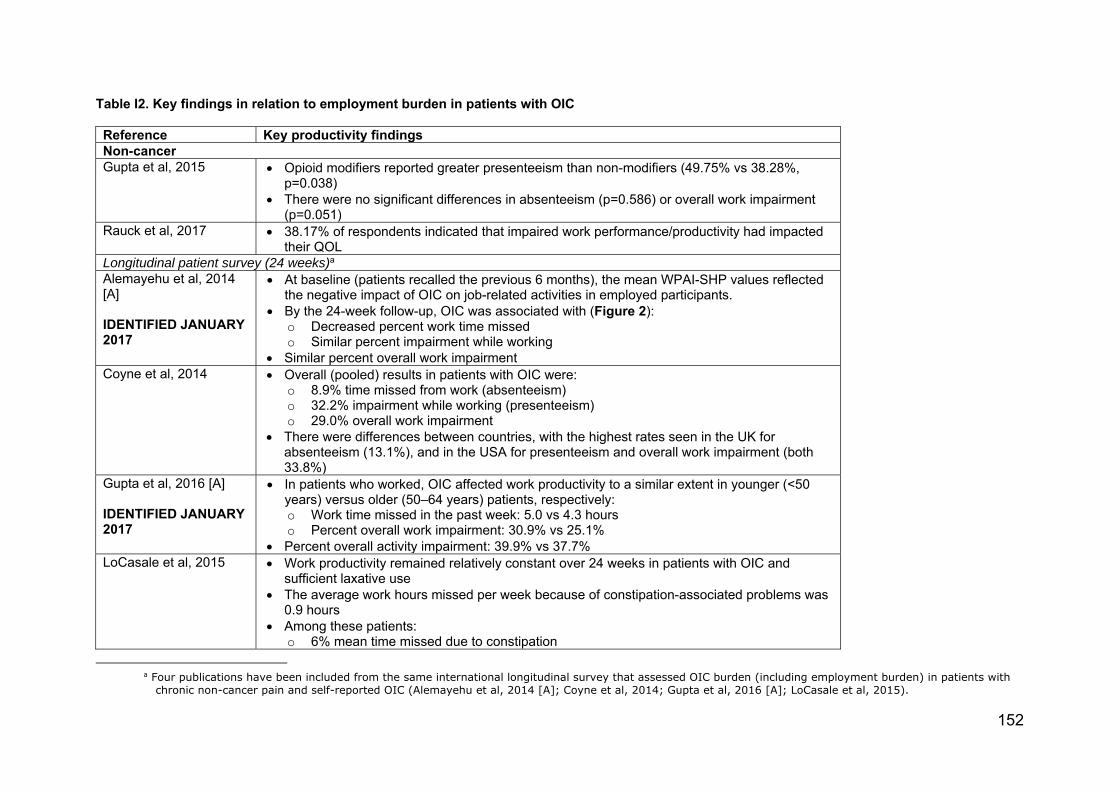
152
Table I2. Key findings in relation to employment burden in patients with OIC Reference Key productivity findingsNon-cancerGupta et al, 2015 Opioid modifiers reported greater presenteeism than non-modifiers (49.75% vs 38.28%,
p=0.038) There were no significant differences in absenteeism (p=0.586) or overall work impairment
(p=0.051)Rauck et al, 2017 38.17% of respondents indicated that impaired work performance/productivity had impacted
their QOLLongitudinal patient survey (24 weeks)a
Alemayehu et al, 2014 [A] IDENTIFIED JANUARY 2017
At baseline (patients recalled the previous 6 months), the mean WPAI-SHP values reflected the negative impact of OIC on job-related activities in employed participants.
By the 24-week follow-up, OIC was associated with (Figure 2): o Decreased percent work time missed o Similar percent impairment while working
Similar percent overall work impairmentCoyne et al, 2014 Overall (pooled) results in patients with OIC were:
o 8.9% time missed from work (absenteeism) o 32.2% impairment while working (presenteeism) o 29.0% overall work impairment
There were differences between countries, with the highest rates seen in the UK for absenteeism (13.1%), and in the USA for presenteeism and overall work impairment (both 33.8%)
Gupta et al, 2016 [A] IDENTIFIED JANUARY 2017
In patients who worked, OIC affected work productivity to a similar extent in younger (<50 years) versus older (50–64 years) patients, respectively: o Work time missed in the past week: 5.0 vs 4.3 hours o Percent overall work impairment: 30.9% vs 25.1%
Percent overall activity impairment: 39.9% vs 37.7%LoCasale et al, 2015 Work productivity remained relatively constant over 24 weeks in patients with OIC and
sufficient laxative use The average work hours missed per week because of constipation-associated problems was
0.9 hours Among these patients:
o 6% mean time missed due to constipation
a Four publications have been included from the same international longitudinal survey that assessed OIC burden (including employment burden) in patients with
chronic non-cancer pain and self-reported OIC (Alemayehu et al, 2014 [A]; Coyne et al, 2014; Gupta et al, 2016 [A]; LoCasale et al, 2015).
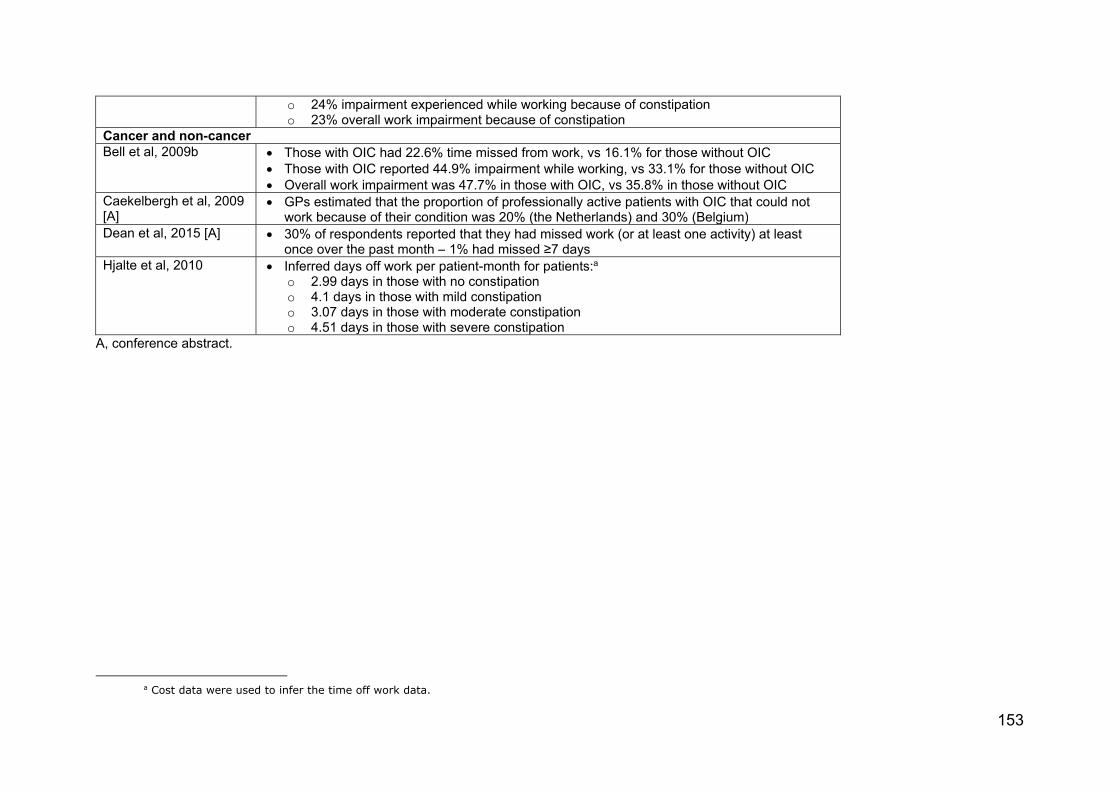
153
o 24% impairment experienced while working because of constipation o 23% overall work impairment because of constipation
Cancer and non-cancer Bell et al, 2009b Those with OIC had 22.6% time missed from work, vs 16.1% for those without OIC
Those with OIC reported 44.9% impairment while working, vs 33.1% for those without OIC Overall work impairment was 47.7% in those with OIC, vs 35.8% in those without OIC
Caekelbergh et al, 2009 [A]
GPs estimated that the proportion of professionally active patients with OIC that could not work because of their condition was 20% (the Netherlands) and 30% (Belgium)
Dean et al, 2015 [A] 30% of respondents reported that they had missed work (or at least one activity) at least once over the past month – 1% had missed ≥7 days
Hjalte et al, 2010 Inferred days off work per patient-month for patients:a o 2.99 days in those with no constipation o 4.1 days in those with mild constipation o 3.07 days in those with moderate constipation o 4.51 days in those with severe constipation
A, conference abstract.
a Cost data were used to infer the time off work data.

Summary of employment costs findings
Alemayehu et al, 2014 [A]
Study findings
This was an analysis of the AstraZeneca-sponsored international, longitudinal, web-based patient survey
assessing OIC burden. A total of 489 patients with chronic non-cancer pain and self-reported OIC
completed the WPAI-SHP questionnaire at baseline and 24 weeks. The study showed (in the 27% of
employed patients) that OIC has a substantial negative impact on work-related activities in patients with
non-cancer pain.
The effect of OIC on work activity over time is shown in Figure I1. At baseline, at which patients recalled
the previous 6 months, the mean WPAI-SHP values reflected the negative impact of OIC on job-related
activities in employed participants. By the 24-week follow-up, the percent work time missed due to OIC
decreased, while percent impairment while working and percent overall work impairment were similar to
baseline values.
Figure II. Impact of OIC on work activity over time (WPAI-SHP endpoints) (Alemayehu et al, 2014)
†Recall of previous 6 months. ‡Activity impairment was regardless of employment status. Observations on this study
This was an analysis of the AstraZeneca-sponsored study on the long-term burden of OIC. As outlined
previously, this study is important because it provides data from a number of countries (USA, Canada,
Germany, UK) and sources information from medical record abstraction, patient and physician surveys.
OIC was associated with substantial work impairment in around 30–40% of patients at baseline, and this
remained relatively similar over time.

155
Importantly, of the 489 participants with chronic non-cancer pain and self-reported OIC, only 27% were
employed. Thus, the impact of OIC on work includes only these patients.
Regarding laxative use, 18% of patients used at least one prescription laxative, and 70% used at least
one OTC laxative at baseline. These values remained relatively stable over the 24-week follow-up.
Gupta et al, 2016 [A]
Study findings
An international longitudinal survey assessed OIC burden (including work productivity) in patients with
chronic non-cancer pain and self-reported OIC. A total of 419 chronic non-cancer pain patients with OIC
were divided according to age: <50 years (n=184) and 50–64 years (n=235). The study showed that
younger patients experienced at least the same OIC-associated burden (including work productivity;
WPAI questionnaire) as older patients.
In patients who worked, OIC affected work productivity to a similar extent in younger versus older patients,
respectively:
Work time missed in the past week: 5.0 vs 4.3 hours
Percent overall work impairment: 30.9% vs 25.1%
Percent overall activity impairment: 39.9% vs 37.7%.
Observations on the study
This was a post-hoc analysis of data from the AstraZeneca-sponsored study on the long-term burden of
OIC. The study showed that younger patients experienced at least the same OIC-associated employment
burden as older patients. The post-hoc analysis also showed that older patients had a significantly greater
mean duration of both chronic pain and opioid medication use versus younger patients (data in the
conference abstract). OIC moderately interfered with pain management in both the younger and older
patients (46.6% and 44.5%).
Cost burden of OIC
The tables below summarize the objectives and methods (Table I3), and the key findings (Table I4) for
the studies on the cost burden of OIC. The new studies are then described in more detail (Coyne et al,
2016; Rauck et al, 2017; Tuteja et al, 2010).

Table I3. Objectives and methods in the cost burden studies
Reference (Country)
Study objective regarding cost of OIC
Study type (study length) Patient population
Cancer Candrilli et al, 2009 (USA)
To compare direct per patient costs in cancer patients with opioid use with vs without constipation, from a third-party/private HCP perspective
Multicentre retrospective observational matched cohort study using a health insurance database to capture HCRU and claims data (12 months)
Cancer patients with OIC, n=821 Cancer patients without constipation, n=821
Ovanfors et al, 2009 [A] (Sweden)
To estimate the direct per patient cost of treating OIC (constipation episode) (public HCP perspective)
Survey-based interviews with nurses from 3 hospices and home care centres informing HCRU (NA)
Cancer patients with OIC who had previously failed laxatives, n=NA (interview of healthcare providers)
Wee et al, 2010 (UK)
To evaluate the direct cost of managing constipation (per admission and cost over 6 months) in patients taking opioids in a specialist palliative care unit (public HCP perspective)
Retrospective review of medical records of HCRU for constipation in single palliative care centre. Prospective time-in-motion study also conducted to estimate bottom-up costing of HCRU (6 months)
Cancer patients, n=57 (1 patient with end-stage emphysema)
Non-cancerFernandes et al, 2016 (USA)
To assess direct costs (all-cause, OIC-related, and pain-related) during 12 months after opioid initiation in non-cancer pain patients with vs without newly diagnosed OIC.
Retrospective matched cohort study using administrative claims data from HealthCore Integrated Research Environment
Patients (≥18 years old) who filled a prescription for continuous opioid treatment (≥28 days) for non-cancer pain. Excluded: cancer; constipation not induced by opioid (constipation diagnosis, related procedure, or pharmacy claim for a constipation medication during the 6-month preindex period) n=34,768 (with OIC, n=17,384; without OIC, n=17,384)
Kwong et al, 2010 (USA)
To estimate the direct per patient cost associated with GI events coincident with oral short-acting opioid treatment vs those without GI events (third-party/private HCP perspective)
Multicentre retrospective observational (cohort) study using a health insurance database to capture HCRU and cost data (90 days)
Non-cancer with constipation medical claim: n=1972. Non-cancer with laxative use: n=3303 (without GI event medical claim) Non-cancer with no GI event medical or prescription claim, n=217,218
Wan et al, 2010 (USA)
To analyse the direct per patient cost of long-term use of opioids, comparing those with vs without OIC (third-party/private HCP perspective)
Multicentre retrospective observational matched cohort study using a health insurance database to capture HCRU and cost data (12 months)
Non-cancer patients Elderly with OIC=194 Nonelderly with OIC=401

157
Long term care with OIC=85 Non-cancer patients Elderly with no OIC=2764 Nonelderly with no OIC=13,407 Long term care with no OIC=481
Cancer and non-cancer Caekelbergh et al, 2009 [A] (Belgium and Netherlands)
To describe the direct and indirect per patient cost of OIC (constipation episode and cost of specific complications) from the societal and public healthcare payer perspective
2-round Delphi panel of 12 general practitioners from Belgium and 12 GPs from the Netherlands informing HCRU use (NA)
Cancer or non-cancer patients with OIC taking opioids, n=NA (Delphi Panel)
Guijarro et al, 2010 [A] (Spain)
To analyse direct per patient costs of an OIC event from a public HCP perspective
Multicentre retrospective observational cohort study using NHS patient records and patient interviews to capture HCRU and cost data (2 months)
Patientsa who developed OIC, n=347 (46.6% of 744b). Assumption is that this includes cancer and non-cancer patients Analysis did compare responders to laxatives to nonresponders (no patient numbers provided)
Hjalte et al, 2010 (Sweden)
To estimate the direct and indirect costs of OIC (by severity) in patients being treated with strong opioids (societal perspective)
Noninterventional observational study in patients on strong opioids (6 months)
Cancer and non-cancer patients with mild, moderate, severe constipation and treated with strong opioids, n=197 (n=29 cancer related, n=158 non-cancer related, n=9 combinationc) Comparison is for same patient cohort in months where there was no reported constipation
Iyer et al, 2010 (USA)
To compare direct per patient costs in patients on opioid therapy who have constipation vs those who do not
Multicentre retrospective observational matched cohort study using a health insurance database to capture HCRU and cost data in patients treated with opioids (12 months)
Patients with constipation, n=2519d Patients without constipation, n=25195
a No more information provided on population b Number not provided in abstract so calculated c Numbers as given in paper – add to 196 not 197 d No reference made to % with cancer

158
Suh et al, 2010 (USA)
To estimate direct per patient hospital-based treatment costs for patients with OIC (identified as those being treated with constipation medication) vs the cost of patients who did not receive medication for nausea, vomiting, or constipation (third-party/private HCP perspective)
Multicentre retrospective observational matched cohort study using an inpatient health insurance database to capture HCRU and cost data (14 days)
Hospitalised patients on oral opioid and with constipation medication, n=2493 Non-cancer and cancer hospitalised patients on injectable opioid and with constipation medication, n=47,122a Patients receiving opioids not receiving medication for nausea/vomiting/ constipation (NVC) (all three), n=195,121
Takemoto et al, 2011 (Brazil)
To compare direct per patient monthly costs in opioid-treated patients with and without constipation (third-party/private HCP perspective)
Multicentre retrospective observational matched cohort study using a health insurance database to capture HCRU and cost data (35 months)
Cancer and non-cancer patients opioid treated patients with constipation, n=6678 (29.0% among opioid-treated patients)b Table 1 (supplementary materials in the paper) shows that 9% of OIC patients had cancer Reference population: Cancer and non-cancer opioid treated patients without constipation, n=16,545
A, conference abstract.
a Breakdown of cancer patients not reported for these numbers. Of all oral opioid patients (n=19,373) there were 3901 with cancer. Of all injection opioid patients
(n=367,585) there were 65,112 with cancer b In supplementary tables this is stated as 6768. It is unclear what the correct number is as 29% of opioid treated patients is 6761.
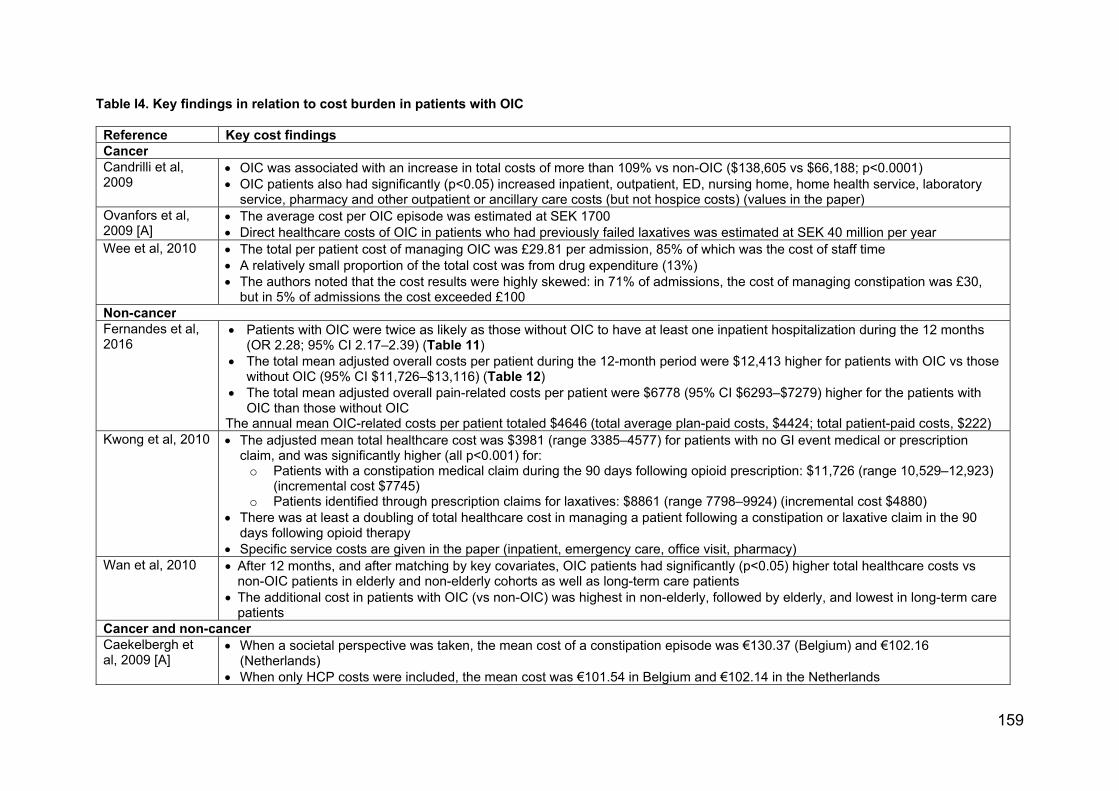
159
Table I4. Key findings in relation to cost burden in patients with OIC
Reference Key cost findingsCancer Candrilli et al, 2009
OIC was associated with an increase in total costs of more than 109% vs non-OIC ($138,605 vs $66,188; p<0.0001) OIC patients also had significantly (p<0.05) increased inpatient, outpatient, ED, nursing home, home health service, laboratory
service, pharmacy and other outpatient or ancillary care costs (but not hospice costs) (values in the paper)Ovanfors et al, 2009 [A]
The average cost per OIC episode was estimated at SEK 1700 Direct healthcare costs of OIC in patients who had previously failed laxatives was estimated at SEK 40 million per year
Wee et al, 2010 The total per patient cost of managing OIC was £29.81 per admission, 85% of which was the cost of staff time A relatively small proportion of the total cost was from drug expenditure (13%) The authors noted that the cost results were highly skewed: in 71% of admissions, the cost of managing constipation was £30,
but in 5% of admissions the cost exceeded £100Non-cancerFernandes et al, 2016
Patients with OIC were twice as likely as those without OIC to have at least one inpatient hospitalization during the 12 months (OR 2.28; 95% CI 2.17–2.39) (Table 11)
The total mean adjusted overall costs per patient during the 12-month period were $12,413 higher for patients with OIC vs those without OIC (95% CI $11,726–$13,116) (Table 12)
The total mean adjusted overall pain-related costs per patient were $6778 (95% CI $6293–$7279) higher for the patients with OIC than those without OIC
The annual mean OIC-related costs per patient totaled $4646 (total average plan-paid costs, $4424; total patient-paid costs, $222) Kwong et al, 2010 The adjusted mean total healthcare cost was $3981 (range 3385–4577) for patients with no GI event medical or prescription
claim, and was significantly higher (all p<0.001) for: o Patients with a constipation medical claim during the 90 days following opioid prescription: $11,726 (range 10,529–12,923)
(incremental cost $7745) o Patients identified through prescription claims for laxatives: $8861 (range 7798–9924) (incremental cost $4880)
There was at least a doubling of total healthcare cost in managing a patient following a constipation or laxative claim in the 90 days following opioid therapy
Specific service costs are given in the paper (inpatient, emergency care, office visit, pharmacy)Wan et al, 2010 After 12 months, and after matching by key covariates, OIC patients had significantly (p<0.05) higher total healthcare costs vs
non-OIC patients in elderly and non-elderly cohorts as well as long-term care patients The additional cost in patients with OIC (vs non-OIC) was highest in non-elderly, followed by elderly, and lowest in long-term care
patients Cancer and non-cancer Caekelbergh et al, 2009 [A]
When a societal perspective was taken, the mean cost of a constipation episode was €130.37 (Belgium) and €102.16 (Netherlands)
When only HCP costs were included, the mean cost was €101.54 in Belgium and €102.14 in the Netherlands
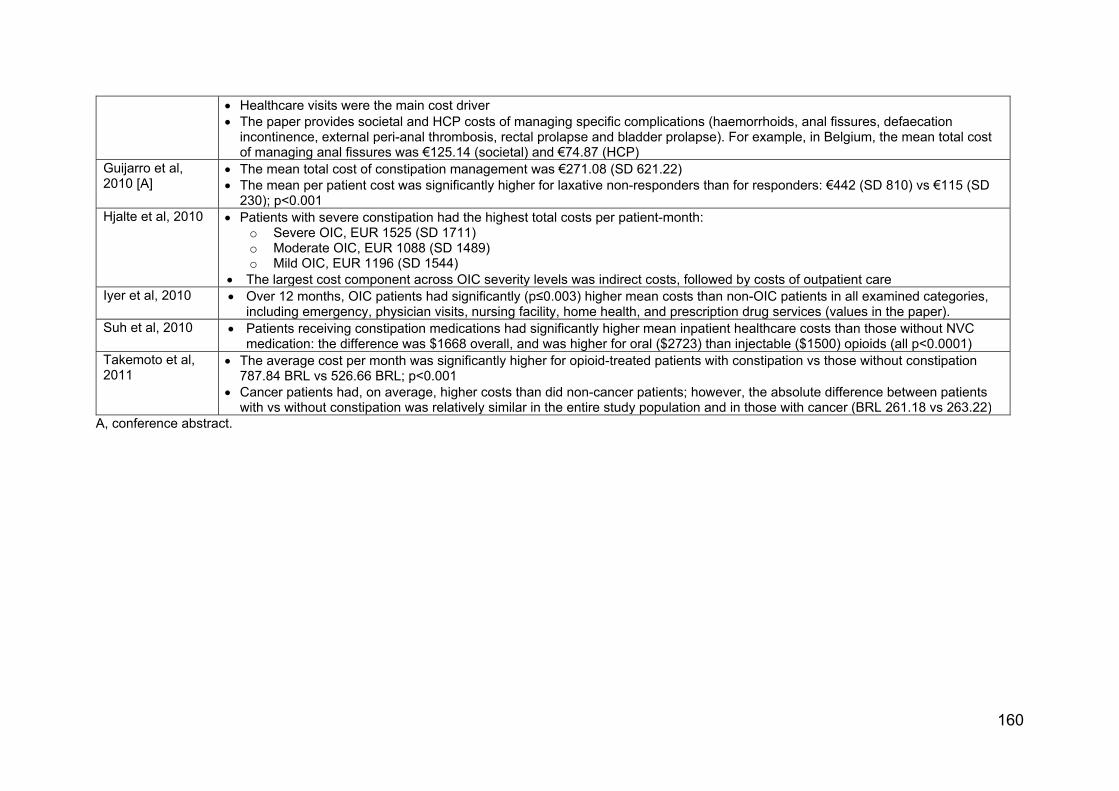
160
Healthcare visits were the main cost driver The paper provides societal and HCP costs of managing specific complications (haemorrhoids, anal fissures, defaecation
incontinence, external peri-anal thrombosis, rectal prolapse and bladder prolapse). For example, in Belgium, the mean total cost of managing anal fissures was €125.14 (societal) and €74.87 (HCP)
Guijarro et al, 2010 [A]
The mean total cost of constipation management was €271.08 (SD 621.22) The mean per patient cost was significantly higher for laxative non-responders than for responders: €442 (SD 810) vs €115 (SD
230); p<0.001 Hjalte et al, 2010 Patients with severe constipation had the highest total costs per patient-month:
o Severe OIC, EUR 1525 (SD 1711) o Moderate OIC, EUR 1088 (SD 1489) o Mild OIC, EUR 1196 (SD 1544)
The largest cost component across OIC severity levels was indirect costs, followed by costs of outpatient careIyer et al, 2010 Over 12 months, OIC patients had significantly (p≤0.003) higher mean costs than non-OIC patients in all examined categories,
including emergency, physician visits, nursing facility, home health, and prescription drug services (values in the paper). Suh et al, 2010 Patients receiving constipation medications had significantly higher mean inpatient healthcare costs than those without NVC
medication: the difference was $1668 overall, and was higher for oral ($2723) than injectable ($1500) opioids (all p<0.0001)Takemoto et al, 2011
The average cost per month was significantly higher for opioid-treated patients with constipation vs those without constipation 787.84 BRL vs 526.66 BRL; p<0.001
Cancer patients had, on average, higher costs than did non-cancer patients; however, the absolute difference between patients with vs without constipation was relatively similar in the entire study population and in those with cancer (BRL 261.18 vs 263.22)
A, conference abstract.

Summary of cost findings
Fernandes et al, 2016
Study findings
This retrospective matched cohort study used administrative claims data from HealthCore Integrated
Research Environment to assess HCRU and costs (all-cause, OIC-related, and pain-related) during
12 months after opioid initiation in non-cancer pain patients with newly-diagnosed OIC versus patients
without new OIC (n=17,384 each). The study showed that patients with OIC had significantly greater
HCRU and costs than patients without OIC. These costs accounted for around 16% of the total
healthcare costs per patient during the 12-month study period.
Resource utilization
Table I5 summarizes the HCRU in the 12-month post-index period in patients with versus without OIC.
Patients with OIC were twice as likely as those without OIC to have at least one inpatient hospitalization
during the 12 months (OR 2.28; 95% CI 2.17–2.39; p<0.0001). OIC patients also had around twice the
risk of having an ED visit, and office or other outpatient visit versus patients without OIC (both p<0.0001).
Regarding pain-related resource use, patients with OIC had twice the risk of an inpatient hospitalization
versus those without OIC, 1.4 times the risk of an ED visit, and 1.3 times the risk of an outpatient or
office visit (after adjusting for the analogous preindex utilization).

Table I5. HCRU in the 12-month post-index period (Fernandes et al, 2016)
Utilization
OIC (n=17,3
84)
No OIC (n=17,3
84)
Odds ratio or mean
differencea
P valueb
All-cause, n (%) ≥1 hospitalizations Length of stay, mean (SD) ≥1 ED visit ≥1 outpatient visit ≥1 skilled nursing facility visit
7219 (41.5)
9.6 (15.5) 6996 (40.2) 17,230 (99.1) 2682 (15.4)
4190 (24.1)
6.9 (12.5) 4809 (27.7) 17,077 (98.2) 1664 (9.6)
2.28 2.13 1.79 2.07 1.83
<0.0001 <0.0001 <0.0001 <0.0001 <0.0001
Pain-related ≥1 hospitalizations Length of stay, mean (SD) ≥1 ED visit ≥1 outpatient visit
4631 (26.6)
9.5 (15.5) 3066 (17.6) 14,611 (84.0)
2597 (14.9)
6.8 (11.9) 2357 (13.6) 13,987 (80.5)
2.10 1.41 1.38 1.33
<0.0001 <0.0001 <0.0001 <0.0001
OIC-related ≥1 hospitalizations Length of stay,
2361 (13.6)
8.0 (13.5) 1569 (9.0)
– – – –
– – – –
– – – –

163
mean (SD) ≥1 ED visit ≥1 outpatient visit
6106 (35.1)
a Odds ratios from logistic regression models are reported for categoric variables (≥1 vs 0 events); difference in means from negative binomial models are reported for continuous length-of-stay variables. The covariate model includes the analogous variable in the preindex period (e.g., post-index inpatient hospitalization was adjusted for preindex inpatient hospitalization). b Statistical values were derived by comparing cohort 1 (with OIC) with cohort 2 (no OIC) (reference group). ED, emergency department; SD, standard deviation.

Costs
Table I6 summarizes the overall healthcare costs during the 12-month postindex period.
The total mean adjusted overall costs per patient were $12,413 higher for patients with OIC versus those
without OIC (95% CI $11,726–$13,116). Medical costs were $11,558 higher, and pharmacy costs were
$723 higher for OIC patients. For patients with OIC (versus without OIC), mean adjusted plan-paid costs
were $11,533 (95% CI, $10,855–$12,228) higher, and total mean adjusted patient-paid costs were $818
(95% CI, $767–$869) higher.
The total mean adjusted overall pain-related costs per patient were $6778 (95% CI $6293–$7279) higher
for patients with versus without OIC. Mean plan-paid costs were $6619 (95% CI, $6114-$7143) higher,
and patient-paid costs were $254 (95% CI, $228-$280) higher. Mean pain-related medical costs were
$6894 higher and pharmacy costs were $270 higher in OIC patients.
The annual mean OIC-related costs per patient totaled $4646 (medical costs, $4585; pharmacy costs,
$61). The total average plan-paid cost was $4424, and the total patient-paid cost was $222.
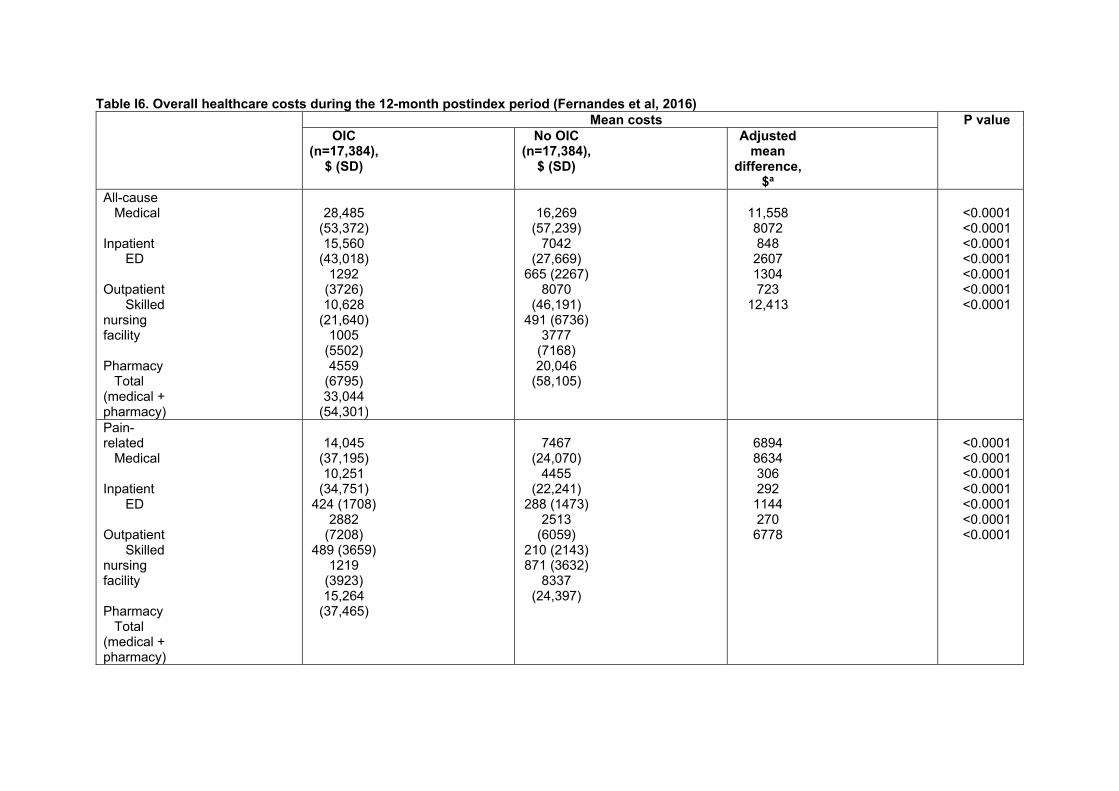
Table I6. Overall healthcare costs during the 12-month postindex period (Fernandes et al, 2016) Mean costs P value
OIC (n=17,384),
$ (SD)
No OIC (n=17,384),
$ (SD)
Adjusted mean
difference, $a
All-cause Medical Inpatient ED Outpatient Skilled nursing facility Pharmacy Total (medical + pharmacy)
28,485
(53,372) 15,560
(43,018) 1292
(3726) 10,628
(21,640) 1005
(5502) 4559
(6795) 33,044
(54,301)
16,269
(57,239) 7042
(27,669) 665 (2267)
8070 (46,191)
491 (6736) 3777
(7168) 20,046
(58,105)
11,558 8072 848 2607 1304 723
12,413
<0.0001 <0.0001 <0.0001 <0.0001 <0.0001 <0.0001 <0.0001
Pain-related Medical Inpatient ED Outpatient Skilled nursing facility Pharmacy Total (medical + pharmacy)
14,045
(37,195) 10,251
(34,751) 424 (1708)
2882 (7208)
489 (3659) 1219
(3923) 15,264
(37,465)
7467
(24,070) 4455
(22,241) 288 (1473)
2513 (6059)
210 (2143) 871 (3632)
8337 (24,397)
6894 8634 306 292 1144 270 6778
<0.0001 <0.0001 <0.0001 <0.0001 <0.0001 <0.0001 <0.0001

166
OIC-related Medical Inpatient ED Outpatient Skilled nursing facility Pharmacy Total (medical + pharmacy)
4585
(20,856) 4111
(20,800) 201 (1145) 216 (844) 57 (1085) 61 (181)
4646 (20,850)
– – – – – – –
– – – – – – –
– – – – – – –
a Adjusted mean difference = cohort 1 (with OIC) adjusted mean minus cohort 2 (no OIC) adjusted mean, where the adjusted means for each cohort were calculated from the regression model controlling for the analogous preindex cost (e.g., post-index inpatient costs were adjusted for preindex inpatient costs). ED, emergency department; SD, standard deviation.
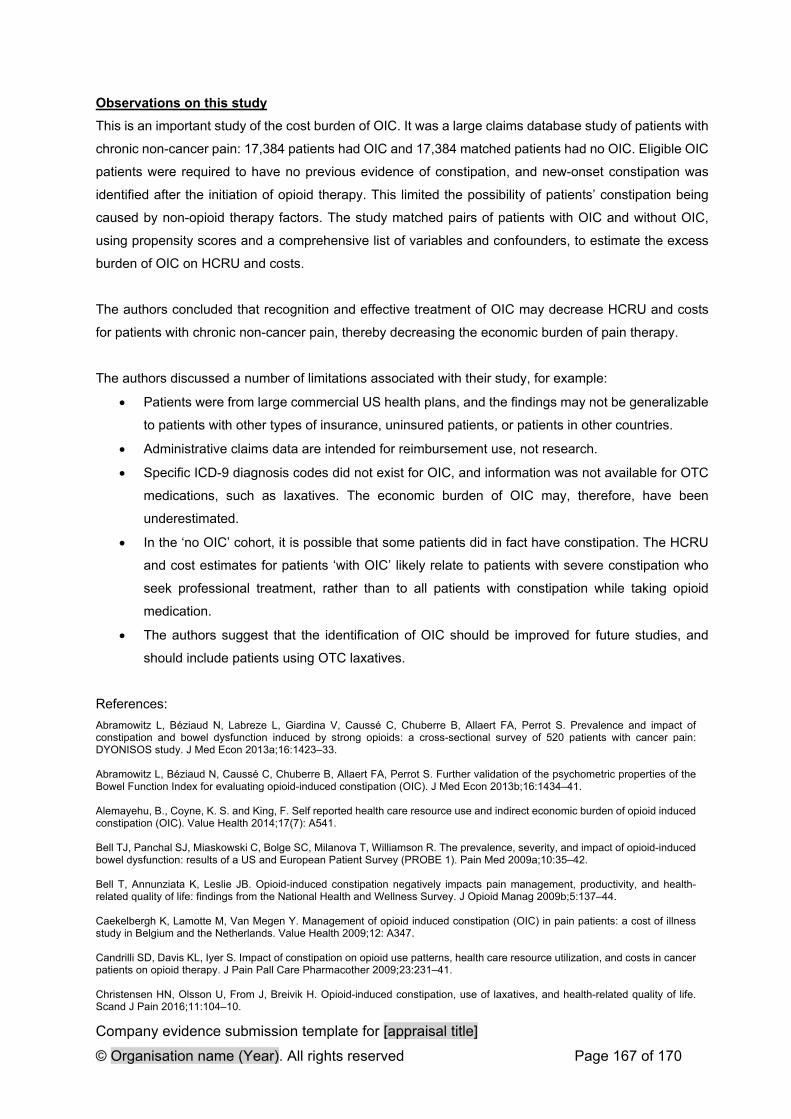
Company evidence submission template for [appraisal title]
© Organisation name (Year). All rights reserved Page 167 of 170
Observations on this study
This is an important study of the cost burden of OIC. It was a large claims database study of patients with
chronic non-cancer pain: 17,384 patients had OIC and 17,384 matched patients had no OIC. Eligible OIC
patients were required to have no previous evidence of constipation, and new-onset constipation was
identified after the initiation of opioid therapy. This limited the possibility of patients’ constipation being
caused by non-opioid therapy factors. The study matched pairs of patients with OIC and without OIC,
using propensity scores and a comprehensive list of variables and confounders, to estimate the excess
burden of OIC on HCRU and costs.
The authors concluded that recognition and effective treatment of OIC may decrease HCRU and costs
for patients with chronic non-cancer pain, thereby decreasing the economic burden of pain therapy.
The authors discussed a number of limitations associated with their study, for example:
Patients were from large commercial US health plans, and the findings may not be generalizable
to patients with other types of insurance, uninsured patients, or patients in other countries.
Administrative claims data are intended for reimbursement use, not research.
Specific ICD-9 diagnosis codes did not exist for OIC, and information was not available for OTC
medications, such as laxatives. The economic burden of OIC may, therefore, have been
underestimated.
In the ‘no OIC’ cohort, it is possible that some patients did in fact have constipation. The HCRU
and cost estimates for patients ‘with OIC’ likely relate to patients with severe constipation who
seek professional treatment, rather than to all patients with constipation while taking opioid
medication.
The authors suggest that the identification of OIC should be improved for future studies, and
should include patients using OTC laxatives.
References:
Abramowitz L, Béziaud N, Labreze L, Giardina V, Caussé C, Chuberre B, Allaert FA, Perrot S. Prevalence and impact of constipation and bowel dysfunction induced by strong opioids: a cross-sectional survey of 520 patients with cancer pain: DYONISOS study. J Med Econ 2013a;16:1423–33. Abramowitz L, Béziaud N, Caussé C, Chuberre B, Allaert FA, Perrot S. Further validation of the psychometric properties of the Bowel Function Index for evaluating opioid-induced constipation (OIC). J Med Econ 2013b;16:1434–41. Alemayehu, B., Coyne, K. S. and King, F. Self reported health care resource use and indirect economic burden of opioid induced constipation (OIC). Value Health 2014;17(7): A541. Bell TJ, Panchal SJ, Miaskowski C, Bolge SC, Milanova T, Williamson R. The prevalence, severity, and impact of opioid-induced bowel dysfunction: results of a US and European Patient Survey (PROBE 1). Pain Med 2009a;10:35–42. Bell T, Annunziata K, Leslie JB. Opioid-induced constipation negatively impacts pain management, productivity, and health-related quality of life: findings from the National Health and Wellness Survey. J Opioid Manag 2009b;5:137–44. Caekelbergh K, Lamotte M, Van Megen Y. Management of opioid induced constipation (OIC) in pain patients: a cost of illness study in Belgium and the Netherlands. Value Health 2009;12: A347. Candrilli SD, Davis KL, Iyer S. Impact of constipation on opioid use patterns, health care resource utilization, and costs in cancer patients on opioid therapy. J Pain Pall Care Pharmacother 2009;23:231–41. Christensen HN, Olsson U, From J, Breivik H. Opioid-induced constipation, use of laxatives, and health-related quality of life. Scand J Pain 2016;11:104–10.

Company evidence submission template for [appraisal title]
© Organisation name (Year). All rights reserved Page 168 of 170
Coyne KS, LoCasale RJ, Datto CJ, Sexton CC, Yeomans K, Tack J. Opioid-induced constipation in patients with chronic noncancer pain in the USA, Canada, Germany, and the UK: descriptive analysis of baseline patient-reported outcomes and retrospective chart review. Clinicoecon Outcomes Res 2014;6:269–81. Coyne KS, Margolis MK, Yeomans K, King FR, Chavoshi S, Payne KA, LoCasale RJ. Opioid-induced constipation among patients with chronic noncancer pain in the United States, Canada, Germany, and the United Kingdom: Laxative use, response, and symptom burden over time. Pain Med 2015;16:1551–65. Coyne KS, Sexton C, LoCasale RJ, King FR, Margolis MK, Ahmedzai SH. Opioid-Induced Constipation among a convenience sample of patients with cancer pain. Front Oncol 2016;6:131. Datto C, LoCasale R, Wilson H, Coyne K. Does the impact of OIC differ by type of chronic pain? Presented at PainWeek 2015. http://conference.painweek.org/scientificposters/2015-accepted-abstracts. Dean D, Juchniewicz J, Bridgeman M. Unmet needs in opioid induced constipation: Results of a patient survey. Presented at AMCG 2015. Available at: http://acgmeetings.gi.org/pdfs/ACG15_FinalProgram_web.pdf Dhingra L, Shuk E, Grossman B, Strada A, Wald E, Portenoy A, Knotkova H, Portenoy R. A qualitative study to explore psychological distress and illness burden associated with opioid-induced constipation in cancer patients with advanced disease. Palliat Med 2013;27:447–56. Fernandes AW, Kern DM, Datto C, Chen YW, McLeskey C, Tunceli O. Increased burden of healthcare utilization and cost associated with opioid-related constipation among patients with noncancer pain. Am Health Drug Benefits 2016;9:160–70. Guijarro P, Alonso-Babarro A, Viqueira A, Fernandez G. Economic burden of opioid induced constipation in Spain. Value Health. 2010;13:A369. Gupta A, Coyne KS, Datto C, Venuti C. The burden of opioid-induced constipation in younger patients with chronic pain. PAINWeek Abstract Book 2016, Postgrad Med,128:sup2, 1–105. Gupta S, Patel H, Scopel J, Mody RR. Impact of constipation on opioid therapy management among long-term opioid users, based on a patient survey. J Opioid Manag 2015;11:325–8. Hjalte F, Berggren AC, Bergendahl H, Hjortsberg C. The direct and indirect costs of opioid-induced constipation. J Pain Symptom Manage 2010;40:696–703. Iyer S, Davis KL, Candrilli S. Opioid use patterns and health care resource utilization in patients prescribed opioid therapy with and without constipation. Manag Care 2010;19:44–51. Kwong WJ, Diels J, Kavanagh S. Costs of gastrointestinal events after outpatient opioid treatment for non-cancer pain. Ann Pharmacother 2010;44:630–40. LoCasale RJ, Datto CJ, Margolis MK, Tack J, Coyne KS. The impact of opioid-induced constipation among chronic pain patients with sufficient laxative use. Int J Clin Pract 2015;69:1448–56. Ovanfors A, Kasteng F, Borgstrom F, Iyer S. Resource utilization and costs associated with opioid induced constipation (OIC) in cancer patients in Sweden. Value Health. 2009;12:A348. Penning-van Beest FJ, van den Haak P, Klok RM, Prevoo YF, van der Peet DL, Herings RM. Quality of life in relation to constipation among opioid users. J Med Econ 2010;13:129–35. Rauck RL, Hong KJ, North J. Opioid-induced constipation survey in patients with chronic noncancer pain. Pain Pract. 2017;17:329-335. Suh D-C, Kim MS, Chow W, et al. Use of medications and resources for treatment of nausea, vomiting or constipation in hospitalized patients treated with analgesics. Clin J Pain 2011;27:508–17. Takemoto MLS, Fernandes RA, Almeida GR, et al. Health care resource use and costs in opioid-treated patients with and without constipation in Brazil. Value Health 2011;14:S78–S81. Tuteja AK, Biskupiak J, Stoddard GJ, Lipman AG. Opioid-induced bowel disorders and narcotic bowel syndrome in patients with chronic non-cancer pain. Neurogastroenterol Motil 2010;22:424–30, e96. Wan Y, Corman S, Gao X, et al. Economic burden of opioid-induced constipation among long-term opioid users with noncancer pain. Am Health Drug Benefits 2015;8:93–102. Wee B, Adams A, Thompson K, et al. How much does it cost a specialist palliative care unit to manage constipation in patients receiving opioid therapy? J Pain Symptom Manage 2010;39:644–54. Other references Cain KC, Headstrom P, Jarrett ME, Motzer SA, Park H, Burr RL, Surawicz CM, Heitkemper MM. Abdominal pain impacts quality of life in women with irritable bowel syndrome. Am J Gastroenterol. 2006;101:124–32.

Company evidence submission template for [appraisal title]
© Organisation name (Year). All rights reserved Page 169 of 170
Tuteja AK, Talley NJ, Joos SK, Woehl JV, Hickam DH. Is constipation associated with decreased physical activity in normally active subjects? Am J Gastroenterol 2005;100:124–9.
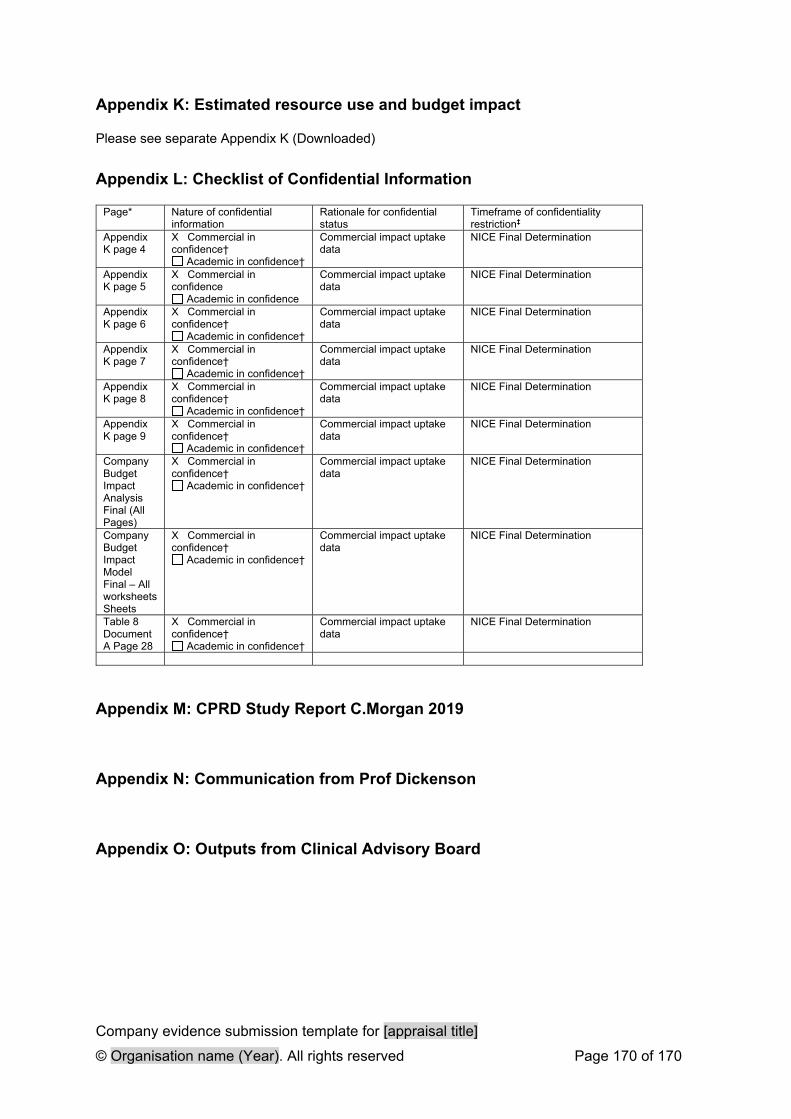
Company evidence submission template for [appraisal title]
© Organisation name (Year). All rights reserved Page 170 of 170
Appendix K: Estimated resource use and budget impact
Please see separate Appendix K (Downloaded)
Appendix L: Checklist of Confidential Information
Page* Nature of confidential information
Rationale for confidential status
Timeframe of confidentiality restriction‡
Appendix K page 4
X Commercial in confidence†
Academic in confidence†
Commercial impact uptake data
NICE Final Determination
Appendix K page 5
X Commercial in confidence
Academic in confidence
Commercial impact uptake data
NICE Final Determination
Appendix K page 6
X Commercial in confidence†
Academic in confidence†
Commercial impact uptake data
NICE Final Determination
Appendix K page 7
X Commercial in confidence†
Academic in confidence†
Commercial impact uptake data
NICE Final Determination
Appendix K page 8
X Commercial in confidence†
Academic in confidence†
Commercial impact uptake data
NICE Final Determination
Appendix K page 9
X Commercial in confidence†
Academic in confidence†
Commercial impact uptake data
NICE Final Determination
Company Budget Impact Analysis Final (All Pages)
X Commercial in confidence†
Academic in confidence†
Commercial impact uptake data
NICE Final Determination
Company Budget Impact Model Final – All worksheets Sheets
X Commercial in confidence†
Academic in confidence†
Commercial impact uptake data
NICE Final Determination
Table 8 Document A Page 28
X Commercial in confidence†
Academic in confidence†
Commercial impact uptake data
NICE Final Determination
Appendix M: CPRD Study Report C.Morgan 2019
Appendix N: Communication from Prof Dickenson
Appendix O: Outputs from Clinical Advisory Board
Clarification questions Page 1 of 154
NATIONAL INSTITUTE FOR HEALTH AND CARE EXCELLENCE
Single technology appraisal
Naldemedine for treating opioid-induced constipation [ID1189]
Clarification questions
October 2019
File name Version Contains confidential information
Date
ID1189 naldemedine clarification letter to PM for company [noACIC]
For company No 31st October 2019
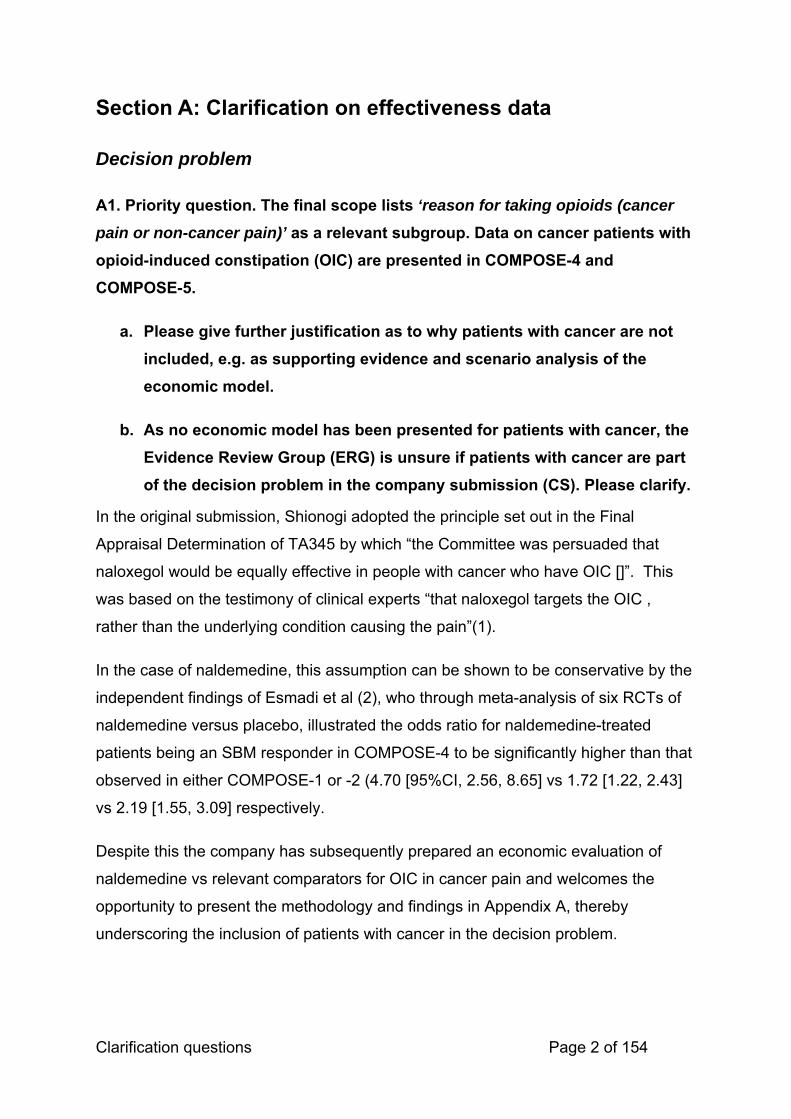
Clarification questions Page 2 of 154
Section A: Clarification on effectiveness data
Decision problem
A1. Priority question. The final scope lists ‘reason for taking opioids (cancer
pain or non-cancer pain)’ as a relevant subgroup. Data on cancer patients with
opioid-induced constipation (OIC) are presented in COMPOSE-4 and
COMPOSE-5.
a. Please give further justification as to why patients with cancer are not
included, e.g. as supporting evidence and scenario analysis of the
economic model.
b. As no economic model has been presented for patients with cancer, the
Evidence Review Group (ERG) is unsure if patients with cancer are part
of the decision problem in the company submission (CS). Please clarify.
In the original submission, Shionogi adopted the principle set out in the Final
Appraisal Determination of TA345 by which “the Committee was persuaded that
naloxegol would be equally effective in people with cancer who have OIC []”. This
was based on the testimony of clinical experts “that naloxegol targets the OIC ,
rather than the underlying condition causing the pain”(1).
In the case of naldemedine, this assumption can be shown to be conservative by the
independent findings of Esmadi et al (2), who through meta-analysis of six RCTs of
naldemedine versus placebo, illustrated the odds ratio for naldemedine-treated
patients being an SBM responder in COMPOSE-4 to be significantly higher than that
observed in either COMPOSE-1 or -2 (4.70 [95%CI, 2.56, 8.65] vs 1.72 [1.22, 2.43]
vs 2.19 [1.55, 3.09] respectively.
Despite this the company has subsequently prepared an economic evaluation of
naldemedine vs relevant comparators for OIC in cancer pain and welcomes the
opportunity to present the methodology and findings in Appendix A, thereby
underscoring the inclusion of patients with cancer in the decision problem.

Clarification questions Page 3 of 154
A2. Priority question. The National Institute for Health and Care
Excellence (NICE) scope specifies the population as people with OIC [who
have had previous laxative treatment]. However, scenario 2 in the CS is
described as ‘patients with mixed aetiology constipation (which includes OIC)’.
This appears to be out of scope. Please confirm or justify the inclusion of
scenario 2.
In specifying scenario 2 as concerning patients with mixed aetiology constipation
(which includes OIC), Shionogi have attempted to align the anticipated use case for
naldemedine in combination with standard laxatives with contemporary European
clinical consensus on the management of OIC(3).
The clinical advisory board convened by Shionogi in September 2018 confirmed that
OIC is commonly concomitant to functional constipation in both non-cancer- and
cancer-pain patients, endorsing the clinical construct of ‘mixed aetiology
constipation’. They also considered naldemedine, through its action as an
antagonist at the µ-opioid receptors in GI tract tissue(4), to be suitable for managing
the OIC-component of such patients.
Naldemedine is the only PAMORA licensed for initiation in combination with laxatives
- when commencing naloxegol, laxative therapy must be discontinued(5) - in patients
refractory to laxative therapy alone.
Therefore, Shionogi consider naldemedine the most suitable treatment for patients
who have previously been treated with a laxative and mixed aetiology constipation,
requiring a combination treatment approach when used within its license. This
should be regarded as a relatively simple clinical decision in adding naldemedine to
an existing laxative regime in patients with mixed aetiology constipation.
A3. Priority question. The exact place of naldemedine in the clinical pathway in
an NHS setting is unclear. Figure 1 in the CS is a reproduction of a flow chart
from a European clinical practice guideline on the management of OIC; it does
not specifically indicate the proposed positioning of naldemedine. Please
provide a flow chart with clear positioning of naldemedine in a UK NHS setting.
We have adapted Farmer AD, et al. (3) to produce a suitable diagram to indicate a
simpler clinical pathway for use of Naldemedine (Figure 1).

Clarification questions Page 4 of 154
Figure 1. A pragmatic stepwise suggestion for the management of OIC in clinical practice indicating a broad positioning of naldemedine.

Clarification questions Page 5 of 154
Figure 2. Pathway of care for OIC indicating positioning of naldemedine (Figure 1 CS)
Figure 2 (Figure 1 CS) outlines the guidance for OIC issued by UEG/EFIC experts.
Naldemedine should be considered in three therapeutic situations, after initial
treatment with a laxative when OIC has been identified, in a situation when a patient
might have mixed aetiology constipation as an add therapy or when laxatives have
not given an adequate response. These three therapeutic situations are covered in
the diagram above and have been described in our economic case.
(SCENARIO 1)
(SCENARIO 2)
Opioid commenced with counselling describing potential side effects including constipation
Co-prescribe standard laxative (osmotic or stimulant) to commence if constipation develops
Constipation reported by the patient Address lifestyle aspects
Consider and treat alternative reasons
(psychological aspects, inactivity, other medications,
metabolic abnormalities
Constipation clearly related to commencing, escalating or switch in opioids
Opioid induced constipation (laxative refractory)
OIC laxative inadequate responder
Mixed aetiology constipation (including OIC)
Switch laxative Consider combination
standard laxatives
Add naldemedine to standard laxatives – if
positive continue
Nalexgol Naldemedine
Primary care
Specialist or secondary care Consider addition of laxatives, lubiprostone
(discontinued), linaclotide (off-label: IBS-C) or prucalopride (TA211: women only)
Consider opioid switch or change in route of administration
Consider referral to secondary or tertiary centre for further evaluation
Specific management needs to be tailored
to the individual patient based on the indication for opioids,
comorbidities, specific
contraindications and concurrent
medications. Regular re-evaluations should
be undertaken
(SCENARIO 3)

Clarification questions Page 6 of 154
A4. Priority question. Ten outcomes are listed in the final scope issued by
NICE. These have been reproduced in Table 2 of the CS. However, only one
outcome, ‘spontaneous bowel movements’ (SBM), is listed as being addressed
in the CS. The rationale given for this difference is ‘NA’ (not applicable).
a. Please provide a justification for not including the outcomes listed in the
final scope.
Thank you for the opportunity to provide an update to the ‘Outcomes’ section of
Table 2CS. This is now provided in Table 1 below. For clarity we have added which
outcomes are considered in the ‘Clinical effectiveness’ section of the CS and those
considered in the ‘Cost-effectiveness’ section with annotation as to their location in
either.

Clarification questions Page 7 of 154
Table 1. The decision problem: Outcomes (from Table 2CS) Final scope issued by
NICE Decision problem addressed in the company submission
Rationale if different
from the final NICE
scope
Outcomes The outcome measures to be considered include: frequency of bowel
movements (including spontaneous bowel movements)
symptoms of constipation
time to first bowel action after intervention
use of rescue medication or interventions
response rate upper gastrointestinal
symptoms including nausea
pain effects on analgesic
efficacy adverse effects of
treatment health-related quality of
life
Considered in Clinical effectiveness section: Frequency of spontaneous
bowel movements (SBMs) per week (1o EP)
Frequency of complete SBMs per week (CSBMs) (2o EP)
PAC-SYM (2o EP) Time to first SBM (hours;
Figure 6CS) Proportion using rescue
meds during treatment period (Table 2)
Upper GI symptoms (AEs; Table 21CS)
Numeric Pain Rating Scale (Figure 20CS & 21CS)
Clinical Opiate Withdrawal Scale & Subjective Opiate Withdrawal Scale (Figure 19CS)
Total Daily Dose of opioid (Figure 22CS)
Treatment Emergent Adverse Events (Table 21CS)
PAC-QOL (Table 2) Considered in Cost-effectiveness section: Frequency of SBMs (health
state criterion) Time to first SBM
(assumption of rapid onset of health benefits)
Adverse effects of treatment (first model cycle)
Use of rescue medication (costs)
Health-related quality of life (health state utility [EQ-5D])
As per TA345
b. Please ensure that all outcomes for the COMPOSE trials are reported in
full in Table 13. Results should be reported as baseline values, endpoint
values (with time point measured), change from baseline (where
relevant) with effect sizes and 95% confidence interval (CI) for the
difference between treatment groups. At present, not all results contain
an effect size and 95% CI.
Thank you for the opportunity to revise Table 13CS; the requested additional data
are presented in Table 2 below. The revised table does not yet contain standardised
effect sizes (with 95% CIs) as these outputs were not included in the prespecified
analyses for the COMPOSE study programme. Shionogi will endeavour to calculate

Clarification questions Page 8 of 154
the requested statistics post hoc and provide a further update to Table 2 by close of
business on 31OCT19. These are now included (highlighted red).

Clarification questions Page 9 of 154
Table 2. Clinical effectiveness of naldemedine 0.2 mg vs. placebo (Table 13 CS)
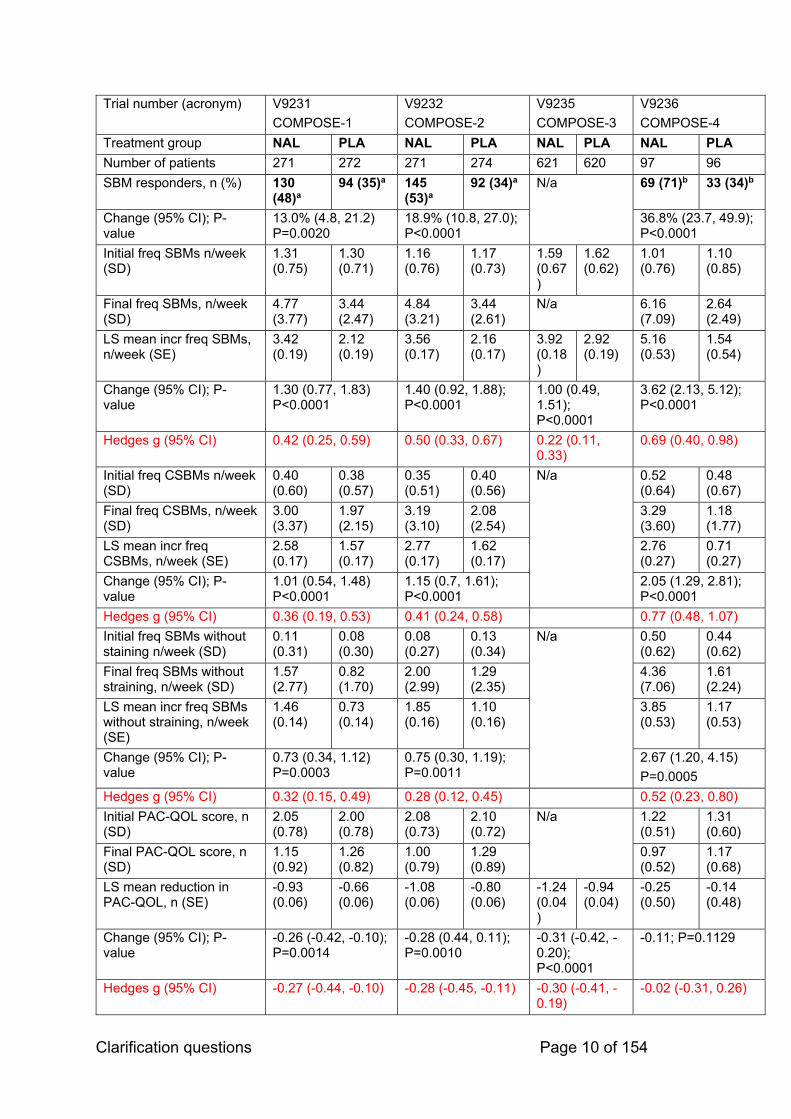
Clarification questions Page 10 of 154
Trial number (acronym) V9231
COMPOSE-1
V9232
COMPOSE-2
V9235
COMPOSE-3
V9236
COMPOSE-4
Treatment group NAL PLA NAL PLA NAL PLA NAL PLA
Number of patients 271 272 271 274 621 620 97 96
SBM responders, n (%) 130 (48)a
94 (35)a 145 (53)a
92 (34)a N/a 69 (71)b 33 (34)b
Change (95% CI); P-value
13.0% (4.8, 21.2) P=0.0020
18.9% (10.8, 27.0); P<0.0001
36.8% (23.7, 49.9); P<0.0001
Initial freq SBMs n/week (SD)
1.31 (0.75)
1.30 (0.71)
1.16 (0.76)
1.17 (0.73)
1.59 (0.67)
1.62 (0.62)
1.01 (0.76)
1.10 (0.85)
Final freq SBMs, n/week (SD)
4.77 (3.77)
3.44 (2.47)
4.84 (3.21)
3.44 (2.61)
N/a 6.16 (7.09)
2.64 (2.49)
LS mean incr freq SBMs, n/week (SE)
3.42 (0.19)
2.12 (0.19)
3.56 (0.17)
2.16 (0.17)
3.92 (0.18)
2.92 (0.19)
5.16 (0.53)
1.54 (0.54)
Change (95% CI); P-value
1.30 (0.77, 1.83) P<0.0001
1.40 (0.92, 1.88); P<0.0001
1.00 (0.49, 1.51); P<0.0001
3.62 (2.13, 5.12); P<0.0001
Hedges g (95% CI) 0.42 (0.25, 0.59) 0.50 (0.33, 0.67) 0.22 (0.11, 0.33)
0.69 (0.40, 0.98)
Initial freq CSBMs n/week (SD)
0.40 (0.60)
0.38 (0.57)
0.35 (0.51)
0.40 (0.56)
N/a 0.52 (0.64)
0.48 (0.67)
Final freq CSBMs, n/week (SD)
3.00 (3.37)
1.97 (2.15)
3.19 (3.10)
2.08 (2.54)
3.29 (3.60)
1.18 (1.77)
LS mean incr freq CSBMs, n/week (SE)
2.58 (0.17)
1.57 (0.17)
2.77 (0.17)
1.62 (0.17)
2.76 (0.27)
0.71 (0.27)
Change (95% CI); P-value
1.01 (0.54, 1.48) P<0.0001
1.15 (0.7, 1.61); P<0.0001
2.05 (1.29, 2.81); P<0.0001
Hedges g (95% CI) 0.36 (0.19, 0.53) 0.41 (0.24, 0.58) 0.77 (0.48, 1.07)
Initial freq SBMs without staining n/week (SD)
0.11 (0.31)
0.08 (0.30)
0.08 (0.27)
0.13 (0.34)
N/a 0.50 (0.62)
0.44 (0.62)
Final freq SBMs without straining, n/week (SD)
1.57 (2.77)
0.82 (1.70)
2.00 (2.99)
1.29 (2.35)
4.36 (7.06)
1.61 (2.24)
LS mean incr freq SBMs without straining, n/week (SE)
1.46 (0.14)
0.73 (0.14)
1.85 (0.16)
1.10 (0.16)
3.85 (0.53)
1.17 (0.53)
Change (95% CI); P-value
0.73 (0.34, 1.12) P=0.0003
0.75 (0.30, 1.19); P=0.0011
2.67 (1.20, 4.15)
P=0.0005
Hedges g (95% CI) 0.32 (0.15, 0.49) 0.28 (0.12, 0.45) 0.52 (0.23, 0.80)
Initial PAC-QOL score, n (SD)
2.05 (0.78)
2.00 (0.78)
2.08 (0.73)
2.10 (0.72)
N/a 1.22 (0.51)
1.31 (0.60)
Final PAC-QOL score, n (SD)
1.15 (0.92)
1.26 (0.82)
1.00 (0.79)
1.29 (0.89)
0.97 (0.52)
1.17 (0.68)
LS mean reduction in PAC-QOL, n (SE)
-0.93 (0.06)
-0.66 (0.06)
-1.08 (0.06)
-0.80 (0.06)
-1.24 (0.04)
-0.94 (0.04)
-0.25 (0.50)
-0.14 (0.48)
Change (95% CI); P-value
-0.26 (-0.42, -0.10); P=0.0014
-0.28 (0.44, 0.11); P=0.0010
-0.31 (-0.42, -0.20); P<0.0001
-0.11; P=0.1129
Hedges g (95% CI) -0.27 (-0.44, -0.10) -0.28 (-0.45, -0.11) -0.30 (-0.41, -0.19)
-0.02 (-0.31, 0.26)

Clarification questions Page 11 of 154
Initial PAC-SYM score, n (SE)
1.92 (0.77)
1.84 (0.73)
1.86 (0.72)
1.77 (0.74)
N/a 1.06 (0.60)
1.15 (0.62)
Final PAC-SYM score, n (SE)
1.01 (0.78)
1.18 (0.81)
0.86 (0.74)
1.08 (0.82)
0.82 (0.58)
1.02 (0.59)
LS mean reduction in PAC-SYM, n (SE)
-0.93 (0.06)
-0.62 (0.06)
-1.01 (0.06)
-0.69 (0.06)
-1.22 (0.04)
-0.98 (0.04)
-0,26 (0.65)
-0.13 (0.50)
Change (95% CI); P-value
-0.30 (-0.46, -0.15); P=0.0001
-0.32 (-0.48, -0.15); P=0.0002
-0.24 (-0.35, -0.12); P<0.0001
-0.13; P=0.1476
Hedges g (95% CI) -0.31 (-0.48, -0.14) -0.32 (-0.49, -0.15) -0.24 (-0.35, -0.13)
-0.02 (-0.31, 0.26)
c. Bold indicates primary endpoint. d. a ≥9 positive-response weeks out of the 12-week treatment period and 3 positive-response weeks out of the last 4
weeks of the 12-week treatment period. A positive-response week was defined as ≥3 SBMs per week and an increase from baseline of ≥1 SBM per week for that week. Results shown for intention-to-treat population.
e. b≥3 SBMs per week and an increase of ≥1 SBM per week from baseline. Results shown for full analysis set.
f. Please include the proportion of patients who required rescue laxatives
during the treatment period.
See Table 4 below.
Systematic review
A5. Priority question. Appendix D of the CS has two statements referring to
work that could not be completed due to time constraints:
‘For the SLR [systematic literature review] update, the database searches
retrieved records from clinical trial registries that were not indexed previously.
Due to time constraints, these records were not explored fully. Once these
records have been reviewed and any relevant information extracted, an update
will be provided to the NICE team.’
‘For the SLR update, although manual searches of congresses, the
WHO [World Health Organization] ICTRP [International Clinical Trials Registry
Platform] website and bibliographies of included articles were pre-specified,

Clarification questions Page 12 of 154
due to time constraints these could not be performed. Once completed, an
update will be provided to the NICE team.’
Additionally, Figure 1 of Appendix D refers to ‘Potentially relevant clinical trial
records temporarily excluded: 29’
a. Please explain these time constraints.
As reported in the CS, records retrieved in the updated SLR had not been fully
explored at the time of submission due to time constraints; due to uncertainty around
the likely submission date, the SLR update was not commissioned with sufficient
time for it to be fully completed before the submission date.
b. Please provide the missing results and records.
All relevant records identified in the SLR update have now been explored fully,
details of which can be found in the supplied updated Appendix D1-4 (see separate
appendix).
A6. Please provide the definition of chronic non-cancer pain used in the
systematic review and in the trials.
No specific definition of chronic non-cancer pain was used in the clinical SLR, and
instead study author definitions of chronic non-cancer pain were used. This may
have introduced heterogeneity in the patient population of the trials captured in the
clinical SLR, which was explored as part of the feasibility assessment for the indirect
comparisons. However, few studies reported more detailed definitions than “chronic
non-cancer pain”, as shown in Table 3. As such, it was important to consider opioid
type and dose when considering the similarity of the patient populations with respect
to the pain being treated.
Table 3: Summary of definitions reported for chronic non-cancer pain for all studies identified in the clinical SLR
Trial Definition of chronic non-cancer pain as per study authors
1 Arsenault 2014 Chronic non-cancer pain for >3 months
2 COMPOSE-1 (NCT01965158) Non-malignant chronic pain
3 COMPOSE-2 (NCT01993940) Non-malignant chronic pain
4 COMPOSE-3 (NCT01965652) Non-malignant chronic pain
5 COMPOSE-4 (and COMPOSE-5 extension study); JapicCTI-111510
Cancer pain
Clarification questions Page 13 of 154
6 Dimitroulis 2014 Cancer pain
7 KODIAC-04 (NCT01309841) Non-cancer-related pain
8 KODIAC-05 (NCT01323790) Non-cancer-related pain
9 KODIAC-07 (NCT01395524) Non-cancer pain
10 KODIAC-08 (NCT01336205) Non-cancer pain
11 Meissner 2009 Severe chronic pain (cancer or non-cancer pain)
12 MOTION Cancer or non-cancer pain
13 NCT00401362 Cancer or non-cancer pain
14 NCT00402038 Cancer or non-cancer pain
15 NCT00412100 (OXN3006(S)) Non-cancer pain
16 NCT00529087 Non-cancer pain
17 NCT00600119 Cancer or non-cancer pain
18 NCT00640146 Non-cancer pain
19 NCT00672477 (OLE: NCT00672139) Cancer or non-cancer pain
20 NCT01122030 Non-cancer pain
21 NCT01189409 Cancer pain
22 NCT01438567 Cancer or non-cancer pain
23 NCT01443403 Non-cancer pain
24 NCT03060512 Pain related to cancer was an exclusion criterion
25 OXN2001(S) (NCT00513656) Cancer pain
26 OXN3001(S) (NCT00412152) Non-cancer
27 Ramesh 1998 Cancer pain
A7. According to Table 6 of Appendix D of the CS, the SLR included only
English language studies.
a. How many studies were rejected solely on this basis?
b. Please provide the references rejected solely for this reason at full paper
screening.
As shown below in Figure 3 and in the supplied updated Appendix D, during both the
abstract and full text screening process, certain records not of a publication type or
study design of interest were excluded and filtered out in conjunction with records
not written in English in an ‘E1’ category (1,179 at the title/abstract screen and 50 at
the full text screen).
However, for completeness, a top-line review of records excluded in the ‘E1’
category in both the original SLR and SLR update was conducted, finding that:
Of the 1,044 records excluded in the E1 category of the original SLR at the
title/abstract screening stage, 82 were in a language other than English. Of
Clarification questions Page 14 of 154
these 82, only 4 were considered a publication type or study design of
interest. However, all 4 would have been excluded in the E2 category as they
did not include adult patients with OIC at baseline.
Of the 23 records excluded in the E1 category of the original SLR at the full
text screening stage, only 1 was in a language other than English(6).
However, this record was an SLR and so not considered a publication type or
study design of interest, and hand-searches of the reference list of Ruston et
al. 2013 did not yield any further records of interest that had not already been
captured.
Of the 135 records excluded in the E1 category of the updated SLR at the
title/abstract screening stage, 1 was in a language other than English,
however, this record was a prospective observational study and so was not
considered a publication type or study design of interest.
Of the 27 records excluded in the E1 category of the updated SLR at the full
text screening stage, none were in a language other than English
This suggests that of the few records which were excluded solely on the basis of
being written in a language other than English, none were considered relevant to the
SLR. Thus, the impact of this eligibility criterion was minimal.

Clarification questions Page 15 of 154
Figure 3. Combined PRISMA flow diagram for the original SLR and SLT update
Abbreviations: CDSR: Cochrane Database of Systematic Reviews; CENTRAL: Cochrane Central Register of Controlled Trials; DARE: Database of Abstracts of Reviews of Effects; RCT: Randomised Controlled Trial; SLR: Systemic Literature Review.

Clarification questions Page 16 of 154
A8. The systematic review included ‘Adult subjects with OIC who have cancer
or chronic non-cancer pain and are receiving a regimen of opioids’.
a. What age was used to define adults?
b. Were any studies included when only a proportion of patients were
adults?
c. Did all patients have OIC or were patients taking agents to prevent OIC
also included?
d. Please confirm that no results were available for the comparison with
rectal interventions, a comparator listed in the NICE scope. If results are
available, please provide all relevant data.
Definition of Adults
There was no pre-specified age used to define adults in the SLR. However, study
author definitions of patients aged 18 years and over were considered appropriate
and relevant. No studies that reported including only a proportion of adult patients
were included in the SLR.
OIC
Only studies where all patients had OIC at baseline were included in the SLR as this
was a pre-defined eligibility criterion of the SLR. A proportion of patients may also
have been using laxatives at baseline or have previously used laxatives, which are
usually given with opioids in an effort to prevent OIC. However, for studies to be
eligible for inclusion in the SLR, any patients currently using laxatives must still have
had OIC.
Rectal Interventions
Although studies of rectal interventions were eligible for inclusion in the SLR, no
relevant studies investigating enemas or disimpaction were found.
COMPOSE trials
A9. Priority question. Table 11 of the CS gives the ‘characteristics of
participants in the studies across treatment groups’ in the COMPOSE trials.

Clarification questions Page 17 of 154
However, some details are missing and the table appears to contain errors.
Please provide the correct / supplementary details for the following:
a. The mean duration of opioid therapy for COMPOSE -4, -5, -6 and -7.
b. The mean age and standard deviation for COMPOSE-1 and -2.
c. A breakdown of the region for COMPOSE-3.
d. A breakdown of the opioids received by the patients in the COMPOSE
trials. Were participants eligible for both strong and weak opioids?
Please see Table 4 below.
Clarification questions Page 18 of 154
Table 4. Characteristics of participants in the studies across treatment groups (Table 11 CS)
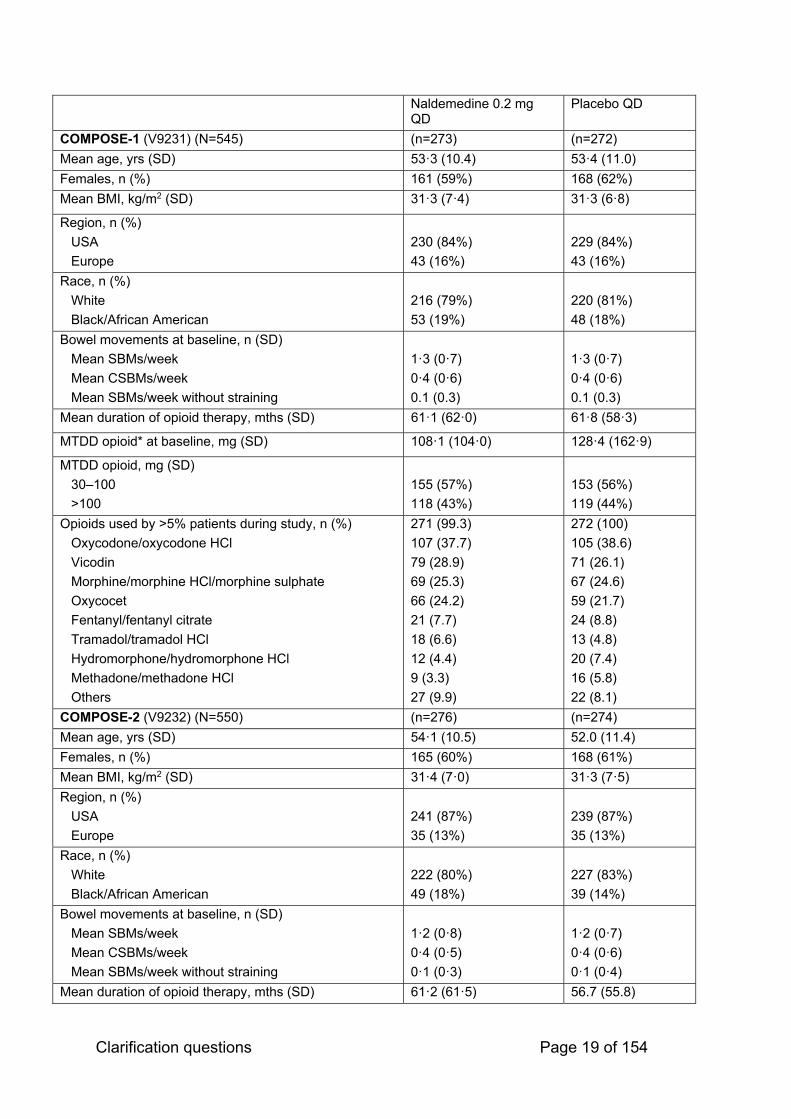
Clarification questions Page 19 of 154
Naldemedine 0.2 mg QD
Placebo QD
COMPOSE-1 (V9231) (N=545) (n=273) (n=272)
Mean age, yrs (SD) 53·3 (10.4) 53·4 (11.0)
Females, n (%) 161 (59%) 168 (62%)
Mean BMI, kg/m2 (SD) 31·3 (7·4) 31·3 (6·8)
Region, n (%)
USA
Europe
230 (84%)
43 (16%)
229 (84%)
43 (16%)
Race, n (%)
White
Black/African American
216 (79%)
53 (19%)
220 (81%)
48 (18%)
Bowel movements at baseline, n (SD)
Mean SBMs/week
Mean CSBMs/week
Mean SBMs/week without straining
1·3 (0·7)
0·4 (0·6)
0.1 (0.3)
1·3 (0·7)
0·4 (0·6)
0.1 (0.3)
Mean duration of opioid therapy, mths (SD) 61·1 (62·0) 61·8 (58·3)
MTDD opioid* at baseline, mg (SD) 108·1 (104·0) 128·4 (162·9)
MTDD opioid, mg (SD)
30–100
>100
155 (57%)
118 (43%)
153 (56%)
119 (44%)
Opioids used by >5% patients during study, n (%)
Oxycodone/oxycodone HCl
Vicodin
Morphine/morphine HCl/morphine sulphate
Oxycocet
Fentanyl/fentanyl citrate
Tramadol/tramadol HCl
Hydromorphone/hydromorphone HCl
Methadone/methadone HCl
Others
271 (99.3)
107 (37.7)
79 (28.9)
69 (25.3)
66 (24.2)
21 (7.7)
18 (6.6)
12 (4.4)
9 (3.3)
27 (9.9)
272 (100)
105 (38.6)
71 (26.1)
67 (24.6)
59 (21.7)
24 (8.8)
13 (4.8)
20 (7.4)
16 (5.8)
22 (8.1)
COMPOSE-2 (V9232) (N=550) (n=276) (n=274)
Mean age, yrs (SD) 54·1 (10.5) 52.0 (11.4)
Females, n (%) 165 (60%) 168 (61%)
Mean BMI, kg/m2 (SD) 31·4 (7·0) 31·3 (7·5)
Region, n (%)
USA
Europe
241 (87%)
35 (13%)
239 (87%)
35 (13%)
Race, n (%)
White
Black/African American
222 (80%)
49 (18%)
227 (83%)
39 (14%)
Bowel movements at baseline, n (SD)
Mean SBMs/week
Mean CSBMs/week
Mean SBMs/week without straining
1·2 (0·8)
0·4 (0·5)
0·1 (0·3)
1·2 (0·7)
0·4 (0·6)
0·1 (0·4)
Mean duration of opioid therapy, mths (SD) 61·2 (61·5) 56.7 (55.8)
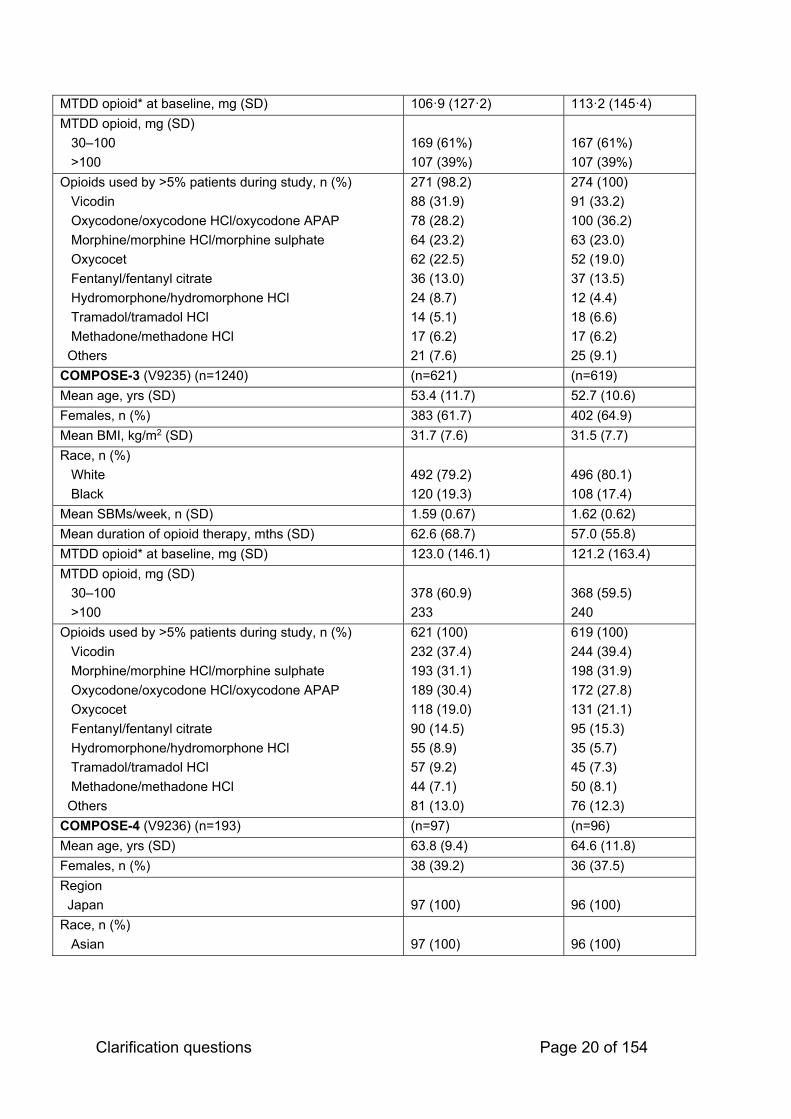
Clarification questions Page 20 of 154
MTDD opioid* at baseline, mg (SD) 106·9 (127·2) 113·2 (145·4)
MTDD opioid, mg (SD)
30–100
>100
169 (61%)
107 (39%)
167 (61%)
107 (39%)
Opioids used by >5% patients during study, n (%)
Vicodin
Oxycodone/oxycodone HCl/oxycodone APAP
Morphine/morphine HCl/morphine sulphate
Oxycocet
Fentanyl/fentanyl citrate
Hydromorphone/hydromorphone HCl
Tramadol/tramadol HCl
Methadone/methadone HCl
Others
271 (98.2)
88 (31.9)
78 (28.2)
64 (23.2)
62 (22.5)
36 (13.0)
24 (8.7)
14 (5.1)
17 (6.2)
21 (7.6)
274 (100)
91 (33.2)
100 (36.2)
63 (23.0)
52 (19.0)
37 (13.5)
12 (4.4)
18 (6.6)
17 (6.2)
25 (9.1)
COMPOSE-3 (V9235) (n=1240) (n=621) (n=619)
Mean age, yrs (SD) 53.4 (11.7) 52.7 (10.6)
Females, n (%) 383 (61.7) 402 (64.9)
Mean BMI, kg/m2 (SD) 31.7 (7.6) 31.5 (7.7)
Race, n (%)
White
Black
492 (79.2)
120 (19.3)
496 (80.1)
108 (17.4)
Mean SBMs/week, n (SD) 1.59 (0.67) 1.62 (0.62)
Mean duration of opioid therapy, mths (SD) 62.6 (68.7) 57.0 (55.8)
MTDD opioid* at baseline, mg (SD) 123.0 (146.1) 121.2 (163.4)
MTDD opioid, mg (SD)
30–100
>100
378 (60.9)
233
368 (59.5)
240
Opioids used by >5% patients during study, n (%)
Vicodin
Morphine/morphine HCl/morphine sulphate
Oxycodone/oxycodone HCl/oxycodone APAP
Oxycocet
Fentanyl/fentanyl citrate
Hydromorphone/hydromorphone HCl
Tramadol/tramadol HCl
Methadone/methadone HCl
Others
621 (100)
232 (37.4)
193 (31.1)
189 (30.4)
118 (19.0)
90 (14.5)
55 (8.9)
57 (9.2)
44 (7.1)
81 (13.0)
619 (100)
244 (39.4)
198 (31.9)
172 (27.8)
131 (21.1)
95 (15.3)
35 (5.7)
45 (7.3)
50 (8.1)
76 (12.3)
COMPOSE-4 (V9236) (n=193) (n=97) (n=96)
Mean age, yrs (SD) 63.8 (9.4) 64.6 (11.8)
Females, n (%) 38 (39.2) 36 (37.5)
Region
Japan
97 (100)
96 (100)
Race, n (%)
Asian
97 (100)
96 (100)

Clarification questions Page 21 of 154
ECOG PS, n (%)
0
1
2
28 (28.9)
55 (58.8)
14 (14.4)
33 (34.0)
49 (51.0)
14 (14.6)
Primary tumour
Lung
Breast
Large intestine
Other
42 (43.3)
22 (22.7)
3 (3.1)
30 (30.9)
45 (46.9)
17 (17.7
3 (3.1)
31 (32.3)
Bowel movements at baseline, n (SD)
Mean SBMs/week
Mean CSBMs/week
(0.76)
0.52 (0.64)
1.10 (0.85)
0.48 (0.67)
Mean duration of opioid therapy, mths (SD) N/a in Katakami 2017, 2018 or CSR
N/a in Katakami 2017, 2018 or CSR
MTDD opioid at baseline, mg (SD) 57.3 (46.4) 69.5 (99.5)
Opioids used regularly by >5% patients during study, n (%)
Oxycodone (oral or subcut)
Fentanyl (transdermal or other)
Morphine (oral)
Others
Rescue opioids used by >5% of patients during study, n (%)
Oxycodone (oral)
Morphine (oral or IV)
Fentanyl (oral or other)
Others
67 (69.1)
22 (22.7)
7 (7.2)
5 (5.1)
53 (54.6)
9 (9.3)
4 (4.1)
0
69 (71.9)
22 (22.9)
8 (8.3)
0
46 (47.9)
11 (11.5)
(2.1)
0
COMPOSE-5 (V9237) (N=131) (N=131)
Mean age, yrs (SD) 63.5 (10.4)
Females, n (%) 57 (43.5)
Race, n (%)
Asian
131 (100%)
ECOG PS, n (%)
0
1
2
43 (32.8)
71 (54.2)
17 (13.0)
Primary tumour
Lung
Breast
Large intestine
Other
51 (38.9)
29 (22.1)
5 (3.8)
46 (35.1)
Mean SBMs/week, n (SD) 0.98 (0.80)
Mean duration of opioid therapy, mths (SD) N/a in Katakami 2017, 2018 or CSR
MTDD opioid at baseline, mg (SD) 64.0 (80.8)

Clarification questions Page 22 of 154
Opioids used regularly by >5% patients during study, n (%)
Oxycodone (oral or subcut or IV)
Fentanyl (transdermal or IV)
Morphine (ora or subcut or IVl)
Others
Rescue opioids used by >5% of patients during study, n (%)
Oxycodone (oral or subcut or IV)
Morphine (oral or subcut or IV or rectal)
Fentanyl (other)
Others
43 (69.4)
18 (29.0)
8 (12.9)
2 (3.2)
37 (59.7)
11 (17.7)
7 (11.3)
1 (1.6)
COMPOSE-6 (V9238) (N=43) (N=43)
Mean age, yrs (SD) 63.9 (14.6)
Females, n (%) 23 (55)
Mean BMI, kg/m2 (SD) 22.3 (3.8)
Race, n (%)
Asian
43 (100%)
Mean SBMs/week, n (SD) 1.21 (0.9)
Mean duration of opioid therapy, mths (SD) N/a in Saito et al
MTDD opioids, mg (SD) 74.7 (68.6)
Opioids used during study, n (%)
Fentanyl
Oxycodone
Morphine
Others
28 (65.1)
10 (23.3)
9 (20.9)
15 (34.9)
Routine laxatives, n (%) 37.0 (86.0)
COMPOSE-7 (V9239) (N=10) (N=10)
Mean age, yrs (SD) 66.9 (7.4)
Females, n (%) 8 (80)
Mean BMI, kg/m2 (SD) 22.7 (3.2)
Race, n (%)
Asian
10 (100%)
Mean SBMs/week, n (SD) 1.30 (0.82)
Mean duration of opioid therapy, mths (SD) N/a in Saito et al
MTDD PR oxycodone, mg (SD) 45.3 (20.40
Opioids used during study, n (%)
PR oxycodone
10 (100)
Routine laxatives, n (%) 9 (90)
d) Yes, except for COMPOSE-7, where all patients received PR oxycodone.

Clarification questions Page 23 of 154
A10. Priority question. In Table 15 of Appendix D, it can be seen that the
definitions of inadequate response to laxatives (LIR) in the COMPOSE trials
and the KODIAC trials are different.
a. Please comment on the impact of these different definitions.
b. Please comment whether the definition used in the COMPOSE trials is in
line with current clinical practice in England
The definitions of LIR and non-LIR used in the COMPOSE and KODIAC trials are
presented in Table 5 and do differ, as noted by the ERG.
Table 5: Summary of LIR/non-LIR definitions
Trial LIR Definition Non-LIR Definition
COMPOSE-1
COMPOSE-2
(pooled)
Subjects on laxative therapy (with
≥1 product) prior to entering the
study and who stopped its use
within 30 days prior to screening
Patients with no laxatives
within the 12 months prior to
screening
KODIAC-04
KODIAC-05
(pooled)
Using 1 laxative class for ≥4 days
of the 14 days prior to screening
and reporting moderate, severe, or
very severe symptoms in ≥1 of 4
stool symptom domains
Patients not defined as LIR
LIR, laxative inadequate response.
The EMA accepted that that naldemedine will be effective in LIR as well as
non-LIR groups of patients(7,8)
Generally, NHS prescribing algorithms(9–11) seem to be consistent with the
naloxegol definition of LIR (as per the NICE TAG)
A11. Please provide baseline data and trial methods for the dose finding
studies, e.g. V9214, V9221, and V9222.
STUDY V9214(12,13)
Title and/or study number: A phase 2a, randomized, double-blind, placebo-
controlled, single ascending-dose study to evaluate the safety and efficacy of

Clarification questions Page 24 of 154
naldemedine in patients with chronic non-cancer pain and opioid-induced bowel
dysfunction (NCT01122030; 1007V9214)
Study design: This was a phase 2a, randomized, double-blind, placebo-controlled,
single ascending-dose study to evaluate the safety and efficacy of naldemedine in
patients with chronic non-cancer pain and opioid-induced bowel dysfunction
Patients aged 18–65 years with chronic non-cancer pain and OIBD (≤5 spontaneous
bowel movements [SBMs] in 2 weeks) were enrolled to receive naldemedine
0.01mg, 0.03mg, 0.1mg, 0.3mg, 1.0mg or 3.0mg or placebo.
A single dose of naldemedine or matching placebo was administered orally to each
cohort of 12 participants (9 treatments, 3 placebos) in the morning of Day 15 under
fasted conditions. The first cohort received a 0.1 mg dose. Cohorts continued to be
enrolled at the next higher dose level until either the highest dose level (3 mg) had
been achieved or until the study was discontinued due to adverse events or Clinical
Opioid Withdrawal Score of >8. A 0.03 mg dose was also tested. A 0.01 mg dose
was to be tested if 4 or more subjects experienced 1 or more bowel movements
within the 24 hour period post dose in the 0.03 mg dosing cohort.
Inclusion criteria: to be eligible, patients were required to:
Understand and sign an informed consent form;
If male, agree to use an approved double-barrier method of contraception
from Day 1 until 1 month after study completion; and
Test negative on urine drug test unless the subject had a prescription for the
drug(s) that tested positive.
Exclusion criteria: subjects were ineligible if either:
They were under opioid therapy for cancer-related pain or for the
management of drug addiction; or
Had faecal incontinence, irritable bowel syndrome, inflammatory bowel
disease, or other active medical disorders associated with diarrhoea,
intermittent loose stools, or constipation; or

Clarification questions Page 25 of 154
Had participated in any other investigational drug study within 30 days prior to
Day 1; or
Had prior exposure to S-297995 (the investigational medicinal product).
Study medicines: Participants received either naldemedine tablets or solution for
oral administration (at various doses listed above) or placebo as matching dose
forms.
Permitted and disallowed concomitant medications: [none specified]
Primary outcome: The primary outcome measure was Number of Participants With
Adverse Events [ Time Frame: From the first dose of study drug on Day 15 up to Day
24. ]
Severity of adverse events (AEs) was graded according to the following definitions:
Mild: The subject experiences awareness of symptoms but these are easily
tolerated or managed without specific treatment
Moderate: The subject experiences discomfort enough to cause interference
with usual activity, and/or the condition requires specific treatment
Severe: The subject is incapacitated with inability to work or do usual activity,
and/or the event requires significant treatment measures.
The relationship of the event to the study drug was determined by the investigator.
A serious adverse event (SAE) is defined as any AE occurring at any dose that
resulted in any of the following outcomes: death, life-threatening AE, hospitalization
or prolongation of existing hospitalization, a persistent or significant
disability/incapacity, or a congenital anomaly/birth defect.
Population included in primary analysis of primary outcome and methods for
handling missing data: See corresponding CSR
Statistical test in primary analysis of primary outcome: See corresponding CSR

Clarification questions Page 26 of 154
Primary hypothesis under investigation and power calculation: The primary
objective of the study was to evaluate the safety of single doses of oral naldemedine
in adults physically dependent on opioids.
The planned enrolment for this study was 72 subjects equally distributed across 6
experimental cohorts (by intended naldemedine dose); each cohort 9 participants
received naldemedine tablets and 3 participants received matching placebo.
Relevant analyses of relevant secondary outcomes:
Change From Baseline to 24 Hours Post-dose in Number of Spontaneous
Bowel Movements (SBMs) Per Day [ Time Frame: Baseline (Day 1 to Day 15)
and Day 15 to 16 (0 to 24 hours post-dose)]
Participants completed a bowel function assessment daily diary to record
information about bowel movements and constipation. A spontaneous bowel
movement was defined as a bowel movement where no laxative or enema
was used in the 24 hours preceding the bowel movement. Baseline was
defined as the average number of SBMs per day during the 2 weeks prior to
receiving study drug (Day 1 to Day 15).
Change From Baseline to 48 Hours Post-dose in the Number of SBMs Per
Day [ Time Frame: Baseline (Day 1 to Day 15) and Day 15 to Day 17 (0 to 48
hours post-dose) ]
Participants completed a bowel function assessment daily diary to record
information about bowel movements and constipation. A spontaneous bowel
movement was defined as a bowel movement where no laxative or enema
was used in the 24 hours preceding the bowel movement. Baseline was
defined as the average number of SBMs per day during the 2 weeks prior to
receiving study drug (Day 1 to Day 15). Forty-eight hours post-dose was
defined as the average number of SBMs per day from 0 to 48 hours post-
dose.
Change From Baseline to 24 Hours Post-dose in Number of Bowel
Movements (BM) Per Day [ Time Frame: Baseline and 24 hours post-dose ]

Clarification questions Page 27 of 154
Participants completed a bowel function assessment daily diary to record
information about bowel movements and constipation. Baseline was defined
as the average number of BMs per day during the 2 weeks prior to receiving
study drug (Day 1 to Day 15).
Change From Baseline to 48 Hours Post-dose in Number of Bowel
Movements Per Day [ Time Frame: Baseline and 48 hours post-dose ]
Participants completed a bowel function assessment daily diary to record
information about bowel movements and constipation. Baseline was defined
as the average number of BMs per day during the 2 weeks prior to receiving
study drug (Day 1 to Day 15). Forty-eight hours post-dose was defined as the
average number of BMs per day from 0 to 48 hours post-dose.
Change From Baseline to 24 Hours Post-dose in Number of Complete
Spontaneous Bowel Movements (CSBMs) Per Day [ Time Frame: Baseline
and 24 hours post-dose ]
Participants completed a bowel function assessment daily diary to record
information about bowel movements and constipation. A complete
spontaneous bowel movement was defined as a bowel movement where no
laxative or enema was used and the bowel movement resulted in a sensation
of complete evacuation (based on the question of "having a feeling of
complete emptying after the bowel movement"). Baseline was defined as the
average number of CSBMs per day during the 2 weeks prior to receiving
study drug (Day 1 to Day 15).
Change From Baseline to 48 Hours Post-dose in Number of Complete
Spontaneous Bowel Movements (CSBMs) Per Day [ Time Frame: Baseline
and 48 hours post-dose ]
Participants completed a bowel function assessment daily diary to record
information about bowel movements and constipation. A complete
spontaneous bowel movement was defined as a bowel movement where no
laxative or enema was used and the bowel movement resulted in a sensation
of complete evacuation (based on the question of "having a feeling of

Clarification questions Page 28 of 154
complete emptying after the bowel movement"). Baseline was defined as the
average number of CSBMs per day during the 2 weeks prior to receiving
study drug (Day 1 to Day 15). Forty-eight hours post-dose was defined as the
average number of CSBMs per day from 0 to 48 hours post-dose.
Time to First Spontaneous Bowel Movement [ Time Frame: From first dose on
Day 15 through Day 17 ]
The time to first SBM during the Study Drug Administration Period was
summarized using Kaplan-Meier estimates. Each participant's first SBM was
counted as an event and the time to first SBM after dosing was calculated
from the date and time of first dosing until the date and time of first SBM.
Participants who dropped out or were lost to follow-up before the first SBM
were censored.
Time to First Bowel Movement [ Time Frame: From first dose on Day 15
through Day 17 ]
The time to first BM during the Study Drug Administration Period was
summarized using Kaplan-Meier estimates. Each participant's first BM was
counted as an event and the time to first BM after dosing was calculated from
the date and time of first dosing until the date and time of first BM.
Participants who dropped out or were lost to follow-up before the first BM
were censored.
Time to First Complete Spontaneous Bowel Movement [ Time Frame: From
first dose on Day 15 through Day 17 ]
The time to first CSBM during the Study Drug Administration Period was
summarized using Kaplan-Meier estimates. Each participant's first CSBM was
counted as an event and the time to first CSBM after dosing was calculated
from the date and time of first dosing until the date and time of first CSBM.
Participants who dropped out or were lost to follow-up before the first CSBM
were censored.

Clarification questions Page 29 of 154
Change From Baseline in Straining During Bowel Movements
[ Time Frame: Baseline, 24 hours post-dose and 48 hours post-dose ]
Straining during BMs was graded using the following scale: 0 = Absent; 1 =
Mild; 2 = Moderate; 3 = Severe; 4 = Very Severe. Baseline was defined as the
average straining score of all BMs prior to receiving study drug (Day 1 to Day
15). The straining score at 24 and 48 hours post-dose was calculated as the
average straining score from all bowel movements from 0 to 24 and 0 to 48
hours post-dose, respectively.
Change From Baseline to 24 Hours Post-dose in Number of Complete Bowel
Movements Per Day [ Time Frame: Baseline and 24 hours post-dose ]
A complete bowel movement (CBM) was defined as a bowel movement that
resulted in a sensation of complete evacuation based on the question "Did
you have a feeling of complete emptying after the bowel movement?"
Baseline was defined as the average number of CBMs per day prior to
receiving study drug (Day 1 to Day 15).
Change From Baseline to 48 Hours Post-dose in Number of Complete Bowel
Movements Per Day [ Time Frame: Baseline and 48 hours post-dose ]
A complete bowel movement (CBM) was defined as a bowel movement that
resulted in a sensation of complete evacuation based on the question "Did
you have a feeling of complete emptying after the bowel movement?"
Baseline was defined as the average number of CBMs per day prior to
receiving study drug (Day 1 to 15). Forty-eight hours post-dose was
calculated as the average number of CBMs per day from 0 to 48 hours post-
dose.
Change From Baseline in Abdominal Bloating [ Time Frame: Baseline, 24
hours post-dose and 48 hours post-dose ]
Participants were asked to rate their abdominal bloating for the past 24 hours
using the following scale: 0 = Absent; 1 = Mild; 2 = Moderate; 3 = Severe; 4 =
Very Severe. Baseline was defined as the average abdominal bloating score

Clarification questions Page 30 of 154
prior to receiving study drug (Day 1 to Day 15). Abdominal bloating at 24
hours and 48 hours post-dose was calculated as the mean score from 0 to 24
and 0 to 48 hours post-dose respectively.
Change From Baseline in Abdominal Discomfort [ Time Frame: Baseline, 24
hours post-dose and 48 hours post-dose ]
Participants were asked to rate their abdominal discomfort for the past 24
hours using the following scale: 0 = Absent; 1 = Mild; 2 = Moderate; 3 =
Severe; 4 = Very Severe. Baseline was defined as the average abdominal
discomfort score prior to receiving study drug (Day 1 to Day 15). Abdominal
discomfort at 24 hours and 48 hours post-dose was calculated as the mean
score from 0 to 24 and 0 to 48 hours post-dose respectively.
Change From Baseline in BM Consistency [ Time Frame: Baseline, 24 hours
post-dose and 48 hours post-dose ]
Consistency of BMs was measured using the Bristol Stool Scale, as follows: 1
= separate hard lumps like nuts; 2 = sausage shaped but lumpy; 3 = like a
sausage, but with cracks on its surface; 4 = like a sausage or a snake, smooth
and soft; 5 = soft blobs and with clear-cut edges; 6 = floppy pieces with
ragged edges/mushy stool; 7 = watery, no solid pieces, entirely liquid.
Baseline was defined as the average consistency of BMs prior to receiving
study drug (Day 1 to Day 15). BM consistency at 24 hours and 48 hours post-
dose was calculated as the average scores from all bowel movements from 0
to 24 and 0 to 48 hours post-dose, respectively.
Change From Baseline in Number of False Start Bowel Movements Per Day
[ Time Frame: Baseline, 24 hours post-dose and 48 hours post-dose ]
A false start was defined as any attempted, but unsuccessful bowel
movement (no solid or liquid fecal material was excreted) based on the
question "In the past 24 hours, how many times did you try to have a bowel
movement but were unsuccessful?" Baseline was defined as the average
number of false start BMs per day prior to receiving study drug (Day 1 to Day
15). The number of false start BMs per day at 24 hours and 48 hours post-

Clarification questions Page 31 of 154
dose was calculated as is the average number of false start BMs per day from
0 to 24 and 0 to 48 hours post-dose, respectively.
Change From Baseline in the Number of Bowel Movements With No Straining
Per Day [ Time Frame: Baseline, 24 hours post-dose and 48 hours post-
dose ]
Straining during BMs was graded using the following scale: 0 = Absent; 1 =
Mild; 2 = Moderate; 3 = Severe; 4 = Very Severe. A BM without straining was
defined as a BM with a straining score = 0. Baseline was defined as the
average number of BMs without straining per day prior to receiving study drug
(Day 1 to Day 15). The number of BMs without straining per day at 24 hours
and 48 hours post-dose was calculated as the average number of BMs with
no straining per day from 0 to 24 hours and 0 to 48 hours post-dose,
respectively.
Change From Baseline in Number of Rescue Medications Used Per Day
[ Time Frame: Baseline, 24 hours post-dose and 48 hours post-dose ]
Baseline was defined as the average number of rescue medications used per
day prior to receiving study drug (Day 1 to Day 15). The number of rescue
medications used per day at 24 hours and 48 hours post-dose was calculated
as the average number of rescue medications used per day from 0 to 24
hours and 0 to 48 hours post-dose, respectively.
Percentage of Participants With Clinical Opiate Withdrawal Scale (COWS)
Score > 8 at Any Time During the Study [ Time Frame: The COWS
assessments were performed at Screening, on Day 14, Day 15 (pre-dose and
1, 2, 3, 4, 5, 6 and 8 hours post-dose, and at unscheduled times as signs or
symptoms indicate), on Days 16 and 17, and on Day 24/End of Study. ]
The COWS assessment consisted of 11 questions which rated the severity of
opiate withdrawal symptoms, including resting pulse rate, gastrointestinal
upset, sweating, restlessness, pupil size, tremor, anxiety or irritability, bone or
joint aches, gooseflesh skin, yawning, and runny nose or tearing. Each
symptom was rated on a scale from 0 (not present) to 4 or 5 (most severe).
Clarification questions Page 32 of 154
The total score was calculated by summing the 11 individual scores and
ranged from 0 (no withdrawal symptoms) to 48 (worst symptoms).
Percentage of Participants With Webster Opiate Withdrawal Scale (WOWS)
Score > 8 at Any Time During the Study [ Time Frame: The WOWS
assessment was performed at Screening, Day 14, Day 15 at pre-dose , and
24 and 48 hours post-dose and at the Follow-up/End of Study visit (Day 24). ]
The Webster Opiate Withdrawal Scale (WOWS) assessment consisted of 7
questions which rate the severity of opiate withdrawal symptoms, including
sweating, sleep, bone or joint aches, runny nose or tearing, gastrointestinal
upset, anxiety or irritability and gooseflesh skin. Each symptom was rated on
a scale from 0 (not present/no issues) to 4 or 5 (severe). The total score was
calculated by summing the 7 individual scores and ranged from 0 (no
withdrawal symptoms) to 29 (worst symptoms).
Maximum Observed Plasma Concentration (Cmax) of Naldemedine and
Metabolite Nor-S-297995 [ Time Frame: Blood samples were collected
predose and at 0.25, 0.5, 0.75, 1, 1.5, 2, 2.5, 3, 4, 5, 6, 8, 10, 12, 24, 36, 48,
and 72 hours post-dose. ]
The plasma concentration of naldemedine and its metabolite Nor-S-297995
were measured by liquid chromatography/tandem mass spectrometry
(LC/MS/MS) method.
Time to Maximum Observed Plasma Concentration of Naldemedine and
Metabolite Nor-S-297995 [ Time Frame: Blood samples were collected
predose and at 0.25, 0.5, 0.75, 1, 1.5, 2, 2.5, 3, 4, 5, 6, 8, 10, 12, 24, 36, 48,
and 72 hours post-dose. ]
The plasma concentration of naldemedine and its metabolite Nor-S-297995
were measured by liquid chromatography/tandem mass spectrometry
(LC/MS/MS) method.
Area Under the Plasma Concentration-time Curve From Time Zero to Time of
Last Measurable Concentration of Naldemedine and Metabolite Nor-S-297995

Clarification questions Page 33 of 154
[ Time Frame: Blood samples were collected predose and at 0.25, 0.5, 0.75,
1, 1.5, 2, 2.5, 3, 4, 5, 6, 8, 10, 12, 24, 36, 48, and 72 hours post-dose. ]
The plasma concentration of naldemedine and its metabolite Nor-S-297995
were measured by liquid chromatography/tandem mass spectrometry
(LC/MS/MS) method. Area under the plasma concentration versus time curve
from time zero to the last sampling time at which concentrations were at or
above the limit of quantitation, calculated using the linear trapezoidal rule for
increasing concentrations and the logarithmic rule for decreasing
concentrations (Linear Up/ Log Down).
Area Under the Plasma Concentration-time Curve From Time Zero to Infinity
for Naldemedine and Metabolite Nor-S-297995 [ Time Frame: Blood samples
were collected predose and at 0.25, 0.5, 0.75, 1, 1.5, 2, 2.5, 3, 4, 5, 6, 8, 10,
12, 24, 36, 48, and 72 hours post-dose. ]
The plasma concentration of naldemedine and its metabolite Nor-S-297995
were measured by liquid chromatography/tandem mass spectrometry
(LC/MS/MS) method. Area under the plasma concentration versus time curve
from time zero to infinity, calculated using the formula: AUC0-inf = AUC0-t +
Ct/λZ where Ct was the last measurable concentration and λZ was the
apparent terminal elimination rate constant.
Apparent Elimination Half-life of Naldemedine and Metabolite Nor-S-297995
[ Time Frame: Blood samples were collected predose and at 0.25, 0.5, 0.75,
1, 1.5, 2, 2.5, 3, 4, 5, 6, 8, 10, 12, 24, 36, 48, and 72 hours post-dose. ]
The plasma concentration of naldemedine and its metabolite Nor-S-297995
were measured by liquid chromatography/tandem mass spectrometry
(LC/MS/MS) method. The apparent elimination half-life was calculated using
the formula t1/2,z = (ln2)/λZ
Patient disposition: The study was conducted at a single study center in the United
States. Seventy-two Participants were randomized to naldemedine or placebo,
screened for 13 days (Days 1-13), and admitted to the clinic on Day 14 for pre-
admission assessments. Six cohorts were sequentially enrolled from Cohort 1 (0.1

Clarification questions Page 34 of 154
mg) to Cohort 2 (0.3 mg), Cohort 3 (1 mg), and Cohort 4 (3 mg), and subsequent de-
escalation in Cohorts 5 (0.03 mg) and 6 (0.01 mg). All patients completed the study
as shown in Table 6.
Table 6. Patient disposition in Study V9214
Baseline demographics: Baseline patient characteristics were comparable across
the different treatment groups (Table 7).

Clarification questions Page 35 of 154
Table 7. Baseline demographic characteristics of subjects in Study V9214
STUDY V9221(14,15)

Clarification questions Page 36 of 154
Title and/or study number: A Phase 2b, Randomized, Double-Blind Placebo-
Controlled Study to Evaluate the Efficacy and Safety of Naldemedine for the
Treatment of Opioid-Induced Constipation in Patients with Chronic Noncancer Pain
(NCT01443403; 1107V9221)
Study design: This was a phase 2b, multicentre, randomized, double-blind,
placebo-controlled parallel-group trial to evaluate the efficacy and safety of three
different doses of oral naldemedine in patients with chronic noncancer pain receiving
opioid therapy who had OIC and who maintained a stable laxative regimen
throughout the study.
Patients age 18 years or older were screened for 15–28 days. Those who met the
eligibility criteria and completed a Bowel Movement and Constipation Assessment
(BMCA) diary on a daily basis for at least 14 days were enrolled in the treatment
period. Patients were then randomized 1:1:1:1 to receive oral naldemedine 0.1 mg,
0.2 mg, or 0.4mg or placebo once daily for 28 days and were followed up for a
further 28 days to complete safety assessments. Patients were randomly assigned to
one of the four treatment groups using an interactive voice response system, which
assigned a unique number to each patient and was used to identify the patient in all
data systems. Treatment assignment was masked from each of participants, care
providers, investigators, and outcomes assessors.
Inclusion criteria: to be eligible, patients were required to:
have a documented medical history of chronic noncancer pain for at least
three months before screening;
be taking a stable dose of a full opioid agonist equivalent to at least 30mg oral
morphine daily for one month or longer before screening; and
have self-reported ongoing symptoms of OIC, defined as fewer than three
spontaneous bowel movements (SBMs) per week despite a stable regimen of
laxatives and one or more of the following symptoms in at least 25% of bowel
movements: straining, feeling of incomplete evacuation, and/or hard/small
stools, defined as Bristol Stool Scale (BSS) score lower than 3.

Clarification questions Page 37 of 154
Exclusion criteria: The following exclusion criteria were applied:
evidence of clinically significant GI disease, bowel dysfunction, bowel
obstruction, or pelvic disorder that may cause constipation;
a history of chronic constipation before starting analgesic medication or
nonopioid causes of bowel dysfunction that may have contributed to
constipation; severe constipation that had not been appropriately managed,
such that the patient was at immediate risk of developing serious related
complications;
initiation of a new treatment regimen for OIC or a prokinetic agent within 28
days of screening;
cancer treatment within the past five years;
history or presence of any clinically important abnormality, medical condition,
or use of concomitant medication(s), that could have interfered with the study;
medically significant cardiovascular, respiratory, hepatic, renal or thyroid
dysfunction, or a history of human immunodeficiency virus infection;
any medical or psychiatric condition that may have compromised the ability of
the patient to understand and comply with the study protocol;
current use of any prohibited medication, including opioid receptor
antagonists, partial agonists, fentanyl, or meperidine;
the inability to take oral medication;
any history of illegal drug use in the past five years;
surgery within one month of screening or planned surgery during study
treatment that would, in the opinion of the investigators, have affected the
study results;
any relevant allergies;

Clarification questions Page 38 of 154
treatment with an investigational study drug in the 30 days before screening;
or
previous exposure to naldemedine.
Study medicines: Participants received either oral naldemedine 0.1 mg, 0.2 mg, or
0.4mg or matching placebo once daily for 28 days.
Permitted and disallowed concomitant medications: Patients were required
either to maintain a stable laxative regimen throughout the study (defined as any
combination of laxatives that had been taken consistently in the 28 days before the
start of the study) or not to use any laxatives.
Primary outcome: The primary efficacy end point was the mean change in weekly
SBM frequency from baseline to the last two weeks of the treatment period.
The BMCA diary was completed on a daily basis for the 28 days of treatment. As
part of this diary record, patients also assessed the consistency of stools using BSS.
To minimize the potential for overestimating the frequency of BMs, all passages of
stool with a score of at least 1 on the BSS that occurred within a two-hour time frame
were classified as a single BM. The baseline mean number of SBMs was calculated
from the data collected in the last two weeks of screening, before the first dose of
study drug was administered. Any BMs in the 24 hours after use of rescue laxatives
were not considered to be spontaneous.
The Bristol stool scale is a diagnostic medical tool designed to classify the form of
human faeces into seven categories from 'Separate hard lumps, like nuts (hard to
pass)’ to ‘Watery, no solid pieces, entirely liquid’ where Types 1 and 2 indicate
constipation. Several clinical studies have used the scale as a diagnostic tool
validated for recognition and evaluation of response to various treatments for OIC
(16,17).
Population included in primary analysis of primary outcome and methods for
handling missing data: The modified intent-to-treat population (mITT) comprised all
randomized patients who received the study drug and for whom at least one post
dose primary efficacy assessment had been completed.

Clarification questions Page 39 of 154
Missing values due to withdrawal of subjects from the study were imputed with the
last observation carried forward method.
Statistical test in primary analysis of primary outcome: The mean change in
weekly SBM frequency in each naldemedine dose group was compared with that of
the placebo group, based on an analysis of covariance model, with frequency of
SBMs per week at baseline as a covariate. Naldemedine dose groups were
compared with the placebo group sequentially in descending order of dose.
Primary hypothesis under investigation and power calculation: The study aimed
to test a superiority hypothesis of each naldemedine dose versus placebo. Based on
pairwise comparison with placebo, a sample size of 212 (53 subjects per treatment
group) was required to provide greater than 80% power to detect a treatment
difference of at least 2.1 in the primary end point of change from baseline in the
number of SBMs per week (at a two-sided significance level of 0.05 and assuming a
standard deviation of 3.8). A total target sample size of 240 subjects (60 per
treatment group) was determined, taking into consideration a 10% dropout rate.
Relevant analyses of relevant secondary outcomes:
Change in weekly SBM frequency from baseline to weeks 1, 2, 3, and 4
(evaluable1 mITT);
Change in weekly frequency of BMs2, complete BMs3 (CBM), and complete
SBMs4 (CSBM) from baseline to the last two weeks of the treatment period
the proportions of SBM and CSBM responders (defined as patients with ≥3
SBMs/CSBMs per week in the last two weeks of the treatment period and an
increase of ≥1 SBMs/CSBMs per week from baseline);
change in weekly frequency of SBMs without straining from baseline to the
last two weeks of the treatment period;
1 population with values at both baseline and the specified time point 2 A BM was defined as all bowel movements observed irrespective of the use of a laxative agent. 3 A complete BM (CBM) was defined as a BM where the participant answered ‘Yes’ to the following question: ‘Did you have a feeling of complete emptying after the bowel movement?’ 4 A CSBM was defined as a spontaneous BM which was accompanied by the feeling of complete evacuation.
Clarification questions Page 40 of 154
change in abdominal bloating score from baseline to the last two weeks of the
treatment period (this score was assessed daily for the past 24 hours and
could range from 0 to 4, where 0 = absent or no bloating, 1 = mild, 2 =
moderate, 3 = severe, and 4 = very severe bloating);
change in abdominal discomfort score from baseline to the last two weeks of
the treatment period (this score was assessed daily for the past 24 hours and
could range from 0 to 4, where 0 = no abdominal discomfort, 1 = mild, 2 =
moderate, 3 = severe, and 4 = very severe discomfort);
the proportion of patients with an improvement in their global satisfaction
score at the end of treatment on day 29 (assessed by the patient selecting
one of the following descriptors: markedly worsened, moderately worsened,
slightly worsened, unchanged, slightly improved, moderately improved, or
markedly improved);
time to first SBM and CSBM after initial treatment administration;
the incidence of SBMs and of CSBMs in the four, eight, 12, and 24 hours after
initial treatment administration;
change in the number of days with SBMs and with CSBMs per week from
baseline to the last two weeks of the treatment period;
change in weekly frequency of SBMs rated 3 or 4 on the BSS from baseline to
the last two weeks of the treatment period;
change in the weekly frequency of false starts of BMs from baseline to the last
two weeks of the treatment period;
change in the weekly frequency of rescue laxative use from baseline to the
last two weeks of the treatment period;
the frequency of rescue laxative use during the treatment period.
Patient disposition: In total, 244 patients were randomized 1:1:1:1 to the
naldemedine 0.1 mg, 0.2 mg, 0.4 mg, or the placebo groups (see Figure 4)

Clarification questions Page 41 of 154
Figure 4. Subject flow diagram for study V9221
Baseline demographics: Baseline patient characteristics were comparable across
the different treatment groups (Table 8). The mean total daily dose of opioids at
baseline was not significantly different across treatment groups (P=0.8635). Subjects
were required to maintain a stable laxative regimen throughout the study. The
proportion of subjects using concomitant, regular laxative agents during the study
was similar across the placebo and naldemedine dose groups (72.1% [44/61], 75.4%
[46/61], 78.0% [46/59], and 71.9% [41/57] for the placebo, naldemedine 0.1 mg, 0.2
mg, and 0.4mg groups, respectively).

Clarification questions Page 42 of 154
Table 8. Baseline characteristics of the V9221 study population (mITT population)
STUDY V9222(18,19)
Title and/or study number: Phase IIb, Randomized, Double-Blind, Placebo-
Controlled Study of Naldemedine for the Treatment of Opioid-Induced Constipation
in Patients with Cancer (JapicCTI-111510)
Study design: This randomized, double-blind, placebo-controlled, parallel-group,
multicentre study evaluated three doses of naldemedine compared with placebo.
Patients were recruited from 102 sites in two countries (Japan and Korea). Eligible
patients were randomly assigned 1:1:1:1 to receive naldemedine 0.1, 0.2, or 0.4 mg,
or placebo, administered orally once daily in the morning for 14 days, with a follow-
up of 28 days. Random assignment was performed using the dynamic allocation
procedure of the registration centre, where the maximum intergroup difference in the
patient number at each study site did not exceed two.
Inclusion criteria: Screened patients with cancer were ≥18 years of age, had been
receiving opioids for ≥2 weeks before screening and were expected to continue
opioid treatment for ≥4 weeks thereafter, and had at least one constipation symptom
(straining during BM, feeling of incomplete evacuation, passage of hard stools)
despite regular laxative use.
Key inclusion criteria were stable opioid dosage, SBM frequency of no more than five
times and at least one of the above constipation symptoms in at least 25% of BMs
Clarification questions Page 43 of 154
within 14 days of the screening period, and Eastern Cooperative Oncology Group
performance status of ≤25.
Exclusion criteria: Key exclusion criteria included new cancer therapy or any
therapy with obvious effects on GI functions within 14 days before enrolment,
radiotherapy or surgery within 28 days before enrolment, constipation potentially
attributable to causes other than opioid analgesics (such as mechanical intestinal
obstruction), or presence of other known clinically significant GI, bowel, or pelvic
disorders.
Study medicines: Either naldemedine 0.1, 0.2, 0.4mg, or placebo, administered
orally once daily in the morning for 14 days.
Permitted and disallowed concomitant medications: Regular-use laxatives at the
time of screening could be continued by the investigator; however, the drug and its
dosage regimen could not be changed. Laxatives for rescue use were allowed when
necessary but were prohibited 24 hours before and after initial administration of
study drug.
Primary outcome: Change in the frequency of SBMs per week from baseline during
a 14-day treatment period (an SBM was defined as a BM that occurred without
rescue-laxative use within the previous 24 hours). Subjects recorded the date and
time of every BM and rescue-laxative use and evaluated stool formation and
abdominal symptoms in a diary.
Population included in primary analysis of primary outcome and methods for
handling missing data: Efficacy analyses were performed on the full analysis set
(FAS; all randomly assigned patients who received study treatment and for whom
any information on efficacy was obtained).
Missing values due to withdrawal of subjects from the study were imputed with the
last observation carried forward method.
5 Describing a patient who is at least: “Ambulatory and capable of all selfcare but unable to carry out any work activities; up and about more than 50% of waking hours”(51)

Clarification questions Page 44 of 154
Statistical test in primary analysis of primary outcome: For the primary efficacy
endpoint, each naldemedine dose group was compared with placebo by analysis of
covariance, with the frequency of SBMs per week at the baseline as a covariate. The
fixed sequence testing approach, starting from higher doses of naldemedine, was
used to control the overall type I error rate at ≤ 0.05 for the primary end point.
Primary hypothesis under investigation and power calculation: On the basis of
results of clinical studies of alvimopan(20,21), which has the same mechanism of
action as naldemedine, the standard deviation of the change in the frequency of
SBM per week from baseline was assumed to be 3.8, with the intergroup difference
for naldemedine versus placebo assumed to be 2.1. To ensure 80% power of
detecting this difference at a two-sided a of 0.05 in a two-sample t test, 53 patients
per treatment group were considered necessary; therefore, the targeted sample size
was determined to be 212 patients.
Relevant secondary analyses of primary outcome and analyses of relevant
secondary outcomes:
After evaluating the efficacy of naldemedine compared with placebo, the
comparisons in pairs between naldemedine dose groups were made as
secondary analyses.
The changes in frequency of CSBMs or SBMs without straining per week from
baseline were analyzed similarly.
Differences in the SBM responder rates of each naldemedine dose group
versus placebo were evaluated using the Chi-squared test.
Patient disposition: Patients were recruited between June 14, 2011, and February
8, 2013. Of 354 patients screened, 227 were randomly assigned, and 225 were
included in the FAS (naldemedine 0.1mg, n=55; naldemedine 0.2mg, n=58;
naldemedine 0.4mg, n=56; placebo, n=56; Figure 5).
Baseline demographics: Baseline characteristics were generally similar across all
treatment groups (Table 9). The mean regular-use opioid dosage per day ranged
from 54.9 to 85.5mg per day across all four groups. All patients had prior regular

Clarification questions Page 45 of 154
laxative use, and 98% to 100% had prior regular concomitant laxative use.
Treatment compliance of ≥80% was reported by 100% of subjects receiving placebo
(n=56) and naldemedine 0.2mg (n=58), 98.2% of subjects receiving naldemedine
0.1mg (n=54), and 92.9% of subjects receiving naldemedine 0.4mg (n=52).
Figure 5. CONSORT diagram for Study V9222.

Clarification questions Page 46 of 154
Table 9. Baseline characteristics of the full analysis set for Study V9221
A12. The ERG would like to consider the applicability of the COMPOSE trials to
the patients who might be offered naldemedine in clinical practice in England.
a. How many UK patients / patients in England were included in each of the
COMPOSE trials?
There was a total of 29 subjects from the UK in the COMPOSE 1 trial and 57 in the
COMPOSE 3 trial. There were no subjects from the UK in COMPOSE 2.
b. Do you consider the patients in the COMPOSE trials to reflect those seen in
clinical practice in England? If so, please provide supporting evidence.
Table 10. Baseline characteristics for subjects in the UK compared to the overall ITT population
Characteristic COMPOSE 1 - UK patients COMPOSE 1 & 2 p-value COMPOSE 3 - UK patients COMPOSE 3 p-value
N 29 1095 57 1241
Gender 0.4495 0.3572
Male, n (%) 14 (48.28%) 433 (39.54%) 17 (29.82%) 456 (36.74%)
Female, n (%) 15 (51.72%) 662 (60.46%) 40 (70.18%) 785 (63.26%)
Age, mean (sd) 50.41 (12.45) 53.42 (10.84) 0.2076 50.72 (11.46) 53.04 (11.14) 0.1401
BMI, mean (sd) 31.29 (7.78) 31.27 (7.29) 0.9937 32.08 (6.28) 31.56 (7.62) 0.5497
As seen in Table 10 there is no statistical significance between any of the baseline
characteristics for those from the UK compared to the overall ITT cohorts in their
respective trials. Additionally, presented in Table 11 the baseline characteristics for
all non-cancer UK patients with OIC.

Clarification questions Page 47 of 154
Table 11. Baseline characteristics of non-cancer UK CPRD OIC patients
Characteristic CPRD UK non-cancer
N 74,206
Gender
Male, n (%) 26,116 (35.2%) Female, n (%) 48,090 (64.8%)
Age, mean (sd) 68.7 (17.4)
c. How relevant to clinical practice in England are COMPOSE-4 and -5, the trials
of patients with cancer, given that these were conducted in Japan?
Comparison of the demographic characteristics of the COMPOSE-4 and -5 studies,
indirect comparison cohort (methylnaltrexone [MNTX]), and the UK CPRD cohort
used to derive health resource data indicates a close match in terms of age and
gender balance. Shionogi therefore believe the results of these studies to be relevant
to clinical practice in England.
COMPOSE 4
(FAS)
COMPOSE 5
(FAS) MNTX QAD(22) UK CPRD
N 193 131 116 25,044
Age, mean 64.2 63.5 65.3 702
Male, % 61.7% 56.5% 51.7% 53.7%
d. In COMPOSE-1, -2 and -3, patients have an average Body Mass Index (BMI)
of >30. How does this relate to patients seen in clinical practice in England?
Based on the real-world evidence carried out using CPRD, the mean BMI for OIC
patients was 28.7 kg/m-2 compared to 31.27 kg/m-2 from COMPOSE-1 & -2 ITT
overall population. We believe that these give relatively similar results.
Clarification questions Page 48 of 154
e. In the COMPOSE trials -1, -2 and -3, patients had to be following a stable
opioid regimen for at least one month. Please discuss if this would also apply
if naldemedine were used in clinical practice in England.
Naldemedine is indicated in EU/UK for the treatment of opioid-induced
constipation (OIC) in adult patients who have previously been treated with a
laxative. Shionogi contend that the enrolment criteria for COMPOSE-1, -2, and -3
trials requiring that patients had to be following a stable opioid regimen for at
least one month prior is consistent with usual clinical practice as evidenced by
the UEG/EFIC consensus guidelines (see Figure 2), which recommend not only
co-prescription of standard laxatives if constipation develops after commencing
opioids in a primary care setting but also addressing lifestyle aspects if patients
report constipation extant to laxative prescription. At the advisory board of UK
clinical experts held in September 2018, an evaluation period of one-month for
OIC interventions was considered reasonable.
A13. The company assessed the quality of the COMPOSE trials and presented the
results in Table 12 of the CS.
a. COMPOSE-1 and COMPOSE-3 were rated as ‘Not clear’ for similarity of
groups in terms of prognostic factors. Was there any evidence of imbalance in
patient characteristics between groups in these trials?
The designation of the ‘Not clear’ rating in assessment of imbalance in patient
characteristics between treatment allocation groups in the COMPOSE-1 and
COMPOSE-3 studies appears to be a typographical error and should in each case
read ‘Yes’. Apologies for any confusion.
In both studies, the principal investigators concluded that “The patient baseline
characteristics in the two studies [COMPOSE-1 & -2] were generally similar and well
balanced for patients randomly assigned to either treatment group”(23) and for
COMPOSE-3, “Patient demographics and baseline characteristics were similar
between treatment groups in the safety population”(24).
Clarification questions Page 49 of 154
b. In COMPOSE-4 both similarity of groups and blinding were rated as ‘Not
clear’. Please provide further details.
The designation of the ‘Not clear’ rating in assessment of imbalance in patient
characteristics between treatment allocation groups in the COMPOSE-4 study
appears to be a typographical error and should read ‘Yes’. Apologies for any
confusion.
In this study, the principal investigators concluded that “Demographic and baseline
characteristics were well balanced between treatment groups in COMPOSE-4 and
were similar across the subset of patients who continued on to COMPOSE-5”(25).
A14. Please provide details of the sample size calculations and statistical analysis
methods of the COMPOSE trials.
Apologies for not supplying this information originally.
COMPOSE 1 – Sample size
The primary endpoint is the proportion of responders. A responder is defined as
having 9 positive response weeks or more out of the 12-week Treatment Period and
3 positive response weeks out of the last 4 weeks of the 12-week Treatment Period.
A positive response week will be defined as ≥ 3 SBM per week and an increase from
baseline of ≥ 1SBM per week for that week. If a subject has less than 4 days of diary
entries related to defecation for a week, that week will be treated as a “non-
response” week. An SBM is defined as a bowel movement that occurs without the
use of a rescue laxative therapy during the 24 hours prior to the BM. A BM occurring
within 24 hours after rescue laxative therapy will not be considered as an SBM.
Assuming a 45% responder proportion from naldemedine 0.2 mg group and 30%
responder proportion from the placebo group for the intention-to-treat (ITT)
population, a sample size of 540 subjects (270 subjects in the active treatment group
and 270 subjects in the placebo group) provides greater than 95% power to detect a
15% or greater between-group difference in responder proportions with a 2-sided
significance level of 0.05 by Pearson’s chi-squared test.
COMPOSE 2 – Sample size

Clarification questions Page 50 of 154
The primary endpoint is the proportion of responders. A responder is defined as
having 9 positive response weeks or more out of the 12-week Treatment Period and
3 positive response weeks out of the last 4 weeks of the 12-week Treatment Period.
A positive response week will be defined as ≥ 3 SBM per week and an increase from
baseline of ≥ 1 SBM per week for that week. If a subject has less than 4 days of
diary entries related to defecation for a week, that week will be treated as a “non-
response” week. An SBM is defined as a bowel movement that occurs without the
use of a rescue laxative therapy during the 24 hours prior to the BM. A BM occurring
within 24 hours after rescue laxative therapy will not be considered as an SBM.
Assuming a 45% responder proportion from naldemedine 0.2 mg group and 30%
responder proportion from the placebo group for the intention-to-treat (ITT)
population, a sample size of 540 subjects (270 subjects in the active treatment group
and 270 subjects in the placebo group) provides greater than 95% power to detect a
15% or greater between-group difference in responder proportions with a 2-sided
significance level of 0.05 by Pearson’s chi-squared test.
COMPOSE 3 – Sample size
Approximately 1200 subjects, about 600 subjects per arm (1:1 randomization ratio)
were to be randomized in the study. The anticipated number of subjects and
corresponding duration of treatment was fully aligned to meet or exceed the ICH E1
Guidelines: The Extent of Population Exposure to Assess Clinical Safety for Drugs
Intended for Long-term Treatment of Non-Life-Threatening Conditions. Exposures of
at least 6 months for 300 to 600 subjects and of 1 year for 100 subjects in each of
the study arms were anticipated.

Clarification questions Page 51 of 154
A15. There is extensive reporting of results for ‘the pool’, which appears to refer to
pooled data from COMPOSE-1 and COMPOSE-2. If the results of two studies were
pooled this should have been done using meta-analysis. However, the methods of
pooling have not been reported. Please provide details of the pooling methods for
the following: COMPOSE-1 and -2; V9222 and COMPOSE-4; and KODIAC-4 and -5.
The pooled analysis of COMPOSE 1 and COMPOSE 2 methods are outlined in the
Hale et al publication (23).
A16. Results of subgroup analyses are currently limited to unlabelled forest plots (the
headings state “enter description”) and appear to be for pooled data (COMPOSE-1
and COMPOSE-2), but no description of pooling methods is provided. Please
provide full methods for and results of subgroup analyses.
The pooled analysis of COMPOSE 1 and COMPOSE 2 methods are outlined in the
Hale et al publication (23).
A17. In the section on ongoing studies there is a statement that ‘there are no
Shionogi ongoing studies’. Are you aware of any other ongoing studies relevant to
this appraisal?
The original statement pertaining to ongoing studies was incorrect. At the current
time of writing, Shionogi are aware of two company sponsored- and four
independent ongoing studies relevant to this appraisal. Each is detailed as follows:
V9241(26) (company sponsored)
Title and/or study number: Risk of Major Adverse Cardiovascular Events Among
Users of Naldemedine Compared With Other Medications Used for Opioid Induced
Constipation in Adult Patients With Chronic Non-Cancer Pain in a Healthcare Claims
Database (NCT03720613)
Study design: The research objective is to characterize the risk of a major adverse
cardiovascular event (MACE) among new users of naldemedine versus new users of
lubiprostone and new users of naloxegol as comparator opioid induced constipation
(OIC) medications. This is an observational prospective cohort study conducted in
the United States only. There is neither blinding of participants nor randomisation of
study medications.

Clarification questions Page 52 of 154
Inclusion criteria: a patient is eligible if all the following apply:
At least one dispensing of naldemedine or lubiprostone or naloxegol without
prior use in the database of either medication (index date);
At least two dispensings of opioids within six months prior to and including the
index date, with at least a combined 31 cumulative days supply;
At least 18 years of age or older on the index date; and
At least six months of continuous health plan coverage that includes medical
and pharmacy benefits prior to and including the index date.
Exclusion criteria: a patient is ineligible if any of the following apply:
Any acute MACE (non-fatal MI or non-fatal stroke) within six months before or
on the index date;
Any cancer treatment or cancer pain diagnosis within six months before or on
the index date; or
Prior use of methylnaltrexone, alvimopan or naloxegol within six months
before or on the index date.
Study medicines: three marketed medicines will be studied when used in
accordance with their US-licensed posology:
Naldemedine (Symproic®) - 0.2 mg tablet once a day at any time with or
without food
Lubiprostone (Amitiza®) - 0.024 mg twice a day [adjust dose based on liver
function]
Naloxegol (Movantik®) - 25 mg tablet once a day in morning, 1 hour before or
2 hours after food
Permitted and disallowed concomitant medications: None specified.
Clarification questions Page 53 of 154
Primary outcome: Number of participants with a Major Adverse Cardiovascular
Event (MACE) over a 5-year time frame, where MACE is a composite of
cardiovascular (CV) death, nonfatal myocardial infarction (MI), and non-fatal stroke.
Population included in primary analysis of primary outcome and methods for
handling missing data: The study population will include new users of naldemedine
or one of the comparator OIC medications (lubiprostone or naloxegol) who satisfy all
of the inclusion criteria and none of the exclusion criteria.
Statistical test in primary analysis of primary outcome: Not reported.
Primary hypothesis under investigation and power calculation: Estimated
enrolment is 34532.
Relevant secondary analyses of primary outcome and analyses of relevant
secondary outcomes:
Number of participants with cardiovascular death over 5 years;
Number of participants with nonfatal myocardial infarction over 5 years; and
Number of participants with nonfatal stroke over 5 years.
Additional information: the estimated study completion date is November 1, 2025.
JapicCTI-183988(27) (company sponsored)
Title and/or study number: Symproic Tablets 0.2mg drug use-results survey
Study design: To collect safety and efficacy data on Symproic Tablets 0.2mg under
conditions of actual use including long-term and to detect patient background where
diarrhoea, the important identified risk, is likely to expression or to becomes severe.
Eligibility criteria: Opioid-induced constipation in patients with chronic non-cancer
pain.

Clarification questions Page 54 of 154
Study medicines: Symproic Tablets 0.2mg (Naldemedine) taken at the usual oral
dosage of once daily.
Permitted and disallowed concomitant medications: None specified.
Primary outcome/s: Safety and effectiveness.
Population included in primary analysis of primary outcome and methods for
handling missing data: Not reported.
Statistical test in primary analysis of primary outcome: Not reported.
Primary hypothesis under investigation and power calculation: Estimated
enrolment is 350 Japanese patients.
Relevant secondary analyses of primary outcome and analyses of relevant
secondary outcomes: Not reported.
Additional information: the estimated study completion date is 28FEB2023.
JPRN-UMIN000031891(28) (independent study)
Title and/or study number: Superiority comparative test of conventional treatment
vs naldemedine for prevention of opioid-induced constipation in cancer patients:
Investigator initiated, single center, 2 arm, open label, randomized controlled trials
Study design: This Phase III pragmatic exploratory trial will compare the effect
against quality of life (QOL) between conventional treatment (magnesium oxide) and
naldemedine on the prevention of opioid-induced constipation with cancer patients.
Patients will be randomised to receive either naldemedine or active control (MgO),
and the study will be double blinded.
Inclusion criteria: a patient will be eligible if all the following apply:
Aged 20 to 85 years of age (inclusive) at the time of acquisition;
Are not undergoing opioid analgesic treatment at enrolment;
Clarification questions Page 55 of 154
Scheduled to use opioids due to cancer pain;
Can take oral medicine, meals and drinks;
Can be evaluated by patient diary (Surrogate record to patient's diary is
permitted only when patient's own evaluation is possible);
Expected to have stable cancer pathology during the observation period; and
Written consent from participants to participate in this research, observe
observance matter participating in this research, undergo examination
prescribed in this research plan, and can declare symptoms etc.
Exclusion criteria: a patient will be ineligible if any of the following apply:
Contraindicated in the package inserts of magnesium oxide and naldemedine
and patients who have a history of hypersensitivity to the components of
either drug;
Serious structural abnormalities of the digestive tract (e.g. mechanical ileus),
diseases affecting intestinal transport (e.g. paralytic ileus, peritoneal
dissemination affecting gastrointestinal function, peritoneal cancer,
uncontrolled thyroid function decline (IBS), inflammatory bowel disease (e.g.
ulcerative colitis, Crohn's disease), active diverticular disease, pelvic disorders
causing constipation (uterine prolapse, rectal prolapse, defecation A patient
with uterine fibroids affecting GI function). Also, even if these diseases are
cured at present, patients judged by doctors to affect digestive tract function;
Breastfeeding or may be pregnant; and
Surgery that affects GI function, treatment (e.g. nerve block) or radiotherapy
affecting GI function within 28 days from the date of registration or patients
scheduled to be performed during the observation period.
Study medicines: Naldemedine (intervention) or magnesium oxide (active control).
Permitted and disallowed concomitant medications: None specified.

Clarification questions Page 56 of 154
Primary outcome/s: PAC-QOL overall score difference after 2 weeks of treatment
start from baseline.
Population included in primary analysis of primary outcome and methods for
handling missing data: Not reported.
Statistical test in primary analysis of primary outcome: Not reported.
Primary hypothesis under investigation and power calculation: Estimated
enrolment is 120 Japanese patients.
Relevant secondary analyses of primary outcome and analyses of relevant
secondary outcomes:
PAC-SYM overall score difference after 2 weeks of treatment start from
Baseline;
CSS overall score difference after 2 weeks of treatment start from Baseline;
Difference in the presence or absence of constipation by Rome IV (all
observation period) after 2 weeks of treatment start from Baseline;
Bristol scale overall score difference after 2 weeks of treatment start from
Baseline;
SBMs overall score difference after 2 weeks of treatment start from Baseline;
PAC-QOL overall score difference after 12 weeks of treatment start from
Baseline;
PAC-SYM overall score difference after 12 weeks of treatment start from
Baseline;
CSS overall score difference after 12 weeks of treatment start from Baseline;
Difference in the presence or absence of constipation by Rome IV (all
observation period) after 12 weeks of treatment start from Baseline;

Clarification questions Page 57 of 154
Bristol scale overall score difference after 12 weeks of treatment start from
Baseline;
SBMs overall score difference after 12 weeks of treatment start from Baseline;
and
Oral compliance rate.
Additional information: the estimated study completion date is 21MAR2023.
JPRN-UMIN000030218(29)(independent study)
Title and/or study number: Multicenter Prospective Trial of Efficacy of
Naldemedine for Opioid-Induced Constipation in Patients with Advanced Pancreatic
Cancer
Study design: This is a single-arm open-label prospective study to evaluate the
efficacy and safety of a peripherally acting opioid receptor antagonist, naldemedine
for opioid-induced constipation (OIC) in patients with advanced pancreatic cancer.
Inclusion criteria: a patient will be eligible if all the following apply:
Aged at least 20 years of age (inclusive) at the time of enrolment;
Have pancreatic cancer with OIC receiving treatment by opioid for 2 weeks or
more against cancer pain;
Have less than three spontaneous bowel movements during a week before
entry; and
Understand sufficiently the study to provide written informed consent.
Exclusion criteria: a patient will be ineligible if any of the following apply:
Presence or suspicion of gastrointestinal stricture;
Difficult ingestion;

Clarification questions Page 58 of 154
Allergy to naldemedine;
Severe mental illness; or
Unsuitable case.
Study medicines: Naldemedine is administered orally once daily at a dose of
0.2mg/d for 14 consecutive days.
Permitted and disallowed concomitant medications: None specified.
Primary outcome/s: Proportion of spontaneous bowel movement responders during
the 2-week treatment period.
Population included in primary analysis of primary outcome and methods for
handling missing data: Not reported.
Statistical test in primary analysis of primary outcome: Not reported.
Primary hypothesis under investigation and power calculation: Estimated
enrolment is 60 Japanese patients.
Relevant secondary analyses of primary outcome and analyses of relevant
secondary outcomes: None reported.
JPRN-UMIN000030219(30) (independent study)
Title and/or study number: Prospective Trial of Efficacy of Naldemedine for Opioid-
Induced Constipation in Patients with Advanced Pancreatic Cancer: Quality of Life
survey
Study design: This is a prospective single-arm open-label prospective study to
survey QOL by naldemedine for opioid-induced constipation.
Inclusion criteria: a patient will be eligible if all the following apply:
Aged at least 20 years of age (inclusive) at the time of enrolment;

Clarification questions Page 59 of 154
Have pancreatic cancer with OIC receiving treatment by opioid for 2 weeks or
more against cancer pain;
Have less than three spontaneous bowel movements during a week before
entry; and
Understand sufficiently the study to provide written informed consent.
Exclusion criteria: a patient will be ineligible if any of the following apply:
Presence or suspicion of gastrointestinal stricture;
Difficult ingestion;
Allergy to naldemedine;
Severe mental illness; or
Unsuitable case.
Study medicines: Naldemedine is administered orally once daily at a dose of
0.2mg/d for 14 consecutive days.
Permitted and disallowed concomitant medications: None specified.
Primary outcome/s: Change of QOL score at 2 weeks after treatment. QOL
questionnaire perform at the start of naldemedine and two weeks after
commencement.
Population included in primary analysis of primary outcome and methods for
handling missing data: Not reported.
Statistical test in primary analysis of primary outcome: Not reported.
Primary hypothesis under investigation and power calculation: Estimated
enrolment is 20 Japanese patients.
Relevant secondary analyses of primary outcome and analyses of relevant
secondary outcomes: None reported.

Clarification questions Page 60 of 154
JPRN-UMIN000029459(31)(independent study)
Title and/or study number: Study on the effect of Naldemedine Tosilate by diet
Study design: This is a prospective twin-arm open-label non-randomised cross-over
study to investigate the effect of Naldemedine Tosilate usage and consider
appropriate usage.
Inclusion criteria: a patient will be eligible if all the following apply:
OIC patient (1 week with less than 3 SBMs)
One or more of the following items,
o constipation with straining,
o feeling of incomplete evacuation, or
o pain at defecation;
Men and women of ages 20 to 75 years old;
Performance status (0-2);
Patients taking boiled rice as staple food; and
A written agreement is provided.
Exclusion criteria: a patient will be ineligible if any of the following apply:
Performance status (3-4);
Artificial anus;
Ileus of intestine;
Patients taking specific dietary form (for example, liquid diet, etc);
Having regular use of Itraconazole, Fluconazole, Rifampicin, or Ciclosporin;

Clarification questions Page 61 of 154
Patients who do not obtain written consent; or
Patients judged inappropriate by the research director.
Study medicines: Arm 1, take Naldemedine Tosilate after breakfast for 1 week and
on waking the next week. Arm 2, take Naldemedine Tosilate on waking for 1 week
and after breakfast the next week.
Permitted and disallowed concomitant medications: Use of Itraconazole,
Fluconazole, Rifampicin, or Ciclosporin prohibited.
Primary outcome/s: Change of QOL score at 2 weeks after treatment. QOL
questionnaire perform at the start of naldemedine and two weeks after
commencement.
Population included in primary analysis of primary outcome and methods for
handling missing data: Comparison of the change amount from the baseline of the
number of SBM per week due to the difference in usage and the time from oral
administration to the first SBM.
Statistical test in primary analysis of primary outcome: Not reported.
Primary hypothesis under investigation and power calculation: Estimated
enrolment is 14 Japanese patients.
Relevant secondary analyses of primary outcome and analyses of relevant
secondary outcomes:
Change amount of NRS score;
Change in rescue usage; and
Survey of senses by questionnaire.

Clarification questions Page 62 of 154
A18. The company provides results on the COMPOSE-trial in Tables 14 and 15,
however, information on the trials the data stem from is contradictory or missing:
a. The second row of Table 14 in the CS states that the results are for
COMPOSE-1, COMPOSE-2 and the pool respectively, though data for the
outcomes from these studies were already provided in the row above.
Apologies for this, Table 14 from the CS has now been updated (Table 12).
Table 12. Time to onset of action (Table 14 CS)
Data pool Endpoint definition Results
Trials COMPOSE-1, COMPOSE-2, and the pool (non-cancer)
Median time to first SBM: naldemedine vs placebo
16.07 vs 46.73, 18.33 vs 45.92, and 17.67 vs. 46.70 hours for COMPOSE-1, COMPOSE-2, and the pool respectively
Trials V9222, COMPOSE-4, and the pool (cancer)
4.33 vs 45.43, 4.67 vs 26.58, and 4.42 vs. 30.88 hours for V9222, COMPOSE-4, and the pool respectively.
b. In Table 15 results are presented without any information on the trials they
stem from.
Apologies for the lack of information. Table 15 has now been updated to be clearer
(Table 13).
Table 13. Quality of life (Table 15 CS)
Data pool Endpoint definition Results
Study COMPOSE-1, COMPOSE-2 and COMPOSE-3 Non-cancer pain
PAC-SYM
PAC-QOL
Changes in the overall score for PAC-SYM from baseline to Weeks 2 and 12 were similar for the three studies and all statistically significant improved for naldemedine compared to placebo. The treatment effects ranged from -0.25 to -0.35.
Changes in the overall score for PAC-QOL from baseline to Weeks 2 and 12 were similar for the three studies and all statistically significant improved for naldemedine compared to placebo. The treatment effects ranged from -0.26 to -0.40.
Study COMPOSE-4 (cancer):
For the PAC-SYM overall scores as well as for all domain scores, apart from the stool symptom score, there was no difference in change from baseline between naldemedine and placebo.
For the PAC-QOL overall scores as well as for all domain scores, apart from the dissatisfaction score, there was no difference in change from baseline between naldemedine and placebo.

Clarification questions Page 63 of 154
Please review the tables in the report in order to check the completeness and
correctness of the data provided.
Apologies for any typographical errors and omissions you have detected in the
tables and figures of the CS. We believe the company clarifications stage has
allowed us to address them.
A19. Section B 2.8 on page 48 refers to a network meta-analysis but does not
provide a reference. Please ensure that you provide the references as well as
papers for any publications cited in the CS.
The data presented in Table 17CS and Figure 16CS refers to an independent
network meta-analysis conducted by the University of Leeds, UK and Northwestern
University, Chicago, USA(32). Apologies for this omission from the CS.
Indirect comparison
A20. Priority question. As the indirect comparison uses pooled data in the
calculation please provide the pooled relative risks and odds ratios with 95%
CI for use in the analysis rather than the raw data.
As shown below in Table 14, the relative risks and odds ratios have been provided
for response rates in the LIR subgroups, calculated from the raw data.
Table 14: Week 12 Response rate raw data, relative risks and odds ratios in the LIR subgroups
Trial Treatment arm
Responders, n/N (%)
Naldemedine 0.2 mg vs naloxegol 25 mg
Relative risk (95% CI)
Odds ratio (95% CI)
COMPOSE-1/ COMPOSE-2 (pooled)
Naldemedine 0.2 mg
147/317 (46.4) 1.53 (1.25,1.89)
2.00 (1.44, 2.77)
Placebo 94/311 (30.2) KODIAC-04/ KODIAC-05 (pooled)
Naloxegol 25 mg
115/241 (47.7) 1.58 (1.25, 2.00)
2.12 (1.46, 3.08)
Placebo 72/239 (30.1) Abbreviations: CI: confidence interval; LIR: laxative-inadequate response

Clarification questions Page 64 of 154
A21. Why were sample sizes for KODIAC 4 and 5 estimated from the standard
error (SE) in technology appraisal 345 (TA345) and not based on sample sizes
reported by the study? Please also provide the estimation method.
The sample sizes of the clinical subgroups selected by the manufacturer of
naloxegol for reporting “Proportion of patients in ‘non-OIC(on treatment)’ at Week 4”
(Table 90 of manufacturers submission(33)) were not explicitly reported. Therefore,
for the purposes of indirect comparison with comparable subgroups selected from
the COMPOSE studies it was necessary to deduce sample size using the estimation
method described by .
A22. In figure 18 both plots have the same label – is one of them week 4 and
one week 12?
Please accept our apologies for this error. As shown below in Figure 6, the left- and
right-hand side forest plots should be labelled as risk ratio and odds ratio,
respectively. Both are the results of the ITC analysis of response rate in the LIR
population at Week 12.
Figure 6. Response Rate ITC Results at Week 12 (LIR Populations): Naloxegol 25 mg QD vs Naldemedine 0.2 mg QD (Figure 18 CS)
A23. The indirect comparison used the Bucher method and not a Bayesian
model so why are results presented as credible intervals? Is this an error?
The indirect comparison for the response rate at Week 4 (LIR population)
underpinning the Forest Plot depicted in Figure 17CS was conducted using a
Bayesian methodology(34). This analysis was conducted post hoc during the final
stages of the health economic evaluation after the originally specified Bucher-

Clarification questions Page 65 of 154
method indirect comparisons had been completed. The presentation of credible
intervals is therefore intentional. Apologies for this omission.
A24. Based on the subgroup analyses in figure 10, effect estimates favoured
placebo in patients on morphine and hydromorphone. Please discuss the
potential reasons for the observed effects.
This question appears to relate to Figure 11CS, itself sourced from Figure 8 of the
European Public Assessment Report for Rizmoic(8). The ‘observed effects’ referred
to are for subgroups of the pooled ITT populations from COMPOSE-1 and -2 defined
by opioid type. In either case the sample size of each subgroup (74/69 and 14/18 for
NAL/PBO taking either ‘Morphine’ or ‘Hydromorphone’ respectively) is substantially
lower the a priori minimum sample size needed to demonstrate the superiority
hypothesis for the primary efficacy endpoint in either study (N=270 per arm).
Therefore, Shionogi concludes there is no statistical inference that can be
reasonably drawn from either of these underpowered subgroups. As neither the
European Medicines Agency nor the US Federal Drug Administration(35) made
further reference to differences in response to naldemedine based on opioid
subtype, this conclusion would appear to be warranted.
Section B: Clarification on cost-effectiveness data
General
B1. Priority question. The Markov model defines the health state “OIC” as “<3
SBMs per week in at least three weeks per four-week cycle”. This is different to
the definition used in TA345 which was OIC: “<3 SBMs per week in at least two
of the weeks per four-week cycle”.
a. Please explain this change in definition.
b. Please confirm that the current definition of health states means that
patients with 2 weeks <3 SBMs and 2 weeks ≥3 SBMs in a 4-week cycle
cannot be classified as OIC or non-OIC.
c. Please provide an updated model in which all patients have been
classified as either OIC or non-OIC.

Clarification questions Page 66 of 154
We agree that the definitions, as currently stated in the CS, are not clear. The
following definitions applied to identify each health-state was as follows:
OIC - <3 SBMs per week in at least two of the weeks per four-week cycle
Non-OIC - ≥3 SBMs per week in at least three of the weeks per four-week cycle
We hope this resolves any confusion in wording, as agreed between all parties on
the clarification feedback call.
B2. Priority question. Please justify why for scenarios 1 and 2 the intervention
is defined as naldemedine without rescue bisacodyl. It appears highly unlikely
that in clinical practice patients will be told not to use rescue medication.
Shionogi agree that such clinical practice is unlikely. It should however be noted that
in treating OIC, the recent UEG consensus guideline does not make specific
reference to the use of concomitant rescue laxatives where PAMORAs are indicated.
We have sought to align the economic analysis to that produced for TA345 for
consistency.
B3. Priority question. Please provide an updated version of the model with an
appropriately defined intervention, i.e. naldemedine, without constraining it to
no rescue medication (with scenario 3 limited to the LIR population).
The model should include rescue medication as an event for both treatment
arms, informed by the rate of this event as an outcome in the COMPOSE trials.
Response should be based on a consistent outcome for all treatment arms.
Please provide separate results for SBM as the main outcome and CSBM as
the main outcome. All other relevant model transitions (time-to-event
estimation for transition A, the estimation of transition B and C) must also be
based on all patients (i.e. regardless of rescue bisacodyl) from the COMPOSE
trials.
See Appendix B
Shionogi are unable to produce model results based on CSBM as an outcome due to
the absence of any known corresponding health-state utility values. We would also
question the limited value of such results in the light of preference research among
OIC patients, in which ‘completeness’ of bowel movements did not feature as an
Clarification questions Page 67 of 154
aspect of constipation most participants would prefer to improve, but more than 70%
of respondents regarded increasing bowel frequency by one movement per week as
either ‘extremely’ or ‘very’ important(36).
B4. Priority question. Please explain why the company considers rescue
bisacodyl as a reasonable proxy for ‘any other laxative’ as a comparator for
both scenario 1 and 2. For scenario 1, naldemedine is positioned in the
CS (page 65) as an alternative to second-line laxative monotherapy, and in
scenario 2 as an alternative to combination-laxative therapy when combined
with existing laxative therapy. Have clinical experts verified this assumption?
If yes, please provide details.
The assumption is made in the absence of any evidence to the contrary(37,38).
Analysis of the CPRD database shows that ninety-one percent of opioid+laxative
users, received monotherapy first-line, of which macrogols (47%) and lactulose
(25%) predominated, followed by senna (15%), ispaghula (6.3%), and docusate
(3.4%). UK clinical experts attending an Advisory Board in September 2018
confirmed no clear consensus on choice of laxative agents.
B5. Two health states were defined according to SBM frequency (i.e. OIC and non-
OIC). Please explain why complete spontaneous bowel movement (CSBM) was not
incorporated in the model either to define more health states (e.g. refining the non-
OIC state) or to estimate utilities and/or costs. Please supply the CSBM data
separately and incorporate these into the model in terms of utilities and resource
use.
See B3 response.
B6. The company stated that an incremental analysis was not feasible as different
comparators are used for different populations. Please specify precisely the
populations (in terms of line of therapy and response to previous therapy) applicable
to each of the drugs in the final agreed scope. In particular, what might be the clinical
reason that patients would be eligible for oral laxative treatment, but not any of the
other comparators, e.g. naloxegol?
SCENARIO 1 (naldemedine as an alternative to laxative monotherapy in patients
switching from first line laxative)
Clarification questions Page 68 of 154
Rizmoic (naldemedine) is indicated for the treatment of opioid-induced constipation
(OIC) in adult patients who have previously been treated with a laxative. This
permits naldemedine to be used in all laxative refractory patients, regardless of the
reason for laxative switching which could include for tolerability or adherence
reasons. Naloxegol can only be used in patients who are laxative inadequate
responders (LIR). Shionogi contend that most clinicians would observe the EMA
guideline definition of LIR, which states that a subject “should have confirmed
insufficient response to laxative treatment with at least two drug substances
belonging to different classes used in the treatment of constipation by history taking”,
thereby omitting naloxegol as a credible comparator.
SCENARIO 2 (naldemedine plus laxative as an alternative to combination laxative
therapy in patients escalating treatment from first-line laxative)
Naldemedine may be used with or without laxative(s), whereas when naloxegol
therapy is initiated, it is recommended that all currently used maintenance laxative
therapy should be halted, until clinical effect of naloxegol is determined. This
effectively rules out naloxegol as a credible comparator for patients initiating adjunct
second-line therapy in combination with existing laxatives.
SCENARIO 3 (naldemedine as an alternative to naloxegol in laxative inadequate
responders to two laxatives of different classes)
See above for EMA definition of LIR. Naldemedine’s broad indication makes it
suitable for LIR patients, who constitute a subgroup of laxative refractory patients.
B7. Please clarify why bowel movement (BM) rather than SBM is used as “EP” in
Table 24.
This is consistent with the approach to economic analysis specified in TA345.
Transition probabilities
B8. Priority question. In Figures 25, 26, and 27 of the CS, parametric curves are
shown that are said to be extrapolations of the KM data that are shown in the

Clarification questions Page 69 of 154
same graphs. On page 70, it is said that goodness-of-fit was assessed by
visual inspection, diagnostic plots and the AIC / BIC.
a. Based on visual inspection the ERG considers the fit of these curves to
be rather poor. Please explain why these curves are seen as a
reasonable fit.
Please accept our apologies for the figures supplied originally in the CS. These have
now been corrected in Figure 7, Figure 8 and Figure 9. When considering scenario 1
after calculating the AIC and BIC scores it indicated that lognormal and gompertz
were considered the closest fit. Since the diagnostic plots provided no evidence that
there was a clear unique distribution to this data, the visual inspection was then seen
vital. As present in Figure 7, it is clear that gompertz is not a suitable distribution
whereas lognormal shows a reasonable fit to the clinical trial data.
Figure 7. Transition A parametric survival curves ‐ scenario 1
The AIC and BIC scores for scenario 2 indicated that lognormal was the most
suitable distribution for this data and the diagnostic plots did not indicated a superior
0%
10%
20%
30%
40%
50%
60%
70%
80%
90%
100%
0 100 200 300 400 500 600 700 800 900 1,000
PROBABILITY OF RETURNING TO OIC STA
TE FROM NON‐0IC (AT WEEK 4)
DAYS
Placebo KM
Naldemedine KM
Comparator Exponential
Comparator Weibull
Comparator Gompertz
Comparator Lognormal
Comparator Loglogistic
Treatment Exponent ial
Treatment Weibull
Treatment Gompertz
Treatment Loglogistic
Treatment Lognormal

Clarification questions Page 70 of 154
distribution. Although, since there are few data points in this scenario a visual
inspection was important to ensure the correct and most suitable distribution was
selected. As you can see in Figure 8 lognormal does not look visually sensible and
after inspection it was decided that the exponential distribution best described the
data.
Figure 8. Transition A parametric survival curves ‐ scenario 2
The AIC and BIC scores in scenario 3 showed that the lognormal distribution is
superior. Diagnostic plots did not show any significant results to indicate that a
specific distribution should be considered primarily. Finally, the visual inspection
(Figure 9) confirmed the AIC and BIC score results as lognormal was decided as the
most sensible distribution to fit the clinical trial data.
0%
10%
20%
30%
40%
50%
60%
70%
80%
90%
100%
0 100 200 300 400 500 600 700 800 900 1,000
PROBABILITY OF RETURNING TO OIC STA
TE FROM NON‐0IC (AT WEEK 4)
DAYS
Placebo KM
Naldemedine KM
Comparator Exponential
Comparator Weibull
Comparator Gompertz
Comparator Lognormal
Comparator Loglogistic
Treatment Exponent ial
Treatment Weibull
Treatment Gompertz
Treatment Loglogistic
Treatment Lognormal
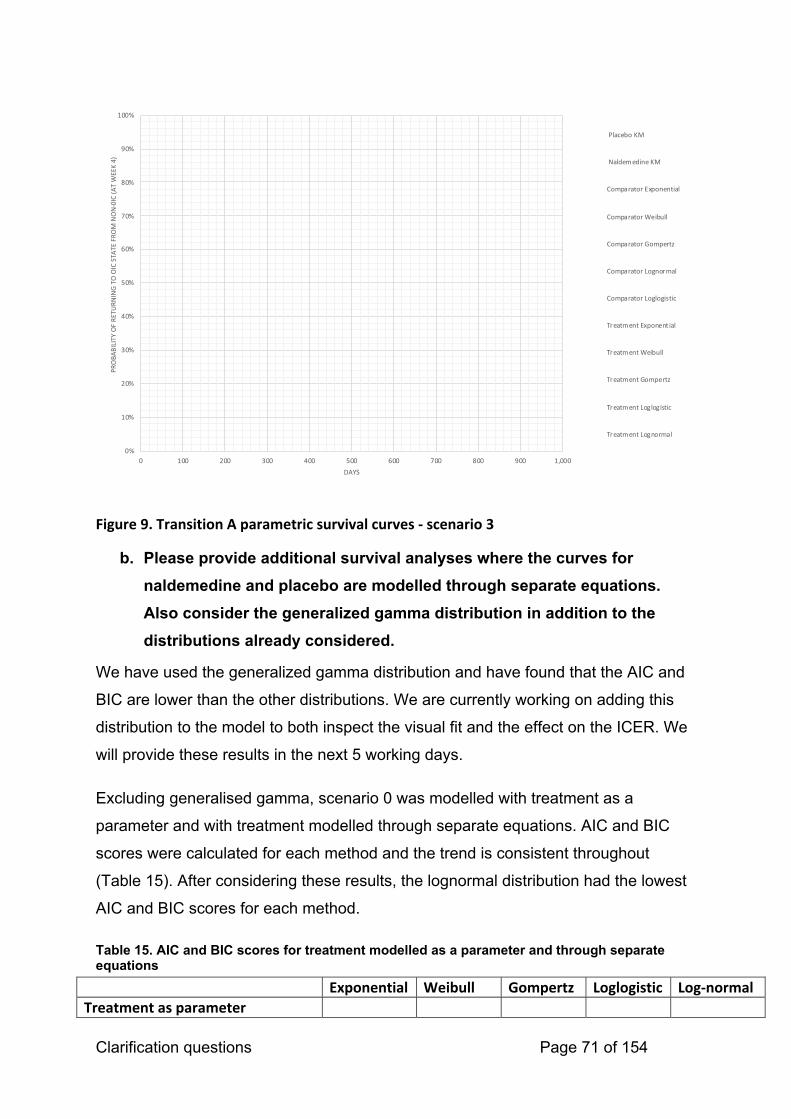
Clarification questions Page 71 of 154
Figure 9. Transition A parametric survival curves ‐ scenario 3
b. Please provide additional survival analyses where the curves for
naldemedine and placebo are modelled through separate equations.
Also consider the generalized gamma distribution in addition to the
distributions already considered.
We have used the generalized gamma distribution and have found that the AIC and
BIC are lower than the other distributions. We are currently working on adding this
distribution to the model to both inspect the visual fit and the effect on the ICER. We
will provide these results in the next 5 working days.
Excluding generalised gamma, scenario 0 was modelled with treatment as a
parameter and with treatment modelled through separate equations. AIC and BIC
scores were calculated for each method and the trend is consistent throughout
(Table 15). After considering these results, the lognormal distribution had the lowest
AIC and BIC scores for each method.
Table 15. AIC and BIC scores for treatment modelled as a parameter and through separate equations
Exponential Weibull Gompertz Loglogistic Log‐normal
Treatment as parameter
0%
10%
20%
30%
40%
50%
60%
70%
80%
90%
100%
0 100 200 300 400 500 600 700 800 900 1,000
PROBABILITY OF RETURNING TO OIC STA
TE FROM NON‐0IC (AT WEEK 4)
DAYS
Placebo KM
Naldemedine KM
Comparator Exponential
Comparator Weibull
Comparator Gompertz
Comparator Lognormal
Comparator Loglogistic
Treatment Exponent ial
Treatment Weibull
Treatment Gompertz
Treatment Loglogistic
Treatment Lognormal

Clarification questions Page 72 of 154
AIC 1568.949 1570.949 1565.325 1566.157 1550.864
BIC 1577.569 1583.879 1578.255 1579.087 1563.793
Naldemedine modelled separately
AIC 893.911 895.561 895.005 893.522 885.986
BIC 897.698 903.135 902.579 901.096 893.560
Placebo modelled separately
AIC 675.038 676.602 670.743 673.977 666.549
BIC 678.450 683.425 677.567 680.800 673.373
After consulting the diagnostic plots (Appendix D), the next plausible step to take
was visual inspection. As you can see in Figure 10, Figure 11 and Figure 12 the
visual aspect of each method is consistent. Therefore, we conclude that lognormal
would have been the chosen distribution irrelevant of how treatment was modelled.
Please see Appendix F for the generalized gamma distribution analysis.

Clarification questions Page 73 of 154
Figure 10. Transition A treatment modelled as a parameter ‐ scenario 0
Figure 11. Placebo modelled as a separate equation for transition A ‐ scenario 0
0%
10%
20%
30%
40%
50%
60%
70%
80%
90%
100%
0 100 200 300 400 500 600 700 800 900 1,000
SURVIVAL FU
NCTION
DAYS
Placebo KM
Naldemedine KM
Comparator Exponential
Comparator Weibull
Comparator Gompertz
Comparator Lognormal
Comparator Log‐logistic
Treatment Exponent ial
Treatment Weibull
Treatment Gompertz
Treatment Log ‐normal
Treatment Log ‐logistic

Clarification questions Page 74 of 154
Figure 12. Naldemedine modelled as a separate equation for transition A ‐ scenario 0
c. Please provide the log-cumulative hazard plots based on the individual
patient data (for each scenario, for each treatment arm).
Apologies for not supplying this material originally. All log-cumulative hazard plots for
scenario 1, 2 & 3 are presented below in Figure 13, Figure 14 and Figure 15,
respectively.

Clarification questions Page 75 of 154
Figure 13. Log‐cumulative hazard plot ‐ scenario 1
Figure 14. Log‐cumulative hazard plot ‐ scenario 2
−2.25
−2.00
−1.75
−1.50
−1.25
−1.00
2.0 2.5 3.0 3.5Log (time)
Lo
g (
−lo
g(S
(t))
)
Placebo
Naldemedine 0.2 mg
−2.5
−2.0
−1.5
−1.0
4.4 4.8 5.2 5.6Log (time)
Lo
g (
−lo
g(S
(t))
)
Placebo
Naldemedine 0.2 mg

Clarification questions Page 76 of 154
Figure 15. Log‐cumulative hazard plot ‐ scenario 3
d. Please explain why external validity was not included in the criteria for
curve selection. The Decision Support Unit (DSU) report on survival
analysis states that external data, clinical plausibility and expert
judgement should be used to assess the suitability and external validity
of the alternative models.
Shionogi are unaware of an external data source that would permit validation of ‘loss
of response’ of any treatment for OIC, though we would be happy to consider any
suggested by the ERG. We will endeavour to include expert judgement on the
survival analysis in the validation report to be supplied by 30NOV19.
B9. Priority question. On page 71 of the CS, it is stated that “treatment effect
was modelled as a parameter rather than through separate equations, in
accordance with best practice guidelines” with reference to NICE DSU
technical support document (TSD) 14. However, as mentioned in NICE DSU
TSD 14, “if the proportional hazards assumption does not seem appropriate it
−2.0
−1.8
−1.6
2.0 2.5 3.0 3.5Log (time)
Lo
g (
−lo
g(S
(t))
)
Naldemedine 0.2 mg

Clarification questions Page 77 of 154
is likely to be the most sensible to fit separate parametric models of the same
type, …”.
a. Please explain how the company has come to the conclusion that the
proportional hazards assumption seems appropriate for the data that
are presented in Figures 25, 26, and 27 of the CS.
As seen in the corrected figures, visually it shows that the proportional hazard
assumption has not been violated as the treatment and comparator curves do not
cross-over. Additionally, the Schoenfeld residual p-values were calculated and
showed no statistical significance for scenarios 1, 2 & 3 with values of 0.8887,
0.7839 and 0.8063, respectively.
b. Please also provide justification, using this new set of extrapolation
curves, for how the most appropriate curves were determined, based
on: 1) visual inspection of correspondence between observed and
predicted data, 2) diagnostic plots (provided as an appendix), 3) AIC /
BIC values, and 4) clinical plausibility of the extrapolations.
Since the proportional hazard assumptions were not violated please refer to Q8a,b
and c.
B10. Priority question. Please clarify how the time points that are shown for
the observed data in Figures 25, 26, and 27 of the CS correspond to the
different time points in the trial. For example, Figures 25 and 27 show data at
week 1, 2, 3, 4 and 5. As week 0 in the figure would correspond to week 4 in
COMPOSE-1 and -2, this means that the latest time point in the figures is from
week 9 in COMPOSE-1 and -2. Given that these RCTs had a follow-up of
12 weeks, the ERG would have expected the Kaplan‒Meier (KM) curves to
extend to week 8.
COMPOSE 1 & 2
As transition A requires subjects to be in a non-OIC state there is an initial 4-week
period to identify these cases, based on those who were having 3 or more SBMs in
at least 3 of the 4 weeks.

Clarification questions Page 78 of 154
After this period, each consecutive 4-weeks of assessment was analysed and if
patients were seen as becoming OIC within this period subjects were flagged at the
final week of the 4-week period.
Therefore, this allows subjects to transition from non-OIC to OIC at 5 time points
(week 5-8, week 6-9, week 7-10, week 8-11 and week 9-12) in the COMPOSE 1 & 2
trials.
The reason that we assessed these at 4-week periods was to align to the model
design. We appreciate that there will be subjects that will move between these
periods at early stages in the 4-week period, but these should be adjusted for by
using the half-cycle.
COMPOSE 3
At week 12 subjects were identified as non-OIC based on greater than or equal to 3
BMs. Then each week following this was a possible time-point to lose response and
transition to OIC.
B11. Please provide a detailed explanation of how the transition probabilities for
transitions B and C were derived from the trial data. For example, are B and C based
on only one period of 4 weeks in the RCTs or multiple periods? If the latter, how
were these combined to obtain the values reported in Table 26 of the CS?
Please explain this for each scenario, given the difference in follow-up of COMPOSE
1 and 2 versus COMPOSE 3. Additionally, referring back to question B3, please
provide an updated table based on all patients, regardless of bisacodyl use.
For COMPOSE 1 & 2, the population from the placebo arm that were analysed in
Transition B were based on those that were classified as OIC in the first 4-weeks. Of
these patients the rate for transition B was then calculated based on those who were
classified as non-OIC between weeks 5 to 8. Transition C was calculated with the
same time frames for the transition non-OIC to OIC.
For COMPOSE 3, the population from the placebo arm that were analysed in
transition B were based on those that were classified as OIC (less than 3 BMs) in the
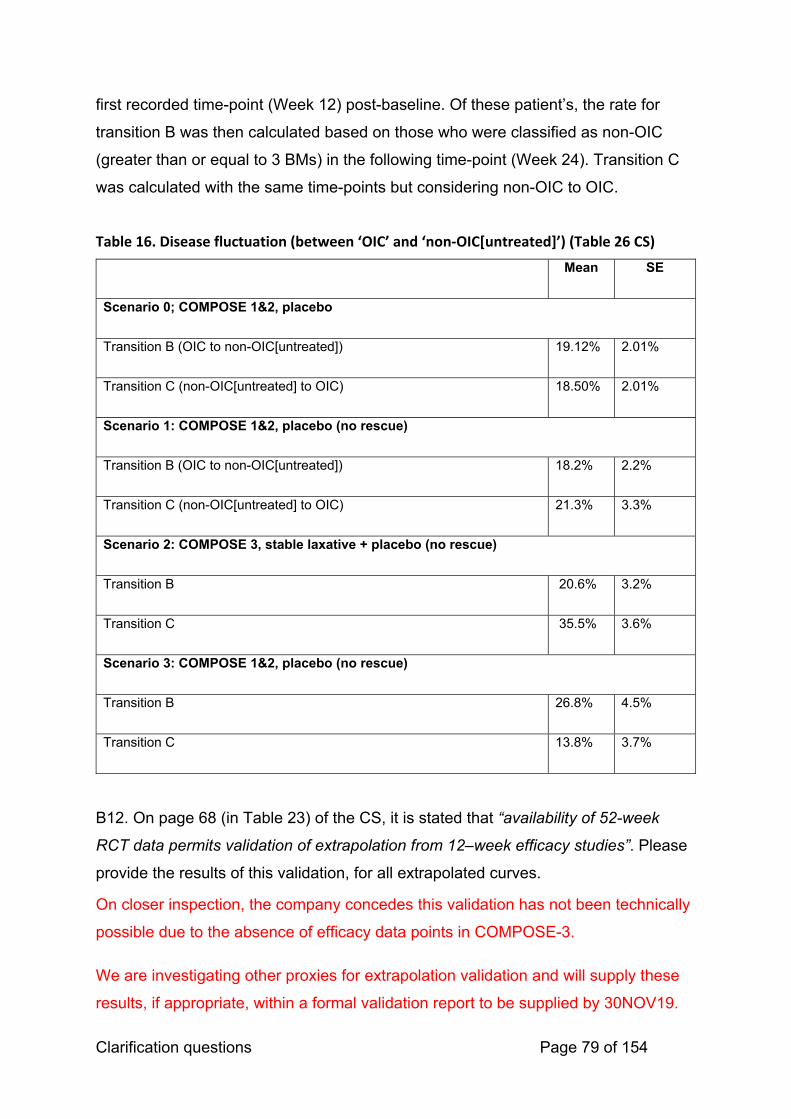
Clarification questions Page 79 of 154
first recorded time-point (Week 12) post-baseline. Of these patient’s, the rate for
transition B was then calculated based on those who were classified as non-OIC
(greater than or equal to 3 BMs) in the following time-point (Week 24). Transition C
was calculated with the same time-points but considering non-OIC to OIC.
Table 16. Disease fluctuation (between ‘OIC’ and ‘non‐OIC[untreated]’) (Table 26 CS)
Mean SE
Scenario 0; COMPOSE 1&2, placebo
Transition B (OIC to non-OIC[untreated]) 19.12% 2.01%
Transition C (non-OIC[untreated] to OIC) 18.50% 2.01%
Scenario 1: COMPOSE 1&2, placebo (no rescue)
Transition B (OIC to non-OIC[untreated]) 18.2% 2.2%
Transition C (non-OIC[untreated] to OIC) 21.3% 3.3%
Scenario 2: COMPOSE 3, stable laxative + placebo (no rescue)
Transition B 20.6% 3.2%
Transition C 35.5% 3.6%
Scenario 3: COMPOSE 1&2, placebo (no rescue)
Transition B 26.8% 4.5%
Transition C 13.8% 3.7%
B12. On page 68 (in Table 23) of the CS, it is stated that “availability of 52-week
RCT data permits validation of extrapolation from 12–week efficacy studies”. Please
provide the results of this validation, for all extrapolated curves.
On closer inspection, the company concedes this validation has not been technically
possible due to the absence of efficacy data points in COMPOSE-3.
We are investigating other proxies for extrapolation validation and will supply these
results, if appropriate, within a formal validation report to be supplied by 30NOV19.
Clarification questions Page 80 of 154
B13. On page 69 (in Table 24) of the CS, the proportions are provided of patients in
the ‘non-OIC (treatment) state’ for each scenario. However, the cells corresponding
to week 4 are empty for scenario 2, and the cells corresponding to week 12 are
empty for scenario 3. From this, we conclude that in scenario 2 the decision tree part
of the model actually covers 12 weeks and not 4 weeks. Please confirm if this
conclusion is correct. Otherwise please provide the appropriate data for these cells.
Since the data source for scenario 2 was COMPOSE-3 the earliest time-point for
analysis of BM was week 12. Carrying the resultant response rate forward to Week 4
was a conservative assumption given that subject to Transition A, the actual 4-week
response rate in COMPOSE-3 would be expected to be higher. With regards to the
empty cell at week 12 in scenario 3, this is due to the fact the indirect comparison
was considered only at week 4.
Utilities
B14. Priority question. In the base case, the company has used the EuroQol-
5 dimensions (EQ-5D) utility values from the naloxegol submission (TA345).
However, the naloxegol submission uses a time-dependent utility value for the
non-OIC (treated) health state, whereas the current submission uses a
constant utility value.
a. Please provide a justification for why the company deviated from the
naloxegol submission.
In TA345, the company submission for naloxegol tested the hypothesis that both
time and treatment effects would be observable from repeated measures of EQ-5D
utility observed during the KODIAC-04 and -05 pivotal trials i.e. not only would
responders to naloxegol exhibit incremental utility over responders to placebo but
also this effect would become more pronounced over time. A repeated measures
mixed effects (RMME) model was developed using pooled data from the pivotal
studies which included time, treatment, baseline utility, OIC status, and an interaction
between treatment and time as covariates (Table 103, AZ company submission(33)).
In the anticipated licensed population (laxative inadequate responders (LIR)), a
significant impact was identified between change in utility and a time-treatment
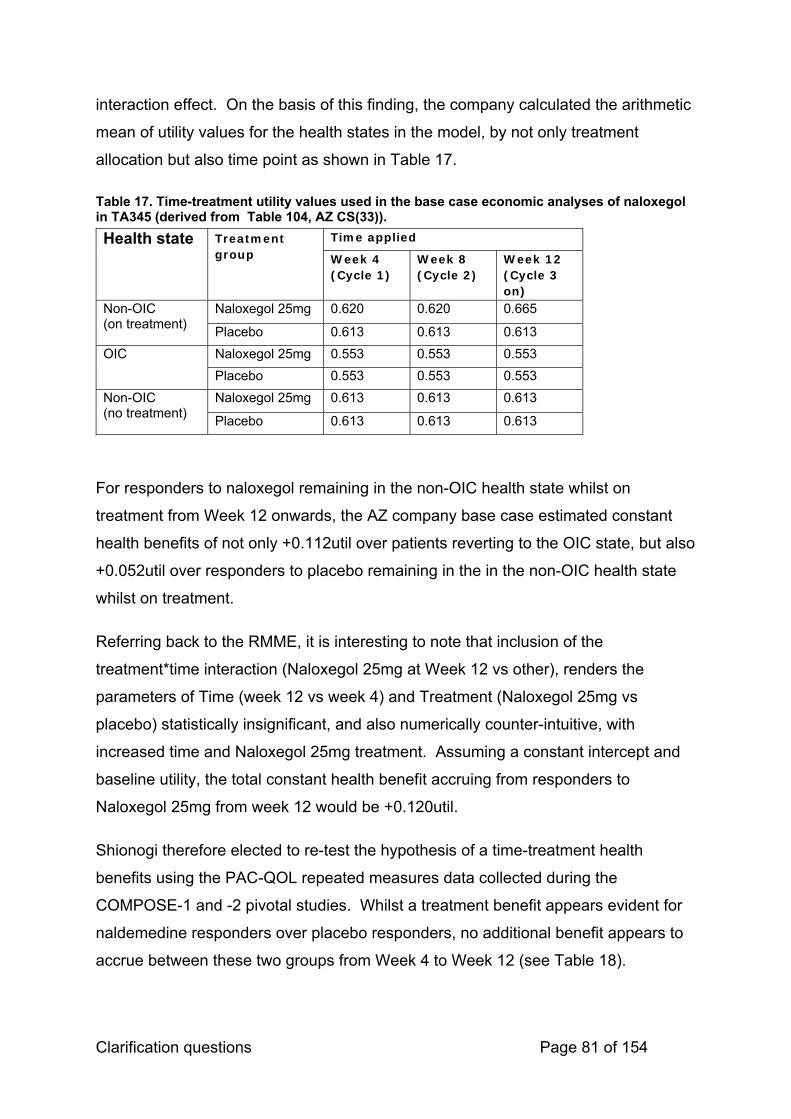
Clarification questions Page 81 of 154
interaction effect. On the basis of this finding, the company calculated the arithmetic
mean of utility values for the health states in the model, by not only treatment
allocation but also time point as shown in Table 17.
Table 17. Time-treatment utility values used in the base case economic analyses of naloxegol in TA345 (derived from Table 104, AZ CS(33)).
Health state Treatment group
Time applied
Week 4 (Cycle 1)
Week 8 (Cycle 2)
Week 12 (Cycle 3 on)
Non-OIC (on treatment)
Naloxegol 25mg 0.620 0.620 0.665
Placebo 0.613 0.613 0.613
OIC Naloxegol 25mg 0.553 0.553 0.553
Placebo 0.553 0.553 0.553
Non-OIC (no treatment)
Naloxegol 25mg 0.613 0.613 0.613
Placebo 0.613 0.613 0.613
For responders to naloxegol remaining in the non-OIC health state whilst on
treatment from Week 12 onwards, the AZ company base case estimated constant
health benefits of not only +0.112util over patients reverting to the OIC state, but also
+0.052util over responders to placebo remaining in the in the non-OIC health state
whilst on treatment.
Referring back to the RMME, it is interesting to note that inclusion of the
treatment*time interaction (Naloxegol 25mg at Week 12 vs other), renders the
parameters of Time (week 12 vs week 4) and Treatment (Naloxegol 25mg vs
placebo) statistically insignificant, and also numerically counter-intuitive, with
increased time and Naloxegol 25mg treatment. Assuming a constant intercept and
baseline utility, the total constant health benefit accruing from responders to
Naloxegol 25mg from week 12 would be +0.120util.
Shionogi therefore elected to re-test the hypothesis of a time-treatment health
benefits using the PAC-QOL repeated measures data collected during the
COMPOSE-1 and -2 pivotal studies. Whilst a treatment benefit appears evident for
naldemedine responders over placebo responders, no additional benefit appears to
accrue between these two groups from Week 4 to Week 12 (see Table 18).
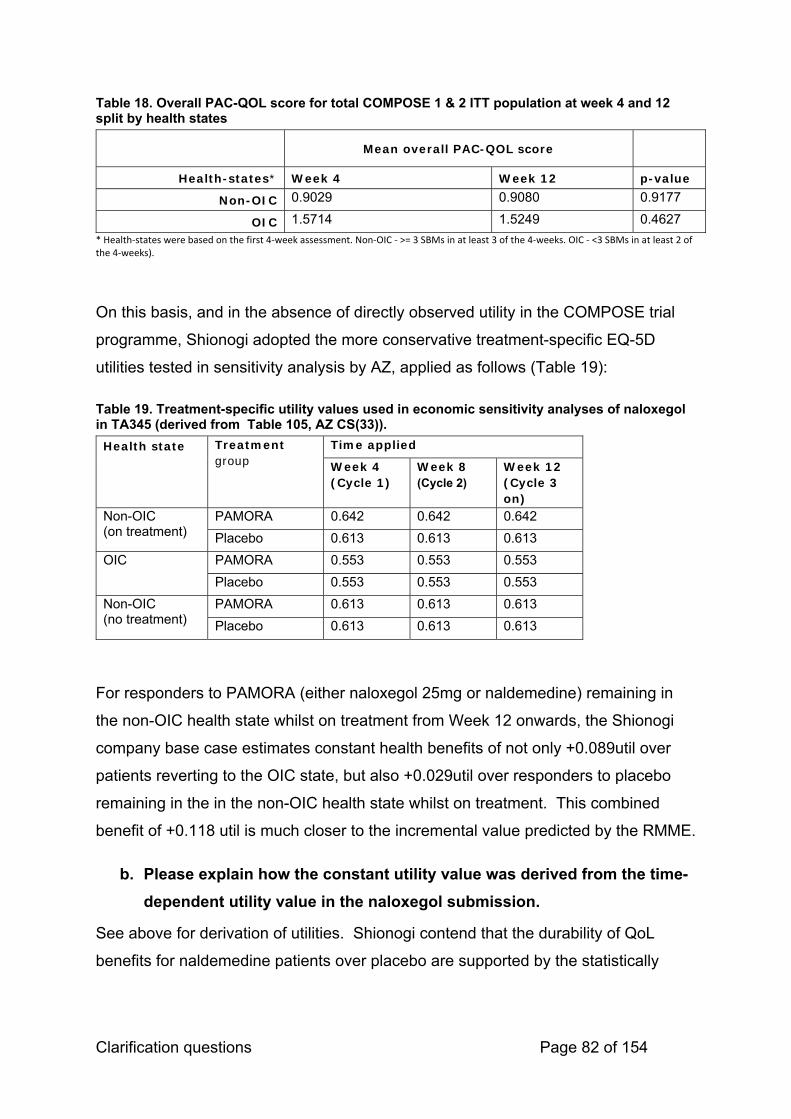
Clarification questions Page 82 of 154
Table 18. Overall PAC-QOL score for total COMPOSE 1 & 2 ITT population at week 4 and 12 split by health states
Mean overall PAC-QOL score
Health-states* Week 4 Week 12 p-value
Non-OIC 0.9029 0.9080 0.9177
OIC 1.5714 1.5249 0.4627
* Health‐states were based on the first 4‐week assessment. Non‐OIC ‐ >= 3 SBMs in at least 3 of the 4‐weeks. OIC ‐ <3 SBMs in at least 2 of the 4‐weeks).
On this basis, and in the absence of directly observed utility in the COMPOSE trial
programme, Shionogi adopted the more conservative treatment-specific EQ-5D
utilities tested in sensitivity analysis by AZ, applied as follows (Table 19):
Table 19. Treatment-specific utility values used in economic sensitivity analyses of naloxegol in TA345 (derived from Table 105, AZ CS(33)).
Health state Treatment group
Time applied
Week 4 (Cycle 1)
Week 8 (Cycle 2)
Week 12 (Cycle 3 on)
Non-OIC (on treatment)
PAMORA 0.642 0.642 0.642
Placebo 0.613 0.613 0.613
OIC PAMORA 0.553 0.553 0.553
Placebo 0.553 0.553 0.553
Non-OIC (no treatment)
PAMORA 0.613 0.613 0.613
Placebo 0.613 0.613 0.613
For responders to PAMORA (either naloxegol 25mg or naldemedine) remaining in
the non-OIC health state whilst on treatment from Week 12 onwards, the Shionogi
company base case estimates constant health benefits of not only +0.089util over
patients reverting to the OIC state, but also +0.029util over responders to placebo
remaining in the in the non-OIC health state whilst on treatment. This combined
benefit of +0.118 util is much closer to the incremental value predicted by the RMME.
b. Please explain how the constant utility value was derived from the time-
dependent utility value in the naloxegol submission.
See above for derivation of utilities. Shionogi contend that the durability of QoL
benefits for naldemedine patients over placebo are supported by the statistically

Clarification questions Page 83 of 154
significant difference in PAC-QOL scores at each quarterly measurement (P≤0.0001
at each time point) in the 52-week COMPOSE-3 trial(24).
B15. Priority question. In section B.3.4 on page 79, it is stated that the
plausibility of TA345 utilities for the current submission is substantiated by the
“near identical difference between naldemedine and placebo … and naloxegol
and placebo”.
a. The difference between naldemedine and placebo is provided in
Table 30 of the CS. Please include the difference between naloxegol and
placebo in this table.
Table 30CS has been updated as requested reporting data from page 267 of the AZ
company submission to TA345 and appears below as Table 20.
Table 20. Analysis of Week 12 non-OIC patients in COMPOSE-1 & -2 (pooled), KODIAC-04, and KODIAC-05 (Table 30CS)
Study Treatment Mean #SBMs
(sd)
Mean cfb
SBMs
(sd)
Tx group
diff' (cfb)
COMPOSE-1 & -2
pooled
Naldemedine 6.4 (3.2) 5.1 (3.2) p<0.001
Placebo 5.5 (2.4) 4.2 (2.5)
KODIAC-04 Naloxegol
25mg
6.1 (NR) 4.2 (NR) (NR)
Placebo 5.8 (NR) 3.4 (NR)
KODIAC-05 Naloxegol
25mg
6.0 (NR) 4.9 (NR) (NR)
Placebo 5.1 (NR) 3.7 (NR)
cfb, change from baseline; NR, not reported

Clarification questions Page 84 of 154
b. Quality of life might be affected by various factors. Not only the effect
size of treatment is therefore important, but all potential factors
impacting quality of life should be equal between naldemedine and
naloxegol, i.e. the naldemedine, naloxegol and both placebo populations
should have the same patient characteristics. Please provide evidence
for this.
Table 21. Baseline characteristics between COMPOSE-1 &-2 and KODIAC-04 & -05
COMPOSE 1 & 2 responders COMPOSE 1 & 2 Naloxegol 25 mg
Naldemedine Placebo Naldemedine Placebo KODIAC ‐ 4 KODIAC ‐ 5
Gender Male, n (%) 139 (41.99%) 92 (40.53%) 220 (40.59%) 92 (40.53%) 96 (44.9%) 85 (36.6%)
Female, n (%) 192 (58.01%) 135 (59.47%) 322 (59.41%) 135 (59.47%) 118 (55.1%) 147 (63.4%)
Age, mean (sd) 53.92 (10.44) 53.94 (11.95) 53.76 (10.43) 53.12 (11.21) 52.2 (10.3) 51.9 (12.1)
The main baseline characteristics presented between COMPOSE-1 & -2 responders
after 4-weeks, COMPOSE-1 & -2 ITT population and naloxegol in KODIAC-04 and -
05 are considered to be similar values (Table 21).
B16. In section B.3.4 on page 87, the company claims that naldemedine does not
have an effect on short form-36 (SF-36) because of the inability of SF-36 to capture
disease-specific impairment of quality of life (QoL). An alternative explanation is that
the SF-36 instrument is a capable instrument, but that the effect of naldemedine is
not large enough to result in any changes in QoL.
a. If the company believes that the SF-36 is not suited for this particular disease
then why did it choose to use this instrument in its clinical trials?
The COMPOSE studies were conceived prior to the subsequent assessment of the
suitability of SF 36 as a measure in this condition. At the time of conception,
Shionogi were guided by the then current literature to use this instrument in their
studies. It is important to note that the company did not initiate the regulatory
process for naldemedine until 3 years after Japan and the United States.

Clarification questions Page 85 of 154
b. Was the EuroQol-5 dimensions (EQ-5D) instrument, which has shown to be
responsive in naloxegol treatment, considered as an alternative?
At the time of conception of the COMPOSE studies it was judged that SF-36 was an
appropriate PRO. It was subsequently found to be not suited for OIC.
B17. The company claims that the Short Form – 6 dimensions (SF-6D) utility is
insensitive to health status. However, the results of the repeated measures mixed
model show a significant effect of health state (non-OIC vs OIC) on SF-6D utility.
a. Please provide a more elaborate argument as to why SF-6D utilities are
deemed insensitive to health status.
Thank you for the opportunity to elaborate on the relative insensitivity of SF-6D utility
to change in health status in OIC. Table 28CS shows the adjusted incremental utility
of non-OIC vs OIC to be +0.023util (95% CI: 0.011,0.035), as observed in the pooled
COMPOSE-1 and -2 dataset. Whilst this is a statistically significant parameter in a
post hoc RMME of determinants of SF-6D utility, it is empirically far lower than the
equivalent mean EQ-5D incremental utilities of 0.066util and 0.068util observed in
the naloxegol (Table 106, AZ CS, (33)) and lubiprostone (39) studies for similarly
defined health states (</>3SBMs per week).
The SF-6D suffers from a floor effect where for patient groups in severe health a
significant number of patients report the lowest level of health possible for some
dimensions, meaning the SF-6D cannot capture a deterioration in health for these
patients(40).
The observed discordance described above would appear to substantiate the claim.
b. Please include a scenario analysis in which SF-6D utilities are used.
Thank you for the opportunity to present scenario analysis in which SF-6D utilities
are used. As agreed, on the clarification feedback call, we will present the results of
these analyses by 31OCT19.
SF-6D has now been calculated for ITT COMPOSE 1 & 2 population where
available. Using the utilities mapped from SF-6D the ICERs vary between scenarios
(Table 22).

Clarification questions Page 86 of 154
Table 22. Deterministic results – health state utilities (mapped from SF-6D)
Technologies Total costs (£)
Total QALYs
Incremental costs (£)
Incremental QALYs
ICER pairwise
(£/QALY)
Scenario 0 £1,091.50 2.617 256.714098 0.00409304 £62,719.64
Scenario 1 £1,234.98 2.618 371.035453 0.01073544 £34,561.75
Scenario 2 £1,642.74 2.625 747.887061 0.02160212 £34,621.00
Scenario 3 £1,102.11 2.647 105.453068 0.00587292 £17,955.80
Scenario 4
£1,206.10 2.317 ‐3175.36439 0.00444956 Naldemedine Dominates
Scenario 5 £1,206.10 2.317 513.20176 0.01513486 £33,908.60
Abbreviations: ICER, incremental cost-effectiveness ratio; QALYs, quality-adjusted life years
The deterministic results of varying the time horizons from 1 year to 5 years using
utilities mapped from SF-6D are shown in Table 23. For all scenarios other than
scenario 4 the ICER exceeds the £30,000 threshold with at all time horizons.
Table 23. Deterministic results - time horizon – SF-6D
Time horizon 1-year 2-year 3-year 4-year 5-yearSCENARIO 0
Mapped from SF-6D £61,391 £63,592 £63,558 £63,252 £62,720
SCENARIO 1
Mapped from SF-6D £36,747 £36,429 £35,726 £35,155 £34,562
SCENARIO 2
Mapped from SF-6D £59,022 £47,214 £40,881 £37,160 £34,621
SCENARIO 3
Mapped from SF-6D £8,641 £13,541 £15,856 £17,217 £17,956
SCENARIO 4
Mapped from SF-6D
Naldemedine Dominates
Naldemedine Dominates
Naldemedine Dominates
Naldemedine Dominates
Naldemedine Dominates
SCENARIO 5
Mapped from SF-6D £34,247 £35,101 £34,874 £34,552 £33,909

Clarification questions Page 87 of 154
Probabilistic sensitivity analysis using the SF-6D utility values for scenario 0 results
in a cost effectiveness curve and cost-effectiveness plane that shows 0% probability
of cost-effectiveness at the £30,000 per QALY willingness to pay threshold (Figure
16, Figure 17).
Figure 16. Probabilistic sensitivity analysis ‐ Cost‐effectiveness Acceptability curve ‐ Scenario 0 (SF‐6D)
Figure 17. Probabilistic sensitivity analysis ‐ Cost effectiveness plane ‐ Scenario 0 (SF‐6D)
One-way sensitivity analysis was performed with SF-6D as the utility value for
scenario 0 and showed that the transition A in the treatment arm had the largest
impact on the ICER (Figure 18).

Clarification questions Page 88 of 154
Figure 18. One‐way sensitivity analysis – Tornado diagram ‐ Scenario 0 (SF‐6D)
B18. The mapping exercise was claimed not to be useful, because of the suggested
insensitivity of the SF-36 for changes in QoL in OIC. In contrast, the study did show
an effect on Patient Assessment of Constipation Quality of Life questionnaire (PAC-
QOL).
a. Why has the company not used a mapping algorithm of PAC-QOL to EQ-5D
to predict QOL, for instance the mapping algorithm described by Parker et al.
2011 (reference 116 in the CS)?
b. Please include this analysis as a scenario analysis.
Shionogi opted not to use the mapping algorithm described by Parker et al to predict
EQ-5D from PAC-QOL scores, on the empirical basis that the mapping was
undertaken using data derived from the clinical trials undertaken for prucalopride for
the treatment of severe chronic constipation, and therefore out with the current
decision problem.
Thank you for the opportunity to present scenario analysis in which EQ-5D utilities
mapped from PAC-QOL are used. As agreed on the clarification feedback call, we
will present the results of these analyses by 31OCT19.
Parker EQ-5D values has now been calculated for ITT COMPOSE 1 & 2 population
where available. Using the utilities from Parker the ICERs vary between scenarios
(Table 24).

Clarification questions Page 89 of 154
Table 24. Deterministic results – health state utilities (mapped from Parker equation)
Technologies Total costs (£)
Total QALYs
Incremental costs (£)
Incremental QALYs
ICER pairwise
(£/QALY)
Scenario 0 £1,091.50 3.907 256.714098 0.03321524 £7,728.81
Scenario 1 £1,234.98 3.927 371.035453 0.06845888 £5,419.83
Scenario 2 £1,642.74 3.976 747.887061 0.13094168 £5,711.60
Scenario 3 £1,102.11 4.011 105.453068 0.05598925 £1,883.45
Scenario 4
£1,206.10 3.511 ‐3175.36439 0.06202608 Naldemedine Dominates
Scenario 5 £1,206.10 3.511 513.20176 0.09358057 £5,484.06
Abbreviations: ICER, incremental cost-effectiveness ratio; QALYs, quality-adjusted life years
The deterministic results of varying the time horizons from 1 year to 5 years using
utilities mapped from the Parker equation are shown in Table 25. For all scenarios
other than the ICER does not exceed the £30,000 threshold with at all time horizons.
Table 25. Deterministic results - time horizon – mapped from Parker equation
Time horizon 1-year 2-year 3-year 4-year 5-yearSCENARIO 0
Mapped from Parker £7,686 £7,794 £7,790 £7,773 £7,729
SCENARIO 1
Mapped from Parker £5,623 £5,591 £5,531 £5,482 £5,420
SCENARIO 2
Mapped from Parker £7,465 £6,738 £6,266 £5,955 £5,712
SCENARIO 3
Mapped from Parker £882 £1,365 £1,620 £1,784 £1,883
SCENARIO 4
Mapped from Parker
Naldemedine Dominates
Naldemedine Dominates
Naldemedine Dominates
Naldemedine Dominates
Naldemedine Dominates
SCENARIO 5
Mapped from Parker £5,601 £5,643 £5,609 £5,572 £5,484

Clarification questions Page 90 of 154
Probabilistic sensitivity analysis using the Parker utility values for scenario 0 results
in a cost effectiveness curve and cost-effectiveness plane that shows 100%
probability of cost-effectiveness at the £20,000 per QALY willingness to pay
threshold (Figure 19, Figure 20)
Figure 19. Probabilistic sensitivity analysis ‐ Cost‐effectiveness Acceptability curve ‐ Scenario 0 (Parker)
Figure 20. Probabilistic sensitivity analysis ‐ Cost effectiveness plane ‐ Scenario 0 (Parker)
One-way sensitivity analysis was performed with Parker as the utility value for
scenario 0 and showed that the transition A in the treatment arm had the largest
impact on the ICER (Figure 21).

Clarification questions Page 91 of 154
Figure 21. One‐way sensitivity analysis – Tornado diagram ‐ Scenario 0 (Parker)
B19. In section B.3.4 on page 87 it is stated that “in the case of Scenarios 1 & 2,
treatment-specific utilities are deployed on the basis that naldemedine-treated
responders have a greater change from baseline than placebo-treated responders in
COMPOSE-1 & -2”.
a. What does the ‘greater change’ refer to? Does this refer to the number of
SBMs? Please provide precise quantification of what is meant by “greater
change”.
Please see Table 20 for clarification. The difference in SBM change from baseline
between naldemedine ‘responders’ (non-OIC at Week 12) and placebo ‘responders’
was statistically significant (p<0.001)
b. If ‘greater change’ refers the number of SBMs then why is the difference in
SBMs between treatment options not reflected in the model structure?
As discussed on the clarification feedback call, Shionogi’s intent in adopting an
identical model structure with similar inputs to that evaluated in TA345 was to enable
a reasonable comparison between the economic analyses for naloxegol and
naldemedine. We reflected on ERG and Committee conclusions on the economic
modelling presented in TA345 that: 1) increasing the number of health states to
better reflect heterogeneity in the non-OIC(on treatment) population “may not
Clarification questions Page 92 of 154
necessarily have changed the model results”; and 2) “although the company's model
had some limitations, overall it was acceptable for modelling treatment in this
population.”(41)
As a consequence, Shionogi was then committed to adopting certain common inputs
from TA345, notably EQ-5D health state utilities, which the COMPOSE study
programme had not specified as a patient reported outcome measure. At the time of
writing there is no known source of EQ-5D health state utilities based on varying
frequency of SBMs, further limiting the company’s ability to address this concern.
B20. Different health state utility sets are used in the scenario analyses. Please
provide the values used in the mapped SF-12 scenario analyses.
Apologies for this omission from the CS. The mean health state utilities calculated
from mapping SF-12 to EQ-5D are: for non-OIC, 0.515 (SE 0.0072), and for OIC,
0.460 (0.0086).
Costs
B21. In section B.3.5 on page 90 of the CS, it is stated that “Patients were assumed
to incur the non-laxative costs of constipation only in the OIC state”. This assumption
might not be realistic and might underestimate costs, particularly for the naldemedine
arm. Did clinical experts validate this assumption? If so, please provide a report
about the validation of this assumption.
Shionogi believe this assumption to be reasonable given that logically non-laxative
costs of constipation can only occur when the patient is constipated i.e. in the OIC
state. Furthermore, among all credible economic analyses in this domain, Shionogi
has sought to report those observed in routine clinical practice (from the CPRD
database), rather than opinion-based estimates from professional surveys. As
illustrated in the CS, this has led to somewhat lower per cycle OIC health state costs
than deployed in other analyses.
UK clinical experts validated this assumption at an Advisory Board held in
September 2018.
B22. In section B.3.5 on page 91 of the CS, it is stated that the company believes
that the base case costs in the model may be conservative. As the costs are only

Clarification questions Page 93 of 154
applied to OIC, incremental costs would therefore be underestimated, leading to an
underestimated ICER estimate. Please elaborate which cost components are
missing and include scenario analyses in which alternative health state costs,
derived from previous analyses, are used
This statement in the CS refers to the total cost of resource use. Previous economic
analysis found used total cost of resource use of £24 (42) and £35 (43) which is
lower than the £16.75 used in this economic analysis. When indexed to 2019 these
costs become £34.07 and £41.42 respectively. There is minimal impact on the
ICERs which reduce as the total cost of resource use increases.
Table 26. Varying resource use costs and the impact on ICERs
Original cost Indexed cost ICER
Basecase £16.75 £16.75 £8,444
Lawson 2017 £35 £41.42 £6,350
Dunlop 2012 £24 £34.07 £6,974
B23. In section B.3.5 on page 91 of the CS, it is stated that all Grade 3/4 adverse
events are assumed to result in a single GP visit. Did clinical experts validate this
assumption? If so, please provide a report about the validation of this assumption.
No. We aligned this assumption to the economic analysis in TA345 for consistency.
B24. Regarding section B.3.5 on page 90 of the CS: Please provide the duration of
inpatient care.
The duration of inpatient care was 3.09 (SD 5.4) days.
Results
B25. Priority question. In section B.3.8 (pages 98-100 of the CS), the cost-
effectiveness planes show only very limited uncertainty with regard to quality-
adjusted life years (QALYs) whilst the cost effectiveness (CE)-planes in the
Excel model show much larger uncertainty. Please explicitly state whether the
CE-planes in the submission or in the model are correct. If the CE-planes in

Clarification questions Page 94 of 154
the submission are correct, please explain the very limited uncertainty with
regard to effects and provide the corrected model.
Apologies these were previously incorrect. Please see corrected images below. The cost-effectiveness planes (Figure 23, Figure 25 & Figure 27) and cost-
effectiveness acceptability curves (CEAC) for each scenario (Figure 22, Figure 24,
and Figure 26) suggest that the ICER for naldemedine versus all comparators is below
the £20,000 threshold is robust in the face of parameter uncertainty. Naldemedine has
a >88% probability of being below the £20,000 willingness to pay threshold when
compared with either placebo+bisacodyl, placebo+stable laxative+rescue laxative, or
naloxegol 25mg in LIR patients.
Figure 22 : Probabilistic sensitivity analysis ‐ Cost‐effectiveness Acceptability curve ‐ Scenario 1 (base case)

Clarification questions Page 95 of 154
Figure 23: Probabilistic sensitivity analysis ‐ Cost effectiveness plane ‐ Scenario 1 (base case)
Figure 24: Probabilistic sensitivity analysis ‐ Cost‐effectiveness Acceptability curve ‐ Scenario 2 (base case)

Clarification questions Page 96 of 154
Figure 25: Probabilistic sensitivity analysis ‐ Cost effectiveness plane ‐ Scenario 2 (base case)
Figure 26:Probabilistic sensitivity analysis ‐ Cost‐effectiveness Acceptability curve ‐ Scenario 3 (base case)

Clarification questions Page 97 of 154
Figure 27: Probabilistic sensitivity analysis ‐ Cost effectiveness plane ‐ Scenario 3
B26. Priority question. On page 97 of the CS, the base case results are
presented. However, for scenario 3 these do not correspond to the results
from the model. Please make clear whether the model is incorrect, the values
in Table 38 of the CS are incorrect, or both are incorrect. Please provide the
correct cost-effectiveness results in both a corrected model and an erratum to
the CS.
Please see Appendix C with updated results for the entire submission. These have
changed very slightly due to the issues with the model raised below.
Validation
B27. Priority question: Please provide details about what validation efforts
were performed in Section B.3.10 of the CS and the results of these validation
efforts, for example (but not necessarily) with the help of the validation tool
AdViSHE (Assessment of de Validation Status of Health Economic decision
models, https://advishe.wordpress.com/author/advishe/). Appendix O
suggests that clinical experts were asked about some aspects of the cost-
effectiveness study, but it is not clear from the document what their responses
were. Also, it is not clear if experts validated the face validity of the results.
Please provide details of all clinical expert validation.

Clarification questions Page 98 of 154
Thank you for the invitation to provide details on validation efforts. A formal external
validation report based on the AdViSHE tool will be provided by 30NOV19.
Section C: Textual clarification and additional points
Missing data
C1. Please provide labels for all Tables and Figures that are currently unlabelled or
are missing legends, e.g. Figures 10 and 11 of the CS.
Apologies for this error, please see the figures and their corresponding descriptions
below (Figure 28 and Figure 29).

Clarification questions Page 99 of 154
Figure 28. Difference of Proportion of SBM Responders with its 95% Confidence Interval (Studies V9231 and V9232), ITT Population
Figure 29. Difference of Proportion of SBM Responders with its 95% Confidence Interval (Studies V9231 and V9232), ITT Population (continued)
C2. Please provide the clinical study reports (CSRs) and any missing data for
COMPOSE-6 and COMPOSE-7.
Supplied.
C3. Please provide a list of abbreviations used in the CS.
Please see Appendix E.

Clarification questions Page 100 of 154
Literature searching
C4. Priority question. Adverse events
a. In Appendix D.1, the CS states that the clinical evidence SLR searches
were also intended to identify relevant literature focussing on the safety
of interventions for OIC. Please confirm if these were the only searches
used to identify data on adverse events.
b. If other searches for adverse events were conducted, please provide full
details and search strategies.
As reported in the CS, studies reporting adverse events were eligible for inclusion in
the clinical SLR as per the eligibility criteria shown below in Table 27 and in the
supplied updated Appendix D. Further searches to capture additional safety
information about interventions for OIC were not performed.
Table 27: Eligibility criteria for the SLR
PICOS domain Inclusion criteria Exclusion criteria Population Adult subjects with OIC who have
cancer or chronic non-cancer pain and are receiving a regimen of opioids
Patients who have not been diagnosed with OIC and/or who are not receiving a regimen of opioids
Interventions Laxatives: Osmotic agents (including
magnesium, lactulose, polyethylene glycol (macrogols) and sorbitol liquid)
Stimulant laxatives (including bisacodyl and senna)
Emollient laxatives (including stool softeners such as docusate)
Lubricant laxatives (including mineral oil)
Opioid receptor antagonists including: Naloxone hydrochloride Naloxone oxycodone
PAMORAs including: Naldemedine Methylnaltrexone Naloxegol Alvimopan*
Other constipation treatments including:
Interventions that are not recommended for the
treatment of OIC:15
Bulk-forming laxatives including ispaghula husk, methylcellulose and sterculia (when administered alone, and not in combination with any of the interventions listed in the ‘inclusion criteria’ column)
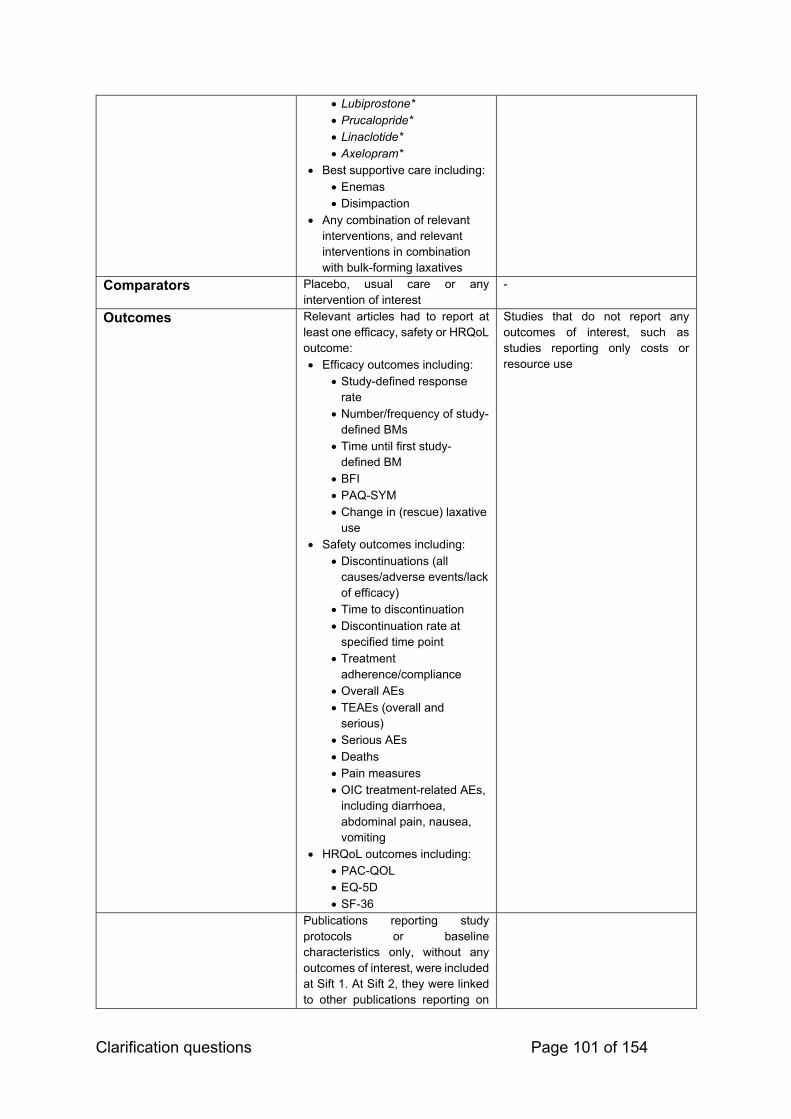
Clarification questions Page 101 of 154
Lubiprostone* Prucalopride* Linaclotide* Axelopram*
Best supportive care including: Enemas Disimpaction
Any combination of relevant interventions, and relevant interventions in combination with bulk-forming laxatives
Comparators Placebo, usual care or any intervention of interest
-
Outcomes Relevant articles had to report at least one efficacy, safety or HRQoL outcome: Efficacy outcomes including:
Study-defined response rate
Number/frequency of study-defined BMs
Time until first study-defined BM
BFI PAQ-SYM Change in (rescue) laxative
use Safety outcomes including:
Discontinuations (all causes/adverse events/lack of efficacy)
Time to discontinuation Discontinuation rate at
specified time point Treatment
adherence/compliance Overall AEs TEAEs (overall and
serious) Serious AEs Deaths Pain measures OIC treatment-related AEs,
including diarrhoea, abdominal pain, nausea, vomiting
HRQoL outcomes including: PAC-QOL EQ-5D SF-36
Studies that do not report any outcomes of interest, such as studies reporting only costs or resource use
Publications reporting study protocols or baseline characteristics only, without any outcomes of interest, were included at Sift 1. At Sift 2, they were linked to other publications reporting on

Clarification questions Page 102 of 154
the same study. If there was at least one publication reporting relevant outcomes (efficacy, safety or HRQoL) for the trial, the protocol or baseline characteristics were included as a secondary publication for the trial. However, if there were no publications with relevant outcomes, the protocol or baseline characteristics were excluded.
Study design RCTs Interventional non-RCTs†
Any other study design, including: Economic evaluations Observational studies Non-systematic or narrative
reviews Editorials, notes, comments or
letters Case reports/case studies
Relevant systematic reviews and (network) meta-analyses were eligible for inclusion at the abstract review stage, but excluded at the full-text review stage after hand-searching their reference lists
Other considerations Abstracts or full text in the English language
Human subjects
Non-English language abstracts or full-texts
Studies not on human subjects *These comparators were not relevant to the NICE scope so were removed at feasibility assessment stage in the original SLR and were excluded at all stages of the SLR update † Non-RCTs were excluded at all stages for the SLR update Abbreviations: HRQoL: Health-related quality of life; RCT: Randomised controlled trial.
C5. Priority question. Cost Effectiveness
a. Regarding Appendix G ‘Published cost-effectiveness studies’, the ERG
is currently unable to fully critique these searches due to the lack of hits
per line for each strategy or study flow diagram for the overall number
of studies retrieved. Please provide a flow diagram and full strategies
including hits per line as reported in Appendix D.
Please see the revised Appendix G. For completeness we have re-run all searches
upto 28th October. No new studies were identified. A PRISMA flow diagram and full
revised strategies including hits per line have been provided.

Clarification questions Page 103 of 154
b. In Appendix G a search is reported for Medline in-process and other
non-indexed citations (G.1). Please confirm if:
This search also covered the full Medline database as well as the
in-process element.
Yes, the revised searches used the full Medline database.
Whether Medline daily and epub ahead of print were also
included.
Yes, the revised searches did include Medline daily and epub ahead of print.
c. Please confirm which host interface was used for the Medline and
Embase cost effectiveness searches. The syntax described in line #1
generated an error message in relation to the use of: 'constipation'/exp
when the ERG attempted to rerun it in Ovid.
Apologies, the syntax has been updated accordingly and tested in Ovid.
d. Please provide full details of all grey literature searches for cost
effectiveness, including search terms used and numbers of hits per
resource.
See revised Appendix G.
e. The ERG noticed that the comparator naltrexone appears to have been
missed from the Medline strategy, please explain what impact this may
have had on the overall recall of results.
Apologies, this was a typographical error, now corrected.
f. Please note there appear to be some line combination errors in the final
line (#66) of the Embase strategy for cost effectiveness. It currently
reads: (#63 and #64 and #66), which misses 2 of the 3 interventions
facets listed in line #65 and doesn’t account for the Costs filter in line
#62. Please explain what impact this may have had on the overall recall
of results.
Apologies, this was a typographical error, now corrected.

Clarification questions Page 104 of 154
g. Please confirm that the NHS Economic Evaluation Database (EED)
search reported in G1.2 also includes the Health Technology
Assessment (HTA) database as listed in G.1?
Apologies, this was an omission, the HTA database was included in the Cochrane
electronic search.
Thank you for permitting additional time to update Appendix G. An updated version
will be provided by 31OCT19.
C6. Priority question. In Appendix D.1, the CS states that the clinical evidence
SLR searches were also intended to identify relevant literature on health-
related quality of life (HRQoL). Please confirm if these were the only searches
used to inform HRQoL. If other searches for HRQoL data were also conducted
please provide full details and search strategies.
As reported in the CS, studies reporting HRQoL outcomes were eligible for inclusion
in the clinical SLR as per the eligibility criteria shown above in Table 27 and in the
supplied updated Appendix D. Further searches to capture HRQoL were not
performed.
C7. Identification, selection and synthesis of clinical evidence
a. There appears to be some disparity regarding the date range for
conference searching reported for the clinical evidence SLR.
Appendix D1.2 reports searches being conducted from 2016-2018.
However, in Table 4 of the Appendix, where the full search strategies are
reported, the majority are recorded as 2016-2017. Please confirm that
Table 4 carries the correct date range and provide the date(s) these
resources were searched.
b. The ERG noted a line combination error in the Medline strategy that
resulted in the non-randomised controlled trials (RCTs) not being
included in the final facet in line 85. Please explain what impact this may
have had on the recall of results.
c. The included non-RCT facet (for example see Medline lines 73-78)
appears limited, terms for observational studies, case control and

Clarification questions Page 105 of 154
cohort studies etc. are not included. Please explain the rationale for this
and what effect it may have had on the overall recall of results.
Conference Searching
As reported in the CS, the manual conference searches had not been screened at
the time of the submission. The details of the conference searches can be found
below (original SLR: Table 28; SLR update: Table 29) and in the supplied Appendix
D, which reports the full findings from the SLR update. The manual conference
searches were conducted 14-17 July 2017 for the original SLR and 18-19 June 2019
for the SLR update.
Table 28: Search terms used for congress websites in the original SLR
Congress Link Search Strategy Hits Relevant Hits
AAPM Annual Meeting 2015, 2016 and 2017
http://www.painmed.org/annualmeeting/annual-meeting-archive/
From the provided link, for each of 2015, 2016 and 2017, the scientific abstracts were accessed. On each of the pages for each specific year, a web page search was run for the given search terms (OIC, opioid induced constipation, PAMORA, opioid antagonist, laxative). Any hits were noted. The 4 hits found were posters 132, 158, 200 and 244 from the 2017 annual meeting. Of these, posters 158 and 244 are duplicates of ID1112 and ID1615 respectively. Poster 132 is classed E1, as is poster 200. Links to these are: http://www.painmed.org/2017scientific-abstracts/psychosocial/#abstract132 and http://www.painmed.org/2017scientific-abstracts/epidemiology/#abstract200
4 0
APS Annual Scientific Meeting 2016 and 2017
http://americanpainsociety.org/annual-meeting/abstract-archive/abstract-database
From the provided link, each of the links for 2016 and 2017 were accessed. By using the built in 'search within this issue' function, the given search terms were individually entered and the total number of unique hits investigated by reading the abstract provided. Duplicates were poster numbers 479 (ID1620) and 480 (ID1622) from 2016 and 220 is a near duplicate from 2017, same study as in ID1613, ID1615 and ID1622.
20 0
IASP World Congress on Pain 2016
https://event.crowdcompass.com/wcp2016/search
The only IASP congress which has occurred since July 2015 was the 16th World Congress held in Japan, 2016. A search was run within this pdf for all 5 search terms with the following posters being a hit: PTH319, PTH294, PW0029, PW0030, PW0265, PW0305. Of these, PTH294 and PW0030 was classed as E1. PW0265 was classed as E2 as it was conducted for healthy volunteers. PTH319 and PW0305 (NCT02321397, similar to ID460) are to be included as they meet all
6 2

Clarification questions Page 106 of 154
eligibility criteria and are not duplicates.
ACG Annual Scientific Meeting 2016
https://www.eventscribe.com/2016/ACG/SearchPostersByKeyword.asp
The website provided gives a link to a keyword search within the abstracts from the 2016 ACG Meeting. Running a search of each search term individually yields a list of hits, however, the vast majority of which were non-relevant as 'OIC' returned many hits for cases where it occurred within a word. To double check the results, a web search (using ctrl+F) on the page: https://www.eventscribe.com/2016/ACG/aaSearchByPosterDaySession.asp was conducted for each of Sunday and Monday's posters. A total of 4 posters returned hits, being P119, P577, P886, P893 with only P119 and P577 being relevant, however these were a duplicate (and E1 as it is an SLR) and E1 respectively. A link to the 2015 conference could not be found
2 0
United European Gastroenterology (EUG) Week 2015 and 2016
2015: https://www.ueg.eu/education/library/#stq=%20&stp=1?abstract2015=true 2016: https://www.ueg.eu/education/library/#stq=%20&stp=1?abstract2016=true
The links to the web search function for the abstracts of each of the 2015 and 2016 EUG weeks are given here. The search terms were used in the keyword search for each of the two years, apostrophes were used, as for "OIC", to indicate a whole word search. From 2016 there was only 1 relevant abstract of interest; this was a recorded as a duplicate to ID637. Similarly from 2015 there was 1 relevant abstract which seems to be a duplicate to ID312.
2 0
Digestive Disease Week (DDW)
http://ddw.org/attendee-planning/online-planner https://ep70.eventpilot.us/web/page.php?page=Home&project=DDW16
The websites given direct to a web app which allows a search of DDW abstracts for each of 2017 and 2016 respectively. By searching for the given term we identify any relevant unique hits. From 2017 the relevant hits were: Su1522 (E1), Sa1131 (E1), Su1525 (E1), Mo1598 (E1), Tu1352 (E1). Additionally, from 2016 the relevant studies found were: 598 (near duplicate, almost identical to ID637), Su1585 (duplicate to ID946), Su1597 (near duplicate, identical to near duplicate from UEG 2015, therefore similar to ID312), Tu112 (E1), Su1596 (E1), Sa1053 (E1) and Su1020 (E2)
12 0
Table 29: Search terms used for congress websites in the SLR update
Congress Link Search Strategy Hits Relevant Hits
AAPM Annual Meeting 2018
http://www.painmed.org/annualmeeting/annual-meeting-archive/
From the link provided, the scientific abstracts were assessed. A web page search was run for the given search terms (OIC, opioid induced constipation, PAMORA, opioid antagonist, laxative). No hits were noted.
0 0

Clarification questions Page 107 of 154
APS Annual Scientific Meeting 2018 and 2019
2018: https://www.jpain.org/issue/S1526-5900(17)X0015-1 2019: https://www.jpain.org/issue/S1526-5900%2818%29X0002-9
From the provided link, each of the links for 2018 and 2019 were accessed. By using the built in 'search within this issue' function, the given search terms were individually entered, and the total number of unique hits investigated by reading the abstract provided.
5 0
ACG Annual Scientific Meeting 2017 and 2018
2017: https://www.eventscribe.com/2017/wcogacg2017/PosterTitles.asp?h=Browse%20by%20Title 2018: https://www.eventscribe.com//2018/ACG/searchGlobal.asp
The websites provided gives a link to a keywork search within the abstracts from the 2017 and 2018 ACG Meeting. Running a search of each search term individually yields a list of hits, however the vast majority of which were non-relevant as 'OIC' returned many hits for cases where it occurred within a word. To double check the results, a web search (using ctrl+F) on the abstract was conducted. 1 poster from 2018 ACG Meeting (P0339) was to be included as it met all eligibility criteria and is not a duplicate.
7 1
United European Gastroenterology (EUG) Week 2017 and 2018
2017: https://www.ueg.eu/education/library/#stq=%20&stp=1?abstract2017=true 2018: https://www.ueg.eu/education/library/#stq=%20&stp=1?abstract2018=true
The links to the web search function for the abstracts of each of the 2017 and 2018 EUG weeks are given here. The search terms were used in the keyword search for each of the two years, apostrophes were used, as for "OIC", to indicate a whole word search. The results were also filtered to the specific conference.
44 0
Digestive Disease Week (DDW) 2018
Gastroenterology: https://www.gastrojournal.org/issue/S0016-5085(18)X6001-6 GIE: https://www.giejournal.org/issue/S0016-5107(18)X0005-4
Abstracts were available through May 2018 Supplement issue of Gastroenterology and GIE. The same strategy was used for both. By using the built in 'search within this issue' function, the given search terms were individually entered and the total number of unique hits investigated by reading the abstract provided.
0 0
Non-RCT Searching
The non-RCT searches were included as exploratory in the original SLR. In line with
this, only RCTs were ultimately eligible for inclusion in the SLR update presented in
the submission. As such, the impact of the error in the Medline strategy (ERG point
C7b) and the limited terms used (ERG point C7c) is minimal as no non-RCTs were
included in the SLR.

Clarification questions Page 108 of 154
However, for completeness, we have explored the potential impact of the error in the
Medline search strategy on the results of the SLR in the following ways:
Re-running the Medline search with the correction, and then identifying any
original records. This yielded records.
De-duplicating these 37 records against the final library of records from
across all electronic databases searched in the original SLR and SLR update.
This yielded 16 records.
Screening these 16 new records against the eligibility criteria used in the SLR
update. This yielded 1 record – Brenner et al. (2019).(44)
Cross-checking the 1 eligible record against the studies included in the
original SLR and SLR update. The study reported by Brenner et al. (2019)
was captured in the World Health Organization International Clinical Trial
Registry Platform (WHO ICTRP) manual searches (NCT03060512).
These additional checks support the conclusion that the impact of the error in the
Medline strategy on the findings of the SLR was negligible.
With respect to the terms used in the non-RCT term group, these exploratory
searches were targeted at interventional, single-arm studies rather than being
designed to capture all non-RCT data, such as those from observational studies. As
such and given the exploratory nature of the non-RCT searches, a fully
comprehensive search strategy for non-RCTs was not employed.
C8. Section B3.5 of the CS reports that ‘Comparator costs and health state
resource use were derived from an analysis of anonymised patient-level
electronic health record data sourced from the Clinical Practice Research
Datalink (CPRD)’. Please confirm whether any additional searches were
conducted to inform this section and if so, provide full details.
No additional searches were performed as Shionogi reasoned that health resource
use derived from observational data of routine clinical practice provide the most
relevant and generalisable estimates in this regard, reducing uncertainty. The two
surveys conducted by AZ pursuant to the company submission for TA345 yielded
estimates of non-comparator health state costs with a 10-fold difference.

Clarification questions Page 109 of 154
Electronic model
C9. Priority question. The current version of the model contains a substantial
number of hidden rows and columns. Please unhide all hidden cells in the
model. Also please unhide any text that is hidden (e.g. cell A1 in the Survival
Curves sheets, which has been set to a white font to make it unnoticeable) in
an amended version of the model.
Apologies, this was done purely for aesthetic reasons. All cells are now visible. In the
new updated model, there are grouped cells to make the model clearer (these can
be viewed by clicking on the ‘+’ button).
C10. Figure 23 in section B.3.2 (page 66 of the CS) as well as Figure 1 in the model
refer to naloxegol as if it were the intervention. Should this be naldemedine instead?
Yes, please see below.
Figure 30. Decision‐tree schema for first model cycle (response assessment) (Figure 23 CS)
C11. Please provide descriptions (referring to the sheet and cell locations etc.) to
conduct the scenario analyses presented in section B.3.8 of the CS.
Apologies we appreciate that the last version of the model wasn’t as clear as it
should have been. The model has been updated to hopefully be clearer and the
instructions to run the probabilistic sensitivity analyses are below:
1. Ensure that all drop down options in the summary sheet are chosen for the chosen sensitivity analysis
2. Go to ‘PSA results’

Clarification questions Page 110 of 154
3. Choose the percentage difference you want to use for input variables without confidence intervals (default = 20%)
4. Choose number of simulations (default = 1000) 5. Click ‘Run PSA’
C12. Please provide a short description of all macros contained in the Excel model.
Will be supplied by 31OCT.
Table 30. Description of macros in Excel model Macro Description AppSettings Stores commonly edited Excel application/workbook settings
BookProtected Returns a value indicating whether the current workbook is protected
BookProtection Protects workbook
FindRange Finds range linked to a named area.
LockApp Prepares workbook for automation editing
NameExists Returns a boolean indicator to specify whether or not a named cell exists.
SaveSettings Obtain Current Important application settings and output in AppSettings variable obj [The AppSettings variable to save properties]
SheetProtection Apply / remove worksheet protection, with password protection
UnLockApp Reset application properties to a previously saved state
PSA Runs a given number of simulations for the model and prints them onto ‘PSA results’ worksheet
Tornado1 Runs one way sensitivity analysis for each variable (in order for data to be created for the tornado plot)
Mceac Produces the data for the CEAC.
C13. For the columns in model sheet ‘One Way SA Calcs’ no headers are provided,
which makes it difficult for the ERG to assess this sheet. Please provide the column
headers and (at least a minimal) explanation of what is intended with this sheet.
In the updated model all columns have headers. This sheet is used to calculate the data for the tornado diagram [found in the sheet
“OWSA sheet”]. A macro is used to print the ICER at lower and upper confidence
intervals of all variables included in the model. These values are ordered by the
biggest variance and sorted for inclusion in the tornado diagram.
C14. For all sheets in the model, please make sure that (at least a minimal)
explanation of what is intended is provided. This includes user-modifiable inputs and
unlabelled cells that are important for the proper functioning of the model.
Summary – Summary sheet including options for models, inputs and model results.

Clarification questions Page 111 of 154
OWSA Results – Sheet provides button to run one-way sensitivity analysis, options
for varying inputs and results of one-way sensitivity analysis (tornado diagram).
PSA Results – Sheet provides button to run probabilistic sensitivity analysis, options
for number of simulations and percentage to vary data with no uncertainty data
available, and results of probabilistic sensitivity analysis (Cost-effectiveness
Acceptability Curve and Cost-effectiveness Plane).
Transition A – Sheet provides the inputs for transition A (loss of effect) for each of
the scenarios. A number of different distributions for each scenario are held here
along with data for Kaplan-Meier curves.
Mortality – Sheet contains life tables for the general population (which is adjusted
for the cancer scenarios using a hazard ratio)
Scenario Input Data (previously “Default Data”) – This includes a summary of the
data inputs into the model for the selected scenario (from Summary sheet (cell E3)).
DataRaw – all data inputs for each scenario are stored here.
Input Summary – This sheet includes all input variables and is the sheet used to
calculate input OWSA/PSA/Basecase variables into the engine of the model.
One Way SA Calcs – This sheet calculates the variance introduced by each
variables and sorts the variables by the largest absolute difference of the ICER. This
sheet contains the data for the graph displayed in sheet ‘OWSA Results’.
PSA Calcs – This sheet contains the data used in the charts displayed in ‘PSA
results’. The data is calculated using a macro.
Markov Treatment (Previously ‘Markov Naldemedine’) – Is the sheet that runs the
simulation model. It predicts how many patients will be in each state for each cycle of
the model for those in the treatment group.
Markov Comparator (Previously ‘Markov Comparator’) – Is the sheet that runs
the simulation model. It predicts how many patients will be in each state for each
cycle of the model for those in the comparator group.

Clarification questions Page 112 of 154
Calculation – Outcomes – This sheet calculates the quality adjusted life years and
total life years for both the treatment and comparator groups for each cycle of the
model.
Calculation – Costs – This sheet calculates the costs incurred for both the
treatment and comparator groups for each cycle of the model.
Mechanics – This sheet included lookups for options on the front sheet. This is
purely used for formulas.
C15. Please make sure that it is clear in the model whether cells are actually used in
the model calculations or not (see e.g. in the ‘Default Data’ and ‘DataRaw’ sheets).
Also make sure that cells that are used are sufficiently labelled.
Default data has been updated to be named ‘Scenario Input Data’. The ‘DataRaw’
sheet includes all raw data for each of the scenarios. The scenario of choice is then
summarised in ‘Scenario Input Data’.
The model now includes a number of different cell types. These include the standard
excel cell styles. Please see below:
C16. In the model sheet ‘Calculation - Outcomes’, there appears to be an error in
cells J75 and O75, causing the cumulative life years gained to be calculated
incorrectly. Please correct this error in an amended version of the model.
Apologies, thank you for identifying this error. This has now been updated.
C17. In the economic model, the control sheet for adverse events (AEs) appears not
to work. When all adverse event rates are set to 100% in the naldemedine arm and
0% in the placebo arm, the incremental cost effectiveness ratio (ICER) remains
unaffected. Please comment on the functionality of this sheet and fix any errors.
We have removed the control sheet for adverse events. All adverse event inputs are
now included in ‘DataRaw’ and ‘Scenario Input Data’. We have validated that these
values feed into the model.
Clarification questions Page 113 of 154
C18. In the model, AE costs are only included for the first cycle. Because of half-
cycle correction, a relatively large proportion of patients are not at risk of AE events
in the model, since they enter the treated non-OIC state in the second model cycle.
Hence, AE costs are not incorporated for these patients. Please correct this error in
an amended version of the model.
The adverse event costs have been updated not to take the half cycle correction into
account. Please see all updated results in Appendix C.
114
References
1. NICE. Final appraisal determination-naloxegol for treating opioid-induced constipation. NICE; 2015.
2. Esmadi M, Ahmad D, Hewlett A. Efficacy of naldemedine for the treatment of opioid-induced constipation: a meta-analysis. J Gastrointest Liver Dis [Internet]. 2019 Mar 1;28(1):41–6. Available from: http://www.jgld.ro/wp/archive/y2019/n1/a9
3. Farmer AD, Drewes AM, Chiarioni G, De Giorgio R, O’Brien T, Morlion B, et al. Pathophysiology and management of opioid-induced constipation: European expert consensus statement. United Eur Gastroenterol J [Internet]. 2019 Feb 14 [cited 2019 Feb 15];7(1):7–20. Available from: http://journals.sagepub.com/doi/10.1177/2050640618818305
4. Hu K, Bridgeman MBM. Naldemedine (Symproic) for the Treatment Of Opioid-Induced Constipation. PT [Internet]. 2018 Oct;43(10):601–27. Available from: http://www.ncbi.nlm.nih.gov/pubmed/30271103
5. SmPC Naloxegol [Internet]. 2014. Available from: https://www.ema.europa.eu/en/documents/product-information/moventig-epar-product-information_en.pdf
6. Ruston T, Hunter K, Cummings G, Lazarescu A. Efficacy and side-effect profiles of lactulose, docusate sodium, and sennosides compared to PEG in opioid-induced constipation: a systematic review. Canadian oncology nursing journal = Revue canadienne de nursing oncologique. 2013.
7. Committee for Medicinal Products for Human Use (CHMP). Guideline on the evaluation of medicinal products for the treatment of chronic constipation (including opioid induced constipation) and for bowel cleansing (EMA/CHMP/336243/2013). 2015.
8. Committee for Medicinal Products for Human Use. European Public Assessment Report: Rizmoic (naldemedine) [Internet]. 2018. Available from: https://www.ema.europa.eu/en/documents/assessment-report/rizmoic-epar-public-assessment-report_en.pdf
9. 3Ts Formulary. Constipation guidance for adults 2018. 2018. 10. Hull and East Riding Prescribing Committee. Management of Constipation in Adults.
2019. 11. West Essex Clinical Commissioning Group, The Princess Alexandra Hospital.
Guideline for the management of Opioid Induced Constipation in Adults. 2017. 12. Webster L, Nagata T, Yamada T, Arjona Ferreira J. (479) A phase 2a, randomized,
double-blind, placebo-controlled, single ascending-dose study to evaluate the safety and efficacy of naldemedine in patients with chronic non-cancer pain and opioid-induced bowel dysfunction. J Pain. 2016 Apr;17(4):S94.
13. Shionogi Inc. Study to Evaluate the Safety and Efficacy of Naldemedine (S-297995) for the Treatment of Opioid-Induced Bowel Dysfunction in Subjects With Chronic Pain. ClinicalTrials.gov. 2010.
14. Webster LR, Yamada T, Ferreira JCA. A phase 2b, randomized, double-blind placebo-controlled study to evaluate the efficacy and safety of naldemedine for the treatment of opioid-induced constipation in patients with chronic noncancer pain. Pain Med (United States). 2017;18(12):2350–60.
15. Shionogi Inc. A Study of Naldemedine (S-297995) for the Treatment of Opioid-Induced Constipation in Adults With Non-Malignant Chronic Pain Receiving Opioid Therapy [Internet]. ClinicalTrials.gov. 2017 [cited 2019 Sep 3]. Available from:

115
https://clinicaltrials.gov/ct2/show/results/NCT01443403?term=V9221&rank=1 16. Michna E, Blonsky ER, Schulman S, Tzanis E, Manley A, Zhang H, et al.
Subcutaneous Methylnaltrexone for Treatment of Opioid-Induced Constipation in Patients With Chronic, Nonmalignant Pain: A Randomized Controlled Study. J Pain [Internet]. 2011 May;12(5):554–62. Available from: https://linkinghub.elsevier.com/retrieve/pii/S1526590010008333
17. Clemens KE, Quednau I, Klaschik E. Bowel function during pain therapy with oxycodone/naloxone prolonged-release tablets in patients with advanced cancer. Int J Clin Pract [Internet]. 2011 Apr;65(4):472–8. Available from: http://doi.wiley.com/10.1111/j.1742-1241.2011.02634.x
18. Katakami N, Oda K, Tauchi K, Nakata K, Shinozaki K, Yokota T, et al. Phase IIb, randomized, double-blind, placebo-controlled study of naldemedine for the treatment of opioid-induced constipation in patients with cancer. J Clin Oncol [Internet]. 2017;35(17):1921–8. Available from: http://www.embase.com/search/results?subaction=viewrecord&from=export&id=L617109630%0Ahttp://dx.doi.org/10.1200/JCO.2016.70.8453
19. Shionogi Inc. A Phase IIb, Randomized, Double-blind, Placebo-controlled, Parallel Group Study of S-297995 for the Treatment of Opioid-induced Constipation (OIC) in Cancer Patients [Internet]. JapicCTI. 2018 [cited 2019 Sep 3]. Available from: https://www.clinicaltrials.jp/cti-user/trial/ShowDirect.jsp?japicId=JapicCTI-111510
20. Irving G, Pénzes J, Ramjattan B, Cousins M, Rauck R, Spierings ELH, et al. A Randomized, Placebo-Controlled Phase 3 Trial (Study SB-767905/013) of Alvimopan for Opioid-Induced Bowel Dysfunction in Patients With Non-Cancer Pain. J Pain [Internet]. 2011 Feb;12(2):175–84. Available from: https://linkinghub.elsevier.com/retrieve/pii/S1526590010005997
21. Jansen J-P, Lorch D, Langan J, Lasko B, Hermanns K, Kleoudis CS, et al. A Randomized, Placebo-Controlled Phase 3 Trial (Study SB-767905/012) of Alvimopan for Opioid-Induced Bowel Dysfunction in Patients With Non-Cancer Pain. J Pain [Internet]. 2011 Feb;12(2):185–93. Available from: https://linkinghub.elsevier.com/retrieve/pii/S1526590010005985
22. Bull J, Wellman C V., Israel RJ, Barrett AC, Paterson C, Forbes WP. Fixed-Dose Subcutaneous Methylnaltrexone in Patients with Advanced Illness and Opioid-Induced Constipation: Results of a Randomized, Placebo-Controlled Study and Open-Label Extension. J Palliat Med. 2015;18(7):593–600.
23. Hale M, Wild J, Reddy J, Yamada T, Arjona Ferreira JC. Naldemedine versus placebo for opioid-induced constipation (COMPOSE-1 and COMPOSE-2): two multicentre, phase 3, double-blind, randomised, parallel-group trials. Lancet Gastroenterol Hepatol [Internet]. 2017 Aug;2(8):555–64. Available from: http://dx.doi.org/10.1016/S2468-1253(17)30105-X
24. Webster LR, Nalamachu S, Morlion B, Reddy J, Baba Y, Yamada T, et al. Long-term use of naldemedine in the treatment of opioid-induced constipation in patients with chronic noncancer pain. Pain [Internet]. 2018 May [cited 2019 Feb 15];159(5):987–94. Available from: http://dx.doi.org/10.1097/j.pain.0000000000001174
25. Katakami N. Randomized phase III and Extension Studies of Naldemedine in Patients with Opioid Induced Constipation and Cancer. J Clin Oncol. 2018;35:3859–66.
26. Shionogi Inc. Risk of Major Adverse Cardiovascular Events for Naldemedine and Other Medications for Opioid Induced Constipation in Adults With Chronic Non-Cancer Pain [Internet]. ClinicalTrials.gov. 2019. Available from: https://clinicaltrials.gov/ct2/show/NCT03720613
27. Shionogi Inc. Symproic Tablets 0.2mg drug use-results survey [Internet]. JapicCTI.
116
2019 [cited 2019 Sep 3]. Available from: https://www.clinicaltrials.jp/cti-user/trial/ShowDirect.jsp?japicId=JapicCTI-183988
28. Kessoku T. Superiority comparative test of conventional treatment vs naldemedine for prevention of opioid-induced constipation in cancer patients: Investigator initiated, single center, 2 arm, open label, randomized controlled trials [Internet]. UMIN-CTR. 2019 [cited 2019 Sep 3]. Available from: https://upload.umin.ac.jp/cgi-open-bin/ctr/ctr.cgi?function=brows&action=brows&recptno=R000036408&type=summary&language=E
29. Okuwaki K, Kida M. Multicenter Prospective Trial of Efficacy of Naldemedine for Opioid-Induced Constipation in Patients with Advanced Pancreatic Cancer [Internet]. UMIN-CTR. 2019 [cited 2019 Sep 3]. Available from: https://upload.umin.ac.jp/cgi-open-bin/ctr_e/ctr_view.cgi?recptno=R000034487
30. Okuwaki K, Kida M. Prospective Trial of Efficacy of Naldemedine for Opioid-Induced Constipation in Patients with Advanced Pancreatic Cancer: Quality of Life survey [Internet]. UMIN-CTR. 2019 [cited 2019 Sep 3]. Available from: https://upload.umin.ac.jp/cgi-open-bin/ctr_e/ctr_view.cgi?recptno=R000034499
31. Kanai T. Study on the effect of Naldemedine Tosilate by diet [Internet]. UMIN-CTR. 2019 [cited 2019 Sep 3]. Available from: https://upload.umin.ac.jp/cgi-open-bin/ctr_e/ctr_view.cgi?recptno=R000033597
32. Luthra P, Burr NE, Brenner DM, Ford AC. Efficacy of pharmacological therapies for the treatment of opioid-induced constipation: systematic review and network meta-analysis. Gut [Internet]. 2019 Mar [cited 2019 Apr 10];68(3):434–44. Available from: http://gut.bmj.com/
33. NICE. TA345: Final appraisal determination-naloxegol for treating opioid-induced constipation [Internet]. NICE; 2015 [cited 2019 Feb 12]. Available from: https://www.nice.org.uk/guidance/TA345
34. van Valkenhoef G, Bujkiewicz S, Efthimiou O, Reid D, Stroomberg C, de Keijser J. GeMTC Manual. 2019.
35. Center for Drug Evaluation and Research. FDA Clinical Review: Symproic (naldemedine) [Internet]. 2016. Available from: https://www.accessdata.fda.gov/drugsatfda_docs/nda/2017/208854Orig1s000MedR.pdf
36. Epstein RS, Cimen A, Benenson H, Aubert RE, Khalid M, Sostek MB, et al. Patient Preferences for Change in Symptoms Associated with Opioid-Induced Constipation. Adv Ther [Internet]. 2014 Dec 21 [cited 2019 Feb 19];31(12):1263–71. Available from: www.advancesintherapy.com
37. Candy B, Jones L, Larkin PJ, Vickerstaff V, Tookman A, Stone P. Laxatives for the management of constipation in people receiving palliative care. Cochrane Database Syst Rev [Internet]. 2015;(5):CD003448. Available from: http://doi.wiley.com/10.1002/14651858.CD003448.pub4
38. Hanson B, Siddique SM, Scarlett Y, Sultan S. American Gastroenterological Association Institute Technical Review on the Medical Management of Opioid-Induced Constipation. Gastroenterology [Internet]. 2019;156(1):229-253.e5. Available from: https://doi.org/10.1053/j.gastro.2018.08.018
39. Hatswell AJ, Vegter S. Measuring quality of life in opioid-induced constipation: mapping EQ-5D-3 L and PAC-QOL. Health Econ Rev [Internet]. 2016 Dec 21 [cited 2019 Feb 13];6(1):14. Available from: https://www.ncbi.nlm.nih.gov/pmc/articles/PMC4839018/pdf/13561_2016_Article_91.pdf
40. Ferreira LN, Ferreira PL, Pereira LN, Rowen D. Reducing the Floor Effect in the SF-
117
6D: A Feasibility Study. Appl Res Qual Life. 2012 Jun;7(2):193–208. 41. NICE. TA345: Naloxegol for treating opioid-induced constipation [Internet]. Available
from: https://www.nice.org.uk/guidance/ta345 42. Dunlop W, Uhl R, Khan I, Taylor A, Barton G, Dunlop W, et al. Quality of life
benefits and cost impact of prolonged release oxycodone/naloxone versus prolonged release oxycodone in patients with moderate-to-severe non-malignant pain and opioid-induced constipation: a UK cost-utility analysis. J Med Econ [Internet]. 2012 Jan 23;15(3):564–75. Available from: http://www.tandfonline.com/doi/full/10.3111/13696998.2012.665279
43. Lawson R, Ryan J, King F, Goh JW, Tichy E, Marsh K. Cost Effectiveness of Naloxegol for Opioid-Induced Constipation in the UK. Pharmacoeconomics [Internet]. 2017 Feb 23;35(2):225–35. Available from: http://link.springer.com/10.1007/s40273-016-0454-4
44. Brenner DM, Hu Y, Datto C, Creanga D, Camilleri M. A Randomized, Multicenter, Prospective, Crossover, Open-Label Study of Factors Associated With Patient Preferences for Naloxegol or PEG 3350 for Opioid-Induced Constipation. Am J Gastroenterol. 2019;
45. Latimer N. NICE DSU TECHNICAL SUPPORT DOCUMENT 14: SURVIVAL ANALYSIS FOR ECONOMIC EVALUATIONS ALONGSIDE CLINICAL TRIALS-EXTRAPOLATION WITH PATIENT-LEVEL DATA REPORT BY THE DECISION SUPPORT UNIT [Internet]. 2011 [cited 2019 Feb 21]. Available from: www.nicedsu.org.uk
46. National Institute for Health and Care Excellence. METHYLNALTREXONE BROMIDE [Internet]. 2019. Available from: https://bnf.nice.org.uk/medicinal-forms/methylnaltrexone-bromide.html%0A
47. Office for National Statistics. GDP deflators at market prices and money GDP [Internet]. 2019. Available from: https://www.gov.uk/government/collections/gdp-deflators-at-market-prices-and-money-gdp
48. Scottish Medicines Consortium. oxycodone / naloxone (Targinact). 2009. 49. Dunlop W, Neufeld K. Quality of Life Benefits and Cost Impact of Prolonged Release
Oxycodone/Naloxone Versus Prolonged Release Oxycodone in Patients with Moderate to Severe Pain and Opioid-Induced Constipation Despite the Use of 2 Laxatives: A UK Cost Utility Analysis. Value Heal [Internet]. 2013 Nov 1 [cited 2019 Feb 12];16(7):A384. Available from: https://linkinghub.elsevier.com/retrieve/pii/S1098301513022626
50. Earnshaw SR, Klok RM, Iyer S, McDade C. Methylnaltrexone bromide for the treatment of opioid-induced constipation in patients with advanced illness - A cost-effectiveness analysis. Aliment Pharmacol Ther. 2010 Jan;31(8):911–21.
51. Oken MM, Creech RH, Tormey DC, Horton J, Davis TE, McFadden ET, et al. Toxicity and response criteria of the Eastern Cooperative Oncology Group. Am J Clin Oncol [Internet]. 1982 Dec;5(6):649–55. Available from: http://www.ncbi.nlm.nih.gov/pubmed/7165009
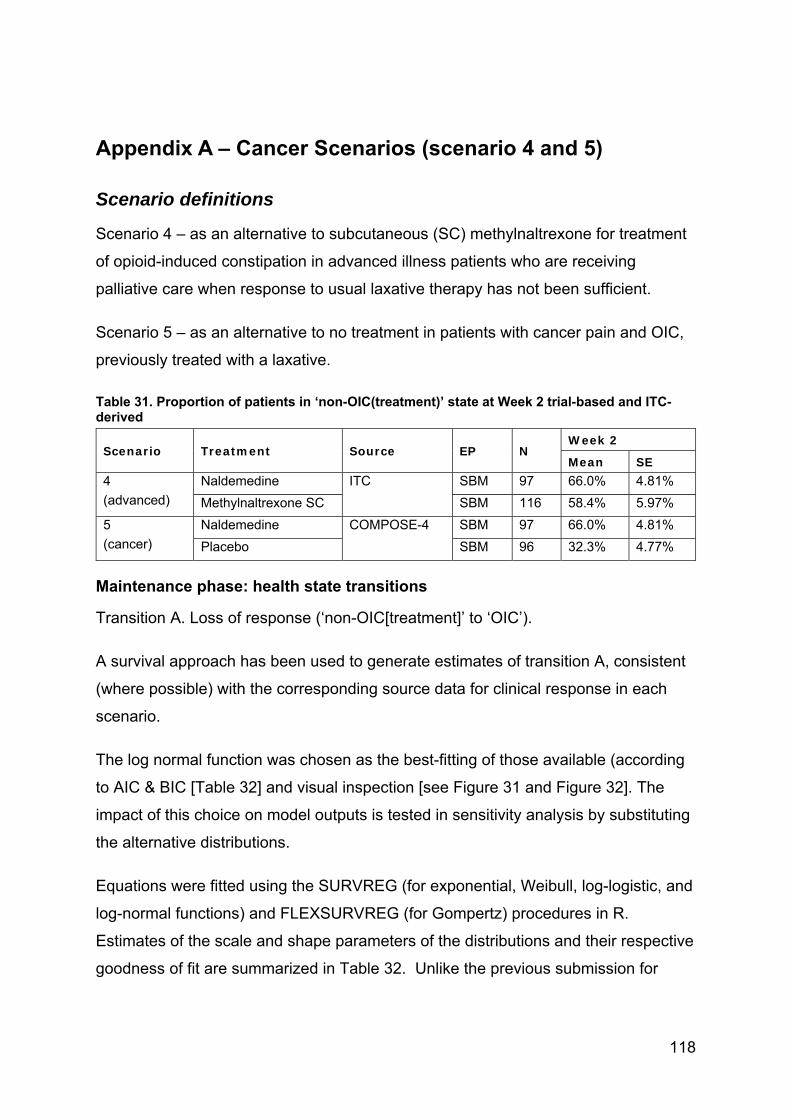
118
Appendix A – Cancer Scenarios (scenario 4 and 5)
Scenario definitions
Scenario 4 – as an alternative to subcutaneous (SC) methylnaltrexone for treatment
of opioid-induced constipation in advanced illness patients who are receiving
palliative care when response to usual laxative therapy has not been sufficient.
Scenario 5 – as an alternative to no treatment in patients with cancer pain and OIC,
previously treated with a laxative.
Table 31. Proportion of patients in ‘non-OIC(treatment)’ state at Week 2 trial-based and ITC-derived
Scenario Treatment Source EP N Week 2
Mean SE 4
(advanced)
Naldemedine ITC SBM 97 66.0% 4.81%
Methylnaltrexone SC SBM 116 58.4% 5.97%
5
(cancer)
Naldemedine COMPOSE-4 SBM 97 66.0% 4.81%
Placebo SBM 96 32.3% 4.77%
Maintenance phase: health state transitions
Transition A. Loss of response (‘non-OIC[treatment]’ to ‘OIC’).
A survival approach has been used to generate estimates of transition A, consistent
(where possible) with the corresponding source data for clinical response in each
scenario.
The log normal function was chosen as the best-fitting of those available (according
to AIC & BIC [Table 32] and visual inspection [see Figure 31 and Figure 32]. The
impact of this choice on model outputs is tested in sensitivity analysis by substituting
the alternative distributions.
Equations were fitted using the SURVREG (for exponential, Weibull, log-logistic, and
log-normal functions) and FLEXSURVREG (for Gompertz) procedures in R.
Estimates of the scale and shape parameters of the distributions and their respective
goodness of fit are summarized in Table 32. Unlike the previous submission for
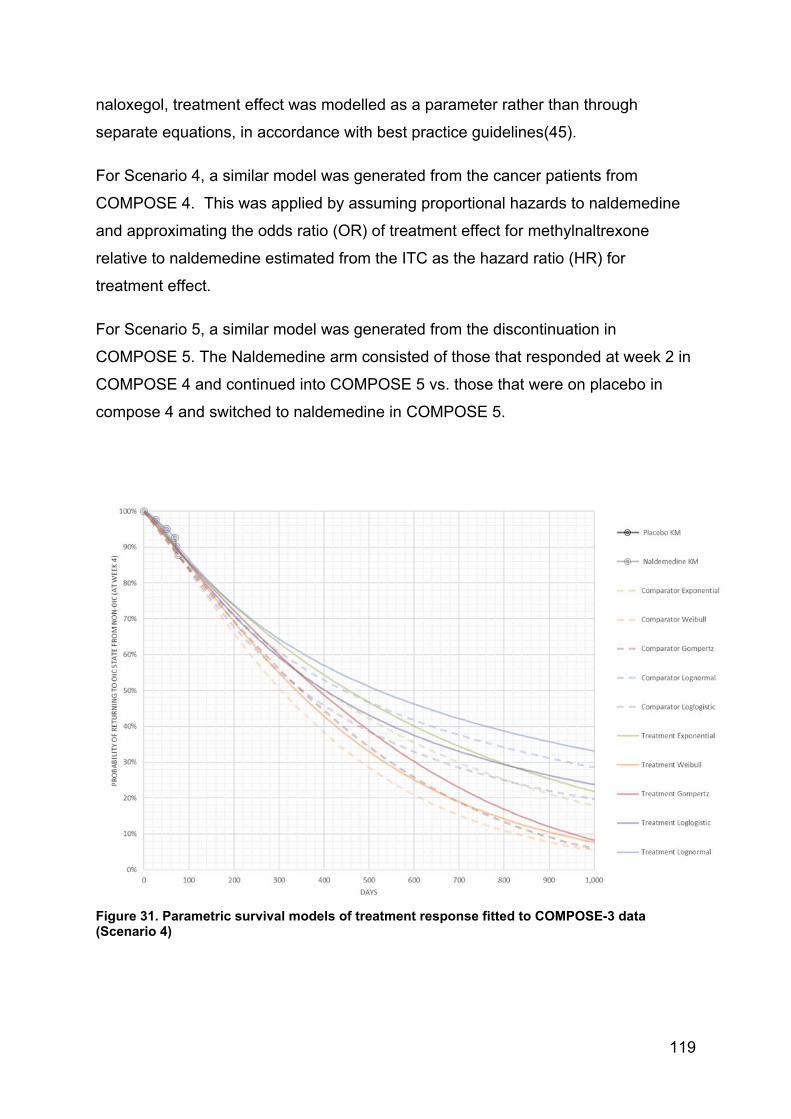
119
naloxegol, treatment effect was modelled as a parameter rather than through
separate equations, in accordance with best practice guidelines(45).
For Scenario 4, a similar model was generated from the cancer patients from
COMPOSE 4. This was applied by assuming proportional hazards to naldemedine
and approximating the odds ratio (OR) of treatment effect for methylnaltrexone
relative to naldemedine estimated from the ITC as the hazard ratio (HR) for
treatment effect.
For Scenario 5, a similar model was generated from the discontinuation in
COMPOSE 5. The Naldemedine arm consisted of those that responded at week 2 in
COMPOSE 4 and continued into COMPOSE 5 vs. those that were on placebo in
compose 4 and switched to naldemedine in COMPOSE 5.
Figure 31. Parametric survival models of treatment response fitted to COMPOSE-3 data (Scenario 4)
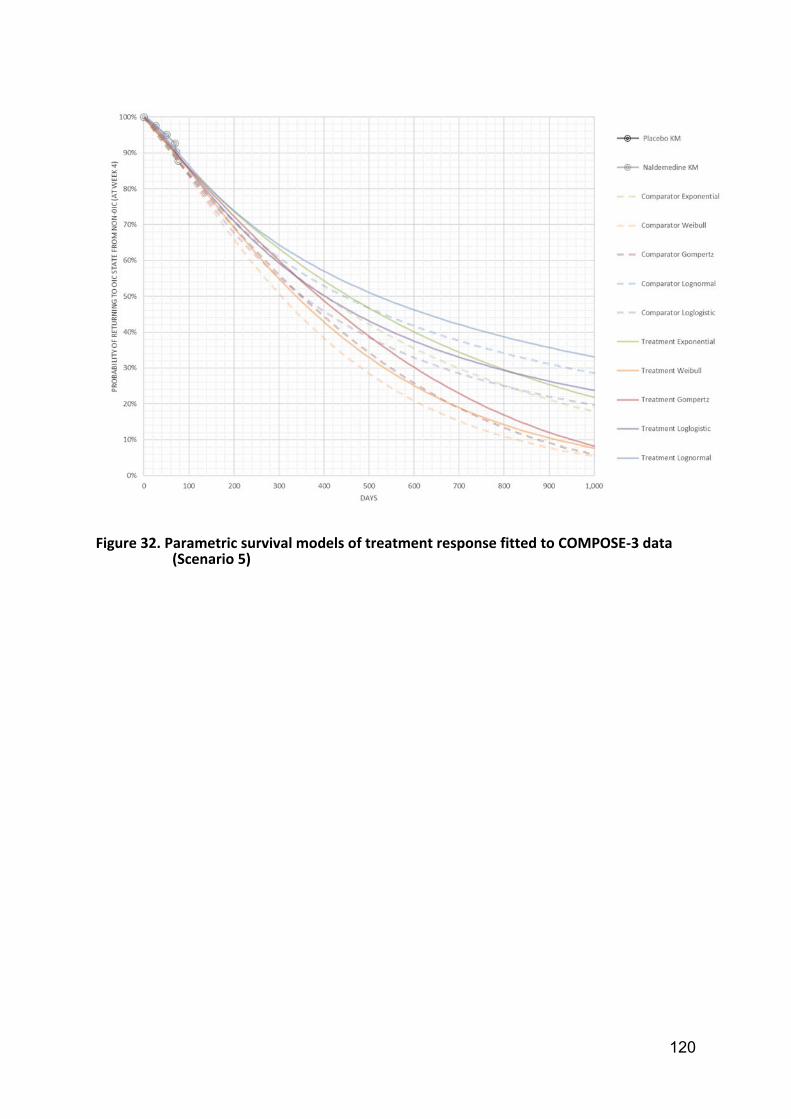
120
Figure 32. Parametric survival models of treatment response fitted to COMPOSE‐3 data (Scenario 5)

121
Table 32. Functions used to estimate transition A (Week 4 onwards) Function Exponential Weibull Log-logistic Log-normal Gompertz
Scenario 4: COMPOSE 5 discontinuation
Intercept 5.9063 5.6440 5.4583 5.6024 5.9465
Treatment 0.5810 0.4851 0.5401 0.6535 0.5813
Scale 0.8287 0.7813 1.4921
Shape 1.2068
AIC 272.25 273.58 272.99 271.04 274.24
BIC 277.65 281.68 281.10 279.14 282.34
Scenario 5: COMPOSE 5 discontinuation
Intercept 5.9063 5.6440 5.4583 5.6024 5.9465
Treatment 0.5810 0.4851 0.5401 0.6535 0.5813
Scale 0.8287 0.7813 1.4921
Shape 1.2068
AIC 272.25 273.58 272.99 271.04 274.24
BIC 277.65 281.68 281.10 279.14 282.34
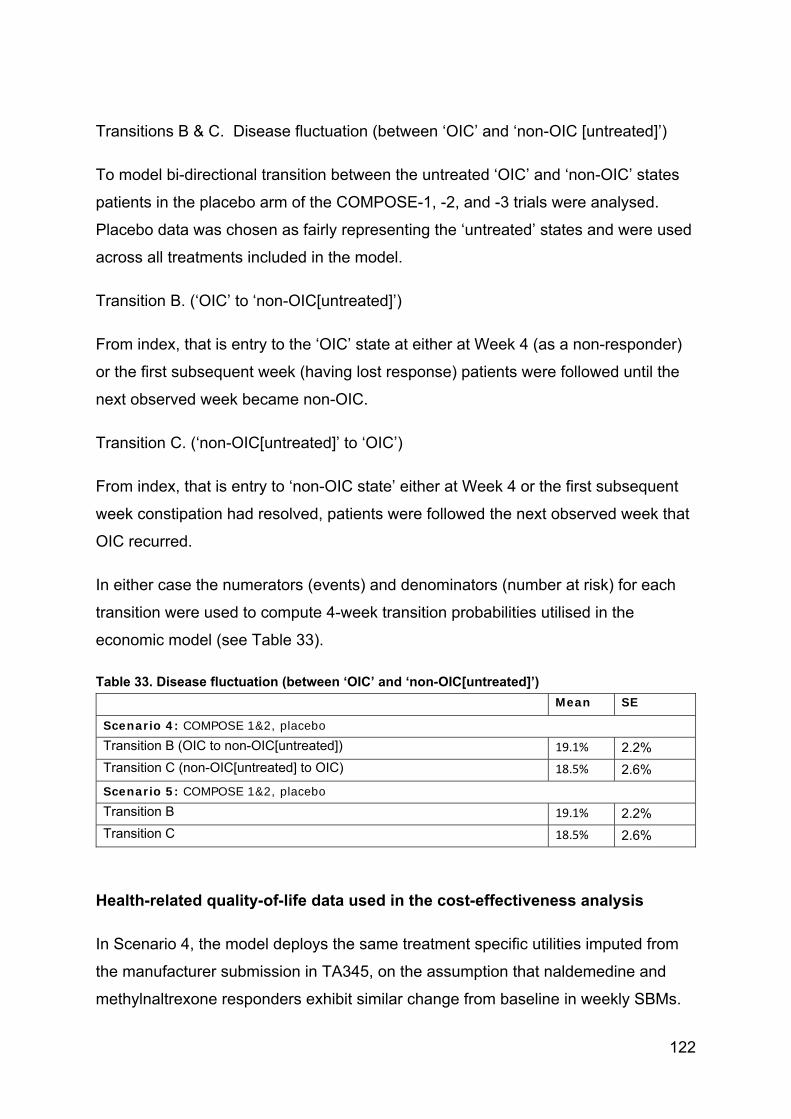
122
Transitions B & C. Disease fluctuation (between ‘OIC’ and ‘non-OIC [untreated]’)
To model bi-directional transition between the untreated ‘OIC’ and ‘non-OIC’ states
patients in the placebo arm of the COMPOSE-1, -2, and -3 trials were analysed.
Placebo data was chosen as fairly representing the ‘untreated’ states and were used
across all treatments included in the model.
Transition B. (‘OIC’ to ‘non-OIC[untreated]’)
From index, that is entry to the ‘OIC’ state at either at Week 4 (as a non-responder)
or the first subsequent week (having lost response) patients were followed until the
next observed week became non-OIC.
Transition C. (‘non-OIC[untreated]’ to ‘OIC’)
From index, that is entry to ‘non-OIC state’ either at Week 4 or the first subsequent
week constipation had resolved, patients were followed the next observed week that
OIC recurred.
In either case the numerators (events) and denominators (number at risk) for each
transition were used to compute 4-week transition probabilities utilised in the
economic model (see Table 33).
Table 33. Disease fluctuation (between ‘OIC’ and ‘non-OIC[untreated]’)
Mean SE
Scenario 4: COMPOSE 1&2, placebo Transition B (OIC to non-OIC[untreated]) 19.1% 2.2%
Transition C (non-OIC[untreated] to OIC) 18.5% 2.6%
Scenario 5: COMPOSE 1&2, placebo Transition B 19.1% 2.2%
Transition C 18.5% 2.6%
Health-related quality-of-life data used in the cost-effectiveness analysis
In Scenario 4, the model deploys the same treatment specific utilities imputed from
the manufacturer submission in TA345, on the assumption that naldemedine and
methylnaltrexone responders exhibit similar change from baseline in weekly SBMs.

123
In the case of Scenarios 5, treatment-specific utilities are deployed on the basis that
naldemedine-treated responders have a greater change from baseline than placebo-
treated responders in COMPOSE-1 & -2. As the analysis of PAC-QOL in
COMPOSE-3(24) shows no ‘wearing-off’ of the difference between naldemedine and
placebo over 52 weeks, the model assumes a persistent treatment benefit.
Table 34. Summary of utility values for cost-effectiveness analysis
State Utility value: mean (standard error)
95% confidence interval
SCENARIO 5 Non-OIC(naldemedine) 0.642 (0.018) (0.607, 0.678)
Non-OIC(placebo) 0.613 (0.021) (0.573, 0.655)
Non-OIC(untreated) 0.613 (0.021) (0.573, 0.655)
OIC 0.553 (0.022) (0.511, 0.597)
SCENARIO 4 Non-OIC(treated) 0.642 (0.018) (0.607, 0.678)
Non-OIC(untreated) 0.613 (0.021) (0.573, 0.655)
OIC 0.553 (0.022) (0.511, 0.597)
Intervention and comparators’ costs and resource use
The intervention and comparator costs are summarised in Table 35.
Scenario 4 assumes that naldemedine and methylnaltrexone are used in
monotherapy (£41.72 versus £637.37 respectively). The cost of methylnaltrexone
has been calculated as £294.70(46) using one vial every other day at a cost of
£21.05. An additional cost of administering the drug has been calculated as £342.67
after indexing to 2019.(1,47)
In all scenarios, following discontinuation of assigned treatment, patients move to
last line therapy assumed to be equivalent to second-line laxative combination.
As all interventions are oral treatments there are no administration costs included in
any scenario. None of the assigned treatments incur monitoring costs.
Table 35. Unit costs associated with the technology in the economic model (GBP2019)
Naldemedine Methylnatrexone 12 mg

124
Cost per OP £41.72 per 28 tablet pack £21.05 per vial, £342.67 per treatment
Cost per model cycle £41.72 £637.37
Base-case results
Base-case incremental cost-effectiveness analysis results
An overview of the base case results is presented in Table 36. Through greater
clinical effectiveness at relieving OIC, naldemedine improves HRQoL, although it
does not impact on mortality, which is reflected in the same life years being accrued
by naldemedine-treated and comparator patients. Over the 5-year time horizon, the
impact of naldemedine on the reduced time that patients spend in OIC results in an
improvement in QALYs (0.00794 and 0.06072 for Scenarios 4 and 5 respectively) for
a cost increase of -£3,236 and £522 respectively. This results in incremental cost-
effectiveness ratios for naldemedine over the respective comparator in each
scenario with dominance and an ICER of £8,602 per QALY respectively.
Table 36. Base-case results
Technologies Total costs (£)
Total QALYs
Incremental costs (£)
Incremental QALYs
ICER pairwise
(£/QALY)
Scenario 4 1,206 2.498 -3,175 0.00788 Dominates
Scenario 5 1,206 2.473 513 0.05982 8,579
Abbreviations: ICER, incremental cost-effectiveness ratio; LYG, life years gained; QALYs, quality-adjusted life years
B.3.8 Sensitivity analyses
Probabilistic sensitivity analysis
Probabilistic sensitivity analysis for each of the three scenarios by running 1000
simulations each in which for each base case input parameter, a random value was
drawn from between the lower and upper 95% confidence interval according to the
respective distribution. In cases where the actual confidence interval was unknown,
a random draw was made by assuming an empiric +/- 20% variation.
The cost-effectiveness planes (Figure 34 and Figure 36) and cost-effectiveness
acceptability curves (CEAC) for each scenario (Figure 33 and Figure 35) suggest
that the ICER for naldemedine versus all comparators is below the £20,000
threshold is robust in the face of parameter uncertainty. Naldemedine has a 100%

125
probability of being below the £20,000 willingness to pay threshold when compared
with either Methylnaltrexone or no treatment.
Figure 33 : Probabilistic sensitivity analysis - Cost-effectiveness Acceptability curve - Scenario 4
Figure 34: Probabilistic sensitivity analysis - Cost effectiveness plane - Scenario 4
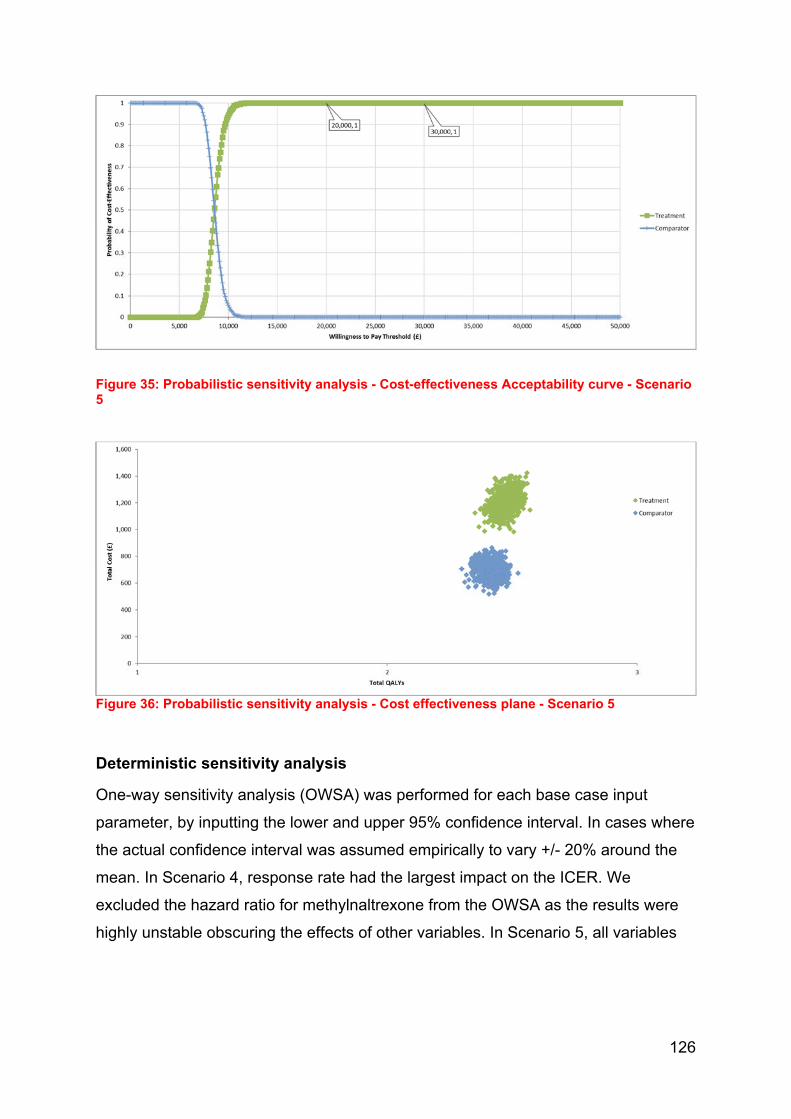
126
Figure 35: Probabilistic sensitivity analysis - Cost-effectiveness Acceptability curve - Scenario 5
Figure 36: Probabilistic sensitivity analysis - Cost effectiveness plane - Scenario 5
Deterministic sensitivity analysis
One-way sensitivity analysis (OWSA) was performed for each base case input
parameter, by inputting the lower and upper 95% confidence interval. In cases where
the actual confidence interval was assumed empirically to vary +/- 20% around the
mean. In Scenario 4, response rate had the largest impact on the ICER. We
excluded the hazard ratio for methylnaltrexone from the OWSA as the results were
highly unstable obscuring the effects of other variables. In Scenario 5, all variables

127
had an ICER of <£20,000 when varied (
Figure 37 and Figure 38).
Figure 37: One-way sensitivity analysis– Tornado diagram – Scenario 4

128
Figure 38: One-way sensitivity analysis– Tornado diagram – Scenario 5

129
Appendix B – Scenario 0 – All patients from pooled
Compose 1 and 2 studies.
Clinical parameters and variables
Table 37. Proportion of patients in ‘non-OIC (treatment)’ state at Week 4 and Week 12, trial-based and ITC-derived
Scenario Treatment Source EP N Week 4 Week 12
Mean SE Mean SE
0 Naldemedine COMPOSE‐1 & ‐2 SBM 542 61.07% 2.09% 57.75% 2.12%
Placebo SBM 546 41.58% 2.11% 46.70% 2.14%
Maintenance phase: health state transitions
Transition A. Loss of response (‘non-OIC[treatment]’ to ‘OIC’).
A survival approach has been used to generate estimates of transition A, consistent
(where possible) with the corresponding source data for clinical response in each
scenario.
The log normal function was chosen as the best-fitting of those available (according
to AIC & BIC [Table 38] and visual inspection [see Figure 42]. The impact of this
choice on model outputs is tested in sensitivity analysis by substituting the
alternative distributions.

130
Figure 39. Parametric survival models of treatment response fitted to COMPOSE-1&2 data (Scenario 0)
Equations were fitted using the SURVREG (for exponential, Weibull, log-logistic, and
log-normal functions) and FLEXSURVREG (for Gompertz) procedures in R.
Estimates of the scale and shape parameters of the distributions and their respective
goodness of fit are summarized in Table 38. Unlike the previous submission for
naloxegol, treatment effect was modelled as a parameter rather than through
separate equations, in accordance with best practice guidelines(45).
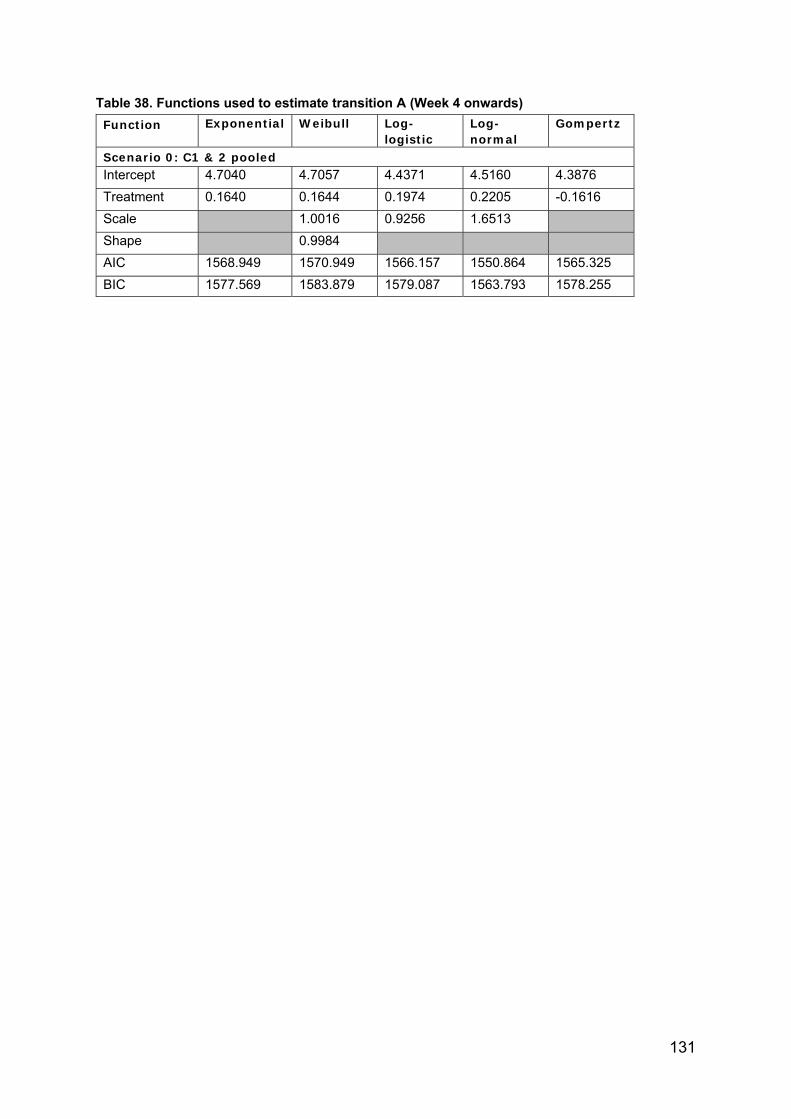
131
Table 38. Functions used to estimate transition A (Week 4 onwards)
Function Exponential Weibull Log-logistic
Log-normal
Gompertz
Scenario 0: C1 & 2 pooled Intercept 4.7040 4.7057 4.4371 4.5160 4.3876
Treatment 0.1640 0.1644 0.1974 0.2205 -0.1616
Scale
1.0016 0.9256 1.6513
Shape
0.9984
AIC 1568.949 1570.949 1566.157 1550.864 1565.325
BIC 1577.569 1583.879 1579.087 1563.793 1578.255
132
Transitions B & C. Disease fluctuation (between ‘OIC’ and ‘non-OIC [untreated]’)
To model bi-directional transition between the untreated ‘OIC’ and ‘non-OIC’ states
patients in the placebo arm of the COMPOSE-1, -2, and -3 trials were analysed.
Placebo data was chosen as fairly representing the ‘untreated’ states and were used
across all treatments included in the model.
Transition B. (‘OIC’ to ‘non-OIC[untreated]’)
From index, that is entry to the ‘OIC’ state at either at Week 4 (as a non-responder)
or the first subsequent week (having lost response) patients were followed until the
next observed week became non-OIC.
Transition C. (‘non-OIC[untreated]’ to ‘OIC’)
From index, that is entry to ‘non-OIC state’ either at Week 4 or the first subsequent
week constipation had resolved, patients were followed the next observed week that
OIC recurred.
In either case the numerators (events) and denominators (number at risk) for each
transition were used to compute 4-week transition probabilities utilised in the
economic model (see Table 39).
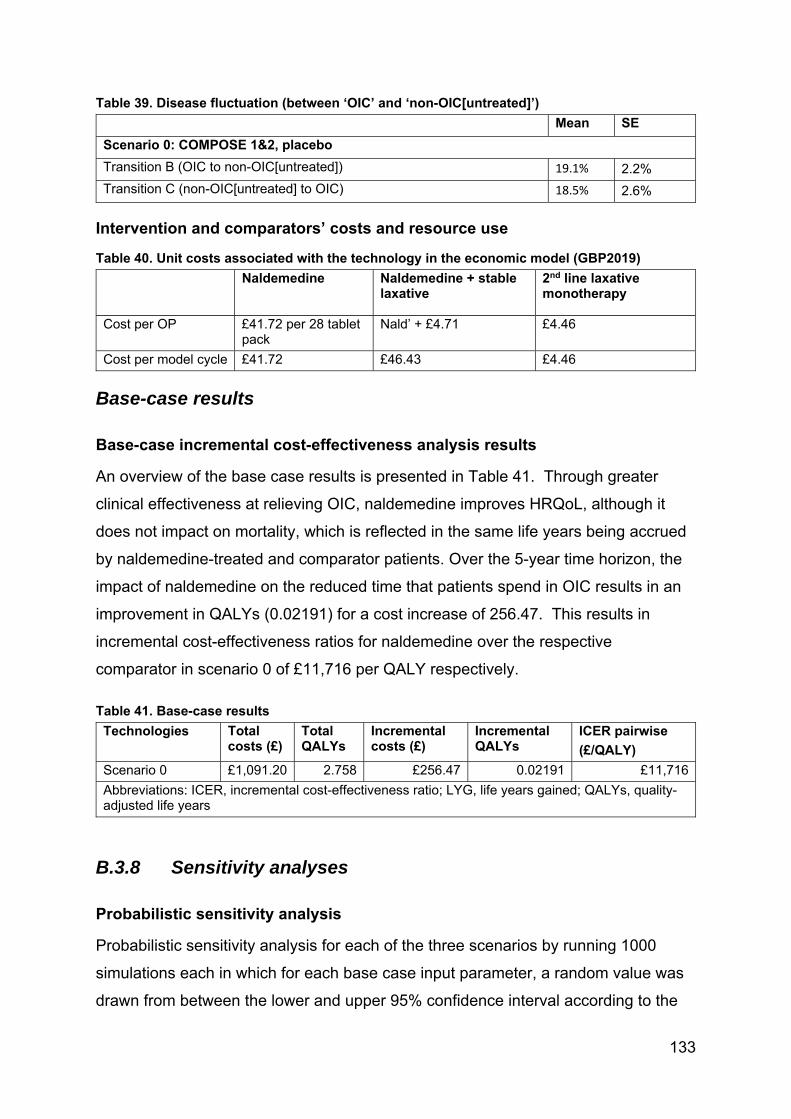
133
Table 39. Disease fluctuation (between ‘OIC’ and ‘non-OIC[untreated]’)
Mean SE
Scenario 0: COMPOSE 1&2, placebo
Transition B (OIC to non-OIC[untreated]) 19.1% 2.2%
Transition C (non-OIC[untreated] to OIC) 18.5% 2.6%
Intervention and comparators’ costs and resource use
Table 40. Unit costs associated with the technology in the economic model (GBP2019)
Naldemedine Naldemedine + stable laxative
2nd line laxative monotherapy
Cost per OP £41.72 per 28 tablet pack
Nald’ + £4.71 £4.46
Cost per model cycle £41.72 £46.43 £4.46
Base-case results
Base-case incremental cost-effectiveness analysis results
An overview of the base case results is presented in Table 41. Through greater
clinical effectiveness at relieving OIC, naldemedine improves HRQoL, although it
does not impact on mortality, which is reflected in the same life years being accrued
by naldemedine-treated and comparator patients. Over the 5-year time horizon, the
impact of naldemedine on the reduced time that patients spend in OIC results in an
improvement in QALYs (0.02191) for a cost increase of 256.47. This results in
incremental cost-effectiveness ratios for naldemedine over the respective
comparator in scenario 0 of £11,716 per QALY respectively.
Table 41. Base-case results
Technologies Total costs (£)
Total QALYs
Incremental costs (£)
Incremental QALYs
ICER pairwise
(£/QALY)
Scenario 0 £1,091.20 2.758 £256.47 0.02191 £11,716
Abbreviations: ICER, incremental cost-effectiveness ratio; LYG, life years gained; QALYs, quality-adjusted life years
B.3.8 Sensitivity analyses
Probabilistic sensitivity analysis
Probabilistic sensitivity analysis for each of the three scenarios by running 1000
simulations each in which for each base case input parameter, a random value was
drawn from between the lower and upper 95% confidence interval according to the
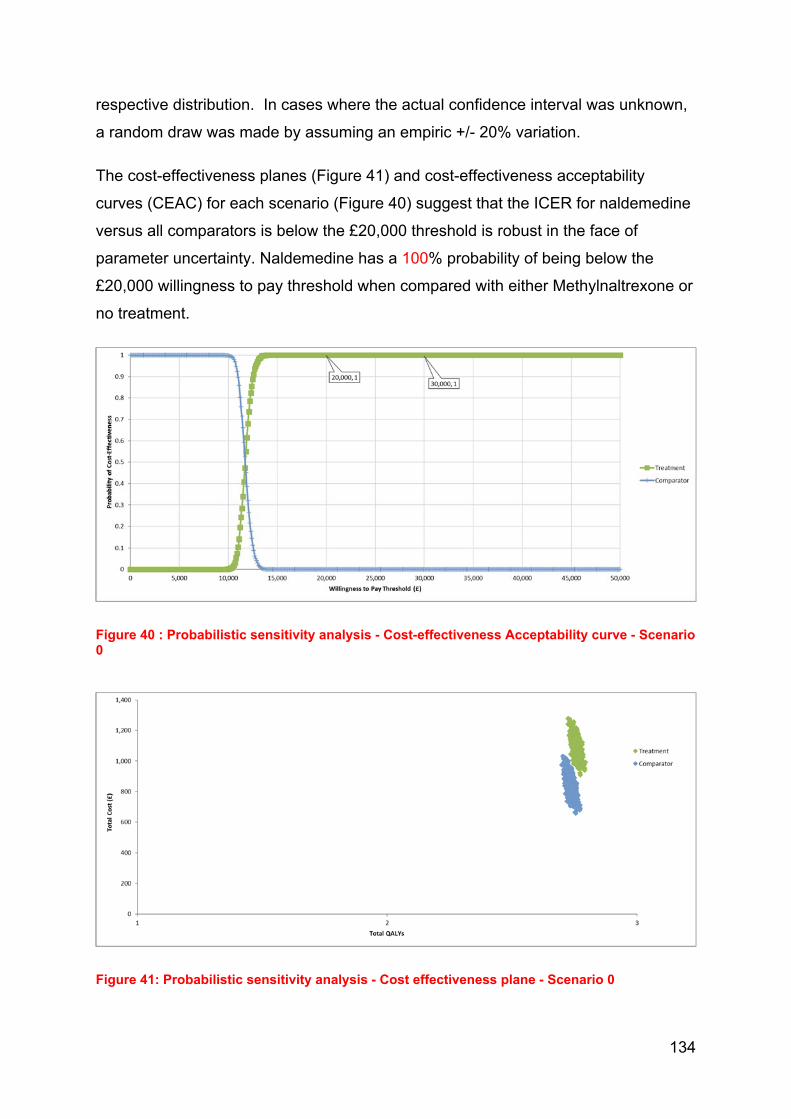
134
respective distribution. In cases where the actual confidence interval was unknown,
a random draw was made by assuming an empiric +/- 20% variation.
The cost-effectiveness planes (Figure 41) and cost-effectiveness acceptability
curves (CEAC) for each scenario (Figure 40) suggest that the ICER for naldemedine
versus all comparators is below the £20,000 threshold is robust in the face of
parameter uncertainty. Naldemedine has a 100% probability of being below the
£20,000 willingness to pay threshold when compared with either Methylnaltrexone or
no treatment.
Figure 40 : Probabilistic sensitivity analysis - Cost-effectiveness Acceptability curve - Scenario 0
Figure 41: Probabilistic sensitivity analysis - Cost effectiveness plane - Scenario 0

135
Deterministic sensitivity analysis
One-way sensitivity analysis (OWSA) was performed for each base case input
parameter, by inputting the lower and upper 95% confidence interval. In cases where
the actual confidence interval was assumed empirically to vary +/- 20% around the
mean. In Scenario 0, the utility value for non-OIC in the naldemedine patients had
the largest impact on the ICER (Figure 42).
Figure 42: One-way sensitivity analysis– Tornado diagram – Scenario 0

136
Appendix C – Section B.3.7 updated
Base-case incremental cost-effectiveness analysis results
An overview of the base case results is presented in Table 42. Through greater
clinical effectiveness at relieving OIC, naldemedine improves HRQoL, although it
does not impact on mortality, which is reflected in the same life years being accrued
by naldemedine-treated and comparator patients. Over the 5-year time horizon, the
impact of naldemedine on the reduced time that patients spend in OIC results in an
improvement in QALYs (0.04396, 0.08348, and 0.01041 for Scenarios 1, 2, and 3
respectively) for a cost increase of £371, £748, and £105 respectively. This results
in incremental cost-effectiveness ratios for naldemedine over the respective
comparator in each Scenario of £8,444, £8,959, and £10,134 per QALY respectively.
Table 42. Base-case results
Technologies Total costs (£)
Total QALYs
Incremental costs (£)
Incremental QALYs
ICER pairwise
(£/QALY)
Scenario 1 1,235 2.772 371 0.04396 8,444
Scenario 2 1,642 2.804 748 0.08348 8,959
Scenario 3 1,102 2.862 105 0.01041 10,134
Abbreviations: ICER, incremental cost-effectiveness ratio; LYG, life years gained; QALYs, quality-adjusted life years
B.3.8 Sensitivity analyses
Probabilistic sensitivity analysis
Probabilistic sensitivity analysis for each of the three scenarios by running 1000
simulations each in which for each base case input parameter, a random value was
drawn from between the lower and upper 95% confidence interval according to the
respective distribution. In cases where the actual confidence interval was unknown,
a random draw was made by assuming an empiric +/- 20% variation.
The cost-effectiveness planes (Figure 44, Figure 46 and Figure 48) and cost-
effectiveness acceptability curves (CEAC) for each scenario (Figure 45, Figure 47
and Figure 52) suggest that the ICER for naldemedine versus all comparators is
below the £20,000 threshold is robust in the face of parameter uncertainty.
Naldemedine has a >97% probability of being below the £20,000 willingness to pay
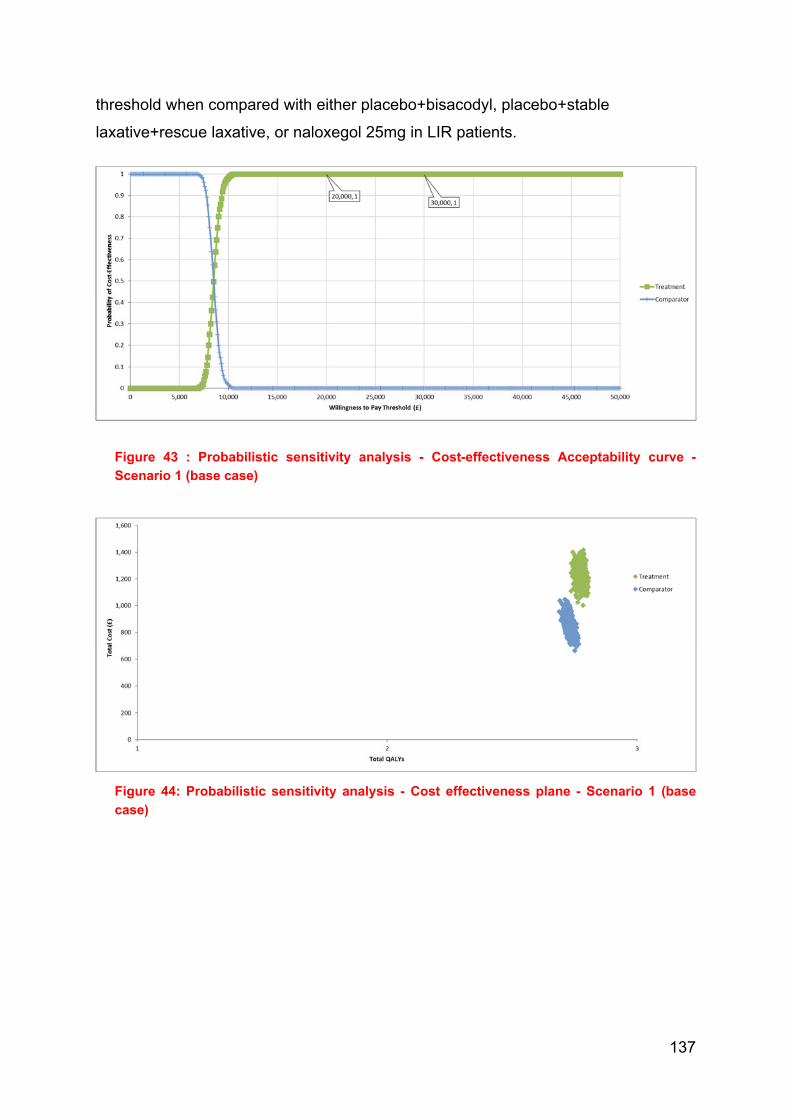
137
threshold when compared with either placebo+bisacodyl, placebo+stable
laxative+rescue laxative, or naloxegol 25mg in LIR patients.
Figure 43 : Probabilistic sensitivity analysis - Cost-effectiveness Acceptability curve -
Scenario 1 (base case)
Figure 44: Probabilistic sensitivity analysis - Cost effectiveness plane - Scenario 1 (base
case)

138
Figure 45: Probabilistic sensitivity analysis - Cost-effectiveness Acceptability curve -
Scenario 2 (base case)
Figure 46: Probabilistic sensitivity analysis - Cost effectiveness plane - Scenario 2 (base
case)

139
Figure 47:Probabilistic sensitivity analysis - Cost-effectiveness Acceptability curve -
Scenario 3 (base case)
Figure 48: Probabilistic sensitivity analysis - Cost effectiveness plane - Scenario 3
Deterministic sensitivity analysis
One-way sensitivity analysis (OWSA) was performed for each base case input parameter, by inputting
the lower and upper 95% confidence interval. In cases where the actual confidence interval was
assumed empirically to vary +/- 20% around the mean. . In Scenarios 1 and 2 transition A for the
naldemedine patients and the transition of OIC to non-OIC (untreated) had the largest impact on the
ICER, respectively (Figure 49 and Figure 50). In Scenario 3, varying the risk ratio for naloxegol in
transition A had the greatest impact on the ICER, but in no instance was £20,000 per QALY exceeded.
(Figure 51)

140
Figure 49: One-way sensitivity analysis– Tornado diagram - Scenario 1 (base case)
Figure 50: One-way sensitivity analysis– Tornado diagram - Scenario 2

141
Figure 51: One-way sensitivity analysis – Tornado diagram - Scenario 3
Scenario analysis
The impact of other assumptions has been tested in a series of scenario analyses, namely:
1) deployment of health-state specific utility values instead of treatment specific ones;
2) varying the time horizon of each model from one year to five years by utility value set; and
3) substituting alternative parametric survival distributions for the maintenance of response
(Transition A).
Alternative utility sets
Replacement of treatment-specific utilities with health-state specific utility values has the effect of
decreasing the incremental QALY gain in each scenario and inflating the ICER. Using values from
TA345 (direct EQ-5D utility), no ICER exceeds £20,000 per QALY in any scenario (Table 43). Using
the more conservative utility values mapped from SF-12 in the COMPOSE-1 & -2 data, the ICERs for
Scenarios 1 and 2 exceed £20,000 per QALY but remain within £30,000 per QALY, while that for
Scenario 3 remains within a threshold of £20,000 per QALY (Table 44).
Table 43: Deterministic results – health state utilities (direct EQ-5D)
Technologies Total costs (£)
Total QALYs
Incremental costs (£)
Incremental QALYs
ICER pairwise
(£/QALY)
Scenario 1 1,235 2.812 371 0.01902 19,506
Scenario 2 1,643 2.823 748 0.03828 19,539
Scenario 3 1,102 2.862 105 0.01041 10,134
Abbreviations: ICER, incremental cost-effectiveness ratio; QALYs, quality-adjusted life years
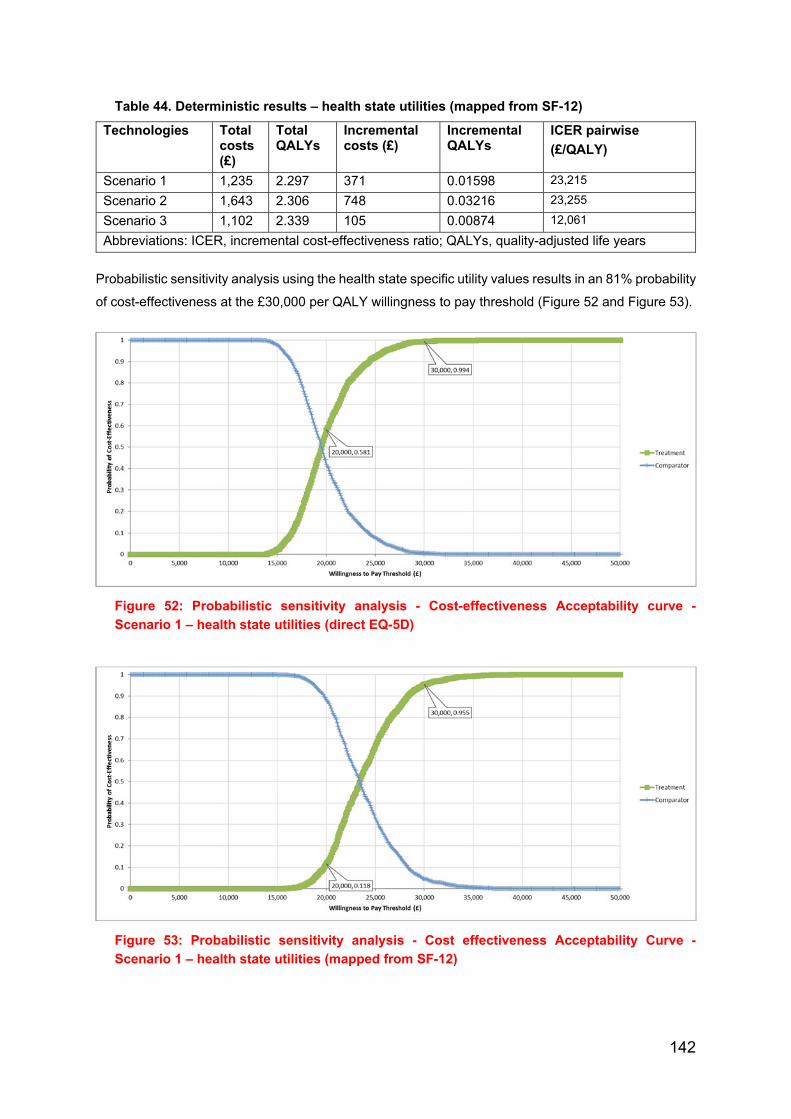
142
Table 44. Deterministic results – health state utilities (mapped from SF-12)
Technologies Total costs (£)
Total QALYs
Incremental costs (£)
Incremental QALYs
ICER pairwise
(£/QALY)
Scenario 1 1,235 2.297 371 0.01598 23,215
Scenario 2 1,643 2.306 748 0.03216 23,255
Scenario 3 1,102 2.339 105 0.00874 12,061
Abbreviations: ICER, incremental cost-effectiveness ratio; QALYs, quality-adjusted life years
Probabilistic sensitivity analysis using the health state specific utility values results in an 81% probability
of cost-effectiveness at the £30,000 per QALY willingness to pay threshold (Figure 52 and Figure 53).
Figure 52: Probabilistic sensitivity analysis - Cost-effectiveness Acceptability curve -
Scenario 1 – health state utilities (direct EQ-5D)
Figure 53: Probabilistic sensitivity analysis - Cost effectiveness Acceptability Curve -
Scenario 1 – health state utilities (mapped from SF-12)
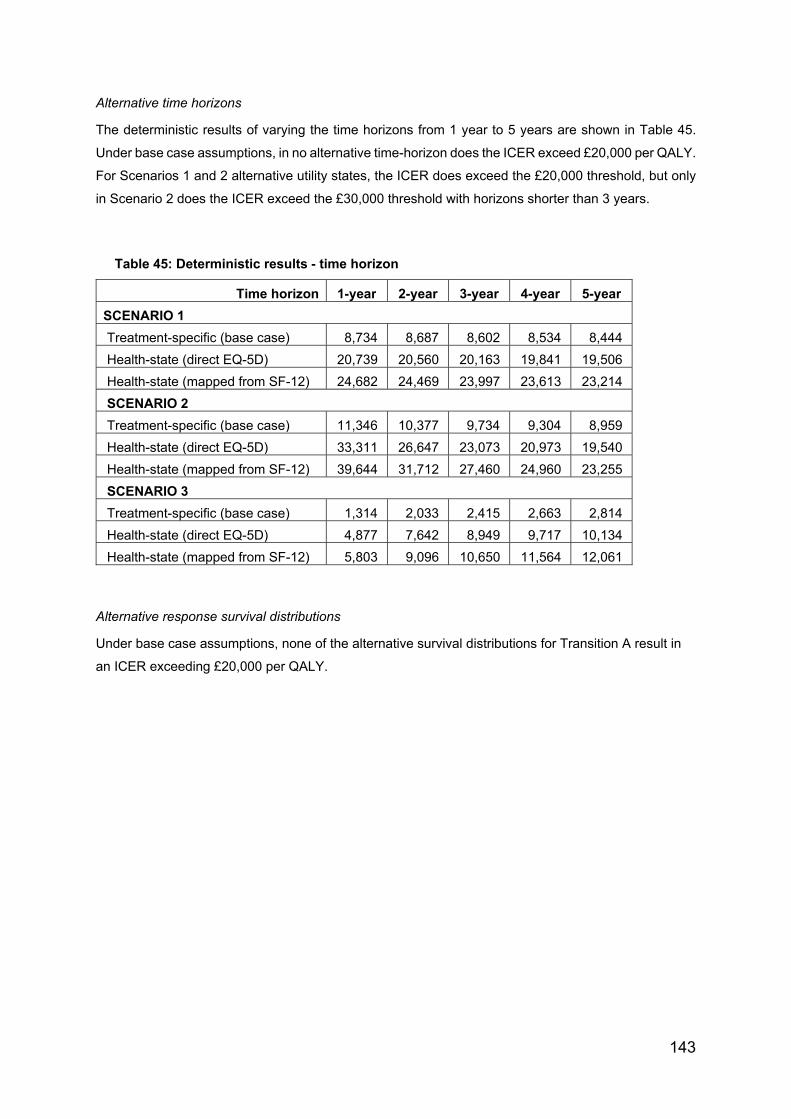
143
Alternative time horizons
The deterministic results of varying the time horizons from 1 year to 5 years are shown in Table 45.
Under base case assumptions, in no alternative time-horizon does the ICER exceed £20,000 per QALY.
For Scenarios 1 and 2 alternative utility states, the ICER does exceed the £20,000 threshold, but only
in Scenario 2 does the ICER exceed the £30,000 threshold with horizons shorter than 3 years.
Table 45: Deterministic results - time horizon
Time horizon 1-year 2-year 3-year 4-year 5-year
SCENARIO 1
Treatment-specific (base case) 8,734 8,687 8,602 8,534 8,444
Health-state (direct EQ-5D) 20,739 20,560 20,163 19,841 19,506
Health-state (mapped from SF-12) 24,682 24,469 23,997 23,613 23,214
SCENARIO 2
Treatment-specific (base case) 11,346 10,377 9,734 9,304 8,959
Health-state (direct EQ-5D) 33,311 26,647 23,073 20,973 19,540
Health-state (mapped from SF-12) 39,644 31,712 27,460 24,960 23,255
SCENARIO 3
Treatment-specific (base case) 1,314 2,033 2,415 2,663 2,814
Health-state (direct EQ-5D) 4,877 7,642 8,949 9,717 10,134
Health-state (mapped from SF-12) 5,803 9,096 10,650 11,564 12,061
Alternative response survival distributions
Under base case assumptions, none of the alternative survival distributions for Transition A result in
an ICER exceeding £20,000 per QALY.
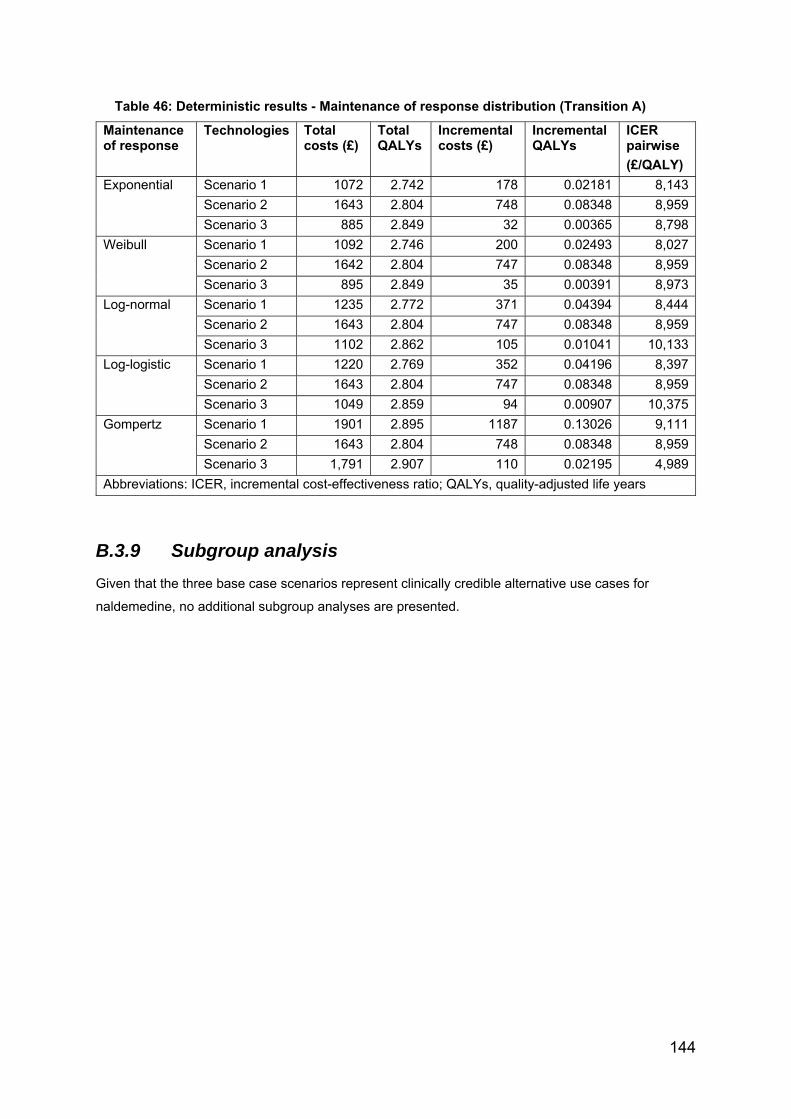
144
Table 46: Deterministic results - Maintenance of response distribution (Transition A)
Maintenance of response
Technologies Total costs (£)
Total QALYs
Incremental costs (£)
Incremental QALYs
ICER pairwise
(£/QALY)
Exponential Scenario 1 1072 2.742 178 0.02181 8,143
Scenario 2 1643 2.804 748 0.08348 8,959
Scenario 3 885 2.849 32 0.00365 8,798
Weibull Scenario 1 1092 2.746 200 0.02493 8,027
Scenario 2 1642 2.804 747 0.08348 8,959
Scenario 3 895 2.849 35 0.00391 8,973
Log-normal Scenario 1 1235 2.772 371 0.04394 8,444
Scenario 2 1643 2.804 747 0.08348 8,959
Scenario 3 1102 2.862 105 0.01041 10,133
Log-logistic Scenario 1 1220 2.769 352 0.04196 8,397
Scenario 2 1643 2.804 747 0.08348 8,959
Scenario 3 1049 2.859 94 0.00907 10,375
Gompertz Scenario 1 1901 2.895 1187 0.13026 9,111
Scenario 2 1643 2.804 748 0.08348 8,959
Scenario 3 1,791 2.907 110 0.02195 4,989
Abbreviations: ICER, incremental cost-effectiveness ratio; QALYs, quality-adjusted life years
B.3.9 Subgroup analysis
Given that the three base case scenarios represent clinically credible alternative use cases for
naldemedine, no additional subgroup analyses are presented.
145
B.3.10 Validation
The current model applied a very similar structure to that developed for the manufacturer submission
of naloxegol, on the basis that it not only had been endorsed by NICE but also that the results would
allow meaningful comparison. Given the lower acquisition cost of naldemedine relative to naloxegol,
similar comparative effectiveness, and using the same treatment-specific utility values, the lower base
case ICERs than those accepted in the NICE reference case for TA345(1) provide evidence of both
internal and external validity of the current model.
The model was initial constructed by expert health economists in the US (RTI) and subsequently
reviewed by (Costello Medical) and adapted by (Pharmatelligence) other UK-based health economists.
B.3.11 Interpretation and conclusions of economic evidence
The economic evidence presented demonstrates that naldemedine is a cost-effective treatment option
in the UK for patients with OIC who have previously been treated with a laxative.
A de novo economic model was constructed to compare the cost-effectiveness of naldemedine based
on the patients enrolled in COMPOSE-1, -2 and -3 trials for the treatment of adult patients with OIC who
had previously been treated with a laxative. The model comprised a decision-tree structure for the first
four weeks of treatment, followed by a Markov structure over a time horizon of up to five years. This
approach was taken in order to not only represent the natural history of OIC but also to conservatively
model the available data. The modelling approach was in line with previous models and the feedback
upon them (1,43,48–50).
The economic analysis reports on the following use cases:
Scenario 1: naldemedine 0.2mg daily (recommended dose) as monotherapy versus placebo in
combination with bisacodyl (where bisacodyl was a proxy for second-line laxative monotherapy)
Scenario 2: naldemedine 0.2mg plus stable laxative versus placebo in combination with stable laxative
plus rescue laxative.
Scenario 3: naldemedine 0.2mg versus naloxegol 25mg in patients with inadequate response to
previous laxative therapy.
These scenarios are considered the most clinically relevant given the multifactorial nature of
constipation and contemporary European clinical guidance (17) for the management of OIC, endorsed
by an advisory board of UK expert clinicians (Appendix O).
In the base-case analysis for each of the three scenarios for naldemedine use, the ICERs for
naldemedine versus comparator gained for a five-year time horizon were as follows:
Scenario 1: £8,429 per QALY gained

146
Scenario 2: £8,953 per QALY gained
Scenario 3: £4,723 per QALY gained
Interestingly, whilst the acquisition cost of naldemedine is 19% lower than that of naloxegol and
treatment benefit was shown to be consistently superior, naldemedine was not ‘dominant’ in the base
case. This was due to differential discontinuation patterns between the two PAMORAs, whereby those
treated with naloxegol discontinued at a more rapid rate to relatively inexpensive alternative therapies—
a highly conservative assumption.
A large number of sensitivity and scenario analyses were completed in order to investigate the
robustness of the model to changes and uncertainty in the parameters and assumptions. These
included analyses of alternative treatment effect extrapolation and utility assumptions. In nearly all of
these sensitivity analyses, naldemedine was found to be cost-effective at a willingness-to-pay threshold
of £20,000 per QALY.
Probabilistic sensitivity analysis was undertaken for all the base-case comparisons. Derived from this,
naldemedine 0.2mg has a probability of being cost-effective at a willingness-to-pay threshold of
<£20,000 in excess of 99% (all scenarios). The model was most sensitive to the utility associated with
OIC. However, even assuming the most conservative value set, naldemedine has a minimum 85%
probability of being cost-effective at a willingness-to-pay threshold of £30,000 (all scenarios).
Shionogi therefore contends that naldemedine 0.2mg represents a cost-effective alternative to current
standard of care, whether used alone or in combination with laxatives for the management of OIC.

147
Appendix D- Diagnostic plots for parametric survival models
for Transition A (loss of response) – scenario 0
A good fit of a distribution is represented by a linear pattern in a diagnostic plot.
The parametric plot for the exponential distribution tests the negative natural log of
survival vs. time. The line represents the trend line which the observed data points
should follow.
The parametric plot for the Weibull distribution tests the natural log of the negative
natural log of survival vs. natural log of time. The line represents the trend which the
observed data points should follow.
The parametric plot for the log-normal distribution tests the natural log of time vs.
standard normal quartiles. The line represents the trend which the observed data
points should follow.
Scenario 0
In Figure 54 and Figure 55 it can be seen that the points follow a linear trend of the
line for both Naldemedine and Placebo, suggesting that the underlying distribution
could be exponential.
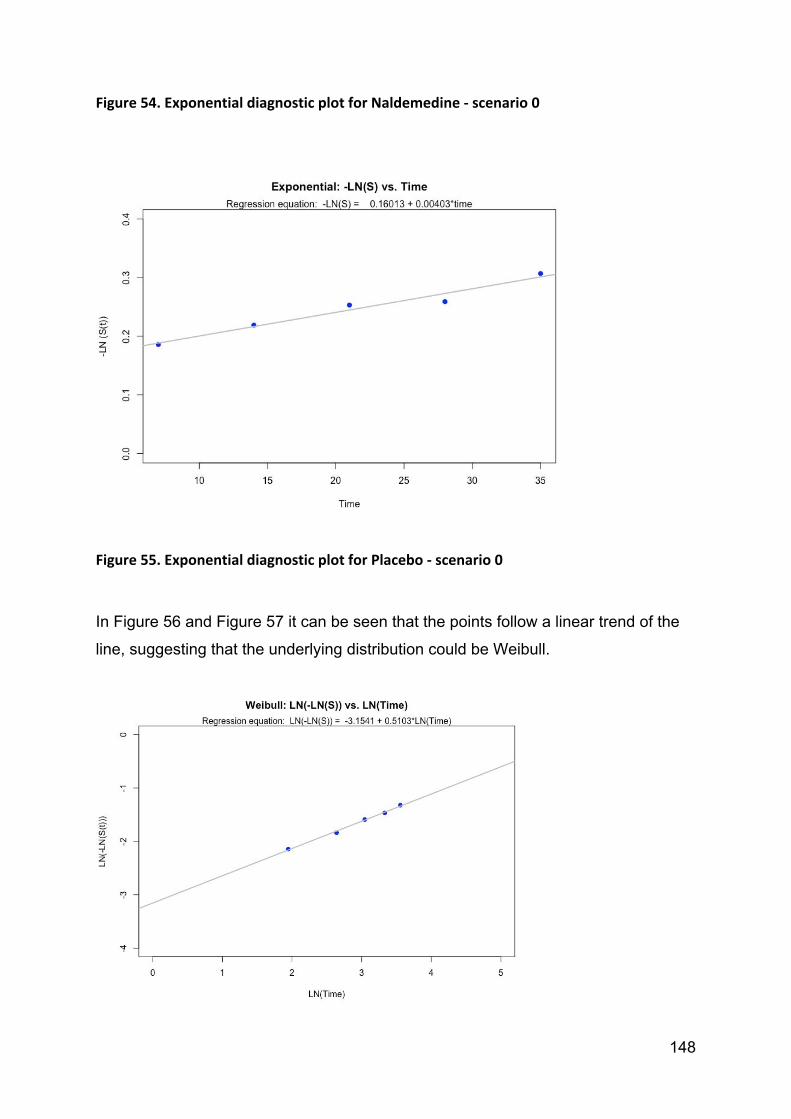
148
Figure 54. Exponential diagnostic plot for Naldemedine ‐ scenario 0
Figure 55. Exponential diagnostic plot for Placebo ‐ scenario 0
In Figure 56 and Figure 57 it can be seen that the points follow a linear trend of the
line, suggesting that the underlying distribution could be Weibull.
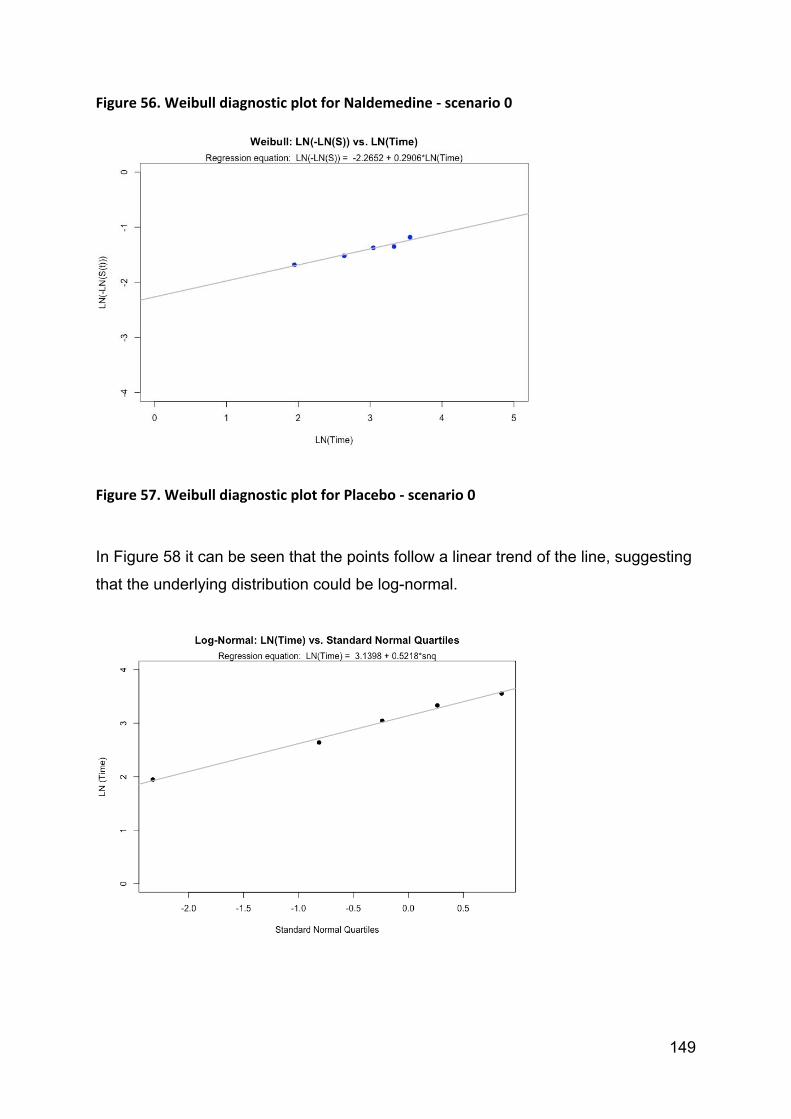
149
Figure 56. Weibull diagnostic plot for Naldemedine ‐ scenario 0
Figure 57. Weibull diagnostic plot for Placebo ‐ scenario 0
In Figure 58 it can be seen that the points follow a linear trend of the line, suggesting
that the underlying distribution could be log-normal.

150
Figure 58. Log‐normal diagnostic plot for scenario 0
Summary
Due to the similarity of the diagnostic plots between each available distribution of the
three available methods for goodness of fit determination we used only AIC, BIC
criterion with visual inspection.

151
Appendix E – Abbreviations

152
Abbreviation Expansion 5-HT4 5-hydroxytryptamine (serotonin) type 4
AE Adverse event
AGA American Gastroenterological Association
AIC Akaike Information Criterion
BCL Bisacodyl
BFI Bowel Function Index
BIC Bayesian Information Criterion
BL Baseline
BM Bowel movement
BMI Body Mass Index
BNF British National Formulary
BSFS Bristol Stool Form Scale
CEAC Cost-effectiveness acceptability curve
cGMP Cyclic guanosine monophosphate
CHF Chronic heart failure
CI Confidence Interval
CNS Central nervous system
COWS Clinical Opiate Withdrawal Scale
CPRD Clinical Practice Research Datalink
CRD Centre for Reviews and Dissemination, University of York
CSBM Spontaneous bowel movement with complete evacuation
ECOG Eastern Cooperative Oncology Group performance scale
eCRF electronic Case Report Form
ED Emergency Department
eGFR Estimated Glomerular Filtration Rate
EMA European Medicines Agency
EPAR European public assessment report
EQ-5D Standardised instrument measuring quality of life
EQ-5D VAS EQ-5D visual analogue scale
EU European Union
GC-C Guanylate cyclase-C
GDP Gross Domestic Product
GERD Gastroesophageal reflux disease
GI Gastrointestinal
GP General Practitioner
HCP Healthcare provider
HCRU Healthcare resource utilisation
HES Hospital Episode Statistics
HR Hazard ratio
HRG Healthcare resource group
HRQOL Health-related quality of life
ICD-9 International Classification of Disease, 9th revision
ICER Incremental cost-effectiveness ratio
INN International normalised nomenclature
ITC Indirect treatment comparison
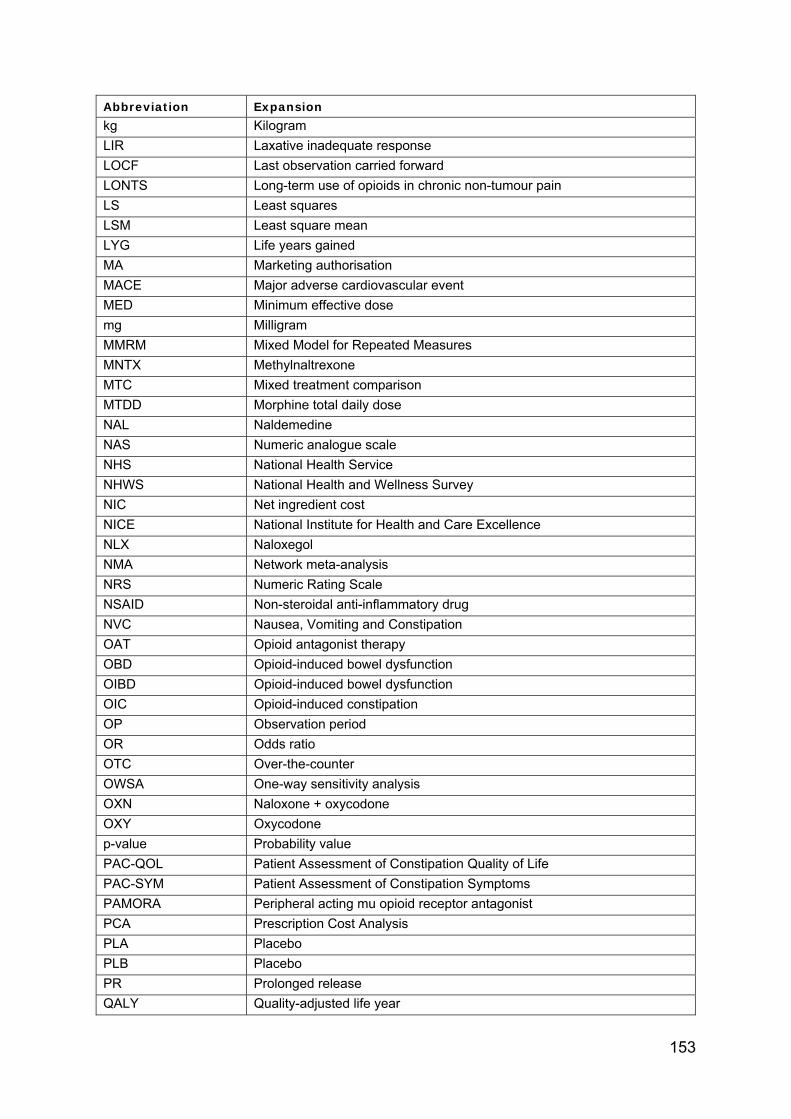
153
Abbreviation Expansion kg Kilogram
LIR Laxative inadequate response
LOCF Last observation carried forward
LONTS Long-term use of opioids in chronic non-tumour pain
LS Least squares
LSM Least square mean
LYG Life years gained
MA Marketing authorisation
MACE Major adverse cardiovascular event
MED Minimum effective dose
mg Milligram
MMRM Mixed Model for Repeated Measures
MNTX Methylnaltrexone
MTC Mixed treatment comparison
MTDD Morphine total daily dose
NAL Naldemedine
NAS Numeric analogue scale
NHS National Health Service
NHWS National Health and Wellness Survey
NIC Net ingredient cost
NICE National Institute for Health and Care Excellence
NLX Naloxegol
NMA Network meta-analysis
NRS Numeric Rating Scale
NSAID Non-steroidal anti-inflammatory drug
NVC Nausea, Vomiting and Constipation
OAT Opioid antagonist therapy
OBD Opioid-induced bowel dysfunction
OIBD Opioid-induced bowel dysfunction
OIC Opioid-induced constipation
OP Observation period
OR Odds ratio
OTC Over-the-counter
OWSA One-way sensitivity analysis
OXN Naloxone + oxycodone
OXY Oxycodone
p-value Probability value
PAC-QOL Patient Assessment of Constipation Quality of Life
PAC-SYM Patient Assessment of Constipation Symptoms
PAMORA Peripheral acting mu opioid receptor antagonist
PCA Prescription Cost Analysis
PLA Placebo
PLB Placebo
PR Prolonged release
QALY Quality-adjusted life year

154
Abbreviation Expansion QD Once a day
QOD Every other day
QoL Quality of life
R Programming language for statistical computing
RCT Randomised controlled trial
RMP Risk management plan
RR Relative risk
SA Statistical analysis
SBM Spontaneous bowel movement
SC Subcutaneous
SD Standard Deviation
SE Standard error
SF-12 Short Form 12 health survey
SF-36 Short Form 36 health survey
SLR Systematic literature review
SmPC Summary of product characteristics
SoC Standard of care
SOWS Subjective Opiate Withdrawal Scale
TDD Total daily dose
TEAE Treatment-emergent adverse event
TOPS Treatment Outcomes of Pain Survey
UEG United European Gastroenterology
UK United Kingdom
URTI Upper respiratory tract infection
USA United States of America
UTI Urinary tract infection
WHO World Health Organization
WPAI Work Productivity and Activity Impairment questionnaire
WPAI-SHP WPAI - Specific Health Problem questionnaire
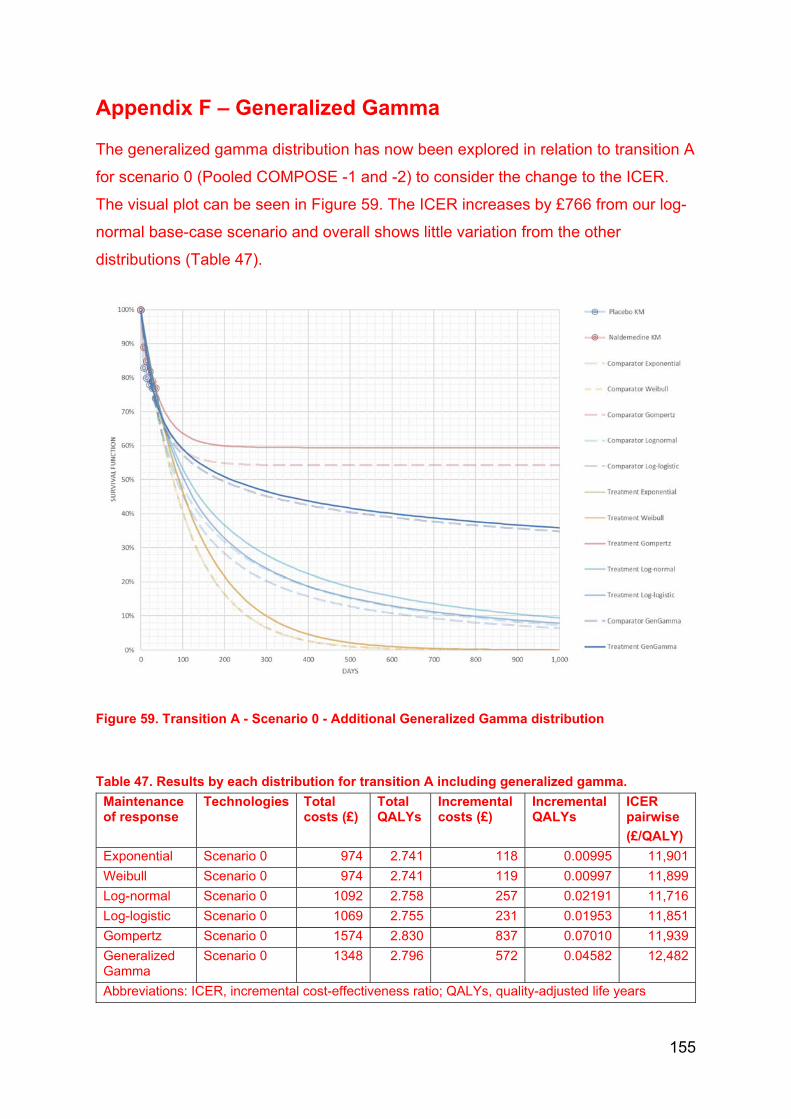
155
Appendix F – Generalized Gamma
The generalized gamma distribution has now been explored in relation to transition A
for scenario 0 (Pooled COMPOSE -1 and -2) to consider the change to the ICER.
The visual plot can be seen in Figure 59. The ICER increases by £766 from our log-
normal base-case scenario and overall shows little variation from the other
distributions (Table 47).
Figure 59. Transition A - Scenario 0 - Additional Generalized Gamma distribution
Table 47. Results by each distribution for transition A including generalized gamma.
Maintenance of response
Technologies Total costs (£)
Total QALYs
Incremental costs (£)
Incremental QALYs
ICER pairwise
(£/QALY)
Exponential Scenario 0 974 2.741 118 0.00995 11,901
Weibull Scenario 0 974 2.741 119 0.00997 11,899
Log-normal Scenario 0 1092 2.758 257 0.02191 11,716
Log-logistic Scenario 0 1069 2.755 231 0.01953 11,851
Gompertz Scenario 0 1574 2.830 837 0.07010 11,939
Generalized Gamma
Scenario 0 1348 2.796 572 0.04582 12,482
Abbreviations: ICER, incremental cost-effectiveness ratio; QALYs, quality-adjusted life years

Professional organisation submission Naldemedine for treating opioid-induced constipation [ID1189] 1 of 21
Professional organisation submission
Naldemedine for treating opioid-induced constipation [ID1189]
Thank you for agreeing to give us your organisation’s views on this technology and its possible use in the NHS.
You can provide a unique perspective on the technology in the context of current clinical practice that is not typically available from the published literature.
To help you give your views, please use this questionnaire. You do not have to answer every question – they are prompts to guide you. The text boxes will expand as you type.
Information on completing this submission
Please do not embed documents (such as a PDF) in a submission because this may lead to the information being mislaid or make the submission unreadable
We are committed to meeting the requirements of copyright legislation. If you intend to include journal articles in your submission you must have copyright clearance for these articles. We can accept journal articles in NICE Docs.
Your response should not be longer than 13 pages.
About you
1. Your name XXXXXXXXXXXXXXXXXXXXXXXXXXXXXXXXXXXXXXXXXXXXXXXXXXXXXXXXXXXX XXXXXXXXXXXXXXXXXXXX
2. Name of organisation British Society of Gastroenterology

Professional organisation submission Naldemedine for treating opioid-induced constipation [ID1189] 2 of 21
3. Job title or position XXXXXXXXXXXXXXXXXXXXXXXXXXXXXXXXXXXXXXXXXXXXXXXXXXXXXXXXXX XXXXXXX
4. Are you (please tick all that
apply): x an employee or representative of a healthcare professional organisation that represents clinicians?
x a specialist in the treatment of people with this condition?
x a specialist in the clinical evidence base for this condition or technology?
other (please specify):
5a. Brief description of the
organisation (including who
funds it).
5b. Do you have any direct or
indirect links with, or funding
from, the tobacco industry?
No
The aim of treatment for this condition
6. What is the main aim of
treatment? (For example, to
stop progression, to improve
mobility, to cure the condition,
Reduction in the problematic symptoms of constipation related to concomitant opioid prescriptions.

Professional organisation submission Naldemedine for treating opioid-induced constipation [ID1189] 3 of 21
or prevent progression or
disability.)
7. What do you consider a
clinically significant treatment
response? (For example, a
reduction in tumour size by
x cm, or a reduction in disease
activity by a certain amount.)
Although a plethora of patient reported outcome measures are available, such as the patient assessment of constipation symptoms (PAC-SYM),(Slappendel, Simpson et al. 2006) patient assessment of constipation quality of life (PAC-QoL)(Marquis, De La Loge et al. 2005) and the Knowles Eccersley Scott Symptom Score,(Knowles, Eccersley et al. 2000) many of these are too cumbersome for routine clinical practice.(Argoff, Brennan et al. 2015) However, the Bristol Stool Form scale (BSFS) and the Bowel Function Index (BFI) are simple, brief and validated questionnaires that can be a useful adjunct to standard clinical evaluation as well as providing an objective assessment of treatment response. The BSFS evaluates stool consistency is a widely used tool which pictorially describes stool ranging from type 7 to type 1, with the latter representing separate hard lumps of stool.(Lewis and Heaton 1997) BSFS type 1 and 2 would be consistent with, but not specific for, OIC.
Other aspects of OIC can be assessed using the BFI, which contains three items evaluating the wider scope of OIC symptoms over the preceding week. These three items include ease of defecation, feeling of incomplete bowel evacuation and the patient’s own view of their constipation. Each are rated on a numerical scale from 0–100, giving a total combined score of 300, which is then divided by 3 to give an overall score out of 100 (Rentz, Yu et al. 2009). Overall scores greater than 30 are consistent with OIC, and a change in score of ≥12 points represent a clinically meaningful change following an intervention.(Rentz, Yu et al. 2009,

Professional organisation submission Naldemedine for treating opioid-induced constipation [ID1189] 4 of 21
Ueberall, Muller-Lissner et al. 2011, Argoff, Brennan et al. 2015). The BFI is easy to use in routine clinical practice.
8. In your view, is there an
unmet need for patients and There is an unmet need in terms of identification but current treatment options need to be used in a sequential step wise manner with input from a wider multidisciplinary team.

Professional organisation submission Naldemedine for treating opioid-induced constipation [ID1189] 5 of 21
healthcare professionals in this
condition?
What is the expected place of the technology in current practice?
9. How is the condition
currently treated in the NHS? Opioids are a class of potent analgesics, whose use has increased markedly in recent years.(Vadivelu, Kai et al. 2018) Although opioids are potent analgesics, they are not a panacea for all types of pain, and must be used appropriately in selected and supervised pain patients as part of a comprehensive, multi-modal, multi-disciplinary approach to treatment.4 More importantly, they are associated with a variety of bothersome side effects such as sedation, lethargy and pruritus notwithstanding the considerable risk of addiction.(Benyamin, Trescot et al. 2008, O'Brien, Christrup et al. 2017) Opioids also adversely impact the sensorimotor function of the gastrointestinal (GI) tract, via the action of exogenous opioid agonists, on the enteric nervous system (ENS).(Moore and McQuay 2005, Lee and Hasler 2016) Such adverse effects limit dose escalation and can necessitate a switch in opioids or even cessation of therapy.(Porreca and Ossipov 2009, Lee and Hasler 2016) The term opioid-induced bowel dysfunction (OIBD) encompasses a spectrum of symptoms including nausea, vomiting, bloating, gastro-oesophageal reflux-related symptoms and constipation.(Brock, Olesen et al. 2012, Ketwaroo, Cheng et al. 2013)
Opioid-induced constipation (OIC) is the most common subtype of OIBD that occurs in 51-87% of patients receiving opioids for cancer and between 41-57% patients receiving opioids for chronic non-cancer pain.(Glare, Walsh et al. 2006, Tuteja, Biskupiak et al. 2010, Drewes, Munkholm et al. 2016) OIC is associated with reduced work productivity, a decrease in quality of life and increased healthcare utilisation.(Bell, Annunziata et al. 2009) OIC is often under-recognised and likely to be more troubling in younger rather than older patients.(Ducrotte, Milce et al. 2017, Gupta, Coyne et al. 2018). The Rome process has sought to systematise the definition of OIC, building upon previous proposals.(Gaertner, Siemens et al. 2015) The Rome IV criteria define OIC as new, or escalating, symptoms of constipation when initiating,

Professional organisation submission Naldemedine for treating opioid-induced constipation [ID1189] 6 of 21
changing or increasing opioid therapy with further clinical features, such as sensation of incomplete evacuation and fewer than three spontaneous bowel movements per week .(Mearin, Lacy et al. 2016).
General measures Prophylactic treatment of OIC with laxatives can be considered, although there is minimal evidence to support this view.(Plaisance and Ellis 2002, Ishihara, Ikesue et al. 2012, Muller-Lissner, Bassotti et al. 2016) However, more often than not laxatives are not co-prescribed; for instance, a Norwegian community study found that only 30% of cancer patients receiving opioids had a laxative co-prescription.(Skollerud, Fredheim et al. 2013) Clearly, there is a role for the clinician commencing, changing or escalating the opioid to warn patients that constipation is a recognised side effect, although many patients never receive, or do not recall, this advice.(Pottegård, Knudsen et al. 2014) Initial general measures include patient education, examining lifestyle factors (fluid intake and activity) and where possible identifying and modifying concurrent medications (such as iron supplements, calcium channel blockers, anti-cholinergic agents, 5-hydroxytryptamine (5-HT)3 receptor antagonists or diuretics) which may exacerbate OIC. In some cases, switching the opioid or changing the route of administration can be useful. For example, tapentadol, a mixed opioid agonist and noradrenaline reuptake inhibitor, is associated with less constipation than oxycodone.(Baron, Eberhart et al. 2017) In addition, the incidence of OIC may be numerically less with transcutaneous preparations of fentanyl in comparison to equipotent doses of oral morphine.(Tassinari, Sartori et al. 2008) Standard laxatives Standard laxatives, such as osmotic agents (macrogol) and stimulants (bisacodyl, picosulphate and senna) are good first line choices in the management of OIC. Additionally, a recent study reported that laxative side effects, such as gas, bloating/fullness and defaecatory urgency, are seen in up to 75% of patients and are more common in those under 40 years of age.(Emmanuel, Johnson et al. 2017) Non-absorbable sugars, such as lactulose, can be fermented within the colon and exacerbate bloating and distension in OIC.(Basilisco, Marino et al. 2003) Mu-opioid receptor antagonists Opioid receptor antagonists can alleviate the adverse effects of opioids on GI functions, but their central analgesic effects may also be antagonised if they cross the blood-brain barrier.(Liu and Wittbrodt 2002) The most readily well-known example is naloxone, commonly used as an intravenous reversal agent in the

Professional organisation submission Naldemedine for treating opioid-induced constipation [ID1189] 7 of 21
context of opioid over-dosing. Agents that block µ-opioid receptors in the GI tract, but do not enter the CNS, are expected to treat OIBD without diminishing central analgesic actions. Several opioid antagonists with local action within the gut or peripherally-acting (outside the central nervous system) µ-opioid receptor antagonists (PAMORAs) have become available and others are being developed. These have been shown to be safe and effective in treating OIC.(Nee, Zakari et al. 2018) Naloxegol Naloxegol is a pegylated derivative of naloxone. Pegylation induces P-glycoprotein transporter-substrate properties, thereby enhancing bio-availability and preventing passage across the blood-brain barrier. Two randomised, placebo-controlled, double blind, parallel group, multicentre, phase 3 trials in OIC patients with non-cancer pain demonstrated that naloxegol 25 mg was superior to placebo in achieving the primary response endpoint.(Chey, Webster et al. 2014) The primary endpoint of the study was proportion of responders, defined as having ≥9 positive response weeks in the 12-week treatment period and ≥3 in the last 4 weeks of the 12-week treatment period. Naloxegol 25 mg also resulted in greater improvements in straining, stool consistency, and frequency of days with complete spontaneous bowel movements compared to placebo. Significant benefit was also observed for several of the secondary endpoints with the 12.5 mg dose, but the primary endpoint was reached with the 12.5 mg dose in only one of the studies. In a 52-week, multicentre, open-label, randomised, parallel-group study, naloxegol 25 mg was found to be generally safe and well tolerated.(Webster, Dhar et al. 2013) The most side effects were early-onset abdominal pain, diarrhoea and nausea, mostly mild to moderate in intensity, and transient after the first days.(Webster, Dhar et al. 2013, Chey, Webster et al. 2014, Webster, Chey et al. 2014) Naloxegol has been approved for OIC by the EMA and in non-cancer OIC by the FDA. In comparison to placebo, the incremental cost-effectiveness ratio of naloxone is £10,800 per quality adjusted life year gained. (Excellence 2015). Naldemedine Naldemedine is the newest orally available PAMORA, approved by the FDA for the treatment of OIC in adult patients. Two randomised controlled phase 3 trials in OIC subjects with chronic non-cancer pain showed that naldemedine 0.2 mg was superior to placebo in increasing the number of bowel movements over baseline.(Hale, Wild et al. 2017) The primary responder endpoint of the study was reached in 47.6% compared to 34.6% (p=0.002), and 52.5% compared to 33.6% (p<0.0001) of the subjects with naldemedine versus placebo respectively in the COMPOSE I and II trial. A significant increase in spontaneous bowel

Professional organisation submission Naldemedine for treating opioid-induced constipation [ID1189] 8 of 21
movement frequency occurred during the first week of active treatment in both trials. The prevalence of GI-related adverse effects such as diarrhoea, nausea and abdominal pain were more prevalent in the naldemedine group but were mild to moderate in nature. In addition, there were no significant occurrences of opioid withdrawal symptoms or interference with the analgesic efficacy of opioids. A 52-week placebo-controlled study, COMPOSE III, was also conducted with 1,246 patients randomised to either placebo or naldemedine 0.2 mg daily. Efficacy was evaluated with the PAC-SYM and PAC-QOL questionnaires at baseline, 2, 12, 24, 36 and 52 weeks.(Tack, Camilleri et al. 2017) Naldemedine resulted in significant increase in spontaneous bowel movements and significant improvement over placebo in all the subscales of the symptom and in quality of life questionnaires at all time points. The adverse event profile and incidence were similar to that observed in the COMPOSE I and II trials. Naldemedine 0.2 mg was also studied in a 2-week controlled trial in 193 cancer patients with OIC (COMPOSE IV).(Katakami, Harada et al. 2017) The proportion of spontaneous bowel movements responders ((≥3 spontaneous bowel movements per week with an increase of ≥1 spontaneous bowel movements per week over baseline) was significantly greater with naldemedine (71.1% vs. 34.4%, p< 0.0001). The study was followed by a 12-week open-label extension safety trial (COMPOSE V). Adverse event profile and incidence were similar to previous studies in non-cancer patients.(Katakami, Harada et al. 2017)

Professional organisation submission Naldemedine for treating opioid-induced constipation [ID1189] 9 of 21
Are any clinical guidelines used in the treatment of the condition, and if so, which?
Farmer et al. Pathophysiology and management of opioid-induced constipation: European expert consensus statement. UEG Journal 2019.
Is the pathway of care
well defined? Does it vary or are there differences of opinion between professionals
Although the pathway of management is well defined, OIC is an under-recognised disorder, despite it being a common side effect of opioids.

Professional organisation submission Naldemedine for treating opioid-induced constipation [ID1189] 10 of 21
across the NHS? (Please state if your experience is from outside England.)
What impact would the technology have on the current pathway of care?
Naldemedine would be a useful addition to the therapeutic armamentarium to treat OIC. Notably there is evidence in patients with OIC related to cancer pain (I understand studies are on-going to assess naloxegol in this regard). There is no evidence to suggest that the pathophysiology of OIC differs in cancer pain. Vs non cancer pain.
10. Will the technology be
used (or is it already used) in
the same way as current care
in NHS clinical practice?
This will be an additional option.
How does healthcare resource use differ between the technology and current care?
No difference.
In what clinical setting should the technology be used? (For example, primary or secondary care, specialist clinics.)
I would suggest that naldemedine is initiated by specialists with an early review after 1 month of treatment. An objective assessment can be made with the BFI and if there is an objective response it can be continued, and its efficacy periodically, reviewed by the GP.
What investment is needed to introduce the technology? (For
None
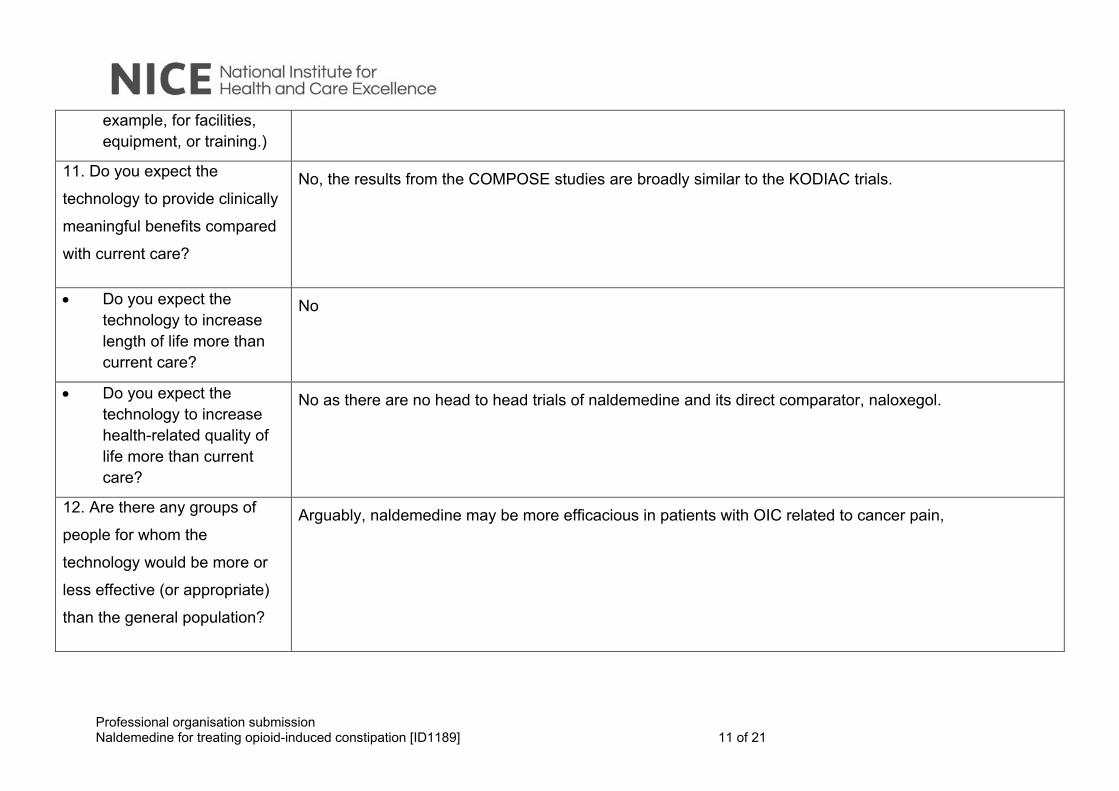
Professional organisation submission Naldemedine for treating opioid-induced constipation [ID1189] 11 of 21
example, for facilities, equipment, or training.)
11. Do you expect the
technology to provide clinically
meaningful benefits compared
with current care?
No, the results from the COMPOSE studies are broadly similar to the KODIAC trials.
Do you expect the technology to increase length of life more than current care?
No
Do you expect the technology to increase health-related quality of life more than current care?
No as there are no head to head trials of naldemedine and its direct comparator, naloxegol.
12. Are there any groups of
people for whom the
technology would be more or
less effective (or appropriate)
than the general population?
Arguably, naldemedine may be more efficacious in patients with OIC related to cancer pain,
Professional organisation submission Naldemedine for treating opioid-induced constipation [ID1189] 12 of 21
The use of the technology
13. Will the technology be
easier or more difficult to use
for patients or healthcare
professionals than current
care? Are there any practical
implications for its use (for
example, any concomitant
treatments needed, additional
clinical requirements, factors
affecting patient acceptability
or ease of use or additional
tests or monitoring needed.)
No
14. Will any rules (informal or
formal) be used to start or stop
treatment with the technology?
Do these include any
additional testing?
Assessment with the BFI at initiation and periodically thereafter would provide an objective outcome as to
relative efficacy.

Professional organisation submission Naldemedine for treating opioid-induced constipation [ID1189] 13 of 21
15. Do you consider that the
use of the technology will
result in any substantial health-
related benefits that are
unlikely to be included in the
quality-adjusted life year
(QALY) calculation?
Reduction in the burden of constipation which has a significant detrimental impact on QoL.
16. Do you consider the
technology to be innovative in
its potential to make a
significant and substantial
impact on health-related
benefits and how might it
improve the way that current
need is met?
PAMORAs are innovative in terms of their MOA.
Is the technology a ‘step-change’ in the management of the condition?
No
Does the use of the technology address any
Patients with OIC related to cancer pain.

Professional organisation submission Naldemedine for treating opioid-induced constipation [ID1189] 14 of 21
particular unmet need of the patient population?
17. How do any side effects or
adverse effects of the
technology affect the
management of the condition
and the patient’s quality of life?
No
Sources of evidence
18. Do the clinical trials on the
technology reflect current UK
clinical practice?
Yes
If not, how could the results be extrapolated to the UK setting?
What, in your view, are the most important outcomes, and were they measured in the trials?
If surrogate outcome measures were used, do they adequately predict

Professional organisation submission Naldemedine for treating opioid-induced constipation [ID1189] 15 of 21
long-term clinical outcomes?
Are there any adverse effects that were not apparent in clinical trials but have come to light subsequently?
19. Are you aware of any
relevant evidence that might
not be found by a systematic
review of the trial evidence?
No
20. Are you aware of any new
evidence for the comparator
treatment(s) since the
publication of NICE technology
appraisal guidance [TAXXX]?
[delete if there is no NICE
guidance for the comparator(s)
and renumber subsequent
sections]
I am not aware of any comparator evidence (e.g. naloxegol vs naldemedine).
Professional organisation submission Naldemedine for treating opioid-induced constipation [ID1189] 16 of 21
21. How do data on real-world
experience compare with the
trial data?
Given the mandated composite primary endpoints the real world experience for naloxegol is comparative to
the clinical trials. I am not aware of any real world data with naldemedine as yet.
Equality
22a. Are there any potential
equality issues that should be
taken into account when
considering this treatment?
No
22b. Consider whether these
issues are different from issues
with current care and why.
N/a
Topic-specific questions
23 [To be added by technical
team at scope sign off. Note
that topic-specific questions
will be added only if the
treatment pathway or likely use
of the technology remains

Professional organisation submission Naldemedine for treating opioid-induced constipation [ID1189] 17 of 21
uncertain after scoping
consultation, for example if
there were differences in
opinion; this is not expected to
be required for every
appraisal.]
if there are none delete
highlighted rows and
renumber below
Key messages
24. In up to 5 bullet points, please summarise the key messages of your submission.
Thank you for your time. Please log in to your NICE Docs account to upload your completed submission.
………………………………………………………………………………………………….

Professional organisation submission Naldemedine for treating opioid-induced constipation [ID1189] 18 of 21
Your privacy
The information that you provide on this form will be used to contact you about the topic above.
Please tick this box if you would like to receive information about other NICE topics.
For more information about how we process your personal data please see our privacy notice.
…………………………………………………………………………………………………. Argoff, C. E., M. J. Brennan, M. Camilleri, A. Davies, J. Fudin, K. E. Galluzzi, J. Gudin, A. Lembo, S. P. Stanos and L. R. Webster (2015). "Consensus Recommendations on Initiating Prescription Therapies for Opioid-Induced Constipation." Pain Med 16(12): 2324-2337. Baron, R., L. Eberhart, K. U. Kern, S. Regner, R. Rolke, C. Simanski and T. Tolle (2017). "Tapentadol Prolonged Release for Chronic Pain: A Review of Clinical Trials and 5 Years of Routine Clinical Practice Data." Pain Pract 17(5): 678-700. Basilisco, G., B. Marino, L. Passerini and C. Ogliari (2003). "Abdominal distension after colonic lactulose fermentation recorded by a new extensometer." Neurogastroenterol Motil 15(4): 427-433. Bell, T., K. Annunziata and J. B. Leslie (2009). "Opioid-induced constipation negatively impacts pain management, productivity, and health-related quality of life: findings from the National Health and Wellness Survey." J Opioid Manag 5(3): 137-144. Benyamin, R., A. M. Trescot, S. Datta, R. Buenaventura, R. Adlaka, N. Sehgal, S. E. Glaser and R. Vallejo (2008). "Opioid complications and side effects." Pain physician 11(2 Suppl): S105-120. Brock, C., S. S. Olesen, A. E. Olesen, J. B. Frokjaer, T. Andresen and A. M. Drewes (2012). "Opioid-induced bowel dysfunction: pathophysiology and management." Drugs 72(14): 1847-1865. Chey, W. D., L. Webster, M. Sostek, J. Lappalainen, P. N. Barker and J. Tack (2014). "Naloxegol for opioid-induced constipation in patients with noncancer pain." N Engl J Med 370(25): 2387-2396. Drewes, A. M., P. Munkholm, M. Simren, H. Breivik, U. E. Kongsgaard, J. G. Hatlebakk, L. Agreus, M. Friedrichsen and L. L. Christrup (2016). "Definition, diagnosis and treatment strategies for opioid-induced bowel dysfunction-Recommendations of the Nordic Working Group." Scand J Pain 11: 111-122. Ducrotte, P., J. Milce, C. Soufflet and C. Fabry (2017). "Prevalence and clinical features of opioid-induced constipation in the general population: A French study of 15,000 individuals." United European Gastroenterol J 5(4): 588-600. Emmanuel, A., M. Johnson, P. McSkimming and S. Dickerson (2017). "Laxatives Do Not Improve Symptoms of Opioid-Induced Constipation: Results of a Patient Survey." Pain Med 18(10): 1932-1940.
Professional organisation submission Naldemedine for treating opioid-induced constipation [ID1189] 19 of 21
Excellence, N. I. o. H. a. C. (2015). "Naloxegol for treating opioid-induced constipation - Final appraisal determination." from https://www.nice.org.uk/guidance/ta345/documents/constipation-opioidinduced-naloxegol-final-appraisal-determination-document2. Gaertner, J., W. Siemens, M. Camilleri, A. Davies, D. A. Drossman, L. R. Webster and G. Becker (2015). "Definitions and outcome measures of clinical trials regarding opioid-induced constipation: a systematic review." J Clin Gastroenterol 49(1): 9-16. Glare, P., D. Walsh and D. Sheehan (2006). "The adverse effects of morphine: a prospective survey of common symptoms during repeated dosing for chronic cancer pain." Am J Hosp Palliat Care 23(3): 229-235. Gupta, A., K. S. Coyne, C. Datto and C. Venuti (2018). "The Burden of Opioid-Induced Constipation in Younger Patients with Chronic Noncancer Pain." Pain Med. Hale, M., J. Wild, J. Reddy, T. Yamada and J. C. Arjona Ferreira (2017). "Naldemedine versus placebo for opioid-induced constipation (COMPOSE-1 and COMPOSE-2): two multicentre, phase 3, double-blind, randomised, parallel-group trials." Lancet Gastroenterol Hepatol 2(8): 555-564. Ishihara, M., H. Ikesue, H. Matsunaga, K. Suemaru, K. Kitaichi, K. Suetsugu, R. Oishi, T. Sendo, H. Araki, Y. Itoh and D. Japanese Study Group for the Relief of Opioid-induced Gastrointestinal (2012). "A multi-institutional study analyzing effect of prophylactic medication for prevention of opioid-induced gastrointestinal dysfunction." Clin J Pain 28(5): 373-381. Katakami, N., T. Harada, T. Murata, K. Shinozaki, M. Tsutsumi, T. Yokota, M. Arai, Y. Tada, M. Narabayashi and N. Boku (2017). "Randomized Phase III and Extension Studies of Naldemedine in Patients With Opioid-Induced Constipation and Cancer." J Clin Oncol 35(34): 3859-3866. Ketwaroo, G. A., V. Cheng and A. Lembo (2013). "Opioid-induced bowel dysfunction." Curr Gastroenterol Rep 15(9): 344. Knowles, C. H., A. J. Eccersley, S. M. Scott, S. M. Walker, B. Reeves and P. J. Lunniss (2000). "Linear discriminant analysis of symptoms in patients with chronic constipation: validation of a new scoring system (KESS)." Dis Colon Rectum 43(10): 1419-1426. Lee, A. A. and W. L. Hasler (2016). "Opioids and GI Motility-Friend or Foe?" Curr Treat Options Gastroenterol 14(4): 478-494. Lewis, S. J. and K. W. Heaton (1997). "Stool form scale as a useful guide to intestinal transit time." Scand J Gastroenterol 32(9): 920-924. Liu, M. and E. Wittbrodt (2002). "Low-dose oral naloxone reverses opioid-induced constipation and analgesia." J Pain Symptom Manage 23(1): 48-53. Marquis, P., C. De La Loge, D. Dubois, A. McDermott and O. Chassany (2005). "Development and validation of the Patient Assessment of Constipation Quality of Life questionnaire." Scand J Gastroenterol 40(5): 540-551. Mearin, F., B. E. Lacy, L. Chang, W. D. Chey, A. J. Lembo, M. Simren and R. Spiller (2016). "Bowel Disorders." Gastroenterology. Moore, R. A. and H. J. McQuay (2005). "Prevalence of opioid adverse events in chronic non-malignant pain: systematic review of randomised trials of oral opioids." Arthritis Res Ther 7(5): R1046-1051. Muller-Lissner, S., G. Bassotti, B. Coffin, A. M. Drewes, H. Breivik, E. Eisenberg, A. Emmanuel, F. Laroche, W. Meissner and B. Morlion (2016). "Opioid-Induced Constipation and Bowel Dysfunction: A Clinical Guideline." Pain Med.

Professional organisation submission Naldemedine for treating opioid-induced constipation [ID1189] 20 of 21
Nee, J., M. Zakari, M. A. Sugarman, J. Whelan, W. Hirsch, S. Sultan, S. Ballou, J. Iturrino and A. Lembo (2018). "Efficacy of Treatments for Opioid-induced Constipation: A Systematic Review and Meta-Analysis." Clin Gastroenterol Hepatol. O'Brien, T., L. L. Christrup, A. M. Drewes, M. T. Fallon, H. G. Kress, H. J. McQuay, G. Mikus, B. J. Morlion, J. Perez-Cajaraville, E. Pogatzki-Zahn, G. Varrassi and J. C. Wells (2017). "European Pain Federation position paper on appropriate opioid use in chronic pain management." Eur J Pain 21(1): 3-19. Plaisance, L. and J. A. Ellis (2002). "Opioid-induced constipation. Management is necessary but prevention is better." Am J Nurs 102(3): 72-73. Porreca, F. and M. H. Ossipov (2009). "Nausea and vomiting side effects with opioid analgesics during treatment of chronic pain: mechanisms, implications, and management options." Pain Med 10(4): 654-662. Pottegård, A., T. Knudsen, K. van Heesch, H. Salmasi, S. Schytte-Hansen and J. Søndergaard (2014). "Information on risk of constipation for Danish users of opioids, and their laxative use." International Journal of Clinical Pharmacology 34(2): 3. Rentz, A. M., R. Yu, S. Muller-Lissner and P. Leyendecker (2009). "Validation of the Bowel Function Index to detect clinically meaningful changes in opioid-induced constipation." J Med Econ 12(4): 371-383. Skollerud, L. M., O. M. Fredheim, K. Svendsen, S. Skurtveit and P. C. Borchgrevink (2013). "Laxative prescriptions to cancer outpatients receiving opioids: a study from the Norwegian prescription database." Support Care Cancer 21(1): 67-73. Slappendel, R., K. Simpson, D. Dubois and D. L. Keininger (2006). "Validation of the PAC-SYM questionnaire for opioid-induced constipation in patients with chronic low back pain." Eur J Pain 10(3): 209-217. Tack, J., M. Camilleri, B. Cai, T. Yamada and A. Ferreira (2017). "OP284 Patient-reported outcomes with naldemedine long-term treatment of opioid-induced constipation in subjects with chronic non-cancer pain." UEG Journal 5(5S): A121. Tassinari, D., S. Sartori, E. Tamburini, E. Scarpi, W. Raffaeli, P. Tombesi and M. Maltoni (2008). "Adverse effects of transdermal opiates treating moderate-severe cancer pain in comparison to long-acting morphine: a meta-analysis and systematic review of the literature." J Palliat Med 11(3): 492-501. Tuteja, A. K., J. Biskupiak, G. J. Stoddard and A. G. Lipman (2010). "Opioid-induced bowel disorders and narcotic bowel syndrome in patients with chronic non-cancer pain." Neurogastroenterol Motil 22(4): 424-430, e496. Ueberall, M. A., S. Muller-Lissner, C. Buschmann-Kramm and B. Bosse (2011). "The Bowel Function Index for evaluating constipation in pain patients: definition of a reference range for a non-constipated population of pain patients." J Int Med Res 39(1): 41-50. Vadivelu, N., A. M. Kai, V. Kodumudi, J. Sramcik and A. D. Kaye (2018). "The Opioid Crisis: a Comprehensive Overview." Curr Pain Headache Rep 22(3): 16. Webster, L., W. D. Chey, J. Tack, J. Lappalainen, U. Diva and M. Sostek (2014). "Randomised clinical trial: the long-term safety and tolerability of naloxegol in patients with pain and opioid-induced constipation." Aliment Pharmacol Ther 40(7): 771-779.

Professional organisation submission Naldemedine for treating opioid-induced constipation [ID1189] 21 of 21
Webster, L., S. Dhar, M. Eldon, L. Masuoka, J. Lappalainen and M. Sostek (2013). "A phase 2, double-blind, randomized, placebo-controlled, dose-escalation study to evaluate the efficacy, safety, and tolerability of naloxegol in patients with opioid-induced constipation." Pain 154(9): 1542-1550.
Clinical expert statement Naldemedine for treating opioid-induced constipation [ID1189] 1 of 12
Clinical expert statement
Naldemedine for treating opioid-induced constipation [ID1189]
Thank you for agreeing to give us your views on this technology and its possible use in the NHS.
You can provide a unique perspective on the technology in the context of current clinical practice that is not typically available from the published literature.
To help you give your views, please use this questionnaire. You do not have to answer every question – they are prompts to guide you. The text boxes will expand as you type.
Information on completing this expert statement
Please do not embed documents (such as a PDF) in a submission because this may lead to the information being mislaid or make the submission unreadable
We are committed to meeting the requirements of copyright legislation. If you intend to include journal articles in your submission you must have copyright clearance for these articles. We can accept journal articles in NICE Docs.
Your response should not be longer than 13 pages.
About you
1. Your name Dr Andrew Davies
2. Name of organisation Royal Surrey County Hospital
Clinical expert statement Naldemedine for treating opioid-induced constipation [ID1189] 2 of 12
3. Job title or position Consultant in Palliative Medicine
4. Are you (please tick all that
apply): an employee or representative of a healthcare professional organisation that represents clinicians?
a specialist in the treatment of people with this condition?
a specialist in the clinical evidence base for this condition or technology?
other (please specify):
5. Do you wish to agree with
your nominating organisation’s
submission? (We would
encourage you to complete
this form even if you agree with
your nominating organisation’s
submission)
yes, I agree with it
no, I disagree with it
I agree with some of it, but disagree with some of it
other (they didn‘t submit one, I don’t know if they submitted one etc.)
6. If you wrote the organisation
submission and/ or do not
have anything to add, tick
here. (If you tick this box, the
rest of this form will be deleted
after submission.)
yes

Clinical expert statement Naldemedine for treating opioid-induced constipation [ID1189] 3 of 12
The aim of treatment for this condition
7. What is the main aim of
treatment? (For example, to
stop progression, to improve
mobility, to cure the condition,
or prevent progression or
disability.)
Manage opioid-induced constipation
8. What do you consider a
clinically significant treatment
response? (For example, a
reduction in tumour size by
x cm, or a reduction in disease
activity by a certain amount.)
Return to normal / pre-opioid bowel function
Bowel Function Index < 30 (/100)
Absence of Rome IV criteria for opioid-induced constipation – straining, lumpy or hard stool, sensation of incomplete evacuation; sensation of anorectal obstruction / blockage, need to use “manual manoeuvres” to assist with defaecation.
9. In your view, is there an
unmet need for patients and
healthcare professionals in this
condition?
Many patients with opioid-induced constipation are undiagnosed, and if diagnosed are under-treated (i.e. with conventional laxatives). PAMORAs are effective for treating opioid-induced constipation, but are infrequently utilised (despite the lack of efficacy of conventional laxatives, and despite the positive NICE technology appraisal for naloxegol)

Clinical expert statement Naldemedine for treating opioid-induced constipation [ID1189] 4 of 12
What is the expected place of the technology in current practice?
10. How is the condition
currently treated in the NHS? Most patients are treated with conventional laxatives, which are relatively ineffective in opioid-induced constipation. A minority of patients are treated with other peripherally acting mu opioid receptor antagonists (PAMORAs), e.g. naloxegol, methylnaltrexone (which are somewhat effective in pure opioid-induced constipation)
Are any clinical guidelines used in the treatment of the condition, and if so, which?
There are no UK specific guidelines – various international consensus guidelines have been published (e.g. ESMO guidelines for cancer patients; MASCC guidelines for cancer patients)
Is the pathway of care well defined? Does it vary or are there differences of opinion between professionals across the NHS? (Please state if your experience is from outside England.)
There is no well-defined pathway in the UK (as there are no UK specific guidelines - see above).
Treatment is extremely variable across the country (and within localities): conventional laxatives are usually used as first (and second) line treatments; PAMORAs are often used third or fourth line (after conventional laxatives, combinations of conventional laxatives, and rectal interventions)
What impact would the technology have on the current pathway of care?
A positive outcome would increase the profile of PAMORAs, and (hopefully) ensure that more patients with laxative inadequate responses receive PAMORAs. This would result in positive benefits for patients, and positive benefits for the NHS (as a result of the improvement in management of opioid-induced constipation)
11. Will the technology be
used (or is it already used) in Currently, the product is not available in the UK. (Other PAMORAs are available in the UK)

Clinical expert statement Naldemedine for treating opioid-induced constipation [ID1189] 5 of 12
the same way as current care
in NHS clinical practice?
How does healthcare resource use differ between the technology and current care?
Unknown (see above0
In what clinical setting should the technology be used? (For example, primary or secondary care, specialist clinics.)
All settings (as opioid-induced constipation is a significant clinical problem in all settings)
What investment is needed to introduce the technology? (For example, for facilities, equipment, or training.)
No specific training / equipment will be required (oral preparation)
12. Do you expect the
technology to provide clinically
meaningful benefits compared
with current care?
The product has significant benefits over conventional laxatives – there is no comparative data with other PAMORAs
Do you expect the technology to increase
N/A

Clinical expert statement Naldemedine for treating opioid-induced constipation [ID1189] 6 of 12
length of life more than current care?
Do you expect the technology to increase health-related quality of life more than current care?
Yes (vs conventional laxatives)
13. Are there any groups of
people for whom the
technology would be more or
less effective (or appropriate)
than the general population?
PAMORAs are avoided in patients with certain gastrointestinal pathologies (due to concerns about gastrointestinal perforation)
The use of the technology
14. Will the technology be
easier or more difficult to use
for patients or healthcare
professionals than current
care? Are there any practical
implications for its use (for
example, any concomitant
The product is easy to use (oral preparation), and there are no practical implications for its use (or non-
use). [There are some contra-indications to the use of PAMORAs, e.g. certain gastrointestinal pathologies]

Clinical expert statement Naldemedine for treating opioid-induced constipation [ID1189] 7 of 12
treatments needed, additional
clinical requirements, factors
affecting patient acceptability
or ease of use or additional
tests or monitoring needed.)
15. Will any rules (informal or
formal) be used to start or stop
treatment with the technology?
Do these include any
additional testing?
As with all drugs, there should be a therapeutic trial, and if the product is ineffective, or the product is poorly
tolerated, then the product should be discontinued. (No specific rules need apply to this product)
16. Do you consider that the
use of the technology will
result in any substantial health-
related benefits that are
unlikely to be included in the
quality-adjusted life year
(QALY) calculation?
(The product may result in improvements in other opioid-related adverse effects)

Clinical expert statement Naldemedine for treating opioid-induced constipation [ID1189] 8 of 12
17. Do you consider the
technology to be innovative in
its potential to make a
significant and substantial
impact on health-related
benefits and how might it
improve the way that current
need is met?
The PAMORAs are innovative, but it is unclear whether there are clinically significant differences between
the PAMORAs (as there have been no head-to-head comparisons).
Is the technology a ‘step-change’ in the management of the condition?
PAMORAs are a definite “step change” in the management of opioid-induced constipation
Does the use of the technology address any particular unmet need of the patient population?
Yes – many patients with opioid-induced constipation are undertreated, or a receiving treatment that is not
well tolerated (i.e. conventional laxatives)
18. How do any side effects or
adverse effects of the
technology affect the
management of the condition
and the patient’s quality of life?
The product appears to be generally well tolerated, and adverse effects are generally reversible (and not
severe in intensity)

Clinical expert statement Naldemedine for treating opioid-induced constipation [ID1189] 9 of 12
Sources of evidence
19. Do the clinical trials on the
technology reflect current UK
clinical practice?
The pivotal studies were placebo controlled (rather than active controlled, i.e. PAMORA versus
conventional laxative)
If not, how could the results be extrapolated to the UK setting?
(The pivotal studies were conducted in Japan, but there is nothing to suggest that the condition is different
in this population, or that this population would respond in a different manner to a UK population)
What, in your view, are the most important outcomes, and were they measured in the trials?
See above. Spontaneous bowel movements are a valid endpoint, but other endpoints may be equally valid
(and more important in certain patients, e.g. straining)
If surrogate outcome measures were used, do they adequately predict long-term clinical outcomes?
N/A
Are there any adverse effects that were not apparent in clinical trials but have come to light subsequently?
No (to my knowledge)

Clinical expert statement Naldemedine for treating opioid-induced constipation [ID1189] 10 of 12
20. Are you aware of any
relevant evidence that might
not be found by a systematic
review of the trial evidence?
No
21. Are you aware of any new
evidence for the comparator
treatment(s) since the
publication of NICE technology
appraisal guidance TA345?
Several studies have been initiated with naloxegol since the publication of the relevant technology
appraisal, but I am not sure that the data so far presented adds anything to that appraisal, or indeed to this
appraisal. (A number of studies are ongoing, and results are expected to be presented / published in 2020)
22. How do data on real-world
experience compare with the
trial data?
In the real world many patients have mixed aetiology constipation, and so need a PAMORA to manage
their opioid-induced constipation, and a conventional laxative to manage the other type of constipation
Equality
23a. Are there any potential
equality issues that should be
taken into account when
considering this treatment?
No

Clinical expert statement Naldemedine for treating opioid-induced constipation [ID1189] 11 of 12
23b. Consider whether these
issues are different from issues
with current care and why.
N/A
Topic-specific questions
24. Does the cause of pain, for
example non-cancer and
cancer, influence treatment
choice for opioid induced
constipation in current NHS
practice? If so, please explain
why.
No (as far as I can ascertain)
There is no evidence that opioid-induced constipation is in anyway different in cancer patients than in non-
cancer patients (and the NICE naloxegol technology appraisal supported this position)
25. Would you expect
decisions about using the
technology to differ depending
on the cause of pain, for
example non-cancer and
cancer? If so, please explain
why.
No
See above

Clinical expert statement Naldemedine for treating opioid-induced constipation [ID1189] 12 of 12
Key messages
26. In up to 5 bullet points, please summarise the key messages of your statement.
Conventional laxatives are often ineffective in opioid-induced constipation
PAMORAs are often effective (and well tolerated) in opioid-induced constipation
Naldemedine appears to be an effective / well tolerated PAMORA, although there are no head-to-head comparisons with other PAMORAs
Thank you for your time. Please log in to your NICE Docs account to upload your completed statement, declaration of interest form and consent form.
………………………………………………………………………………………………….
Your privacy
The information that you provide on this form will be used to contact you about the topic above.
Please tick this box if you would like to receive information about other NICE topics.
For more information about how we process your personal data please see our privacy notice.
………………………………………………………………………………………………….
Clinical expert statement Naldemedine for treating opioid-induced constipation [ID1189] 1 of 12
Clinical expert statement
Naldemedine for treating opioid-induced constipation [ID1189]
Thank you for agreeing to give us your views on this technology and its possible use in the NHS.
You can provide a unique perspective on the technology in the context of current clinical practice that is not typically available from the published literature.
To help you give your views, please use this questionnaire. You do not have to answer every question – they are prompts to guide you. The text boxes will expand as you type.
Information on completing this expert statement
Please do not embed documents (such as a PDF) in a submission because this may lead to the information being mislaid or make the submission unreadable
We are committed to meeting the requirements of copyright legislation. If you intend to include journal articles in your submission you must have copyright clearance for these articles. We can accept journal articles in NICE Docs.
Your response should not be longer than 13 pages.
About you
1. Your name XXXXXXXXXXX
2. Name of organisation British Society of Gastroenterology

Clinical expert statement Naldemedine for treating opioid-induced constipation [ID1189] 2 of 12
3. Job title or position XXXXXXXXXXXXXXXXXXXXXXXXXXXXXXXXXXXXXXXXXXXXXXXXX
4. Are you (please tick all that
apply): an employee or representative of a healthcare professional organisation that represents clinicians?
a specialist in the treatment of people with this condition?
a specialist in the clinical evidence base for this condition or technology?
other (please specify):
5. Do you wish to agree with
your nominating organisation’s
submission? (We would
encourage you to complete
this form even if you agree with
your nominating organisation’s
submission)
yes, I agree with it
no, I disagree with it
I agree with some of it, but disagree with some of it
other (they didn‘t submit one, I don’t know if they submitted one etc.)
6. If you wrote the organisation
submission and/ or do not
have anything to add, tick
here. (If you tick this box, the
rest of this form will be deleted
after submission.)
x yes

Clinical expert statement Naldemedine for treating opioid-induced constipation [ID1189] 3 of 12
The aim of treatment for this condition
7. What is the main aim of
treatment? (For example, to
stop progression, to improve
mobility, to cure the condition,
or prevent progression or
disability.)
8. What do you consider a
clinically significant treatment
response? (For example, a
reduction in tumour size by
x cm, or a reduction in disease
activity by a certain amount.)
9. In your view, is there an
unmet need for patients and
healthcare professionals in this
condition?
What is the expected place of the technology in current practice?
Clinical expert statement Naldemedine for treating opioid-induced constipation [ID1189] 4 of 12
10. How is the condition
currently treated in the NHS?
Are any clinical guidelines used in the treatment of the condition, and if so, which?
Is the pathway of care well defined? Does it vary or are there differences of opinion between professionals across the NHS? (Please state if your experience is from outside England.)
What impact would the technology have on the current pathway of care?
11. Will the technology be
used (or is it already used) in
the same way as current care
in NHS clinical practice?

Clinical expert statement Naldemedine for treating opioid-induced constipation [ID1189] 5 of 12
How does healthcare resource use differ between the technology and current care?
In what clinical setting should the technology be used? (For example, primary or secondary care, specialist clinics.)
What investment is needed to introduce the technology? (For example, for facilities, equipment, or training.)
12. Do you expect the
technology to provide clinically
meaningful benefits compared
with current care?
Do you expect the technology to increase length of life more than current care?
Clinical expert statement Naldemedine for treating opioid-induced constipation [ID1189] 6 of 12
Do you expect the technology to increase health-related quality of life more than current care?
13. Are there any groups of
people for whom the
technology would be more or
less effective (or appropriate)
than the general population?
The use of the technology
14. Will the technology be
easier or more difficult to use
for patients or healthcare
professionals than current
care? Are there any practical
implications for its use (for
example, any concomitant
treatments needed, additional
clinical requirements, factors

Clinical expert statement Naldemedine for treating opioid-induced constipation [ID1189] 7 of 12
affecting patient acceptability
or ease of use or additional
tests or monitoring needed.)
15. Will any rules (informal or
formal) be used to start or stop
treatment with the technology?
Do these include any
additional testing?
16. Do you consider that the
use of the technology will
result in any substantial health-
related benefits that are
unlikely to be included in the
quality-adjusted life year
(QALY) calculation?
17. Do you consider the
technology to be innovative in
its potential to make a
significant and substantial

Clinical expert statement Naldemedine for treating opioid-induced constipation [ID1189] 8 of 12
impact on health-related
benefits and how might it
improve the way that current
need is met?
Is the technology a ‘step-change’ in the management of the condition?
Does the use of the technology address any particular unmet need of the patient population?
18. How do any side effects or
adverse effects of the
technology affect the
management of the condition
and the patient’s quality of life?
Sources of evidence

Clinical expert statement Naldemedine for treating opioid-induced constipation [ID1189] 9 of 12
19. Do the clinical trials on the
technology reflect current UK
clinical practice?
If not, how could the results be extrapolated to the UK setting?
What, in your view, are the most important outcomes, and were they measured in the trials?
If surrogate outcome measures were used, do they adequately predict long-term clinical outcomes?
Are there any adverse effects that were not apparent in clinical trials but have come to light subsequently?
20. Are you aware of any
relevant evidence that might

Clinical expert statement Naldemedine for treating opioid-induced constipation [ID1189] 10 of 12
not be found by a systematic
review of the trial evidence?
21. Are you aware of any new
evidence for the comparator
treatment(s) since the
publication of NICE technology
appraisal guidance TA345?
22. How do data on real-world
experience compare with the
trial data?
Equality
23a. Are there any potential
equality issues that should be
taken into account when
considering this treatment?

Clinical expert statement Naldemedine for treating opioid-induced constipation [ID1189] 11 of 12
23b. Consider whether these
issues are different from issues
with current care and why.
Topic-specific questions
24. Does the cause of pain, for
example non-cancer and
cancer, influence treatment
choice for opioid induced
constipation in current NHS
practice? If so, please explain
why.
25. Would you expect
decisions about using the
technology to differ depending
on the cause of pain, for
example non-cancer and
cancer? If so, please explain
why.

Clinical expert statement Naldemedine for treating opioid-induced constipation [ID1189] 12 of 12
Key messages
26. In up to 5 bullet points, please summarise the key messages of your statement.
Thank you for your time. Please log in to your NICE Docs account to upload your completed statement, declaration of interest form and consent form.
………………………………………………………………………………………………….
Your privacy
The information that you provide on this form will be used to contact you about the topic above.
Please tick this box if you would like to receive information about other NICE topics.
For more information about how we process your personal data please see our privacy notice.
………………………………………………………………………………………………….

in collaboration with:
Naldemedine for treating opioid-induced constipation
Produced by
Kleijnen Systematic Reviews (KSR) Ltd. in collaboration with Erasmus University Rotterdam (EUR) and Maastricht University
Authors Robert Wolff, Deputy Director, KSR Ltd, UK Pim Wetzelaer, Health Economics Researcher, Erasmus School of Health
Policy and Management, EUR, The Netherlands Tim Kanters, Health Economics Researcher, Institute for Medical
Technology Assessment, EUR, The Netherlands Debra Fayter, Systematic Reviewer, KSR Ltd, UK Heike Raatz, Reviews Manager, KSR Ltd, UK Steve Ryder, Health Economist, KSR Ltd, UK Gill Worthy, Statistician, KSR Ltd, UK Vanesa Huertas Carrera, Systematic Reviewer, KSR Ltd, UK Caro Noake, Information Specialist, KSR Ltd, UK Adam D Farmer, Consultant Gastroenterology and Senior Lecturer,
University Hospitals of North Midlands NHS and Institute of Applied Clinical Sciences, Keele University, UK
Nigel Armstrong, Health Economics Manager, KSR Ltd, UK Maiwenn Al, Health Economics Researcher, Erasmus School of Health
Policy and Management, EUR, The Netherlands Jos Kleijnen, Director, KSR Ltd, UK; Professor of Systematic Reviews
in Health Care, Maastricht University, The Netherlands

CONFIDENTIAL UNTIL PUBLISHED
2
Correspondence to Kleijnen Systematic Reviews FAO Robert Wolff Unit 6, Escrick Business Park Riccall Road, Escrick York, UK YO19 6FD
Date completed 20/11/2019
Source of funding: This report was commissioned by the NIHR HTA Programme as project number 17/46/03.
Declared competing interests of the authors: None.
Acknowledgements: None.
Commercial in confidence (CiC) data are highlighted in blue throughout the report.
Academic in confidence (AiC) data are highlighted in yellow throughout the report.
Copyright belongs to Kleijnen Systematic Reviews Ltd.
Rider on responsibility for report: The views expressed in this report are those of the authors and not necessarily those of the NIHR HTA Programme. Any errors are the responsibility of the authors.
This report should be referenced as follows: Wolff R, Wetzelaer P, Kanters T, Fayter D, Raatz H, Ryder S, Worthy G, Huertas Carrera V, Noake C, Farmer AD, Armstrong N, Al M, Kleijnen J. Naldemedine for treating opioid-induced constipation: a Single Technology Assessment. York: Kleijnen Systematic Reviews Ltd, 2019.
Contributions of authors Robert Wolff acted as project lead and systematic reviewer on this assessment, critiqued the clinical effectiveness methods and evidence and contributed to the writing of the report. Maiwenn Al acted as health economic project lead, critiqued the company’s economic evaluation and contributed to the writing of the report. Pim Wetzelaer, Tim Kanters, Steve Ryder, and Nigel Armstrong acted as health economists on this assessment, critiqued the company’s economic evaluation and contributed to the writing of the report. Debra Fayter, Heike Raatz and Vanesa Huertas Carrera acted as systematic reviewers, critiqued the clinical effectiveness methods and evidence and contributed to the writing of the report. Gill Worthy acted as statistician, critiqued the analyses in the company’s submission and contributed to the writing of the report. Caro Noake critiqued the search methods in the submission and contributed to the writing of the report. Adam Farmer provided clinical expertise and contributed to the writing of the report. Jos Kleijnen critiqued the company’s definition of the decision problem and their description of the underlying health problem and current service provision, contributed to the writing of the report and supervised the project.

CONFIDENTIAL UNTIL PUBLISHED
3
Abbreviations
5-HT-4 5-hydroxytryptamine (serotonin) type 4
AAPM American Academy of Pain Medicine
ADR Adverse drug reaction
AdViSHE Assessment of the Validation Status of Health-Economic decision models
AE Adverse event
AIC Akaike information criterion
AiC Academic in confidence
ANCOVA Analysis of covariance
APS American Pain Society
BC Base-case
BFI Bowel Function Index
BIC Bayesian information criterion
BL Baseline
BM Bowel movement
BMI Body mass index
BSFS Bristol Stool Form Scale
CDSR Cochrane Database of Systematic Reviews
CE Cost effectiveness
CEA Cost effectiveness analysis
CEAC Cost effectiveness acceptability curve
CHMP Committee for Medicinal Products for Human Use
CI Confidence interval
CiC Commercial in confidence
COWS Clinical Opiate Withdrawal Scale
CPRD Clinical Practice Research Datalink
CRD Centre for Reviews and Dissemination
CrI Credible interval
CS Company submission
CSBM Complete spontaneous bowel movement
CSR Clinical study report
DARE Database of Abstracts of Reviews of Effects
DDW Digestive Disease Week
DSU Decision Support Unit
ECG Electrocardiogram
ECOG Eastern Cooperative Oncology Group
EED Economic Evaluations Database
EMA European Medicines Agency
EQ-5D European Quality of Life-5 Dimensions
ERG Evidence Review Group
EUR Erasmus University Rotterdam
FAS Full analysis set

CONFIDENTIAL UNTIL PUBLISHED
4
FDA Federal Drug Administration
GI Gastrointestinal
GP General practitioner
HRQoL Health-related quality of life
HTA Health technology assessment
IASP International Association for the Study of Pain
IBS-C Irritable bowel syndrome with constipation
ICER Incremental cost effectiveness ratio
ICH International Conference on Harmonization
ICTRP International Clinical Trials Registry Platform
Incr. Incremental
ISPOR International Society for Pharmacoeconomics and Outcomes Research
ITC Indirect treatment comparison
ITT Intention-to-treat
IV Intravenous
kg Kilogram
KSR Kleijnen Systematic Reviews
LIR Laxative inadequate response
LS Least square
LYG Life years gained
MACE Major adverse cardiovascular events
mg Milligram
mITT Modified intention-to-treat
MMRM Mixed model repeated measures
MNTX Methylnaltrexone
MTDD Morphine total daily dose
mths Months
N Sample size
NA Not applicable
NHS National Health Service
NICE National Institute for Health and Care Excellence
NIHR National Institute for Health Research
NR Not reported
NRS Numerical rating scale
OBID Opioid-induced bowel dysfunction
OIC Opioid-induced constipation
OWSA One-way sensitivity analysis
PAC-QOL Patient Assessment of Constipation Quality of Life
PAC-SYM Patient Assessment of Constipation Symptoms
PAMORA Peripherally acting µ-opioid receptor antagonist
PAS Patient access scheme
PICOS Population, intervention, comparison, outcome, and study design

CONFIDENTIAL UNTIL PUBLISHED
5
PPS Per protocol set
PR Prolonged release
PSA Probabilistic sensitivity analysis
PSS Personal social services
PSSRU Personal Social Services Research Unit
PT Preferred term
QALY Quality-adjusted life year
QD Once daily
QOL Quality of life
RCT Randomised controlled trial
RePEc Research Papers in Economics
RR Relative risk
RRME Repeated measures mixed effects
s.c. Subcutaneous
SBM Spontaneous bowel movement
SD Standard deviation
SE Standard error
SF-6D Short form – 6 dimensions
SF-12 Short form-12
SF-36 Short form-36
SIGN Scottish Intercollegiate Guidelines Network
SLR Systematic literature review
SMC Scottish Medicine Consortium
SOC System organ class
SOWS Subjective Opiate Withdrawal Scale
SR Systematic review
TA Technology appraisal
TDD Total daily dose
TEAE Treatment-emergent adverse event
TECHVER A Verification Checklist to Reduce Errors in Models and Improve Their Credibility
TSD Technical support document
UK United Kingdom
USA United States of America
WHO World Health Organization
wk Week

CONFIDENTIAL UNTIL PUBLISHED
6
TableofContents
Abbreviations .................................................................................................................................... 3
Table of Tables .................................................................................................................................. 9
Table of Figures .............................................................................................................................. 11
1. Executive summary .................................................................................................................... 13
1.1 Critique of the decision problem in the company’s submission .......................................... 13
1.1.1 Population ..................................................................................................................... 13
1.1.2 Intervention ................................................................................................................... 13
1.1.3 Comparators .................................................................................................................. 13
1.1.4 Outcomes ...................................................................................................................... 14
1.1.5 Other issues ................................................................................................................... 14
1.2 Summary of the key issues in the clinical effectiveness evidence ...................................... 14
1.3 Summary of the key issues in the cost effectiveness evidence ............................................ 19
1.4 Summary of the ERG’s preferred assumptions and resulting ICER ................................... 20
1.5 Summary of exploratory and sensitivity analyses undertaken by the ERG ......................... 21
2. Background ................................................................................................................................. 22
2.1 Introduction ......................................................................................................................... 22
2.2 Background .......................................................................................................................... 22
2.2.1 Opioid induced constipation (OIC) ............................................................................... 22
2.2.2 Epidemiology of opioid induced constipation .............................................................. 23
2.3 Critique of company’s description of underlying health problem ....................................... 26
2.4 Critique of company’s overview of current service provision ............................................ 26
3. Critique of company’s definition of decision problem ............................................................ 29
3.1 Population ............................................................................................................................ 32
3.2 Intervention .......................................................................................................................... 34
3.3 Comparators ........................................................................................................................ 34
3.4 Outcomes ............................................................................................................................. 35
3.5 Other relevant factors .......................................................................................................... 35
4. Clinical effectiveness .................................................................................................................. 36
4.1 Critique of the methods of review(s) ................................................................................... 36

CONFIDENTIAL UNTIL PUBLISHED
7
4.1.1 Searches ........................................................................................................................ 36
4.1.2 Inclusion criteria ........................................................................................................... 38
4.1.3 Critique of data extraction ............................................................................................. 39
4.1.4 Quality assessment ........................................................................................................ 39
4.1.5 Evidence synthesis ........................................................................................................ 39
4.2 Critique of trials of the technology of interest, the company’s analysis and interpretation (and any standard meta-analyses of these) .................................................................................. 40
4.2.1 Overview of the evidence for naldemedine .................................................................. 40
4.2.2 Details of included naldemedine studies ....................................................................... 41
4.2.3 Statistical analysis of the included naldemedine studies ............................................... 45
4.2.4 Trial participant characteristics ..................................................................................... 50
4.2.5 Risk of bias assessment for included naldemedine studies ........................................... 55
4.2.6 Efficacy results .............................................................................................................. 56
4.2.7 Subgroup analysis for included naldemedine studies ................................................... 60
4.2.8 Safety results ................................................................................................................. 60
4.2.9 Ongoing trials ................................................................................................................ 66
4.3 Critique of trials identified and included in the indirect comparison and/or multiple treatment comparison .......................................................................................................................... 68
4.4 Critique of the indirect comparison and/or multiple treatment comparison ........................ 73
4.5 Additional work on clinical effectiveness undertaken by the ERG ..................................... 73
4.6 Conclusions of the clinical effectiveness section ................................................................ 74
5. Cost effectiveness ........................................................................................................................ 76
5.1 ERG comment on company’s review of cost effectiveness evidence ................................. 76
5.1.1 Searches performed for cost effectiveness section ........................................................ 76
5.1.2 Inclusion/exclusion criteria ........................................................................................... 77
5.1.3 Identified studies ........................................................................................................... 78
5.1.4 Interpretation of the review ........................................................................................... 78
5.2 Summary and critique of company’s submitted economic evaluation by the ERG ............ 78
5.2.1 NICE reference case checklist (TABLE ONLY) .......................................................... 78
5.2.2 Population ..................................................................................................................... 79

CONFIDENTIAL UNTIL PUBLISHED
8
5.2.3 Interventions and comparators ...................................................................................... 80
5.2.4 Perspective, time horizon and discounting .................................................................... 81
5.2.5 Model structure ............................................................................................................. 82
5.2.6 Treatment effectiveness and extrapolation .................................................................... 84
5.2.7 Adverse events .............................................................................................................. 93
5.2.8 Health-related quality of life ......................................................................................... 94
5.2.9 Resources and costs ...................................................................................................... 97
6. Cost effectiveness results ......................................................................................................... 100
6.1 Company’s cost effectiveness results ................................................................................ 100
6.2 Company’s sensitivity analyses ......................................................................................... 102
6.2.1 Probabilistic sensitivity analysis ................................................................................. 102
6.2.2 Deterministic sensitivity analysis ................................................................................ 105
6.2.3 Scenario analyses ........................................................................................................ 109
6.3 Model validation and face validity check .......................................................................... 115
7. Evidence review group’s additional analyses ........................................................................ 116
7.1 Exploratory and sensitivity analyses undertaken by the ERG ........................................... 116
7.1.1 Explanation of the company adjustments after the request for clarification ............... 116
7.1.2 Explanation of the ERG adjustments .......................................................................... 116
7.1.3 Additional scenarios conducted by the ERG .............................................................. 117
7.2 Impact on the ICER of additional clinical and economic analyses undertaken by the ERG ........................................................................................................................................... 118
7.2.1 Results of the ERG preferred base-case scenario ....................................................... 118
7.2.2 Results of the ERG additional exploratory scenario analyses ..................................... 122
7.3 ERG’s preferred assumptions ............................................................................................ 123
7.4 Conclusions of the cost effectiveness section .................................................................... 124
8. End of life .................................................................................................................................. 127
9. References ................................................................................................................................. 128
Appendix 1: Company systematic review eligibility criteria .................................................... 133
Appendix 2: Additional results company’s base-case ............................................................... 136
A2.1 Disaggregated results by health state ................................................................................. 136
CONFIDENTIAL UNTIL PUBLISHED
9
Table of Tables
Table 1.1: Effectiveness results of RCTs .............................................................................................. 16
Table 1.2: Safety results of RCTs ......................................................................................................... 18
Table 1.3: ERG preferred deterministic base-case results (discounted) ............................................... 20
Table 2.1: Diagnostic criteria for opioid-induced constipation............................................................. 23
Table 2.2: Examples of cited incidences and prevalences and data found in the literature .................. 25
Table 3.1: Statement of the decision problem (as presented by the company) ..................................... 29
Table 4.1: Identification of clinical evidence ........................................................................................ 36
Table 4.2: Overview of the clinical trial programme for naldemedine ................................................. 40
Table 4.3: Summary of RCT design ..................................................................................................... 42
Table 4.4: Summary of open label studies design ................................................................................ 44
Table 4.5: Statistical methods of the naldemedine RCTs ..................................................................... 46
Table 4.6: RCT baseline characteristics ................................................................................................ 51
Table 4.7: Open label studies baseline characteristics .......................................................................... 54
Table 4.8: Company quality assessment RCTs ..................................................................................... 55
Table 4.9: Effectiveness results of RCTs .............................................................................................. 57
Table 4.10: Safety results of RCTs ....................................................................................................... 61
Table 4.11: TEAEs in RCTs ................................................................................................................. 61
Table 4.12: Safety results of open label studies .................................................................................... 63
Table 4.13: TEAEs in open label studies .............................................................................................. 63
Table 4.14: Overview of ongoing trials ................................................................................................ 67
Table 4.15: Methodology of trials included in the ITC ........................................................................ 68
Table 4.16: Patient characteristics of trials included in the ITC ........................................................... 71
Table 4.17: Data used in ITC (LIR population) .................................................................................... 72
Table 5.1: Identification of cost effectiveness studies .......................................................................... 76
Table 5.2: NICE reference case checklist ............................................................................................. 78
Table 5.3: Overview of intervention and comparators as defined by the company for all scenarios (i.e. subpopulations) ..................................................................................................................................... 80
Table 5.4: Proportion of responders at weeks 2, 4 and 12 in each scenario ......................................... 86
Table 5.5: Estimated mean transition probabilities for transitions B and C in each scenario ............... 91
Table 5.6: Adverse event rates in the economic model ........................................................................ 93
Table 5.7: Base-case utility values in the model ................................................................................... 94
Table 5.8: Input values different utility sources ................................................................................... 95
CONFIDENTIAL UNTIL PUBLISHED
10
Table 5.9: Intervention costs of naldemedine and comparator treatments ............................................ 97
Table 6.1: Company base-case cost effectiveness results (discounted) for each scenario .................. 100
Table 6.2: Disaggregated, discounted results by health state for scenario 0: OIC monotherapy, non-cancer (The ERG considers this to be the corrected version of scenario 1) ........................................ 101
Table 6.3: Disaggregated, discounted results by health state for scenario 5: cancer .......................... 101
Table 6.4: Descriptions of the different sensitivity scenarios performed by the company ................. 109
Table 6.5: Summary of the results of the sensitivity scenario analyses conducted by the company – Scenario 1 ........................................................................................................................................... 111
Table 6.6: Summary of the results of the sensitivity scenario analyses conducted by the company – Scenario 2 ........................................................................................................................................... 112
Table 6.7: Summary of the results of the sensitivity scenario analyses conducted by the company – Scenario 3 ........................................................................................................................................... 113
Table 7.1: Company and ERG base-case preferred assumptions........................................................ 116
Table 7.2: Descriptions of the different sensitivity scenarios performed by the ERG ........................ 117
Table 7.3: ERG-preferred base-case cost effectiveness results (discounted) for each scenario that changes compared to company base-case ........................................................................................... 118
Table 7.4: ERG-preferred probabilistic cost effectiveness results (discounted) for each scenario ..... 119
Table 7.5: Summary of the results of the sensitivity scenario analyses conducted by the ERG ......... 122
Table 7.6: ICERs based on ERG’s preferred model assumptions ...................................................... 123
Table A2.1: Disaggregated, discounted results by health state for scenario 1: OIC monotherapy, non-cancer .................................................................................................................................................. 137
Table A2.2: Disaggregated, discounted results by health state for scenario 2: mixed aetiology constipation (combination therapy), non-cancer ................................................................................. 137
Table A2.3: Disaggregated, discounted results by health state for scenario 3: OIC monotherapy (LIR), non-cancer ........................................................................................................................................... 138
Table A2.4: Disaggregated, discounted results by health state for scenario 4: advanced illness, cancer ............................................................................................................................................................ 138
CONFIDENTIAL UNTIL PUBLISHED
11
Table of Figures
Figure 2.1: A pragmatic stepwise suggestion for the management of OIC in clinical practice indicating a broad positioning of naldemedine ...................................................................................................... 26
Figure 2.2: Pathway of care for OIC indicating positioning of naldemedine ....................................... 27
Figure 4.1: Assessment of pain intensity using the numerical rating scale safety population (mean and SD) ........................................................................................................................................................ 65
Figure 4.2: Mean (± SE) numerical rating scale scores (safety population) ......................................... 65
Figure 4.3: Total daily dose of opioid (safety population) .................................................................... 65
Figure 4.7: ITC results for response at week 4 ..................................................................................... 72
Figure 4.8: ITC results for response at week 12 ................................................................................... 73
Figure 5.1: Decision-tree structure for first model cycle (response assessment) .................................. 82
Figure 5.2: Markov model structure from second model cycle onwards .............................................. 83
Figure 5.3: Parametric survival curves of transition A for scenario 0 .................................................. 88
Figure 5.4: Parametric survival curves of transition A for scenario 1 .................................................. 89
Figure 5.5: Parametric survival curves of transition A for scenario 2 .................................................. 89
Figure 5.6: Parametric survival curves of transition A for scenario 3 .................................................. 90
Figure 5.7: Parametric survival curves of transition A for scenarios 4 and 5 ....................................... 90
Figure 6.1: Cost effectiveness plane for scenario 0: OIC monotherapy, non-cancer (The ERG considers this to be the corrected version of scenario 1) .................................................................................... 102
Figure 6.2: Cost effectiveness acceptability curve for scenario 0: naldemedine versus placebo (regardless of rescue laxative), non-cancer ......................................................................................... 103
Figure 6.3: Cost effectiveness acceptability curve for scenario 1: OIC monotherapy, non-cancer .... 103
Figure 6.4: Cost effectiveness acceptability curve for scenario 2: mixed aetiology constipation (combination therapy), non-cancer ..................................................................................................... 104
Figure 6.5: Cost effectiveness acceptability curve for scenario 3: OIC monotherapy (LIR), non-cancer ............................................................................................................................................................ 104
Figure 6.6: Cost effectiveness acceptability curve for scenario 4: advanced illness, cancer .............. 104
Figure 6.7: Cost effectiveness plane for scenario 5: cancer ................................................................ 105
Figure 6.8: Cost effectiveness acceptability curve for scenario 5: cancer .......................................... 105
Figure 6.9: One-way sensitivity results for scenario 0: naldemedine versus placebo (regardless of rescue laxative), non-cancer ........................................................................................................................... 106
Figure 6.10: One-way sensitivity results for scenario 1: OIC monotherapy, non-cancer ................... 106
Figure 6.11: One-way sensitivity results for scenario 2: mixed aetiology constipation (combination therapy), non-cancer ........................................................................................................................... 107
Figure 6.12: One-way sensitivity results for scenario 3: OIC monotherapy (LIR), non-cancer ......... 107
Figure 6.13: One-way sensitivity results for scenario 4: advanced illness, cancer ............................. 108
CONFIDENTIAL UNTIL PUBLISHED
12
Figure 6.14: One-way sensitivity results for scenario 5: cancer ......................................................... 108
Figure 7.1: Cost effectiveness acceptability curve for ERG-preferred version of scenario 0: OIC monotherapy, non-cancer (The ERG considers this to be the corrected version of scenario 1) ......... 120
Figure 7.2: Cost effectiveness acceptability curve for ERG-preferred version of scenario 3: LIR; OIC monotherapy, non-cancer .................................................................................................................... 120
Figure 7.3: Cost effectiveness acceptability curve for ERG-preferred version of scenario 6: Cancer and OIC ...................................................................................................................................................... 121
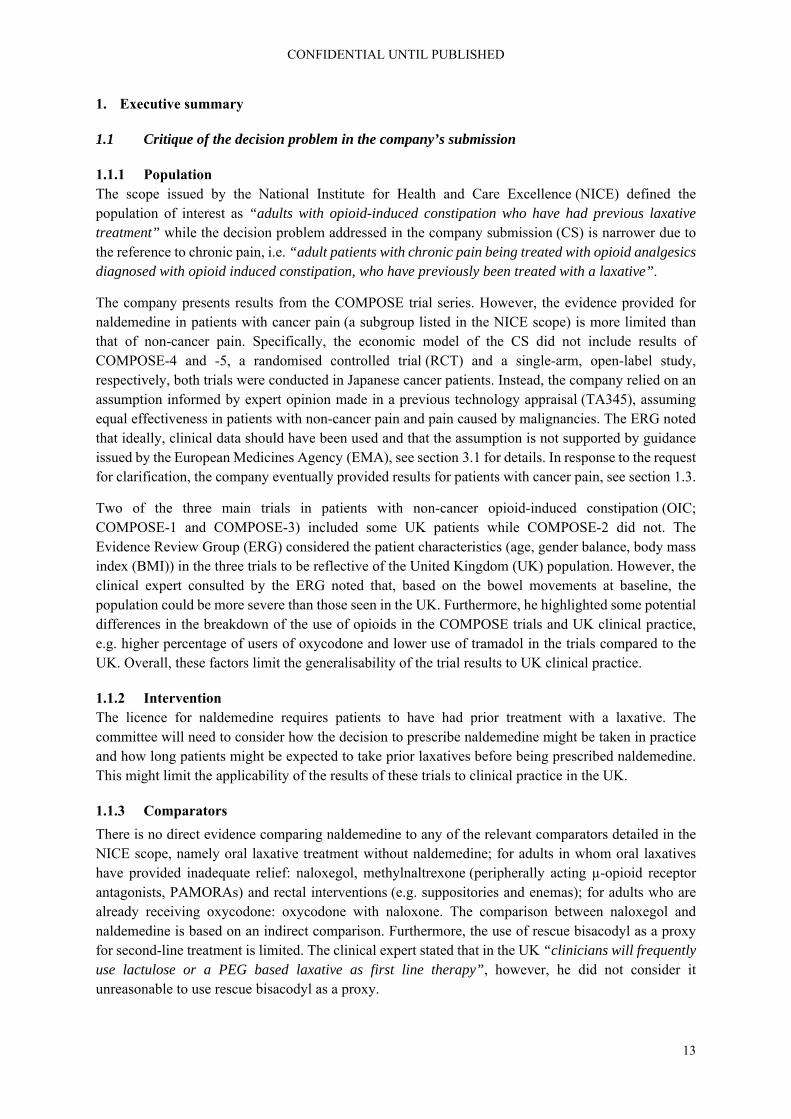
CONFIDENTIAL UNTIL PUBLISHED
13
1. Executive summary
1.1 Critique of the decision problem in the company’s submission
1.1.1 Population The scope issued by the National Institute for Health and Care Excellence (NICE) defined the population of interest as “adults with opioid-induced constipation who have had previous laxative treatment” while the decision problem addressed in the company submission (CS) is narrower due to the reference to chronic pain, i.e. “adult patients with chronic pain being treated with opioid analgesics diagnosed with opioid induced constipation, who have previously been treated with a laxative”.
The company presents results from the COMPOSE trial series. However, the evidence provided for naldemedine in patients with cancer pain (a subgroup listed in the NICE scope) is more limited than that of non-cancer pain. Specifically, the economic model of the CS did not include results of COMPOSE-4 and -5, a randomised controlled trial (RCT) and a single-arm, open-label study, respectively, both trials were conducted in Japanese cancer patients. Instead, the company relied on an assumption informed by expert opinion made in a previous technology appraisal (TA345), assuming equal effectiveness in patients with non-cancer pain and pain caused by malignancies. The ERG noted that ideally, clinical data should have been used and that the assumption is not supported by guidance issued by the European Medicines Agency (EMA), see section 3.1 for details. In response to the request for clarification, the company eventually provided results for patients with cancer pain, see section 1.3.
Two of the three main trials in patients with non-cancer opioid-induced constipation (OIC; COMPOSE-1 and COMPOSE-3) included some UK patients while COMPOSE-2 did not. The Evidence Review Group (ERG) considered the patient characteristics (age, gender balance, body mass index (BMI)) in the three trials to be reflective of the United Kingdom (UK) population. However, the clinical expert consulted by the ERG noted that, based on the bowel movements at baseline, the population could be more severe than those seen in the UK. Furthermore, he highlighted some potential differences in the breakdown of the use of opioids in the COMPOSE trials and UK clinical practice, e.g. higher percentage of users of oxycodone and lower use of tramadol in the trials compared to the UK. Overall, these factors limit the generalisability of the trial results to UK clinical practice.
1.1.2 Intervention The licence for naldemedine requires patients to have had prior treatment with a laxative. The committee will need to consider how the decision to prescribe naldemedine might be taken in practice and how long patients might be expected to take prior laxatives before being prescribed naldemedine. This might limit the applicability of the results of these trials to clinical practice in the UK.
1.1.3 Comparators
There is no direct evidence comparing naldemedine to any of the relevant comparators detailed in the NICE scope, namely oral laxative treatment without naldemedine; for adults in whom oral laxatives have provided inadequate relief: naloxegol, methylnaltrexone (peripherally acting µ-opioid receptor antagonists, PAMORAs) and rectal interventions (e.g. suppositories and enemas); for adults who are already receiving oxycodone: oxycodone with naloxone. The comparison between naloxegol and naldemedine is based on an indirect comparison. Furthermore, the use of rescue bisacodyl as a proxy for second-line treatment is limited. The clinical expert stated that in the UK “clinicians will frequently use lactulose or a PEG based laxative as first line therapy”, however, he did not consider it unreasonable to use rescue bisacodyl as a proxy.

CONFIDENTIAL UNTIL PUBLISHED
14
1.1.4 Outcomes
The outcomes evaluated by the company largely reflected the NICE scope. However not all outcomes in the CS were clearly reported, see sections 3.4 and 4.2.6 for details.
1.1.5 Other issues
The CS did not state that naldemedine would raise any issues relating to equality of access to treatments.
1.2 Summary of the key issues in the clinical effectiveness evidence Overall, the CS reported clinical effectiveness searches were well presented and missing data were provided at clarification. Searches were carried out on a broad range of databases. Supplementary searches of conference proceedings, trials databases and the checking of references lists were undertaken by the company in order to identify additional studies not retrieved by the main searches. However, the ERG identified some limitations in the way in which health-related quality of life (HRQoL) literature was identified by these searches. Without the time to undertake independent searches and review the results within the single technology appraisal (STA) timeline the ERG is unable to say what effect these limitations may have had on the overall recall of results.
The company presented evidence from the COMPOSE programme of trials. This included:
Three phase 2, randomised, double-blind, placebo-controlled dose-finding studies - two in patients with chronic non-cancer pain (V9214 and V9221), and one in patients with cancer (V9222)
Four randomised, double-blind, placebo-controlled studies - three in patients with chronic non-cancer pain (COMPOSE-1, COMPOSE-2, and COMPOSE-3), and one in patients with cancer (COMPOSE-4)
Three phase 3 single-arm, open-label studies (COMPOSE-5, COMPOSE-6 and COMPOSE-7)
Data from COMPOSE-1, -2 and -3 (patients with non-cancer pain) were used in the economic model while data from COMPOSE-4 and -5 (patients with cancer pain) were used in models provided in response to the request for clarification. COMPOSE-3 is the longest and largest RCT (621 participants in the naldemedine arm compared to 271 in COMPOSE-1 and -2, respectively) but it is important to note that patients in this trial were permitted to continue with their previous stable laxative regimen.
The primary outcome of the 12-week RCTs COMPOSE-1 and -2 was the proportion of spontaneous bowel movement (SBM) responders as recorded in an e-diary. Responders were defined as patients with ≥9/12 positive-response weeks and ≥3 positive-response weeks out of the last four weeks. A positive response week was defined as ≥3 SBM/week and ≥1 SBM/week increase from baseline. The primary outcome of the 52-week COMPOSE-3 trial was treatment-emergent adverse events (TEAEs).
In COMPOSE-4 (the two-week RCT in cancer patients) the primary outcome was again the proportion of SBM responders as recorded in a patient diary. In this trial, responders were patients with ≥3 SBMs/week and an increase of ≥1 SBM/week from baseline (average number SBMs/week in two weeks prior to screening). COMPOSE-5 was an open label extension of COMPOSE-4.
Overall, effect estimates for COMPOSE-1 to -4, show an advantage of naldemedine vs. placebo regarding SBM, complete spontaneous bowel movement (CSBM), SBM without straining, Patient Assessment of Constipation Quality of Life (PAC-QOL) and Patient Assessment of Constipation Symptoms (PAC-SYM). For PAC-QOL and PAC-SYM the effect estimates in COMPOSE-4 did not reach statistical significance. Effectiveness results for COMPOSE-1, -2, -3, and -4 are presented in Table 1.1.

CONFIDENTIAL UNTIL PUBLISHED
15
In regard to safety, naldemedine appeared to be generally well tolerated while not impeding the analgesic benefits of opioids or precipitating opioid-withdrawal syndrome. Proportions reporting any treatment-emergent adverse event or serious event were similar in naldemedine and placebo groups in COMPOSE-1, -2 and -3. However, in COMPOSE-4, the cancer trial, a higher number of patients reported TEAEs in the naldemedine group than the placebo group and a higher number discontinued for this reason, see Table 1.2.
The ERG noted that patients taking naldemedine experienced a higher incidence of gastrointestinal adverse events such as diarrhoea than those receiving placebo. The company reported that in all trials most events were mild to moderate in severity. Serious adverse events appeared to occur in similar proportions across treatment groups.
The company stated that no deaths in either treatment group across the COMPOSE trials were considered to be related to the study drug. The ERG noticed that 15 patients (11.5%) died in COMPOSE-5, the open-label study of cancer patients taking naldemedine. The clinical study report (CSR) for COMPOSE-5 stated that “**************************************************************************************************************************************************************************”.
The company performed an indirect comparison (ITC) which compared naldemedine 0.2 mg (using pooled data from COMPOSE-1 and -2) with naloxegol (using pooled data from KODIAC-4 and -5). The outcomes analysed were the response rates at weeks 4 and 12. The ERG asked the company to clarify the pooling methods, however, even after receiving the response to request for clarification, it was not clear how the data from COMPOSE-1 and -2, or from KODIAC-4 and -5 were pooled.
After four and 12 weeks, results for naldemedine were comparable to naloxegol (risk ratio (RR) 0.76, 95% credible interval (CrI) 0.41 to 1.40 and RR 1.03, 95% confidence interval (CI) 0.75 to 1.41, respectively). The ERG checked the ITC calculations and could reproduce the reported results for week 12 but not week 4. The ERG obtained a relative risk for naloxegol versus naldemedine of 0.75 (95% CI 0.60 to 0.93) compared to the estimate of 0.76 (95% credible interval 0.41 to 1.40) presented in the CS. Even after response to the request for clarification, the ERG could not check whether the analysis was appropriate or verify the results.
Overall, the ERG is concerned about the potential differences between the naldemedine and naloxegol trials particularly regarding the baseline comparability in SBM and opioid use and different definitions of OIC as well as differences regarding treatment response to laxatives. Given these differences and the discrepancies between the reported analysis methods and results the results of the ITC should be interpreted with caution.
In response to the request for clarification, the company provided details of six ongoing trials, see section 4.2.9.
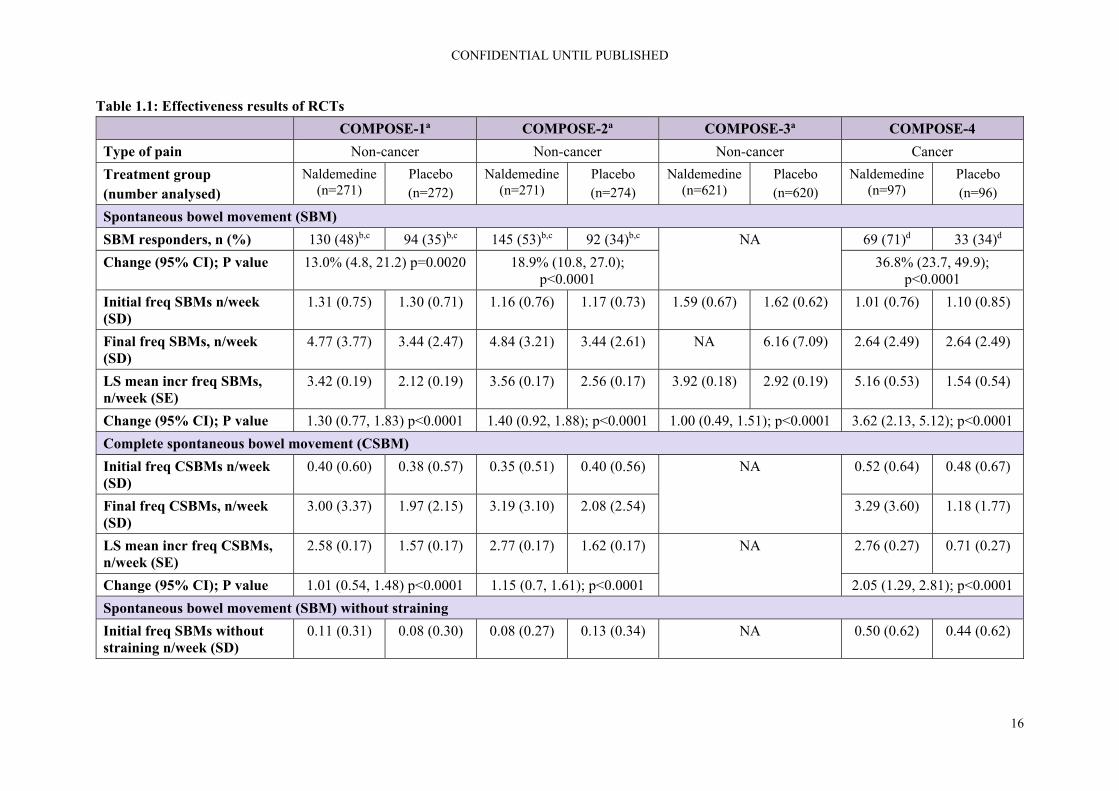
CONFIDENTIAL UNTIL PUBLISHED
16
Table 1.1: Effectiveness results of RCTs
COMPOSE-1a COMPOSE-2a COMPOSE-3a COMPOSE-4
Type of pain Non-cancer Non-cancer Non-cancer Cancer
Treatment group (number analysed)
Naldemedine (n=271)
Placebo (n=272)
Naldemedine (n=271)
Placebo (n=274)
Naldemedine (n=621)
Placebo (n=620)
Naldemedine (n=97)
Placebo (n=96)
Spontaneous bowel movement (SBM)
SBM responders, n (%) 130 (48)b,c 94 (35)b,c 145 (53)b,c 92 (34)b,c NA 69 (71)d 33 (34)d
Change (95% CI); P value 13.0% (4.8, 21.2) p=0.0020 18.9% (10.8, 27.0); p<0.0001
36.8% (23.7, 49.9); p<0.0001
Initial freq SBMs n/week (SD)
1.31 (0.75) 1.30 (0.71) 1.16 (0.76) 1.17 (0.73) 1.59 (0.67) 1.62 (0.62) 1.01 (0.76) 1.10 (0.85)
Final freq SBMs, n/week (SD)
4.77 (3.77) 3.44 (2.47) 4.84 (3.21) 3.44 (2.61) NA 6.16 (7.09) 2.64 (2.49) 2.64 (2.49)
LS mean incr freq SBMs, n/week (SE)
3.42 (0.19) 2.12 (0.19) 3.56 (0.17) 2.56 (0.17) 3.92 (0.18) 2.92 (0.19) 5.16 (0.53) 1.54 (0.54)
Change (95% CI); P value 1.30 (0.77, 1.83) p<0.0001 1.40 (0.92, 1.88); p<0.0001 1.00 (0.49, 1.51); p<0.0001 3.62 (2.13, 5.12); p<0.0001
Complete spontaneous bowel movement (CSBM)
Initial freq CSBMs n/week (SD)
0.40 (0.60) 0.38 (0.57) 0.35 (0.51) 0.40 (0.56) NA 0.52 (0.64) 0.48 (0.67)
Final freq CSBMs, n/week (SD)
3.00 (3.37) 1.97 (2.15) 3.19 (3.10) 2.08 (2.54) 3.29 (3.60) 1.18 (1.77)
LS mean incr freq CSBMs, n/week (SE)
2.58 (0.17) 1.57 (0.17) 2.77 (0.17) 1.62 (0.17) NA 2.76 (0.27) 0.71 (0.27)
Change (95% CI); P value 1.01 (0.54, 1.48) p<0.0001 1.15 (0.7, 1.61); p<0.0001 2.05 (1.29, 2.81); p<0.0001
Spontaneous bowel movement (SBM) without straining
Initial freq SBMs without straining n/week (SD)
0.11 (0.31) 0.08 (0.30) 0.08 (0.27) 0.13 (0.34) NA 0.50 (0.62) 0.44 (0.62)

CONFIDENTIAL UNTIL PUBLISHED
17
COMPOSE-1a COMPOSE-2a COMPOSE-3a COMPOSE-4
Final freq SBMs without straining, n/week (SD)
1.57 (2.77) 0.82 (1.70) 2.00 (2.99) 1.29 (2.35) 4.36 (7.06) 1.61 (2.24)
LS mean incr freq SBMs without straining, n/week (SE)
1.46 (0.14) 0.73 (0.14) 1.85 (0.16) 1.10 (0.16) NA 3.85 (0.53) 1.17 (0.53)
Change (95% CI); P value 0.73 (0.34, 1.12) p=0.0002 0.75 (0.3, 1.19) p=0.0011 2.67 (1.20, 4.15) p=0.0005
Patient Assessment of Constipation Quality of Life (PAC-QOL)
Initial PAC-QOL score, n (SD)
2.05 (0.78) 2.00 (0.78) 2.08 (0.73) 2.10 (0.72) NA 1.22 (0.51) 1.31 (0.60)
Final PAC-QOL score, n (SD)
1.15 (0.92) 1.26 (0.82) 1.00 (0.79) 1.29 (0.89) 0.97 (0.52) 1.17 (0.68)
LS mean reduction in PAC-QOL, n (SE)
-0.93 (0.06) -0.66 (0.06) -1.08 (0.06) -0.8 (0.06) -1.24 (0.04) -0.94 (0.04) -0.25 (0.5) -0.14 (0.48)
Change (95% CI); P value -0.26 (-0.42, -0.10); p=0.0014
-0.28 (0.44, 0.11); p=0.0010 -0.31 (-0.42, -0.20); p<0.0001
-0.11; p=0.1129
Patient Assessment of Constipation Symptoms (PAC-SYM)
Initial PAC-SYM score, n (SE)
1.92 (0.77) 1.84 (0.73) 1.86 (0.72) 1.77 (0.74) NA 1.06 (0.60) 1.15 (0.62)
Final PAC-SYM score, n (SE)
1.01 (0.78) 1.18 (0.81) 0.86 (0.74) 1.08 (0.82) 0.82 (0.58) 1.02 (0.59)
LS mean reduction in PAC-SYM, n (SE)
-0.93 (0.06) -0.62 (0.06) -1.01 (0.06) -0.69 (0.06) -1.22 (0.04) -0.98 (0.04) -0.26 (0.65) -0.13 (0.5)
Change (95% CI); P value -0.30 (-0.46, -0.15); p=0.0001
-0.32 (-0.48, -0.15); p=0.0002
-0.24 (-0.35, -0.12); p<0.0001
-0.13; p=0.1476
Based on Table 13 of the CS and the response to the request for clarification a Totals reported correspond to those reported for the baseline characteristics of the populations but differ from the totals of the number of patients from the two treatment arms with totals being higher for COMPOSE-1 and -2, and lower for COMPOSE-3; b ≥9 positive-response weeks out of the 12-week treatment period and 3 positive-response weeks out of the last 4 weeks of the 12-week treatment period. A positive-response week was defined as ≥3 SBMs per week and an increase from baseline of ≥1 SBM per

CONFIDENTIAL UNTIL PUBLISHED
18
COMPOSE-1a COMPOSE-2a COMPOSE-3a COMPOSE-4 week for that week. Results shown for intention-to-treat population; c Figure 2 in the CS reports the same results once rounded but the number of patients per arm corresponds to those reported in the table on the baseline characteristics; d ≥3 SBMs per week and an increase of ≥1 SBM per week from baseline. Results shown for full analysis set CI = confidence interval; CS = company submission; CSBM = complete spontaneous bowel movement; LS = least square; NA = not applicable; PAC-QOL = Patient Assessment of Constipation Quality of Life; PAC-SYM = Patient Assessment of Constipation Symptoms; RCT = randomised controlled trial; SBM = spontaneous bowel movement; SD = standard deviation; SE = standard error
Table 1.2: Safety results of RCTs
COMPOSE-1 COMPOSE-2 COMPOSE-3 COMPOSE-4
Type of pain Non-cancer Non-cancer Non-cancer Cancer
Treatment group Naldemedine (n=271)
Placebo (n=272)
Naldemedine (n=271)
Placebo (n=274)
Naldemedine (n=621)
Placebo (n=619)
Naldemedine (n=97)
Placebo (n=96)
Any TEAE, n (%) 132 (49) 123 (45) 136 (50) 132 (48) 425 (68) 446 (72) 43 (44) 25 (26)
Drug-related TEAE, n (%)
59 (22) 45 (17) 54 (20) 31 (11) 149 (24) 121 (20) 18 (19) 9 (9)
Serious TEAE, n (%) 14 (5) 5 (2) 9 (3) 13 (5) 60 (10) 73 (12) - -
Drug-related serious TEAE, n (%)
2 (1) 0 2 (1) 1 (<1) 3 (<1) 6 (1) - -
TEAE leading to study discontinuation, n (%)
13 (5) 4 (2) 14 (5) 9 (3) 39 (6) 36 (6) 9 (9) 1 (1)
Serious TEAE leading to study discontinuation, n (%)
3 (1) 0 3 (1) 3 (1) 7 (1) 12 (2) NR NR
Deaths, n (%) 0 0 1 (<1) 0 4 (<1) 4 (<1) 2 (2) 0 Based on Table 21 of the CS CS = company submission; NR = not reported; TEAE = treatment-emergent adverse event

CONFIDENTIAL UNTIL PUBLISHED
19
1.3 Summary of the key issues in the cost effectiveness evidence
Searches were undertaken to identify published cost effectiveness studies. After a request at clarification regarding missing information reporting hits per line of searches and overall recall of results, the company provided sufficient details for the ERG to appraise the searches. A good range of databases and additional resources including conference proceedings, specialist and organisational websites were searched. Searches for HRQoL literature were reported as being conducted as part of the clinical effectiveness searches, the ERG’s concerns regarding the limitations of these searches are reported in section 5.1.1.
The ERG considers the general structure of the model, pertaining to the decision-tree part, the Markov part, and the combination thereof, as appropriate. The same model was previously also considered by the ERG for TA345 to be appropriate.
In response to the request for clarification, the company produced a final submission with four scenarios (subpopulations) in non-cancer patients and two scenarios in cancer patients [NB: While the company refers to these as scenarios, these should be considered subpopulations]:
Scenario 1 (non-cancer) was based a comparison of naldemedine (without rescue laxative) to placebo (with rescue laxative)
Scenario 0 (non-cancer), which the ERG considers to be a corrected version of scenario 1, includes rescue therapy in both the naldemedine and placebo comparators, as suggested by the ERG
Scenario 2 (non-cancer) compared naldemedine plus a stable laxative to placebo with a stable laxative in patients with mixed aetiology constipation
Scenario 3 (non-cancer) compared naldemedine to naloxegol
Scenario 4 (cancer patients) compared naldemedine to methylnaltrexone
Scenario 5 (cancer patients) compared naldemedine to placebo
One of the major issues in the evidence regards the definitions of the various subpopulations in which naldemedine might be used in combination with the defined intervention and comparators, and the subsequently extracted data from the various COMPOSE studies. Only for one sub-population (scenario 1) did the company provide an alternative scenario (scenario 0) which the ERG considers to be the corrected version of scenario 1. In the response to the clarification letter, a cancer scenario was added (scenario 5) which was also based on the correct data for the correct subpopulation. In scenario 2 and 3, issues remained with regards to the in- or exclusion from analysis of patients who had received rescue laxatives; in scenario 4 the population was not restricted to patients with laxative inadequate response. As a result of these fundamental problems, the ERG considers all results and discussion with regards to scenarios 1, 2, 3, and 4 largely irrelevant. Where results of scenarios 1 to 4 are presented, they should only be regarded as only indicative.
It is clear, from the various analyses that the company formulated to investigate the model’s sensitivity, that variation in the utility values per health state is one of the major determinants of the incremental cost effectiveness ratio (ICERs). Unfortunately, European Quality of Life-5 Dimensions (EQ-5D) was not measured in the COMPOSE studies, only the short form-36 (SF-36) and the Patient Assessment of Constipation Quality of Life (PAC-QOL). The ERG considers the choice of the company to use utilities from TA345 as an appropriate alternative. The CS used treatment-specific utilities for the non-OIC (on treatment) health state in the base-case.

CONFIDENTIAL UNTIL PUBLISHED
20
Although it seems plausible that an independent treatment effect of naloxegol on HRQoL may be present, the provided evidence is not completely convincing. If there is indeed a treatment effect on utility, the most plausible explanation according to the ERG is that the non-OIC (on treatment) state is too broad as it can include patients with exactly three SBM per week but also patients with seven SBM per week, thus including a heterogeneous group of patients. The most preferable approach to dealing with this would have been to refine the non-OIC (on treatment) state by splitting it in two states and deriving treatment unspecific, health state specific utility values. However, it is the ERG’s view that in the absence of such a more refined and transparent Markov model, the current approach with treatment specific utilities is a reasonable alternative.
Once patients have responded to their treatment for OIC, they are continuously at risk of going back to OIC. This risk is described by time-to-event curves, based on observations from the various COMPOSE studies and indirect treatment comparisons. Given the time horizon of five years, these curves were extrapolated beyond the observed period using parametric distributions. The most important element of selecting an appropriate time-to-event curve, i.e. clinical plausibility, was not addressed in the CS. In response to the request for clarification, the company stated that a full report on validation will be available by the end of November 2019, which is beyond the time period for ERG assessment. The company performed several sensitivity analyses that demonstrated that use of alternative parametric distributions for survival curves led to relatively small differences in cost effectiveness results. Unfortunately, it was difficult for the ERG to assess the soundness of the results presented for various scenarios, because the presentation and explanation of the methodology used for the model were very limited.
It is unclear to the ERG how the adverse event rates as presented in the electronic model were derived. This makes it difficult for the ERG to comment on the large difference in adverse events (AEs) of naldemedine versus naloxegol and methylnaltrexone.
1.4 Summary of the ERG’s preferred assumptions and resulting ICER
Only limited changes were made to the company base-case to reflect the ERG’s preferred assumptions, which are detailed in section 7.1.2, are as follows:
Use of a Gompertz distribution (instead of lognormal) for the extrapolation of the survival curves for transition A, loss of response, in scenarios 0 and 3. This change was based on the opinion of a clinical expert consulted by the ERG.
Addition of naloxegol as comparator against naldemedine in LIR cancer patients (scenario 6).
These changes led to a slight increase in the ICER for scenarios 0 (the ERG preferred base-case results are shown in Table 1.3 below) in comparison to the company base-case for these scenarios.
For scenario 3, the ERG base-case ICER has nearly halved in comparison to the one from the company.
Table 1.3: ERG preferred deterministic base-case results (discounted)
Scenarios/ Technologies
Total costs
Total LYGs
Total QALYs
Incr. costs
Incr. LYGs
Incr. QALYs
ICER (costs/QALY)
Scenario 0: OIC monotherapy, non-cancer (The ERG considers this to be the corrected version of scenario 1) (distribution)
Naldemedine £1,574 4.69 2.83 £837 0 0.07 £11,939
Placebo £737 4.69 2.76 - - - -

CONFIDENTIAL UNTIL PUBLISHED
21
Scenarios/ Technologies
Total costs
Total LYGs
Total QALYs
Incr. costs
Incr. LYGs
Incr. QALYs
ICER (costs/QALY)
Scenario 3*: LIR; OIC mono-therapy, non-cancer (distribution)
Naldemedine £1,791 4.69 2.91 £110 0 0.02 £4,989
Naloxegol £1,681 4.69 2.89 - - - -
Scenario 6*: LIR; cancer with OIC (scenario 4 with alternative comparator)
Naldemedine £1,206 4.11 2.47 £63 0 0.05 £1,282
Naloxegol £1,143 4.11 2.42 - - - -
Based on the electronic model * Indicative only scenarios ICER = incremental cost-effectiveness ratio, Incr. = incremental, LIR = laxative inadequate response, LYGs = life years gained, OIC = opioid-induced constipation, QALYs = quality-adjusted life years
1.5 Summary of exploratory and sensitivity analyses undertaken by the ERG
The ERG conducted probabilistic sensitivity analyses (PSAs) using the ERG base-case assumptions. The probabilistic results were in line with the findings from the deterministic analyses. In scenario 0, non-cancer OIC patients, naldemedine has a probability of being cost effective of 0% and 3.4% at thresholds of £20,000 and £30,000, respectively.
In scenario 3 and 6, the probability of naldemedine being cost effective is (almost) 100% at both thresholds.
The ERG conducted additional scenario analyses, varying utilities using values from the literature and health state costs using values from TA345. The utilities produced results like those of the ERG preferred base-case. Using higher health state costs for OIC health state resulted in lower ICER values. Naldemedine was dominant in all scenarios when the health state costs of £371.32 were used.

CONFIDENTIAL UNTIL PUBLISHED
22
2. Background
2.1 Introduction
In this report the Evidence Review Group (ERG) provides a review of the evidence submitted by Shionogi in support of naldemedine, trade name Rizmoic®, for treating opioid induced constipation (OIC).
2.2 Background
In the company submission (CS), naldemedine was described as a member of the peripherally acting µ-opioid receptor antagonists (PAMORA) class of drugs with a permanent binding action on the µ-opioid receptor which results in blocking the action of opioid drugs in the gut in order to alleviate their gastrointestinal side effects.1
2.2.1 Opioid induced constipation (OIC)
According to the CS, opioids are routinely used as analgesics in the United Kingdom (UK) and physicians are guided to use analgesics by the World Health Organization (WHO) pain ladder approach [CS reference #17].1 The CS reported that opioids are associated with a variety of side-effects such as sedation, lethargy, pruritus, gastrointestinal side-effects and a considerable risk of addiction [CS references #18 and #24].1 Potential side effects included opioid-induced bowel dysfunction (OBID) which encompasses a variety of symptoms such as nausea, vomiting, bloating, and gastro-intestinal reflux.1
The CS cited two different sources for the Rome IV classification of OIC.1-3 Both classifications agreed that OIC is defined by “new or worsening symptoms of constipation when initiating, changing or increasing opioid therapy, which must include two or more of the symptoms defining functional constipation (i.e. straining, lumpy or hard stools, sensation of incomplete evacuation and/or anorectal blockage, need for manual defaecation, <3 SBM [spontaneous bowel movements] per week) with the same frequency cut off (25%)”.4 However, the newer source for the Rome IV classification of OIC cited an European expert consensus statement, adding a second point, namely that “loose stools rarely present without the use of laxatives”.2
2.2.1.1 Use of naldemedine
The CS proposed that naldemedine can be used either as monotherapy or in combination with other laxatives in adult patients, previously treated with laxatives for OIC.1 Based on the previous technology appraisal (TA) 345 for naloxegol, the company suggested three scenarios for the use in the National Health Service (NHS) England and Wales in these cases:
1. As monotherapy as an alternative to second-line laxative in patients with OIC 2. In combination therapy as an alternative to combination laxative therapy in patients with mixed
aetiology constipation (which includes OIC) 3. As an alternative to naloxegol in patients with OIC
In this context, the company stated that the treatment with naldemedine needs to be discontinued if the treatment with the opioid analgesic is being discontinued.5 See sections 3.1 and 3.3 for further details.
The CS stated that for patients who need opioids for an extended period, whether for cancer or for non-cancer pain, it is to be expected that they also require long-term management of the subsequent constipation.1 The CS claimed that the treatment with drugs (other than µ-opioid antagonists) can lead

CONFIDENTIAL UNTIL PUBLISHED
23
to compromised pain control, coping and bowel evacuation self-management techniques, and lower quality of life, especially if the treatment with opioids is initiated in primary care.6
2.2.1.2 Laxative inadequate response (LIR)
The company reported that laxative inadequate response is defined as <3 bowel movements (BM) and ≥1 Patient Assessment of Constipation Symptoms (PAC-SYM) scored moderate, severe, or very severe and classified differently depending on the intensity of the treatment with laxatives as:
1* LIR defined as sufficient laxative use (use of at least one laxative agent from a class ≥4 times in the last two weeks) [No reference provided]
2* LIR was defined as sufficient laxative use of agents from two different classes (use of at least two laxative agents from at least two different classes ≥4 times each in the last two weeks) [No reference provided]
ERG comment: The CS presented two slightly discrepant Rome IV definitions for OIC. Looking at the website of the Rome foundation7, the publication by Mearin and Lacy et al. 2016.8 seems to present the original definition for OIC which is in line with the classification in the European expert consensus statement2 that was also cited in the CS1. However, the latter was not correctly presented in the CS as there are two separate points that need to apply, see Table 2.1 for a definition according to Mearin and Lacy et al. 2016.8
Furthermore, the CS gave definitions of LIR in section B1.2.3 but it is not clear whether this describes the results in their own Clinical Practice Research Datalink (CPRD) study [no reference provided] or whether it should be linked to a paper by Coyne et al. 2014.1, 9
Table 2.1: Diagnostic criteria for opioid-induced constipation
Item Criterion
#1 New, or worsening, symptoms of constipation when initiating, changing or increasing opioid therapy that must include two or more of the following: Straining during more than one-fourth (25%) of defaecations Lumpy or hard stools (BSFS 1–2) more than one-fourth of the time Sensation of incomplete evacuation more than one-fourth (25%) of the time Sensation of anorectal blockage/obstruction in more than one-fourth (25%) of defaecations Manual manoeuvres to facilitate more than one-fourth (25%) of defaecations, e.g. digital evacuation, support of the pelvic floor Fewer than three spontaneous bowel movements per week
#2 Loose stools rarely present without the use of laxatives Based on Mearin and Lacy et al. 20168 BSFS = Bristol Stool Form Scale
2.2.2 Epidemiology of opioid induced constipation
The CS presented information on a range of incidences and prevalences such as prevalence and incidence of OIC, prevalence of opioid prescriptions, and prevalence of LIR. According to the CS, the case for naldemedine treatment was focused on routine primary and secondary care OIC management.1
2.2.2.1 Opioid-induced bowel dysfunction (OBID)
The company stated that OBID can be considered to occur at some stage in all patients that continue opioid therapy for pain relief over an extended period and that a systematic review on chronic non-cancer pain patients found that overall prevalence rate of OBID was 41% of patients on oral opioids

CONFIDENTIAL UNTIL PUBLISHED
24
enrolled in an randomised controlled trial (RCT) and that at least 90% report constipation as a major side-effect of their opioid treatment when actively questioned.10, 11
2.2.2.2 Opioid-induced constipation (OIC)
According to the CS, it was estimated that OIC occurs in 51 to 87% of patients receiving opioids for cancer and in 41 to 57% of patients receiving opioids for chronic non-cancer pain.4, 12, 13 Section 1.4.1 of the CS provided a fourth estimate for the OIC prevalence (81%) but did not specify which population they were referring to.1, 6
Reported incidence estimates for OIC in the CS included 3 to 66% in opioid patients, 41% based on a meta-analysis of 11 placebo-controlled RCTs in patients with non-malignant pain [CS references #20, #78, #79]. For patients with an opioid treatment of at least 4 weeks duration the overall incidence based on a retrospective cohort study in two university affiliated outpatient departments was reported to be 49% in the CS [CS reference #80].
2.2.2.3 Laxative inadequate response (LIR)
According to the CS, literature focussing on the prevalence of LIR in patients with OIC is sparse.1 The CS cites results from the Clinical Practice Research Datalink (CPRD) study, conducted by the company in the UK, in which “the prevalence of patients with laxative stable treatment ranged between 45.9% to 60.2%, depending on the strengths of the opioids they were treated with”.1
Another study cited in the CS (Coyne et al. 2016) reported that “the prevalence of non-cancer and cancer patients with laxative inadequate response to one or more laxative class in the German subsample (n=115) of the study ranges between 22.4% - 89.7%”.14
ERG comment: The NICE scope reported prevalences for OIC of 45% to 57% for non-cancer pain patients and of 90% for cancer related pain patients.15 The CS reported a fair number of prevalence estimates for OBID, OIC, and for the frequency of an inadequate response to laxatives but in many instances the references provided seem to be incorrect or mixed up or are even completely missing. Examples of this issue are presented in Table 2.2.
Therefore, any background information provided in the CS should be interpreted with some caution. While the ERG checked a number of references provided in the CS, it could not establish the correct source documents for many of the prevalences cited or indeed check these estimates.

CONFIDENTIAL UNTIL PUBLISHED
25
Table 2.2: Examples of cited incidences and prevalences and data found in the literature
Reported in CS Estimates found be ERG
Population Estimate Source in original CS (reference cited in CS)
Population reported in cited reference
Estimate reported in cited reference
Comments
Cancer pain OIC: 51 to 87%
CS section 1.3.1, page 13, line 303ff (Drewes et al. 2016, Glare et al. 2006, Tuteja et al. 2010)4, 12, 13
Cancer patients12 OIC: 94% Whilst checking other references it was found that the correct reference for both estimates in the CS may be the publication by Farmer et al.2
Cancer pain13 OIC reported in at least one questionnaire: 60% In all 4 questionnaires provided over 4 weeks: 23%
Chronic non-cancer pain
OIC: 41 to 57%
Non-cancer patients12 OIC: 41-57%
Non-cancer pain [CS #30]
OIC: 46.9% Tuteja et al.4 cite another paper with a 41% prevalence + states that it usually lies between 40% and 50%
OBID: 41% OIC: 90%
CS section B1.1, page 7 line 220 (SR, Robinson et al. 2000, Rauck et al. 2006)10, 11
Protocol of a SR on cancer patients11 Methods of RCT in lower back pain patients comparing two opioids10a
None The ERG has not tried to find the publications of the results of the SR/RCT these publications of the methods refer to.
a Conference abstract only CS = company submission; ERG = Evidence Review Group; OBID = opioid-induced bowel dysfunction; OIC = opioid-induced constipation; RCT = randomised controlled trial; SR = systematic review

CONFIDENTIAL UNTIL PUBLISHED
26
2.3 Critique of company’s description of underlying health problem
Three different populations are targeted in the CS:
1. An alternative to second-line laxative monotherapy in patients with OIC 2. An alternative to combination-laxative therapy in patients with mixed aetiology constipation
(which includes OIC) when combined with existing laxative therapy 3. An alternative to naloxegol in patients with OIC who have previously had an inadequate
response to laxative treatment/s.
In response to the request for clarification, the company also included the data on OIC in cancer pain in the economic model.16
The intervention was naldemedine 0.2 mg which was administered without any rescue medication in the COMPOSE-1 and -2 trials. All randomised trials compared naldemedine to placebo, both the COMPOSE-1 and -2 trials were combined with rescue bisacodyl in the placebo arm. In contrast, in COMPOSE-3 naldemedine was combined with stable laxative treatment compared to stable laxative treatment alone and rescue medication was permitted both in the intervention and comparator arm. COMPOSE-4 compared the effects of naldemedine vs. placebo in patients with stable cancer. Primary outcome was the proportion of patients achieving a response in COMPOSE-1, COMPOSE-2, and COMPOSE-4 and summary measures of TEAEs in COMPOSE-3.
ERG comment: The outcomes reported reflected the outcomes listed in the NICE scope. In a fair number of instances, only graphic results but no numeric results were presented. Further ERG comments on those issues are presented in sections 3.4 and 4.2.6.
2.4 Critique of company’s overview of current service provision
In response to the request for clarification, the company suggested two different flowcharts in order to place naldemedine in the clinical pathway. In both instances, the use of naldemedine was suggested after the use of other laxatives.16 However, at the same time the subsequent addition of other laxatives to naldemedine would remain an option, see Figures 2.1 and 2.2.
Figure 2.1: A pragmatic stepwise suggestion for the management of OIC in clinical practice indicating a broad positioning of naldemedine
Based on Figure 1 of the response to request for clarification16 OIC = opioid-induced constipation
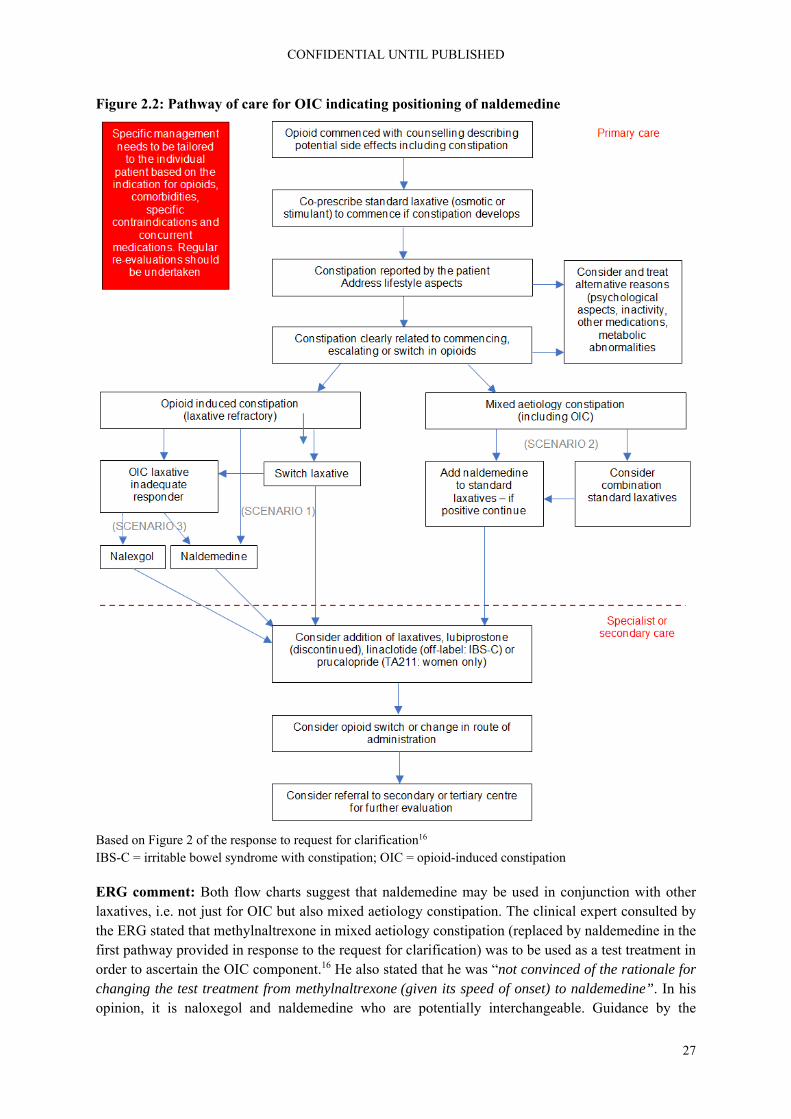
CONFIDENTIAL UNTIL PUBLISHED
27
Figure 2.2: Pathway of care for OIC indicating positioning of naldemedine
Based on Figure 2 of the response to request for clarification16 IBS-C = irritable bowel syndrome with constipation; OIC = opioid-induced constipation
ERG comment: Both flow charts suggest that naldemedine may be used in conjunction with other laxatives, i.e. not just for OIC but also mixed aetiology constipation. The clinical expert consulted by the ERG stated that methylnaltrexone in mixed aetiology constipation (replaced by naldemedine in the first pathway provided in response to the request for clarification) was to be used as a test treatment in order to ascertain the OIC component.16 He also stated that he was “not convinced of the rationale for changing the test treatment from methylnaltrexone (given its speed of onset) to naldemedine”. In his opinion, it is naloxegol and naldemedine who are potentially interchangeable. Guidance by the

CONFIDENTIAL UNTIL PUBLISHED
28
European Medicines Agency (EMA) suggests that rescue medicine should be offered in trials on idiopathic chronic constipation and that in general trials on OIC should be similar.17 Even though the company suggested that naldemedine could be used in conjunction with other laxatives, data on the proportion of patients needing rescue laxatives were only reported for the COMPOSE-3 trial.
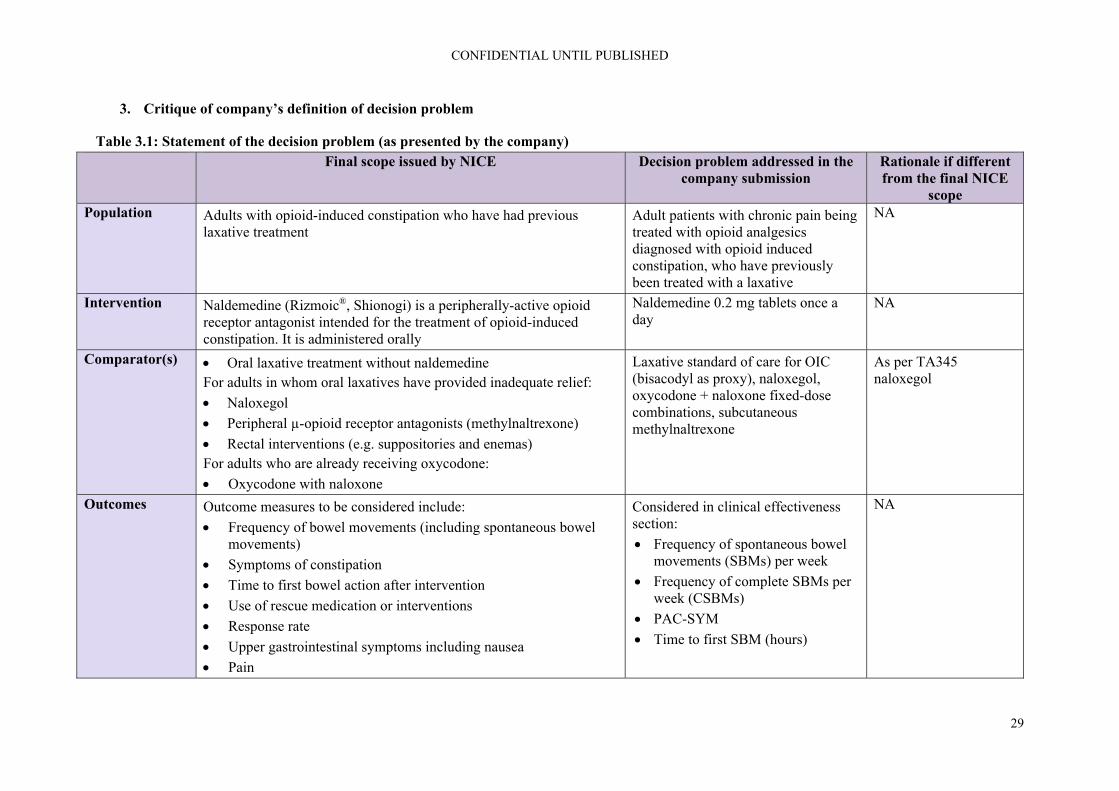
CONFIDENTIAL UNTIL PUBLISHED
29
3. Critique of company’s definition of decision problem
Table 3.1: Statement of the decision problem (as presented by the company) Final scope issued by NICE Decision problem addressed in the
company submission Rationale if different from the final NICE
scope Population Adults with opioid-induced constipation who have had previous
laxative treatment Adult patients with chronic pain being treated with opioid analgesics diagnosed with opioid induced constipation, who have previously been treated with a laxative
NA
Intervention Naldemedine (Rizmoic®, Shionogi) is a peripherally-active opioid receptor antagonist intended for the treatment of opioid-induced constipation. It is administered orally
Naldemedine 0.2 mg tablets once a day
NA
Comparator(s) Oral laxative treatment without naldemedine For adults in whom oral laxatives have provided inadequate relief:
Naloxegol
Peripheral µ-opioid receptor antagonists (methylnaltrexone)
Rectal interventions (e.g. suppositories and enemas) For adults who are already receiving oxycodone:
Oxycodone with naloxone
Laxative standard of care for OIC (bisacodyl as proxy), naloxegol, oxycodone + naloxone fixed-dose combinations, subcutaneous methylnaltrexone
As per TA345 naloxegol
Outcomes Outcome measures to be considered include:
Frequency of bowel movements (including spontaneous bowel movements)
Symptoms of constipation
Time to first bowel action after intervention
Use of rescue medication or interventions
Response rate
Upper gastrointestinal symptoms including nausea
Pain
Considered in clinical effectiveness section:
Frequency of spontaneous bowel movements (SBMs) per week
Frequency of complete SBMs per week (CSBMs)
PAC-SYM
Time to first SBM (hours)
NA

CONFIDENTIAL UNTIL PUBLISHED
30
Final scope issued by NICE Decision problem addressed in the company submission
Rationale if different from the final NICE
scope Effects on analgesic efficacy
Adverse effects of treatment
Health-related quality of life
Proportion using rescue medication during treatment period
Upper GI symptoms
Numerical Pain Rating Scale
Clinical Opiate Withdrawal Scale & Subjective Opiate Withdrawal Scale
Total daily dose of opioid
Treatment emergent adverse events
PAC-QOL Considered in cost effectiveness section:
Frequency of SBMs (health state criterion)
Time to first SBM (assumption of rapid onset of health benefits)
Adverse effects of treatment (first model cycle)
Use of rescue medication (costs)
Health-related quality of life (health state utility [EQ-5D])
Economic analysis
The reference case stipulates that the cost effectiveness of treatments should be expressed in terms of incremental cost per quality-adjusted life year. If the technology is likely to provide similar or greater health benefits at similar or lower cost than technologies recommended in published
NA NA

CONFIDENTIAL UNTIL PUBLISHED
31
Final scope issued by NICE Decision problem addressed in the company submission
Rationale if different from the final NICE
scope NICE technology appraisal guidance for the same indication, a cost-comparison may be carried out.
Subgroups to be considered
If the evidence allows the following subgroups will be considered: reason for taking opioids (cancer or non-cancer pain) Guidance will only be issued in accordance with the marketing authorisation. Where the wording of the therapeutic indication does not include specific treatment combinations, guidance will be issued only in the context of the evidence that has underpinned the marketing authorisation granted by the regulator.
The economic case for naldemedine is presented through three main subgroups covering the main therapeutic positions for the product in the treatment of OIC: 1. An alternative to second-line
laxative monotherapy in patients with OIC;
2. An alternative to combination-laxative therapy in patients with mixed aetiology constipation (including OIC) when combined with existing laxative therapy; and as
3. An alternative to naloxegol in patients with OIC who have previously had an inadequate response to laxative treatment/s.
The economic case for cancer patients will not be presented in this submission as per TA345 naloxegol
Based on Table 2 of the CS1and Company response to clarification16 CSBM = complete spontaneous bowel movement; EQ-5D = European Quality of Life-5 Dimensions; GI = gastrointestinal; NA = not applicable; NICE = National Institute for Health and Care Excellence; OIC = opioid-induced constipation; PAC-QOL = Patient Assessment of Constipation Quality of Life; PAC-SYM = Patient Assessment of Constipation Symptoms; SBM = spontaneous bowel movement; TA = technology appraisal
CONFIDENTIAL UNTIL PUBLISHED
32
3.1 Population
The NICE scope defined the relevant population as “adults with opioid-induced constipation who have had previous laxative treatment”15 while the decision problem addressed in the CS is narrower due to the reference to chronic pain, i.e. “adult patients with chronic pain being treated with opioid analgesics diagnosed with opioid induced constipation, who have previously been treated with a laxative”.1
In the CS, the company presented the economic case for three scenarios targeting different population groups1:
1. An alternative to second-line laxative monotherapy in patients with OIC 2. An alternative to combination-laxative therapy in patients with mixed aetiology
constipation (which includes OIC) when combined with existing laxative therapy 3. An alternative to naloxegol in patients with OIC who have previously had an inadequate
response to laxative treatment/s
The company stated that these scenarios were based on the analysis strategy of the previous TA345 for naloxegol.5 Scenario 3 used the results from an indirect treatment comparison (ITC) between naldemedine and naloxegol.
The company presented evidence from the COMPOSE programme of trials. This included:
Three phase 2, randomised, double-blind, placebo-controlled dose-finding studies - two in patients with chronic non-cancer pain (V9214 and V9221), and one in patients with cancer (V9222)
Four randomised, double-blind, placebo-controlled studies - three in patients with chronic non-cancer pain (COMPOSE-1, COMPOSE-2, and COMPOSE-3), and one in patients with cancer (COMPOSE-4)
Three phase 3 single-arm, open-label studies (COMPOSE-5, COMPOSE-6 and COMPOSE-7)
The three randomised trials in patients with chronic non-cancer pain (COMPOSE-1, COMPOSE-2, and COMPOSE-3) were multinational. Twenty-nine of patients in COMPOSE-1 and 57 of patients in COMPOSE-3 were from the UK. There were no participants from the UK in COMPOSE-2. COMPOSE-4 and COMPOSE-5, the main cancer studies, were conducted in Japan.
ERG comment: The ERG had a number of concerns regarding the population in the CS.
Data from COMPOSE-1, -2 and -3 (patients with non-cancer pain) were used in the economic model. Data from COMPOSE-4 and COMPOSE-5 (the cancer studies) were not originally included in the economic model. Given that the NICE scope listed reasons for taking opioids (cancer pain or non-cancer pain) as a relevant subgroup, the ERG asked the company to justify their omission from the model and to clarify if patients with cancer were part of the decision problem in the company submission.18 In response, the company stated that “in the original submission, Shionogi adopted the principle set out in the Final Appraisal Determination of TA3455 by which “the Committee was persuaded that naloxegol would be equally effective in people with cancer who have OIC []”. This was based on the testimony of clinical experts “that naloxegol targets the OIC, rather than the underlying condition causing the pain”“.16
It is important that for TA345 “the Committee noted that both KODIAC 4 and 5 specifically excluded people with cancer”, i.e. that in the absence of trial evidence an assumption had to be made based on clinical opinion.5 While the clinical expert for the ERG agreed with the aforementioned assumption,
CONFIDENTIAL UNTIL PUBLISHED
33
ideally, in this CS, the company should have tried addressing the highlighted evidence gap rather than just relying on expert opinion. Therefore, the ERG has some concerns regarding this approach.
Guidance of the European Medicines Agency (EMA) on treatments for chronic constipation including OIC did not expect a principle difference for the constipation caused by opioids between patients with cancer and with non-cancer pain.17 However, it does highlight a couple of reasons why effects might differ between the two populations:
1. Usually cancer patients would be expected to receive higher doses of opioids, making the OIC more difficult to treat
2. The greater severity of the underlying conditions makes it necessary to document safety separately in these patients
Subsequently, the EMA guidance described the requirements for additional safety trial(s) in the population with pain due to malignancies.17 In order to transfer efficacy data from a non-cancer population to cancer patients, a sufficiently large subgroup from the studies in non-cancer patients on high doses of opioids should be evaluated or additional short-term studies should be conducted. A “full extrapolation of efficacy will not be acceptable to the EMA due to “differences in the definition of the patient population” related to the restricted possibilities of patient recruitment in cancer-pain patients and the need to show “sustained” efficacy and long-term safety”.17
The company also cited a meta-analysis which showed the odds of being a SBM responder in COMPOSE-4 to be significantly higher than that observed in either COMPOSE-1 or 2.19 An economic evaluation of naldemedine vs. relevant comparators for OIC in cancer pain was provided response to the request for clarification and is critiqued in this report.16 The ERG remains concerned that the evidence for naldemedine in patients with cancer pain is more limited than that of non-cancer pain. COMPOSE-4 was a two-week randomised trial of naldemedine or placebo in 97 patients with cancer. COMPOSE-5, the open label study had 131 patients and lasted 12 weeks with safety as a primary outcome. Both, as stated above, were conducted in Japan. The committee will need to decide if they agree with the company’s assertion of equal or perhaps superior effectiveness in OIC in cancer patients as well as whether the Japanese studies and modelling are appropriate.
A further limitation (although this approach is based on TA345) was that the company did not model the randomised trial results directly as the trials compared naldemedine to placebo rather than the comparators in the NICE scope. Instead the trial populations were used to create population groups to represent the scenarios above which the company propose will reflect those who will receive naldemedine in practice. A fuller discussion of this approach can be found in section 3.3.
The ERG was additionally concerned about the applicability of scenario 2, described as “an alternative to combination-laxative therapy in patients with mixed aetiology constipation (which includes OIC) when combined with existing laxative therapy”, as this appeared to be out of scope. In response to request for clarification, the company stated that “in specifying scenario 2 as concerning patients with mixed aetiology constipation (which includes OIC), Shionogi have attempted to align the anticipated use case for naldemedine in combination with standard laxatives with contemporary European clinical consensus on the management of OIC2“.16, 18 They further stated that “The clinical advisory board convened by Shionogi in September 2018 confirmed that OIC is commonly concomitant to functional constipation in both non-cancer- and cancer-pain patients, endorsing the clinical construct of ‘mixed aetiology constipation’. They also considered naldemedine, through its action as an antagonist at the µ-opioid receptors in GI tract tissue,20 to be suitable for managing the OIC-component of such

CONFIDENTIAL UNTIL PUBLISHED
34
patients”.16 The committee will need to decide if patients with mixed aetiology are part of the scope and, if so, at what stage in the pathway might naldemedine be offered.
As noted above, two of the three main trials in patients with non-cancer OIC (COMPOSE-1 and COMPOSE-3) included some UK patients but COMPOSE-2 did not. The company was asked if they considered the patients in the COMPOSE trials to reflect those seen in clinical practice in England and if so to provide supporting evidence. The company provided tabulated data and stated that “there is no statistical significance between any of the baseline characteristics for those from the UK compared to the overall ITT cohorts in their respective trials.”16 The clinical expert consulted by the ERG considered the patient characteristics (age, gender balance, BMI) in the three trials to be reflective of a UK population. He commented that, based on the bowel movements at baseline, the population could be more severe than those seen in the UK. A further difference was the breakdown of opioids used in the trials. This issue is examined in more detail in Section 4.2.4 of this report.
3.2 Intervention
The intervention (naldemedine (Rizmoic®) is in line with the NICE scope. Regulatory approval by the EMA has been received and naldemedine is authorised for the treatment of opioid-induced constipation (OIC) in adults who have previously been treated with a laxative.17
Naldemedine is a peripherally acting µ-opioid receptor antagonist (PAMORA). It is administered orally at the recommended dose of 0.2 mg (one tablet daily). As naldemedine works by attaching to and blocking receptors in the gut, and molecules of naldemedine were designed not to be able to enter the brain, it does not prevent opioids from working on pain receptors in the brain. The company stated that no specific additional tests are required whilst taking naldemedine. When a patient stops taking opioids naldemedine should be stopped.
In the randomised trials COMPOSE-1 and -2, naldemedine was designed to be used alone and patients had to be willing to discontinue or not be using any current laxatives. In the COMPOSE-3 and -4 randomised trials, patients with a stable regimen were not excluded. In all trials rescue laxatives were permitted.
ERG comment: The licence for naldemedine requires patients to have had prior treatment with a laxative.1 The committee will need to consider how the decision to prescribe naldemedine might be taken in practice and how long patients might be expected to take prior laxatives before being prescribed naldemedine. The pathway outlined in the CS and response to request for clarification appeared to suggest that naldemedine might be offered as soon as it is clear that constipation is clearly related to commencing, escalating or switching opioids.1, 16
3.3 Comparators
The company stated that they evaluated the same comparators as the previous appraisal of naloxegol (TA345).5 These were: “laxative standard of care for OIC (bisacodyl as proxy), naloxegol, oxycodone+naloxone fixed-dose combinations and subcutaneous methylnaltrexone”.1
The randomised trials in the COMPOSE programme all compared naldemedine to placebo. The company stated that “given the absence of head-to head trials including laxatives as a comparator, the comparative efficacy of naldemedine and laxative in the company base case is informed by post hoc analysis of the pooled trial data”.1 Data on patients receiving naldemedine but no rescue bisacodyl were compared to patients receiving placebo and rescue bisacodyl in COMPOSE-1 and -2. This was used to represent the scenario above where naldemedine is an alternative to second-line laxative monotherapy
CONFIDENTIAL UNTIL PUBLISHED
35
in patients with OIC. Using COMPOSE-3, patients on a stable laxative and naldemedine with no rescue bisacodyl were compared to those on a stable laxative receiving rescue bisacodyl. This was to represent the scenario above where naldemedine is an alternative to combination-laxative therapy in patients with mixed aetiology constipation (which includes OIC) when combined with existing laxative therapy.
The company cited a previously conducted network meta-analysis of pharmacological therapies in OIC.21 They also conducted an indirect comparison of naldemedine (using the trials COMPOSE-1 and -2) and naloxegol (using the trials KODIAC-4 and -5). This was to represent the company’s third scenario where naldemedine is an alternative to naloxegol in patients with OIC who have previously had an inadequate response to laxative treatment/s.
ERG comment: As stated above, there is no direct evidence comparing naldemedine to any of the relevant comparators detailed in the NICE scope.15 The comparison between naloxegol and naldemedine is based on an indirect comparison.
The use of rescue bisacodyl as a proxy for second-line treatment is limited. The clinician consulted by the ERG stated that “in UK practice clinicians will frequently use lactulose or a PEG based laxative as first line therapy”. However, he did not consider it unreasonable to use rescue bisacodyl as a proxy.
3.4 Outcomes
The primary outcome of the 12-week RCTs COMPOSE-1 and -2 was the proportion of SBM responders as recorded in an e-diary. Responders were defined as patients with ≥9/12 positive-response weeks and ≥3 positive-response weeks out of the last four weeks. A positive response week was defined as ≥3 SBM/week and ≥1 SBM/week increase from baseline. The primary outcome of the 52-week COMPOSE-3 trial was treatment-emergent adverse events.
In COMPOSE-4 (the two-week RCT in cancer patients) the primary outcome was again the proportion of SBM responders as recorded in a patient diary. In this trial, responders were patients with ≥3 SBMs/week and an increase of ≥1 SBM/week from baseline (average number SBMs/week in two weeks prior to screening).
ERG comment: The outcomes evaluated by the company largely reflected the NICE scope. However not all outcomes in the CS were clearly reported. Further information was provided by the company in response to clarification but the ERG still did not consider reporting of trial outcomes to be optimal.16
3.5 Other relevant factors
In the section on equality (B1.5 in the CS), the company highlighted barriers to good pain management and suggested that “the use of naldemedine should support optimisation of chronic pain management and potentially improve the dialogue between patient and clinician both in the multidisciplinary and general prescribing environments”.1 They did not state that naldemedine would raise any issues relating to equality of access to treatments.
There is no Patient Access Scheme (PAS) application. The list price of naldemedine is £41.72 for a 28-tablet pack. The cost of a course of treatment is governed by the continued duration of opioid therapy.
CONFIDENTIAL UNTIL PUBLISHED
36
4. Clinical effectiveness
4.1 Critique of the methods of review(s)
The company conducted a systematic review in 2017 which was updated in 2019 to identify evidence on naldemedine and relevant comparators for the treatment of opioid-induced constipation. Section 4.1 critiques the methods of the review including searching, inclusion criteria, data extraction, quality assessment and evidence synthesis.
4.1.1 Searches
A revised Appendix D was provided at clarification including additional details of the updated grey literature searches, the dates and resources recorded below are from the revised document.22
Table 4.1: Identification of clinical evidence
Search strategy element
Resource Host/Source Date range Original search: date searched
Update search: date searched
Electronic databases
MEDLINE Ovid 1946-Date searched
12/06/17* 20/5/19
MEDLINE In-Process & Other Non-Indexed
MEDLINE Daily Update
MEDLINE Epub ahead of print
Embase 1974- Date searched
12/06/17* 20/5/19
CDSR Wiley Issue 6 of 12, June 2017
12/06/17 20/5/19
DARE Issue 2 of 4, April 2015
12/06/17 NA
CENTRAL Issue 5 of 12, May 2017
12/06/17 20/5/19
Conference proceedings
The American Academy of Pain Medicine (AAPM) Annual Meeting
Years: 2015-2018
14-17/07/17 18-19/06/19
American Pain Society (APS) Annual Scientific Meeting
Years: 2016-2019
14-17/07/17 18-19/06/19
International Association for the Study of Pain (IASP) World Congress on Pain
Years: 2016 14-17/07/17 No information
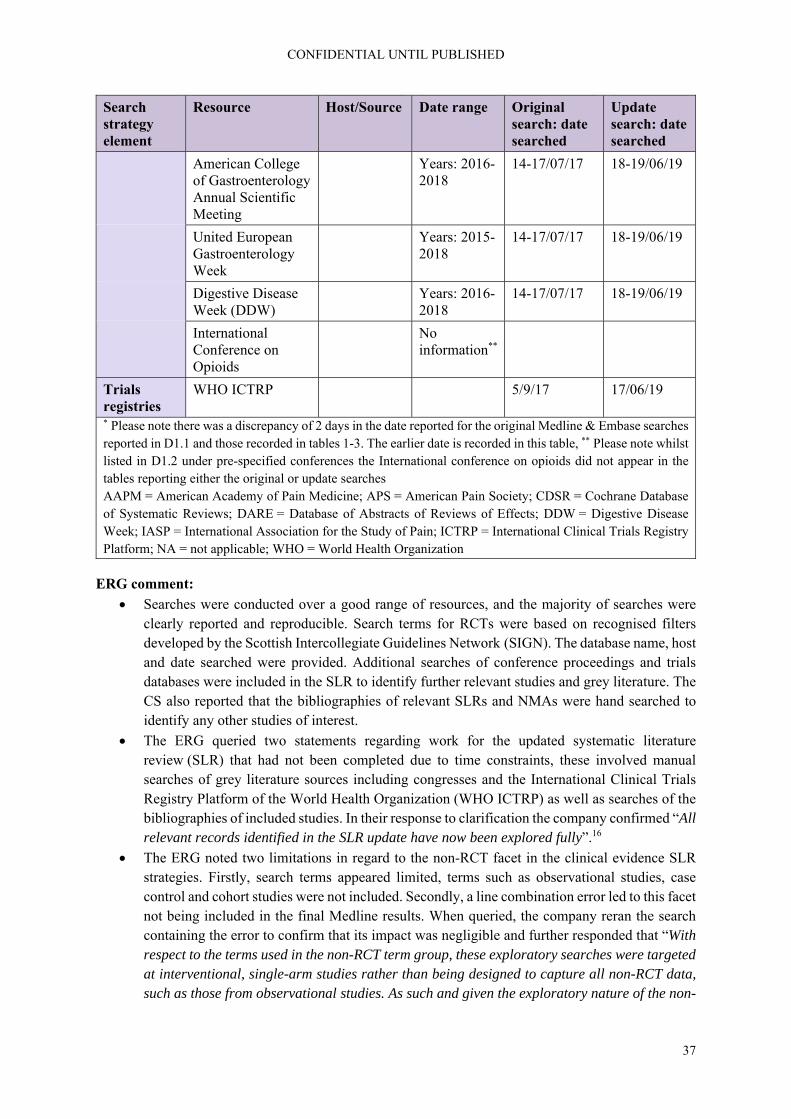
CONFIDENTIAL UNTIL PUBLISHED
37
Search strategy element
Resource Host/Source Date range Original search: date searched
Update search: date searched
American College of Gastroenterology Annual Scientific Meeting
Years: 2016-2018
14-17/07/17 18-19/06/19
United European Gastroenterology Week
Years: 2015-2018
14-17/07/17 18-19/06/19
Digestive Disease Week (DDW)
Years: 2016-2018
14-17/07/17 18-19/06/19
International Conference on Opioids
No information**
Trials registries
WHO ICTRP 5/9/17 17/06/19
* Please note there was a discrepancy of 2 days in the date reported for the original Medline & Embase searches reported in D1.1 and those recorded in tables 1-3. The earlier date is recorded in this table, ** Please note whilst listed in D1.2 under pre-specified conferences the International conference on opioids did not appear in the tables reporting either the original or update searches AAPM = American Academy of Pain Medicine; APS = American Pain Society; CDSR = Cochrane Database of Systematic Reviews; DARE = Database of Abstracts of Reviews of Effects; DDW = Digestive Disease Week; IASP = International Association for the Study of Pain; ICTRP = International Clinical Trials Registry Platform; NA = not applicable; WHO = World Health Organization
ERG comment:
Searches were conducted over a good range of resources, and the majority of searches were clearly reported and reproducible. Search terms for RCTs were based on recognised filters developed by the Scottish Intercollegiate Guidelines Network (SIGN). The database name, host and date searched were provided. Additional searches of conference proceedings and trials databases were included in the SLR to identify further relevant studies and grey literature. The CS also reported that the bibliographies of relevant SLRs and NMAs were hand searched to identify any other studies of interest.
The ERG queried two statements regarding work for the updated systematic literature review (SLR) that had not been completed due to time constraints, these involved manual searches of grey literature sources including congresses and the International Clinical Trials Registry Platform of the World Health Organization (WHO ICTRP) as well as searches of the bibliographies of included studies. In their response to clarification the company confirmed “All relevant records identified in the SLR update have now been explored fully”.16
The ERG noted two limitations in regard to the non-RCT facet in the clinical evidence SLR strategies. Firstly, search terms appeared limited, terms such as observational studies, case control and cohort studies were not included. Secondly, a line combination error led to this facet not being included in the final Medline results. When queried, the company reran the search containing the error to confirm that its impact was negligible and further responded that “With respect to the terms used in the non-RCT term group, these exploratory searches were targeted at interventional, single-arm studies rather than being designed to capture all non-RCT data, such as those from observational studies. As such and given the exploratory nature of the non-

CONFIDENTIAL UNTIL PUBLISHED
38
RCT searches, a fully comprehensive search strategy for non-RCTs was not employed.”16 This approach may have limited the recall on searches for both adverse events and HRQoL literature.
The company confirmed at clarification that the searches reported in D1 were intended to inform section B2.10 (Adverse events).16 While the searches outlined would have retrieved some relevant information in these areas, the addition of a trials filter and limited non-RCT facet may have resulted in relevant references being missed. Guidance by the Centre for Reviews and Dissemination (CRD)23 recommends that if searches have been limited by a study design filter, additional searches should be undertaken to ensure that adverse events that are long-term, rare or unanticipated are not missed.
Please note the searches reported in Appendix D1 of the CS were also intended to identify HRQoL literature, the ERGs critique of this approach can be found in section 5.1.1, searches performed for cost effectiveness section.
4.1.2 Inclusion criteria
As stated above, the company conducted a systematic review to identify evidence on naldemedine and relevant comparators for the treatment of opioid-induced constipation. Inclusion and exclusion criteria for the review are reproduced in Appendix 1 of this report. Briefly, the population comprised adult participants with OIC who have cancer or chronic non-cancer pain and are receiving a regimen of opioids. Interventions included osmotic agents, stimulant laxatives, emollient laxatives, lubricant laxatives, opioid receptor antagonists, PAMORAs, best supportive care including enemas and disimpaction and any combination of relevant interventions and relevant interventions in combination with bulk-forming laxatives. Comparators were placebo, usual care or any intervention of interest. Studies needed to be in English. The systematic review was intended to focus on “efficacy, safety, tolerability and health-related quality of life (HRQoL) outcomes”.22 The company stated that “given the availability of RCT data in this indication, it was considered appropriate to limit to RCT data only within the SLR”.22
The company stated that “abstracts and full texts were screened by two independent reviewers and disputes relating to eligibility were resolved through discussion between reviewers until consensus was reached. If necessary, a third reviewer was consulted to adjudicate the final decision”.22
ERG comment:
Two reviewers were involved in the selection of studies for the reviews which helps to minimise bias and error.
Generally, it is expected that non-randomised trials will be considered in a systematic review to examine safety concerns in more detail. However, the ERG notes that the CS included details of the open label studies in the COMPOSE programme. Therefore, adequate data are provided for the safety of naldemedine although data relating to the relative safety of naldemedine in relation to other comparators are not provided.
The ERG asked a number of questions at clarification to which the company provided satisfactory responses:
The ERG queried how many studies were rejected solely on the basis of not being published in English. The company confirmed that “of the few records which were excluded solely on the basis of being written in a language other than English, none were considered relevant to the SLR”.16
The ERG asked what age was used to define adults for the systematic review and if any studies were included when only a proportion of patients were adults. The company responded that

CONFIDENTIAL UNTIL PUBLISHED
39
“there was no pre-specified age used to define adults in the SLR. However, study author definitions of patients aged 18 years and over were considered appropriate and relevant. No studies that reported including only a proportion of adult patients were included in the SLR”.16
The ERG questioned whether all patients had to have OIC or were patients taking agents to prevent OIC also included. The company responded that “only studies where all patients had OIC at baseline were included in the SLR as this was a pre-defined eligibility criterion of the SLR. A proportion of patients may also have been using laxatives at baseline or have previously used laxatives, which are usually given with opioids in an effort to prevent OIC. However, for studies to be eligible for inclusion in the SLR, any patients currently using laxatives must still have had OIC”.16
The ERG asked the company to confirm that no results were available for the comparison with rectal interventions, a comparator listed in the NICE scope. The company responded that “although studies of rectal interventions were eligible for inclusion in the SLR, no relevant studies investigating enemas or disimpaction were found”.16
4.1.3 Critique of data extraction
The company stated that “full texts which were deemed ultimately eligible for inclusion in the review were extracted by one reviewer and checked by a second reviewer”.22
ERG comment: Recommended procedures for data extraction in a systematic review appeared to have been followed.
4.1.4 Quality assessment
The company assessed the quality of the randomised trials and the open label studies using an adaptation of CRD’s guidance.23 Elements assessed were randomisation, allocation concealment, baseline comparability, blinding, dropout imbalances, selective outcome reporting and use of intention to treat analysis.
No information was provided on the number of reviewers who assessed the quality of included studies.
ERG comment: It is normally recommended that two reviewers are involved in the assessment of study quality to avoid bias and error. It was further noted that no supporting statements for the quality assessment of COMPOSE-4 were provided. Results of the company’s quality assessment and the ERG’s comments are presented in section 4.2.5.
4.1.5 Evidence synthesis
The randomised trials in the COMPOSE programme all compared naldemedine to placebo. The company stated that “given the absence of head-to head trials including laxatives as a comparator, the comparative efficacy of naldemedine and laxative in the company base case is informed by post hoc analysis of the pooled trial data”.1 Data on patients receiving naldemedine but no rescue bisacodyl were compared to patients receiving placebo and rescue bisacodyl in COMPOSE-1 and -2. This was used to represent the scenario where naldemedine is an alternative to second-line laxative monotherapy in patients with OIC (scenario 1, see section 3.1). Using COMPOSE-3, patients on a stable laxative and naldemedine with no rescue bisacodyl were compared to those on a stable laxative receiving rescue bisacodyl to represent the scenario where naldemedine is an alternative to combination-laxative therapy in patients with mixed aetiology constipation (which includes OIC) when combined with existing laxative therapy (scenario 2).

CONFIDENTIAL UNTIL PUBLISHED
40
The company cited a previously conducted network meta-analysis of pharmacological therapies in OIC.21 They also conducted an ITC of naldemedine (using the trials COMPOSE-1 and -2) and naloxegol (using the trials KODIAC-4 and -5). This was to represent the company’s third scenario of interest where naldemedine is an alternative to naloxegol in patients with OIC who have previously had an inadequate response to laxative treatment/s.
ERG comment:
As stated above, there is no direct evidence comparing naldemedine to any of the relevant comparators detailed in the NICE scope.15 The use of rescue bisacodyl as a proxy for second-line treatment is limited.
The evidence comparing naloxegol and naldemedine was based on an indirect comparison. Furthermore, it was not clear how the data from COMPOSE-1 and -2, or from KODIAC-4 and -5 were pooled. The ERG could not reproduce the methods and verify all results.
The ERG is concerned about the potential differences between the naldemedine and naloxegol trials particularly regarding the baseline comparability in SBM and opioid use and different definitions of OIC as well as differences regarding treatment response to laxatives. Given these differences and the discrepancies between the reported analysis methods and results the results of the indirect treatment comparison (ITC) should be interpreted with caution.
4.2 Critique of trials of the technology of interest, the company’s analysis and interpretation (and any standard meta-analyses of these)
4.2.1 Overview of the evidence for naldemedine
The CS identified the studies in Table 4.2 as relevant to this appraisal.
Table 4.2: Overview of the clinical trial programme for naldemedine
Study Number treated with naldemedine
Patient population Treatment duration
Dose-finding studies
V9214 54 Non-cancer pain with OIC Single dose
V9221 182 Non-cancer pain with OIC 4 weeks
V9222 170 Cancer pain with OIC 2 weeks
Main studies
COMPOSE-1 271 Non-cancer pain with OIC 12 weeks
COMPOSE-2 271 Non-cancer pain with OIC 12 weeks
COMPOSE-3 621 Non-cancer pain with OIC 52 weeks
COMPOSE-4 97 Cancer pain with OIC 2 weeks
Open label supportive studies
COMPOSE-5 131 Cancer pain with OIC 12 weeks
COMPOSE-6 40 Non-cancer pain with OIC 48 weeks
COMPOSE-7 10 Non-cancer pain with OIC 48 weeks Based on Table 9 of the CS1 CS = company submission; OIC = opioid-induced constipation

CONFIDENTIAL UNTIL PUBLISHED
41
ERG comment: The ERG noted that most of the evidence in the COMPOSE programme is for non-cancer pain with OIC. COMPOSE-3 is the longest and largest RCT but it is important to note that patients in this trial were permitted to continue with their previous stable laxative regimen. There has been one RCT in cancer patients (COMPOSE-4) but it is very short-term (two weeks). The open-label study in cancer (COMPOSE-5) is also relatively short (12 weeks). The company provided baseline data and trial methods for the dose finding studies at clarification as this information was not in the CS, but these studies are not discussed in this report given the availability of relevant RCTs and open label extension studies.
4.2.2 Details of included naldemedine studies
All three RCTs of non-cancer patients (COMPOSE-1, -2 and -3) were multinational. However, COMPOSE-2 did not include any UK sites. All trials were in adult patients with a confirmed diagnosis of OIC. They had to have been treated with opioids for ≥3 months and have a stable opioid regimen for ≥1 month before screening. In COMPOSE-1 and -2 patients were not using laxatives or were willing to discontinue. In COMPOSE-3 patients with a stable laxative regimen were not excluded. Rescue laxatives were permitted in all trials. The primary outcome in COMPOSE-1 and 2 was the proportion of SBM responders as recorded in an e-diary whereas in COMPOSE-3 it was treatment-emergent adverse events, see Table 4.3.
The RCT of cancer patients was located in Japan (COMPOSE-4). Patients were aged over 20 with an Eastern Cooperative Oncology Group (ECOG) performance status ≤2 and stable cancer that did not affect gastrointestinal (GI) function. Patients needed to have a stable daily dose of opioids for ≥2 weeks prior to screening. Patients with a stable laxative regimen were not excluded and rescue laxatives were permitted. The primary outcome in COMPOSE-4 was the proportion of SBM responders as recorded in a diary, see Table 4.3.
Details of the open label studies supporting the CS are given in Table 4.4.

CONFIDENTIAL UNTIL PUBLISHED
42
Table 4.3: Summary of RCT design
COMPOSE-1 COMPOSE-2 COMPOSE-3 COMPOSE-4
Location Multicentre in the USA and Europe Multicentre worldwide Multicentre in Japan
Trial design Phase III, randomised, double-blind, placebo-controlled, parallel group
Eligibility criteria for participants
Aged 18–80; confirmed diagnosis of OIC; chronic non-cancer pain treated with opioids for ≥3 months; stable opioid regimen for ≥1 month before screening
Aged >20; ECOG performance status ≤2; stable cancer that did not affect GI function; stable daily dose of opioids for ≥2 weeks prior to screening; confirmed
Not using laxatives or willing to discontinue Patients with stable laxative regimen were not excluded.
Settings and locations where data were collected
68 outpatient sites: 48 in USA 8 in UK, 2 in Austria, 4 in Czech Rep, 2 in Germany, 3 in Poland, 1 in Spain
69 outpatient sites: 54 in USA; 1 in Austria, 6 in Czech Rep, 4 in Germany, 3 in Poland, 1 in Spain
195 sites: 133 in USA; 20 in UK, 8 in Canada; 3 in Belgium, 6 in Denmark; 2 in Estonia, 2 in France; 5 in Germany, 6 in Hungary; 3 in Poland, 2 in Spain; 1 in Spain; 3 in Australia; 1 in South Africa
170 sites in Japan
Trial drugs (number in each group)
Oral naldemedine 0.2 mg QD (n=273) or matched placebo (n=272) QD taken with or without food at the same time of day for 12 weeks. 4-week follow-up followed treatment period.
Oral naldemedine 0.2 mg QD (n=276) or matched placebo (n=274) QD taken with or without food at the same time of day for 12 weeks. 4-week follow-up followed treatment period.
Oral naldemedine 0.2 mg QD (n=621) or matched placebo QD (n=619), taken with or without food at the same time of day for 52 weeks.
Oral naldemedine 0.2 mg QD (n=97) or matched placebo QD (n=96), taken with or without food at the same time of day for 2 weeks. 4-week follow-up followed treatment period.
Permitted and disallowed concomitant medication
Breakthrough pain relief (opioid/non-opioid) was permitted. Concomitant opioid antagonists, acetylcholine agonists, guanylate cyclase-C agonist, 5-HT-4 agonists, prostaglandin, mu receptor partial agonist opioids, nalorphine-like agonist/antagonist opioids, antispasmodics, antidiarrheals,
Patients maintained a stable opioid dose; rescue laxatives were permitted.
Patients maintained a stable opioid dose; rescue laxatives were permitted. Chemotherapy or other intervention likely to affect GI function not permitted.
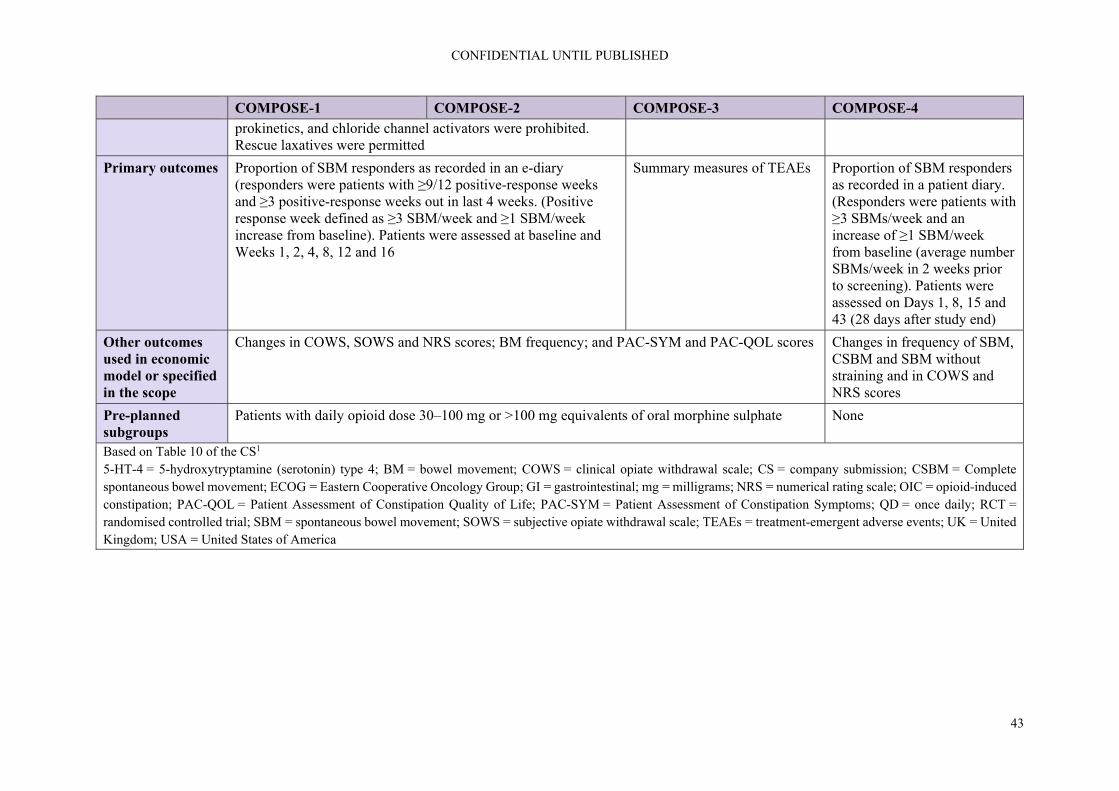
CONFIDENTIAL UNTIL PUBLISHED
43
COMPOSE-1 COMPOSE-2 COMPOSE-3 COMPOSE-4 prokinetics, and chloride channel activators were prohibited. Rescue laxatives were permitted
Primary outcomes Proportion of SBM responders as recorded in an e-diary (responders were patients with ≥9/12 positive-response weeks and ≥3 positive-response weeks out in last 4 weeks. (Positive response week defined as ≥3 SBM/week and ≥1 SBM/week increase from baseline). Patients were assessed at baseline and Weeks 1, 2, 4, 8, 12 and 16
Summary measures of TEAEs Proportion of SBM responders as recorded in a patient diary. (Responders were patients with ≥3 SBMs/week and an increase of ≥1 SBM/week from baseline (average number SBMs/week in 2 weeks prior to screening). Patients were assessed on Days 1, 8, 15 and 43 (28 days after study end)
Other outcomes used in economic model or specified in the scope
Changes in COWS, SOWS and NRS scores; BM frequency; and PAC-SYM and PAC-QOL scores Changes in frequency of SBM, CSBM and SBM without straining and in COWS and NRS scores
Pre-planned subgroups
Patients with daily opioid dose 30–100 mg or >100 mg equivalents of oral morphine sulphate None
Based on Table 10 of the CS1 5-HT-4 = 5-hydroxytryptamine (serotonin) type 4; BM = bowel movement; COWS = clinical opiate withdrawal scale; CS = company submission; CSBM = Complete spontaneous bowel movement; ECOG = Eastern Cooperative Oncology Group; GI = gastrointestinal; mg = milligrams; NRS = numerical rating scale; OIC = opioid-induced constipation; PAC-QOL = Patient Assessment of Constipation Quality of Life; PAC-SYM = Patient Assessment of Constipation Symptoms; QD = once daily; RCT = randomised controlled trial; SBM = spontaneous bowel movement; SOWS = subjective opiate withdrawal scale; TEAEs = treatment-emergent adverse events; UK = United Kingdom; USA = United States of America

CONFIDENTIAL UNTIL PUBLISHED
44
Table 4.4: Summary of open label studies design
COMPOSE-5 COMPOSE-6 COMPOSE-7
Location Multicentre in Japan
Trial design Phase III, single arm, open-label extension of study COMPOSE-4
Phase III, single arm, open-label
Eligibility criteria for participants
Aged >20; ECOG performance status ≤2; stable cancer that did not affect GI function; stable daily dose of opioids for ≥2 weeks prior to screening; confirmed diagnosis of OIC.
Confirmed diagnosis of OIC; chronic non-cancer pain treated with regular opioids
Confirmed diagnosis of OIC; chronic non-cancer pain treated with PR oxycodone
Patients with stable laxative regimen were not excluded.
No details
Settings and locations where data were collected
70 sites in Japan 21 sites in Japan 9 sites in Japan
Trial drugs (number in each group)
Oral naldemedine 0.2 mg QD (n=131) taken with or without food at the same time of day for 12 weeks.
Oral naldemedine 0.2 mg QD (n=42) taken with or without food at the same time of day for 48 weeks.
Oral naldemedine 0.2 mg QD (n=10) taken with or without food at the same time of day for 48 weeks.
Permitted and disallowed concomitant medication
Patients maintained a stable opioid dose; rescue laxatives were permitted. Chemotherapy or other intervention likely to affect GI function not permitted.
Patients maintained a stable opioid dose; rescue laxatives were permitted.
Treatment period began with 2 weeks to switch to stable oxycodone dose that was maintained throughout study. Rescue laxatives permitted
Primary outcomes
Summary measures of TEAEs
Pre-planned subgroups
None
Based on Table 10 of the CS1 CS = company submission; ECOG = Eastern Cooperative Oncology Group; GI = gastrointestinal; mg = milligrams; OIC = opioid-induced constipation; PR = prolonged release; QD = once daily; TEAEs = treatment-emergent adverse events

CONFIDENTIAL UNTIL PUBLISHED
45
ERG comment: As noted above, COMPOSE-1 and COMPOSE-3 had a number of UK patients but COMPOSE-2 did not. COMPOSE-4 took place in Japan. The applicability of the trials to a UK setting is of concern to the ERG particularly for cancer patients which have been recruited in a different healthcare setting and might differ in genetic factors.
In COMPOSE-1, 2 and 3 patients had to have been treated with opioids for ≥3 months and have a stable opioid regimen for ≥1 month before screening. The company was asked if this would also apply if naldemedine were used in clinical practice in England. The company stated that “Shionogi contend that the enrolment criteria for COMPOSE-1, -2, and -3 trials requiring that patients had to be following a stable opioid regimen for at least one month prior is consistent with usual clinical practice as evidenced by the UEG/EFIC consensus guidelines (see Figure 2), which recommend not only co-prescription of standard laxatives if constipation develops after commencing opioids in a primary care setting but also addressing lifestyle aspects if patients report constipation extant to laxative prescription. At the advisory board of UK clinical experts held in September 2018, an evaluation period of one-month for OIC interventions was considered reasonable.”16 The committee will need to take this issue into account when considering the use of naldemedine in practice.
Details of the open label studies supporting the CS are given in Table 4.4. All of these were conducted in Japan. COMPOSE-5 was an open label extension of COMPOSE-4 in cancer patients. COMPOSE-7 investigated use of naldemedine for a group of patients receiving oxycodone but had only 10 patients.
As stated above, the supporting open label studies were conducted in Japan so may be less applicable to a UK setting. COMPOSE-6 and -7 were small studies. The RCT evidence (COMPOSE-1 to -4) should be considered as the primary source of data.
4.2.3 Statistical analysis of the included naldemedine studies
Details of the sample size calculations, analysis population and statistical methods of COMPOSE-1 to -4 are provided in Table 4.5.

CONFIDENTIAL UNTIL PUBLISHED
46
Table 4.5: Statistical methods of the naldemedine RCTs
COMPOSE-1 COMPOSE-2 COMPOSE-3 COMPOSE-4
Sample size calculation
Assuming a 45% responder proportion from naldemedine 0.2 mg group and 30% responder proportion from the placebo group in the ITT population, a sample size of 540 subjects (270 subjects in each group) provides > 95% power to detect a ≥ 15% between-group difference in responder proportions with a 2-sided significance level of 0.05 by Pearson’s chi-squared test.
Assuming a 45% responder proportion from naldemedine 0.2 mg group and 30% responder proportion from the placebo group in the ITT population, a sample size of 540 subjects (270 subjects in each group) provides > 95% power to detect a ≥ 15% between-group difference in responder proportions with a 2-sided significance level of 0.05 by Pearson’s chi-squared test.
Approximately 1200 subjects, about 600 subjects per arm (1:1 randomisation ratio) were to be randomised in the study. The anticipated number of subjects and corresponding duration of treatment was fully aligned to meet or exceed the ICH Guidelines: The Extent of Population Exposure to Assess Clinical Safety for Drugs Intended for Long-term Treatment of Non-Life-Threatening Conditions. Exposures of at least 6 months for 300 to 600 subjects and of 1 year for 100 subjects in each of the study arms were anticipated.
Based on the results of a previous phase 2b study, it was conservatively assumed that the difference in the proportion of SBM responders is 23.5% between the naldemedine 0.2 mg group and the placebo group and the proportion of SBM responders is 37.5% for the placebo group based on the lower limit of 95% CI. Under these assumptions, required sample size to detect this difference with power of at least 90% and two-sided significance level of 0.05 using the chi-square test, was calculated as 94 per group. Thus, target analysis population size was set to be 188 (94 in each group).
Analysis populations
ITT population included all randomised subjects. All efficacy analyses were based on this population. The Modified ITT (mITT) Population included all randomised subjects who received at least 1 dose of study drug and completed the first 4 weeks of the study with at least 4 days of e-diary entries related to defecation per week. This
ITT population included all randomised subjects. All efficacy analyses were based on this population. The Modified ITT (mITT) Population included all randomised subjects who received at least 1 dose of study drug and completed the first 4 weeks of the study with at least 4 days of e-diary entries related to defecation per week. This
All efficacy analyses were based on the ITT population, which included all randomised subjects. Subjects were analysed by the treatment to which they were randomised to, regardless of the actual treatment received. All safety analyses were based on the Safety Population, which included all randomised subjects who received at least 1 dose of study drug. Subjects were
Full analysis set (FAS) included all randomised patients who received at least 1 actual dose of the study drug and who had an evaluation of OIC at baseline and at least 1 evaluation of OIC after the initiation of the study drug administration. Per protocol set (PPS) included all randomised patients who met all of the following conditions: Patients who met all inclusion criteria and

CONFIDENTIAL UNTIL PUBLISHED
47
COMPOSE-1 COMPOSE-2 COMPOSE-3 COMPOSE-4 population was analysed as randomised.
population was analysed as randomised.
analysed by the treatment actually received. Subjects who took naldemedine at least once were analysed as naldemedine-treated.
no exclusion criteria, patients with no major deviations from the specified study procedure, and patients with appropriate follow-up.
Analysis methods
The primary efficacy endpoint (proportion of responders) was summarised by treatment group and analysed by the Cochran Mantel Haenszel test adjusted by the opioid dose strata for the comparison between naldemedine and placebo. The primary efficacy endpoint was estimated along with its 95% confidence intervals (CIs) by treatment group. The CIs were calculated with the Clopper-Pearson method. In addition, the difference in the responder proportion adjusted by the opioid dose strata between naldemedine and placebo and its 95% CI were calculated. The primary efficacy endpoint was examined for the following subgroups and results were presented descriptively: opioid dose strata, age, body mass index (BMI), gender, race, and region (country and site). Sensitivity analyses were also performed.
The primary efficacy endpoint was the proportion of responders. The primary efficacy endpoint was summarised by treatment group and analysed by the Cochran Mantel Haenszel test adjusted by the opioid dose strata for the comparison between naldemedine and placebo. The primary efficacy endpoint was estimated along with its 95% confidence intervals (CIs) by treatment group. The CIs were calculated with the Clopper-Pearson method. In addition, the difference in the responder proportion adjusted by the opioid dose strata between naldemedine and placebo and its 95% CI were calculated. The primary efficacy endpoint was examined for the following subgroups and results were presented descriptively: opioid dose strata, age, body mass index (BMI), gender, race, and region (country and site).
Assessment of naldemedine efficacy was a secondary objective of the study. The significance level of tests was set at 0.05 (two-sided). The analysis of efficacy endpoints was not adjusted for multiplicity; hence, the p-values are purely nominal. Summary statistics for the exploratory efficacy variables (changes in total and free testosterone in males) were calculated by treatment group. Treatment-emergent adverse events (TEAEs) were adverse events (AEs) with a start date after the initial dose of study drug up to 14 days after the final dose of study drug. Incidences of TEAEs, treatment-related TEAEs (adverse drug reactions [ADRs]), TEAEs leading to discontinuation, and serious TEAEs were summarised by System Organ Class (SOC), preferred term (PT), and treatment group. Incidences of TEAEs of abdominal pain (i.e., abdominal pain, abdominal pain
The primary efficacy endpoint (proportion of SBM responders) was assessed during the 2-week Treatment Period for each treatment group. This was compared between the naldemedine group and the placebo group with the chi-square test and reported as the difference with its 95% confidence interval (CI). The proportion of patients with SBM response for each week during the 2-week treatment period was analysed in a similar way. The changes from baseline in the frequency of SBMs per week during the 2-week treatment period were compared between the naldemedine and placebo groups, based on an analysis of covariance (ANCOVA) using the frequency of SBMs per week at baseline as a covariate. The change from baseline in the frequency of CSBMs per week to the 2-week treatment period was analysed similarly.

CONFIDENTIAL UNTIL PUBLISHED
48
COMPOSE-1 COMPOSE-2 COMPOSE-3 COMPOSE-4 The mean of the change in frequency of SBM per week from baseline to the last 2 weeks of the treatment period was compared between naldemedine and placebo based on an analysis of covariance method using the opioid dose strata as a covariate. Summary statistics of the frequency of SBMs per week and its change from baseline to the last 2 weeks were calculated by treatment group. Change in the frequency of SBMs per week from baseline to Week 1; change in the frequency of CSBMs per week from baseline to the last 2 weeks of the treatment period; and change in the frequency of SBMs without straining per week from baseline to the last 2 weeks of the treatment period were analysed in the same manner.
Sensitivity analyses were also performed. The mean of the change in frequency of SBM per week from baseline to the last 2 weeks of the treatment period was compared between naldemedine and placebo based on an analysis of covariance method using the opioid dose strata as a covariate. Summary statistics of the frequency of SBMs per week and its change from baseline to the last 2 weeks were calculated by treatment group. Change in the frequency of SBMs per week from baseline to Week 1; change in the frequency of CSBMs per week from baseline to the last 2 weeks of the treatment period; and change in the frequency of SBMs without straining per week from baseline to the last 2 weeks of the treatment period were analysed in the same manner.
upper, abdominal pain lower, and abdominal discomfort), TEAEs considered for adjudication by the Cardiovascular Adjudication Committee, TEAEs adjudicated as MACE, and TEAEs of opioid withdrawal were summarised in the same manner. Changes in safety laboratory parameters, vital signs, physical examination findings, and ECGs were summarised by treatment group. Summary statistics and change from baseline to each scheduled visit were calculated by treatment group for COWS score, SOWS score, weekly opioid dose, and NRS score.
All available data on the change from baseline in the frequency of SBMs per week to Weeks 1 and 2 were used to compare the mean of the change at Weeks 1 and 2 based on the MMRM approach. Specifically, the mean of the weekly change in the frequency of SBMs per week (as response variable) was compared between the naldemedine and placebo groups at Weeks 1 and 2, using the MMRM which includes treatment-group, Week, and group by Week interaction as fixed effects, and the frequency of SBMs per week at baseline as a covariate. The weekly change from baseline in CSBMs per week was analysed in a similar way. Time to the first SBM (or CSBM) was defined as the time to appearance of the first SBM (or CSBM) after the first administration of the study drug. The Kaplan-Meier plot of the time to the first SBM was made for each treatment group, and the median time to the first SBM and its 95% CI were calculated for each treatment group. The naldemedine and placebo groups

CONFIDENTIAL UNTIL PUBLISHED
49
COMPOSE-1 COMPOSE-2 COMPOSE-3 COMPOSE-4 were compared with a generalised Wilcoxon test. The mean of daily change in the frequency of SBMs was compared between the naldemedine and placebo groups on each observation day, using the MMRM which includes treatment-group, day and group by day interaction as fixed effects, and the frequency of SBMs per day at baseline as a covariate The change in the number of days with SBMs was compared between the naldemedine and placebo groups based on an ANCOVA using the number of days with SBMs per week at baseline as a covariate. The changes from baseline in the number of days with SBMs to Week 1 and Week 2 were determined, separately.
Based on the CSRs for COMPOSE-1 to COMPOSE-524-28 and the response to the request for clarification16 ADR = adverse drug reaction; AE = adverse event; ANCOVA = analysis of covariance; BMI = body mass index; CI = confidence interval; COWS = Clinical Opiate Withdrawal Scale; CSBM = complete spontaneous bowel movement; ECG = electrocardiogram; FAS = full analysis set; ICH = International Conference on Harmonization ITT = intention-to-treat; MACE = major adverse cardiovascular events; mITT = modified ITT; MMRM = mixed model repeated measures; NRS = numerical rating scale; OIC = opioid-induced constipation; PPS = per protocol set; PT = preferred term; SOC = system organ class; RCT = randomised controlled trial; SBM = spontaneous bowel movement; SOWS = Subjective Opiate Withdrawal Scale; TEAE = treatment-emergent adverse event
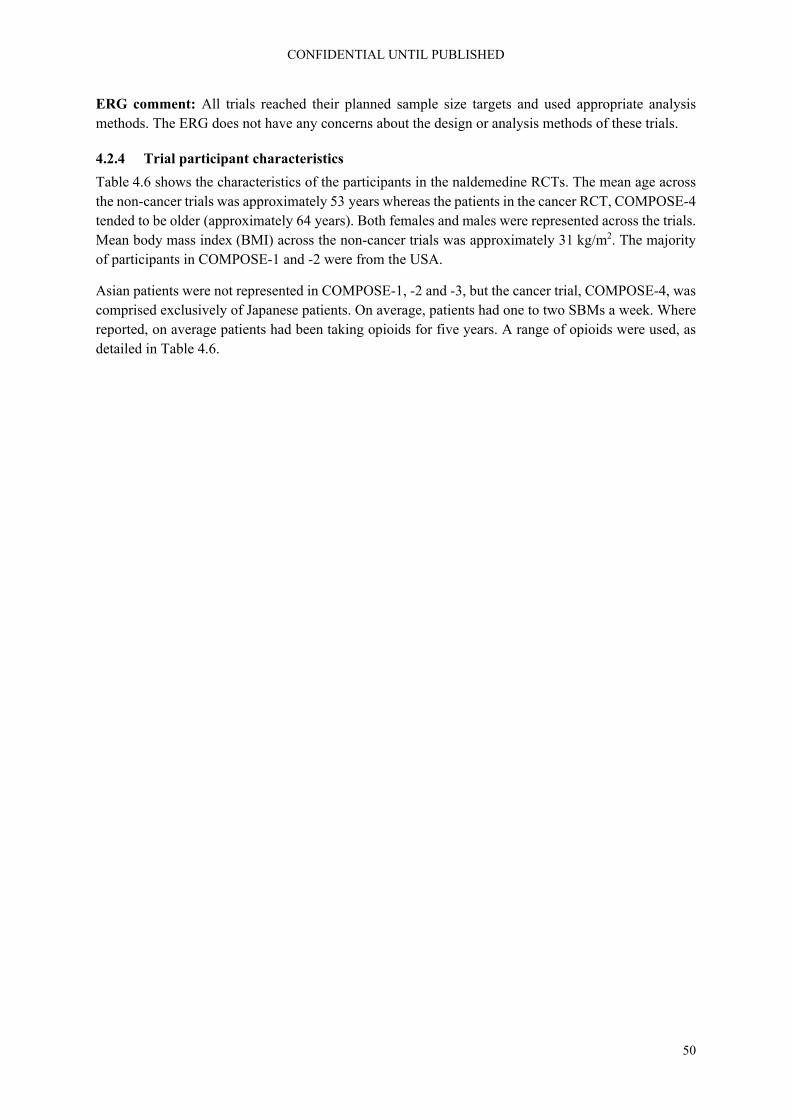
CONFIDENTIAL UNTIL PUBLISHED
50
ERG comment: All trials reached their planned sample size targets and used appropriate analysis methods. The ERG does not have any concerns about the design or analysis methods of these trials.
4.2.4 Trial participant characteristics
Table 4.6 shows the characteristics of the participants in the naldemedine RCTs. The mean age across the non-cancer trials was approximately 53 years whereas the patients in the cancer RCT, COMPOSE-4 tended to be older (approximately 64 years). Both females and males were represented across the trials. Mean body mass index (BMI) across the non-cancer trials was approximately 31 kg/m2. The majority of participants in COMPOSE-1 and -2 were from the USA.
Asian patients were not represented in COMPOSE-1, -2 and -3, but the cancer trial, COMPOSE-4, was comprised exclusively of Japanese patients. On average, patients had one to two SBMs a week. Where reported, on average patients had been taking opioids for five years. A range of opioids were used, as detailed in Table 4.6.

CONFIDENTIAL UNTIL PUBLISHED
51
Table 4.6: RCT baseline characteristics
COMPOSE-1 COMPOSE-2 COMPOSE-3 COMPOSE-4
Type of pain Non-cancer Non-cancer Non-cancer Cancer
Treatment group Naldemedine (n=273)
Placebo (n=272)
Naldemedine (n=276)
Placebo (n=274)
Naldemedine (n=621)
Placebo (n=619)
Naldemedine (n=97)
Placebo (n=96)
Mean age (SD) 53.3 (10.4) 53.4 (11.0) 54.1 (10.5) 52.0 (11.4) 53.4 (11.7) 52.7 (10.6) 63.8 (9.4) 64.6 (11.8)
Females, n (%) 161 (59%) 168 (62%) 165 (60%) 168 (61%) 383 (61.7) 402 (64.9) 38 (39.2) 36 (37.5)
Mean BMI, kg/m2 (SD) 31.3 (7.4) 31.3 (6.8) 31.4 (7.0) 31.3 (7.5) 31.7 (7.6) 31.5 (7.7) NR NR
Region, n (%) USA Europe Asia
230 (84%) 43 (16%)
0
229 (84%) 43 (16%)
0
241 (87%) 35 (13%)
0
239 (87%) 35 (13%)
NR NR 0 0
97 (100)
0 0
96 (100)
Race, n (%)a White Black Asian
216 (79%) 53 (19%)
220 (81%) 48 (18%)
222 (80%) 49 (18%)
227 (83%) 39 (14%)
492 (79.2) 120 (19.3)
496 (80.1) 108 (17.4)
0 0
97 (100)
0 0
96 (100)
Bowel movements n (SD) Mean SBMs/wk Mean CSBMs/wk Mean SBMs/wk without straining
1.3 (0.7) 0.4 (0.6) 0.1 (0.3)
1.3 (0.7) 0.4 (0.6) 0.1 (0.3)
1.2 (0.8) 0.4 (0.5) 0.1 (0.3)
1.2 (0.7) 0.4 (0.6) 0.1 (0.4)
1.59 (0.67)
1.62 (0.62)
1.01 (0.76) 0.52 (0.64)
1.10 (0.85) 0.48 (0.67)
Mean duration opioids, months (SD)
61.1 (62.0) 61.8 (58.3) 61.2 (61.5) 56.7 (55.8) 62.6 (68.7) 57.0 (55.8) NR NR
MTDD opioid mg (SD) 108.1 (104.0)
128.4 (162.9) 106.9 (127.2) 113.2 (145.4)
123.0 (146.1)
121.2 (163.4) 57.3 (46.4) 69.5 (99.5)
MTDD opioid, mg (SD) 30–100 >100
155 (57%) 118 (43%)
153 (56%) 119 (44%)
169 (61%) 107 (39%)
167 (61%) 107 (39%)
378 (60.9)
233
368 (59.5)
240
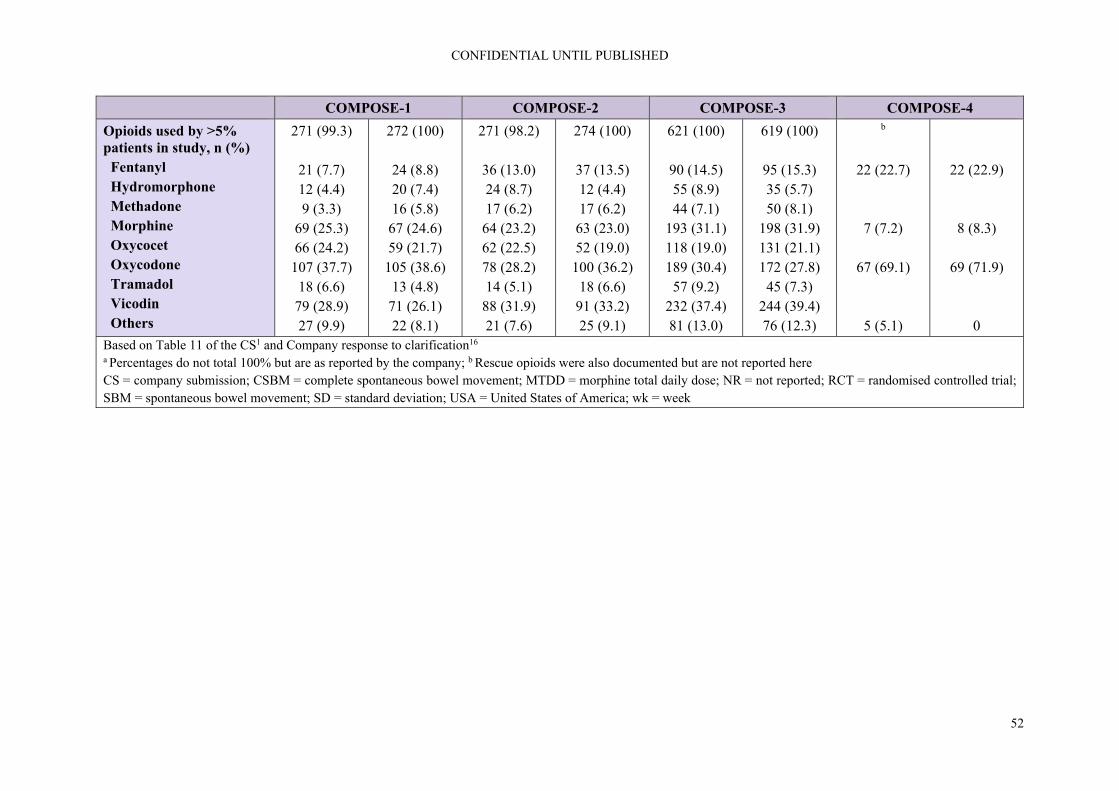
CONFIDENTIAL UNTIL PUBLISHED
52
COMPOSE-1 COMPOSE-2 COMPOSE-3 COMPOSE-4
Opioids used by >5% patients in study, n (%) Fentanyl Hydromorphone Methadone Morphine Oxycocet Oxycodone Tramadol Vicodin Others
271 (99.3)
21 (7.7) 12 (4.4) 9 (3.3)
69 (25.3) 66 (24.2)
107 (37.7) 18 (6.6)
79 (28.9) 27 (9.9)
272 (100)
24 (8.8) 20 (7.4) 16 (5.8)
67 (24.6) 59 (21.7)
105 (38.6) 13 (4.8)
71 (26.1) 22 (8.1)
271 (98.2)
36 (13.0) 24 (8.7) 17 (6.2)
64 (23.2) 62 (22.5) 78 (28.2) 14 (5.1)
88 (31.9) 21 (7.6)
274 (100)
37 (13.5) 12 (4.4) 17 (6.2)
63 (23.0) 52 (19.0)
100 (36.2) 18 (6.6)
91 (33.2) 25 (9.1)
621 (100)
90 (14.5) 55 (8.9) 44 (7.1)
193 (31.1) 118 (19.0) 189 (30.4)
57 (9.2) 232 (37.4) 81 (13.0)
619 (100)
95 (15.3) 35 (5.7) 50 (8.1)
198 (31.9) 131 (21.1) 172 (27.8)
45 (7.3) 244 (39.4) 76 (12.3)
b
22 (22.7)
7 (7.2)
67 (69.1)
5 (5.1)
22 (22.9)
8 (8.3)
69 (71.9)
0 Based on Table 11 of the CS1 and Company response to clarification16 a Percentages do not total 100% but are as reported by the company; b Rescue opioids were also documented but are not reported here CS = company submission; CSBM = complete spontaneous bowel movement; MTDD = morphine total daily dose; NR = not reported; RCT = randomised controlled trial; SBM = spontaneous bowel movement; SD = standard deviation; USA = United States of America; wk = week

CONFIDENTIAL UNTIL PUBLISHED
53
ERG comment: As noted above, two of the three main trials in patients with non-cancer OIC (COMPOSE-1 and COMPOSE-3) had some UK patients but COMPOSE-2 did not. The company was asked if they considered the patients in the COMPOSE trials to reflect those seen in clinical practice in England and if so to provide supporting evidence. The company provided tabulated data and stated that “there is no statistical significance between any of the baseline characteristics for those from the UK compared to the overall ITT cohorts in their respective trials”.16 The ERG noted that in COMPOSE-1, -2 and -3, patients had an average BMI of >30 kg/m2 and questioned how this related to patients seen in clinical practice in England. The company replied that “based on the real-world evidence carried out using CPRD, the mean BMI for OIC patients was 28.7 kg/m2 compared to 31.2 kg/m2 from COMPOSE-1 & -2 ITT [intention-to-treat] overall population. We believe that these give relatively similar results”.16
The clinical expert consulted by the ERG considered the patient characteristics (age, gender balance, BMI) in the three trials to be reflective of the UK population. He commented that, based on the bowel movements at baseline, the population could be more severe than those seen in the UK. A further difference he highlighted was the breakdown of opioids used in the trials, i.e. oxycodone at an average of 32% use across the trials is higher than in the UK (11% according to a recent study of patterns of regional variation of opioid prescribing).29 Tramadol use is higher in the UK (approximately 33%)29 than in the COMPOSE trials (4.8% to 9.2%, see Table 4.6). He also noted differences in prescribing: hydromorphone use in the UK is largely restricted to hospices while methadone is largely used as an opioid substitute for opioid dependence.
In relation to COMPOSE-4 and COMPOSE-5, the main cancer studies, the company stated that “comparison of the demographic characteristics of the COMPOSE-4 and -5 studies, indirect comparison cohort (methylnaltrexone [MNTX]), and the UK CPRD cohort used to derive health resource data indicates a close match in terms of age and gender balance. Shionogi therefore believe the results of these studies to be relevant to clinical practice in England”.16 The committee will need to decide if they agree with the company’s assertion of equal or perhaps superior effectiveness in OIC in cancer patients or whether the Japanese studies and modelling are appropriate.
Table 4.7 shows the characteristics of the participants in the naldemedine open label studies, all of which took place in Japan with all patients listed as being Asian. The mean age across the non-cancer trials was approximately 65 years. Both females and males were represented across the trials. Mean BMI across the non-cancer trials was approximately 22 kg/m2. Patients had on average one spontaneous bowel movement per week. Duration of opioids was not reported. A range of opioids were used in COMPOSE-5 and -6 but COMPOSE-7 which had just 10 patients focused solely on patients taking oxycodone.
It is noticeable that, contrary to the expectations regarding the need for stronger opioid treatment in cancer pain patients postulated in the EMA guidance, the MTDD at baseline in the cancer pain studies (COMPOSE-4 and COMPOSE-5) was about half that in the non-cancer pain studies (COMPOSE-1 to -3). The same issue applied to the non-randomised COMPOSE-6 and -7 studies in non-cancer patients, see Tables 4.5 and 4.6 for details.
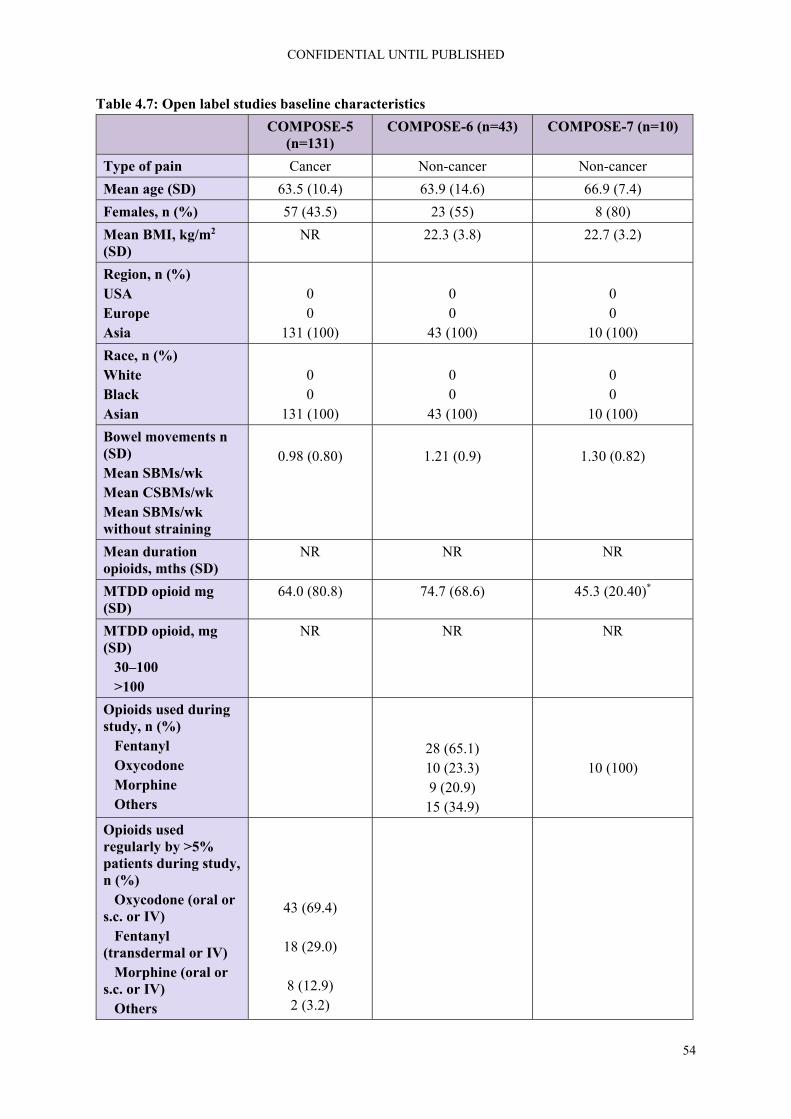
CONFIDENTIAL UNTIL PUBLISHED
54
Table 4.7: Open label studies baseline characteristics
COMPOSE-5 (n=131)
COMPOSE-6 (n=43) COMPOSE-7 (n=10)
Type of pain Cancer Non-cancer Non-cancer
Mean age (SD) 63.5 (10.4) 63.9 (14.6) 66.9 (7.4)
Females, n (%) 57 (43.5) 23 (55) 8 (80)
Mean BMI, kg/m2 (SD)
NR 22.3 (3.8) 22.7 (3.2)
Region, n (%) USA Europe Asia
0 0
131 (100)
0 0
43 (100)
0 0
10 (100)
Race, n (%) White Black Asian
0 0
131 (100)
0 0
43 (100)
0 0
10 (100)
Bowel movements n (SD) Mean SBMs/wk Mean CSBMs/wk Mean SBMs/wk without straining
0.98 (0.80)
1.21 (0.9)
1.30 (0.82)
Mean duration opioids, mths (SD)
NR NR NR
MTDD opioid mg (SD)
64.0 (80.8) 74.7 (68.6) 45.3 (20.40)*
MTDD opioid, mg (SD) 30–100 >100
NR NR NR
Opioids used during study, n (%) Fentanyl Oxycodone Morphine Others
28 (65.1) 10 (23.3) 9 (20.9)
15 (34.9)
10 (100)
Opioids used regularly by >5% patients during study, n (%) Oxycodone (oral or s.c. or IV) Fentanyl (transdermal or IV) Morphine (oral or s.c. or IV) Others
43 (69.4)
18 (29.0)
8 (12.9) 2 (3.2)
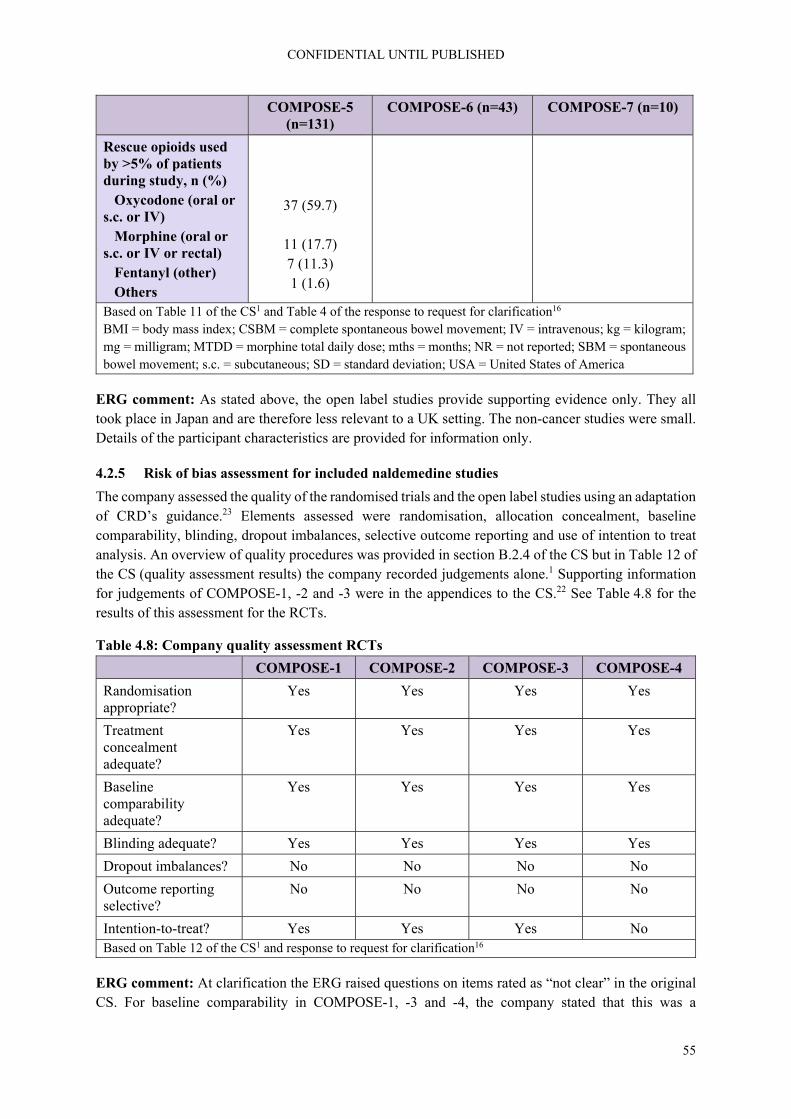
CONFIDENTIAL UNTIL PUBLISHED
55
COMPOSE-5 (n=131)
COMPOSE-6 (n=43) COMPOSE-7 (n=10)
Rescue opioids used by >5% of patients during study, n (%) Oxycodone (oral or s.c. or IV) Morphine (oral or s.c. or IV or rectal) Fentanyl (other) Others
37 (59.7)
11 (17.7) 7 (11.3) 1 (1.6)
Based on Table 11 of the CS1 and Table 4 of the response to request for clarification16 BMI = body mass index; CSBM = complete spontaneous bowel movement; IV = intravenous; kg = kilogram; mg = milligram; MTDD = morphine total daily dose; mths = months; NR = not reported; SBM = spontaneous bowel movement; s.c. = subcutaneous; SD = standard deviation; USA = United States of America
ERG comment: As stated above, the open label studies provide supporting evidence only. They all took place in Japan and are therefore less relevant to a UK setting. The non-cancer studies were small. Details of the participant characteristics are provided for information only.
4.2.5 Risk of bias assessment for included naldemedine studies
The company assessed the quality of the randomised trials and the open label studies using an adaptation of CRD’s guidance.23 Elements assessed were randomisation, allocation concealment, baseline comparability, blinding, dropout imbalances, selective outcome reporting and use of intention to treat analysis. An overview of quality procedures was provided in section B.2.4 of the CS but in Table 12 of the CS (quality assessment results) the company recorded judgements alone.1 Supporting information for judgements of COMPOSE-1, -2 and -3 were in the appendices to the CS.22 See Table 4.8 for the results of this assessment for the RCTs.
Table 4.8: Company quality assessment RCTs
COMPOSE-1 COMPOSE-2 COMPOSE-3 COMPOSE-4
Randomisation appropriate?
Yes Yes Yes Yes
Treatment concealment adequate?
Yes Yes Yes Yes
Baseline comparability adequate?
Yes Yes Yes Yes
Blinding adequate? Yes Yes Yes Yes
Dropout imbalances? No No No No
Outcome reporting selective?
No No No No
Intention-to-treat? Yes Yes Yes No Based on Table 12 of the CS1 and response to request for clarification16
ERG comment: At clarification the ERG raised questions on items rated as “not clear” in the original CS. For baseline comparability in COMPOSE-1, -3 and -4, the company stated that this was a

CONFIDENTIAL UNTIL PUBLISHED
56
typographical error. The ERG re-assessed the four trials against the criteria above. For COMPOSE-1, -2, -3 and -4, based on the information provided by the company in the CS and clinical study reports (CSRs), appropriate procedures for randomisation, allocation concealment, blinding, reporting of outcomes and intention to treat analysis have been used.1, 24-27 In terms of baseline characteristics, the company noted that in COMPOSE-1 patients in the placebo group had a higher mean total daily dose of opioid at baseline (128.4 (162.9) mg) than patients in the naldemedine group (108.1 (104.0) mg). Patients in the placebo group of COMPOSE-4 also had a higher dose of opioids at baseline (69.5 (99.5) mg as opposed to 57.3 (46.4) mg in the naldemedine group). Baseline characteristics appeared to be similar in COMPOSE-2 and -3. There were more dropouts due to adverse events in the COMPOSE trial programme. This issue will be discussed in section 4.2.8, the section on safety results.
4.2.6 Efficacy results
Effectiveness results for COMPOSE-1, -2, -3, and -4 are presented in Table 4.9.
The CS reports on the median time for first SBM in COMPOSE-1, COMPOSE-2 and COMPOSE-4 which were 16.1, 18.3 and 4.7 hours with naldemedine, respectively, and the median times to first SBM with placebo were 46.7, 45.9 and 26.6 hours, respectively. In COMPOSE-3, the proportion of patients on a routine laxative regimen at baseline who required rescue laxatives during the treatment period was numerically lower with naldemedine vs. placebo (8.0% vs. 14.0%). A similar trend was observed for patients not on a routine laxative regimen at baseline (7.0% vs. 13.1%).
ERG comment: It should be noted that results were poorly reported in the CS.1 The company provided more complete results in response to the request for clarification.16 However, the patient numbers being analysed was inconsistently reported.
Overall, effect estimates for COMPOSE-1 to -4, show an advantage of naldemedine vs. placebo regarding SBM, CSBM, SBM without straining, PAC-QOL and PAC-SYM. For PAC-QOL and PAC-SYM the effect estimates in COMPOSE-4 did not reach statistical significance.
The effect estimates for the use of rescue laxatives was lower in the naldemedine arm than in the placebo arm. However, the clinical expert consulted by the ERG commented that “if rescue medication needs to be used then in my view it suggests that the PAMORA is not effective”, i.e. this would suggest that in 7 to 8% of patients naldemedine was not effective.

CONFIDENTIAL UNTIL PUBLISHED
57
Table 4.9: Effectiveness results of RCTs
COMPOSE-1a COMPOSE-2a COMPOSE-3a COMPOSE-4
Type of pain Non-cancer Non-cancer Non-cancer Cancer
Treatment group (number analysed)
Naldemedine (n=271)
Placebo (n=272)
Naldemedine (n=271)
Placebo (n=274)
Naldemedine (n=621)
Placebo (n=620)
Naldemedine (n=97)
Placebo (n=96)
Spontaneous bowel movement (SBM)
SBM responders, n (%) 130 (48)b,c 94 (35)b,c 145 (53)b,c 92 (34)b,c NA 69 (71)d 33 (34)d
Change (95% CI); P value 13.0% (4.8, 21.2) p=0.0020 18.9% (10.8, 27.0); p<0.0001
36.8% (23.7, 49.9); p<0.0001
Initial freq SBMs n/week (SD)
1.31 (0.75) 1.30 (0.71) 1.16 (0.76) 1.17 (0.73) 1.59 (0.67) 1.62 (0.62) 1.01 (0.76) 1.10 (0.85)
Final freq SBMs, n/week (SD)
4.77 (3.77) 3.44 (2.47) 4.84 (3.21) 3.44 (2.61) NA 6.16 (7.09) 2.64 (2.49) 2.64 (2.49)
LS mean incr freq SBMs, n/week (SE)
3.42 (0.19) 2.12 (0.19) 3.56 (0.17) 2.56 (0.17) 3.92 (0.18) 2.92 (0.19) 5.16 (0.53) 1.54 (0.54)
Change (95% CI); P value 1.30 (0.77, 1.83) p<0.0001 1.40 (0.92, 1.88);p<0.0001 1.00 (0.49, 1.51); p<0.0001 3.62 (2.13, 5.12); p<0.0001
Complete spontaneous bowel movement (CSBM)
Initial freq CSBMs n/week (SD)
0.40 (0.60) 0.38 (0.57) 0.35 (0.51) 0.40 (0.56) NA 0.52 (0.64) 0.48 (0.67)
Final freq CSBMs, n/week (SD)
3.00 (3.37) 1.97 (2.15) 3.19 (3.10) 2.08 (2.54) 3.29 (3.60) 1.18 (1.77)
LS mean incr freq CSBMs, n/week (SE)
2.58 (0.17) 1.57 (0.17) 2.77 (0.17) 1.62 (0.17) NA 2.76 (0.27) 0.71 (0.27)
Change (95% CI); P value 1.01 (0.54, 1.48) p<0.0001 1.15 (0.7, 1.61); p<0.0001 2.05 (1.29, 2.81); p<0.0001
Spontaneous bowel movement (SBM) without straining
Initial freq SBMs without straining n/week (SD)
0.11 (0.31) 0.08 (0.30) 0.08 (0.27) 0.13 (0.34) NA 0.50 (0.62) 0.44 (0.62)

CONFIDENTIAL UNTIL PUBLISHED
58
COMPOSE-1a COMPOSE-2a COMPOSE-3a COMPOSE-4
Final freq SBMs without straining, n/week (SD)
1.57 (2.77) 0.82 (1.70) 2.00 (2.99) 1.29 (2.35) 4.36 (7.06) 1.61 (2.24)
LS mean incr freq SBMs without straining, n/week (SE)
1.46 (0.14) 0.73 (0.14) 1.85 (0.16) 1.10 (0.16) NA 3.85 (0.53) 1.17 (0.53)
Change (95% CI); P value 0.73 (0.34, 1.12) p=0.0002 0.75 (0.3, 1.19) p=0.0011 2.67 (1.20, 4.15) p=0.0005
Patient Assessment of Constipation Quality of Life (PAC-QOL)
Initial PAC-QOL score, n (SD)
2.05 (0.78) 2.00 (0.78) 2.08 (0.73) 2.10 (0.72) NA 1.22 (0.51) 1.31 (0.60)
Final PAC-QOL score, n (SD)
1.15 (0.92) 1.26 (0.82) 1.00 (0.79) 1.29 (0.89) 0.97 (0.52) 1.17 (0.68)
LS mean reduction in PAC-QOL, n (SE)
-0.93 (0.06) -0.66 (0.06) -1.08 (0.06) -0.8 (0.06) -1.24 (0.04) -0.94 (0.04) -0.25 (0.5) -0.14 (0.48)
Change (95% CI); P value -0.26 (-0.42, -0.10); p=0.0014
-0.28 (0.44, 0.11); p=0.0010 -0.31 (-0.42, -0.20); p<0.0001
-0.11; p=0.1129
Patient Assessment of Constipation Symptoms (PAC-SYM)
Initial PAC-SYM score, n (SE)
1.92 (0.77) 1.84 (0.73) 1.86 (0.72) 1.77 (0.74) NA 1.06 (0.60) 1.15 (0.62)
Final PAC-SYM score, n (SE)
1.01 (0.78) 1.18 (0.81) 0.86 (0.74) 1.08 (0.82) 0.82 (0.58) 1.02 (0.59)
LS mean reduction in PAC-SYM, n (SE)
-0.93 (0.06) -0.62 (0.06) -1.01 (0.06) -0.69 (0.06) -1.22 (0.04) -0.98 (0.04) -0.26 (0.65) -0.13 (0.5)
Change (95% CI); P value -0.30 (-0.46, -0.15); p=0.0001
-0.32 (-0.48, -0.15); p=0.0002
-0.24 (-0.35, -0.12); p<0.0001
-0.13; p=0.1476
Based on Table 13 of the CS1and the response to request for clarification16 a Totals reported correspond to those reported for the baseline characteristics of the populations but differ from the totals of the number of patients from the two treatment arms with totals being higher for COMPOSE-1 and -2, and lower for COMPOSE-3; b ≥9 positive-response weeks out of the 12-week treatment period and 3 positive-response weeks out of the last 4 weeks of the 12-week treatment period. A positive-response week was defined as ≥3 SBMs per week and an increase from baseline of ≥1 SBM per

CONFIDENTIAL UNTIL PUBLISHED
59
COMPOSE-1a COMPOSE-2a COMPOSE-3a COMPOSE-4 week for that week. Results shown for intention-to-treat population; c Figure 2 in the CS reports the same results once rounded but the number of patients per arm corresponds to those reported in the table on the baseline characteristics; d ≥3 SBMs per week and an increase of ≥1 SBM per week from baseline. Results shown for full analysis set CI = confidence interval; CS = company submission; CSBM = complete spontaneous bowel movement; LS = least square; NA = not applicable; PAC-QOL = Patient Assessment of Constipation Quality of Life; PAC-SYM = Patient Assessment of Constipation Symptoms; RCT = randomised controlled trial; SBM = spontaneous bowel movement; SD = standard deviation; SE = standard error

4.2.7 Subgroup analysis for included naldemedine studies
No subgroup analysis relevant was provided that was of relevance to the decision making, e.g. informed the economic model.
4.2.8 Safety results
The company stated that adverse reactions were assessed in the safety population (all randomised patients who received ≥1 dose of the study drug). They concluded that the concomitant use of naldemedine with opioids was generally well tolerated and did not impeded the analgesic benefits of opioids or precipitate opioid-withdrawal syndrome. Safety results are presented for the RCTs in Tables 4.10 and 4.11 and in Tables 4.12 and 4.13 for the open label studies. It can be seen that the proportions reporting any treatment-emergent adverse event were similar in naldemedine and placebo groups in COMPOSE-1, -2 and -3. In COMPOSE-4 a higher number of patients reported TEAEs in the naldemedine group than the placebo group and a higher number discontinued for this reason. The company reported that in all trials most events were mild to moderate in severity. Serious adverse events appeared to occur in similar proportions across treatment groups. The company stated that no deaths in either treatment group were considered to be related to the study drug. Patients experienced a higher incidence of gastrointestinal adverse events such as diarrhoea than those receiving placebo. The company noted, though that similar proportions of patients discontinued treatment due to any TEAE and due to gastrointestinal TEAEs specifically.

Table 4.10: Safety results of RCTs
COMPOSE-1 COMPOSE-2 COMPOSE-3 COMPOSE-4
Type of pain Non-cancer Non-cancer Non-cancer Cancer
Treatment group Naldemedine (n=271)
Placebo (n=272)
Naldemedine (n=271)
Placebo (n=274)
Naldemedine (n=621)
Placebo (n=619)
Naldemedine (n=97)
Placebo (n=96)
Any TEAE, n (%) 132 (49) 123 (45) 136 (50) 132 (48) 425 (68) 446 (72) 43 (44) 25 (26)
Drug-related TEAE, n (%)
59 (22) 45 (17) 54 (20) 31 (11) 149 (24) 121 (20) 18 (19) 9 (9)
Serious TEAE, n (%) 14 (5) 5 (2) 9 (3) 13 (5) 60 (10) 73 (12) - -
Drug-related serious TEAE, n (%)
2 (1) 0 2 (1) 1 (<1) 3 (<1) 6 (1) - -
TEAE leading to study discontinuation, n (%)
13 (5) 4 (2) 14 (5) 9 (3) 39 (6) 36 (6) 9 (9) 1 (1)
Serious TEAE leading to study discontinuation, n (%)
3 (1) 0 3 (1) 3 (1) 7 (1) 12 (2) NR NR
Deaths, n (%) 0 0 1 (<1) 0 4 (<1) 4 (<1) 2 (2) 0 Based on Table 21 of the CS1 CS = company submission; NR = not reported; TEAE = treatment-emergent adverse event
Table 4.11: TEAEs in RCTs
COMPOSE-1 COMPOSE-2 COMPOSE-3 COMPOSE-4
Type of pain Non-cancer Non-cancer Non-cancer Cancer
Treatment group Naldemedine (n=271)
Placebo (n=272)
Naldemedine (n=271)
Placebo (n=274)
Naldemedine (n=621)
Placebo (n=619)
Naldemedine (n=97)
Placebo (n=96)
Infections and infestations
URTIs - - - - 36 (6) 33 (5) - -
UTIs 7 (3) 8 (3) 6 (2) 14 (5) 35 (6) 51 (8) - -
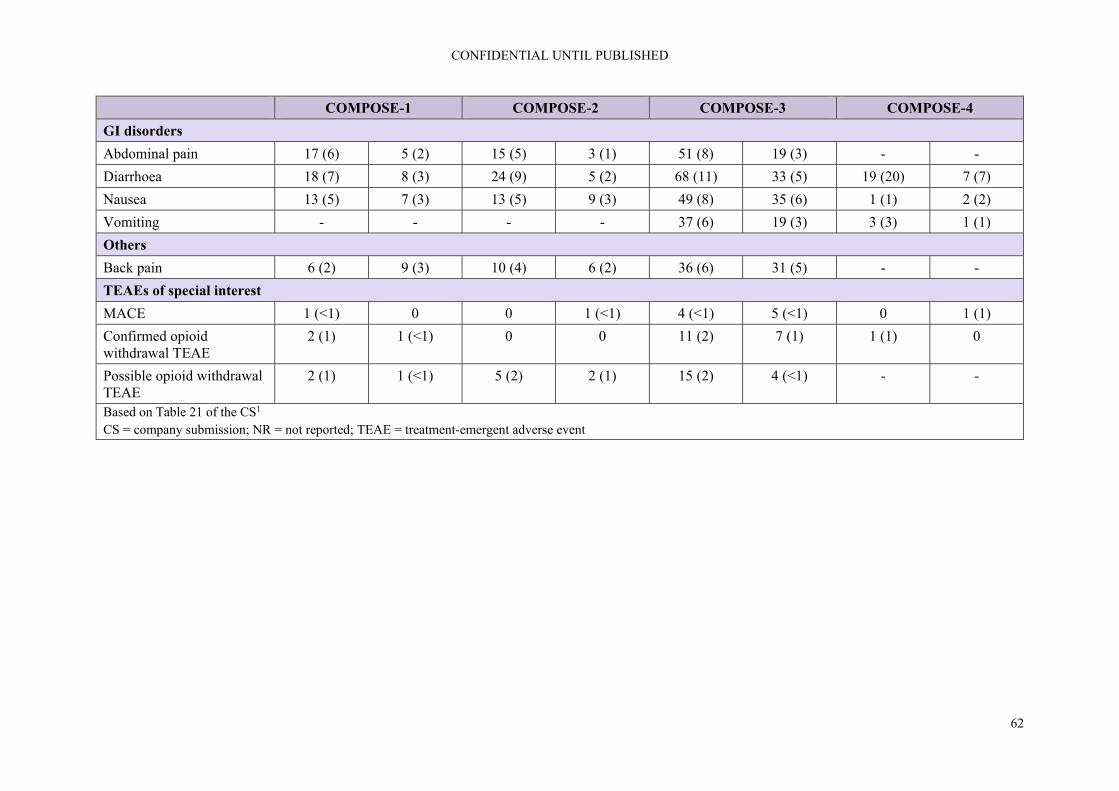
CONFIDENTIAL UNTIL PUBLISHED
62
COMPOSE-1 COMPOSE-2 COMPOSE-3 COMPOSE-4
GI disorders
Abdominal pain 17 (6) 5 (2) 15 (5) 3 (1) 51 (8) 19 (3) - -
Diarrhoea 18 (7) 8 (3) 24 (9) 5 (2) 68 (11) 33 (5) 19 (20) 7 (7)
Nausea 13 (5) 7 (3) 13 (5) 9 (3) 49 (8) 35 (6) 1 (1) 2 (2)
Vomiting - - - - 37 (6) 19 (3) 3 (3) 1 (1)
Others
Back pain 6 (2) 9 (3) 10 (4) 6 (2) 36 (6) 31 (5) - -
TEAEs of special interest
MACE 1 (<1) 0 0 1 (<1) 4 (<1) 5 (<1) 0 1 (1)
Confirmed opioid withdrawal TEAE
2 (1) 1 (<1) 0 0 11 (2) 7 (1) 1 (1) 0
Possible opioid withdrawal TEAE
2 (1) 1 (<1) 5 (2) 2 (1) 15 (2) 4 (<1) - -
Based on Table 21 of the CS1 CS = company submission; NR = not reported; TEAE = treatment-emergent adverse event

CONFIDENTIAL UNTIL PUBLISHED
63
Table 4.12: Safety results of open label studies
COMPOSE-5 COMPOSE-6 COMPOSE-7
Type of pain Cancer Non-cancer Non-cancer
Treatment group Naldemedine (n=131) Naldemedine (n=40)* Naldemedine (n=10)
Any TEAE, n (%) 105 (80) 38 (88) 9 (90)
Drug-related TEAE, n (%)
20 (15) 12 (28) 5 (50)
Serious TEAE, n (%)
- 4 (9) 0
Drug-related serious TEAE, n (%)
- - -
TEAE leading to study discontinuation, n (%)
12 (9) 3 (7) 1 (10)
Serious TEAE leading to study discontinuation, n (%)
- - -
Deaths, n (%) 15 (12) 1 (2) 0 Based on Tables 9 and 21 of the CS1 * As reported in Table 9 of the CS CS = company submission; TEAE = treatment-emergent adverse event
Table 4.13: TEAEs in open label studies
COMPOSE-5 COMPOSE-6 COMPOSE-7
Type of pain Cancer Non-cancer Non-cancer
Treatment group Naldemedine Naldemedine Naldemedine
Infections and infestations
Gastroenteritis, n (%) 9 (7) - -
GI disorders
Abdominal pain - 2 (5) -
Diarrhoea 24 (18) 10 (23) 4 (40)
Nausea 17 (13) 5 (12) 1 (10)
Vomiting 16 (22) 4 (9) 1 (10)
Others
Anaemia 8 (6) - -
Anxiety - 2 (5) 2 (20)
Decreased appetite 14 (11) - -
Dizziness - 2 (5) 0
Eczema - 2 (5) 0
Malaise 13 (10) - -
Somnolence - 3 (7) 1 (10)

CONFIDENTIAL UNTIL PUBLISHED
64
COMPOSE-5 COMPOSE-6 COMPOSE-7
TEAEs of special interest
MACE 1 (1) 3 (7) 0
Confirmed opioid withdrawal TEAE
0 0 0
Possible opioid withdrawal TEAE
- 0 0
Based on Table 21 of the CS1 CS = company submission; GI = gastrointestinal; MACE = major adverse cardiovascular events; TEAE = treatment-emergent adverse event
ERG comment: From the evidence provided, naldemedine appeared to be generally well tolerated and not to impede the analgesic benefits of opioids or precipitate opioid-withdrawal syndrome as stated by the company. Proportions reporting any treatment-emergent adverse event or serious event were similar in naldemedine and placebo groups in COMPOSE-1, -2 and -3. However, in COMPOSE-4, the cancer trial, a higher number of patients reported TEAEs in the naldemedine group than the placebo group and a higher number discontinued for this reason.
The ERG draws to the attention of the committee that patients taking naldemedine experienced a higher incidence of gastrointestinal adverse events such as diarrhoea than those receiving placebo. The company noted, though that similar proportions of patients discontinued treatment due to any TEAE and due to gastrointestinal TEAEs specifically. It will be important to inform patients of the risks of these type of adverse events.
The company stated that no deaths in either treatment group across the COMPOSE trials were considered to be related to the study drug. The ERG noticed that 15 patients (11.5%) died in COMPOSE-5, the open-label study of cancer patients taking naldemedine. The company stated in the CSR for COMPOSE-5 that “**************************************************************************************************************************************************************************”.28
The CS reports the NRS scores for pain based on two figures (Figures 4.1 and 4.2).and one figure (Figure 4.3) presents data on the total daily opioid dose in the safety population but no numerical data are provided for any of these outcomes.
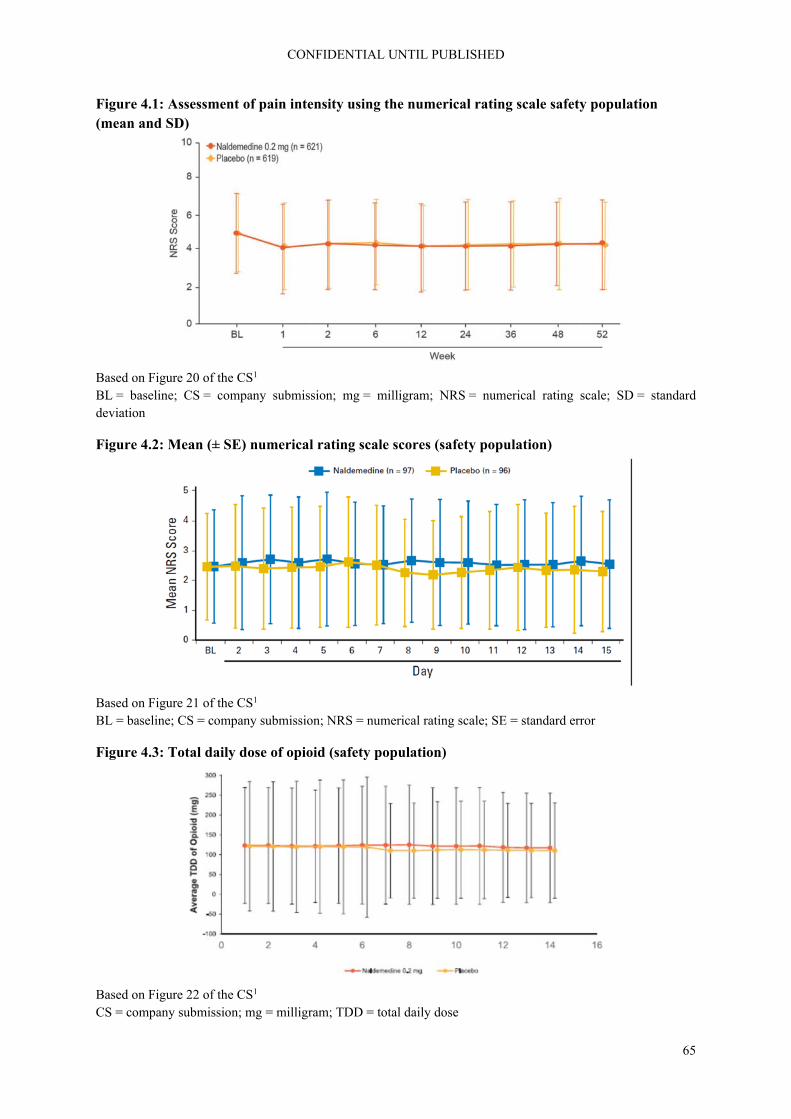
CONFIDENTIAL UNTIL PUBLISHED
65
Figure 4.1: Assessment of pain intensity using the numerical rating scale safety population (mean and SD)
Based on Figure 20 of the CS1 BL = baseline; CS = company submission; mg = milligram; NRS = numerical rating scale; SD = standard deviation
Figure 4.2: Mean (± SE) numerical rating scale scores (safety population)
Based on Figure 21 of the CS1 BL = baseline; CS = company submission; NRS = numerical rating scale; SE = standard error
Figure 4.3: Total daily dose of opioid (safety population)
Based on Figure 22 of the CS1 CS = company submission; mg = milligram; TDD = total daily dose

CONFIDENTIAL UNTIL PUBLISHED
66
ERG comment: No numerical data on the effects of pain and the effects of analgesic efficacy were presented in the CS.1 It is not clear from the labelling and reporting of the aforementioned figures on which studies these data were based. The duration of follow-up suggests that the data in Figures 4.1 and 4.2 may be based on the COMPOSE-4 trial while the longer duration of follow-up in Figure 4.3 suggests that these data may be from the COMPOSE-3 trial. Based on these data, the point estimates for the pain scores and the average total daily dose (TDD) of opioids were slightly higher in the naldemedine arms and the variation of the TDD of opioids was slightly wider than for placebo. The point estimates were lying very close though and there was a very large overlap of the confidence intervals.
4.2.9 Ongoing trials
The company reported on the following ongoing trials in response to the request for clarification, see Table 4.14.16
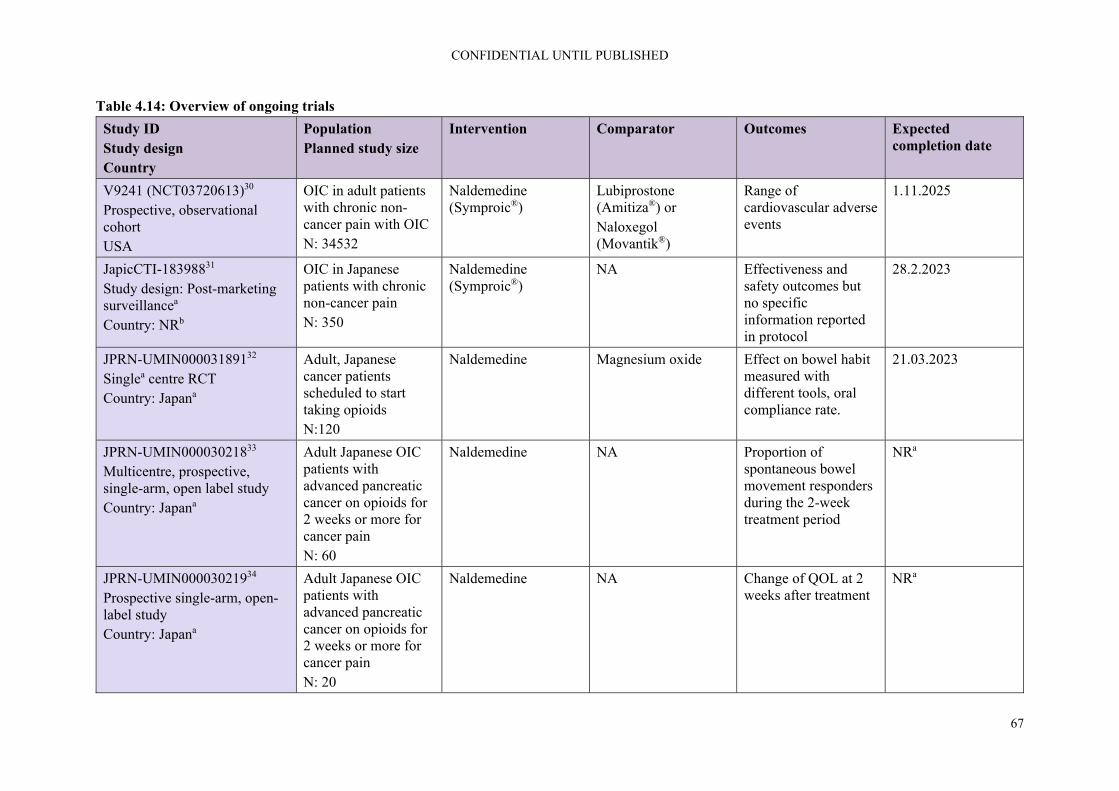
CONFIDENTIAL UNTIL PUBLISHED
67
Table 4.14: Overview of ongoing trials
Study ID Study design Country
Population Planned study size
Intervention Comparator Outcomes Expected completion date
V9241 (NCT03720613)30 Prospective, observational cohort USA
OIC in adult patients with chronic non-cancer pain with OIC N: 34532
Naldemedine (Symproic®)
Lubiprostone (Amitiza®) or Naloxegol (Movantik®)
Range of cardiovascular adverse events
1.11.2025
JapicCTI-18398831 Study design: Post-marketing surveillancea
Country: NRb
OIC in Japanese patients with chronic non-cancer pain N: 350
Naldemedine (Symproic®)
NA Effectiveness and safety outcomes but no specific information reported in protocol
28.2.2023
JPRN-UMIN00003189132 Singlea centre RCT Country: Japana
Adult, Japanese cancer patients scheduled to start taking opioids N:120
Naldemedine Magnesium oxide Effect on bowel habit measured with different tools, oral compliance rate.
21.03.2023
JPRN-UMIN00003021833 Multicentre, prospective, single-arm, open label study Country: Japana
Adult Japanese OIC patients with advanced pancreatic cancer on opioids for 2 weeks or more for cancer pain N: 60
Naldemedine NA Proportion of spontaneous bowel movement responders during the 2-week treatment period
NRa
JPRN-UMIN00003021934 Prospective single-arm, open-label study Country: Japana
Adult Japanese OIC patients with advanced pancreatic cancer on opioids for 2 weeks or more for cancer pain N: 20
Naldemedine NA Change of QOL at 2 weeks after treatment
NRa

CONFIDENTIAL UNTIL PUBLISHED
68
Study ID Study design Country
Population Planned study size
Intervention Comparator Outcomes Expected completion date
JPRN-UMIN00002945935 Prospective twin-arm open-label non-randomised cross-over study Japana
Adult Japanese patients with OIC N: 14
Naldemedine Tosilate after breakfast
Naldemedine Tosilate after waking
Change of QOL at 2 weeks after treatment, change in NRS score, change in rescue usage, survey of senses questionnaire
Last follow-up date: 31.3.2019c
Based on response to request for clarification16 a Information extracted by ERG; b Not reported according to response by company to clarification letter16 NA = not applicable; NR = not reported; OIC = opioid-induced constipation; QOL = quality of life; RCT = randomised controlled trial; USA = United States of America
ERG comment: While it was stated in the CS submission that there were no ongoing trials, six ongoing trials were reported in response to the request for clarification of which four are in cancer patients.30-35 More detailed information is provided in the response to request for clarification.16
4.3 Critique of trials identified and included in the indirect comparison and/or multiple treatment comparison
The feasibility assessment for the ITC/NMA identified four eligible trials. Details are provided in Table 4.15.
Table 4.15: Methodology of trials included in the ITC
Trial Trial Design Countries Populationa Intervention and Comparator(s)
Primary Outcome(s)
COMPOSE-1 (NCT01965158)
Phase 3, double-blind RCT consisting of: A screening period (28 days) A double-blind treatment
Austria, Czech Republic, Germany, Poland, Spain, UK, USA
547 patients aged 18 to 80 years Chronic non-cancer pain treated with opioids for ≥3 months, and with a stable opioid regimen at a total daily dose ≥30 mg equivalent of oral morphine sulphate ≥1 month before screening
Naldemedine 0.2 mg QD Placebo
Proportion of responders, where a responder is defined as having ≥3 SBMs per week and an increase from baseline of ≥1 SBM per week for that week (a positive response week) for ≥9 weeks out of the 12-week treatment period and ≥3 of the last 4 weeks of the 12-week treatment period.

CONFIDENTIAL UNTIL PUBLISHED
69
Trial Trial Design Countries Populationa Intervention and Comparator(s)
Primary Outcome(s)
period (12 weeks) A follow up period (4 weeks)
Laxative use prior to baseline permitted Subgroup of patients with LIR OIC
COMPOSE-2 (NCT01993940)
Phase 3, double-blind RCT consisting of: A screening period (28 days) A double-blind treatment period (12 weeks) A follow up period (4 weeks)
Austria, Czech Republic, Germany, Poland, Spain, USA
553 patients aged 18 to 80 years Chronic non-cancer pain, treated with opioids for ≥3 months, with a stable regimen of ≥30 mg/day of morphine equivalents for ≥1 month before screening Laxative use prior to baseline permitted Subgroup of patients with LIR OIC
Naldemedine 0.2 mg QD Placebo
Proportion of responders, where a responder is defined as having ≥3 SBMs per week and an increase from baseline of ≥1 SBM per week for that week (a positive response week) for ≥9 weeks out of the 12-week treatment period and ≥3 of the last 4 weeks of the 12-week treatment period.
KODIAC-4 (NCT01309841)
Phase 3, double-blind RCT consisting of: An OIC confirmation phase (2 weeks) A double-blind treatment phase (12 weeks)
Europe, USA 652 patients aged 18–84 years Non-cancer pain Taking an oral opioid at a stable total daily dose of 30 to 1000 mg of morphine (or equivalent), for 4 weeks or longer Laxative use prior to baseline permitted Subgroup of patients with LIR Self-reported OIC
Naloxegol 12.5 mg QD Naloxegol 25 mg QD Placebo
12-week response rate (≥1 SBM per week and an increase from baseline ≥1 SBMs for ≥9 of 12 weeks and ≥3 for the final 4 weeks)

CONFIDENTIAL UNTIL PUBLISHED
70
Trial Trial Design Countries Populationa Intervention and Comparator(s)
Primary Outcome(s)
KODIAC-5 (NCT01323790)
Phase 3, double-blind RCT consisting of: An OIC confirmation phase (2 weeks) A double-blind treatment phase (12 weeks)
Europe, USA 700 patients aged 18–84 years Non-cancer pain Taking an oral opioid at a stable total daily dose of 30 to 1000 mg of morphine (or equivalent), for 4 weeks or longer Laxative use prior to baseline permitted Subgroup of patients with LIR Self-reported OIC
Naloxegol 12.5 mg QD Naloxegol 25 mg QD Placebo
12-week response rate, defined as ≥3 SBMs per week and an increase of ≥1 SBMs over baseline for ≥9 of the 12 treatment weeks and ≥3 of the final 4 treatment weeks.
Based on Table 14 of Appendix D of the CS22 a Number of patients refers to those that underwent randomisation CS = company submission; ITC = indirect treatment comparison; LIR = laxative inadequate response; mg = milligram; OIC = opioid-induced constipation; QD = once daily; RCT = randomised controlled trial; SBM = spontaneous bowel movement; UK = United Kingdom; USA = United States of America
The baseline patient characteristics were reviewed to judge potential heterogeneity between these four trials and are shown in Table 4.16. Patient age, gender and mean SBMs per week at baseline were considered to be comparable. The proportion of white patients was lower in Kodiac-4 and there was some variation in mean quantity of and duration of opioid treatment between KODIAC-4 and -5, however, details of SBMs and opioid treatment were not reported by COMPOSE-1 and -2 so it was not possible to judge the baseline comparability of all trials. The definitions of OIC and LIR differed between the trials, the primary outcome measure of 12-week response also differed between Kodiac-4 and -5. The company judged that the clinical heterogeneity was not “deemed sufficiently large to prevent an informative analysis”.1

CONFIDENTIAL UNTIL PUBLISHED
71
Table 4.16: Patient characteristics of trials included in the ITC
Trial LIR treatment
arm
Age, years, mean
Sex or gender, female, n/N (%)
Race or ethnicity,
white, n/N (%)
Opioid treatment,
mean, mg/day
Opioid treatment duration,
mean, months
SBMs per
week, mean
OIC definition LIR definition
COMPOSE-1/ COMPOSE-2 (pooled)
Naldemedine 0.2 mg QD
53.6 191/317 (60.3)
265/317 (83.6)
NR NR NRa ≤4 SBMs over 14-day period; ≤3 SBMs in a given week
Subjects on laxative therapy (with ≥1 product) prior to entering the study and who stopped its use within 30 days prior to screening
Placebo 53.1 198/311 (63.7)
258/311 (83.0)
NR NR NRa
KODIAC-4 Naloxegol 12.5 mg
52.9 72/115 (62.6)
88/115 (76.5)
147 49.5 1.3 <3 SBMs/week over 28 days
Using 1 laxative class for ≥4 of the 14 days prior to screening and moderate, severe, or very severe symptoms in ≥1 of 4 stool symptom domains
Naloxegol 25 mg
53.3 68/117 (58.1)
68/117 (58.1)
162 44.5 1.2
Placebo 53.6 77/118 (65.3)
92/118 (78.0)
155 39.9 1.3
KODIAC-5 Naloxegol 12.5 mg
53.2 85/125 (68.0)
102/125 (81.6)
148 46.2 1.6
Naloxegol 25 mg
53.5 82/124 (66.1)
107/124 (86.3)
136 38.3 1.2
Placebo 53.0 74/121 (61.2)
98/121 (81.0)
133 45.8 1.4
Based on Table 15 of Appendix D of the CS22 a Values for COMPOSE-1 and -2, respectively, are reported in Table 4.5 CS = company submission; ITC = indirect treatment comparison; mg = milligram; NR = not reported; QD = once daily; SBM = spontaneous bowel movement
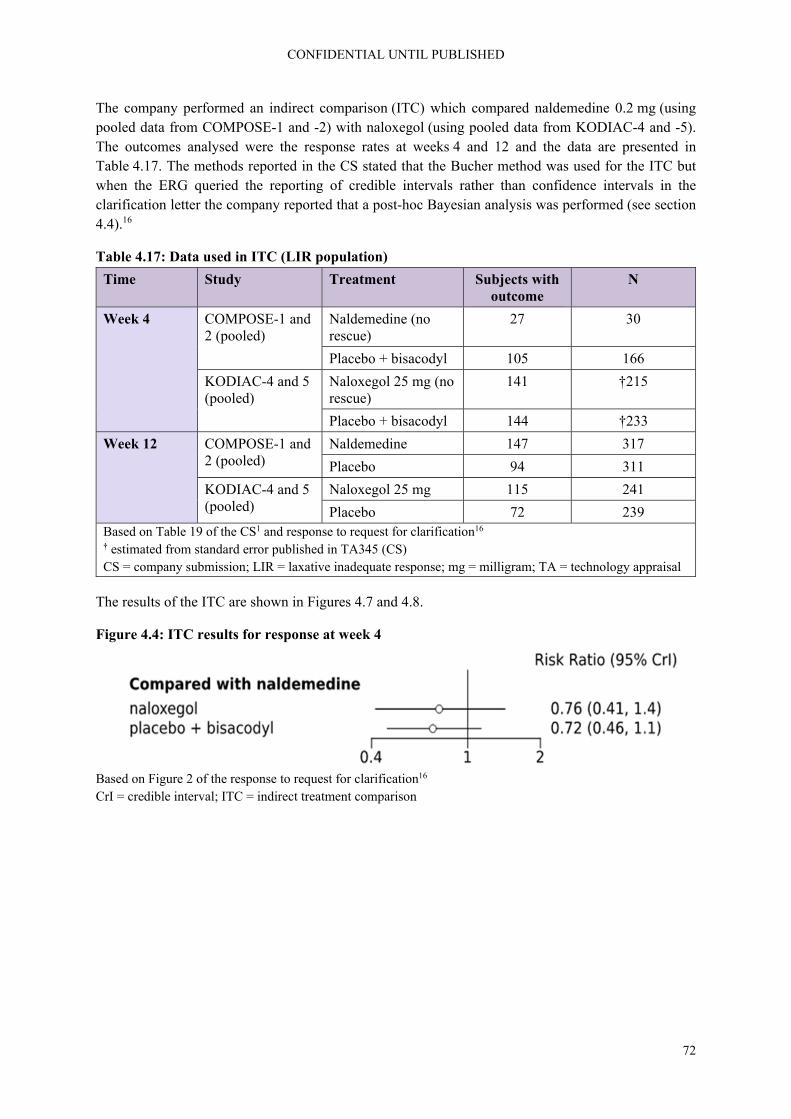
CONFIDENTIAL UNTIL PUBLISHED
72
The company performed an indirect comparison (ITC) which compared naldemedine 0.2 mg (using pooled data from COMPOSE-1 and -2) with naloxegol (using pooled data from KODIAC-4 and -5). The outcomes analysed were the response rates at weeks 4 and 12 and the data are presented in Table 4.17. The methods reported in the CS stated that the Bucher method was used for the ITC but when the ERG queried the reporting of credible intervals rather than confidence intervals in the clarification letter the company reported that a post-hoc Bayesian analysis was performed (see section 4.4).16
Table 4.17: Data used in ITC (LIR population)
Time Study Treatment Subjects with outcome
N
Week 4 COMPOSE-1 and 2 (pooled)
Naldemedine (no rescue)
27 30
Placebo + bisacodyl 105 166
KODIAC-4 and 5 (pooled)
Naloxegol 25 mg (no rescue)
141 †215
Placebo + bisacodyl 144 †233
Week 12 COMPOSE-1 and 2 (pooled)
Naldemedine 147 317
Placebo 94 311
KODIAC-4 and 5 (pooled)
Naloxegol 25 mg 115 241
Placebo 72 239 Based on Table 19 of the CS1 and response to request for clarification16 † estimated from standard error published in TA345 (CS) CS = company submission; LIR = laxative inadequate response; mg = milligram; TA = technology appraisal
The results of the ITC are shown in Figures 4.7 and 4.8.
Figure 4.4: ITC results for response at week 4
Based on Figure 2 of the response to request for clarification16 CrI = credible interval; ITC = indirect treatment comparison
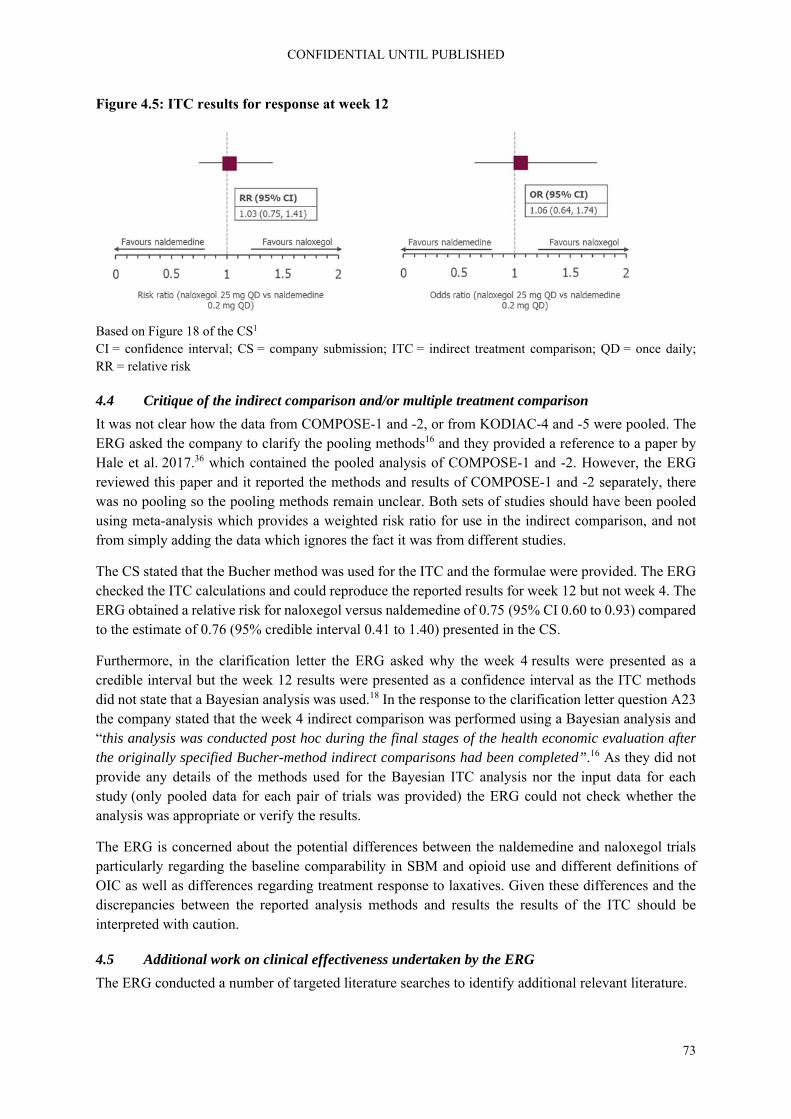
CONFIDENTIAL UNTIL PUBLISHED
73
Figure 4.5: ITC results for response at week 12
Based on Figure 18 of the CS1 CI = confidence interval; CS = company submission; ITC = indirect treatment comparison; QD = once daily; RR = relative risk
4.4 Critique of the indirect comparison and/or multiple treatment comparison
It was not clear how the data from COMPOSE-1 and -2, or from KODIAC-4 and -5 were pooled. The ERG asked the company to clarify the pooling methods16 and they provided a reference to a paper by Hale et al. 2017.36 which contained the pooled analysis of COMPOSE-1 and -2. However, the ERG reviewed this paper and it reported the methods and results of COMPOSE-1 and -2 separately, there was no pooling so the pooling methods remain unclear. Both sets of studies should have been pooled using meta-analysis which provides a weighted risk ratio for use in the indirect comparison, and not from simply adding the data which ignores the fact it was from different studies.
The CS stated that the Bucher method was used for the ITC and the formulae were provided. The ERG checked the ITC calculations and could reproduce the reported results for week 12 but not week 4. The ERG obtained a relative risk for naloxegol versus naldemedine of 0.75 (95% CI 0.60 to 0.93) compared to the estimate of 0.76 (95% credible interval 0.41 to 1.40) presented in the CS.
Furthermore, in the clarification letter the ERG asked why the week 4 results were presented as a credible interval but the week 12 results were presented as a confidence interval as the ITC methods did not state that a Bayesian analysis was used.18 In the response to the clarification letter question A23 the company stated that the week 4 indirect comparison was performed using a Bayesian analysis and “this analysis was conducted post hoc during the final stages of the health economic evaluation after the originally specified Bucher-method indirect comparisons had been completed”.16 As they did not provide any details of the methods used for the Bayesian ITC analysis nor the input data for each study (only pooled data for each pair of trials was provided) the ERG could not check whether the analysis was appropriate or verify the results.
The ERG is concerned about the potential differences between the naldemedine and naloxegol trials particularly regarding the baseline comparability in SBM and opioid use and different definitions of OIC as well as differences regarding treatment response to laxatives. Given these differences and the discrepancies between the reported analysis methods and results the results of the ITC should be interpreted with caution.
4.5 Additional work on clinical effectiveness undertaken by the ERG
The ERG conducted a number of targeted literature searches to identify additional relevant literature.

CONFIDENTIAL UNTIL PUBLISHED
74
4.6 Conclusions of the clinical effectiveness section
Overall, the CS reported clinical effectiveness searches were well presented and missing data were provided at clarification.1, 16 Searches were carried out on a broad range of databases. Supplementary searches of conference proceedings, trials databases and the checking of references lists were undertaken by the company in order to identify additional studies not retrieved by the main searches. However, the ERG identified some limitations in the way in which health-related quality of life (HRQoL) literature was identified by these searches. Without the time to undertake independent searches and review the results within the single technology appraisal (STA) timeline the ERG is unable to say what effect these limitations may have had on the overall recall of results.
The company presented evidence from the COMPOSE programme of trials. This included:
Three phase 2, randomised, double-blind, placebo-controlled dose-finding studies - two in patients with chronic non-cancer pain (V9214 and V9221), and one in patients with cancer (V9222)
Four randomised, double-blind, placebo-controlled studies - three in patients with chronic non-cancer pain (COMPOSE-1, COMPOSE-2, and COMPOSE-3), and one in patients with cancer (COMPOSE-4)
Three phase 3 single-arm, open-label studies (COMPOSE-5, COMPOSE-6 and COMPOSE-7)
Data from COMPOSE-1, -2 and -3 (patients with non-cancer pain) were used in the economic model while data from COMPOSE-4 and -5 (patients with cancer pain) were used in models provided in response to the request for clarification. COMPOSE-3 is the longest and largest RCT (621 participants in the naldemedine arm compared to 271 in COMPOSE-1 and -2, respectively) but it is important to note that patients in this trial were permitted to continue with their previous stable laxative regimen.
The primary outcome of the 12-week RCTs COMPOSE-1 and -2 was the proportion of spontaneous bowel movement (SBM) responders as recorded in an e-diary. Responders were defined as patients with ≥9/12 positive-response weeks and ≥3 positive-response weeks out of the last four weeks. A positive response week was defined as ≥3 SBM/week and ≥1 SBM/week increase from baseline. The primary outcome of the 52-week COMPOSE-3 trial was treatment-emergent adverse events (TEAEs).
In COMPOSE-4 (the two-week RCT in cancer patients) the primary outcome was again the proportion of SBM responders as recorded in a patient diary. In this trial, responders were patients with ≥3 SBMs/week and an increase of ≥1 SBM/week from baseline (average number SBMs/week in two weeks prior to screening). COMPOSE-5 was an open label extension of COMPOSE-4.
Overall, effect estimates for COMPOSE-1 to -4, show an advantage of naldemedine vs. placebo regarding SBM, complete spontaneous bowel movement (CSBM), SBM without straining, Patient Assessment of Constipation Quality of Life (PAC-QOL) and Patient Assessment of Constipation Symptoms (PAC-SYM). For PAC-QOL and PAC-SYM the effect estimates in COMPOSE-4 did not reach statistical significance. Effectiveness results for COMPOSE-1, -2, -3, and -4 are presented in Table 4.9.
In regard to safety, naldemedine appeared to be generally well tolerated while not impeding the analgesic benefits of opioids or precipitating opioid-withdrawal syndrome. Proportions reporting any treatment-emergent adverse event or serious event were similar in naldemedine and placebo groups in COMPOSE-1, -2 and -3. However, in COMPOSE-4, the cancer trial, a higher number of patients reported TEAEs in the naldemedine group than the placebo group and a higher number discontinued for this reason, see Table 4.10.

CONFIDENTIAL UNTIL PUBLISHED
75
The ERG noted that patients taking naldemedine experienced a higher incidence of gastrointestinal adverse events such as diarrhoea than those receiving placebo. The company reported that in all trials most events were mild to moderate in severity.1, 16 Serious adverse events appeared to occur in similar proportions across treatment groups.
The company stated that no deaths in either treatment group across the COMPOSE trials were considered to be related to the study drug.1 The ERG noticed that 15 patients (11.5%) died in COMPOSE-5, the open-label study of cancer patients taking naldemedine. The clinical study report (CSR) for COMPOSE-5 stated that “**************************************************************************************************************************************************************************”.28
The company performed an indirect comparison (ITC) which compared naldemedine 0.2 mg (using pooled data from COMPOSE-1 and -2) with naloxegol (using pooled data from KODIAC-4 and -5). The outcomes analysed were the response rates at weeks 4 and 12. The ERG asked the company to clarify the pooling methods, however, even after receiving the response to request for clarification, it was not clear how the data from COMPOSE-1 and -2, or from KODIAC-4 and -5 were pooled.16, 18
After four and 12 weeks, results for naldemedine were comparable to naloxegol (risk ratio (RR) 0.76, 95% credible interval (CrI) 0.41 to 1.40 and RR 1.03, 95% confidence interval (CI) 0.75 to 1.41, respectively). The ERG checked the ITC calculations and could reproduce the reported results for week 12 but not week 4. The ERG obtained a relative risk for naloxegol versus naldemedine of 0.75 (95% CI 0.60 to 0.93) compared to the estimate of 0.76 (95% credible interval 0.41 to 1.40) presented in the CS. Even after response to the request for clarification, the ERG could not check whether the analysis was appropriate or verify the results.16
Overall, the ERG is concerned about the potential differences between the naldemedine and naloxegol trials particularly regarding the baseline comparability in SBM and opioid use and different definitions of OIC as well as differences regarding treatment response to laxatives. Given these differences and the discrepancies between the reported analysis methods and results the results of the ITC should be interpreted with caution.
In response to the request for clarification, the company provided details of six ongoing trials, see section 4.2.9.

CONFIDENTIAL UNTIL PUBLISHED
76
5. Cost effectiveness
5.1 ERG comment on company’s review of cost effectiveness evidence
5.1.1 Searches performed for cost effectiveness section
The following paragraphs contain summaries and critiques of all searches related to cost effectiveness presented in the company submission.
5.1.1.1 Published cost effectiveness studies
The original searches included in the company submission conducted in April 2019 did not include hits per line for each search strategy or a PRISMA flow diagram for the overall number of studies retrieved, this adversely affected the ERGs ability to fully critique the searches, an issue which was raised at clarification. In light of this and other errors involving an incorrect line combination in the Embase strategy and a missing comparator in the Medline search, the company chose to submit new corrected searches at response to clarification. The searches reported below were run on 28 October 2019. The company reported that no new studies were identified.
Table 5.1: Identification of cost effectiveness studies
Resource Host/Source Date range Original search: date searched
Electronic databases
MEDLINE Ovid 1946-2019/10/28 28/10/19
MEDLINE In-Process & Other Non-Indexed
MEDLINE Daily Update
MEDLINE Epub ahead of print
Embase 1947-2019/10/28 28/10/19
NHS EED Up to 2016/1st quarter
28/10/19
HTA Up to 2016/4th quarter
28/10/19
EconLit 1886- 2019/10/17 28/10/19
Conference proceedings
International Society for Pharmacoeconomics and Outcomes Research (ISPOR) Scientific Presentations Database
Years: 2012-2019 28/10/19
Additional resources
Cost effectiveness analysis (CEA) registry 28/10/19
Research Papers in Economics (RePEc) website
28/10/19
NICE 28/10/19
SMC 28/10/19 CEA = Cost effectiveness analysis; EED = Economic Evaluations Database; HTA = health technology assessment; ISPOR = International Society for Pharmacoeconomics and Outcomes Research; NHS = National Health Service; NICE = National Institute for Health and Care Excellence; RePEc = Research Papers in Economics; SMC = Scottish Medicine Consortium

CONFIDENTIAL UNTIL PUBLISHED
77
ERG comment:
Searches were conducted over a good range of resources, and the majority of searches were clearly reported and reproducible. The database name, host and date searched were provided. Additional searches of conference proceedings, economics resources and organisational websites were included in the SLR to identify further relevant studies and economic evaluations. Search terms for these grey literature searches and hits per resource were provided at clarification. Reference checking was not reported for these searches.
The ERG asked the company to confirm the host interface used for the Medline and Embase cost effectiveness searches. The syntax described in line #1 generated an error message in relation to the use of: 'constipation'/exp when the ERG attempted to rerun it in Ovid. The company reported that this error had been corrected in the updated searches and run in Ovid, however the revised Embase strategy still carried the error although a number of hits per line was reported. The ERG again tested this line in Ovid and received the same error message. It is unclear if its inclusion in this updated version was a reporting error.
5.1.1.2 Health-related quality of life
ERG comment:
The ERG noted that in Appendix D.1, the CS stated that the clinical evidence SLR searches were also intended to identify relevant literature on health-related quality of life. This was queried with the company at clarification, who responded “As reported in the CS, studies reporting HRQoL outcomes were eligible for inclusion in the clinical SLR as per the eligibility criteria shown above in Table 1 and in the supplied updated Appendix D. Further searches to capture HRQoL were not performed”.16 Whilst this approach will have retrieved some relevant data, the NICE DSU technical support document 9 states that: “HSUV data is not exclusively reported in RCTs. Often HSUVs are reported in observational studies as well as other cost-effectiveness studies such as HTAs and economic evaluations, and thus limiting by study design is not appropriate for reviews of HSUVs”.37 Further to this the searches described in Appendix D combined facets for opioid induced constipation with specific named interventions. This approach may have been overly restrictive resulting in HRQoL papers in the conditions of interest irrespective of treatment not being retrieved. Unfortunately, the ERG was unable to undertake independent HRQoL searches and review the results within the STA timeline, as this would be outside of the ERG remit. Therefore, the ERG is unable to say what effect these two restrictions may have had on the overall recall of results.
5.1.2 Inclusion/exclusion criteria
Detailed inclusion/exclusion criteria which were applied to the studies identified in the cost effectiveness searches were provided by the company in section G.1.3 of Appendix G of the CS.38 Inclusion/exclusion criteria were based on the PICOS criteria in order to identify the population and disease, interventions, comparators, outcomes and study designs of interest. No date limit was applied but non-English papers were excluded.
ERG comment: The ERG was concerned that the language limitation of only English language publications may have introduced potential language bias.

CONFIDENTIAL UNTIL PUBLISHED
78
5.1.3 Identified studies
In the CS, the company has not provided details on the number of records found as well as number and reasons of exclusion of particular records.1 The final list consists of eight included cost effectiveness studies and is provided in the CS. Details of all included studies are provided in Table 22 of the CS.1
ERG comment: It would have been useful to see the number of records and a PRISMA diagram for the cost effectiveness searches in order to have a better idea of which exclusion criteria had the largest impact on the results of the review. This was only provided in response to the request for clarification.16 However, further information should have been provided, e.g. in regards to the exclusion of publications in languages other than English (in line with a similar question on the clinical effectiveness, see A7 of the response to the request for clarification).16
5.1.4 Interpretation of the review
The reporting of the review was fairly poor; it is unclear how many records were found and why records were excluded.
5.2 Summary and critique of company’s submitted economic evaluation by the ERG
5.2.1 NICE reference case checklist (TABLE ONLY)
Table 5.2: NICE reference case checklist
Element of health technology assessment
Reference case ERG comment on company submission
Perspective on outcomes
All direct health effects, whether for patients or, when relevant, carers
Health outcomes are reported in QALYs
Perspective on costs NHS and PSS According to NICE reference case
Type of economic evaluation
Cost utility analysis with fully incremental analysis
According to NICE reference case
Time horizon Long enough to reflect all important differences in costs or outcomes between the technologies being compared
5 years. Represents 90th percentile opioid use in a representative UK sample of chronic non-cancer diagnosed users
Synthesis of evidence on health effects
Based on systematic review
Systematic literature reviews were conducted for relevant cost effectiveness studies. Evidence for HRQoL was not reviewed in a systematic way
Measuring and valuing health effects
Health effects should be expressed in QALYs. The EQ-5D is the preferred measure of health-related quality of life in adults.
According to NICE reference case
Source of data for measurement of health-related quality of life
Reported directly by patients and/or carers
Utility data were not available from the trial and were taken from TA3455

CONFIDENTIAL UNTIL PUBLISHED
79
Element of health technology assessment
Reference case ERG comment on company submission
Source of preference data for valuation of changes in health-related quality of life
Representative sample of the UK population
According to NICE reference case.
Equity considerations
An additional QALY has the same weight regardless of the other characteristics of the individuals receiving the health benefit
According to NICE reference case
Evidence on resource use and costs
Costs should relate to NHS and PSS resources and should be valued using the prices relevant to the NHS and PSS
CPRD database was used to determine research use. Relevant unit cost prices were used. Compared to previous estimates, cost estimates were conservative.
Discounting The same annual rate for both costs and health effects (currently 3.5%)
According to NICE reference case
CPRD = Clinical Practice Research Datalink; EQ-5D = European Quality of Life-5 Dimensions; ERG = Evidence Review Group; HRQoL = health-related quality of life; NHS = National Health Service; NICE = National Institute for Health and Care Excellence; PSS = personal social services; QALY = quality-adjusted life year; TA = technology appraisal; UK = United Kingdom
5.2.2 Population
The population for the model was defined as the licensed population for naldemedine, i.e.: treatment of OIC in adult patients who have previously been treated with a laxative.
The company split this population into three distinct subpopulations:
1. In patients with OIC as an alternative to second-line laxative monotherapy; 2. In patients with mixed aetiology constipation (including OIC) in combination with an existing
laxative as an alternative to combination laxative therapy 3. In patients with OIC after inadequate response to at least one laxative class as an alternative for
naloxegol (also referred to as laxative inadequate responders, LIRs)
The company did not explore the cost effectiveness in situations where naldemedine could be an alternative to subcutaneous methylnaltrexone in patients with advanced illness or to oxycodone/naloxone in patients requiring oxycodone. This was based on the reasoning that a) naloxegol has been shown to dominate methylnaltrexone and is cost effective compared to oxycodone/naloxone, b) naldemedine has the same acquisition cost as naloxegol and c) naldemedine is more effective than naloxegol, methylnaltrexone and oxycodone/naloxone.5
The original CS only assessed the cost effectiveness of naldemedine for non-cancer patients. However, in response to the request for clarification, the company provided an updated version of the model also
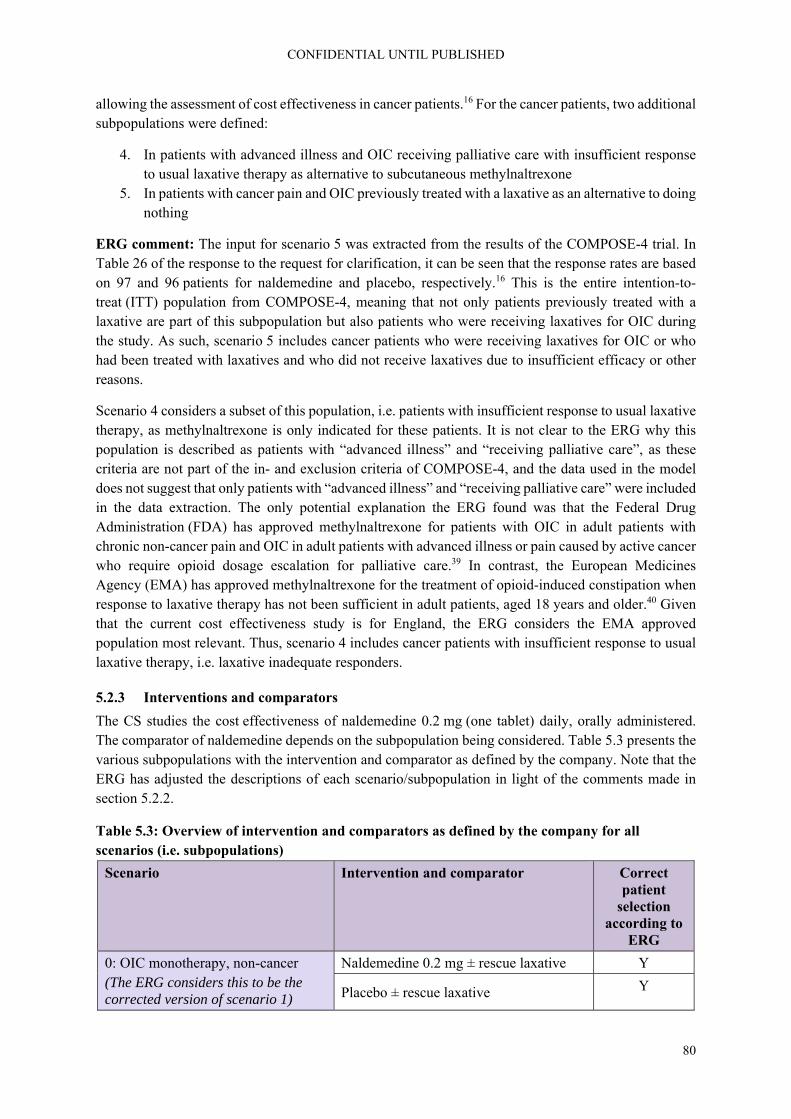
CONFIDENTIAL UNTIL PUBLISHED
80
allowing the assessment of cost effectiveness in cancer patients.16 For the cancer patients, two additional subpopulations were defined:
4. In patients with advanced illness and OIC receiving palliative care with insufficient response to usual laxative therapy as alternative to subcutaneous methylnaltrexone
5. In patients with cancer pain and OIC previously treated with a laxative as an alternative to doing nothing
ERG comment: The input for scenario 5 was extracted from the results of the COMPOSE-4 trial. In Table 26 of the response to the request for clarification, it can be seen that the response rates are based on 97 and 96 patients for naldemedine and placebo, respectively.16 This is the entire intention-to-treat (ITT) population from COMPOSE-4, meaning that not only patients previously treated with a laxative are part of this subpopulation but also patients who were receiving laxatives for OIC during the study. As such, scenario 5 includes cancer patients who were receiving laxatives for OIC or who had been treated with laxatives and who did not receive laxatives due to insufficient efficacy or other reasons.
Scenario 4 considers a subset of this population, i.e. patients with insufficient response to usual laxative therapy, as methylnaltrexone is only indicated for these patients. It is not clear to the ERG why this population is described as patients with “advanced illness” and “receiving palliative care”, as these criteria are not part of the in- and exclusion criteria of COMPOSE-4, and the data used in the model does not suggest that only patients with “advanced illness” and “receiving palliative care” were included in the data extraction. The only potential explanation the ERG found was that the Federal Drug Administration (FDA) has approved methylnaltrexone for patients with OIC in adult patients with chronic non-cancer pain and OIC in adult patients with advanced illness or pain caused by active cancer who require opioid dosage escalation for palliative care.39 In contrast, the European Medicines Agency (EMA) has approved methylnaltrexone for the treatment of opioid-induced constipation when response to laxative therapy has not been sufficient in adult patients, aged 18 years and older.40 Given that the current cost effectiveness study is for England, the ERG considers the EMA approved population most relevant. Thus, scenario 4 includes cancer patients with insufficient response to usual laxative therapy, i.e. laxative inadequate responders.
5.2.3 Interventions and comparators
The CS studies the cost effectiveness of naldemedine 0.2 mg (one tablet) daily, orally administered. The comparator of naldemedine depends on the subpopulation being considered. Table 5.3 presents the various subpopulations with the intervention and comparator as defined by the company. Note that the ERG has adjusted the descriptions of each scenario/subpopulation in light of the comments made in section 5.2.2.
Table 5.3: Overview of intervention and comparators as defined by the company for all scenarios (i.e. subpopulations)
Scenario Intervention and comparator Correct patient
selection according to
ERG
0: OIC monotherapy, non-cancer (The ERG considers this to be the corrected version of scenario 1)
Naldemedine 0.2 mg ± rescue laxative Y
Placebo ± rescue laxative Y

CONFIDENTIAL UNTIL PUBLISHED
81
Scenario Intervention and comparator Correct patient
selection according to
ERG
1: OIC monotherapy, non-cancer Naldemedine 0.2 mg, no rescue laxative N
Placebo + rescue laxative N
2: Mixed aetiology constipation; combination therapy, non-cancer
Stable laxative + naldemedine 0.2 mg, no rescue laxative
N
Stable laxative + placebo + rescue laxative
N
3: LIR; OIC mono-therapy, non-cancer
Naldemedine 0.2 mg, no rescue laxative N
Naloxegol 25 mg, no rescue laxative N
4: LIR; cancer with OIC Naldemedine 0.2 mg N
Methylnaltrexone (s.c.) ?
5: Cancer and OIC Naldemedine 0.2 mg ± rescue laxative Y
Placebo ± rescue laxative Y ERG = Evidence Review Group; LIR = laxative inadequate response; mg = mg: milligram; OIC = opioid induced constipation; s.c. = subcutaneous
ERG comments: In Table 5.3, a scenario 0 is presented though this scenario was not part of the initial CS as described in section 5.2.2. In the request for clarification, the ERG asked the company why for scenarios 1 and 2 the intervention was defined as naldemedine without rescue laxative.18 It was clear from the sample sizes for the response rate calculations (Table 26 of the CS) that only the patients who did not need rescue therapy during the study were included. However, it is highly unlikely that in clinical practice patients will be told not to use rescue medication. Additionally, the response rate of these patients that did not need any rescue therapy may not be a reasonable estimate for a situation where no rescue medication is permitted. In their response the company presented a scenario 0 in which both for the naldemedine and placebo group all patients from COMPOSE-1 and -2 were included, regardless of whether they had used rescue medication.16
Unfortunately, the company did not provide similarly corrected versions of scenarios 2 and 3, meaning that any results presented for these scenarios are incorrect.16 Also, for scenario 3 the company used the incorrect number for the naloxegol group, again using the response rate for patients not using any rescue medication.1
Finally, as mentioned earlier, in response to the request for clarification, the company provided two new scenarios for patients with cancer.16 For scenario 4, which includes cancer patients with an inadequate response to a previous laxative, the company presented methylnaltrexone as comparator, where naloxegol is also a potential comparator. Thus, for scenario 4 the ERG will also present results for naloxegol in section 7 of this report.
5.2.4 Perspective, time horizon and discounting
The report submitted by the company did not state from which perspective the cost effectiveness analysis was done and whether discounting was applied.1 However, from the included costs as described in the report and from the Excel model, it may be inferred that the analysis was conducted from the

CONFIDENTIAL UNTIL PUBLISHED
82
NHS and personal social services (PSS) perspective in England and Wales with 3.5% per annum discounting, applied for costs and QALY outcomes.
The time horizon was set to five years, as this represents the 90th percentile of prescribed opioid use in study of chronic non-cancer diagnosed users from a large representative sample of UK primary care data (CPRD study, Appendix M of CS).41 For sensitivity analyses, the model allows shorter time horizons, starting at one year. The model cycle length was four weeks, which corresponded to the first time-point that estimates of treatment response were available. A half-cycle correction was applied.
ERG comment: The ERG concludes that the discount rate and study perspectives are in-line with the NICE reference case. Regarding the choice for a five year time horizon, the company justified this based on the results of an analysis of the UK CPRD primary-care data set with reference to Appendix M of the CS.41 The ERG could not confirm that this value, or any other that would correspond to the 90th percentile of opioid analgesic episode duration, is actually reported in that reference. However, the ERG considers the five-year time horizon as adequate to include all relevant costs and effects.
5.2.5 Model structure
The company used a decision-analytic model to assess the cost effectiveness of naldemedine for the treatment of OIC relative to the comparator treatments in each scenario. The structure of the model is the same as in the NICE technology appraisal of naloxegol for the treatment of OIC (TA345).5 The model consists of two parts: a decision-tree structure (shown in Figure 5.1) that applies to the first four weeks of treatment, and a Markov structure (shown in Figure 5.2) that applies to the time period thereafter. It should be noted that for scenario 2, the proportion of responders at four weeks is based on the responses of patients in COMPOSE-3 at 12 weeks (which were carried backward to week 4, due to unavailability of data from earlier time points). According to the company, this is a conservative assumption, given that actual response rate at week 4 would be expected to be higher due to loss of response over time.16 For scenarios 4 and 5 (cancer with LIR and cancer, respectively), the proportion of responders at four weeks is based on the responses of patients in COMPOSE-4 at two weeks (which were carried forward to week 4).The Markov part of the model uses a cycle length of four weeks, and a five-year time horizon. It consists of the following health states: OIC, non-OIC (on treatment), non-OIC (untreated), and death.
Figure 5.1: Decision-tree structure for first model cycle (response assessment)
Based on Figure 23 of the CS1 CS = company submission; OIC = opioid-induced constipation
Patients with OIC previously treated with
laxative
Naldemedine treatmentOIC (non-responder)
Non-OIC (responder)
Comparator treatment OIC (non-responder)
WEEK 0 WEEK 4
Non-OIC (responder)

CONFIDENTIAL UNTIL PUBLISHED
83
Figure 5.2: Markov model structure from second model cycle onwards
Based on Figure 24 of the CS1 CS = company submission; OIC = opioid-induced constipation
The decision-tree structure of the model (see Figure 5.1 above) is used to differentiate between patients entering the Markov structure in either the non-OIC (on treatment) health state (i.e. “responders” from Figure 5.1) or the OIC health state (i.e. “non-responders” from Figure 5.1). In the model, responders are those patients who experience a relief of constipation that is quantified as ≥3 SBMs in at least three weeks per four-week cycle. This deviates from the definition of a responder in the trials: ≥3 SBMs per week, and an increase from baseline of at least one SBM per week for that week, for at least nine weeks out of the 12-week treatment period and at least three of the last four weeks of the 12-week treatment period. The CS argues that an advantage of the definition as used for the model is that it allows alignment with the model cycle time of four weeks, and also allows utilities and costs to be assigned to health state that correspond to OIC status, instead of change in status.1
Importantly, non-responders (i.e. either patients who have failed to meet the response criterion after the initial four weeks, or patients who are responders initially but experience a re-occurrence of OIC at a later point in time) are assumed to have discontinued their treatment, and are also assumed not to resume treatment at a later point in time.
For the Markov part of the model (see Figure 5.2 above), patients who are in non-OIC (on treatment) either stay in that health state during the next cycle, move to OIC (transition A), or die. Patients in OIC either stay in that health state during the next cycle, move to non-OIC (untreated) (transition B), or die. Patients in non-OIC (untreated) either stay in that health state during the next cycle, move to OIC (transition C), or die.
Regarding the assumption that patients may not resume treatment in the absence of a response after four weeks or after the re-occurrence of OIC thereafter, the company refers to the results of the scenario analyses that were performed for the CS in TA345.5 In those analyses the inclusion of a reverse transition from OIC to non-OIC on resumption of treatment, with transition probabilities varied between 0 and 10%, only had minimal impact on the cost effectiveness results. The exclusion of the possibility to resume treatment as a non-responder or after having lost response is reported by the company to be in line with the NHS’ goal of efficient use of resources, as well as a European expert consensus statement.2 Transitions B and C, from OIC to non-OIC (untreated) and vice versa, allow the model to account for the variable nature of OIC. This is reported to be in line with clinical expert opinion from an advisory board, as well as the results from (post-hoc) analyses of data from the placebo arms of the clinical trials on both naloxegol and naldemedine. The omission of a transition from non-OIC (on
OIC Non-OIC
(on treatment)
Death Non-OIC
(untreated)
A
B
C

CONFIDENTIAL UNTIL PUBLISHED
84
treatment) to non-OIC (untreated) was based on the assumption that patients on treatment would be unlikely to detect a spontaneous resolution of the cause of OIC. As such, patients who are receiving treatment are assumed to fully ascribe the absence of OIC to the effectiveness of the treatment.
The company reports that the maximum time horizon of five years is based on an analysis of UK Clinical Practice Research Datalink (CPRD) primary-care data set,41 and corresponds to the 90th percentile of opioid analgesic episode duration.
ERG comment: The ERG considers the general structure of the model, pertaining to the decision-tree part, the Markov part, and the combination thereof, as appropriate. The same model was previously also considered by the ERG for TA345 to be appropriate.5
Regarding the assumption the decision being made at week 4, or at later time points while referring back to a preceding time period of four consecutive weeks, about whether a patient is considered as a responder or non-responder, the ERG has consulted with a clinical expert and can confirm that this assumption is justified. The clinical expert consulted also confirmed the appropriateness of the assumption that treatment is discontinued for non-responders, or those having lost response.
In analogy to the concern raised by the ERG in TA345, also for the current appraisal there is concern regarding the level of heterogeneity that is captured in defining health states only in terms of OIC versus non-OIC.5 Much variety could exist in the number of SBMs per patient in the non-OIC health state. In the current definition, only nine SBMs should occur over a 28-day period to be classified as a responder. But patients who have 28 SBMs in these 28 days are in the same health state, and thus are assumed to have the same quality of life as those with only nine SBMs. The ERG expects that these differences in SBMs might translate into differences in quality of life as well.
Another difference that could be of possible relevance is the impact of complete spontaneous bowel movements (CSBMs) versus incomplete SBMs on quality of life. In their request for clarification, the ERG asked the company to amend the electronic model with the option to use the results from an analysis that discriminates between CSBMs and non-complete SBMs.18 However, in response to that request, the company stated that no information on utilities is available in relation to the completeness of bowel movements, and, that results from preference research42 (i.e. patients indicating which aspects of their disorder they would prefer to improve) indicated that completeness of bowel movements was not featured as an “extremely” or “very” important aspect of constipation.16 The clinical expert consulted by the ERG was doubtful whether the distinction between CSBMs and SBMs would be important to patients, and confirmed that is was reasonable to assume that the two are similar.
The ERG agrees with the company that in the absence of more refined utility or cost estimates, refining the health states to more homogeneous states will not affect the outcomes substantially.
5.2.6 Treatment effectiveness and extrapolation
5.2.6.1 Response assessment
In alignment to the different scenarios that were formulated for the appraisal, the company has used different datasets (corresponding to the different interventions and/or the patient population) to inform model parameters, as well as different outcomes as a basis for the response criterion.1
In scenario 1, the response criterion for patients receiving naldemedine (restricted to those who did not use rescue laxative) was defined using SBMs, while it was defined using BMs for the placebo group (restricted to those who did use rescue laxative). Due to concerns regarding these

CONFIDENTIAL UNTIL PUBLISHED
85
inconsistencies in the definitions of interventions and outcomes, the ERG requested the results of an analysis in which the interventions are appropriately defined (i.e. regardless of the use of rescue laxative), and in which outcomes are defined consistently (i.e. by using SBMs as a basis for the response criterion for both arms).18 This additional scenario was provided by the company and labelled as scenario 0.16 For both scenarios 0 and 1, pooled data from the COMPOSE-1 and -2 trials were used.
In scenario 2, the response criterion was defined using the frequency of bowel movements (BMs) based on data from the subgroup of patients in COMPOSE-3 who entered the study on a stable laxative regimen. In absence of data from earlier time points in COMPOSE-3, the proportions of responders in scenario 2 were defined using data at 12 weeks.
In scenario 3, the response criterion was defined using the frequency of SBMs based on data derived from an indirect treatment comparison (ITC) analysis of pooled data from the subpopulation of patients that previously had a LIR in the COMPOSE-1, COMPOSE-2 (both for naldemedine), KODIAC-4, and KODIAC-5 (both for naloxegol) trials. Additionally, these were patients who received no rescue medication.
In scenario 4, the response criterion was defined at week 2 using the frequency of SBMs based on data derived from an ITC of the cancer patients in COMPOSE-4 (for naldemedine), and an RCT on methylnaltrexone.43
In scenario 5, the response criterion was defined using the frequency of SBMs based on data from patients who responded at week 2 to naldemedine in COMPOSE-4 and continued into COMPOSE-5, versus patients who were on placebo in COMPOSE-4 and switched to naldemedine in COMPOSE-5.
In Table 5.4 the proportions of responders at weeks two, four and 12 (where applicable), including the data sources that were used, are shown for each scenario.
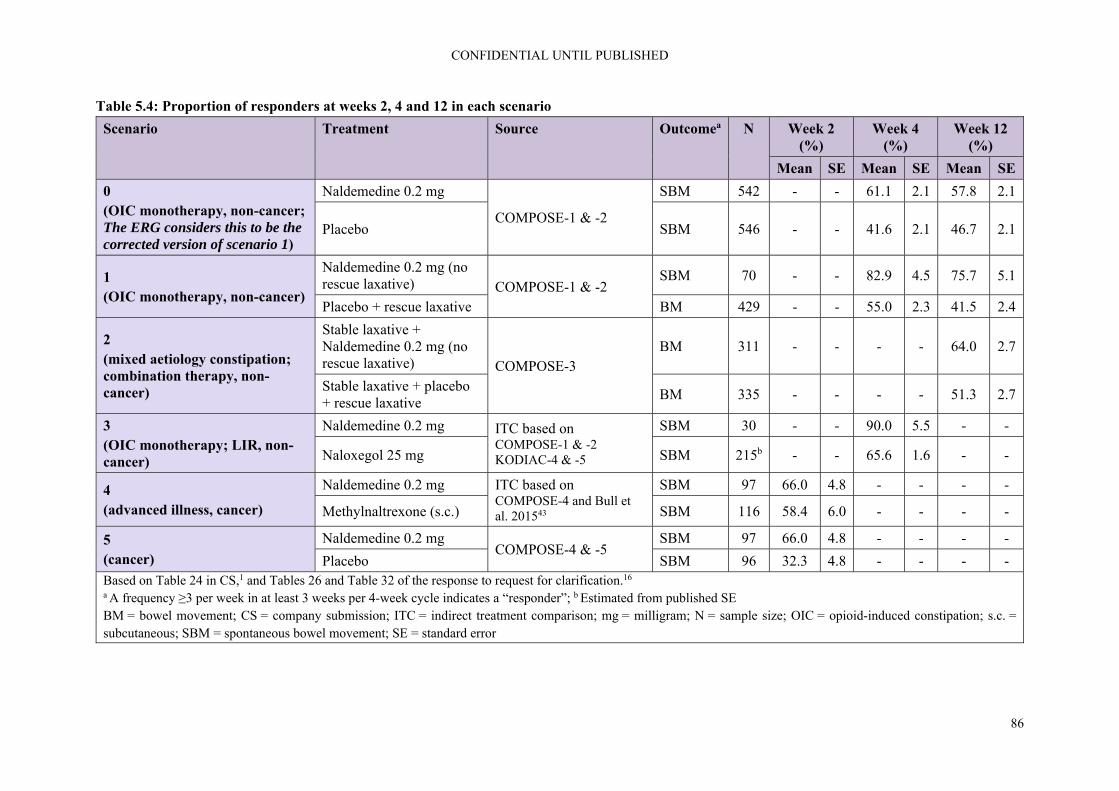
CONFIDENTIAL UNTIL PUBLISHED
86
Table 5.4: Proportion of responders at weeks 2, 4 and 12 in each scenario
Scenario Treatment Source Outcomea N Week 2 (%)
Week 4 (%)
Week 12 (%)
Mean SE Mean SE Mean SE
0 (OIC monotherapy, non-cancer; The ERG considers this to be the corrected version of scenario 1)
Naldemedine 0.2 mg
COMPOSE-1 & -2
SBM 542 - - 61.1 2.1 57.8 2.1
Placebo SBM 546 - - 41.6 2.1 46.7 2.1
1 (OIC monotherapy, non-cancer)
Naldemedine 0.2 mg (no rescue laxative) COMPOSE-1 & -2
SBM 70 - - 82.9 4.5 75.7 5.1
Placebo + rescue laxative BM 429 - - 55.0 2.3 41.5 2.4
2 (mixed aetiology constipation; combination therapy, non-cancer)
Stable laxative + Naldemedine 0.2 mg (no rescue laxative) COMPOSE-3
BM 311 - - - - 64.0 2.7
Stable laxative + placebo + rescue laxative
BM 335 - - - - 51.3 2.7
3 (OIC monotherapy; LIR, non-cancer)
Naldemedine 0.2 mg ITC based on COMPOSE-1 & -2 KODIAC-4 & -5
SBM 30 - - 90.0 5.5 - -
Naloxegol 25 mg SBM 215b - - 65.6 1.6 - -
4 (advanced illness, cancer)
Naldemedine 0.2 mg ITC based on COMPOSE-4 and Bull et al. 201543
SBM 97 66.0 4.8 - - - -
Methylnaltrexone (s.c.) SBM 116 58.4 6.0 - - - -
5 (cancer)
Naldemedine 0.2 mg COMPOSE-4 & -5
SBM 97 66.0 4.8 - - - -
Placebo SBM 96 32.3 4.8 - - - - Based on Table 24 in CS,1 and Tables 26 and Table 32 of the response to request for clarification.16 a A frequency ≥3 per week in at least 3 weeks per 4-week cycle indicates a “responder”; b Estimated from published SE BM = bowel movement; CS = company submission; ITC = indirect treatment comparison; mg = milligram; N = sample size; OIC = opioid-induced constipation; s.c. = subcutaneous; SBM = spontaneous bowel movement; SE = standard error

CONFIDENTIAL UNTIL PUBLISHED
87
5.2.6.2 Health state transitions
This section describes the data, methods and assumptions that were used in the CS to estimate the transition probabilities between the different health states of the model.
5.2.6.2.1 Transition A: from non-OIC (on treatment) to OIC
Transition A in the model, from the non-OIC (on treatment) to the OIC health state, represents the loss of response to treatment. The probabilities for transition A were based on extrapolated time-to-event data from the relevant trials outlined in Table 5.4.
For scenario 3, the naloxegol time-to-event curve was defined as having a proportional hazard compared to the curve for naldemedine, with the hazard ratio approximated by the odds ratio of the treatment response for naloxegol relative to naldemedine. For scenario 4 a similar approach was used, now the hazard ratio was approximated by the odds ratio of the treatment response for methylnaltrexone relative to naldemedine.
For COMPOSE-1 and -2, patients were followed between weeks 4 and 12 after entry into non-OIC (on treatment) as a non-responder, after an initial four weeks of treatment. Response to treatment was assessed each subsequent week, based on a time period of four consecutive weeks, until OIC re-occurred. Hence, there were five time points on which data were available for the transition from non-OIC to OIC: week 5-8, week 6-9, week 8-11, and week 9-12. For COMPOSE-3, the company reported that the same approach was followed, except that patients were identified as responders or not based on BMs instead of SBMs, and after 12 weeks of treatment, instead of four. For COMPOSE-4 and -5, the company reported that a similar model was generated, with no further details provided.
Patients for whom treatment exposure data was only available for a time period less than 12 weeks were censored at the nearest week following the last known day of exposure. Censoring reasons included discontinuation, loss to follow-up and all-cause mortality, which was modelled separately.
Parametric survival modelling was used to generate estimates of transition A, for which the following distributions were considered: exponential, Weibull, log-logistic, log-normal (all fitted using the SUVREG procedure in R), Gompertz (fitted using FLEXSURVREG in R), and generalised gamma (results only reported for scenario 0 in response to the clarification questions, software used for fitting unknown). Goodness-of-fit was assessed by 1) visual inspection of correspondence between observed and predicted values, 2) diagnostic plots associated with each of the distributions under consideration and 3) comparison of the Akaike information criterion (AIC) and Bayesian information criterion (BIC). Treatment effect was modelled as a parameter, in accordance (i.e. based on visual inspection of the curves, and assessment of Schoenfeld residuals the proportional hazards assumption seemed appropriate) with the recommendations as provided in NICE Decision Support Unit (DSU) technical support document (TSD) 14.44
Following their assessment of goodness-of-fit, the company used a lognormal distribution for the extrapolated survival curves for transition A in all scenarios except scenario 2, for which an exponential distribution was used.
The company reported that AIC and BIC values were lowest for the generalised gamma distribution (no actual values were reported) in scenario 0, and has provided an additional set of results based on this distribution.16 No further explanation was provided regarding the clinical plausibility of using the generalised gamma distribution nor any of the other distributions. Although both lognormal and Gompertz provided a close fit for scenario 1, the company deemed the first more reasonable than the

CONFIDENTIAL UNTIL PUBLISHED
88
latter based on visual inspection. Although AIC and BIC scores were lowest for the lognormal distribution in scenario 2, the company deemed the exponential more suitable than the latter based on visual inspection and diagnostic plots that did not indicate superiority for any of the distributions.
The parametric survival curves of transition A for each scenario are shown in Figures 5.3 to 5.7.
Figure 5.3: Parametric survival curves of transition A for scenario 0
Based on Figure 33 of the response to the request for clarification16 KM = Kaplan-Meier
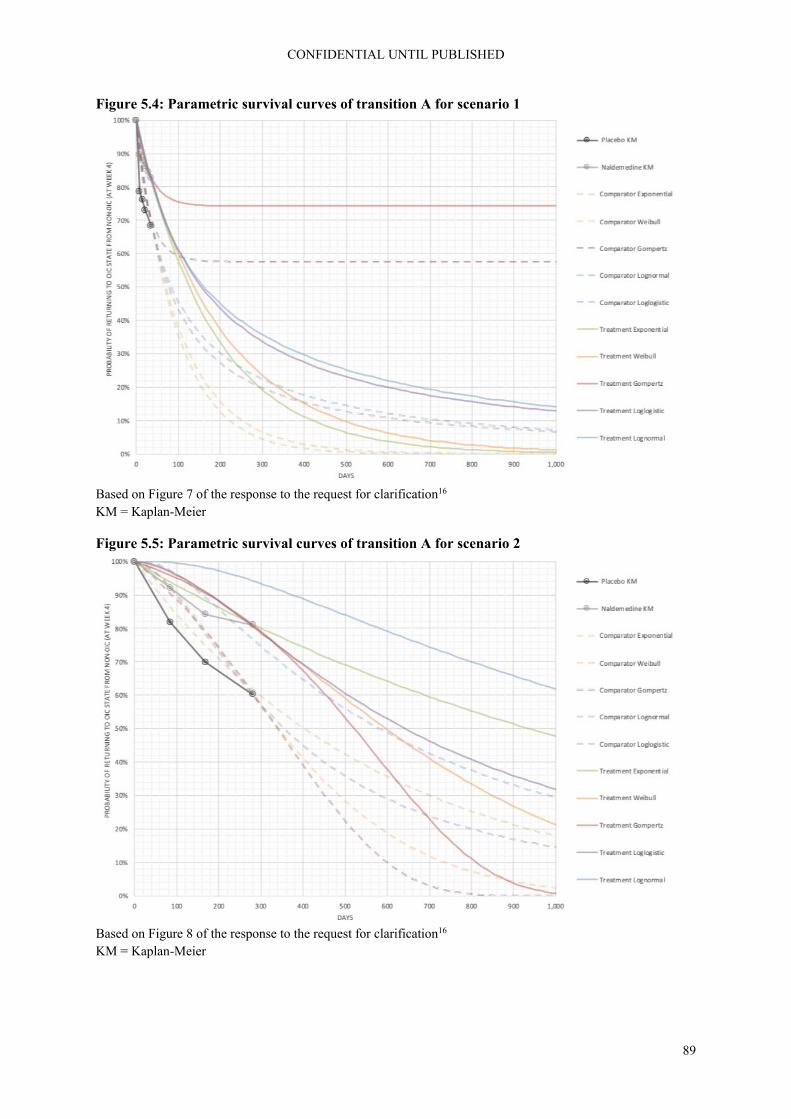
CONFIDENTIAL UNTIL PUBLISHED
89
Figure 5.4: Parametric survival curves of transition A for scenario 1
Based on Figure 7 of the response to the request for clarification16 KM = Kaplan-Meier
Figure 5.5: Parametric survival curves of transition A for scenario 2
Based on Figure 8 of the response to the request for clarification16 KM = Kaplan-Meier

CONFIDENTIAL UNTIL PUBLISHED
90
Figure 5.6: Parametric survival curves of transition A for scenario 3
Based on Figure 9 of the response to the request for clarification16 KM = Kaplan-Meier
Figure 5.7: Parametric survival curves of transition A for scenarios 4 and 5
Based on Figures 25 and 26 of the response to the request for clarification16 KM = Kaplan-Meier

CONFIDENTIAL UNTIL PUBLISHED
91
5.2.6.2.2 Transition B: from OIC to non-OIC (untreated)
Based on pooled data from the (subgroups in the) placebo arm from the relevant COMPOSE-1, -2 and -3 trials for each scenario, patients were followed from entry into OIC as a non-responder after four weeks of treatment in COMPOSE-1 and -2, or 12 weeks of treatment in COMPOSE-3, until the end of the next four-week time period (i.e. weeks 5-8). The estimated mean transition probabilities for transition B are provided in Table 5.5 for each scenario.
5.2.6.2.3 Transition C: from non-OIC (untreated) to OIC
The transition probabilities for transition C were estimated using the same datasets and time points as for transition B but refers to the transition of non-OIC to OIC instead of vice versa. The estimated mean transition probabilities for transition C are provided in Table 5.5.
Table 5.5: Estimated mean transition probabilities for transitions B and C in each scenario
Mean SE
Scenario 0: COMPOSE 1&2, placebo
Transition B (OIC to non-OIC [untreated]) 19.12% 2.01%
Transition C (non-OIC [untreated] to OIC) 18.50% 2.01%
Scenario 1: COMPOSE 1&2, placebo (no rescue)
Transition B (OIC to non-OIC [untreated]) 18.2% 2.2%
Transition C (non-OIC [untreated] to OIC) 21.3% 3.3%
Scenario 2: COMPOSE 3, stable laxative + placebo (no rescue)
Transition B (OIC to non-OIC [untreated]) 20.6% 3.2%
Transition C (non-OIC [untreated] to OIC) 35.5% 3.6%
Scenario 3: COMPOSE 1&2, placebo (no rescue)
Transition B (OIC to non-OIC [untreated]) 26.8% 4.5%
Transition C (non-OIC [untreated] to OIC) 13.8% 3.7%
Scenario 4: COMPOSE 1&2, placebo
Transition B (OIC to non-OIC [untreated]) 19.1% 2.2%
Transition C (non-OIC [untreated] to OIC) 18.5% 2.6%
Scenario 5: COMPOSE 1&2, placebo
Transition B (OIC to non-OIC [untreated]) 19.1% 2.2%
Transition C (non-OIC [untreated] to OIC) 18.5% 2.6% Based on Table 26 of the CS1 as well as Tables 16 and 28 in the response to request for clarification16 CS = company submission; OIC = opioid-induced constipation, SE = standard error
5.2.6.2.4 Mortality
From each health state, the model allows patients to transition to the death health state according the age- and gender-matched mortality rates for scenarios 0, 1, 2, and 3. According to the explanation provided in the original CS, these mortality rates are based on UK life tables for the years 2015 to 2017.1, 45 This contrasts with the reference that is given in the model below the actual mortality rates being used, which refers to “NCHS, National Vital Statistics System, Mortality” as the source of this information.
For scenarios 4 and 5, a hazard ratio has been calculated from CPRD data, which is applied to the general population mortality rates to adjust for the increased mortality rate of cancer patients.

CONFIDENTIAL UNTIL PUBLISHED
92
ERG comment: The ERG found the process to arrive at a final set of extrapolations problematic. This process involved the assessment of various sets of extrapolated survival curves (including sets of erroneous curves in the CS, revised curves in response to the ERG’s clarification questions, and additional curves submitted in a second, delayed response to clarification questions), with both their correctness, completeness and explanation of underlying methodology varying, on different occasions, for all the different scenarios.
More importantly, as pointed out in sections 5.2.3 and 5.2.4, only for scenarios 0 and for scenario 5 did the company use the appropriate patient selection to assess the cost effectiveness for the intended population. This fundamentally renders all results and discussion with regards to scenario 1, 2, 3, and 4 irrelevant. Subsequently, we will therefore focus on scenarios 0 and 5, whilst discussing the general principles.
The choices of survival curves that were used in the model were informed and justified by the company by assessment of goodness-of-fit through visual inspection, assessment of diagnostic plots, and AIC/BIC values. Furthermore, the company provided justification in the form of visual inspection of log-cumulative hazard plots, as well as a more formal analysis of Schoenfeld residuals for the assumption of proportional hazards for scenarios 1, 2, and 3. Regarding the latter, the ERG concurs with the conclusion that the time-to-event curves could be estimated as one curve for placebo and naldemedine with treatment as a covariate.
However, the most important element of selecting the most appropriate curve, i.e. clinical plausibility, was not addressed in the CS.1 In response to the request for clarification, the company stated that a full report on validation will be available by the end of November 2019, which is beyond the time period for ERG assessment.16
The ERG therefore asked its clinical expert to reflect on the curves for scenario 0 (Figure 5.3) and indicate which of these curves is most likely to be a “correct” representation of loss of response. Additionally, he was asked if there was any relevant literature on the duration of the treatment response. In response, the clinical expert indicated not to be aware of any published data examining this question. Regarding the most plausible shape of the time-to-event curve, the expert indicated that in their clinical experience, assuming all things are equal, i.e. dose of opioid/type of opioid/route of opioid administration does not change (although it frequently does), the Gompertz model most accurately reflects the clinical experience with naloxegol and there is no reason at this stage to suggest that naldemedine would be any different. This suggested curve is quite different from the lognormal curve the company selected as their preferred curve. For the naldemedine group, the percentage of patients still remaining in the non-OIC state is 60% for the Gompertz curve versus less than 10% for the lognormal curve (see Figure 5.3).
Given the large differences between the various curves, the company performed several sensitivity analyses that demonstrated that use of alternative parametric distributions for survival curves led to relatively small differences in cost effectiveness results, see section 6. This can be explained by noting that although the shapes of the curves vary greatly, the area between the two curves for any given distribution remains comparable. Hence, also the incremental differences between treatments remain comparable regardless of which distribution is used for the extrapolation of the curves for both treatments.
The ERG also considers the approach of using the results of the ITC analyses (i.e. the odds ratio of treatment response) as the hazard ratio for the time-to-OIC extrapolations in scenarios 3 and 4 in principle as the most sensible in light of the available data. However, as discussed earlier, the data

CONFIDENTIAL UNTIL PUBLISHED
93
extracted from the COMPOSE studies are not in line with the defined populations and interventions, making the analyses based on this approach undependable. Also, though a correlation is likely between response odds and rate of transition from non-OIC (on treatment) to OIC, the ERG is not convinced that this relation would be strictly 1-on-1. Furthermore, it is important to note that if a constant hazard is assumed between naldemedine and another treatment, the time-to-event curve should follow an exponential or Weibull distribution. In Figure 5.6 it can be seen though, that these curves approach 0 the quickest, which at odds with the suggestion of the clinical expert that a plateau after some time might be expected.
Regarding scenarios 2, 4 and 5, the ERG is uncertain regarding the soundness of the results presented. The presentation and explanation of the methodology that is used for this model, including the time-to-event curves for transition A and how these were derived from the data, are very limited, i.e. mostly implying or stating that it is similar to what was done for the other scenarios. Therefore, the ERG has difficulties to interpret how the company has dealt with situations where the data that are available to inform these scenarios are incompatible with the approach outlined for the other scenarios. For example, the CS stated that data from COMPOSE-3 informed the model used for scenario 2 regarding weekly occurrences of transition A.1 However, the study protocol for COMPOSE-3 indicates that data collection in this study was done using 12-week intervals. It is similarly unclear how data from COMPOSE-5 was used for the modelling of transition A in scenarios 4 and 5. In light of the lack of explanation, and therefore justification, provided, the ERG cannot comment on the appropriateness of the analyses regarding these aspects.
Regarding mortality rates, it is not clear to the ERG what the company intended to do, use UK or USA specific mortality rates. Neither is it clear what has actually been done in the model regarding mortality. In case the reference in the model (National Vital Statistics System) indeed was used, thereby applying mortality rates of a population from the United States of America, the ERG considers this as inappropriate for the context of the UK. The use of mortality rates based on a UK population is recommended instead.
5.2.7 Adverse events
In the health economic model adverse events are included as a source of resource use (see Table 5.6). The occurrence of adverse events for naldemedine and placebo was taken from re-analyses of four and two week rates of adverse event rates from the COMPOSE-3 and -4 trials, respectively; adverse events for naloxegol where taken from the prescribing information and for methylnaltrexone were taken from Bull et al. 2015.43 Except for naloxegol and methylnaltrexone, the occurrence of adverse events was very limited. The Advisory Board (Appendix O of the CS) indicated that abdominal pain, diarrhoea, flatulence, headache, nausea and vomiting were the most relevant adverse events.
Table 5.6: Adverse event rates in the economic model
Naldemedine Naldemedine (cancer)
Naloxegol Placebo (cancer)
Placebo Methyl-naltrexone
Abdominal distension
0.17% 0.00% NR 0.00% 0.00% NR
Abdominal pain
0.99% 0.00% 21.00% 0.00% 0.33% 33.60%
Diarrhoea 0.99% 0.13% 9.00% 0.00% 0.16% 7.80%
Flatulence 0.00% 0.00% 6.00% 0.00% 0.00% 6.90%
Headache 0.33% 0.00% 4.00% 0.00% 0.33% NR
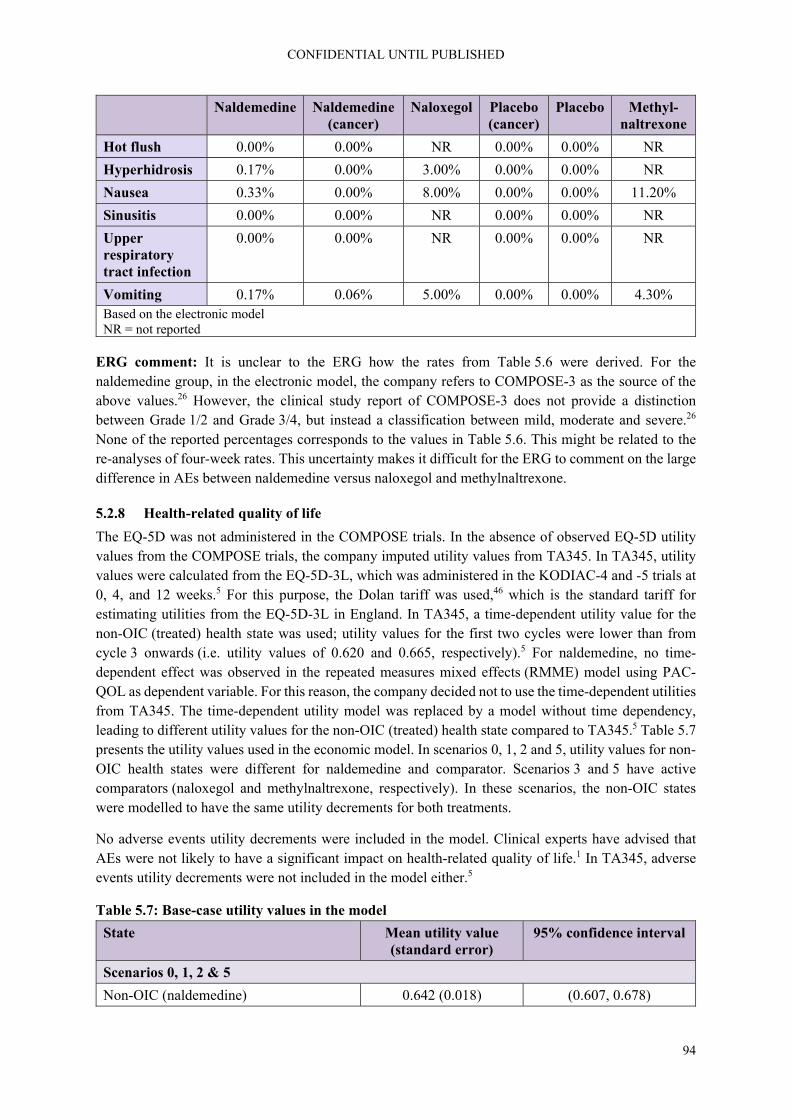
CONFIDENTIAL UNTIL PUBLISHED
94
Naldemedine Naldemedine (cancer)
Naloxegol Placebo (cancer)
Placebo Methyl-naltrexone
Hot flush 0.00% 0.00% NR 0.00% 0.00% NR
Hyperhidrosis 0.17% 0.00% 3.00% 0.00% 0.00% NR
Nausea 0.33% 0.00% 8.00% 0.00% 0.00% 11.20%
Sinusitis 0.00% 0.00% NR 0.00% 0.00% NR
Upper respiratory tract infection
0.00% 0.00% NR 0.00% 0.00% NR
Vomiting 0.17% 0.06% 5.00% 0.00% 0.00% 4.30% Based on the electronic model NR = not reported
ERG comment: It is unclear to the ERG how the rates from Table 5.6 were derived. For the naldemedine group, in the electronic model, the company refers to COMPOSE-3 as the source of the above values.26 However, the clinical study report of COMPOSE-3 does not provide a distinction between Grade 1/2 and Grade 3/4, but instead a classification between mild, moderate and severe.26 None of the reported percentages corresponds to the values in Table 5.6. This might be related to the re-analyses of four-week rates. This uncertainty makes it difficult for the ERG to comment on the large difference in AEs between naldemedine versus naloxegol and methylnaltrexone.
5.2.8 Health-related quality of life
The EQ-5D was not administered in the COMPOSE trials. In the absence of observed EQ-5D utility values from the COMPOSE trials, the company imputed utility values from TA345. In TA345, utility values were calculated from the EQ-5D-3L, which was administered in the KODIAC-4 and -5 trials at 0, 4, and 12 weeks.5 For this purpose, the Dolan tariff was used,46 which is the standard tariff for estimating utilities from the EQ-5D-3L in England. In TA345, a time-dependent utility value for the non-OIC (treated) health state was used; utility values for the first two cycles were lower than from cycle 3 onwards (i.e. utility values of 0.620 and 0.665, respectively).5 For naldemedine, no time-dependent effect was observed in the repeated measures mixed effects (RMME) model using PAC-QOL as dependent variable. For this reason, the company decided not to use the time-dependent utilities from TA345. The time-dependent utility model was replaced by a model without time dependency, leading to different utility values for the non-OIC (treated) health state compared to TA345.5 Table 5.7 presents the utility values used in the economic model. In scenarios 0, 1, 2 and 5, utility values for non-OIC health states were different for naldemedine and comparator. Scenarios 3 and 5 have active comparators (naloxegol and methylnaltrexone, respectively). In these scenarios, the non-OIC states were modelled to have the same utility decrements for both treatments.
No adverse events utility decrements were included in the model. Clinical experts have advised that AEs were not likely to have a significant impact on health-related quality of life.1 In TA345, adverse events utility decrements were not included in the model either.5
Table 5.7: Base-case utility values in the model
State Mean utility value (standard error)
95% confidence interval
Scenarios 0, 1, 2 & 5
Non-OIC (naldemedine) 0.642 (0.018) (0.607, 0.678)

CONFIDENTIAL UNTIL PUBLISHED
95
State Mean utility value (standard error)
95% confidence interval
Non-OIC (placebo) 0.613 (0.021) (0.573, 0.655)
Non-OIC (untreated) 0.613 (0.021) (0.573, 0.655)
OIC 0.553 (0.022) (0.511, 0.597)
Scenarios 3 & 4 (active comparator)
Non-OIC 0.630 (0.014) (0.603, 0.658)
OIC 0.564 (0.017) (0.531, 0.598) OIC = opioid-induced constipation
The following scenario analyses were performed by the company regarding the HRQoL values in the model (for values see Table 5.8):
Health state specific utilities: No distinction was made in the utility value for the non-OIC with respect to treatment. This was the base-case for scenario 3 and 4.
SF12 mapped to EQ-5D: Quality of life was measured in the COMPOSE trials with the SF-36 (v2). The SF-36 can be transformed to a SF-12 form. A mapping exercise was performed using the SF-12 to predict EQ-5D utilities. According to the company, the mapping exercise confirmed the insensitivity of the SF-36 in disease related health-related quality of life in OIC, as the coefficient of non-OIC versus OIC was smaller than observed in the naloxegol studies. The SF-12 mapped EQ-5D utilities were presented in a scenario analysis.
PAC-QOL mapped to EQ-5D (in response to clarification letter): In addition to the SF-36, quality of life was measured in the COMPOSE trials using the disease specific PAC-QOL. The PAC-QOL can be used to map EQ-5D utilities using the tariff developed by Parker et al. 2011 47. In response to the clarification letter, the company presented the results of a scenario analyses in which EQ-5D utilities mapped from the PAC-QOL were used.
SF-6D utilities (in response to clarification letter): The SF-36 can be transformed to SF-6D, from which utilities can be derived. In response to the clarification letter, the company has presented the results of a scenario analysis in which SF-6D utilities were used.
Table 5.8: Input values different utility sources
Non-OIC (treatment)
Non-OIC (untreated)
OIC
Treatment specific TA345* 0.642 0.613 0.553
Health state specific TA345** 0.630 0.630 0.564
Health state specific SF-12 mapped EQ5D
0.515 0.515 0.460
Treatment specific PAC-QOL mapped EQ5D
0.920 0.880 0.770
SF-6D Utilities 0.576 0.576 0.538 * Base-case in scenario 0, 1, 2 & 5; ** Base-case in scenario 3 & 4
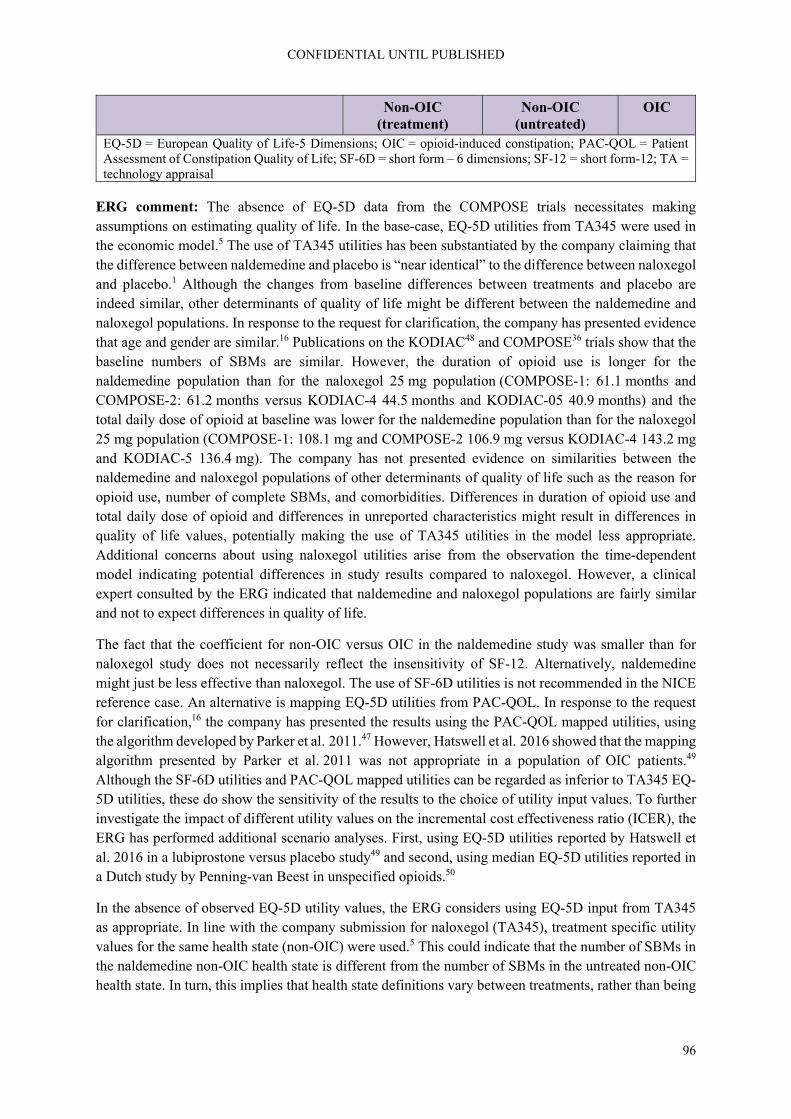
CONFIDENTIAL UNTIL PUBLISHED
96
Non-OIC (treatment)
Non-OIC (untreated)
OIC
EQ-5D = European Quality of Life-5 Dimensions; OIC = opioid-induced constipation; PAC-QOL = Patient Assessment of Constipation Quality of Life; SF-6D = short form – 6 dimensions; SF-12 = short form-12; TA = technology appraisal
ERG comment: The absence of EQ-5D data from the COMPOSE trials necessitates making assumptions on estimating quality of life. In the base-case, EQ-5D utilities from TA345 were used in the economic model.5 The use of TA345 utilities has been substantiated by the company claiming that the difference between naldemedine and placebo is “near identical” to the difference between naloxegol and placebo.1 Although the changes from baseline differences between treatments and placebo are indeed similar, other determinants of quality of life might be different between the naldemedine and naloxegol populations. In response to the request for clarification, the company has presented evidence that age and gender are similar.16 Publications on the KODIAC48 and COMPOSE36 trials show that the baseline numbers of SBMs are similar. However, the duration of opioid use is longer for the naldemedine population than for the naloxegol 25 mg population (COMPOSE-1: 61.1 months and COMPOSE-2: 61.2 months versus KODIAC-4 44.5 months and KODIAC-05 40.9 months) and the total daily dose of opioid at baseline was lower for the naldemedine population than for the naloxegol 25 mg population (COMPOSE-1: 108.1 mg and COMPOSE-2 106.9 mg versus KODIAC-4 143.2 mg and KODIAC-5 136.4 mg). The company has not presented evidence on similarities between the naldemedine and naloxegol populations of other determinants of quality of life such as the reason for opioid use, number of complete SBMs, and comorbidities. Differences in duration of opioid use and total daily dose of opioid and differences in unreported characteristics might result in differences in quality of life values, potentially making the use of TA345 utilities in the model less appropriate. Additional concerns about using naloxegol utilities arise from the observation the time-dependent model indicating potential differences in study results compared to naloxegol. However, a clinical expert consulted by the ERG indicated that naldemedine and naloxegol populations are fairly similar and not to expect differences in quality of life.
The fact that the coefficient for non-OIC versus OIC in the naldemedine study was smaller than for naloxegol study does not necessarily reflect the insensitivity of SF-12. Alternatively, naldemedine might just be less effective than naloxegol. The use of SF-6D utilities is not recommended in the NICE reference case. An alternative is mapping EQ-5D utilities from PAC-QOL. In response to the request for clarification,16 the company has presented the results using the PAC-QOL mapped utilities, using the algorithm developed by Parker et al. 2011.47 However, Hatswell et al. 2016 showed that the mapping algorithm presented by Parker et al. 2011 was not appropriate in a population of OIC patients.49 Although the SF-6D utilities and PAC-QOL mapped utilities can be regarded as inferior to TA345 EQ-5D utilities, these do show the sensitivity of the results to the choice of utility input values. To further investigate the impact of different utility values on the incremental cost effectiveness ratio (ICER), the ERG has performed additional scenario analyses. First, using EQ-5D utilities reported by Hatswell et al. 2016 in a lubiprostone versus placebo study49 and second, using median EQ-5D utilities reported in a Dutch study by Penning-van Beest in unspecified opioids.50
In the absence of observed EQ-5D utility values, the ERG considers using EQ-5D input from TA345 as appropriate. In line with the company submission for naloxegol (TA345), treatment specific utility values for the same health state (non-OIC) were used.5 This could indicate that the number of SBMs in the naldemedine non-OIC health state is different from the number of SBMs in the untreated non-OIC health state. In turn, this implies that health state definitions vary between treatments, rather than being
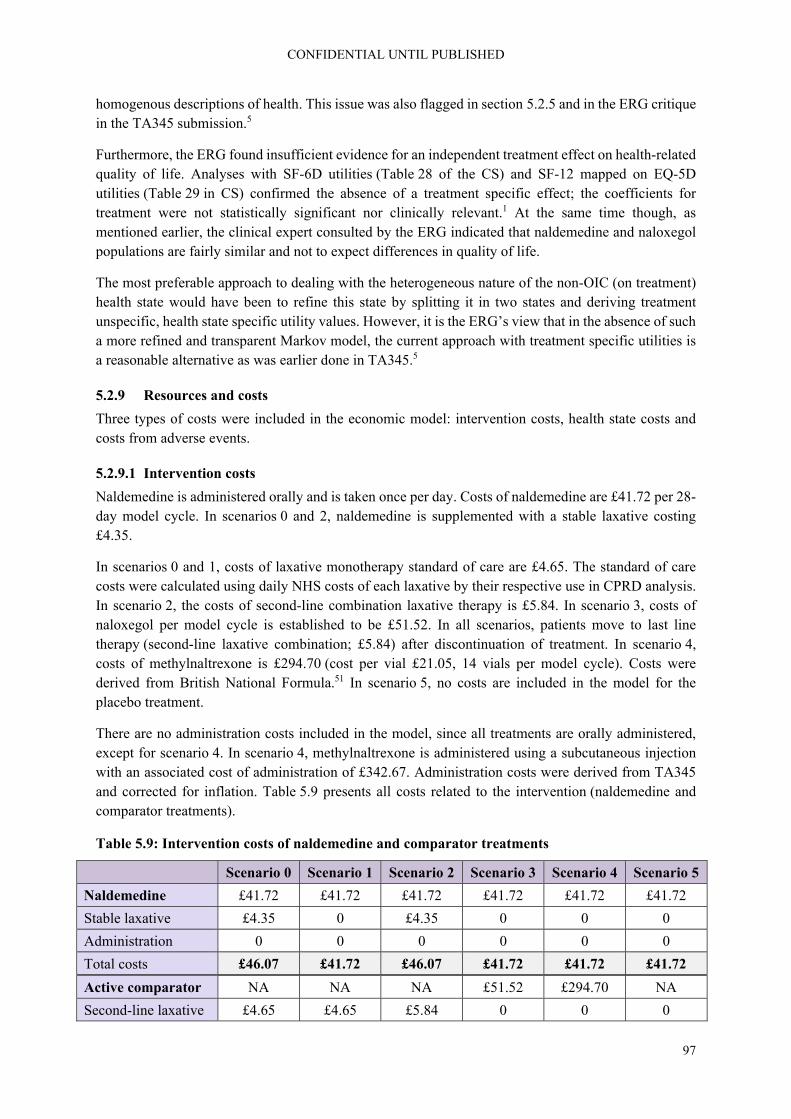
CONFIDENTIAL UNTIL PUBLISHED
97
homogenous descriptions of health. This issue was also flagged in section 5.2.5 and in the ERG critique in the TA345 submission.5
Furthermore, the ERG found insufficient evidence for an independent treatment effect on health-related quality of life. Analyses with SF-6D utilities (Table 28 of the CS) and SF-12 mapped on EQ-5D utilities (Table 29 in CS) confirmed the absence of a treatment specific effect; the coefficients for treatment were not statistically significant nor clinically relevant.1 At the same time though, as mentioned earlier, the clinical expert consulted by the ERG indicated that naldemedine and naloxegol populations are fairly similar and not to expect differences in quality of life.
The most preferable approach to dealing with the heterogeneous nature of the non-OIC (on treatment) health state would have been to refine this state by splitting it in two states and deriving treatment unspecific, health state specific utility values. However, it is the ERG’s view that in the absence of such a more refined and transparent Markov model, the current approach with treatment specific utilities is a reasonable alternative as was earlier done in TA345.5
5.2.9 Resources and costs
Three types of costs were included in the economic model: intervention costs, health state costs and costs from adverse events.
5.2.9.1 Intervention costs
Naldemedine is administered orally and is taken once per day. Costs of naldemedine are £41.72 per 28-day model cycle. In scenarios 0 and 2, naldemedine is supplemented with a stable laxative costing £4.35.
In scenarios 0 and 1, costs of laxative monotherapy standard of care are £4.65. The standard of care costs were calculated using daily NHS costs of each laxative by their respective use in CPRD analysis. In scenario 2, the costs of second-line combination laxative therapy is £5.84. In scenario 3, costs of naloxegol per model cycle is established to be £51.52. In all scenarios, patients move to last line therapy (second-line laxative combination; £5.84) after discontinuation of treatment. In scenario 4, costs of methylnaltrexone is £294.70 (cost per vial £21.05, 14 vials per model cycle). Costs were derived from British National Formula.51 In scenario 5, no costs are included in the model for the placebo treatment.
There are no administration costs included in the model, since all treatments are orally administered, except for scenario 4. In scenario 4, methylnaltrexone is administered using a subcutaneous injection with an associated cost of administration of £342.67. Administration costs were derived from TA345 and corrected for inflation. Table 5.9 presents all costs related to the intervention (naldemedine and comparator treatments).
Table 5.9: Intervention costs of naldemedine and comparator treatments
Scenario 0 Scenario 1 Scenario 2 Scenario 3 Scenario 4 Scenario 5
Naldemedine £41.72 £41.72 £41.72 £41.72 £41.72 £41.72
Stable laxative £4.35 0 £4.35 0 0 0
Administration 0 0 0 0 0 0
Total costs £46.07 £41.72 £46.07 £41.72 £41.72 £41.72
Active comparator NA NA NA £51.52 £294.70 NA
Second-line laxative £4.65 £4.65 £5.84 0 0 0

CONFIDENTIAL UNTIL PUBLISHED
98
5.2.9.2 Health state costs
Health state costs are only included for the OIC health state. Resource consumption was derived from the CPRD, and contained costs of inpatient care, outpatient care and general practitioner (GP) visits. Unit prices were derived from Payment by Results tariffs for inpatient and outpatient care visits and Personal Social Services Research Unit (PSSRU) tariffs for GP visits. OIC health state costs are £16.75 per cycle. Compared to health state costs in previous economic analyses of £2452 and £3553 per month, the company claims that the health state costs are conservative estimates. Costs for non-OIC states were assumed to be zero and none of the treatments incur monitoring costs. This assumption is in line with TA345, but was not validated by clinical experts.5
5.2.9.3 Adverse events costs
Grade 3/4 adverse events are assumed to lead to one single GP visit, with a unit cost of £31.00. Adverse event rates are given in Table 5.6. Costs of adverse events are assumed to only occur in cycle 1. Grade 1/2 adverse events were assumed not to result in healthcare consumption and related costs. This assumption was aligned with TA345, but was not validated by clinical experts.5
ERG comment: In general, how the costs for laxative treatment have been derived for various situations was not well reported. There is, for example, a difference in costs of laxative in scenario 0 between the naldemedine and placebo group, this is possibly the result of more frequent use of rescue laxation, but this is not explained. At the same time, the costs of laxative for the naldemedine group are the same in scenarios 0 and 2, even though in scenario 0 the use of laxative only represents rescue medication whereas in scenario 2 laxative use is permanent. Also, in the model the costs of laxative for placebo in scenario 5 is different from the costs of laxative for placebo in scenario 0, though these should be the same. The company has not clarified where these differences stem from.
It was not possible for the ERG to remedy this, as no unit costs for the various laxatives were presented. At the same time, the costs of laxatives are relatively low compared to the OIC-specific medication, so the impact of these various errors is likely to be small.
The most important elements of resource use seem to be included in the model. However, health state costs for OIC health state were lower than in TA345, in which costs varied between £31.70 and £371.32 per cycle.5 These were based on a survey conducted in GPs (referenced in TA345) and an international prospective study.5, 14 The lower estimate in the company submission might be due to extracting data from the CPRD database, in which only patients primarily treated by the GP are included. Patients that are treated by a specialist are not included in this sample. These patients would have had higher costs, due to the likely higher frequency of specialist visits. As such, the ERG agrees with the company that £16.75 per cycle currently used in the model is a conservative estimate. Increasing the OIC health state costs particularly increases costs for the comparator, which would lead to lower ICER values. The ERG has performed additional scenario analysis to evaluate the impact of higher OIC health state costs as used in TA345.5
Similar to TA345, the model did not include costs for non-OIC health state.5 The ERG would have liked this assumption of zero costs for non-OIC states to have been validated by clinical experts. Outpatient care visits have been valued using Payment by Results tariffs, for first result. The value used in the submission does not correspond to the value in the tariff list; the value in the tariff list is £188, whereas
Administration 0 0 0 0 £342.67 0
Total costs £4.65 £4.65 £5.84 £51.52 £637.67 0 NA = not applicable

CONFIDENTIAL UNTIL PUBLISHED
99
in the company submission a value of £127 per visit was used, thus presenting an underestimation of OIC health state costs. However, given the low frequency of outpatient care use (i.e. 0.9%), the impact on the ICER is small. Using the correct value would lead to a decrease in incremental costs and a small reduction of the ICER (i.e. between 0.3% to 1.1%, depending on the scenario in the company base-case).
Adverse event rates for naldemedine and placebo in scenarios 0 to 3 were derived from recalculated four-week rates from COMPOSE-3. As detailed in section 5.2.7, it is unclear how four-week rates were recalculated. Also, it is unclear why the COMPOSE-1 and -2 trials were not used to inform the economic model’s adverse event rates. Due to the low occurrence of adverse events, the low costs associated with the AEs, and the fact that adverse events were only included in the first cycle of the model, the impact of costs related to adverse events on the ICER will be very limited.

CONFIDENTIAL UNTIL PUBLISHED
100
6. Cost effectiveness results
As discussed in section 5, the ERG considers that appropriate patient selection to assess the cost effectiveness for the intended population was only done for scenarios 0 and 5. Subsequently, the ERG will focus predominantly on the results of scenarios 0 and 5, i.e. results of scenarios 1-4 should be regarded as only indicative.
6.1 Company’s cost effectiveness results
The discounted base-case results for each scenario are presented in Table 6.1. These results indicate that naldemedine treatment results in QALYs gained (0.02, 0.04, 0.08, 0.01, 0.01, and 0.06 for scenarios 0, 1, 2, 3, 4, and 5, respectively), at additional costs (£257, £371, £748, £105, and £513 in scenarios 0, 1, 2, 3, and 5, respectively) in all scenarios except scenario 4 (£-3,175) in which it is dominant, relative to the corresponding comparator treatment in each scenario. The company base-case ICERs for scenarios 0, 1, 2, 3, and 5 are £11,716; £8,444; £8,959; £10,134; and £8,579, respectively.
Table 6.1: Company base-case cost effectiveness results (discounted) for each scenario
Scenarios/ Technologies
Total costs
Total LYGs
Total QALYs
Incr. costs
Incr. LYGs
Incr. QALYs
ICER (costs/QALY)
Scenario 0: OIC monotherapy, non-cancer (The ERG considers this to be the corrected version of scenario 1)
Naldemedine £1,091 4.69 2.76 £257 0 0.02 £11,716
Placebo £835 4.69 2.74 - - - -
Scenario 1: OIC monotherapy, non-cancer
Naldemedine (no rescue laxative)
£1,235 4.69 2.77 £371 0 0.04 £8,444
Placebo + rescue laxative
£864 4.69 2.73 - - - -
Scenario 2: mixed aetiology constipation; combination therapy, non-cancer
Naldemedine + stable laxative (no rescue laxative)
£1,643 4.69 2.80 £748 0 0.08 £8,959
Placebo + stable laxative + rescue laxative
£895 4.69 2.72 - - - -
Scenario 3: LIR; OIC monotherapy, non-cancer
Naldemedine £1,102 4.69 2.86 £105 0 0.01 £10,134
Naloxegol £997 4.69 2.85 - - - -
Scenario 4: LIR; cancer with OIC
Naldemedine £1,206 4.16 2.50 £-3,175 0 0.01 Dominant
Methylnaltrexone (subcutaneous)
£4,381 4.16 2.49 - - - -
Scenario 5: Cancer and OIC
Naldemedine £1,206 4.16 2.47 £513 0 0.06 £8,579

CONFIDENTIAL UNTIL PUBLISHED
101
Scenarios/ Technologies
Total costs
Total LYGs
Total QALYs
Incr. costs
Incr. LYGs
Incr. QALYs
ICER (costs/QALY)
Placebo £693 4.16 2.41 - - - -
Based on the electronic model ICER = incremental cost effectiveness ratio, Incr. = incremental, LIR = laxative inadequate response, LYGs = life years gained, OIC = opioid-induced constipation, QALYs = quality-adjusted life years.
The disaggregated discounted results by health state are given for scenarios 0 and 5 in Tables 6.2 and 6.3. The disaggregated results for scenarios 1 to 4 can be found in Appendix 2.
Table 6.2: Disaggregated, discounted results by health state for scenario 0: OIC monotherapy, non-cancer (The ERG considers this to be the corrected version of scenario 1)
Health state Costs QALYs LYGs
Naldemedine Placebo Naldemedine Placebo Naldemedine Placebo
Non-OIC (on treatment)
£316 £19 0.34 0.19 0.53 0.31
Non-OIC (untreated)
£149 £157 1.22 1.29 1.99 2.10
OIC £627 £659 1.20 1.26 2.16 2.27
Total £1,091 £835 2.76 2.74 4.69 4.69
Based on the electronic model (adjusted by the ERG to calculate results disaggregated per health state) ERG = Evidence Review Group; LYG = life years gained, OIC = opioid-induced constipation, QALYs = quality-adjusted life-years
In scenario 0, the largest proportion of costs is accrued by patients in the OIC health state for both treatments to a comparable extent. The difference in total costs between both treatments in scenario 0 is determined by the time spent by patients in the non-OIC (on treatment) health state. Regarding the number of QALYs gained, patients accrue a similar number of QALYs for both treatments, and in both the non-OIC (untreated) and OIC health states. The minimal difference between both treatments in terms of QALYs gained is determined by the difference between both treatments in the number of QALYs accrued for patients in the non-OIC (on treatment) health state.
Table 6.3: Disaggregated, discounted results by health state for scenario 5: cancer
Health state Costs QALYs LYGs
Naldemedine Placebo Naldemedine Placebo Naldemedine Placebo
Non-OIC (on treatment)
£663 £0 0.78 0.26 1.23 0.42
Non-OIC (untreated)
£102 £132 0.85 1.09 1.39 1.78
OIC £441 £561 0.84 1.06 1.54 1.96
Total £1,206 £693 2.47 2.74 4.16 4.16
Based on the electronic model (adjusted by the ERG to calculate results disaggregated per health state) ERG = Evidence Review Group; LYG = life years gained, OIC = opioid-induced constipation, QALYs = quality-adjusted life-years

CONFIDENTIAL UNTIL PUBLISHED
102
In scenario 5, substantially higher costs are accrued by patients in the non-OIC (on treatment) health state for those receiving naldemedine versus those receiving placebo. The number of QALYs gained are higher for patients in both the non-OIC (untreated) and OIC health states for patients who (previously) received naldemedine versus those that received placebo, and higher for patients receiving naldemedine versus placebo in the non-OIC (on treatment) health state.
6.2 Company’s sensitivity analyses
6.2.1 Probabilistic sensitivity analysis
For each scenario, the company performed a probabilistic sensitivity analysis (PSA) by running 1,000 simulations each in which for each base-case input parameter, a random value was drawn according to the respective distribution. In case of parameters for which the confidence interval was unknown, random draws were based on an assumed 20% variation around the parameters point estimate. Following this, a cost effectiveness plane (CE plane) and cost effectiveness acceptability curve (CEAC) were constructed for each scenario. The CE planes for scenarios 0 and 5 are presented in Figures 6.1 and 6.7, respectively. The CEACs for each scenario are shown below in Figure 6.2 to 6.8.
Figure 6.1: Cost effectiveness plane for scenario 0: OIC monotherapy, non-cancer (The ERG considers this to be the corrected version of scenario 1)
Based on the electronic model (adjusted by the ERG to display incremental costs and QALYs) ERG = Evidence Review Group; QALYs = quality-adjusted life-years
0
100
200
300
400
500
600
700
800
0 0.02 0.04 0.06 0.08 0.1
Incremental costs
Incremental QALYs
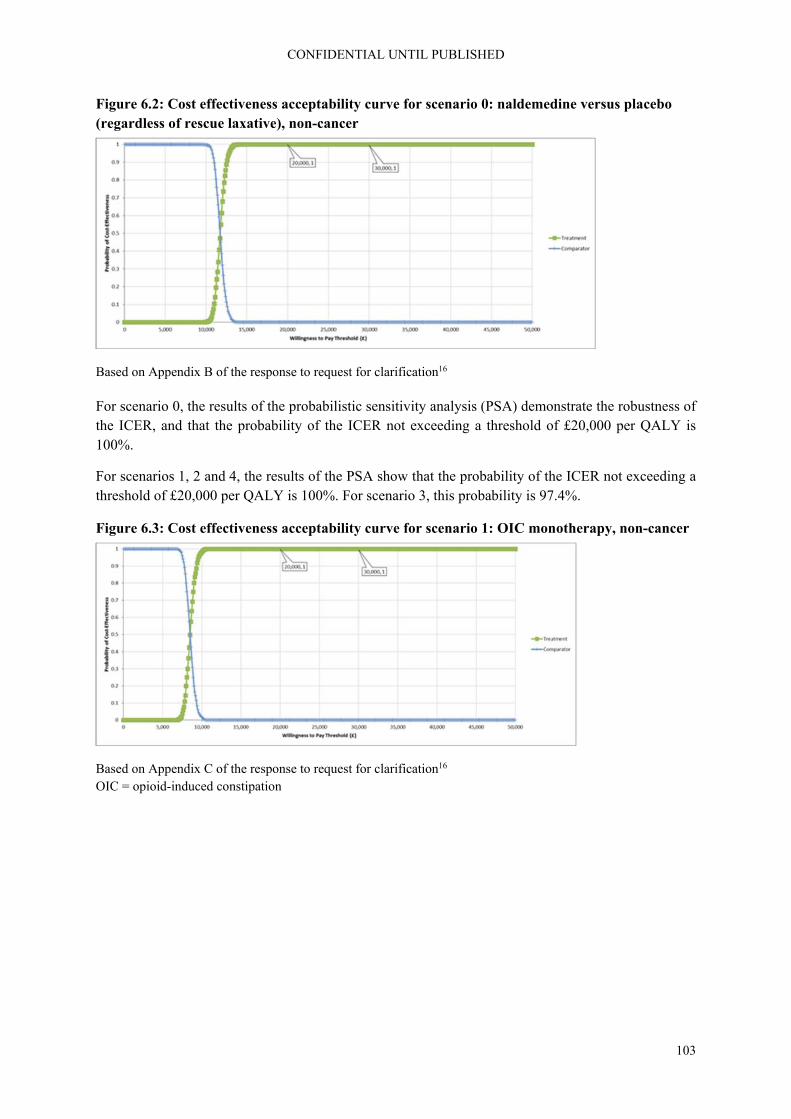
CONFIDENTIAL UNTIL PUBLISHED
103
Figure 6.2: Cost effectiveness acceptability curve for scenario 0: naldemedine versus placebo (regardless of rescue laxative), non-cancer
Based on Appendix B of the response to request for clarification16
For scenario 0, the results of the probabilistic sensitivity analysis (PSA) demonstrate the robustness of the ICER, and that the probability of the ICER not exceeding a threshold of £20,000 per QALY is 100%.
For scenarios 1, 2 and 4, the results of the PSA show that the probability of the ICER not exceeding a threshold of £20,000 per QALY is 100%. For scenario 3, this probability is 97.4%.
Figure 6.3: Cost effectiveness acceptability curve for scenario 1: OIC monotherapy, non-cancer
Based on Appendix C of the response to request for clarification16 OIC = opioid-induced constipation
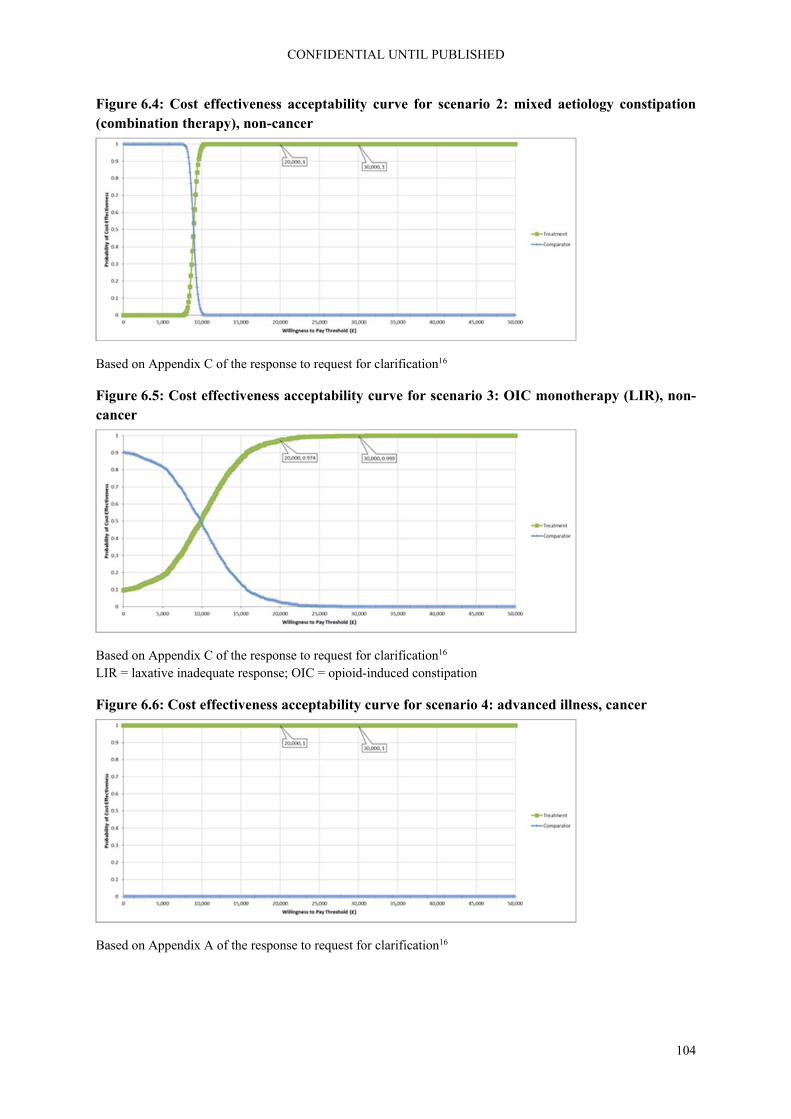
CONFIDENTIAL UNTIL PUBLISHED
104
Figure 6.4: Cost effectiveness acceptability curve for scenario 2: mixed aetiology constipation (combination therapy), non-cancer
Based on Appendix C of the response to request for clarification16
Figure 6.5: Cost effectiveness acceptability curve for scenario 3: OIC monotherapy (LIR), non-cancer
Based on Appendix C of the response to request for clarification16 LIR = laxative inadequate response; OIC = opioid-induced constipation
Figure 6.6: Cost effectiveness acceptability curve for scenario 4: advanced illness, cancer
Based on Appendix A of the response to request for clarification16

CONFIDENTIAL UNTIL PUBLISHED
105
Figure 6.7: Cost effectiveness plane for scenario 5: cancer
Based on the electronic model (adjusted by the ERG to display incremental costs and QALYs) ERG = Evidence Review Group; QALYs = quality-adjusted life-years
Figure 6.8: Cost effectiveness acceptability curve for scenario 5: cancer
Based on Appendix A of the response to request for clarification16
For scenario 5, the PSA shows that the probability of the ICER not exceeding a threshold of £20,000 per QALY is 100%. When comparing Figures 6.1 and 6.7, the ICER for the cancer population is much more uncertain than the ICER for the non-cancer population. However, this does not influence the (lack of) decision uncertainty.
6.2.2 Deterministic sensitivity analysis
For each scenario, a one-way sensitivity analysis (OWSA) was performed in which for each base-case input parameter the lower and upper bounds of the 95% CI was used. In case of parameters for which the confidence interval was unknown, the OWSA was performed using + and - 20% variation around the parameters point estimate. The OWSA results, in terms of change from the base-case ICER, for each scenario are shown using tornado diagrams in Figures 6.9 to 6.14.
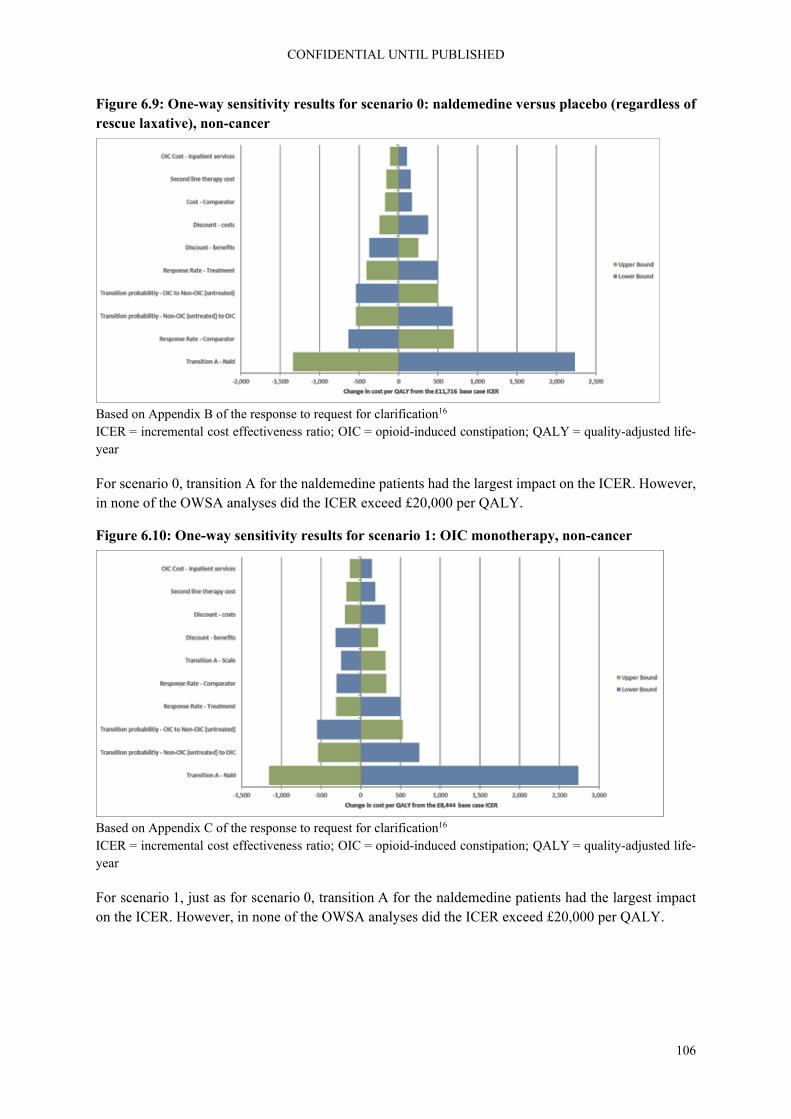
CONFIDENTIAL UNTIL PUBLISHED
106
Figure 6.9: One-way sensitivity results for scenario 0: naldemedine versus placebo (regardless of rescue laxative), non-cancer
Based on Appendix B of the response to request for clarification16 ICER = incremental cost effectiveness ratio; OIC = opioid-induced constipation; QALY = quality-adjusted life-year
For scenario 0, transition A for the naldemedine patients had the largest impact on the ICER. However, in none of the OWSA analyses did the ICER exceed £20,000 per QALY.
Figure 6.10: One-way sensitivity results for scenario 1: OIC monotherapy, non-cancer
Based on Appendix C of the response to request for clarification16 ICER = incremental cost effectiveness ratio; OIC = opioid-induced constipation; QALY = quality-adjusted life-year
For scenario 1, just as for scenario 0, transition A for the naldemedine patients had the largest impact on the ICER. However, in none of the OWSA analyses did the ICER exceed £20,000 per QALY.

CONFIDENTIAL UNTIL PUBLISHED
107
Figure 6.11: One-way sensitivity results for scenario 2: mixed aetiology constipation (combination therapy), non-cancer
Based on Appendix C of the response to request for clarification16 ICER = incremental cost effectiveness ratio; OIC = opioid-induced constipation; QALY = quality-adjusted life-year
For scenario 2, the transition of OIC to non-OIC (untreated) and vice versa, and the response rates had the largest impact on the ICER, though still relatively small. However, in none of the OWSA analyses did the ICER exceed £20,000 per QALY.
Figure 6.12: One-way sensitivity results for scenario 3: OIC monotherapy (LIR), non-cancer
Based on Appendix C of the response to request for clarification16 ICER = incremental cost effectiveness ratio; OIC = opioid-induced constipation; QALY = quality-adjusted life-year
For scenario 3, the risk ratio for the treatment effect of naloxegol relative to naldemedine on transition A had the largest impact on the ICER, potentially making naldemedine the dominant treatment. However, in none of the OWSA analyses did the ICER exceed £20,000 per QALY.

CONFIDENTIAL UNTIL PUBLISHED
108
Figure 6.13: One-way sensitivity results for scenario 4: advanced illness, cancer
Based on Appendix A of the response to request for clarification16 ICER = incremental cost effectiveness ratio; OIC = opioid-induced constipation; QALY = quality-adjusted life-year
For scenario 4, the response rate for methylnaltrexone, followed by the one for naldemedine, had the largest impact on the ICER. However, in none of the OWSA analyses did the ICER exceed £20,000 per QALY. Importantly, the hazard ratio for methylnaltrexone was excluded from the OWSA by the company, stating that “the results were highly unstable obscuring the effects of other variables”.16
Figure 6.14: One-way sensitivity results for scenario 5: cancer
Based on Appendix A of the response to request for clarification16 ICER = incremental cost effectiveness ratio; OIC = opioid-induced constipation; QALY = quality-adjusted life-year
For scenario 5, transition A for the naldemedine patients had the largest impact on the ICER. However, in none of the OWSA analyses did the ICER exceed £20,000 per QALY.

CONFIDENTIAL UNTIL PUBLISHED
109
6.2.3 Scenario analyses
The company performed a number of scenario analyses (subsequently referred to as sensitivity scenarios, to delineate the terminology when referring to the “scenarios” defined earlier in the report) in order to assess the sensitivity of the cost effectiveness results to the assumptions underlying the model. The descriptions of the different sensitivity scenarios are summarised in Table 6.4. These pertain to sets of sensitivity scenarios for 1) alternative utility value sets, 2) varying the model time horizon from one to five years per utility value set, and 3) alternative distributions used for the extrapolation of survival curves for transition A.
Table 6.4: Descriptions of the different sensitivity scenarios performed by the company
Sensitivity scenario
Alternative input Base-case value Parameter value in sensitivity scenario
Sensitivity scenario analysis set 1: alternative utility value sets
1 Treatment specific utilities from TA3455
For scenarios 0, 1, 2, and 5: Treatment specific utilities from TA3455; for scenarios 3 and 4: Health state specific utilities from TA3455
See Tables 5.7 and 5.8
2 Health state specific utilities from TA3455
3 Health state specific SF-12 utilities mapped to EQ-5D
4 Treatment specific PAC-QOL utilities mapped to EQ-5D
5 SF-6D utilities
Sensitivity scenario analysis set 2: varying the model time horizon from one to five years per utility value set
Time horizon
Utility value set
1
One year
Company base-case
Five-year time horizon, utilities as described above
See Table 5.8
2 Health state specific utilities from TA3455
3
Two years
Company base-case
4 Health state specific utilities from TA3455
5
Three years
Company base-case
6 Health state specific utilities from TA3455

CONFIDENTIAL UNTIL PUBLISHED
110
Sensitivity scenario
Alternative input Base-case value Parameter value in sensitivity scenario
7
Four years
Company base-case
8 Health state specific utilities from TA3455
9
Five years
Company base-case
10 Health state specific utilities from TA3455
Sensitivity scenario analysis set 3: alternative distributions used for the extrapolation of survival curves for transition A
1 Exponential distribution
For scenarios 0, 1, 3, 4, and 5, a lognormal distribution; for scenario 2 an exponential distribution
Parametric survival curve extrapolations in the electronic model, according to the corresponding distribution
2 Weibull distribution
3 Log-normal distribution
4 Log-logistic distribution
5 Gompertz distribution
6 Generalised gamma distribution
Based on analyses performed by the ERG in line with those performed by the company, due to results provided in various iterations of the CS and responses to clarification questions being both incomplete and incorrect.1, 16 CS = company submission; EQ-5D = EuroQol-5 dimensions, ERG = Evidence Review Group; PAC-QOL = Patient Assessment of Constipation – Quality of Life; SF-6D = six-dimensional health state short form; TA = technology appraisal
The results of the sensitivity scenario analyses are summarised in Tables 6.5 to 6.7, and discussed in separate paragraphs below for each set of analyses.

CONFIDENTIAL UNTIL PUBLISHED
111
Table 6.5: Summary of the results of the sensitivity scenario analyses conducted by the company – Scenario 1 Scenario 0 Scenario 1 Scenario 2 Scenario 3 Scenario 4 Scenario 5
Incr
Cos
ts
Incr
. Q
AL
Ys
ICE
R
(£/Q
AL
Y)
Incr
. C
osts
Incr
. Q
AL
Ys
ICE
R
(£/Q
AL
Y)
Incr
. C
osts
Incr
. Q
AL
Ys
ICE
R
(£/Q
AL
Y)
Incr
. C
osts
Incr
. Q
AL
Ys
ICE
R
(£/Q
AL
Y)
Incr
. C
osts
Incr
. Q
AL
Ys
ICE
R
(£/Q
AL
Y)
Incr
. C
osts
Incr
. Q
AL
Ys
ICE
R
(£/Q
AL
Y)
BC 257 0.022 11,716 371 0.044 8,444 748 0.083 8,958 105 0.010 10,134 -3,175 0.008 Dominant 513 0.060 8,579
Sensitivity scenario analysis set 1: alternative utility value sets
Incr
. Q
AL
Ys
ICE
R
(£/Q
AL
Y)
Incr
. Q
AL
Ys
ICE
R
(£/Q
AL
Y)
Incr
. Q
AL
Ys
ICE
R
(£/Q
AL
Y)
Incr
. Q
AL
Ys
ICE
R
(£/Q
AL
Y)
Incr
. Q
AL
Ys
ICE
R
(£/Q
AL
Y)
Incr
. Q
AL
Ys
ICE
R
(£/Q
AL
Y)
1 0.022 11,716* 0.044 8,444* 0.083 8,958* 0.037 2,814 0.043 Dominant 0.060 8,579*
2 0.007 35,398 0.019 19,506 0.038 19,540 0.010 10,134* 0.008 Dominant* 0.027 19,137
3 0.006 42,128 0.016 23,215 0.032 23,255 0.009 12,061 0.007 Dominant 0.023 22,776
4 0.033 7,729 0.068 5,420 0.131 5,712 0.056 1,883 0.062 Dominant 0.094 5,484
5 0.022 62,720 0.011 34,562 0.022 34,621 0.006 17,956 0.004 Dominant 0.015 33,909
Based on the corrected electronic model (due to the results as provided in various iterations of the CS and responses to clarification questions being both incomplete and incorrect) BC = base-case; CS = company submission; ICER = incremental cost effectiveness ratio; Incr. = incremental; QALY = quality-adjusted life year

CONFIDENTIAL UNTIL PUBLISHED
112
Table 6.6: Summary of the results of the sensitivity scenario analyses conducted by the company – Scenario 2
Sensitivity scenario analysis set 2: varying the model time horizon from one to five years per utility value set
Scenario 0 Scenario 1 Scenario 2 Scenario 3 Scenario 4 Scenario 5
Incr
. C
osts
Incr
. Q
AL
Ys
ICE
R
(£/Q
AL
Y)
Incr
. C
osts
Incr
. Q
AL
Ys
ICE
R
(£/Q
AL
Y)
Incr
. C
osts
Incr
. Q
AL
Ys
ICE
R
(£/Q
AL
Y)
Incr
. C
osts
Incr
. Q
AL
Ys
ICE
R
(£/Q
AL
Y)
Incr
. C
osts
Incr
. Q
AL
Ys
ICE
R
(£/Q
AL
Y)
Incr
. C
osts
Incr
. Q
AL
Ys
ICE
R
(£/Q
AL
Y)
1 146 0.012 11,669 191 0.022 8,734 278 0.024 11,346 25 0.005 4,877 -1,451 0.003 Dominant 221 0.025 8,775
2 146 0.004 34,648 191 0.009 20,739 278 0.008 33,311 25 0.005 4,877 -1,451 0.003 Dominant 221 0.011 19,328
3 196 0.017 11,809 269 0.031 8,687 463 0.045 10,376 53 0.007 7,642 -2,193 0.005 Dominant 343 0.039 8,821
4 196 0.005 35,890 269 0.013 20,560 463 0.017 26,647 53 0.007 7,642 -2,193 0.005 Dominant 343 0.017 19,811
5 225 0.019 11,802 316 0.037 8,603 593 0.061 9,734 75 0.008 8,949 -2,658 0.006 Dominant 422 0.048 8,767
6 225 0.006 35,871 316 0.016 20,163 593 0.026 23,073 75 0.008 8,949 -2,658 0.006 Dominant 422 0.021 19,682
7 244 0.021 11,779 349 0.041 8,534 686 0.074 9,304 93 0.010 9,717 -2,971 0.007 Dominant 476 0.055 8,712
8 244 0.007 35,698 349 0.018 19,841 686 0.033 20,973 93 0.010 9,717 -2,971 0.007 Dominant 476 0.024 19,500
9 257 0.022 11,716 371 0.044 8,444 748 0.083 8,959 105 0.010 10,134 -3,175 0.008 Dominant 513 0.060 8,579
10 257 0.007 35,398 371 0.019 19,506 748 0.038 19,540 105 0.010 10,134 -3,175 0.008 Dominant 513 0.027 19,137
Based on the corrected electronic model (due to the results as provided in various iterations of the CS and responses to clarification questions being both incomplete and incorrect) CS = company submission; ICER = incremental cost effectiveness ratio; Incr. = incremental; QALY = quality-adjusted life year

CONFIDENTIAL UNTIL PUBLISHED
113
Table 6.7: Summary of the results of the sensitivity scenario analyses conducted by the company – Scenario 3
Sensitivity scenario analysis set 3: alternative distributions used for the extrapolation of survival curves for transition A
Sce
nar
io 0
Sce
nar
io 1
Sce
nar
io 2
Sce
nar
io 3
Sce
nar
io 4
Sce
nar
io 5
Incr
. C
osts
Incr
. Q
AL
Ys
ICE
R
(£/Q
AL
Y)
Incr
. C
osts
Incr
. Q
AL
Ys
ICE
R
(£/Q
AL
Y)
Incr
. C
osts
Incr
. Q
AL
Ys
ICE
R
(£/Q
AL
Y)
Incr
. C
osts
Incr
. Q
AL
Ys
ICE
R
(£/Q
AL
Y)
Incr
. C
osts
Incr
. Q
AL
Ys
ICE
R
(£/Q
AL
Y)
Incr
. C
osts
Incr
. Q
AL
Ys
ICE
R
(£/Q
AL
Y)
1 118 0.010 11,901 178 0.022 8,144 748 0.083 8,959 32 0.004 8,798 -2,622 0.007 Dominant 420 0.050 8,372
2 119 0.010 11,899 200 0.025 8,027 526 0.057 9,225 35 0.004 8,973 -1,934 0.005 Dominant 311 0.036 8,580
3 257 0.022 11,716 371 0.044 8,444 929 0.099 9,417 105 0.010 10,134 -3,175 0.008 Dominant 513 0.060 8,579
4 231 0.020 11,851 352 0.042 8,397 629 0.065 9,693 94 0.009 10,375 -2,652 0.007 Dominant 435 0.050 8,695
5 837 0.070 11,939 1187 0.130 9,111 417 0.041 10,048 110 0.022 4,989 -2,078 0.005 Dominant 333 0.038 8,663
6 572 0.046 12,482 679 0.064 10,534 595 0.046 13,020 143 0.017 8,408 -2,822 0.008 Dominant 495 0.050 9,818
Based on the corrected electronic model (due to the results as provided in various iterations of the CS and responses to clarification questions being both incomplete and incorrect). CS = company submission; ICER = incremental cost effectiveness ratio; Incr. = incremental; QALY = quality-adjusted life year

CONFIDENTIAL UNTIL PUBLISHED
114
6.2.3.1 Results of sensitivity scenario analysis set 1: alternative utility value sets
When using health state specific utilities, rather than treatment specific utilities, in scenarios 0, 1, 2 and 5, incremental effects were smaller and ICERs were substantially higher than in the base-case analyses.
Quality of life was measured in the COMPOSE trials with the disease specific PAC-QOL and the generic health-related quality of life instrument SF-36(v2). SF-6D utility values were argued to be insensitive to health status.1, 16 A mapping exercise using the SF-12 to predict EQ-5D was performed. According to the company, the mapping exercise confirmed the insensitivity of the SF-36 in disease related health-related quality of life in OIC, as the coefficient of non-OIC versus OIC was smaller than observed in the naloxegol studies.1 In response to the request for clarification, the company presented the results of a scenario analysis in which SF-6D utilities were used.16 Using this setting, the absolute values of utilities were lower than in the base-case analyses. The difference between the non-OIC health state and OIC health state was smaller. As a result, incremental QALYs were lower than in the base-case analyses for all treatment scenarios, and, as costs were unchanged, the ICER increased in these analyses (except for scenario 4, where naldemedine still dominates).
In response to the request for clarification, the company presented the results of a scenario analyses in which EQ-5D utilities mapped from the PAC-QOL were used.16 In these analyses, utility values were much higher than in the base-case. The difference between utility values for the non-OIC health states (particularly naldemedine treatment) and utility value of the OIC the health state was larger than in the base-case. This resulted in lower ICER values compared to the base-case analyses.
6.2.3.2 Results of sensitivity scenario analysis set 2: varying the model time horizon from one to five years per utility value set
The cost effectiveness results of sensitivity scenario analyses in which the time horizon of the model is varied between one and five years indicate their robustness to variations in that assumption. In addition, these results indicate that the substantial increase in the ICER that is caused by assuming health-state specific utility values instead of treatment-specific ones (i.e. also see the results of sensitivity scenario analysis set 1 described above) is also robust against alternative assumptions for the model’s time horizon.
6.2.3.3 Results of sensitivity scenario analysis set 3: alternative distributions for transition A
The company performed a series of analyses to assess the sensitivity of the results when alternative distributions for the extrapolation of the survival curves regarding transition A (loss of response) were assumed.1 The results for scenario 0 were provided in response to request for clarification.16 In the original CS, similar analyses (but excluding the generalised gamma distribution, which was added in response to the clarification questions) were performed by the company for scenarios 1, 2, and 3.1 Unfortunately, the company did not provide an updated version of the results of these analyses alongside other updated results that were provided following model amendments in response to the clarification questions. Therefore, the results as shown in Tables 6.5 to 6.7 were derived from the electronic model by the ERG. These results indicate that the cost effectiveness results are robust against alternative assumptions regarding the parametric distribution for the extrapolation of survival curves that are used for modelling transition A.

CONFIDENTIAL UNTIL PUBLISHED
115
6.3 Model validation and face validity check
The report on validation in the CS is limited to noting how the model structure and inputs are similar to those in TA345.5 The ERG requested details about what validation efforts were performed by the company and the results of these validation efforts.18 In the response to the request for clarification, the company states that it will endeavour to provide a full validation report by the 30th of November 2019.16
In the meantime though, the company provided an filled-in version of AdViSHE, a tool for the Assessment of the Validation Status of Health-Economic decision models.54 From the provided information in this tool, the ERG concludes that important parts of the model have been appropriately validated. This is true for the conceptual model, and for the computerised model. For the data input, the validation was not optimal with regards to the time-to-event curves used for transition A as clinical plausibility of the curves did not seem to have been assessed. The operational validation was not complete as no expert opinion was available regarding the face validity of model outputs and no external data were available to assess the extrapolated time-to-event curves against.
The ERG performed technical verification of the model provided by the company, using the TECHVER tool.55 Based on this checklist, various small errors in the electronic model were found which were corrected by the company in response to the request for clarification.16
The ERG base-case results and scenario-analyses were run by one ERG member and subsequently checked by another team member.

CONFIDENTIAL UNTIL PUBLISHED
116
7. Evidence review group’s additional analyses
7.1 Exploratory and sensitivity analyses undertaken by the ERG
7.1.1 Explanation of the company adjustments after the request for clarification
In response to the request for clarification (Question B2) the company presented a scenario 0 in which both for the naldemedine and placebo group all patients from the COMPOSE-1 and -2 were included, regardless of whether they had used rescue medication (see also section 5.2.3 of this report).16 Therefore, in this section the ERG-preferred scenario 0 replaces the company scenario 1, rather than being presented as an additional scenario.
Additionally, in the request for clarification the ERG pointed out various errors in the electronic model (Questions C16, C17 and C18).18 These issues were all corrected by the company.16
7.1.2 Explanation of the ERG adjustments
Very few changes were proposed by the ERG in section 5. The only changes relate to the selection of the time-to-loss of response curve and the addition of naloxegol as a comparator for cancer patients with LIR. In addition, changes are required for scenarios 2, 3 and 4, as these are currently based on incorrect data. However, these changes cannot be made by the ERG. These scenarios are listed in Table 7.1, but not part of the remainder of this section.
In alignment with the opinion of the clinical expert consulted by the ERG, the choice of the preferred distribution for the extrapolation of the time-to-event curves that are used for the modelling of transition A (“loss of response”) by the ERG was guided by which curves best represented the situation where the loss of response levels off to a certain plateau at which a substantial of proportions will still maintain their response to treatment over time. Therefore, the Gompertz distribution was adopted by the ERG for scenarios 0, and 3 instead of the lognormal distribution that was used by the company for these scenarios.1 For the other scenarios, the company already chose the distribution giving the highest proportion still maintaining response at 1,000 days, see also section 5.2.6.2.1.
Table 7.1: Company and ERG base-case preferred assumptions
Base-case preferred assumptions
Company Justification ERG Justification for change
Time-to-event distribution
Lognormal for scenarios 0, 1, 3, 4, 5, exponential for scenario 2
Best visual fit and/or lowest AIC/BIC
Gompertz for scenarios 0 and 3, all others remain as selected by company
Expert opinion regarding clinical plausibility Section 5.2.6.2.1
Comparator in scenario 4
Methylnaltraxone sc
Not stated, but this treatment has indeed indication for the treatment of opioid-induced constipation when response to laxative therapy has
Naloxegol added
Per NICE guidance, naloxegol is also an option in LIR subpopulation
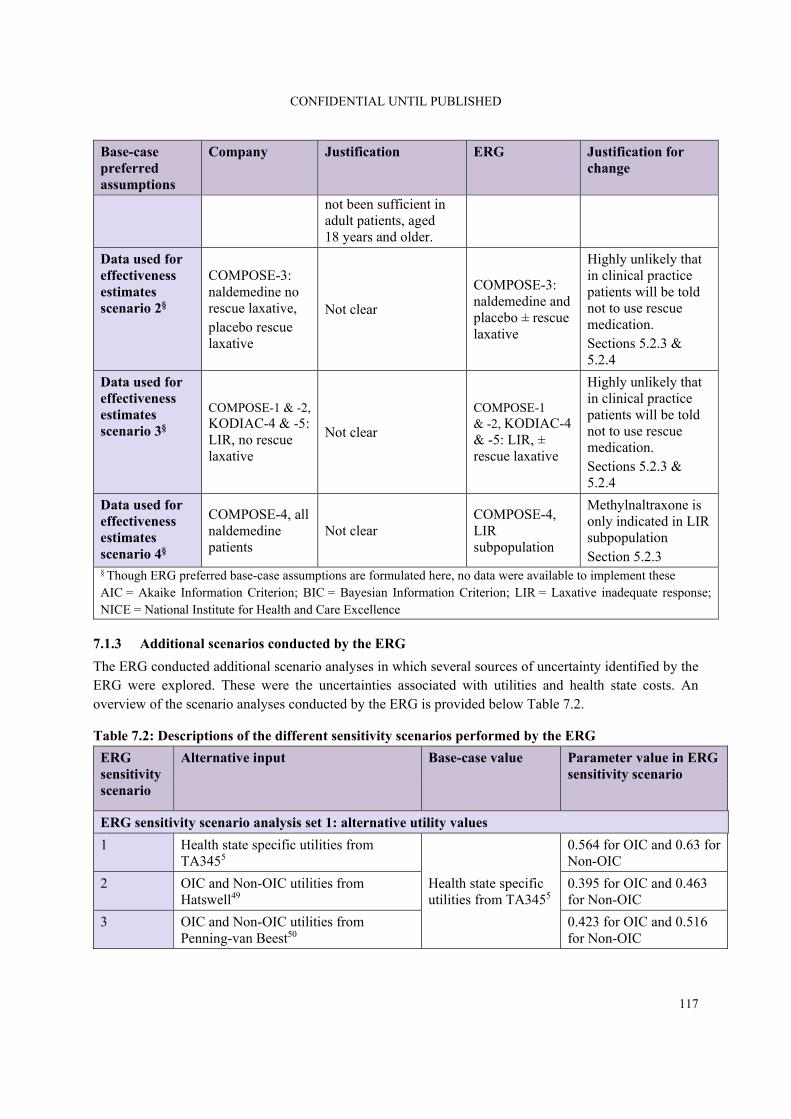
CONFIDENTIAL UNTIL PUBLISHED
117
Base-case preferred assumptions
Company Justification ERG Justification for change
not been sufficient in adult patients, aged 18 years and older.
Data used for effectiveness estimates scenario 2§
COMPOSE-3: naldemedine no rescue laxative, placebo rescue laxative
Not clear
COMPOSE-3: naldemedine and placebo ± rescue laxative
Highly unlikely that in clinical practice patients will be told not to use rescue medication. Sections 5.2.3 & 5.2.4
Data used for effectiveness estimates scenario 3§
COMPOSE-1 & -2, KODIAC-4 & -5: LIR, no rescue laxative
Not clear
COMPOSE-1 & -2, KODIAC-4 & -5: LIR, ± rescue laxative
Highly unlikely that in clinical practice patients will be told not to use rescue medication. Sections 5.2.3 & 5.2.4
Data used for effectiveness estimates scenario 4§
COMPOSE-4, all naldemedine patients
Not clear COMPOSE-4, LIR subpopulation
Methylnaltraxone is only indicated in LIR subpopulation Section 5.2.3
§ Though ERG preferred base-case assumptions are formulated here, no data were available to implement these AIC = Akaike Information Criterion; BIC = Bayesian Information Criterion; LIR = Laxative inadequate response; NICE = National Institute for Health and Care Excellence
7.1.3 Additional scenarios conducted by the ERG
The ERG conducted additional scenario analyses in which several sources of uncertainty identified by the ERG were explored. These were the uncertainties associated with utilities and health state costs. An overview of the scenario analyses conducted by the ERG is provided below Table 7.2.
Table 7.2: Descriptions of the different sensitivity scenarios performed by the ERG
ERG sensitivity scenario
Alternative input Base-case value Parameter value in ERG sensitivity scenario
ERG sensitivity scenario analysis set 1: alternative utility values
1 Health state specific utilities from TA3455
Health state specific utilities from TA3455
0.564 for OIC and 0.63 for Non-OIC
2 OIC and Non-OIC utilities from Hatswell49
0.395 for OIC and 0.463 for Non-OIC
3 OIC and Non-OIC utilities from Penning-van Beest50
0.423 for OIC and 0.516 for Non-OIC

CONFIDENTIAL UNTIL PUBLISHED
118
ERG sensitivity scenario
Alternative input Base-case value Parameter value in ERG sensitivity scenario
ERG sensitivity scenario analysis set 2: varying OIC costs
1 OIC costs from GP survey, TA3455
£16.75
£31.70
2 OIC costs from TA3455, international prospective study 14
£371.32
ERG = Evidence Review Group; GP = general practitioner; OIC = opioid-induced constipation, TA = technology appraisal
7.2 Impact on the ICER of additional clinical and economic analyses undertaken by the ERG
As discussed in section 5, only for scenario 0 and for scenario 5 did the company use the appropriate patient selection to assess the cost effectiveness for the intended population. Unfortunately, this issue could not be resolved by the ERG. This fundamentally renders all results and discussion with regards to scenarios 1, 2, 3, and 4 irrelevant. Subsequently, the ERG will focus predominantly on the results of scenarios 0 and 5, results of scenario 1-4 should be regarded as only indicative.
7.2.1 Results of the ERG preferred base-case scenario
The results of the ERG preferred base-case analysis (as outlined in section 7.1.2 of this report) are shown in Table 7.3. Note though that only the first two ERG preferred assumptions were implemented as no data was available to implement the other three.
The implementation of the ERG preferred assumptions resulted in a small increase in the ICER for scenario 0. This small effect is due to a similar area between the curve when a Gompertz distribution instead of a lognormal.
In scenario 3, the ICER decreases due to an increase in QALYs gained.
Comparing Table 7.3 and 7.4 it is clear that the deterministic and probabilistic analyses provide the same results.
Table 7.3: ERG-preferred base-case cost effectiveness results (discounted) for each scenario that changes compared to company base-case
Scenarios/ Technologies
Total costs
Total LYGs
Total QALYs
Incr. costs
Incr. LYGs
Incr. QALYs
ICER (costs/QALY)
Scenario 0: OIC monotherapy, non-cancer (The ERG considers this to be the corrected version of scenario 1) (distribution)
Naldemedine £1,574 4.69 2.83 £837 0 0.07 £11,939
Placebo £737 4.69 2.76 - - - -

CONFIDENTIAL UNTIL PUBLISHED
119
Scenarios/ Technologies
Total costs
Total LYGs
Total QALYs
Incr. costs
Incr. LYGs
Incr. QALYs
ICER (costs/QALY)
Scenario 3*: LIR; OIC monotherapy, non-cancer (distribution)
Naldemedine £1,791 4.69 2.91 £110 0 0.02 £4,989
Naloxegol £1,681 4.69 2.89 - - - -
Scenario 6*: LIR; cancer with OIC (scenario 4 with alternative comparator)
Naldemedine £1,206 4.11 2.47 £63 0 0.05 £1,282
Naloxegol £1,143 4.11 2.42 - - - -
Based on the electronic model * Indicative only scenarios ERG = Evidence Review Group; ICER = incremental cost-effectiveness ratio, Incr. = incremental, LIR = laxative inadequate response, LYGs = life years gained, OIC = opioid-induced constipation, QALYs = quality-adjusted life years
Table 7.4: ERG-preferred probabilistic cost effectiveness results (discounted) for each scenario
Scenarios/ Technologies
Total costs Total QALYs
Incr. costs Incr. QALYs
ICER (costs/QALY)
Scenario 0: OIC monotherapy, non-cancer (The ERG considers this to be the corrected version of scenario 1) (distribution and utilities)
Naldemedine £1,574 2.83 £838 0.07 £12,095
Placebo £735 2.76 - - -
Scenario 3*: LIR; OIC mono-therapy, non-cancer (distribution)
Naldemedine £1,792 2.91 £111 0.02 £5,051
Naloxegol £1,681 2.89 - - -
Scenario 6*: LIR; cancer with OIC (scenario 4 with alternative comparator)
Naldemedine £1,208 2.48 £63 0.05 £1,268
Naloxegol £1,146 2.43 - - -
Based on the electronic model * Indicative only scenarios ERG = Evidence Review Group; ICER = incremental cost-effectiveness ratio, Incr. = incremental, LIR = laxative inadequate response, LYGs = life years gained, OIC = opioid-induced constipation, QALYs = quality-adjusted life years
The incremental costs and incremental QALYs obtained from the ERG PSA were used to calculate the CEACs. These are shown in Figures 7.1 to 7.3.

CONFIDENTIAL UNTIL PUBLISHED
120
Figure 7.1: Cost effectiveness acceptability curve for ERG-preferred version of scenario 0: OIC monotherapy, non-cancer (The ERG considers this to be the corrected version of scenario 1)
ERG = Evidence Review Group; OIC = opioid-induced constipation
In scenario 0, naldemedine has a probability of being cost effective of 74.1% and 83.0% at thresholds of £20,000 and £30,000, respectively.
Figure 7.2: Cost effectiveness acceptability curve for ERG-preferred version of scenario 3: LIR; OIC monotherapy, non-cancer
ERG = Evidence Review Group; OIC = opioid-induced constipation
In scenario 3 (indicative), the probability of naldemedine being cost effective is 99.7% at a threshold of £20,000, and 100% at a threshold of £30,000.

CONFIDENTIAL UNTIL PUBLISHED
121
Figure 7.3: Cost effectiveness acceptability curve for ERG-preferred version of scenario 6: Cancer and OIC
ERG = Evidence Review Group; OIC = opioid-induced constipation
In scenario 6 (indicative), the probability of naldemedine being cost effective is 100% at both thresholds of £20,000 and £30,000.
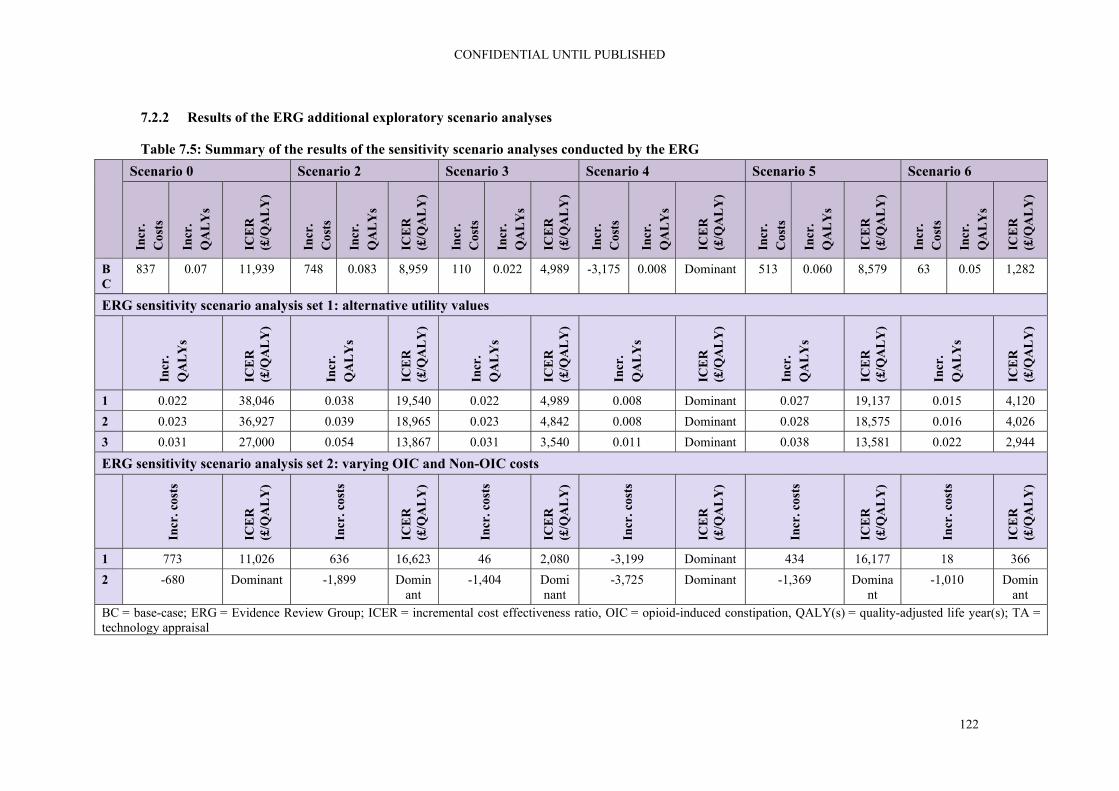
CONFIDENTIAL UNTIL PUBLISHED
122
7.2.2 Results of the ERG additional exploratory scenario analyses
Table 7.5: Summary of the results of the sensitivity scenario analyses conducted by the ERG Scenario 0 Scenario 2 Scenario 3 Scenario 4 Scenario 5 Scenario 6
Incr
. C
osts
Incr
. Q
AL
Ys
ICE
R
(£/Q
AL
Y)
Incr
. C
osts
Incr
. Q
AL
Ys
ICE
R
(£/Q
AL
Y)
Incr
. C
osts
Incr
. Q
AL
Ys
ICE
R
(£/Q
AL
Y)
Incr
. C
osts
Incr
. Q
AL
Ys
ICE
R
(£/Q
AL
Y)
Incr
. C
osts
Incr
. Q
AL
Ys
ICE
R
(£/Q
AL
Y)
Incr
. C
osts
Incr
. Q
AL
Ys
ICE
R
(£/Q
AL
Y)
BC
837 0.07 11,939 748 0.083 8,959 110 0.022 4,989 -3,175 0.008 Dominant 513 0.060 8,579 63 0.05 1,282
ERG sensitivity scenario analysis set 1: alternative utility values
Incr
. Q
AL
Ys
ICE
R
(£/Q
AL
Y)
Incr
. Q
AL
Ys
ICE
R
(£/Q
AL
Y)
Incr
. Q
AL
Ys
ICE
R
(£/Q
AL
Y)
Incr
. Q
AL
Ys
ICE
R
(£/Q
AL
Y)
Incr
. Q
AL
Ys
ICE
R
(£/Q
AL
Y)
Incr
. Q
AL
Ys
ICE
R
(£/Q
AL
Y)
1 0.022 38,046 0.038 19,540 0.022 4,989 0.008 Dominant 0.027 19,137 0.015 4,120
2 0.023 36,927 0.039 18,965 0.023 4,842 0.008 Dominant 0.028 18,575 0.016 4,026
3 0.031 27,000 0.054 13,867 0.031 3,540 0.011 Dominant 0.038 13,581 0.022 2,944
ERG sensitivity scenario analysis set 2: varying OIC and Non-OIC costs
Incr
. cos
ts
ICE
R
(£/Q
AL
Y)
Incr
. cos
ts
ICE
R
(£/Q
AL
Y)
Incr
. cos
ts
ICE
R
(£/Q
AL
Y)
Incr
. cos
ts
ICE
R
(£/Q
AL
Y)
Incr
. cos
ts
ICE
R
(£/Q
AL
Y)
Incr
. cos
ts
ICE
R
(£/Q
AL
Y)
1 773 11,026 636 16,623 46 2,080 -3,199 Dominant 434 16,177 18 366
2 -680 Dominant -1,899 Dominant
-1,404 Dominant
-3,725 Dominant -1,369 Dominant
-1,010 Dominant
BC = base-case; ERG = Evidence Review Group; ICER = incremental cost effectiveness ratio, OIC = opioid-induced constipation, QALY(s) = quality-adjusted life year(s); TA = technology appraisal

CONFIDENTIAL UNTIL PUBLISHED
123
7.2.2.1 Results of sensitivity scenario analysis set 1: alternative utility values
The first analysis is based on the health state specific utilities as used in TA345.5 The CS also included a sensitivity analysis based on this utility set, here it is replicated to assess the impact on the ICER of this scenario in combination with the preferred selection of the time-to-loss of response curve. As was also shown in section 6, the ICER is very sensitive to the assumption of treatment-specific utilities. A similar difference in ICERs was earlier shown in TA345.5
To further evaluate the impact of utility values on the ICER, the ERG has also performed additional scenario analyses using alternative utility values from the international literature. The impact of using utility values from Hatswell et al. 2016 was substantial, increasing the ICER more than 3-fold.49 This is mostly due to the fact that here utility values for the non-OIC state do not differ between treatments. The impact of using utility values from Penning-van Beest et al. 2010 was smaller (though still more than doubling the ICER), due to the larger difference in utility values for OIC versus non-OIC health states (0.093), compared to the Hatswell utlities (0.068).50
7.2.2.2 Results of sensitivity scenario analysis set 2: varying OIC and non-OIC costs
OIC health state costs were higher in TA345 than in the CS.5 Using these higher OIC health state costs in the ERG base-case resulted in lower incremental costs, and lower ICER estimates. With OIC health state costs of £31.70, incremental costs were particularly lower in scenarios comparing naldemedine versus naloxegol. All scenarios with OIC health state costs of £371.32 resulted in dominance of naldemedine.
7.3 ERG’s preferred assumptions
In alignment with the opinion of the clinical expert consulted by the ERG, the choice of the preferred distribution for the extrapolation of the survival curves that are used for the modelling of transition A (“loss of response”) by the ERG was guided by which curves best represented the situation where the loss of response levels off to a certain plateau at which a substantial of proportions will still maintain their response to treatment over time. Therefore, the Gompertz distribution was adopted by the ERG for scenarios 0 and 3 instead of the lognormal distribution that was used by the company for these scenarios.
An overview of the ICERs resulting from the ERG’s preferred model assumptions (with the changes in comparison to the company analyses indicated) is provided below in Table 7.6.
Table 7.6: ICERs based on ERG’s preferred model assumptions
Preferred assumption Section in ERG
report Cumulative ICER
(£/QALY)
Company base-case
Scenario 0 6.1 £11,716
Scenario 1 6.1 £8,444
Scenario 2 6.1 £8,959
Scenario 3 6.1 £10,134
Scenario 4 6.1 Dominant
Scenario 5 6.1 £8,579

CONFIDENTIAL UNTIL PUBLISHED
124
Preferred assumption Section in ERG
report Cumulative ICER
(£/QALY)
ERG preferred base-case
Scenario 0: OIC monotherapy, non-cancer (The ERG considers this to be the corrected version of scenario 1)
Gompertz distribution for transition A (instead of lognormal)
5.2.6.2 £11,939
Scenario 3*: LIR; OIC monotherapy, non-cancer
Gompertz distribution for transition A (instead of lognormal)
5.2.6.2 £4,989
Scenario 6*: LIR; cancer with OIC
Scenario 4 but with naloxegol as comparator instead of methylnaltrexone s.c.
5.2.4 £4,148
Based on the electronic model * Indicative only scenarios ERG = Evidence Review Group; ICER = incremental cost-effectiveness ratio, Incr. = incremental, LIR = laxative inadequate response, LYGs = life years gained, OIC = opioid-induced constipation, QALYs = quality-adjusted life years
7.4 Conclusions of the cost effectiveness section
Searches were undertaken by the company to identify published cost effectiveness studies.1, 41 After the request for clarification regarding missing information reporting hits per line of searches and overall recall of results, the company provided sufficient details for the ERG to appraise the searches.16 A good range of databases and additional resources including conference proceedings, specialist and organisational websites were searched. Searches for HRQoL literature was reported as being conducted as part of the clinical effectiveness searches, the ERG’s concerns regarding the limitations of these searches is reported in section 5.1.1.
The ERG considers the general structure of the model, pertaining to the decision-tree part reflecting the first four weeks, the Markov part, and the combination thereof, as appropriate. The same model was previously also considered by the ERG for TA345 to be appropriate.5
The population for the model was defined as the licensed population for naldemedine, i.e.: treatment of OIC in adult patients who have previously been treated with a laxative.
The company split this population into three distinct subpopulations:
1. In patients with OIC as an alternative to second-line laxative monotherapy; 2. In patients with mixed aetiology constipation (including OIC) in combination with an existing
laxative as an alternative to combination laxative therapy 3. In patients with OIC after inadequate response to at least one laxative class as an alternative for
naloxegol (also referred to as laxative inadequate responders, LIRs)
In response to the clarification letter, the company added two subpopulations for cancer patients:
4. In patients with OIC with insufficient response to usual laxative therapy as alternative to subcutaneous methylnaltrexone
5. In patients with cancer pain and OIC previously treated with a laxative as an alternative to second-line laxative mono therapy.
CONFIDENTIAL UNTIL PUBLISHED
125
Given the above subpopulations, the interventions and comparators were defined, specifically indicating where naldemedine and its comparator should be limited to patients not having received any rescue laxatives or only patients who did receive rescue laxatives (see Table 5.3). Based on these definitions, data were extracted from the various COMPOSE studies.
In the request for clarification, the ERG asked the company why for scenarios 1 and 2 the intervention was defined as, and data were extracted for, naldemedine without rescue laxative.18 It appears to the ERG highly unlikely that in clinical practice patients will be told not to use rescue medication. In response, the company presented a scenario 0 (which the ERG considers to be a correction of scenario 1) in which, both for the naldemedine and placebo group, all patients from the COMPOSE-1 and -2 were included, regardless of whether they had used rescue medication.16 However, no such corrections were presented for scenarios 2 and 3.
Of the cancer scenarios added, scenario 5 was based on the correct data for the correct subpopulation. However, in scenario 4 the population was not restricted to patients with laxative inadequate response despite this being required for treatment with methylnaltrexone. As a result of these fundamental problems with using the correct patient selection for each cost effectiveness analysis, the ERG considers all results and discussion with regards to scenario 1, 2, 3, and 4 irrelevant. Nevertheless, results of scenarios 1 to 4 have been presented but should be regarded as indicative only.
Regarding the quality of life and utility of patients with and without OIC, unfortunately, EQ-5D was not measured in the COMPOSE studies, only the SF-36 and the PAC-QOL were measured. In the absence of EQ-5D, the ERG considers the choice of the company to use utilities from TA345 as an appropriate alternative. The CS used treatment-specific utilities for the non-OIC (on treatment) health state in the base-case. From the various scenario analyses that the company did to investigate the model’s sensitivity to variation in the utility values per health state, it is clear that these values are one of the major determinants of the ICERs. Use of treatment-specific utilities for the same health state (non-OIC) was earlier considered inappropriate in TA345, as it serves as a way to compensate for the very heterogeneous nature of the non-OIC health state.5 After all, this state can be occupied by patients with 10 SBM in a 4 week period or 28 SBM. Ideally this would have been addressed by refining the non-OIC (on treatment) state by splitting it in two states and deriving treatment unspecific, health state specific utility values. However, it is the ERGs view that in the absence of such a more refined Markov model, the current approach with treatment specific utilities is a reasonable alternative.
Once patients have responded to their treatment for OIC, they are continuously at risk of going back to OIC. This risk is described by time-to-event curves, based on observations from the various COMPOSE studies and indirect treatment comparisons. Given the time horizon of five years, these curves were extrapolated beyond the observed period using parametric distributions. The most important element of selecting an appropriate time-to-event curve, i.e. clinical plausibility, was not addressed in the CS. In response to the request for clarification, the company stated that a full report on validation will be available by the end of November 2019, which is beyond the time period for ERG assessment.16 The company performed several sensitivity analyses that demonstrated that use of alternative parametric distributions for survival curves led to relatively small differences in cost effectiveness results, since incremental differences between naldemedine and comparator curves did not differ much for different parametric distributions. Unfortunately, it was difficult for the ERG to assess the soundness of the results presented for various scenarios, because the presentation and explanation of the methodology used for the model, including the time-to-event curves for transition A and how they were derived from the data, were very limited.

CONFIDENTIAL UNTIL PUBLISHED
126
It is unclear to the ERG how the adverse event rates as presented in the electronic model were derived. This makes it difficult for the ERG to comment on the large difference in AEs between naldemedine versus naloxegol and methylnaltrexone. However, the AEs are associated with very low costs and no disutility, hence the impact of changes in the percentage of AEs on the ICER is very small.
Health state costs were limited to the OIC health state only, similar to TA345. The health state costs were derived from the CPRD database and were estimated to be £16.75 per cycle. OIC health state costs were considerably lower than in TA345 and in published literature, making the £16.75 a conservative estimate.
The company base-case outputs resulted in QALY gains from naldemedine versus all comparators at increased costs, except for scenario 4 in which costs were lower. The company base-case discounted ICERs for scenarios 0, 1, 2, 3, and 5 are £11,716; £8,444; £8,959; £10,134; and £8,579, respectively. Naldemedine was dominant in scenario 4.
The ERG preferred the Gompertz distribution as the base-case distribution in scenarios 0 and 3, based on input from the clinical expert consulted by the ERG. Also, the ERG implemented an additional scenario 6, in which naldemedine was compared versus naloxegol in cancer patients and removed scenario 1, since scenario 0 was offered by the company in response to the request for clarification as an improved version of scenario 1.16 Using these settings ICER estimates changed to £11,939; £4,989; and £1,282 for scenarios 0, 3, and 6 respectively. Naldemedine remained dominant in scenario 4.
The ERG also conducted PSAs using the ERG base-case assumptions. The probabilistic results were in line with the findings from the deterministic analyses. In scenario 0, non-cancer OIC patients, naldemedine has probabilities of being cost effective of 74.1% and 83.0% at thresholds of £20,000 and £30,000, respectively.
In scenarios 3 and 6, the probabilities of naldemedine being cost effective are (almost) 100% at both thresholds.
The ERG conducted additional scenario analyses, varying utilities using values from the literature and health state costs using values from TA345.16 Using higher health state costs for OIC health state resulted in lower ICER values. Naldemedine was dominant in all scenarios when the health state costs of £371.32 were used.
It should be noted that many methodological choices made in the model were unsubstantiated and/or unclear to the ERG. Furthermore, scenarios 2 to 4 were modelled for inappropriate populations. Clinical validation of the results and input values were also unavailable to the ERG. These issues led to considerable uncertainty beyond just parameter uncertainty about the accuracy of the ICER estimates.

CONFIDENTIAL UNTIL PUBLISHED
127
8. End of life
The CS did not make reference to end of life, i.e. not relevant for this submission.
CONFIDENTIAL UNTIL PUBLISHED
128
9. References
[1] Shionogi B.V. Constipation (opioid-induced) - naldemedine (RIZMOIC) [ID1189]. Document B: Submission to National Institute of Health and Care Excellence. Single technology appraisal (STA): Shionogi B.V., June 2019 [accessed 24.9.19]. 169p. [2] Farmer AD, Drewes AM, Chiarioni G, De Giorgio R, O'Brien T, Morlion B, et al. Pathophysiology and management of opioid-induced constipation: European expert consensus statement. United European Gastroenterol J 2019;7(1):7-20. [3] Simren M, Palsson OS, Whitehead WE. Update on Rome IV criteria for colorectal disorders: implications for clinical practice. Curr Gastroenterol Rep 2017;19(4):15. [4] Tuteja AK, Biskupiak J, Stoddard GJ, Lipman AG. Opioid-induced bowel disorders and narcotic bowel syndrome in patients with chronic non-cancer pain. Neurogastroenterol Motil 2010;22(4):424-30. [5] National Institute for Health and Care Excellence. Final appraisal determination: Naloxegol for treating opioid-induced constipation (TA345) [Internet]. London: NICE, 2015 [accessed 12.2.19] Available from: https://www.nice.org.uk/guidance/TA345 [6] Bell T, Annunziata K, Leslie JB. Opioid-induced constipation negatively impacts pain management, productivity, and health-related quality of life: findings from the National Health and Wellness Survey. J Opioid Manag 2009;5(3):137-44. [7] MDCalc. Rome IV diagnostic criteria for constipation [Internet]. 2019 [accessed 12.11.19]. Available from: https://www.mdcalc.com/rome-iv-diagnostic-criteria-constipation [8] Mearin F, Lacy BE, Chang L, Chey WD, Lembo AJ, Simren M, et al. Bowel Disorders. Gastroenterology 2016;150(6):1393–407. [9] Coyne KS, LoCasale RJ, Datto CJ, Sexton CC, Yeomans K, Tack J. Opioid-induced constipation in patients with chronic noncancer pain in the USA, Canada, Germany, and the UK: descriptive analysis of baseline patient-reported outcomes and retrospective chart review. Clinicoecon Outcomes Res 2014;6:269-81. [10] Rauck R, Bookbinder S, Bunker T, Alftine C, Negro-Vilar A, De Jong E, et al. Oral once-a-day AVINZA (morphine sulfate extended-release capsules) vs. twice daily OxyContin (oxycodone hydrochloride controlled-release) for the treatment of chronic moderate-to-severe low back pain; final (part I and part II) study results (Abstract 827). Presented at Am Pain Soc 25th Annu Sci Meet; 3-6 May 2006; San Antonio, Tx. J Pain 2006;7(4 Suppl):S57. [11] Robinson CB, Fritch M, Hullett L, Petersen MA, Sikkema S, Theuninck L, et al. Development of a protocol to prevent opioid-induced constipation in patients with cancer: a research utilization project. Clin J Oncol Nurs 2000;4(2):79-84. [12] Drewes AM, Munkholm P, Simren M, Breivik H, Kongsgaard UE, Hatlebakk JG, et al. Definition, diagnosis and treatment strategies for opioid-induced bowel dysfunction-Recommendations of the Nordic Working Group. Scand J Pain 2016;11:111-22. [13] Glare P, Walsh D, Sheehan D. The adverse effects of morphine: a prospective survey of common symptoms during repeated dosing for chronic cancer pain. Am J Hosp Palliat Care 2006;23(3):229-35. [14] Coyne KS, Margolis MK, Yeomans K, King FR, Chavoshi S, Payne KA, et al. Opioid-induced constipation among patients with chronic noncancer pain in the United States, Canada, Germany, and

CONFIDENTIAL UNTIL PUBLISHED
129
the United Kingdom: laxative use, response, and symptom burden over time. Pain Med 2015;16(8):1551-65. [15] National Institute for Health and Care Excellence. Health Technology Appraisal: Naldemedine for treating opioid-induced constipation: Final scope [Internet]. London: NICE, April 2019 [accessed 9.4.19]. 4p. Available from: https://www.nice.org.uk/guidance/gid-ta10291/documents/final-scope-2 [16] Shionogi B.V. Naldemedine for treating opioid-induced constipation [ID1189]: response to request for clarification from the ERG: Shionogi B.V., 31 October 2019 [accessed 4.11.19]. 154p. [17] Committee for Medicinal Products for Human Use (CHMP). Guideline on the evaluation of medicinal products for the treatment of chronic constipation (including opioid induced constipation) and for bowel cleansing (EMA/CHMP/336243/2013)[Internet]. London: European Medicines Agency (EMA), 2015 [accessed 29.6.19] Available from: https://www.ema.europa.eu/en/documents/scientific-guideline/guideline-evaluation-medicinal-products-treatment-chronic-constipation-including-opioid-induced_en.pdf [18] National Institute for Health and Care Excellence. Naldemedine for treating opioid-induced constipation [ID1189]: clarification letter. London: NICE, 2019. 23p. [19] Esmadi M, Ahmad D, Hewlett A. Efficacy of naldemedine for the treatment of opioid-induced constipation: a meta-analysis. J Gastrointestin Liver Dis 2019;28(1):41-46. [20] Hu K, Bridgeman MB. Naldemedine (Symproic) for the treatment of opioid-induced constipation. P T 2018;43(10):601-27. [21] Luthra P, Burr NE, Brenner DM, Ford AC. Efficacy of pharmacological therapies for the treatment of opioid-induced constipation: systematic review and network meta-analysis. Gut 2018;68(3):434-44. [22] Shionogi B.V. Constipation (opioid-induced) - naldemedine (RIZMOIC) [ID1189]. Document B: Appendix D: Identification, selection and synthesis of clinical evidence (Updated). Submission to National Institute of Health and Care Excellence. Single technology appraisal (STA): Shionogi B.V., 2019 [accessed 25.10.19]. 59p. [23] Centre for Reviews and Dissemination. Systematic Reviews: CRD’s guidance for undertaking reviews in health care [Internet]. York: University of York, 2009 [accessed 23.3.11] Available from: http://www.york.ac.uk/inst/crd/SysRev/!SSL!/WebHelp/SysRev3.htm [24] Shionogi Inc. A randomized, double-blind, placebo-controlled, parallel-group study of naldemedine in the treatment of opioid-induced constipation in subjects with non-malignant chronic pain receiving opioid therapy (Clinical Study Report: 1314V9231) (PDF supplied with the company's submission). Florham Park, NJ: Shionogi Inc., 2015. 1539p. [25] Shionogi Inc. A randomized, double-blind, placebo-controlled, parallel-group study of naldemedine in the treatment of opioid-induced constipation in subjects with non-malignant chronic pain receiving opioid therapy (Clinical Study Report: 1315V9232) (PDF supplied with the company's submission). Florham Park, NJ: Shionogi Inc., 2015. 1630p. [26] Shionogi Inc. A randomized, double-blind, placebo-controlled, parallel-group, multicenter, phase 3 study to evaluate the long-term safety of naldemedine for the treatment of opioid-induced constipation in subjects with non-malignant chronic pain receiving opioid therapy (Clinical Study Report: 1326V9235) (PDF supplied with the company's submission). Florham Park, NJ: Shionogi Inc., 2017. 3005p.

CONFIDENTIAL UNTIL PUBLISHED
130
[27] Shionogi Inc. A phase 3, multicenter, randomized, double-blind, placebo-controlled, parallel-group study of naldemedine in cancer patients with opioid-induced constipation (Clinical Study Report: 1331V9236) (PDF supplied with the company's submission). Florham Park, NJ: Shionogi Inc., 2016. 510p. [28] Shionogi Inc. A phase 3, multicenter, open-label study of naldemedine in cancer patients with opioid-induced constipation - extension study (Clinical Study Report: 1332V9237) (PDF supplied with the company's submission). Florham Park, NJ: Shionogi Inc., 2016. 550p. [29] Mordecai L, Reynolds C, Donaldson LJ, de C Williams AC. Patterns of regional variation of opioid prescribing in primary care in England: a retrospective observational study. Br J Gen Pract 2018;68(668):e225-33. [30] Shionogi Inc., BioDelivery Sciences International. Risk of major adverse cardiovascular events for naldemedine and other medications for opioid induced constipation in adults with chronic non-cancer pain. NCT03720613. In: ClinicalTrials.gov [Internet]. Bethesda (MD): National Library of Medicine (US). 2019 [accessed 12.11.19]. Available from: https://clinicaltrials.gov/ct2/show/NCT03720613 [31] Shionogi Inc. Symproic Tablets 0.2mg drug use-results survey [Internet]. JapicCTI. 2019 [accessed 12.11.19]. Available from: https://www.clinicaltrials.jp/cti-user/trial/ShowDirect.jsp?japicId=JapicCTI-183988 [32] Kessoku T. Superiority comparative test of conventional treatment vs naldemedine for prevention of opioid-induced constipation in cancer patients: investigator initiated, single center, 2 arm, open label, randomized controlled trials [Internet]. UMIN-CTR. 2019 [accessed 12.11.19]. Available from: https://upload.umin.ac.jp/cgi-open-bin/ctr/ctr.cgi?function=brows&action=brows&recptno=R000036408&type=summary&language=E [33] Okuwaki K, Kida M. Multicenter prospective trial of efficacy of naldemedine for opioid-induced constipation in patients with advanced pancreatic cancer [Internet]. UMIN-CTR. 2019 [accessed 12.11.19]. Available from: https://upload.umin.ac.jp/cgi-open-bin/ctr_e/ctr_view.cgi?recptno=R000034487 [34] Okuwaki K, Kida M. Prospective trial of efficacy of naldemedine for opioid-induced constipation in patients with advanced pancreatic cancer: quality of life survey [Internet]. UMIN-CTR. 2019 [accessed 12.11.19]. Available from: https://upload.umin.ac.jp/cgi-open-bin/ctr_e/ctr_view.cgi?recptno=R000034499 [35] Kanai T. Study on the effect of naldemedine tosilate by diet [Internet]. UMIN-CTR. 2019 [accessed 12.11.19]. Available from: https://upload.umin.ac.jp/cgi-open-bin/ctr_e/ctr_view.cgi?recptno=R000033597 [36] Hale M, Wild J, Reddy J, Yamada T, Arjona Ferreira JC. Naldemedine versus placebo for opioid-induced constipation (COMPOSE-1 and COMPOSE-2): two multicentre, phase 3, double-blind, randomised, parallel-group trials. Lancet Gastroenterol Hepatol. 2017;2(8):555-64. [37] Papaioannou D, Brazier JE, Paisley S. NICE DSU Technical Support Document 9: the identification, review and synthesis of health state utility values from the literature [Internet], 2011 [accessed 8.12.16] Available from: http://www.nicedsu.org.uk [38] Shionogi B.V. Constipation (opioid-induced) - naldemedine (RIZMOIC) [ID1189]. Document B: Appendix G: Published cost-effectiveness studies (Updated). Submission to National Institute of Health and Care Excellence. Single technology appraisal (STA): Shionogi B.V., 2019 [accessed 31.10.19]. 23p.

CONFIDENTIAL UNTIL PUBLISHED
131
[39] US Food & Drug Administration (FDA). Medication guide: Relistor [Internet]. Silver Spring, MD: US Food & Drug Administration (FDA), 2018 [accessed 16.11.19]. 53p. Available from: https://www.accessdata.fda.gov/drugsatfda_docs/label/2017/021964s018,208271s002lbl.pdf [40] European Medicines Agency. Summary of product characteristics. Relistor 12 mg/0.6 mL solution for injection [Internet]. London: EMA, [accessed 16.11.19]. 89p. Available from: https://www.ema.europa.eu/en/documents/product-information/relistor-epar-product-information_en.pdf [41] Shionogi B.V. Constipation (opioid-induced) - naldemedine (RIZMOIC) [ID1189]. Document B: Appendix M: Evaluation of opioid exposure and symptoms of constipation: incidence, treatment, treatment failure and resource use. Submission to National Institute of Health and Care Excellence. Single technology appraisal (STA): Shionogi B.V., 2019 [accessed 24.9.19]. 65p. [42] Epstein RS, Cimen A, Benenson H, Aubert RE, Khalid M, Sostek MB, et al. Patient preferences for change in symptoms associated with opioid-induced constipation. Adv Ther 2014;31(12):1263-71. [43] Bull J, Wellman CV, Israel RJ, Barrett AC, Paterson C, Forbes WP. Fixed-dose subcutaneous methylnaltrexone in patients with advanced illness and opioid-induced constipation: results of a randomized, placebo-controlled study and open-label extension. J Palliat Med 2015;18(7):593-600. [44] Latimer N. NICE DSU Technical Support Document 14: survival analysis for economic evaluations alongside clinical trials - extrapolation with patient-level data [Internet], 2011 [accessed 18.11.19] Available from: http://nicedsu.org.uk/wp-content/uploads/2016/03/NICE-DSU-TSD-Survival-analysis.updated-March-2013.v2.pdf [45] Office for National Statistics. National life tables, UK: 2015 to 2017 [Internet]. London: Office for National Statistics, 2018 [accessed 18.11.19] Available from: https://www.ons.gov.uk/peoplepopulationandcommunity/birthsdeathsandmarriages/lifeexpectancies/bulletins/nationallifetablesunitedkingdom/2015to2017 [46] Dolan P. Modeling valuations for EuroQol health states. Med Care 1997;35(11):1095-108. [47] Parker M, Haycox A, Graves J. Estimating the relationship between preference-based generic utility instruments and disease-specific quality-of-life measures in severe chronic constipation: challenges in practice. PharmacoEcon 2011;29(8):719-30. [48] Chey WD, Webster L, Sostek M, Lappalainen J, Barker PN, Tack J. Naloxegol for opioid-induced constipation in patients with noncancer pain. N Engl J Med 2014;370(25):2387-96. [49] Hatswell AJ, Vegter S. Measuring quality of life in opioid-induced constipation: mapping EQ-5D-3 L and PAC-QOL. Health Econ Rev 2016;6(1):14. [50] Penning-van Beest FJ, van den Haak P, Klok RM, Prevoo YF, van der Peet DL, Herings RM. Quality of life in relation to constipation among opioid users. J Med Econ 2010;13(1):129-35. [51] British National Formulary [Internet], [accessed 18.11.19]. Available from: https://www.medicinescomplete.com/ [52] Dunlop W, Uhl R, Khan I, Taylor A, Barton G. Quality of life benefits and cost impact of prolonged release oxycodone/naloxone versus prolonged release oxycodone in patients with moderate-to-severe non-malignant pain and opioid-induced constipation: a UK cost-utility analysis. J Med Econ 2012;15(3):564-75.

CONFIDENTIAL UNTIL PUBLISHED
132
[53] Lawson R, Ryan J, King F, Goh JW, Tichy E, Marsh K. Cost effectiveness of naloxegol for opioid-induced constipation in the UK. PharmacoEcon 2017;35(2):225-35. [54] Vemer P, Corro Ramos I, van Voorn GA, Al MJ, Feenstra TL. AdViSHE: a validation-assessment tool of health-economic models for decision makers and model users. PharmacoEcon 2016;34(4):349-61. [55] Buyukkaramikli NC, Rutten-van Molken MPMH, Severens JL, Al M. TECH-VER: a verification checklist to reduce errors in models and improve their credibility. PharmacoEcon 2019;37(11):1391-1408.

CONFIDENTIAL UNTIL PUBLISHED
133
Appendix 1: Company systematic review eligibility criteria
PICOS Inclusion Criteria Exclusion Criteria
Population Adult subjects with OIC who have cancer or chronic non-cancer pain and are receiving a regimen of opioids
Patients who have not been diagnosed with OIC and/or who are not receiving a regimen of opioids
Interventions Laxatives:
Osmotic agents (including magnesium, lactulose, polyethylene glycol (macrogols) and sorbitol liquid)
Stimulant laxatives (including bisacodyl and senna)
Emollient laxatives (including stool softeners such as docusate)
Lubricant laxatives (including mineral oil)
Opioid receptor antagonists including:
Naloxone hydrochloride
Naloxone oxycodone PAMORAs including:
Naldemedine
Methylnaltrexone
Naloxegol
Alvimopan* Other constipation treatments including:
Lubiprostone*
Prucalopride*
Linaclotide*
Axelopram* Best supportive care including:
Enemas
Disimpaction Any combination of relevant interventions, and relevant interventions in combination with bulk-forming laxatives
Interventions that are not recommended for the treatment of OIC:
Bulk-forming laxatives including ispaghula husk, methylcellulose and sterculia (when administered alone, and not in combination with any of the interventions listed in the “inclusion criteria” column)
Comparators Placebo, usual care or any intervention of interest
Outcomes Relevant articles had to report at least one efficacy, safety or HRQoL outcome: Efficacy outcomes including:
Study-defined response ratea
Number/frequency of study-defined BMs

CONFIDENTIAL UNTIL PUBLISHED
134
PICOS Inclusion Criteria Exclusion Criteria
Time until first study-defined BM
BFI
PAQ-SYM
Change in (rescue) laxative use Safety outcomes including:
Discontinuations (all causes/adverse events/lack of efficacy)
Time to discontinuation
Discontinuation rate at specified time point
Treatment adherence/compliance
Overall AEs
TEAEs (overall and serious)
Serious AEs
Deaths
Pain measures
OIC treatment-related AEs, including diarrhoea, abdominal pain, nausea, vomiting
HRQoL outcomes including:
PAC-QOL
EQ-5D
SF-36
Publications reporting study protocols or baseline characteristics only, without any outcomes of interest, were included at Sift 1. At Sift 2, they were linked to other publications reporting on the same study. If there was at least one publication reporting relevant outcomes (efficacy, safety or HRQoL) for the trial, the protocol or baseline characteristics were included as a secondary publication for the trial. However, if there were no publications with relevant outcomes, the protocol or baseline characteristics were excluded.
Study design RCTs
Interventional non-RCTs†
Any other study design, including:
Economic evaluations
Observational studies
Non-systematic or narrative reviews
Editorials, notes, comments or letters
Case reports/case studies
Relevant systematic reviews and (network) meta-analyses were eligible for inclusion at the abstract review stage, but excluded at the full-text review stage after hand-searching their reference lists
Other considerations
Abstracts or full text in the English language
Human subjects
Non-English language abstracts or full texts
Studies not on human subjects Based on Table 6 of Appendix D of the CS22 * These comparators were not relevant to the NICE scope so were removed at feasibility assessment stage in

CONFIDENTIAL UNTIL PUBLISHED
135
PICOS Inclusion Criteria Exclusion Criteria the original SLR and were excluded at all stages for the SLR update; † Non-RCTs were excluded at all stages for the SLR update AE = adverse event; BFI = Bowel Function Index; BM = bowel movement; CS = company submission; EQ-5D = European Quality of Life-5 Dimensions; HRQoL = health-related quality of life; NICE = National Institute for Health and Care Excellence; OIC = opioid-induced constipation; PAC-QOL = Patient Assessment of Constipation Quality of Life; PAC-SYM = Patient Assessment of Constipation Symptoms; PAMORA = peripherally acting µ-opioid receptor antagonist; PICOS = Population, Intervention, Comparison, Outcome, and Study design; RCT = randomised controlled trial; SF-36 = short from-36; SLR = systematic literature review; TEAE = treatment-emergent adverse event

CONFIDENTIAL UNTIL PUBLISHED
136
Appendix 2: Additional results company’s base-case
A2.1 Disaggregated results by health state
Below are the disaggregated results by health state for scenarios 1 to 4 (Tables A2.1 to A2.4).
In scenario 1 (Table A2.1), the largest proportion of costs is accrued by patients in the OIC health state for both treatments to a comparable extent. The difference in total costs between both treatments in scenario 1 is determined by the time spent by patients in the non-OIC (on treatment) health state. The numbers of QALYs gained are slightly higher for patients who (previously) received placebo + rescue laxative versus those that received naldemedine (no rescue laxative) in both the non-OIC (untreated) and OIC health states, and vice versa for patients in the non-OIC (on treatment) health state.
In scenario 2 (Table A2.2), the largest proportion of costs is accrued by patients in the non-OIC (on treatment) health state for those receiving naldemedine + stable laxative (no rescue laxative), and by patients in the OIC health state for those receiving placebo + stable laxative + rescue laxative. The numbers of QALYs gained are slightly higher for patients who (previously) received placebo + stable laxative + rescue laxative versus those that received naldemedine + stable laxative (no rescue laxative) in both the non-OIC (untreated) and OIC health states, and vice versa for patients in the non-OIC (on treatment) health state.
In scenario 3 (Table A2.3), slightly higher costs are accrued by patients in the non-OIC (on treatment) health state for those receiving naldemedine, and by patients in the OIC health state for those receiving naloxegol. The numbers of QALYs gained are slightly higher for patients who (previously) received naloxegol versus those that received naldemedine in both the non-OIC (untreated) and OIC health states, and vice versa for patients in the non-OIC (on treatment) health state.
In scenario 4 (Table A2.4), substantially higher costs are accrued by patients in the non-OIC (on treatment) health state for those receiving methylnaltrexone versus those receiving naldemedine. The numbers of QALYs gained are rather comparable for patients in both the non-OIC (untreated) and OIC health states for both treatments, and just slightly higher for patients receiving naldemedine in the non-OIC (on treatment) health state.
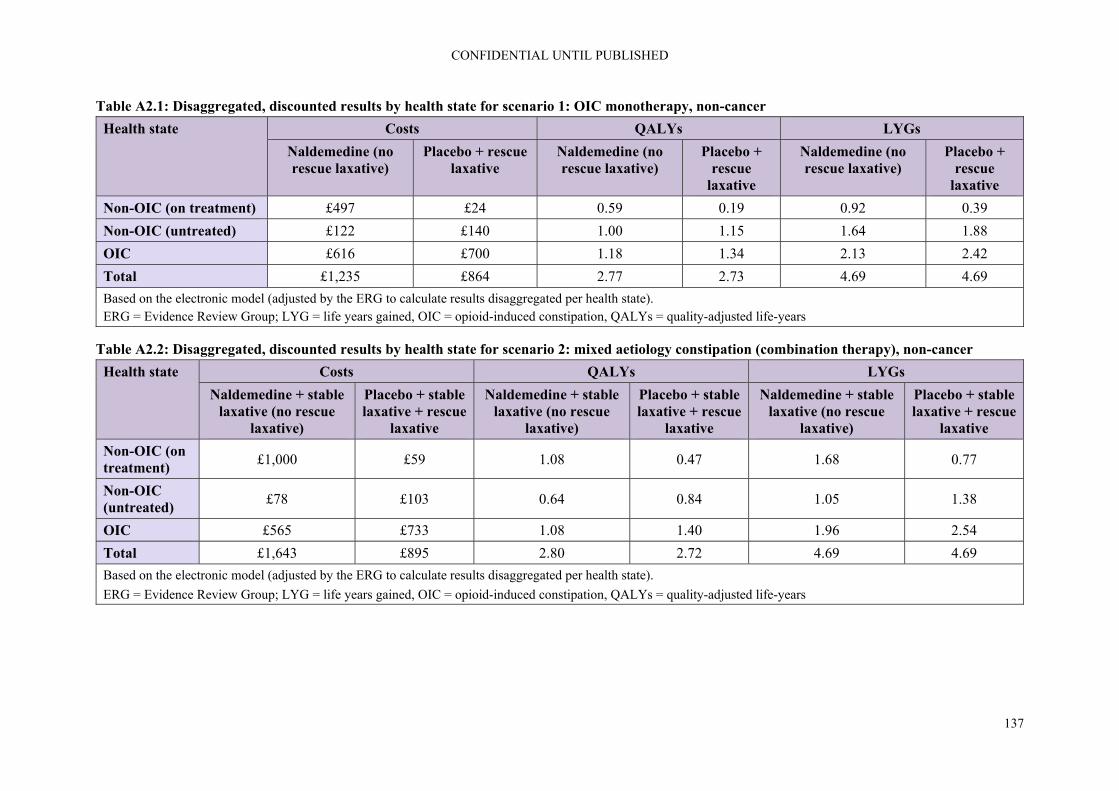
CONFIDENTIAL UNTIL PUBLISHED
137
Table A2.1: Disaggregated, discounted results by health state for scenario 1: OIC monotherapy, non-cancer
Health state Costs QALYs LYGs
Naldemedine (no rescue laxative)
Placebo + rescue laxative
Naldemedine (no rescue laxative)
Placebo + rescue
laxative
Naldemedine (no rescue laxative)
Placebo + rescue
laxative
Non-OIC (on treatment) £497 £24 0.59 0.19 0.92 0.39
Non-OIC (untreated) £122 £140 1.00 1.15 1.64 1.88
OIC £616 £700 1.18 1.34 2.13 2.42
Total £1,235 £864 2.77 2.73 4.69 4.69
Based on the electronic model (adjusted by the ERG to calculate results disaggregated per health state). ERG = Evidence Review Group; LYG = life years gained, OIC = opioid-induced constipation, QALYs = quality-adjusted life-years
Table A2.2: Disaggregated, discounted results by health state for scenario 2: mixed aetiology constipation (combination therapy), non-cancer
Health state Costs QALYs LYGs
Naldemedine + stable laxative (no rescue
laxative)
Placebo + stable laxative + rescue
laxative
Naldemedine + stable laxative (no rescue
laxative)
Placebo + stable laxative + rescue
laxative
Naldemedine + stable laxative (no rescue
laxative)
Placebo + stable laxative + rescue
laxative
Non-OIC (on treatment)
£1,000 £59 1.08 0.47 1.68 0.77
Non-OIC (untreated)
£78 £103 0.64 0.84 1.05 1.38
OIC £565 £733 1.08 1.40 1.96 2.54
Total £1,643 £895 2.80 2.72 4.69 4.69
Based on the electronic model (adjusted by the ERG to calculate results disaggregated per health state).
ERG = Evidence Review Group; LYG = life years gained, OIC = opioid-induced constipation, QALYs = quality-adjusted life-years

CONFIDENTIAL UNTIL PUBLISHED
138
Table A2.3: Disaggregated, discounted results by health state for scenario 3: OIC monotherapy (LIR), non-cancer
Health state Costs QALYs LYGs
Naldemedine Naloxegol Naldemedine Naloxegol Naldemedine Naloxegol
Non-OIC (on treatment) £522 £349 0.61 0.33 0.97 0.52
Non-OIC (untreated) £173 £195 1.46 1.64 2.32 2.61
OIC £406 £453 0.88 1.26 1.40 1.56
Total £1,102 £997 2.86 2.74 4.69 4.69
Based on the electronic model (adjusted by the ERG to calculate results disaggregated per health state).
ERG = Evidence Review Group; LYG = life years gained, OIC = opioid-induced constipation, QALYs = quality-adjusted life-years
Table A2.4: Disaggregated, discounted results by health state for scenario 4: advanced illness, cancer
Health state Costs QALYs LYGs
Naldemedine Methylnaltrexone (s.c.)
Naldemedine Methylnaltrexone (s.c.)
Naldemedine Methylnaltrexone (s.c.)
Non-OIC (on treatment) £663 £3,795 0.77 0.62 1.23 1.00
Non-OIC (untreated) £102 £111 0.87 0.95 1.39 1.50
OIC £441 £476 0.86 0.92 1.54 1.66
Total £1,206 £4,381 2.50 2.49 4.16 4.16
Based on the electronic model (adjusted by the ERG to calculate results disaggregated per health state).
ERG = Evidence Review Group; LYG = life years gained, OIC = opioid-induced constipation, QALYs = quality-adjusted life-years; s.c. = subcutaneous

National Institute for Health and Care Excellence
Centre for Health Technology Evaluation
ERG report – factual accuracy check
Naldemedine for treating opioid-induced constipation [ID1189] You are asked to check the ERG report to ensure there are no factual inaccuracies contained within it. If you do identify any factual inaccuracies, you must inform NICE by 5pm on Monday 2 December 2019 using the below comments table. All factual errors will be highlighted in a report and presented to the Appraisal Committee and will subsequently be published on the NICE website with the committee papers. The factual accuracy check form should act as a method of detailing any inaccuracies found and how and why they should be corrected.

Issue 1
Description of problem Description of proposed amendment Justification for amendment ERG comment
Page 13, para 1, line 3.
“In contrast, the decision problem addressed in the company submission (CS) is narrower due to the reference to chronic pain, …”
“The decision problem addressed in the company submission (CS) is narrower due to the reference to chronic pain, …”
This is not a contrast (suggesting a major departure) but in fact closely aligned.
Changed in sections 1.1.1 and 3.1
Issue 2
Description of problem Description of proposed amendment Justification for amendment ERG comment
Page 13, para 2, line 10.
“…the company eventually provided results for patients with cancer pain …”
“…the company provided results for patients with cancer pain …”
The provision of the economic modelling for cancer patients was provided according to the mutually agreed timeline in request for clarification.
Not a factual error
NB: Sentence with quote cited by the company starts with “In response to the request for clarification,…”
Issue 3
Description of problem Description of proposed amendment Justification for amendment ERG comment
Page 13, para 3, line 9.
“Overall, these factors limit the generalisability of the trial results to UK clinical practice.”
“Overall, these factors could potentially limit the generalisability of the trial results to UK clinical practice.”
The clinical advisory board convened by Shionogi reached a different conclusion with respect to generalisability of trial results to UK clinical practice.
Not a factual error
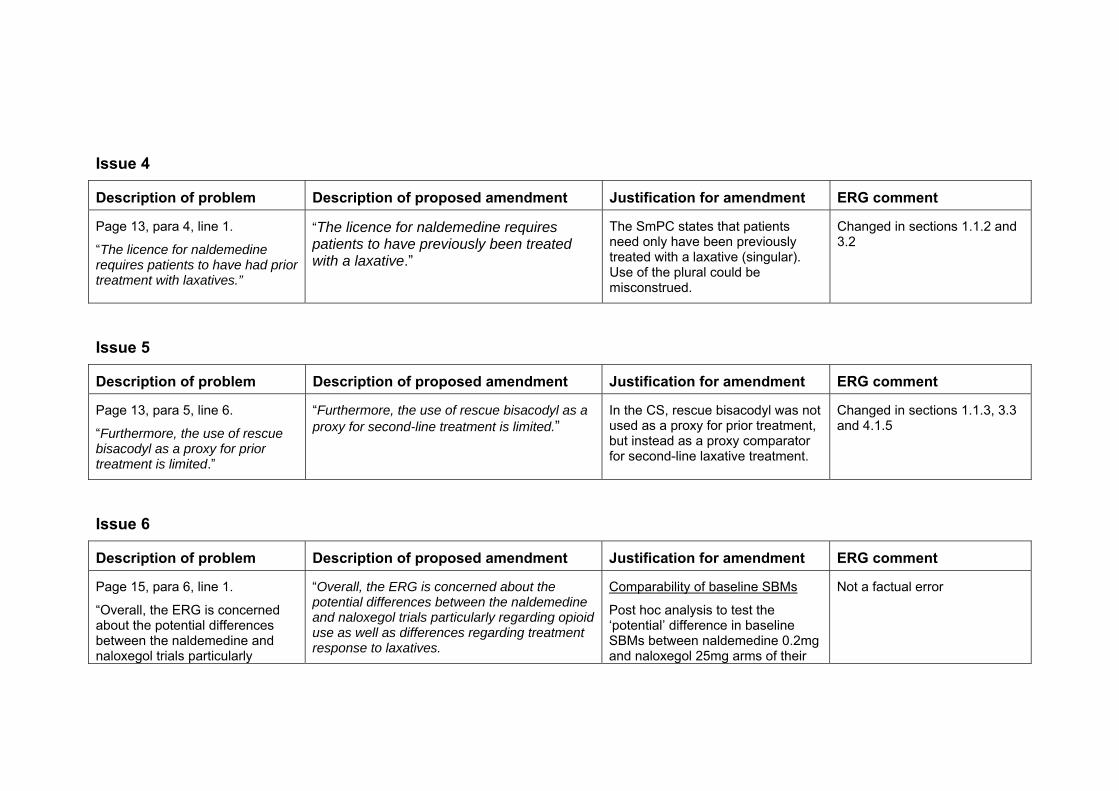
Issue 4
Description of problem Description of proposed amendment Justification for amendment ERG comment
Page 13, para 4, line 1.
“The licence for naldemedine requires patients to have had prior treatment with laxatives.”
“The licence for naldemedine requires patients to have previously been treated with a laxative.”
The SmPC states that patients need only have been previously treated with a laxative (singular). Use of the plural could be misconstrued.
Changed in sections 1.1.2 and 3.2
Issue 5
Description of problem Description of proposed amendment Justification for amendment ERG comment
Page 13, para 5, line 6.
“Furthermore, the use of rescue bisacodyl as a proxy for prior treatment is limited.”
“Furthermore, the use of rescue bisacodyl as a proxy for second-line treatment is limited.”
In the CS, rescue bisacodyl was not used as a proxy for prior treatment, but instead as a proxy comparator for second-line laxative treatment.
Changed in sections 1.1.3, 3.3 and 4.1.5
Issue 6
Description of problem Description of proposed amendment Justification for amendment ERG comment
Page 15, para 6, line 1.
“Overall, the ERG is concerned about the potential differences between the naldemedine and naloxegol trials particularly
“Overall, the ERG is concerned about the potential differences between the naldemedine and naloxegol trials particularly regarding opioid use as well as differences regarding treatment response to laxatives.
Comparability of baseline SBMs
Post hoc analysis to test the ‘potential’ difference in baseline SBMs between naldemedine 0.2mg and naloxegol 25mg arms of their
Not a factual error

regarding the baseline comparability in SBM and opioid use and different definitions of OIC as well as differences regarding treatment response to laxatives.”
respective studies was not statistically significant (P=0.1824).
Definitions of OIC
The definitions of OIC between the COMPOSE-1 & -2 and KODIAC-04 & -05 studies were congruent:
Chey et al. “<3 spontaneous bowel movements per week with one or more of the following symptoms: hard or lumpy stools, straining, or a sensation of incomplete evacuation or anorectal obstruction in at least 25% of bowel movements during the 4 weeks before screening.”
Hale et al. “no more than four spontaneous bowel movements (SBMs) over the 14-day qualifying period with no more than three SBMs in a given week; at least one bowel symptom (presence of straining, lumpy or hard stools, sensation of incomplete evacuation, sensation of anorectal obstruction or blockage) in at least 25% of bowel movements”
The alignment of the definitions can be seen in the similarity of baseline SBMs between the studies (see above).

Issue 7
Description of problem Description of proposed amendment Justification for amendment ERG comment
Page 19, para 3, line 6.
“Scenario 0 (non-cancer) is a corrected version of scenario 1, following suggestions made by the ERG to include rescue therapy in both the naldemedine and placebo comparators”
“Scenario 0 (non-cancer), included rescue therapy in both the naldemedine and placebo comparators (following suggestions made by the ERG)”
Scenario 0 is additional to not instead of Scenario 1. The designation ‘zero’ was intentional given that the placebo comparator in this instance is the clinical equivalent of ‘no treatment’, a treatment choice not favoured by the UEG consensus statement (Farmer, A et al).
Not a factual error. The ERG believes that scenario 1 is an irrelevant comparison, i.e. that scenario 0 should be seen as a correction of scenario 1. However, we consider that in it is clearer to display the scenarios as they were presented by the company. In the text below the list, we have clarified that we regard scenario 0 as the correction of scenario 1.
We have also made changes to clarify this in other parts of the report, where relevant.
Issue 8
Description of problem Description of proposed amendment Justification for amendment ERG comment
Page 19, para 4, line 8.
“As a result of these fundamental problems, the ERG considers all results and discussion with regards to scenarios 1, 2, 3, and 4 largely futile. Where results of scenarios 1 to 4 are presented, they should only be regarded as
“As a result of these limitations, the ERG the results of scenarios 1 to 4 should be interpreted with caution.”
As discussed at clarification, the company’s intention throughout has been to use TA345 as a fixed point of reference for the Committee to make an informed decision about naldemedine as the second-to-market oral PAMORA. We do not dispute the limitations of the
Not a factual error. However, in order to avoid any misunderstanding, the wording has been aligned with that used in TA345, i.e. we have changed ‘futile’ into ‘irrelevant’.
NB: The ERG report described certain scenarios (subgroup

only indicative. evidence for selected subgroups however believe they provide important sensitivity analyses across the range of clinical scenarios for which naldemedine is suitable. In this regard, the ERG description of them as ‘largely futile’ is unhelpful. It is worth noting that despite similar limitations in the AZ CS, the word ‘futile’ is not used at all. We would ask that NICE ensure consistency in the tone and language chosen between submissions.
analyses) as being futile as these were based on the wrong trial data being input into the model, which we regarded as a fundamental problem.
Issue 9
Description of problem Description of proposed amendment Justification for amendment ERG comment
Page 19, para 6, line 7.
“Use of treatment-specific utilities for the same health state (non-OIC) was earlier considered inappropriate in TA345, as it implied that health state definitions vary between treatments, rather than being homogenous descriptions of health.”
“Use of treatment-specific utilities for the same health state (non-OIC) was earlier considered reasonable in TA345, implying that health state definitions vary between treatments, rather than being homogenous descriptions of health.”
In their report to the CS for TA345, the same ERG concluded in their critique of the company cost-effectiveness analysis, “… it is the ERG’s view that in the absence of such a more refined Markov model, the current approach with treatment specific utilities is a reasonable alternative.”
The ERG has made changes throughout the report, most notably section 7, to reflect the fact that the ERG has not changed the utility values in the ERG base case.
The ERG apologises for this oversight and the changes made in the report as a result of this oversight.

Issue 10
Description of problem Description of proposed amendment Justification for amendment ERG comment
Page 19, para 6, line 9.
“Since the ERG did not find evidence for an independent treatment effect of naldemedine, health state specific utilities rather than treatment-specific utilities were preferred.”
“The company provided some evidence for an independent treatment effect of naldemedine. Given the sensitivity of the economic model to the selection of either health state specific utilities rather than treatment-specific utilities, the ERG suggest the Committee consider the limitations of the supporting evidence presented.”
The company has provided evidence to show a statistically durable treatment-specific benefit among naldemedine-treated non-OIC patients at both Week 4 and Week 12 in both SBM and PAC-QOL (pooled COMPOSE-1 & -2). We would ask that the Committee give this evidence full consideration in its deliberations over NICE most plausible ICER.
Not a factual error.
As indicated in the main body, the statement is based on Tables 28 and 29 in the CS, which show results of repeated measures mixed models of determinants of mapped EQ-5D utility and SF-6D utilities. In these analyses the coefficients for treatment were very small and not statistically significant.
Issue 11
Description of problem Description of proposed amendment Justification for amendment ERG comment
Page 20, para 2, line 2.
“This makes it difficult for the ERG to comment on the large difference in adverse events (AEs) between treatments.”
“This makes it difficult for the ERG to comment on the difference in adverse events (AEs) between treatments.
The ERG conclusion on safety is at odds with the EPAR findings that: “Overall, the safety profile of naldemedine is considered acceptable. Based on the mechanism of action of naldemedine, a higher incidence of AEs belonging to the SOC of GI Disorders is in line with expectations.”
and also, those of Esmadi et al who found in a meta-analysis of 2,762
Changed to “This makes it difficult for the ERG to comment on the large difference in AEs of naldemedine versus naloxegol and methylnaltrexone.”.

patients across six RCTs that, “There was no statistically significant difference in treatment-emergent adverse events between naldemedine group and placebo group (mean odds ratio=1.18, p = 0.25, 95% CI: 0.89-1.55).”
Issue 12
Description of problem Description of proposed amendment Justification for amendment ERG comment
Page 28, para 2, line 2.
“Even though the company suggested that naldemedine could be used in conjunction with other laxatives, no rescue medication was offered for patients in the naldemedine arm in COMPOSE 1 and COMPOSE 2 while data on the proportion of patients needing rescue laxatives were only reported for the COMPOSE 3 trial.”
“Naldemedine is licensed for use in conjunction with other laxatives.”
The CSRs for COMPOSE-1 and -2 clearly state that, “Rescue laxative therapy (provided by the Sponsor) was allowed [regardless of treatment allocation] and could have been initiated if a subject did not have a BM for any period of 72 hours during the Screening or Treatment Periods.”
Removed: “no rescue medication was offered for patients in the naldemedine arm in COMPOSE 1 and COMPOSE 2 while”.
In response to question A4f of the request for clarification, the company referred to “table 4 below” for the requested “proportion of patients who required rescue laxatives during the treatment period”. However, Table 4 (p. 17ff) provided only a description of the characteristics of the participants in the trials but no information on use of rescue medication during the trials.
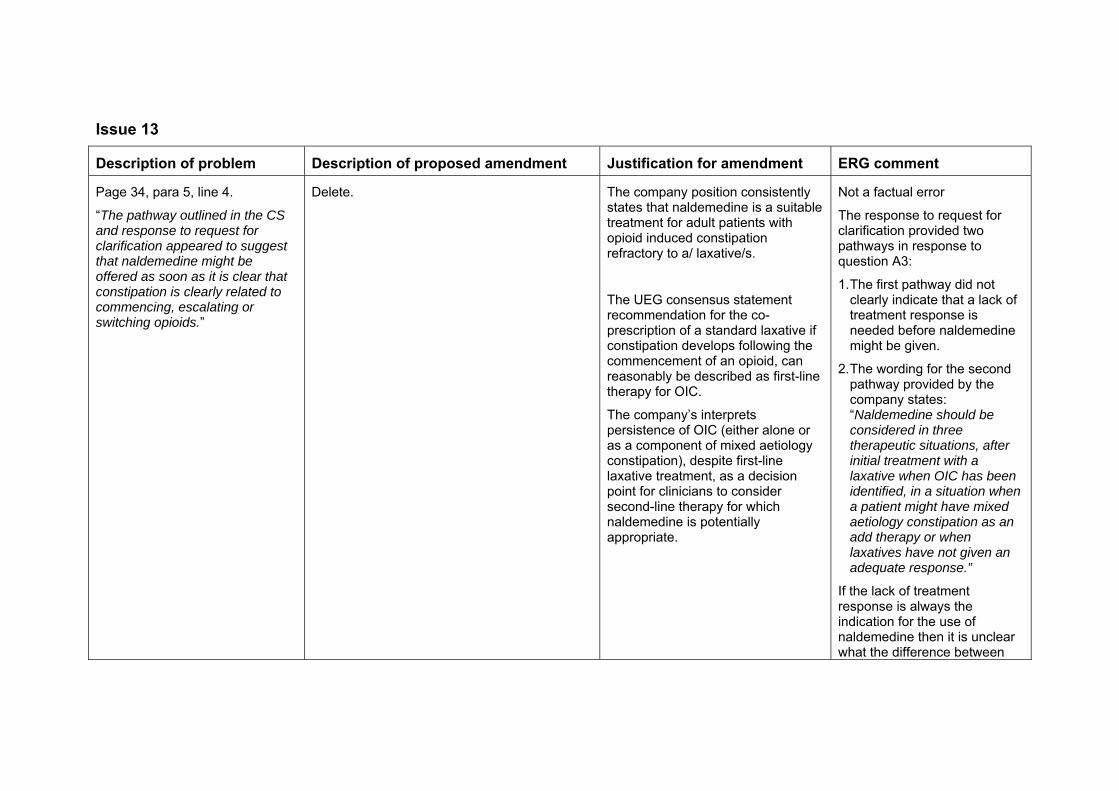
Issue 13
Description of problem Description of proposed amendment Justification for amendment ERG comment
Page 34, para 5, line 4.
“The pathway outlined in the CS and response to request for clarification appeared to suggest that naldemedine might be offered as soon as it is clear that constipation is clearly related to commencing, escalating or switching opioids.”
Delete. The company position consistently states that naldemedine is a suitable treatment for adult patients with opioid induced constipation refractory to a/ laxative/s.
The UEG consensus statement recommendation for the co-prescription of a standard laxative if constipation develops following the commencement of an opioid, can reasonably be described as first-line therapy for OIC.
The company’s interprets persistence of OIC (either alone or as a component of mixed aetiology constipation), despite first-line laxative treatment, as a decision point for clinicians to consider second-line therapy for which naldemedine is potentially appropriate.
Not a factual error
The response to request for clarification provided two pathways in response to question A3:
1. The first pathway did not clearly indicate that a lack of treatment response is needed before naldemedine might be given.
2. The wording for the second pathway provided by the company states: “Naldemedine should be considered in three therapeutic situations, after initial treatment with a laxative when OIC has been identified, in a situation when a patient might have mixed aetiology constipation as an add therapy or when laxatives have not given an adequate response.”
If the lack of treatment response is always the indication for the use of naldemedine then it is unclear what the difference between

the scenarios is supposed to be.

Technical report – Naldemedine for treating opioid-induced constipation Page 1 of 27
Issue date: January 2020
© NICE 2020. All rights reserved. Subject to Notice of rights.
NATIONAL INSTITUTE FOR HEALTH AND CARE EXCELLENCE
Technical report
Naldemedine for treating opioid-induced constipation
This document is the technical report for this appraisal. It has been prepared by the
technical team with input from the lead team and chair of the appraisal committee.
The technical report and stakeholder’s responses to it are used by the appraisal
committee to help it make decisions at the appraisal committee meeting. Usually,
only unresolved or uncertain key issues will be discussed at the appraisal committee
meeting.
The technical report includes:
topic background based on the company’s submission
a commentary on the evidence received and written statements
technical judgements on the evidence by the technical team
reflections on NICE’s structured decision-making framework.
This report is based on:
the evidence and views submitted by the company, consultees and their
nominated clinical experts and patient experts and
the evidence review group (ERG) report.
The technical report should be read with the full supporting documents for this
appraisal.
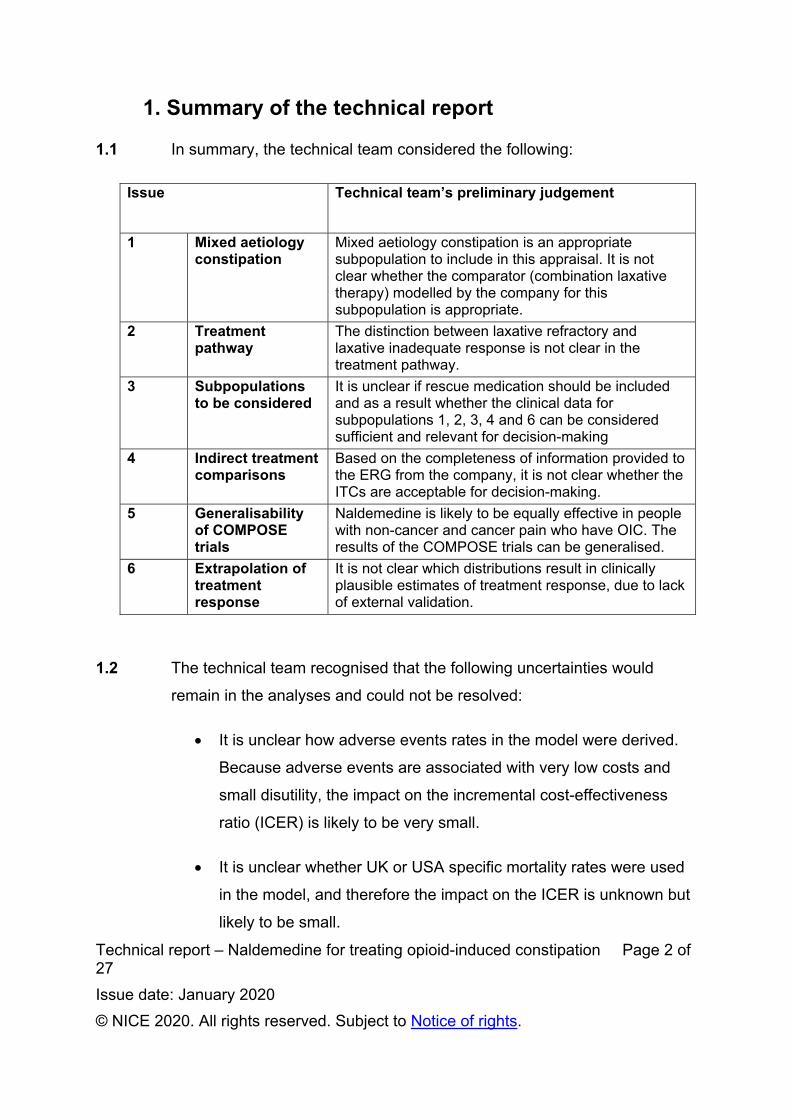
Technical report – Naldemedine for treating opioid-induced constipation Page 2 of 27
Issue date: January 2020
© NICE 2020. All rights reserved. Subject to Notice of rights.
1. Summary of the technical report
1.1 In summary, the technical team considered the following:
Issue Technical team’s preliminary judgement
1 Mixed aetiology constipation
Mixed aetiology constipation is an appropriate subpopulation to include in this appraisal. It is not clear whether the comparator (combination laxative therapy) modelled by the company for this subpopulation is appropriate.
2 Treatment pathway
The distinction between laxative refractory and laxative inadequate response is not clear in the treatment pathway.
3 Subpopulations to be considered
It is unclear if rescue medication should be included and as a result whether the clinical data for subpopulations 1, 2, 3, 4 and 6 can be considered sufficient and relevant for decision-making
4 Indirect treatment comparisons
Based on the completeness of information provided to the ERG from the company, it is not clear whether the ITCs are acceptable for decision-making.
5 Generalisability of COMPOSE trials
Naldemedine is likely to be equally effective in people with non-cancer and cancer pain who have OIC. The results of the COMPOSE trials can be generalised.
6 Extrapolation of treatment response
It is not clear which distributions result in clinically plausible estimates of treatment response, due to lack of external validation.
1.2 The technical team recognised that the following uncertainties would
remain in the analyses and could not be resolved:
It is unclear how adverse events rates in the model were derived.
Because adverse events are associated with very low costs and
small disutility, the impact on the incremental cost-effectiveness
ratio (ICER) is likely to be very small.
It is unclear whether UK or USA specific mortality rates were used
in the model, and therefore the impact on the ICER is unknown but
likely to be small.

Technical report – Naldemedine for treating opioid-induced constipation Page 3 of 27
Issue date: January 2020
© NICE 2020. All rights reserved. Subject to Notice of rights.
1.3 Taking these aspects into account and given the lack of suitable data and
outstanding issues, the technical team’s do not have preferred
incremental cost-effectiveness ratios (ICERs). However, Table 1 outlines
the available ICERs from the company and ERG (see Table 10: ERG and
company assumptions and impact on the cost-effectiveness estimate and
Table 3: Subpopulations modelled by company):
Table 1: ERG and company ICERs
Subpopulation
If rescue treatment should be included (issue 2)
If rescue treatment should be excluded (issue 2)
0 Subpopulation 1 with rescue laxative for naldemedine
£11,939 No ICER available
1 OIC Previous laxative Non-cancer patients
No ICER available
£8,444
2
Mixed aetiology constipation (includes OIC), combination therapy
Previous laxative Non-cancer patients
No ICER available
£8,959
3 OIC Previous laxative + LIR Non-cancer patients
No ICER available
£4,989
4 OIC Previous laxative + LIR Cancer patients
Naldemedine dominant*
6 Subpopulation 4 with different comparator
£4,148*
5 OIC Previous laxative Cancer patients
£8,579 No ICER available
*indicative only since population in model is not restricted to laxative inadequate response (LIR) and it is unclear if the source clinical effectiveness data includes rescue treatment in the comparator arms (all patients included in naldemedine arm regardless of rescue laxative use).

Technical report – Naldemedine for treating opioid-induced constipation Page 4 of 27
Issue date: January 2020
© NICE 2020. All rights reserved. Subject to Notice of rights.
No ICER available = company did not supply analyses
The technical team note that there is additional uncertainty in
subpopulations 3, 4 and 6 due to issues with critiquing the indirect
treatment comparisons (ITCs) due to a lack of information from the
company and uncertainty in the applicability of the ITCs (see issue 4).
1.4 Naldemedine does not meet the end of life criteria specified in NICE’s
guide to the methods of technology appraisal.
1.5 The technology is unlikely to be considered innovative (see Table 12:
Other issues for information).
1.6 No equality issues were identified.

Technical report – Naldemedine for treating opioid-induced constipation Page 5 of 27
Issue date: January 2020
© NICE 2020. All rights reserved. Subject to Notice of rights.
2. Topic background
2.1 Disease background – opioid-induced constipation (OIC)
Opioid analgesics are widely used for managing pain. Opioid receptors
are present in the gastrointestinal tract, and when opioids bind to these
receptors they can disrupt normal gastrointestinal function, resulting in
opioid-induced bowel dysfunction.
Opioid-induced constipation (OIC) will affect nearly all people taking
strong opioid treatment.
The prevalence of opioid-induced constipation is estimated to be
around 45–57% for people with non-cancer pain and 90% for people
with cancer-related pain.
Symptoms include straining, lumpy or hard stools, sensation of
incomplete evacuation and/or anorectal blockage, need for manual
defaecation, less than 3 spontaneous bowel movements per week.
2.2 Naldemedine
Table 2: Details of the technology being appraised
Marketing authorisation
Naldemedine for the treatment of opioid-induced constipation (OIC) in adult patients who have previously been treated with a laxative. (MA granted February 2019)
Mechanism of action
Peripheral acting mu opioid receptor antagonist (PAMORA) with a permanent binding action on receptors in the gut (mu-, delta- and kappa-opioid receptors), through which opioid medicines cause constipation. It does not block opioids from binding to pain receptors in the brain and therefore does not interfere with pain relief.
Administration Oral tablet.
Price The list price of a 28-tablet pack of naldemedine is £41.72. The cost of a course of treatment will depend on the duration of opioid therapy resulting in OIC requiring treatment.

Technical report – Naldemedine for treating opioid-induced constipation Page 6 of 27
Issue date: January 2020
© NICE 2020. All rights reserved. Subject to Notice of rights.
2.3 Treatment pathway
Figure 1 (adapted from Figures 1 and 2 of company response to clarification): Treatment pathway for the management of opioid-induced constipation as modelled by company/ERG
* Methylnaltrexone in patients with cancer pain only ** Laxative inadequate responder defined by company as <3 bowel movements and ≥1 Patient Assessment of Constipation Symptoms (PAC-SYM) scored moderate, severe, or very severe *** Figure 1 in company submission states: Consider a test treatment with a PAMORA or other opioid antagonist - if positive, continue Note: numbers refer to sub-populations, in Table 3. † Refers to modelling scenarios in patients with cancer pain Company report that the marketing authorisation for naldemedine permits its use in all laxative refractory patients regardless of the reason for laxative switching (including for tolerability and adherence reasons).
Consider and treat alternative causes of
constipation
Constipation clearly related to commencing, escalating or switch in opioids
Opioid induced constipation(laxative refractory)
OIC laxative inadequate responder**
Mixed aetiology constipation(including OIC)
Combination laxatives
Proposed naldemedine adjunctive to standard laxatives –if positive
continue***
Naloxegol or methylnaltrexone* Proposed naldemedine
Consider addition of laxatives
Consider referral to secondary or tertiary centre
Switch laxative
3,4†,6†
Primary care
Specialist or secondary
care
2
Proposed naldemedine 0,1,5†
Commence opioid and co-prescribe standard laxative (osmotic or stimulant) to commence if
constipation develops

Technical report – Naldemedine for treating opioid-induced constipation Page 7 of 27
Issue date: January 2020
© NICE 2020. All rights reserved. Subject to Notice of rights.
Table 3 (adapted from Table 5.4 in ERG report): Subpopulations modelled by company/ERG Subpopulation Intervention (I) Comparator (C) Source Outcome* 0 Subpopulation 1 with
rescue laxative for naldemedine
Naldemedine ± rescue laxative
Placebo ± rescue laxative
COMPOSE-1 & -2
Response by SBM
1 OIC Previous laxative Non-cancer patients
Naldemedine Placebo + rescue laxative
COMPOSE-1 & -2
I = response by SBM C = response by BM
2 Mixed aetiology constipation (includes OIC), combination therapy
Previous laxative Non-cancer patients
Naldemedine + stable laxative
Placebo + stable laxative + rescue laxative
COMPOSE-3 Response by BM
3 OIC Previous laxative + LIR Non-cancer patients
Naldemedine Naloxegol ITC based on COMPOSE 1 & 2, KODIAC-4 & 5
Response by SBM
4 OIC Previous laxative + LIR Cancer patients
Naldemedine ± rescue laxative
Methylnaltrexone (s.c)
ITC based on COMPOSE 4 and Bull et al. 2015
Response by SBM
5 OIC Previous laxative Cancer patients
Naldemedine ± rescue laxative
Placebo ± rescue laxative
COMPOSE-4 & -5
Response by SBM
6 Subpopulation 4 with different comparator
Naldemedine ± rescue laxative
Naloxegol ITC based on COMPOSE 1 & 2, KODIAC-4 & 5
Response by SBM
BM = bowel movement, LIR = laxative inadequate response, ITC = indirect treatment comparison, SBM = spontaneous bowel movement. *Note – outcomes refer to both arms unless otherwise stated. A frequency ≥3 per week in at least 3 weeks per 4-week cycle indicates a “responder”.
2.4 Clinical evidence
The company did not identify any evidence directly comparing naldemedine to
comparators naloxegol (NICE technology appraisal TA345) or methylnaltrexone for
treating OIC. As such, the company conducted an indirect treatment comparison
(ITC) of:
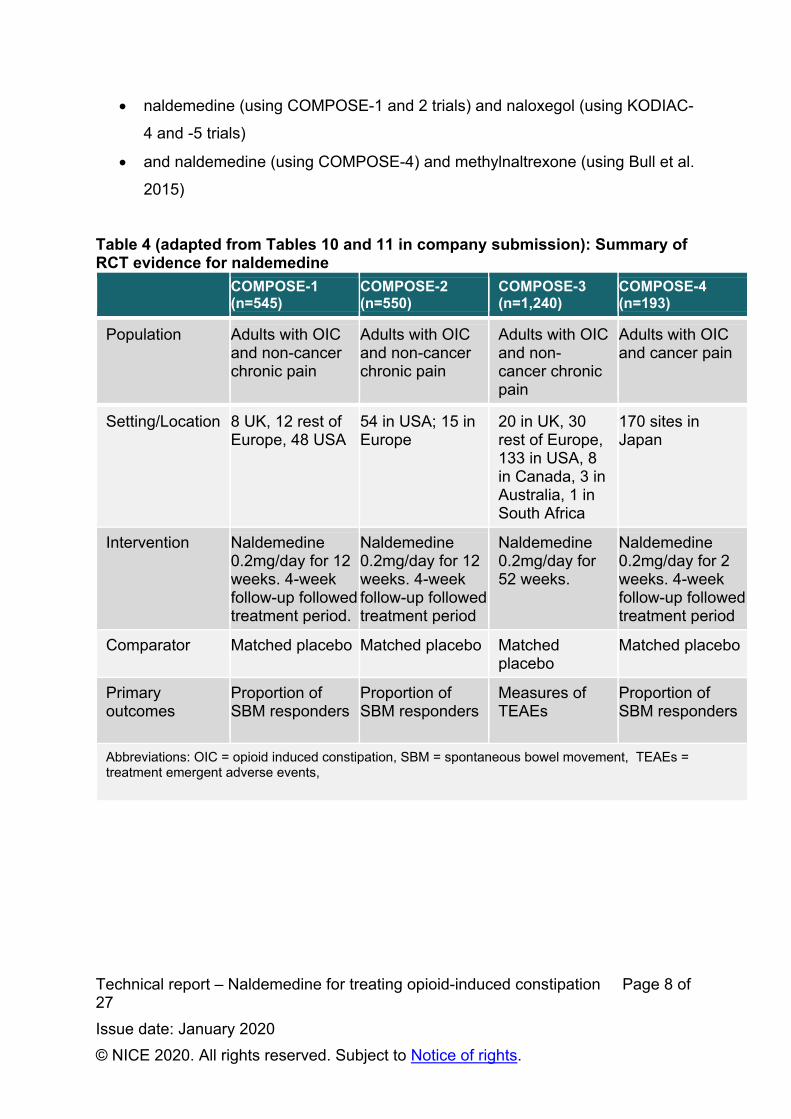
Technical report – Naldemedine for treating opioid-induced constipation Page 8 of 27
Issue date: January 2020
© NICE 2020. All rights reserved. Subject to Notice of rights.
naldemedine (using COMPOSE-1 and 2 trials) and naloxegol (using KODIAC-
4 and -5 trials)
and naldemedine (using COMPOSE-4) and methylnaltrexone (using Bull et al.
2015)
Table 4 (adapted from Tables 10 and 11 in company submission): Summary of RCT evidence for naldemedine
COMPOSE-1 (n=545)
COMPOSE-2 (n=550)
COMPOSE-3 (n=1,240)
COMPOSE-4 (n=193)
Population Adults with OIC and non-cancer chronic pain
Adults with OIC and non-cancer chronic pain
Adults with OIC and non-cancer chronic pain
Adults with OIC and cancer pain
Setting/Location 8 UK, 12 rest of Europe, 48 USA
54 in USA; 15 in Europe
20 in UK, 30 rest of Europe, 133 in USA, 8 in Canada, 3 in Australia, 1 in South Africa
170 sites in Japan
Intervention Naldemedine 0.2mg/day for 12 weeks. 4-week follow-up followed treatment period.
Naldemedine 0.2mg/day for 12 weeks. 4-week follow-up followed treatment period
Naldemedine 0.2mg/day for 52 weeks.
Naldemedine 0.2mg/day for 2 weeks. 4-week follow-up followed treatment period
Comparator Matched placebo Matched placebo Matched placebo
Matched placebo
Primary outcomes
Proportion of SBM responders
Proportion of SBM responders
Measures of TEAEs
Proportion of SBM responders
Abbreviations: OIC = opioid induced constipation, SBM = spontaneous bowel movement, TEAEs = treatment emergent adverse events,
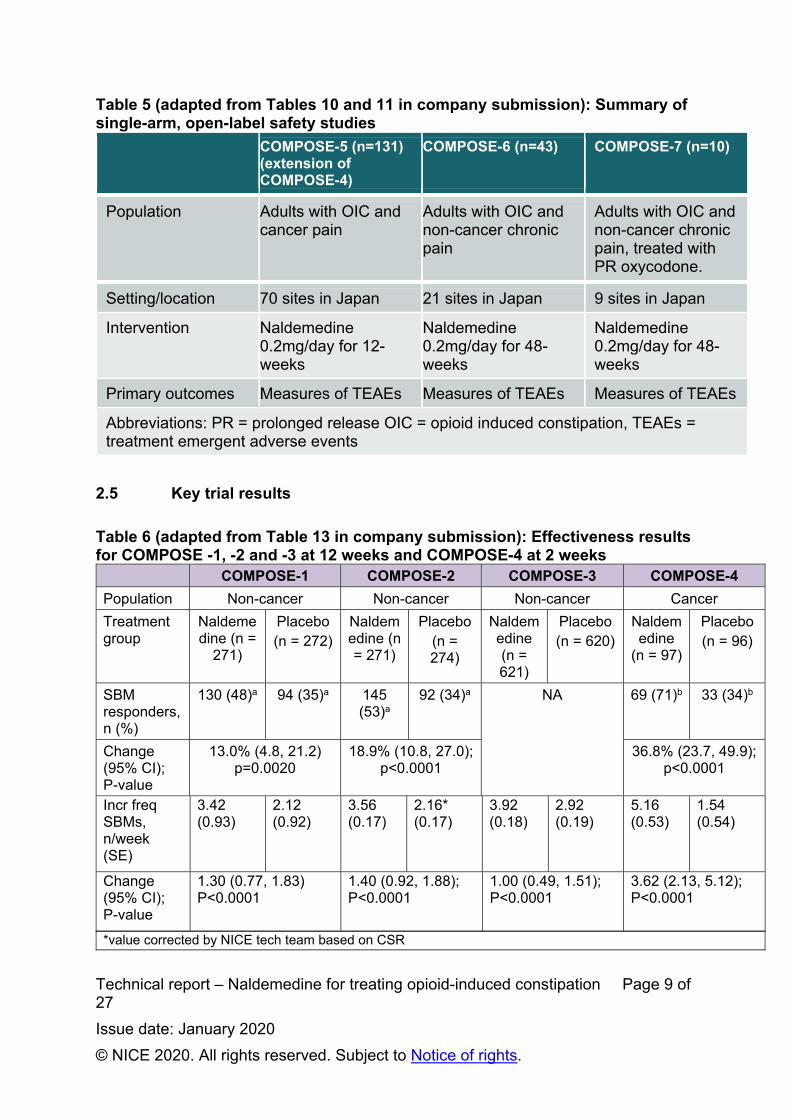
Technical report – Naldemedine for treating opioid-induced constipation Page 9 of 27
Issue date: January 2020
© NICE 2020. All rights reserved. Subject to Notice of rights.
Table 5 (adapted from Tables 10 and 11 in company submission): Summary of single-arm, open-label safety studies
COMPOSE-5 (n=131) (extension of COMPOSE-4)
COMPOSE-6 (n=43) COMPOSE-7 (n=10)
Population Adults with OIC and cancer pain
Adults with OIC and non-cancer chronic pain
Adults with OIC and non-cancer chronic pain, treated with PR oxycodone.
Setting/location 70 sites in Japan 21 sites in Japan 9 sites in Japan
Intervention Naldemedine 0.2mg/day for 12-weeks
Naldemedine 0.2mg/day for 48-weeks
Naldemedine 0.2mg/day for 48-weeks
Primary outcomes Measures of TEAEs Measures of TEAEs Measures of TEAEs
Abbreviations: PR = prolonged release OIC = opioid induced constipation, TEAEs = treatment emergent adverse events
2.5 Key trial results
Table 6 (adapted from Table 13 in company submission): Effectiveness results for COMPOSE -1, -2 and -3 at 12 weeks and COMPOSE-4 at 2 weeks
COMPOSE-1 COMPOSE-2 COMPOSE-3 COMPOSE-4
Population Non-cancer Non-cancer Non-cancer Cancer
Treatment group
Naldemedine (n =
271)
Placebo (n = 272)
Naldemedine (n = 271)
Placebo (n = 274)
Naldemedine (n = 621)
Placebo (n = 620)
Naldemedine
(n = 97)
Placebo (n = 96)
SBM responders, n (%)
130 (48)a 94 (35)a 145 (53)a
92 (34)a NA 69 (71)b 33 (34)b
Change (95% CI); P-value
13.0% (4.8, 21.2) p=0.0020
18.9% (10.8, 27.0); p<0.0001
36.8% (23.7, 49.9); p<0.0001
Incr freq SBMs, n/week (SE)
3.42 (0.93)
2.12 (0.92)
3.56 (0.17)
2.16* (0.17)
3.92 (0.18)
2.92 (0.19)
5.16 (0.53)
1.54 (0.54)
Change (95% CI); P-value
1.30 (0.77, 1.83) P<0.0001
1.40 (0.92, 1.88); P<0.0001
1.00 (0.49, 1.51); P<0.0001
3.62 (2.13, 5.12); P<0.0001
*value corrected by NICE tech team based on CSR
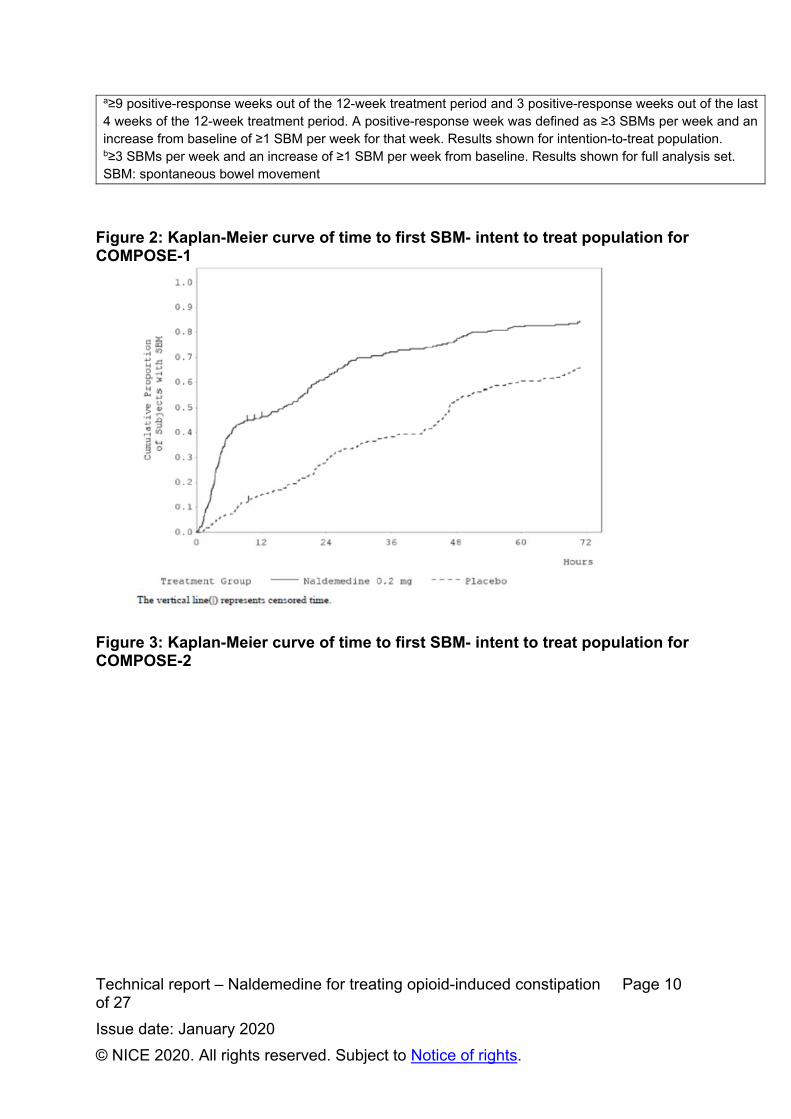
Technical report – Naldemedine for treating opioid-induced constipation Page 10 of 27
Issue date: January 2020
© NICE 2020. All rights reserved. Subject to Notice of rights.
a≥9 positive-response weeks out of the 12-week treatment period and 3 positive-response weeks out of the last 4 weeks of the 12-week treatment period. A positive-response week was defined as ≥3 SBMs per week and an increase from baseline of ≥1 SBM per week for that week. Results shown for intention-to-treat population. b≥3 SBMs per week and an increase of ≥1 SBM per week from baseline. Results shown for full analysis set. SBM: spontaneous bowel movement
Figure 2: Kaplan-Meier curve of time to first SBM- intent to treat population for COMPOSE-1
Figure 3: Kaplan-Meier curve of time to first SBM- intent to treat population for COMPOSE-2

Technical report – Naldemedine for treating opioid-induced constipation Page 11 of 27
Issue date: January 2020
© NICE 2020. All rights reserved. Subject to Notice of rights.
2.6 Model structure
Two components to the decision-analytical model:
Decision-tree structure for first 4 weeks of treatment for response
assessment
Markov structure after 4 weeks of treatment
o Cycle length of 4 weeks
o Time horizon up to a maximum of 5 years
o Patients enter the Markov model at either OIC or non-OIC (on
treatment) health states
Figure 4 (adapted from Figure 23 in company submission): Decision-tree
structure for first model cycle
Patients with OIC/mixed OIC
previously treated with laxative
Naldemedine treatment
OIC (non-responder)
Non-OIC (responder)
Comparator treatment
OIC (non-responder)
WEEK 0 WEEK 4
Non-OIC (responder)

Technical report – Naldemedine for treating opioid-induced constipation Page 12 of 27
Issue date: January 2020
© NICE 2020. All rights reserved. Subject to Notice of rights.
Figure 5: Markov model from second model cycle
OIC= <3 SBMs per week in at least 2 of the weeks per 4-week cycle Non- OIC= ≥3 SBMs per week in at least 3 of the weeks per 4-week cycle. 2.7 Key model assumptions
The company has defined 6 subpopulations (referred to by the company as
‘scenarios’). The company originally presented subpopulations 1, 2 and 3 and added
0, 4 and 5 after clarification. using different datasets to inform model parameters and
different outcomes, see Table 3. The ERG also implemented an additional
subpopulation 6, which was a variant of subpopulation 4, and compares
naldemedine to naloxegol in cancer patients.
Table 8 (adapted from Table 37 in company submission): Assumptions used in economic model
Variable Assumption Justification
Maintenance of response extrapolation
Treatment response is maintained beyond the period observed in the pivotal trials.
COMPOSE-3; no loss of effect by week 52.
Discontinuation 1. If patients have not responded by Week 4, they discontinue;
2. The first time a patient loses response, they discontinue;
Having discontinued; patients will not resume therapy.
NICE technology appraisal 345 (Naloxegol for treating opioid-induced constipation)
OIC Non-OIC
(on treatment)
Death Non-OIC
(untreated)
A
B
C

Technical report – Naldemedine for treating opioid-induced constipation Page 13 of 27
Issue date: January 2020
© NICE 2020. All rights reserved. Subject to Notice of rights.
Treatment in non-OIC (treated) health state
Assigned treatment is maintained in responders
When therapeutic effect maintained, patients remain on treatment. NICE technology appraisal 345 (Naloxegol for treating opioid-induced constipation)
Variable course of OIC The patient experience of OIC is variable, with transition between the OIC and non-OIC states over time
NICE technology appraisal 345 (Naloxegol for treating opioid-induced constipation), placebo arm analysis of COMPOSE-1, -2, & -3
Maintenance of naloxegol 25mg response beyond MTC endpoint (4-week SBMs)
Response maintained on naloxegol 25mg in proportion to the rate for naldemedine, adjusted for RR of response on treatments at Week 4
NICE technology appraisal 345 (Naloxegol for treating opioid-induced constipation)
Abbreviations: OIC = opioid-induced constipation, SBMs = spontaneous bowel movements, RR = risk ratio, MTC = mixed treatment comparison
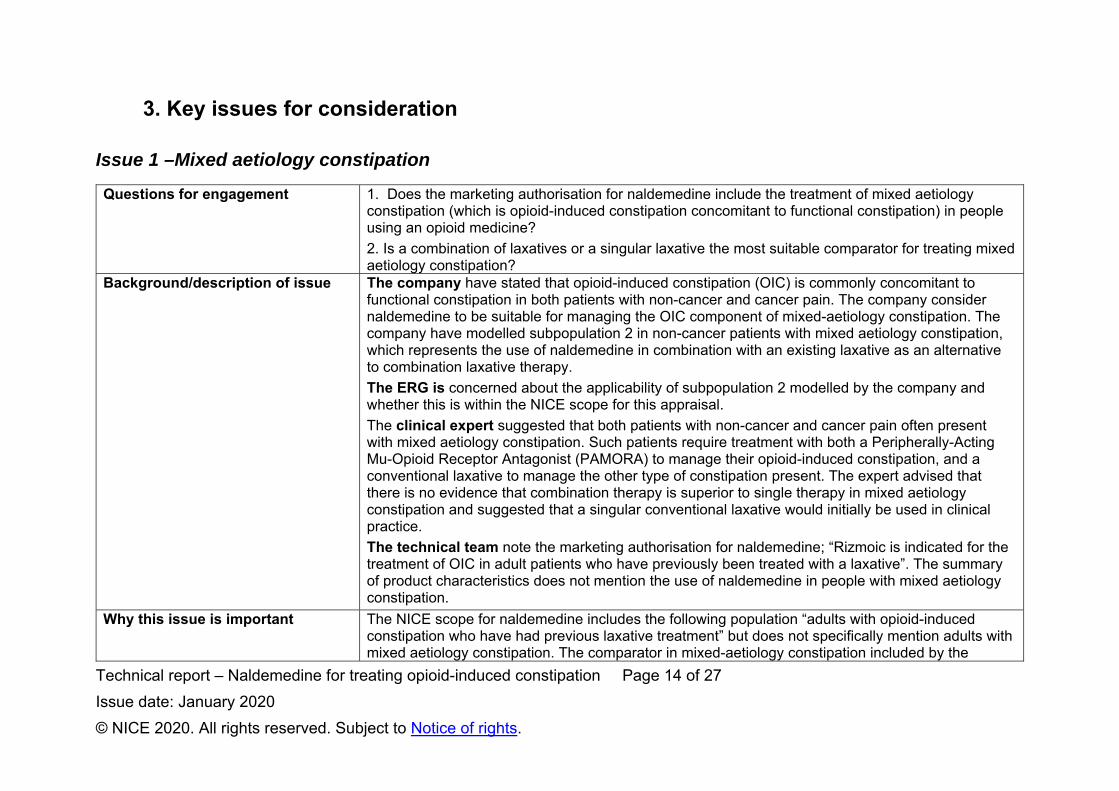
Technical report – Naldemedine for treating opioid-induced constipation Page 14 of 27
Issue date: January 2020
© NICE 2020. All rights reserved. Subject to Notice of rights.
3. Key issues for consideration
Issue 1 –Mixed aetiology constipation
Questions for engagement 1. Does the marketing authorisation for naldemedine include the treatment of mixed aetiology constipation (which is opioid-induced constipation concomitant to functional constipation) in people using an opioid medicine?
2. Is a combination of laxatives or a singular laxative the most suitable comparator for treating mixed aetiology constipation?
Background/description of issue The company have stated that opioid-induced constipation (OIC) is commonly concomitant to functional constipation in both patients with non-cancer and cancer pain. The company consider naldemedine to be suitable for managing the OIC component of mixed-aetiology constipation. The company have modelled subpopulation 2 in non-cancer patients with mixed aetiology constipation, which represents the use of naldemedine in combination with an existing laxative as an alternative to combination laxative therapy.
The ERG is concerned about the applicability of subpopulation 2 modelled by the company and whether this is within the NICE scope for this appraisal.
The clinical expert suggested that both patients with non-cancer and cancer pain often present with mixed aetiology constipation. Such patients require treatment with both a Peripherally-Acting Mu-Opioid Receptor Antagonist (PAMORA) to manage their opioid-induced constipation, and a conventional laxative to manage the other type of constipation present. The expert advised that there is no evidence that combination therapy is superior to single therapy in mixed aetiology constipation and suggested that a singular conventional laxative would initially be used in clinical practice.
The technical team note the marketing authorisation for naldemedine; “Rizmoic is indicated for the treatment of OIC in adult patients who have previously been treated with a laxative”. The summary of product characteristics does not mention the use of naldemedine in people with mixed aetiology constipation.
Why this issue is important The NICE scope for naldemedine includes the following population “adults with opioid-induced constipation who have had previous laxative treatment” but does not specifically mention adults with mixed aetiology constipation. The comparator in mixed-aetiology constipation included by the

Technical report – Naldemedine for treating opioid-induced constipation Page 15 of 27
Issue date: January 2020
© NICE 2020. All rights reserved. Subject to Notice of rights.
company is a combination laxative therapy, however it is not clear in clinical practice whether a combination or singular laxative would be used for initial treatment. Therefore, the comparator arm of the model may not represent clinical practice.
Technical team preliminary judgement and rationale
The MA for naldemedine does not mention that it cannot be used in people with mixed aetiology constipation, so it is an appropriate subpopulation to include in the appraisal. It is not clear whether the comparator (combination laxative therapy) modelled by the company for this subpopulation is appropriate, and therefore further clinical input is required.
Issue 2- Treatment pathway
Questions for engagement 3. Is the positioning of naldemedine in the treatment pathway clear?
4. What definition of laxative inadequate response (LIR) has been and should be included in the model?
Background/description of issue The company state that the marketing authorisation permits naldemedine to be used in all OIC laxative refractory patients, regardless of the reason for switching laxative which could include tolerability or adherence. The company indicated that naldemedine is also suitable for patients with OIC and LIR. Laxative refractory includes LIR patients. The company note that naloxegol (technology appraisal 345) can only be used in patients with OIC and LIR. The company have used different definitions of LIR in their submission:
In COMPOSE -1 and -2 studies as “subjects on laxative therapy (with ≥ 1 product) prior to entering the study and who stopped its use within 30 days prior to screening”.
European Medicines Agency (EMA) guideline definition of LIR, which states that a patient “should have confirmed insufficient response to laxative treatment with at least two drug substances belonging to different classes used in the treatment of constipation by history taking”.
The ERG notes that the definition of LIR used in the COMPOSE -1 and -2 studies appears to be the same as the definition for laxative refractory patients.
The ERG also notes that the definition of LIR used in the COMPOSE studies does not align with the KODIAC 4 and 5 studies used in the ITCs for subpopulations 3 and 6:

Technical report – Naldemedine for treating opioid-induced constipation Page 16 of 27
Issue date: January 2020
© NICE 2020. All rights reserved. Subject to Notice of rights.
KODIAC definition of LIR: using 1 laxative class for ≥4 days of the 14 days prior to screening and reporting moderate, severe, or very severe symptoms in ≥1 of 4 stool symptom domains.
The technical team note that the company positioning of naldemedine for both laxative refractory and LIR patients is not clear based on the treatment pathway provided by the company in response to clarification. The technical team are unclear on which definition of LIR which has been included in the model and on what the difference between laxative refractory and LIR is.
Why this issue is important The company are positioning naldemedine as a treatment option for OIC in both laxative refractory and LIR patients, however the distinction between these groups is not clear.
Technical team preliminary judgement and rationale
The technical team note that further clarification is required from the company on the treatment pathway and on which definition of LIR has been used in the model.
Issue 3 – Subpopulations to be considered
Questions for engagement 5. Should the naldemedine and comparator arm include rescue medication or not?
6. Should subpopulation 4 include all patients on naldemedine or be restricted to those patients with a laxative inadequate response (LIR)?
Background/description of issue Rescue medication
Rescue bisacodyl was used as proxy for second laxative treatment in the comparator arm of the economic model. All COMPOSE trials permitted the use of rescue laxatives.
The company reports cost-effectiveness results for a subset of patients who used naldemedine without rescue laxative for subpopulations 1, 2 and 3. In response to the request at clarification, the company presented subpopulation 0, which is a revised version of subpopulation 1 including all patients in both arms from COMPOSE -1 and -2 trials regardless of rescue medication use. The company did not submit similar revised analyses for subpopulations 2 and 3.
The ERG notes that it is highly unlikely that in clinical practice patients will be told not to use rescue medication. As such, the ERG is concerned that subpopulations 2 and 3 do not use data from the appropriate population to inform the cost effectiveness analyses. The ERG also notes that for subpopulation 3, the company used the response rate for patients without rescue medication for the naloxegol group. The ERG concludes that subpopulation 0 in the revised company analysis does include now include data from the correct patient population.

Technical report – Naldemedine for treating opioid-induced constipation Page 17 of 27
Issue date: January 2020
© NICE 2020. All rights reserved. Subject to Notice of rights.
The clinical expert stated that clinicians would not routinely recommend patients to take rescue laxatives alongside a PAMORA, such as naldemedine. The expert emphasised that combined use of naldemedine with rescue laxatives would make it difficult to establish in clinical practice which treatment was linked to treatment response. Instead, the expert suggested that in clinical practice, patients would discontinue any existing laxative therapy and commence naldemedine monotherapy. If constipation were still to continue, then consideration would be given to adding in a regular (not rescue) conventional laxative. The expert acknowledged that there may some instances where rescue laxatives may be required, such as intermittent worsened constipation.
The technical team note that in the appraisal of naloxegol (technology appraisal 345), the committee concluded that the cost-effectiveness analysis without rescue bisacodyl was neither clinically relevant nor consistent with the KODIAC 4 and 5 trials. The technical team note that the inconsistencies in the patient selection between treatment arms, in relation to rescue medication use for subpopulations 1, 2, 4 and 6, breaks the randomisation of the trial data and introduces bias in these comparisons.
Laxative inadequate response (LIR)
In subpopulation 4, the company reports cost-effectiveness results in people with cancer pain with OIC and LIR for naldemedine compared with subcutaneous methylnaltrexone.
The ERG notes that in subpopulation 4, the naldemedine group was not restricted to patients with LIR, which was a requirement for treatment with the comparator - methylnaltrexone. The ERG suggests that subpopulation 4 did not include the correct patient population and that it is unclear if the comparator arm includes rescue treatment. As such, the ERG concludes that the cost-effectiveness result for this subpopulation is only indicative.
The ERG also noted that naloxegol was a potential comparator (as well as methylnaltrexone) for this subpopulation and reported an additional cost-effectiveness analysis (subpopulation 6) in which naldemedine was compared with naloxegol. The ERG note that this subpopulation was also not restricted to patients with LIR for the naldemedine group and although the naldemedine arm included all patients (including those with rescue treatment), it is unclear if the comparator arm was restricted to those without rescue treatment. The ERG concludes that the cost-effectiveness result for subpopulation 6 is also only indicative.
Why this issue is important The use of rescue medication may affect treatment response outcomes. The cost-effectiveness results of subpopulations 1, 2 and 3 may not be meaningful for decision-

Technical report – Naldemedine for treating opioid-induced constipation Page 18 of 27
Issue date: January 2020
© NICE 2020. All rights reserved. Subject to Notice of rights.
making, if rescue laxatives are used in clinical practice but such patients have been excluded in the analysis. In addition, breaking of randomisation in the source data for subpopulations 1 and 2 may invalidate these comparisons. The company’s base case ICER increases when subpopulation 1 is revised to include naldemedine patients who may or may not have used rescue laxatives (full trial population) from £8,444 per QALY gained to £11,716 per QALY gained.
For subpopulation 4, the analysis included all patients on naldemedine and not those just with LIR, therefore it is unclear what impact this may have on the ICER for this subpopulation. In addition, breaking of randomisation in the source data for this subpopulation may invalidate the comparison. For subpopulation 6, the ERG reported an ICER of £4,148 per QALY gained when compared to naloxegol.
Technical team preliminary judgement and rationale
The technical team note the clinical expert advice contradicts with the judgements made by the ERG and the committee at the time in TA345. It is unclear if rescue medication should be included without further clinical input and as a result whether the clinical data for subpopulations 1, 2, 3, 4 and 6 can be considered sufficient and relevant for decision-making. The technical team request that the company provides the ICERs for the remaining subpopulations with and without rescue laxative use for both treatment arms (see missing ICER values in Table 1: ERG and company ICERs).
Issue 4 – Indirect treatment comparisons
Questions for engagement 7. Is the indirect treatment comparison, comparing naldemedine to naloxegol acceptable for decision-making?
8. Is the indirect treatment comparison, comparing naldemedine to methylnaltrexone acceptable for decision-making?
Background/description of issue The company performed indirect treatment comparisons (ITCs) comparing:
naldemedine (using pooled data from COMPOSE-1 and -2 trials) and naloxegol (using KODIAC-4 and -5 studies)
Response rates (SBM) were reported at weeks 4 and 12.
These were used to inform subpopulations 3 (non-cancer patients) and 6 (cancer patients).

Technical report – Naldemedine for treating opioid-induced constipation Page 19 of 27
Issue date: January 2020
© NICE 2020. All rights reserved. Subject to Notice of rights.
The company also performed an ITC comparing:
naldemedine (using data from COMPOSE-4) and methylnaltrexone (using data from Bull et al. 2015).
Response rates (SBM) were reported at week 2.
This was used to inform subpopulation 4.
The ERG stated that it was not clear how data from the COMPOSE-1 and -2 or KODIAC -4 and -5 trials were pooled. The ERG checked these ITC calculations and could not reproduce the reported results for week 4. The ERG also stated that it was not clear on the statistical methods used to combine outcomes from the COMPOSE-4 and Bull et al. 2015 studies. The ERG was also unclear as to which endpoint from the Bull et al. 2015 study has been combined with the outcomes from the COMPOSE-4 study to produce the hazard ratio used in the model. Following the company response to clarification, the ERG is still unable to assess the appropriateness of the ITC analyses or verify the ITC results. The ERG is concerned about potential differences between naldemedine and naloxegol trials in terms of baseline comparability in SBMs, opioid use and different definitions of OIC as well as differences regarding treatment response to laxatives. The ERG suggests that the results of the ITCs should be interpreted with caution.
Why this issue is important The results from the ITCs may not accurately reflect the effectiveness of naldemedine in comparison to naloxegol or methylnaltrexone. It is unclear what impact this may have on the ICERs for subpopulations 3,4 and 6.
Technical team preliminary judgement and rationale
It is not clear if the ITCs are acceptable for decision-making. Therefore, it would be helpful if the company could clarify the methods used to combine data in all ITCs and provide the input data for each study.
Issue 5 – Generalisability of COMPOSE trials
Questions for engagement 9. The COMPOSE-4 trial (as well as COMPOSE -5, -6 and -7 open label studies) was conducted in Japan. Are there any genetic, cultural, healthcare setting or other differences between Japan and UK that would limit the applicability of these studies to UK clinical practice?
10. Please refer to Table 9 below on opioid use and bowel movements at baseline for COMPOSE -1, -2 and -3 trials in non-cancer patients. Are the baseline characteristics in the table reflective of England?

Technical report – Naldemedine for treating opioid-induced constipation Page 20 of 27
Issue date: January 2020
© NICE 2020. All rights reserved. Subject to Notice of rights.
11. Would naldemedine be expected to have equal effectiveness for treating OIC in patients with cancer related pain compared with non-cancer related pain?
Background/description of issue COMPOSE-1, -2 and -3 are multinational trials in patients with non-cancer pain and the majority of treatment sites were in the USA. Both COMPOSE-1 and -3 trials included sites in the UK, each with 29 and 57 UK participants respectively. The COMPOSE-4 trial in patients with cancer pain was conducted in Japan.
The company report:
Table 9 (adapted from Table 11 in company submission): RCT baseline characteristics
COMPOSE-1 COMPOSE-2 COMPOSE-3Population Non-cancer Non-cancer Non-cancerTreatment group Naldemedine
(n=273)Placebo (n=272)
Naldemedine (n=276)
Placebo (n=274)
Naldemedine (n=621)
Placebo (n=619)
Bowel movements n (SD) Mean SBMs/wk Mean CSBMs/wk Mean SBMs/wk without straining
1.3 (0.7)
0.4 (0.6) 0.1 (0.3)
1.3 (0.7) 0.4 (0.6) 0.1 (0.3)
1.2 (0.8) 0.4 (0.5) 0.1 (0.3)
1.2 (0.7) 0.4 (0.6) 0.1 (0.4)
1.59 (0.67)
1.62 (0.62)
Opioids used by >5% patients in study, n (%) Fentanyl Hydromorphone Methadone Morphine Oxycocet Oxycodone Tramadol Vicodin Others
271 (99.3)
21 (7.7) 12 (4.4) 9 (3.3)
69 (25.3) 66 (24.2) 107 (37.7)
18 (6.6) 79 (28.9) 27 (9.9)
272 (100)
24 (8.8) 20 (7.4) 16 (5.8) 67 (24.6) 59 (21.7)
105 (38.6)13 (4.8) 71 (26.1) 22 (8.1)
271 (98.2)
36 (13.0) 24 (8.7) 17 (6.2)
64 (23.2) 62 (22.5) 78 (28.2) 14 (5.1)
88 (31.9) 21 (7.6)
274 (100)
37 (13.5) 12 (4.4) 17 (6.2) 63 (23.0) 52 (19.0)
100 (36.2)18 (6.6) 91 (33.2) 25 (9.1)
621 (100)
90 (14.5) 55 (8.9) 44 (7.1)
193 (31.1) 118 (19.0) 189 (30.4)
57 (9.2) 232 (37.4) 81 (13.0)
619 (100)
95 (15.3) 35 (5.7) 50 (8.1)
198 (31.9) 131 (21.1) 172 (27.8)
45 (7.3) 244 (39.4) 76 (12.3)

Technical report – Naldemedine for treating opioid-induced constipation Page 21 of 27
Issue date: January 2020
© NICE 2020. All rights reserved. Subject to Notice of rights.
Baseline characteristics: there are no statistically significant differences between any of the baseline characteristics from the UK compared to the overall ITT cohorts in their trials.
The ERG report:
UK setting: concerns about applicability of the trials to a UK setting, particularly for cancer patients for which COMPOSE-4 was conducted in Japan.
Baseline characteristics: participants in the COMPOSE-1, -2 and -3 trials were generally reflective of the UK population. However, the ERG noted that the populations in these trials may be more severe than those seen in the UK, based on clinical opinion on bowel movements at baseline. The ERG clinical expert also noted that there may be differences in the breakdown of the use of opioids in the COMPOSE trials and UK clinical practice.
The clinical expert suggested:
UK setting: Japanese patients would not respond any differently in terms of treatment response to PAMORAs and that the nature of OIC is not different in Japanese patients compared with a UK population. The expert suggested it was therefore reasonable to extrapolate the data to the UK population.
Cancer/non-cancer pain: there is no evidence that OIC is in any way different in patients with cancer pain than in patients with non-cancer pain, so there would not be a difference in terms of treatment effectiveness between these populations.
Baseline characteristics: in relation to bowel movements at baseline for COMPOSE-1, -2 and -3, the expert commented that these figures did not seem unusual for what would be expected in non-cancer patients. In relation to opioid use, the expert suggested that more patients in the UK would likely be on morphine and tramadol, whilst oxycodone use would be less. However, the expert suggested that differences in opioid use is not of key importance, since constipation was prevalent in all patients included in the COMPOSE trials.
The technical team note that for the appraisal of naloxegol (NICE technology appraisal TA345), it was considered that naloxegol would be equally effective in people with non-cancer and cancer pain. The summary of product characteristics for naldemedine states that “the efficacy and safety of naldemedine has been established in patients with chronic non-cancer pain and OIC and in patients with cancer and OIC”.

Technical report – Naldemedine for treating opioid-induced constipation Page 22 of 27
Issue date: January 2020
© NICE 2020. All rights reserved. Subject to Notice of rights.
Why this issue is important UK setting and baseline characteristics: The differences in the cultural, genetic and baseline characteristics of patients in the COMPOSE trials may affect the generalisability of the results to the expected population in the NHS in England.
Cancer/non-cancer pain: If there are differences between patients with non-cancer and cancer pain this may limit the effectiveness and use of naldemedine in clinical practice and in this appraisal. If OIC is considered to be the same in non-cancer and cancer patients, then this may mean trials in non-cancer patients could be relevant for cancer subpopulations. It would also mean that the treatment pathway for naldemedine would be the same for all patients, irrespective of the nature of the pain.
Technical team preliminary judgement and rationale
OIC can be considered the same in non-cancer and cancer patients. Only 2 COMPOSE trials in patients with non-cancer pain included patients from UK sites, but differences in baseline characteristics and geography are unlikely to influence the relative treatment effect of naldemedine.
Issue 6 – Extrapolation of treatment response
Questions for engagement 12. Are the justifications for the distributions chosen for modelling treatment response acceptable?
13. Is the lognormal or Gompertz distribution more appropriate in subpopulations 0 and 3?
Background/description of issue The time horizon of the company model is 5 years, so the treatment response needs to be extrapolated beyond the observed time period for the trials. The probabilities for transition A [from non-OIC (on treatment) to OIC], indicating loss of treatment response, were based on extrapolated time-to-event data from the relevant trials outlined in Table 3: Subpopulations modelled by company.
Company base-case ERG preferred base-case
Subpopulation 0 Lognormal distribution Gompertz distribution
Subpopulation 1 Lognormal distribution Lognormal distribution
Subpopulation 2 Exponential distribution Exponential distribution
Subpopulation 3 Lognormal distribution Gompertz distribution
Subpopulation 4 Lognormal distribution Lognormal distribution
Subpopulation 5 Lognormal distribution Lognormal distribution

Technical report – Naldemedine for treating opioid-induced constipation Page 23 of 27
Issue date: January 2020
© NICE 2020. All rights reserved. Subject to Notice of rights.
*bold = differences between company and ERG preferred curves
The company use a lognormal distribution for the extrapolated survival curves for transition A in all scenarios except subpopulation 2, for which an exponential distribution is used.
The ERG note that the various sets of extrapolated survival curves provided by the company varied in their correctness, completeness and explanation of underlying methodology for all the different scenarios. The ERG agree with the company for the curves used for subpopulations 1, 2, 4 and 5 but concluded that the Gompertz model was more appropriate for subpopulations 0 and 3. The Gompertz curve is more appropriate because it aligns with clinical opinion which suggests that loss of response is likely to plateau at a certain level, at which point a significant proportion of people will still maintain their response to treatment over time.
The technical team note that the clinical plausibility of time-to-event curves were not externally validated by the company, and therefore there is uncertainty in the all of the extrapolations.
Why this issue is important The choice of distribution for the subpopulations is likely to impact the ICERs, as seen for subpopulations 0 and 3. Using the Gompertz distribution:
Subpopulation 0 - the ICER increases from £11,716 in the company base case to £11,939.
Subpopulation 3 - the ICER decreases from £10,134 in the company base case to £4,989
Technical team preliminary judgement and rationale
It is not clear which distributions result in clinically plausible estimates of treatment response. The technical team request that the company provides external validation of the parametric curve extrapolations.

Technical report – Naldemedine for treating opioid-induced constipation Page 24 of 27
Issue date: January 2020
© NICE 2020. All rights reserved. Subject to Notice of rights.
4. Issues for information
Tables 10 to 12 are provided to stakeholders for information only and not included in the technical report comments table provided.
Table 10: ERG and company assumptions and impact on the cost-effectiveness estimate
Alteration Technical team rationale ICER (if rescue tx should be included – issue 2)
ICER (If rescue tx should be excluded - issue 2)
Change from base case
Company base case (Subpopulation 0 & 1) − £11,716 £8,444 N/A
1. ERG use of a Gompertz distribution (instead of lognormal)
Technical team agreed with ERG’s amendment
£11,939 No ICER available
-£223
Company base case (Subpopulation 2) No changes No ICER
available £8,959 N/A
Company base case (Subpopulation 3) − No ICER
available £10,134 N/A
1. ERG use of a Gompertz distribution (instead of lognormal)
Technical team agreed with ERG’s amendment. Note: uncertainty in the applicability of the ITC.
No ICER available
£4,989 - £5,145
Company base case (Subpopulation 4)
No changes. Note: indicative only - population in model not restricted to LIR and unclear if comparator arm includes rescue treatment (all patients included in naldemedine arm). Note: uncertainty in the applicability of the ITC.
Naldemedine is dominant
N/A
ERG subpopulation 6 (Subpopulation 4 with different comparator)
No changes. Note: indicative only - population in model not restricted to
£4,148 N/A

Technical report – Naldemedine for treating opioid-induced constipation Page 25 of 27
Issue date: January 2020
© NICE 2020. All rights reserved. Subject to Notice of rights.
Alteration Technical team rationale ICER (if rescue tx should be included – issue 2)
ICER (If rescue tx should be excluded - issue 2)
Change from base case
LIR and unclear if comparator arm includes rescue treatment (all patients included in naldemedine arm). Note: uncertainty in the applicability of the ITC.
Company base case (Subpopulation 5) No changes £8,579 No ICER
available N/A
Table 11: Outstanding uncertainties in the evidence base
Area of uncertainty Why this issue is important Likely impact on the cost-effectiveness estimate
Adverse event rates It is unclear to how the adverse event rates in the model were derived.
The ERG notes that the adverse events are associated with very low costs and small disutility, so the impact of changes in the percentage of adverse events on the ICER is very small.
Mortality rates It is not clear whether UK or USA specific mortality rates were used in the model.
Unknown but likely to be a small impact

Technical report – Naldemedine for treating opioid-induced constipation Page 26 of 27
Issue date: January 2020
© NICE 2020. All rights reserved. Subject to Notice of rights.
Table 12: Other issues for information
Issue Comments
Adverse events A higher occurrence of gastrointestinal adverse events occurred in patients taking naldemedine compared with those receiving placebo in the COMPOSE trials. The company state that no deaths in either treatment group across the COMPOSE trials were considered to be related to the study drug. The derivation of adverse event rates used in the economic model is unclear to the ERG.
Innovation The company considers naldemedine to be innovative in relation to its permanent binding capacity and higher receptor affinity compared with other PAMORAs. However, the technical team considers that all relevant benefits associated with the drug are adequately captured in the model.
Equality considerations No equalities issues were identified by the company.
Duration of exposure to OIC The technical team note that there may be an externally imposed time-limit for cancer treatment which may shorten the duration of exposure to OIC to less than 5 years. It is unclear whether this has been factored into the model and whether it may be possible to undertake a scenario analysis, to determine any impact of reduced exposure to OIC on the ICERs for the cancer subpopulations. `

Technical report – Naldemedine for treating opioid-induced constipation Page 27 of 27
Issue date: January 2020
© NICE 2020. All rights reserved. Subject to Notice of rights.
Authors
Peter Selby
Appraisal committee chair
Anita Sangha
Technical lead
Alexandra Filby
Technical adviser
Frances Sutcliffe
Associate director
With input from the lead team:
Mike Chambers
Lead team member
Mudasar Mushtaq
Lead team member
Ugochi Nwulu
Lead team member

Technical engagement response form Naldemedine for treating opioid-induced constipation [ID1189] 1 of 14
Technical engagement response form
Naldemedine for treating opioid-induced constipation [ID1189]
As a stakeholder you have been invited to comment on the technical report for this appraisal. The technical report and stakeholders’ responses are used by the appraisal committee to help it make decisions at the appraisal committee meeting. Usually, only unresolved or uncertain key issues will be discussed at the meeting. We need your comments and feedback on the questions below. You do not have to answer every question. The text boxes will expand as you type. Please read the notes about completing this form. We cannot accept forms that are not filled in correctly. Your comments will be summarised and used by the technical team to amend or update the scientific judgement and rationale in the technical report. Deadline for comments: 5pm on Friday 14 February 2020. Thank you for your time. Please log in to your NICE Docs account to upload your completed form, as a Word document (not a PDF). Notes on completing this form
Please see the technical report which summarises the background and submitted evidence. This will provide context and describe the questions below in greater detail.
Please do not embed documents (such as PDFs or tables) because this may lead to the information being mislaid or make the response unreadable. Please type information directly into the form.
Do not include medical information about yourself or another person that could identify you or the other person. Do not use abbreviations. Do not include attachments such as journal articles, letters or leaflets. For copyright reasons, we will have to return forms that have attachments
without reading them. You can resubmit your form without attachments, but it must be sent by the deadline. If you provide journal articles to support your comments, you must have copyright clearance for these articles. Combine all comments from your organisation (if applicable) into 1 response. We cannot accept more than 1 set of comments from each
organisation. Please underline all confidential information, and separately highlight information that is submitted under ‘commercial in confidence’ in turquoise,
all information submitted under ‘academic in confidence’ in yellow, and all information submitted under ‘depersonalised data’ in pink. If confidential

Technical engagement response form Naldemedine for treating opioid-induced constipation [ID1189] 2 of 14
information is submitted, please also send a second version of your comments with that information replaced with the following text: ‘academic/commercial in confidence information removed’. See the Guide to the processes of technology appraisal (sections 3.1.23 to 3.1.29) for more information.
We reserve the right to summarise and edit comments received during engagement, or not to publish them at all, if we consider the comments are too long, or publication would be unlawful or otherwise inappropriate. Comments received during engagement are published in the interests of openness and transparency, and to promote understanding of how recommendations are developed. The comments are published as a record of the comments we received, and are not endorsed by NICE, its officers or advisory committees.
About you
Your name XXXXXXXXXXXXXXXXX
Organisation name – stakeholder or respondent (if you are responding as an individual rather than a registered stakeholder please leave blank)
Shionogi BV
Disclosure Please disclose any past or current, direct or indirect links to, or funding from, the tobacco industry.
None
Technical engagement response form Naldemedine for treating opioid-induced constipation [ID1189] 3 of 14
Questions for engagement
Issue 1: Mixed aetiology constipation
1. Does the marketing authorisation for naldemedine include the treatment of mixed aetiology constipation (which is opioid-induced constipation concomitant to functional constipation) in people using an opioid medicine?
Mixed aetiology constipation is not a specific licence indication for any anti-constipation agent. Thus,
the SmPC for naldemedine does not specify this explicitly. Where OIC is present naldemedine can be
used as per its licence with no specific exclusion and the SmPC indicates that naldemedine can be
used with or without laxatives. Clinical expert opinion indicates that naldemedine can be used in the
context of mixed aetiology constipation to treat the OIC component where patients are receiving opioid
analgesia. Indeed, clinical expert opinion recommends the combination use of naldemedine and
laxatives in patients where both OIC and functional constipation are present.
2. Is a combination of laxatives or a singular laxative the most suitable comparator for treating mixed aetiology constipation?
The 2018 UEG expert consensus statement(1) recommends clinicians to ‘Consider combination
standard laxatives’ in the pathway of managing mixed aetiology constipation, where initial laxative
therapy has been tried.
Issue 2: Treatment pathway
3. Is the positioning of naldemedine in the treatment pathway clear?
The Company propose that naldemedine can be used at any point in the treatment pathway for OIC in
patients previously treated with a laxative due to the consistency of treatment effect in all
Technical engagement response form Naldemedine for treating opioid-induced constipation [ID1189] 4 of 14
subpopulations of the pivotal trial programme. This includes; laxative inadequate responders (LIR),
patients intolerant of laxatives (75% experience side-effects (2)), and those with mixed aetiology
constipation.
The introduction of naldemedine would offer an oral medicine with a single daily dose for all patients who
have previously been treated with a laxative, which considerably simplifies OIC management, because
naldemedine:
may be used with or without laxative(s);
requires no dose adjustment in any special population;(3)
may be taken with or without food and at any time of the day (preferably the same time every
day);(3) and
has demonstrated consistent clinical effects in all subpopulations.
Naldemedine’s clinical and cost-effectiveness profile lends itself to support patients who are
experiencing OIC despite being initiated with a laxative in either primary or secondary care.
Use of naldemedine during opioid analgesia for either cancer pain or chronic non-cancer pain greater
than one month duration could help simplify OIC management.
Initiation of eligible patients receiving opioid analgesia for longer than one month may have a
significant impact on healthcare resource and avoid inappropriate referral to gastroenterologists in
England & Wales.
4. What definition of laxative inadequate response (LIR) has been included in the model?
The definition of LIR used in the model is that pre-specified by the respective manufacturers of and
naldemedine and naloxegol in their clinical development programme.

Technical engagement response form Naldemedine for treating opioid-induced constipation [ID1189] 5 of 14
For naldemedine, LIR was defined as: “patients who, based on the concomitant medication records,
were on laxative therapy (with ≥1 agents) prior to entering the study and who stopped its use within 30
days prior to Visit 1 (Screening) [].” Defined in the COMPOSE Clinical Study Reports
For naloxegol, LIR was defined as opioid-induced constipation symptoms of at least moderate severity
in at least 1 of the 4 stool symptom domains (that is, incomplete bowel movement, hard stools,
straining or false alarms) while taking at least 1 laxative class for at least 4 days during the prior 2
weeks.
The Company would agree with the clinical expert opinion, that distinguishing LIR between these
definitions is difficult in clinical practice, thus the company would recommend that naldemedine be
used within its marketing authorisation i.e. for patients who have previously been treated with laxatives.
This was granted by the CHMP of the EMA upon the demonstration of clinical efficacy in both LIR and
non-LIR patients in the pooled analysis of the COMPOSE-1 and -2 studies(4), consistent requirements
set out by the EMA in 2015 for obtaining marketing authorisation in OIC. (5)
Issue 3: Subpopulations to be considered
5. Should naldemedine and comparator arms include rescue medication or not?
The company agree that best practice with respect to economic modelling includes use of the ITT
populations from pivotal RCTs in order to maintain the important principal of randomisation, itself
intended to avoid substantial bias.
However, clinical expert opinion agrees that the availability of rescue medication in the COMPOSE
studies was ethically necessary to prevent placebo patients having no access to an active treatment

Technical engagement response form Naldemedine for treating opioid-induced constipation [ID1189] 6 of 14
for OIC, but in itself does not represent a standard of care (SoC) in the UK. Indeed, the majority of
guidelines recommend the use of regular laxatives in the management of OIC.
With this in mind, the Company conducted a number of economic scenario analysis with and without
rescue medication in order to assist the Committee's decision making, summarised in Table 1.
Following Technical Engagement, we have supplied additional economic scenarios using clinical input
data from the ITT population of COMPOSE-3 (C-3). Scenario 2A, applies data from the whole C-3 ITT
population (response and transitions A, B & C) for which the ICER is £9,204 per QALY. Shionogi would
see this as a proxy for a comparison of naldemedine+SoC (± rescue) versus SoC (± rescue) in both
the OIC and mixed aetiology constipation (including OIC) clinical populations. Scenario 2B, applies
data from the stable laxative C-3 ITT sub-population (response and transitions A, B & C) for which the
ICER is £9,354 per QALY. Shionogi see this as a proxy for a comparison of naldemedine+stable
laxative (± rescue) versus stable laxative (± rescue) in the mixed aetiology constipation (including OIC)
clinical sub-population. As the stable laxative designation was determined post hoc and not applied as
a stratification factor, this latter analysis could be susceptible to bias however, a generally similar
proportion of ITT subjects in the naldemedine group (50.2%) and in the placebo group (54.0%) were
on a stable laxative regimen during the study(6).
Furthermore, the Company have analysed the PAC-QOL change-from-baseline data for naldemedine
responders versus placebo responders in the C-3 ITT and stable laxative subgroup and found the
treatment effects in each case to not only be near-identical but also entirely consistent with our
argumentation for adoption of the treatment-health state specific utilities from TA345, in other
scenarios. (see Company appendix for details).

Technical engagement response form Naldemedine for treating opioid-induced constipation [ID1189] 7 of 14
6. Should subpopulation 4 include all patients on naldemedine or be restricted to those patients with a laxative inadequate response (LIR)?
The clinical data for naldemedine informing Scenario 4 were drawn from the COMPOSE-4 (C4) RCT,
conducted in patients receiving a stable daily dose of opioids for ≥2 weeks prior to screening and who
also had OIC. The diagnostic criteria for OIC were ≤5 spontaneous bowel movements (SBMs; a bowel
movement [BM] not induced by rescue-laxatives) and experiencing straining, incomplete evacuation,
and/or hard stools in ≥ 25% of all BMs during the 2 weeks prior to randomization. No criteria were set
for laxative inadequate response and thus the company did not have enough information to create LIR
subpopulation.
Clinician expert opinion suggests that naldemedine should offer comparable efficacy in non-cancer and
cancer patients alike thus as naldemedine has demonstrated effectiveness in both LIR and non-LIR
subgroups in the non-cancer COMPOSE-1 & -2 studies, the company believes the current results for
subpopulation 4 are generalisable to the equivalent UK clinical population.
Issue 4: Indirect treatment comparisons
7. Is the indirect treatment comparison, comparing naldemedine to naloxegol acceptable for decision-making?
The Company supports the findings of the indirect treatment comparisons (ITCs) presented in the
submission. We would re-iterate that the ITC published by Luthra et al (7) was both independent and
non-industry funded.
Furthermore, naldemedine is the only drug available for the treatment of OIC to have demonstrated
clinical benefit, symptom control and improved quality of life for up to 52 weeks(8). The company
believe this to be an important distinguishing point as OIC is considered a chronic condition aligned to
treatment with opioids of chronic or cancer pain.
Technical engagement response form Naldemedine for treating opioid-induced constipation [ID1189] 8 of 14
8. Is the indirect treatment comparison, comparing naldemedine to methylnaltrexone acceptable for decision-making?
The company considers the ITC presented to support their economic analysis as valid. There is limited
RCT data for subcutaneous methylnaltrexone and although this agent has some use in the palliative
care setting in the United Kingdom, the Institute have not made any determination as the marketing
authorisation holder has yet to submit an evidence dossier.
Issue 5: Generalisability of COMPOSE trials
9. The COMPOSE-4 trial (as well as COMPOSE -5, -6 and -7 open label studies) was conducted in Japan. Are there any genetic, cultural, healthcare setting or other differences between Japan and UK that would limit the applicability of these studies to UK clinical practice?
The EMA raised the same point in their Day 120 assessment report:
“It is agreed that irrespective of whether or not cancer is the underlying cause of pain, the constipation
caused by opioids used to treat the pain is comparable. It is further agreed that comparable
[pharmacokinetic] PK parameters were observed in healthy subjects of Japanese or US origin,
respectively, after similar doses of naldemedine. Further, race did not have clinically relevant impact on
the population PK model. Thus, it is considered justified that similar safety profiles of naldemedine may
be expected irrespective of race and presence of cancer and thus safety results obtained in the study
of cancer and OIC (in Japanese patients) may be extrapolated to other races.”
In addition, the following extracts are taken from the Rapporteurs Day 180 joint CHMP and PRAC
response assessment report Pages 41/42
“No specific study was conducted to directly investigate the effect of race on naldemedine
pharmacokinetics.
A comparison of naldemedine pharmacokinetics at doses ranging from 0.1 to 2 mg in the fasted state
was conducted between Japanese healthy subjects [] and US healthy subjects []. The effect of race []

Technical engagement response form Naldemedine for treating opioid-induced constipation [ID1189] 9 of 14
was also evaluated in population pharmacokinetic analysis. Population pharmacokinetic analysis of
naldemedine showed that CL/F of non-White was smaller than that of White; however, CL/F ratio of
non-White to White was only 0.870 and the effects of race on CL/F or AUC were small. Population
pharmacokinetic analysis of naldemedine showed that there were not statistically significant
pharmacokinetic differences between Japanese and non-Japanese.
No clinically meaningful differences in naldemedine pharmacokinetics were observed between White
and non-White subjects and among races. Hence, no dose adjustment is required based on race.”
“In conclusion, no clinically meaningful differences were observed in naldemedine pharmacokinetics by
body weight and BMI. No dose adjustment is required for body weight and BMI.”
10. Please refer to Table 9 below on opioid use and bowel movements at baseline for COMPOSE -1, -2 and -3 trials in non-cancer patients. Are the baseline characteristics in the table reflective of England?
The Company have tabulated the baseline demographic characteristics of the relevant pivotal studies
and that observed in a commissioned observational study of OIC the UK CPRD database.
For non-cancer patients receiving opioid analgesia,
and similarly, for patients with cancer receiving opioid analgesia,
COMPOSE-1a COMPOSE-2a KODIAC-04/05b CPRDc
Mean age (years) 53.4 53.5 53.3 56.8
Male, % 39.6% 39.5% 39.7% 39.7%

Technical engagement response form Naldemedine for treating opioid-induced constipation [ID1189] 10 of 14
Notes: a) (4), b) (9), c) (Appendix M June Company Initial Submission), d) (10), and e) (11)
The Company therefore contends that the baseline characteristics of both non-cancer patients and
cancer patients from clinical trials referred to in the submission are reflective of patients in clinical
practice in England.
11. Would naldemedine be expected to have equal effectiveness for treating OIC in patients with cancer related pain compared with non-cancer related pain?
The company would highlight the comments made in TA 345 regarding relevance to general clinical
practice in the NHS:
“The Committee heard from the clinical experts that the efficacy of naloxegol was not expected to be
affected by age or weight and concluded that the KODIAC 4 and 5 trials could be generalised to the
population seen in clinical practice in England. Having heard from the clinical experts that naloxegol
was likely to be effective in people with cancer and considering that the marketing authorisation did not
exclude people with cancer, the Committee was persuaded that naloxegol would be equally effective in
people with cancer pain. It concluded that its decision regarding the use of naloxegol in clinical practice
would also apply to people with cancer pain.”
The company has presented effectiveness data in patients with both cancer and non-cancer pain and
the results of the COMPOSE studies indicate that naldemedine is effective in both patient subgroups.
Issue 6: Extrapolation of treatment response
COMPOSE-4d COMPOSE-5d MNTXe CPRDc
Mean age (years) 64.2 63.5 65.3 67.1
Male, % 61.7% 56.5% 51.7% 52.2%

Technical engagement response form Naldemedine for treating opioid-induced constipation [ID1189] 11 of 14
12. Are the justifications for the distributions chosen for modelling treatment response acceptable?
The economic analysis demonstrated that in all scenarios, choice of survival distribution for loss of
treatment response had only a small impact on the incremental cost-effectiveness ratios.
13. Is the lognormal or Gompertz distribution more appropriate in subpopulations 0 and 3?
See above.
Table 1. Updated model outputs with additional scenarios (2a & 2b)

Technical engagement response form Naldemedine for treating opioid-induced constipation [ID1189] 12 of 14
References
1. Farmer AD, Drewes AM, Chiarioni G, De Giorgio R, O’Brien T, Morlion B, et al. Pathophysiology and management of opioid-induced
Scenario SubpopulationRescue treatment included
Rescue treatment excluded
0 Subpopulation 1 with rescue laxative for naldemed 11,939£ No ICER available
1- OIC- Previous laxative- Non-cancer patients
No ICER available
8,444£
2- Mixed aetiology (includes OIC)- Previous laxative- Non-cancer patients
No ICER available
8,959£
2a- OIC & mixed aetiology (includes OIC)- Previous laxative- Non-cancer patients
9,203£ No ICER available
2b Subpopulation 2 with ITT stable laxative subgroup 9,354£ No ICER available
3- OIC- Previous laxative + LIR- Non-cancer patients
No ICER available
4,989£
4- OIC- Previous laxative + LIR- Cancer patients
6 Subpopulation 4 with different comparator
5- OIC- Previous laxative- Cancer patients
8,579£ No ICER available
Naldemedine dominant
4,148£

Technical engagement response form Naldemedine for treating opioid-induced constipation [ID1189] 13 of 14
constipation: European expert consensus statement. United Eur Gastroenterol J [Internet]. 2019 Feb 14 [cited 2019 Feb 15];7(1):7–20.
Available from: http://journals.sagepub.com/doi/10.1177/2050640618818305
2. Emmanuel A, Johnson M, McSkimming P, Dickerson S. Laxatives Do Not Improve Symptoms of Opioid-Induced Constipation: Results of
a Patient Survey. Pain Med [Internet]. 2016 Oct 10;18(10):pnw240. Available from: http://www.ncbi.nlm.nih.gov/pubmed/28339544
3. SmPC Naldemedine. 2020. p. https://www.ema.europa.eu/en/documents/product-inf.
4. Hale M, Wild J, Reddy J, Yamada T, Arjona Ferreira JC. Naldemedine versus placebo for opioid-induced constipation (COMPOSE-1 and
COMPOSE-2): two multicentre, phase 3, double-blind, randomised, parallel-group trials. Lancet Gastroenterol Hepatol [Internet]. 2017
Aug;2(8):555–64. Available from: http://dx.doi.org/10.1016/S2468-1253(17)30105-X
5. Committee for Medicinal Products for Human Use (CHMP). Guideline on the evaluation of medicinal products for the treatment of chronic
constipation (including opioid induced constipation) and for bowel cleansing (EMA/CHMP/336243/2013). 2015.
6. Webster LR, Nalamachu S, Morlion B, Reddy J, Baba Y, Yamada T, et al. Long-term use of naldemedine in the treatment of opioid-
induced constipation in patients with chronic noncancer pain. Pain [Internet]. 2018 May [cited 2019 Feb 15];159(5):987–94. Available
from: http://dx.doi.org/10.1097/j.pain.0000000000001174
7. Luthra P, Burr NE, Brenner DM, Ford AC. Efficacy of pharmacological therapies for the treatment of opioid-induced constipation:
systematic review and network meta-analysis. Gut [Internet]. 2019 Mar [cited 2019 Apr 10];68(3):434–44. Available from:
http://gut.bmj.com/
8. Katakami N, Harada T, Murata T, Shinozaki K, Tsutsumi M, Yokota T, et al. Randomized phase III and extension studies: efficacy and
impacts on quality of life of naldemedine in subjects with opioid-induced constipation and cancer. Ann Oncol [Internet]. 2018 Jun
1;29(6):1461–7. Available from: https://academic.oup.com/annonc/article/29/6/1461/4975731
9. Tack J, Lappalainen J, Diva U, Tummala R, Sostek M. Efficacy and safety of naloxegol in patients with opioid-induced constipation and
laxative-inadequate response. United Eur Gastroenterol J. 2015;3(5):471–80.

Technical engagement response form Naldemedine for treating opioid-induced constipation [ID1189] 14 of 14
10. Katakami N, Harada T, Murata T, Shinozaki K, Tsutsumi M, Yokota T, et al. Randomized Phase III and Extension Studies of
Naldemedine in Patients With Opioid-Induced Constipation and Cancer. J Clin Oncol [Internet]. 2017 Dec;35(34):3859–66. Available
from: http://ascopubs.org/doi/10.1200/JCO.2017.73.0853
11. Bull J, Wellman C V., Israel RJ, Barrett AC, Paterson C, Forbes WP. Fixed-Dose Subcutaneous Methylnaltrexone in Patients with
Advanced Illness and Opioid-Induced Constipation: Results of a Randomized, Placebo-Controlled Study and Open-Label Extension. J
Palliat Med [Internet]. 2015 Jul;18(7):593–600. Available from: http://www.liebertpub.com/doi/10.1089/jpm.2014.0362
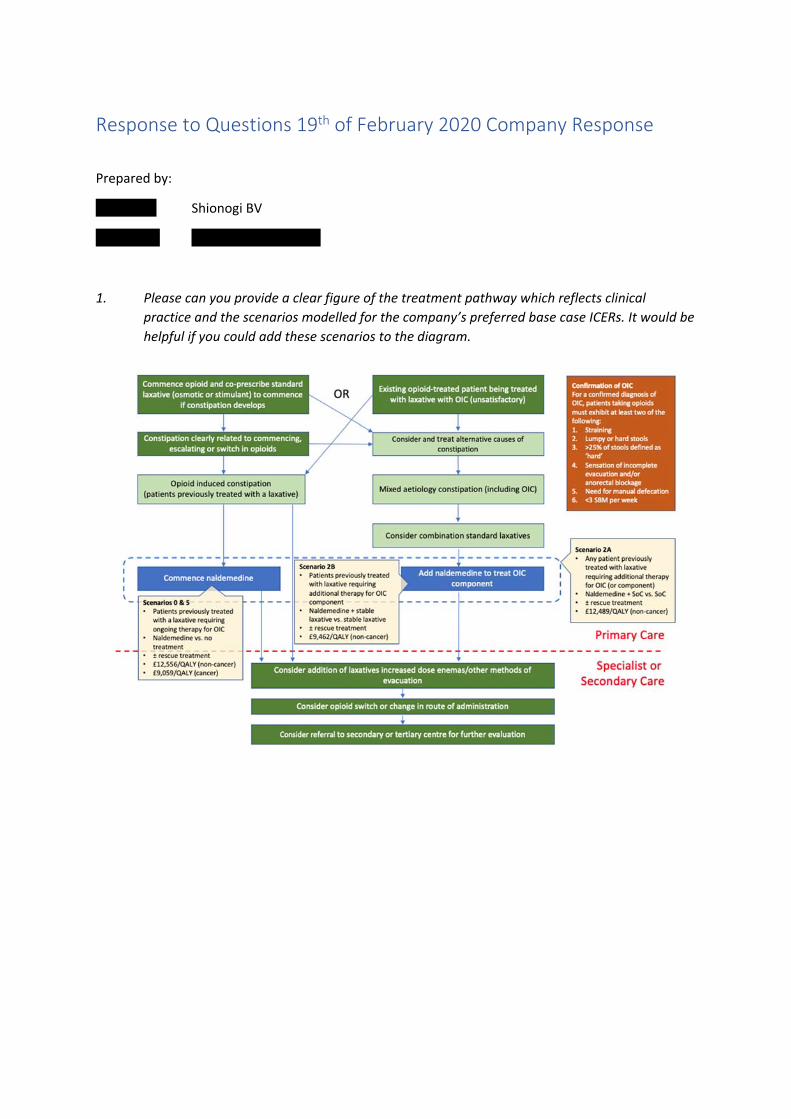
Response to Questions 19th of February 2020 Company Response
Prepared by:
XXXXXXXX Shionogi BV
XXXXXXXX XXXXXXXXXXXXXXXXX
1. Please can you provide a clear figure of the treatment pathway which reflects clinical
practice and the scenarios modelled for the company’s preferred base case ICERs. It would be
helpful if you could add these scenarios to the diagram.

2. Please can you expand the updated Table 1 in your response to include intervention,
comparator, source data and outcome columns so that it is clear to us what each
scenario/subpopulation is referring to. Please highlight which of the ICERs are your preferred
base case ICERs.
Following technical engagement, the company have provided a range of plausible clinical scenarios under which naldemedine could be eligible for use under its marketing authorisation (see above table). We suggest that Scenario 2A (using clinical inputs from the COMPOSE-3 ITT population) could be regarded as representing the majority of use cases for naldemedine versus the existing standard of care (SoC).
3. Can you please clarify the methods used to combine data in all ITCs and provide the input data for each study (as requested in issue 4 of the technical report).
The company submission refers to four ITCs.
a. Luthra et al, 2018
The company do not have the input data and it would be unfeasible in the time remaining to recreate it; this is an independent publication and the company has neither influence nor contact with the authors.
b. Company ITC#1
Compared ‘Response rate at Week 12 (LIR population)’ for naldemedine versus naloxegol 25mg.
Below is the direct copy of the publication source of the data
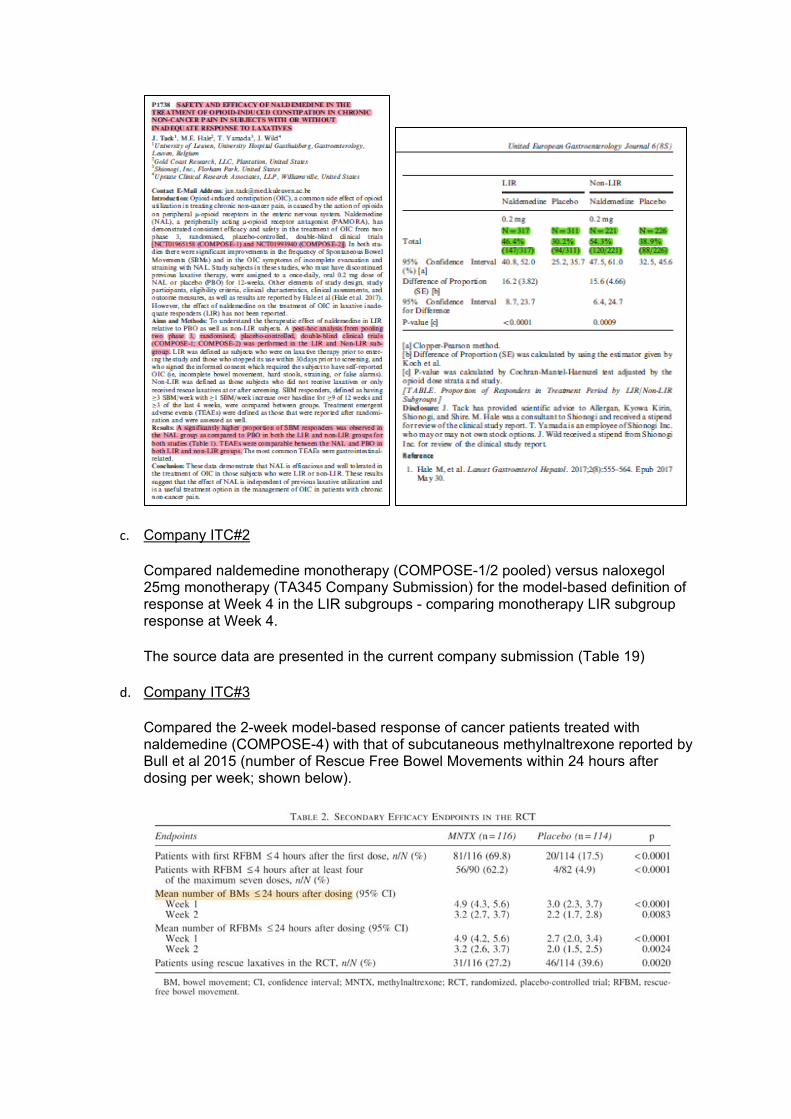
c. Company ITC#2
Compared naldemedine monotherapy (COMPOSE-1/2 pooled) versus naloxegol 25mg monotherapy (TA345 Company Submission) for the model-based definition of response at Week 4 in the LIR subgroups - comparing monotherapy LIR subgroup response at Week 4.
The source data are presented in the current company submission (Table 19)
d. Company ITC#3
Compared the 2-week model-based response of cancer patients treated with naldemedine (COMPOSE-4) with that of subcutaneous methylnaltrexone reported by Bull et al 2015 (number of Rescue Free Bowel Movements within 24 hours after dosing per week; shown below).

4. In your response to issue 3, question 5, you refer to the company appendix for further details. It is
not clear whether you are referring to an existing appendix previously submitted or a new
appendix, which you intended to submit to us. Please could you clarify.
The appendix submitted to the first stage – Appendix M – Resubmitted
MODEL UPDATE
The naldemedine cost‐utility model developed to support health technology appraisals in the UK has
been subject to scrutiny by economic assessors from NICE, the Scottish Medicines Consortium, and
by the originators of the model, RTI Health Solutions, contracted to perform external validation as
part of the company submission to GID‐TA10291.
The accompanying report therefore documents: 1) the changes to the model implemented in the
course of NICE technical engagement; 2) the model inputs and their respective parameter
uncertainties; and 3) the model outputs based on NICE reference case assumptions agreed during
technical engagement with NICE.

Technical engagement response form Naldemedine for treating opioid-induced constipation [ID1189] 1 of 6
Technical engagement response form
Naldemedine for treating opioid-induced constipation [ID1189]
As a stakeholder you have been invited to comment on the technical report for this appraisal. The technical report and stakeholders responses are used by the appraisal committee to help it make decisions at the appraisal committee meeting. Usually, only unresolved or uncertain key issues will be discussed at the meeting. We need your comments and feedback on the questions below. You do not have to answer every question. The text boxes will expand as you type. Please read the notes about completing this form. We cannot accept forms that are not filled in correctly. Your comments will be summarised and used by the technical team to amend or update the scientific judgement and rationale in the technical report. Deadline for comments: 5pm on Friday 14 February 2020. Thank you for your time. Please log in to your NICE Docs account to upload your completed form, as a Word document (not a PDF). Notes on completing this form
Please see the technical report which summarises the background and submitted evidence. This will provide context and describe the questions below in greater detail.
Please do not embed documents (such as PDFs or tables) because this may lead to the information being mislaid or make the response unreadable. Please type information directly into the form.
Do not include medical information about yourself or another person that could identify you or the other person. Do not use abbreviations. Do not include attachments such as journal articles, letters or leaflets. For copyright reasons, we will have to return forms that have attachments
without reading them. You can resubmit your form without attachments, but it must be sent by the deadline. If you provide journal articles to support your comments, you must have copyright clearance for these articles. Combine all comments from your organisation (if applicable) into 1 response. We cannot accept more than 1 set of comments from each
organisation. Please underline all confidential information, and separately highlight information that is submitted under ‘commercial in confidence’ in turquoise,
all information submitted under ‘academic in confidence’ in yellow, and all information submitted under ‘depersonalised data’ in pink. If confidential information is submitted, please also send a second version of your comments with that information replaced with the following text:

Technical engagement response form Naldemedine for treating opioid-induced constipation [ID1189] 2 of 6
‘academic/commercial in confidence information removed’. See the Guide to the processes of technology appraisal (sections 3.1.23 to 3.1.29) for more information.
We reserve the right to summarise and edit comments received during engagement, or not to publish them at all, if we consider the comments are too long, or publication would be unlawful or otherwise inappropriate. Comments received during engagement are published in the interests of openness and transparency, and to promote understanding of how recommendations are developed. The comments are published as a record of the comments we received, and are not endorsed by NICE, its officers or advisory committees.
About you
Your name xxxxxxxxxxx
Organisation name – stakeholder or respondent (if you are responding as an individual rather than a registered stakeholder please leave blank)
Kyowa Kirin
Disclosure Please disclose any past or current, direct or indirect links to, or funding from, the tobacco industry.
none

Technical engagement response form Naldemedine for treating opioid-induced constipation [ID1189] 3 of 6
Questions for engagement
Issue 1: Mixed aetiology constipation
1. Does the marketing authorisation for naldemedine include the treatment of mixed aetiology constipation (which is opioid-induced constipation concomitant to functional constipation) in people using an opioid medicine?
It is common for patients with OIC to have mixed aetiology constipation. Indeed, its difficult to assign with confidence a particular case of constipation caused by only a single factor. Taking this into account mixed aetiology constipation appears out with the scope of the appraisal. The licensed indication does not include treatment concomitantly for mixed aetiology constipation.
2. Is a combination of laxatives or a singular laxative the most suitable comparator for treating mixed aetiology constipation?
In the absence of strong RCT evidence in this area, clinical expert opinion is required to determine whether combination or singular therapy is most appropriate as initial treatment. We expect that it will depend entirely on the actual identified causes of constipation.
Issue 2: Treatment pathway
3. Is the positioning of naldemedine in the treatment pathway clear?
We have some concerns regards the positioning of naldemedine, naloxegol and methylnaltrexone in the treatment pathway proposed on page 6 of the technical report. In particular:
Any treatment algorithm proposed must be validated by practicing clinical experts., In its current form the proposed algorithm looks too complicated and simplification to
reflect everyday practice is possible. The positioning of naldemedine for laxative refractory patients is not clear. How does
laxative refractory differ in clinical practice from laxative inadequate response patients? If patients respond to laxatives, then they do not require treatment with a PAMORA (naldemedine). If they do not respond to a laxative, they would be considered Laxative

Technical engagement response form Naldemedine for treating opioid-induced constipation [ID1189] 4 of 6
inadequate responders. Therefore the additional step in the pathway for laxative refractory patients seems a somewhat artificial divide and it is not clear that this would bear relevance in clinical practice?
The positioning of naloxegol and methylnaltrexone as distinct from naldemedine misrepresents the consistency in licensed indication of these products. They are licensed for OIC in adult patients after laxative use. This ties in with the above concern we have with regards the artificial divide between laxative refractory patients and patients with an inadequate response to laxatives.
With regards mixed aetiology treatment guidance within the pathway, this is not reflected in the licenced indication. We consider this to be out of the scope of the guidance
4. What definition of laxative inadequate response (LIR) has been included in the model?
Clarification required.
Issue 3: Subpopulations to be considered
5. Should naldemedine and comparator arms include rescue medication or not?
We believe the use of rescue laxatives should be included and within the scope of the analyses. Use of rescue laxatives incurs a cost (both purchase cost and if severe, admission time) and therefore excluding this data may not compare true costs appropriately. We recommend use of rescue laxatives in subgroups is included.
6. Should subpopulation 4 include all patients on naldemedine or be restricted to those patients with a laxative inadequate response (LIR)?
As PAMORAs are positioned after laxative failure in current guidelines (UEG guidelines, EMA) and they are indicated either after laxative failure or laxative use, subpopulation 4 should include data for patients
Issue 4: Indirect treatment comparisons

Technical engagement response form Naldemedine for treating opioid-induced constipation [ID1189] 5 of 6
7. Is the indirect treatment comparison, comparing naldemedine to naloxegol acceptable for decision-making?
Without head to head studies we do not consider this acceptable.
Although statistical models are used as part of indirect comparisons, clinical feedback is
imperative.
Due to differences in design, baseline characteristics and differences in definitions used (e.g.
laxative response) we are not clear how results were obtained and how whether can be applied to
clinical practice.
8. Is the indirect treatment comparison, comparing naldemedine to methylnaltrexone acceptable for decision-making?
Similar to point 7. above
Issue 5: Generalisability of COMPOSE trials
9. The COMPOSE-4 trial (as well as COMPOSE -5, -6 and -7 open label studies) was conducted in Japan. Are there any genetic, cultural, healthcare setting or other differences between Japan and UK that would limit the applicability of these studies to UK clinical practice?
We do not have robust data to comment on clinical pathways in Japan versus UK.
10. Please refer to Table 9 below on opioid use and bowel movements at baseline for COMPOSE -1, -2 and -3 trials in non-cancer patients. Are the baseline characteristics in the table reflective of England?
We do not have robust data to comment on clinical pathways in Japan versus UK.

Technical engagement response form Naldemedine for treating opioid-induced constipation [ID1189] 6 of 6
11. Would naldemedine be expected to have equal effectiveness for treating OIC in patients with cancer related pain compared with non-cancer related pain?
KK is not well positioned to comment on raw data from the subgroups cited here.
Issue 6: Extrapolation of treatment response
12. Are the justifications for the distributions chosen for modelling treatment response acceptable?
KK is not well positioned to comment on raw data and statistical methodology employed by the
MAH.
13. Is the lognormal or Gompertz distribution more appropriate in subpopulations 0 and 3?
KK is not well positioned to comment on raw data and statistical methodology employed by the
MAH.

Technical engagement response form Naldemedine for treating opioid-induced constipation [ID1189] 1 of 16
Technical engagement response form
Naldemedine for treating opioid-induced constipation [ID1189]
As a stakeholder you have been invited to comment on the technical report for this appraisal. The technical report and stakeholders’ responses are used by the appraisal committee to help it make decisions at the appraisal committee meeting. Usually, only unresolved or uncertain key issues will be discussed at the meeting. We need your comments and feedback on the questions below. You do not have to answer every question. The text boxes will expand as you type. Please read the notes about completing this form. We cannot accept forms that are not filled in correctly. Your comments will be summarised and used by the technical team to amend or update the scientific judgement and rationale in the technical report. Deadline for comments: 5pm on Friday 14 February 2020. Thank you for your time. Please log in to your NICE Docs account to upload your completed form, as a Word document (not a PDF). Notes on completing this form
Please see the technical report which summarises the background and submitted evidence. This will provide context and describe the questions below in greater detail.
Please do not embed documents (such as PDFs or tables) because this may lead to the information being mislaid or make the response unreadable. Please type information directly into the form.
Do not include medical information about yourself or another person that could identify you or the other person. Do not use abbreviations. Do not include attachments such as journal articles, letters or leaflets. For copyright reasons, we will have to return forms that have attachments
without reading them. You can resubmit your form without attachments, but it must be sent by the deadline. If you provide journal articles to support your comments, you must have copyright clearance for these articles. Combine all comments from your organisation (if applicable) into 1 response. We cannot accept more than 1 set of comments from each
organisation. Please underline all confidential information, and separately highlight information that is submitted under ‘commercial in confidence’ in turquoise,
all information submitted under ‘academic in confidence’ in yellow, and all information submitted under ‘depersonalised data’ in pink. If confidential

Technical engagement response form Naldemedine for treating opioid-induced constipation [ID1189] 2 of 16
information is submitted, please also send a second version of your comments with that information replaced with the following text: ‘academic/commercial in confidence information removed’. See the Guide to the processes of technology appraisal (sections 3.1.23 to 3.1.29) for more information.
We reserve the right to summarise and edit comments received during engagement, or not to publish them at all, if we consider the comments are too long, or publication would be unlawful or otherwise inappropriate. Comments received during engagement are published in the interests of openness and transparency, and to promote understanding of how recommendations are developed. The comments are published as a record of the comments we received, and are not endorsed by NICE, its officers or advisory committees.
About you
Your name XXXXXXXXXXXXXXXXX
Organisation name – stakeholder or respondent (if you are responding as an individual rather than a registered stakeholder please leave blank)
Shionogi BV
Disclosure Please disclose any past or current, direct or indirect links to, or funding from, the tobacco industry.
None
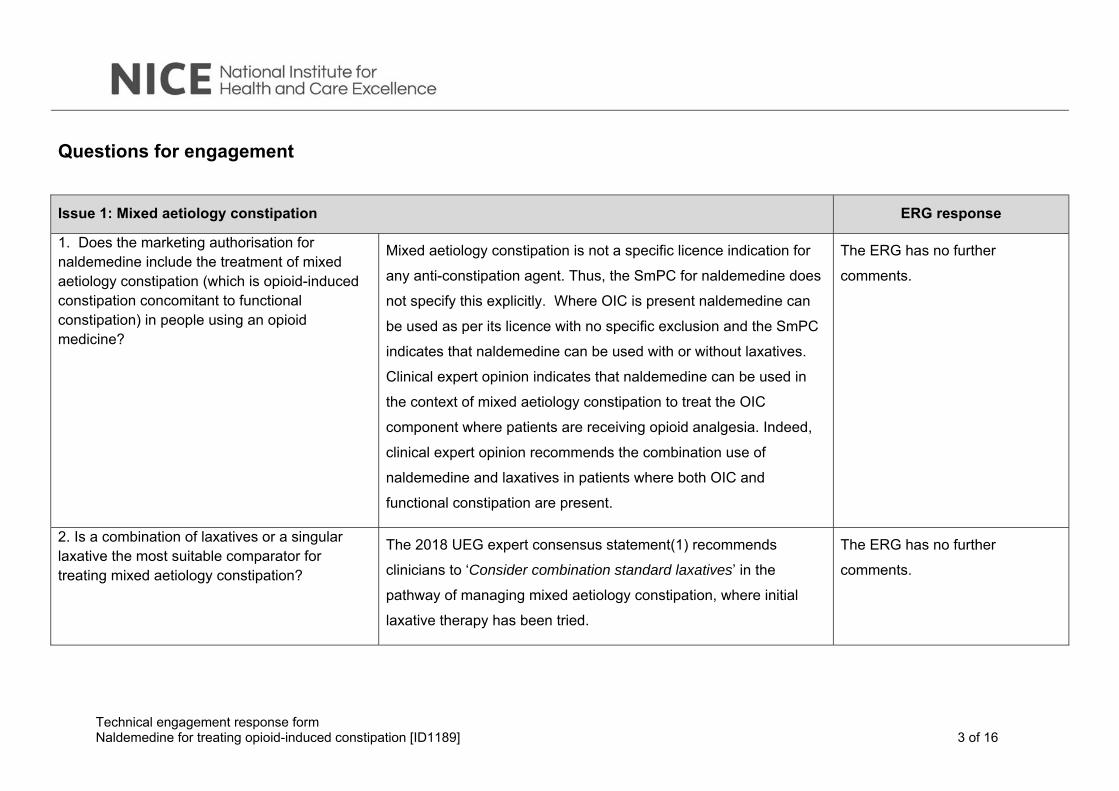
Technical engagement response form Naldemedine for treating opioid-induced constipation [ID1189] 3 of 16
Questions for engagement
Issue 1: Mixed aetiology constipation ERG response
1. Does the marketing authorisation for naldemedine include the treatment of mixed aetiology constipation (which is opioid-induced constipation concomitant to functional constipation) in people using an opioid medicine?
Mixed aetiology constipation is not a specific licence indication for
any anti-constipation agent. Thus, the SmPC for naldemedine does
not specify this explicitly. Where OIC is present naldemedine can
be used as per its licence with no specific exclusion and the SmPC
indicates that naldemedine can be used with or without laxatives.
Clinical expert opinion indicates that naldemedine can be used in
the context of mixed aetiology constipation to treat the OIC
component where patients are receiving opioid analgesia. Indeed,
clinical expert opinion recommends the combination use of
naldemedine and laxatives in patients where both OIC and
functional constipation are present.
The ERG has no further
comments.
2. Is a combination of laxatives or a singular laxative the most suitable comparator for treating mixed aetiology constipation?
The 2018 UEG expert consensus statement(1) recommends
clinicians to ‘Consider combination standard laxatives’ in the
pathway of managing mixed aetiology constipation, where initial
laxative therapy has been tried.
The ERG has no further
comments.
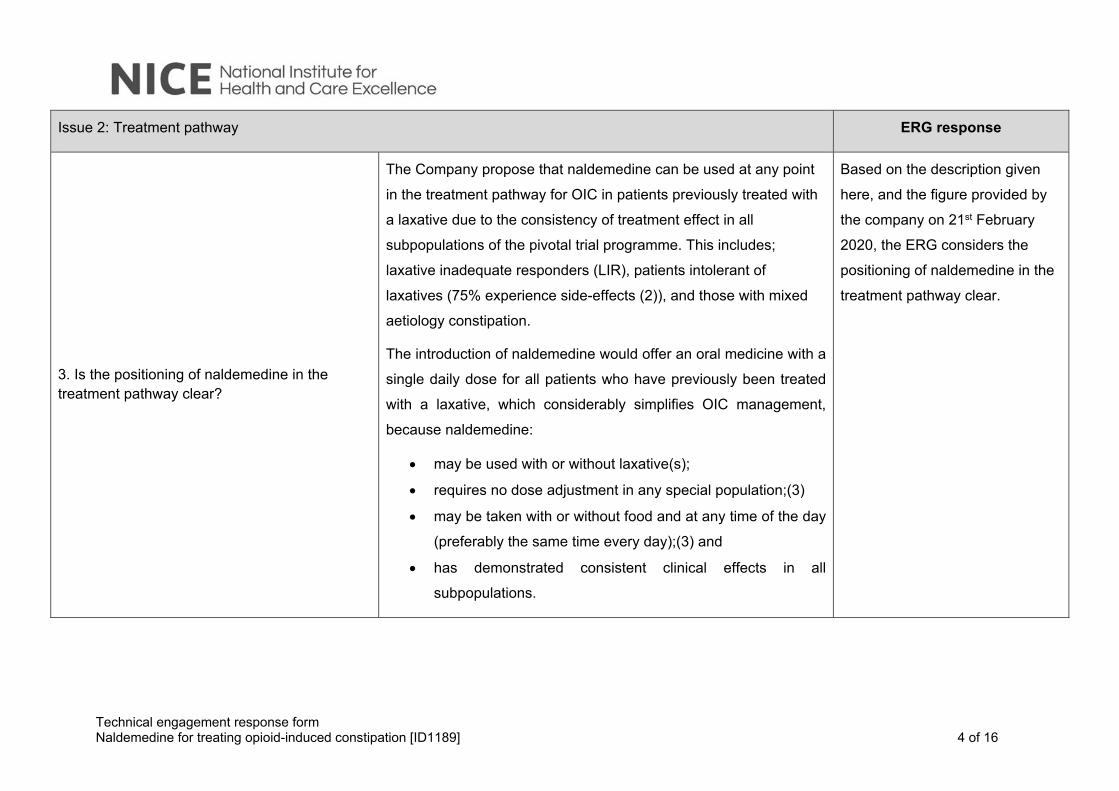
Technical engagement response form Naldemedine for treating opioid-induced constipation [ID1189] 4 of 16
Issue 2: Treatment pathway ERG response
3. Is the positioning of naldemedine in the treatment pathway clear?
The Company propose that naldemedine can be used at any point
in the treatment pathway for OIC in patients previously treated with
a laxative due to the consistency of treatment effect in all
subpopulations of the pivotal trial programme. This includes;
laxative inadequate responders (LIR), patients intolerant of
laxatives (75% experience side-effects (2)), and those with mixed
aetiology constipation.
The introduction of naldemedine would offer an oral medicine with a
single daily dose for all patients who have previously been treated
with a laxative, which considerably simplifies OIC management,
because naldemedine:
may be used with or without laxative(s);
requires no dose adjustment in any special population;(3)
may be taken with or without food and at any time of the day
(preferably the same time every day);(3) and
has demonstrated consistent clinical effects in all
subpopulations.
Based on the description given
here, and the figure provided by
the company on 21st February
2020, the ERG considers the
positioning of naldemedine in the
treatment pathway clear.

Technical engagement response form Naldemedine for treating opioid-induced constipation [ID1189] 5 of 16
Naldemedine’s clinical and cost-effectiveness profile lends itself to
support patients who are experiencing OIC despite being initiated
with a laxative in either primary or secondary care.
Use of naldemedine during opioid analgesia for either cancer pain
or chronic non-cancer pain greater than one month duration could
help simplify OIC management.
Initiation of eligible patients receiving opioid analgesia for longer
than one month may have a significant impact on healthcare
resource and avoid inappropriate referral to gastroenterologists in
England & Wales.
4. What definition of laxative inadequate response (LIR) has been included in the model?
The definition of LIR used in the model is that pre-specified by the
respective manufacturers of and naldemedine and naloxegol in their
clinical development programme.
For naldemedine, LIR was defined as: “patients who, based on the
concomitant medication records, were on laxative therapy (with ≥1
agents) prior to entering the study and who stopped its use within
30 days prior to Visit 1 (Screening) [].” Defined in the COMPOSE
Clinical Study Reports
For naloxegol, LIR was defined as opioid-induced constipation
symptoms of at least moderate severity in at least 1 of the 4 stool
symptom domains (that is, incomplete bowel movement, hard
From the company response, it is
clear that the comparison
between naldemedine and
naloxegol (scenario 3) should be
interpreted with care as the
definition of LIR is clearly different
between the COMPOSE and
KODIAC studies.
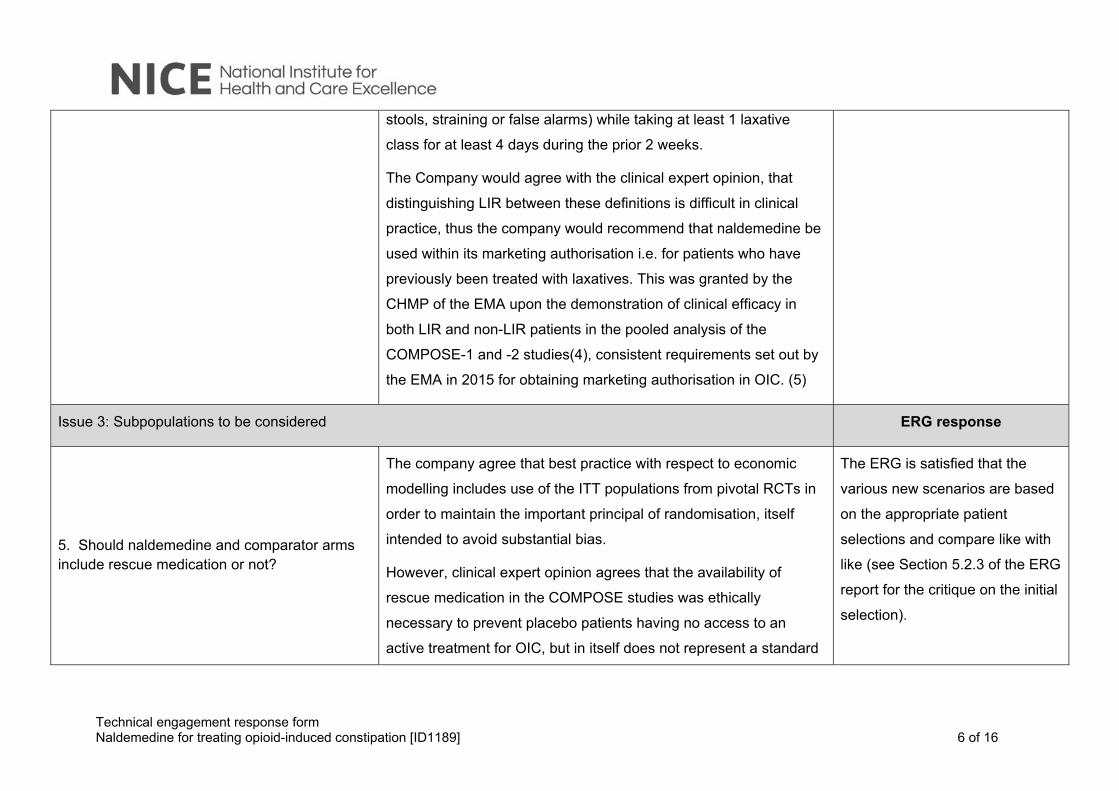
Technical engagement response form Naldemedine for treating opioid-induced constipation [ID1189] 6 of 16
stools, straining or false alarms) while taking at least 1 laxative
class for at least 4 days during the prior 2 weeks.
The Company would agree with the clinical expert opinion, that
distinguishing LIR between these definitions is difficult in clinical
practice, thus the company would recommend that naldemedine be
used within its marketing authorisation i.e. for patients who have
previously been treated with laxatives. This was granted by the
CHMP of the EMA upon the demonstration of clinical efficacy in
both LIR and non-LIR patients in the pooled analysis of the
COMPOSE-1 and -2 studies(4), consistent requirements set out by
the EMA in 2015 for obtaining marketing authorisation in OIC. (5)
Issue 3: Subpopulations to be considered ERG response
5. Should naldemedine and comparator arms include rescue medication or not?
The company agree that best practice with respect to economic
modelling includes use of the ITT populations from pivotal RCTs in
order to maintain the important principal of randomisation, itself
intended to avoid substantial bias.
However, clinical expert opinion agrees that the availability of
rescue medication in the COMPOSE studies was ethically
necessary to prevent placebo patients having no access to an
active treatment for OIC, but in itself does not represent a standard
The ERG is satisfied that the
various new scenarios are based
on the appropriate patient
selections and compare like with
like (see Section 5.2.3 of the ERG
report for the critique on the initial
selection).
Technical engagement response form Naldemedine for treating opioid-induced constipation [ID1189] 7 of 16
of care (SoC) in the UK. Indeed, the majority of guidelines
recommend the use of regular laxatives in the management of OIC.
With this in mind, the Company conducted a number of economic
scenario analysis with and without rescue medication in order to
assist the Committee's decision making, summarised in Table 1.
Following Technical Engagement, we have supplied additional
economic scenarios using clinical input data from the ITT population
of COMPOSE-3 (C-3). Scenario 2A, applies data from the whole C-
3 ITT population (response and transitions A, B & C) for which the
ICER is £9,204 per QALY. Shionogi would see this as a proxy for a
comparison of naldemedine+SoC (± rescue) versus SoC (± rescue)
in both the OIC and mixed aetiology constipation (including OIC)
clinical populations. Scenario 2B, applies data from the stable
laxative C-3 ITT sub-population (response and transitions A, B & C)
for which the ICER is £9,354 per QALY. Shionogi see this as a
proxy for a comparison of naldemedine+stable laxative (± rescue)
versus stable laxative (± rescue) in the mixed aetiology constipation
(including OIC) clinical sub-population. As the stable laxative
designation was determined post hoc and not applied as a
stratification factor, this latter analysis could be susceptible to bias
however, a generally similar proportion of ITT subjects in the
Therefore, the ERG considers the
results of the new scenarios 2A,
B, C and 3A to be reliable.
Regarding the latter comment on
the analysis of PAC-QOL data
specifically for responders, the
ERG could not locate the
appendix the company referred
to.

Technical engagement response form Naldemedine for treating opioid-induced constipation [ID1189] 8 of 16
naldemedine group (50.2%) and in the placebo group (54.0%) were
on a stable laxative regimen during the study(6).
Furthermore, the Company have analysed the PAC-QOL change-
from-baseline data for naldemedine responders versus placebo
responders in the C-3 ITT and stable laxative subgroup and found
the treatment effects in each case to not only be near-identical but
also entirely consistent with our argumentation for adoption of the
treatment-health state specific utilities from TA345, in other
scenarios. (see Company appendix for details).
6. Should subpopulation 4 include all patients on naldemedine or be restricted to those patients with a laxative inadequate response (LIR)?
The clinical data for naldemedine informing Scenario 4 were drawn
from the COMPOSE-4 (C4) RCT, conducted in patients receiving a
stable daily dose of opioids for ≥2 weeks prior to screening and who
also had OIC. The diagnostic criteria for OIC were ≤5 spontaneous
bowel movements (SBMs; a bowel movement [BM] not induced by
rescue-laxatives) and experiencing straining, incomplete
evacuation, and/or hard stools in ≥ 25% of all BMs during the 2
weeks prior to randomization. No criteria were set for laxative
inadequate response and thus the company did not have enough
information to create LIR subpopulation.
Clinician expert opinion suggests that naldemedine should offer
comparable efficacy in non-cancer and cancer patients alike thus as
It seems plausible that, if there is
little difference in effectiveness
between LIR and non-LIR
subgroups in the non-cancer
population and between cancer
and non-cancer then there is
likely to be little difference
between LIR and non-LIR
subgroups in the cancer
population. However, it would
have been more persuasive if the

Technical engagement response form Naldemedine for treating opioid-induced constipation [ID1189] 9 of 16
naldemedine has demonstrated effectiveness in both LIR and non-
LIR subgroups in the non-cancer COMPOSE-1 & -2 studies, the
company believes the current results for subpopulation 4 are
generalisable to the equivalent UK clinical population.
company had shown this with
data from the COMPOSE-4 RCT.
Issue 4: Indirect treatment comparisons ERG response
7. Is the indirect treatment comparison, comparing naldemedine to naloxegol acceptable for decision-making?
The Company supports the findings of the indirect treatment
comparisons (ITCs) presented in the submission. We would re-
iterate that the ITC published by Luthra et al (7) was both
independent and non-industry funded.
Furthermore, naldemedine is the only drug available for the
treatment of OIC to have demonstrated clinical benefit, symptom
control and improved quality of life for up to 52 weeks(8). The
company believe this to be an important distinguishing point as OIC
is considered a chronic condition aligned to treatment with opioids
of chronic or cancer pain.
No further comments in addition
to those made in section 4.4 of
the ERG report
8. Is the indirect treatment comparison, comparing naldemedine to methylnaltrexone acceptable for decision-making?
The company considers the ITC presented to support their
economic analysis as valid. There is limited RCT data for
subcutaneous methylnaltrexone and although this agent has some
use in the palliative care setting in the United Kingdom, the Institute
No further comments in addition
to those made in section 4.4 of
the ERG report

Technical engagement response form Naldemedine for treating opioid-induced constipation [ID1189] 10 of 16
have not made any determination as the marketing authorisation
holder has yet to submit an evidence dossier.
Issue 5: Generalisability of COMPOSE trials ERG response
9. The COMPOSE-4 trial (as well as COMPOSE -5, -6 and -7 open label studies) was conducted in Japan. Are there any genetic, cultural, healthcare setting or other differences between Japan and UK that would limit the applicability of these studies to UK clinical practice?
The EMA raised the same point in their Day 120 assessment report:
“It is agreed that irrespective of whether or not cancer is the
underlying cause of pain, the constipation caused by opioids used
to treat the pain is comparable. It is further agreed that comparable
[pharmacokinetic] PK parameters were observed in healthy
subjects of Japanese or US origin, respectively, after similar doses
of naldemedine. Further, race did not have clinically relevant impact
on the population PK model. Thus, it is considered justified that
similar safety profiles of naldemedine may be expected irrespective
of race and presence of cancer and thus safety results obtained in
the study of cancer and OIC (in Japanese patients) may be
extrapolated to other races.”
In addition, the following extracts are taken from the Rapporteurs
Day 180 joint CHMP and PRAC response assessment report Pages
41/42
Based on the sources cited, the
ERG considers the using studies
conducted in Japan for the
current appraisal acceptable.

Technical engagement response form Naldemedine for treating opioid-induced constipation [ID1189] 11 of 16
“No specific study was conducted to directly investigate the effect of
race on naldemedine pharmacokinetics.
A comparison of naldemedine pharmacokinetics at doses ranging
from 0.1 to 2 mg in the fasted state was conducted between
Japanese healthy subjects [] and US healthy subjects []. The effect
of race [] was also evaluated in population pharmacokinetic
analysis. Population pharmacokinetic analysis of naldemedine
showed that CL/F of non-White was smaller than that of White;
however, CL/F ratio of non-White to White was only 0.870 and the
effects of race on CL/F or AUC were small. Population
pharmacokinetic analysis of naldemedine showed that there were
not statistically significant pharmacokinetic differences between
Japanese and non-Japanese.
No clinically meaningful differences in naldemedine
pharmacokinetics were observed between White and non-White
subjects and among races. Hence, no dose adjustment is required
based on race.”
“In conclusion, no clinically meaningful differences were observed in
naldemedine pharmacokinetics by body weight and BMI. No dose
adjustment is required for body weight and BMI.”

Technical engagement response form Naldemedine for treating opioid-induced constipation [ID1189] 12 of 16
10. Please refer to Table 9 below on opioid use and bowel movements at baseline for COMPOSE -1, -2 and -3 trials in non-cancer patients. Are the baseline characteristics in the table reflective of England?
The Company have tabulated the baseline demographic
characteristics of the relevant pivotal studies and that observed in a
commissioned observational study of OIC the UK CPRD database.
For non-cancer patients receiving opioid analgesia,
and similarly, for patients with cancer receiving opioid analgesia,
Notes: a) (4), b) (9), c) (Appendix M June Company Initial
Submission), d) (10), and e) (11)
The Company therefore contends that the baseline characteristics
of both non-cancer patients and cancer patients from clinical trials
referred to in the submission are reflective of patients in clinical
practice in England.
The ERG considers this
comparison to be rather limited
(see also the critique in
section 3.1 of the ERG report).
COMPOSE-1a COMPOSE-2a KOD
Mean age (years) 53.4 53.5
Male, % 39.6% 39.5%
COMPOSE-4d COMPOSE-5d M
Mean age (years) 64.2 63.5
Male, % 61.7% 56.5%

Technical engagement response form Naldemedine for treating opioid-induced constipation [ID1189] 13 of 16
11. Would naldemedine be expected to have equal effectiveness for treating OIC in patients with cancer related pain compared with non-cancer related pain?
The company would highlight the comments made in TA 345
regarding relevance to general clinical practice in the NHS:
“The Committee heard from the clinical experts that the efficacy of
naloxegol was not expected to be affected by age or weight and
concluded that the KODIAC 4 and 5 trials could be generalised to
the population seen in clinical practice in England. Having heard
from the clinical experts that naloxegol was likely to be effective in
people with cancer and considering that the marketing authorisation
did not exclude people with cancer, the Committee was persuaded
that naloxegol would be equally effective in people with cancer pain.
It concluded that its decision regarding the use of naloxegol in
clinical practice would also apply to people with cancer pain.”
The company has presented effectiveness data in patients with
both cancer and non-cancer pain and the results of the COMPOSE
studies indicate that naldemedine is effective in both patient
subgroups.
The ERG has no further
comments.
Issue 6: Extrapolation of treatment response ERG response
12. Are the justifications for the distributions chosen for modelling treatment response acceptable?
The economic analysis demonstrated that in all scenarios, choice of
survival distribution for loss of treatment response had only a small
impact on the incremental cost-effectiveness ratios.
The ERG still considers it an
omission that the company did
not provide any clinical
justification for the choice of time-

Technical engagement response form Naldemedine for treating opioid-induced constipation [ID1189] 14 of 16
to-event curve for the loss of
treatment response.
However, the ERG agrees with
the company that the impact of
the choice of the curve has
minimal impact on the ICER.
13. Is the lognormal or Gompertz distribution more appropriate in subpopulations 0 and 3?
See above. See above

Technical engagement response form Naldemedine for treating opioid-induced constipation [ID1189] 15 of 16
References
1. Farmer AD, Drewes AM, Chiarioni G, De Giorgio R, O’Brien T, Morlion B, et al. Pathophysiology and management of opioid-induced
constipation: European expert consensus statement. United Eur Gastroenterol J [Internet]. 2019 Feb 14 [cited 2019 Feb 15];7(1):7–20.
Available from: http://journals.sagepub.com/doi/10.1177/2050640618818305
2. Emmanuel A, Johnson M, McSkimming P, Dickerson S. Laxatives Do Not Improve Symptoms of Opioid-Induced Constipation: Results of
a Patient Survey. Pain Med [Internet]. 2016 Oct 10;18(10):pnw240. Available from: http://www.ncbi.nlm.nih.gov/pubmed/28339544
3. SmPC Naldemedine. 2020. p. https://www.ema.europa.eu/en/documents/product-inf.
4. Hale M, Wild J, Reddy J, Yamada T, Arjona Ferreira JC. Naldemedine versus placebo for opioid-induced constipation (COMPOSE-1 and
COMPOSE-2): two multicentre, phase 3, double-blind, randomised, parallel-group trials. Lancet Gastroenterol Hepatol [Internet]. 2017
Aug;2(8):555–64. Available from: http://dx.doi.org/10.1016/S2468-1253(17)30105-X
5. Committee for Medicinal Products for Human Use (CHMP). Guideline on the evaluation of medicinal products for the treatment of chronic
constipation (including opioid induced constipation) and for bowel cleansing (EMA/CHMP/336243/2013). 2015.
6. Webster LR, Nalamachu S, Morlion B, Reddy J, Baba Y, Yamada T, et al. Long-term use of naldemedine in the treatment of opioid-
induced constipation in patients with chronic noncancer pain. Pain [Internet]. 2018 May [cited 2019 Feb 15];159(5):987–94. Available
from: http://dx.doi.org/10.1097/j.pain.0000000000001174
7. Luthra P, Burr NE, Brenner DM, Ford AC. Efficacy of pharmacological therapies for the treatment of opioid-induced constipation:
systematic review and network meta-analysis. Gut [Internet]. 2019 Mar [cited 2019 Apr 10];68(3):434–44. Available from:
http://gut.bmj.com/
8. Katakami N, Harada T, Murata T, Shinozaki K, Tsutsumi M, Yokota T, et al. Randomized phase III and extension studies: efficacy and
impacts on quality of life of naldemedine in subjects with opioid-induced constipation and cancer. Ann Oncol [Internet]. 2018 Jun
1;29(6):1461–7. Available from: https://academic.oup.com/annonc/article/29/6/1461/4975731

Technical engagement response form Naldemedine for treating opioid-induced constipation [ID1189] 16 of 16
9. Tack J, Lappalainen J, Diva U, Tummala R, Sostek M. Efficacy and safety of naloxegol in patients with opioid-induced constipation and
laxative-inadequate response. United Eur Gastroenterol J. 2015;3(5):471–80.
10. Katakami N, Harada T, Murata T, Shinozaki K, Tsutsumi M, Yokota T, et al. Randomized Phase III and Extension Studies of
Naldemedine in Patients With Opioid-Induced Constipation and Cancer. J Clin Oncol [Internet]. 2017 Dec;35(34):3859–66. Available
from: http://ascopubs.org/doi/10.1200/JCO.2017.73.0853
11. Bull J, Wellman C V., Israel RJ, Barrett AC, Paterson C, Forbes WP. Fixed-Dose Subcutaneous Methylnaltrexone in Patients with
Advanced Illness and Opioid-Induced Constipation: Results of a Randomized, Placebo-Controlled Study and Open-Label Extension. J
Palliat Med [Internet]. 2015 Jul;18(7):593–600. Available from: http://www.liebertpub.com/doi/10.1089/jpm.2014.0362