Single-laboratory validation of the determination of ... · PDF fileSingle-laboratory...
25
Single-laboratory validation of the determination of ethanol in kombucha by headspace GC-FID Data Package supporting Official Method of Analysis Submission Primary Investigator: Blake Ebersole, NaturPro Scientific LLC Collaborators: Rich Schmidt and Matt Eckert, Covance Laboratories.
Transcript of Single-laboratory validation of the determination of ... · PDF fileSingle-laboratory...
Single-laboratory validation of the determination
of ethanol in kombucha by headspace GC-FID
Data Package supporting Official Method of Analysis Submission
Primary Investigator: Blake Ebersole, NaturPro Scientific LLC
Collaborators: Rich Schmidt and Matt Eckert, Covance Laboratories.

Applicability (Scope)
The objective of this study was to examine the validity of a gas chromatography with flame ionization
detection (GC-FID) method for quantifying ethanol content in kombucha, and determine whether the
method met performance requirements set by AOAC Internationali,ii. The Covance method “MP-ETME”
commonly used for complex mixtures containing low levels of ethanol, including foods, beverages and
botanical materials, was used in this studyiii. This laboratory and method were selected for single-
laboratory validation after a preliminary study that included commercial, control and spiked kombucha
samples.
Ethanol is a common alcohol that is a product of yeast fermentation. Kombucha is generally stated as a
fermented beverage containing water, tea, sugar, yeast and bacteria, organic acids (such as acetic and
gluconic acids), dissolved gases, and ethanol.
The expected analytical range of this method is between 0.1 and 3.3% ABV (alcohol by volume),
although the method LOD has previously been determined at 10ppm in food and beverage matrices.
Analyte:
Ethanol: CAS # 64-17-5; CH3CH2OH; MW: 46.07
Matrices used (Label Information on File)
1. Ginger Kombucha (Manufacturer #1)
2. Elderberry Kombucha (Manufacturer #2)
3. Pineapple Kombucha (Manufacturer #3)
4. Raspberry Kombucha (Manufacturer #1)
5. Original Kombucha (Manufacturer #1)
6. Ginger Lemon Kombucha (Manufacturer #4)
7. Apple Kombucha (Manufactuer #4)
8. Berry Kombucha (Manufacturer #5)
9. Ethanol-free fermented tea, unflavored
10. Ethanol-free unfermented tea, flavored
Safety statements
Products should be kept refrigerated or chilled (not frozen) at all times, and tested before expiry date.
Products are fermented and are pressurized with dissolved gases in glass bottles. Commercial products
(glass bottles) have been documented to explode, and some products are labeled to ‘never shake’. Bottle
explosion is unlikely if they are kept cold and handled gently. All reagents should be handled according
to labeling.

Principle
Gas chromatography with flame ionization detection (GC-FID) with headspace autosampler.
Units and Statistics
All data are presented in units of alcohol by volume (%ABV). References certified by mass fraction
were converted to % ABV using the specific gravity of ethanol at 20 degrees Celsius of 0.789 g/mL.
The specific gravity of kombucha (1.00-1.02 g/mL experimental, n>30) was measured or estimated in
all test results.
Quantitation was performed using a 6-point calibration curve generated by a weighted (1/concentration)
least squares linear regression analysis. Other statistical tools used include percent recovery, standard
deviation (SD), intraday percent relative SD (Repeatability RSD, (RSD(r)), and intermediate precision
relative SD (RSD(R)).
Interferences
A potential interference of isopropanol (2-propanol or IPA) is present because it elutes just prior to
ethanol. High levels of IPA may reduce the accuracy of the method if the peaks cannot be fully resolved.
However, kombucha is unlikely to contain a measurable amount of IPA. In addition to the standard
validation parameters, several additional controls for interferences were performed:
Detailed sample handling and analysis procedures
Internal standard (IS) of 1-propanol
Intermittent blanks to assess instrument carryover
Ethanol recovery studies in multiple kombucha matrices
Precision and accuracy with beer certified reference material, bracketed by ethanol-water CRM
Review of chromatograms for possible interferences introduced by the matrix.
Other potential interferences
Kombucha may contain many different compounds, such as volatile flavor compounds and essential oils
added to kombucha that may have similar chemical characteristics as ethanol. However, the abundance
of any single flavor compound is low compared to the amount of ethanol being tested. Gingerols from
kombucha with raw ginger added have been estimated to contain 0.004-0.012% gingerols and shogaols
and 0.001-0.004% of essential oils1. At an order of magnitude less than the alcohol content, it could be
1 Assuming 1 g of raw ginger was added per serving, and containing 1-2% gingerols and 0.1-0.5%
essential oils (FAO Ginger Post-harvest Operations).

considered that the predominant compounds found in one of the most popular kombucha flavors may
not be likely to interfere in a meaningful way with the quantitation of moderate levels of alcohol.
Various flavors of kombucha samples tested all met the repeatability requirement (<4% RSD).
There are two main advantages of a headspace method for ethanol versus direct injection for kombucha.
Organic acids such as acetic and gluconic acids have a higher boiling point than the headspace vial
temperature, so they are not extracted during the injection. Solids from fermentation are also not
introduced to the instrument by using headspace.
Possible disadvantages of a headspace method include the reliance on ethanol to be extracted into the
headspace to the same degree for every sample. The extraction efficiency was verified to be in control
through the precision studies and spiking studies on multiple dates, instruments and technicians.
The dissolved gases that are produced naturally during fermentation also present potential issues with
regard to sample transfer. The volume of a given weight may change depending on how much gas is
removed. Therefore, it is critical to ensure proper steps are taken between breaking the seal and
introducing the sample to the instrument. This was verified in control through the precision and
accuracy studies on multiple dates, instruments and technicians.
Reagents
1. Ethanol >99.8, ACS Reagent Grade
2. 1-Propanol (internal standard), >99.5%, ACS Reagent Grade
3. Water, ACS Reagent Grade
Reference Standard Materials:
The following reference materials were used in the study.
Reference # Identification Lot Number Purity Stability Storage
1 1-Propanol, Sigma
#34871 SHBF0634V 99.98% July 2018 Not specified
2 Ethanol (Reference
standard, absolute
(200 proof),
Sigma-Aldrich #
459836) - used for
spiking (lab-
blinded)
SHBG7349V 99.97% Not specified Closed original
container, room
temp

3 Ethanol (Reference
standard, absolute
(200 proof),
Sigma-Aldrich #
459836) - used by
laboratory
SHBG4976V >99.5% Not specified Closed original
container, room
temp
4 Ethanol-water
Certified
Reference
Material, NIST #
2894
Not applicable 0.10084%
±0.00083%
certified mass
fraction
valid until 30 April
2023 Refrigerate (do not
freeze)
5 Ethanol-water
Certified
Reference
Material, Cerilliant
E-031
FN06181501, 100 mg/dL,
(0.1267% ABV
@ 20C)
exp June 2020 Refrigerate (do not
freeze)
6 Beer Certified
Reference
Material, LGC
BCR-651
000149, 000150,
000189, 000191 0.505 +/- 0.006 %
ABV valid until April 1,
2017 Approx 4 deg C.
Room temp before
opening. Do not
freeze.
7 Ethanol-water
Certified
Reference
Material, NIST
2897a
Not applicable 2% nominal mass
fraction (2.53% +/-
0.057%)
Exp April 2025 Refrigerate (do not
freeze)
All stability data is determined by the manufacturer, except for the following:
Ethanol and propanol standard solutions, made daily by the laboratory
Ethanol-free fermented tea, stable for 6 months from manufacture date
Standard stability
Calibration standards prepared by the lab from dilutions of ethanol in water for calibration were used on
the date of preparation only, based on standard laboratory procedure. Stability of other reference
standards was based on manufacturer’s COA or label information.
Preliminary studies on control and commercial kombucha samples spiked with ethanol showed
acceptable recovery after spiking, transportation and resampling into a vial that was then shipped to the
laboratory (data available on request)
Solvents (special requirements) and Buffers
Helium gas
Nitrogen gas

Apparatus
• J&W DB-WAXetrcolumn, 0.53 mm x 30 m, 2µm df
• Headspace vials and magnetic Teflon-lined caps, 20-mL
• Screw-top vials (Restek, part # 23082)
• Crimp top vials (Restek, part # 24685)
• Combi-PAL headspace autosampler
• Agilent 7890 GC system with flame ionization detector
Headspace conditions:
• Incubation temperature: 80°C
• Syringe temperature: 85°C
• Heating time: 15-20 minutes
Gas Chromatograph conditions
• Column: J&W DB-WAXetr
• Film thickness: 2 to 5 um
• Temperature: Initial 40°C for 10 minutes
• Rate: 25°C/minute to 240°C, hold 240°C for 1 minute
• Run Time: 20 minutes
• Detector: flame ionization
• Detector temperature: 250°C
• Injector temperature: 150°C
• Carrier gas: He, 7 mL/min
• Injection volume: 100 to 200 µL
GC conditions are typical and may be adjusted to obtain optimal separation and elution. Any
adjustments are noted in the raw data.
Calibration
System Suitability
The following are part of daily suitability requirements:
1. 6-pt calibration curve is bracketing results with R>0.995.
2. Relative ratio of ethanol to IS confirmed to meet expected result.
3. Peak resolution is sufficient.
4. Duplicates run at random at least every 10th sample. Difference on duplicates is within limits
established by control charts.
5. Blanks confirm no carryover.
6. All instrumental conditions confirmed.
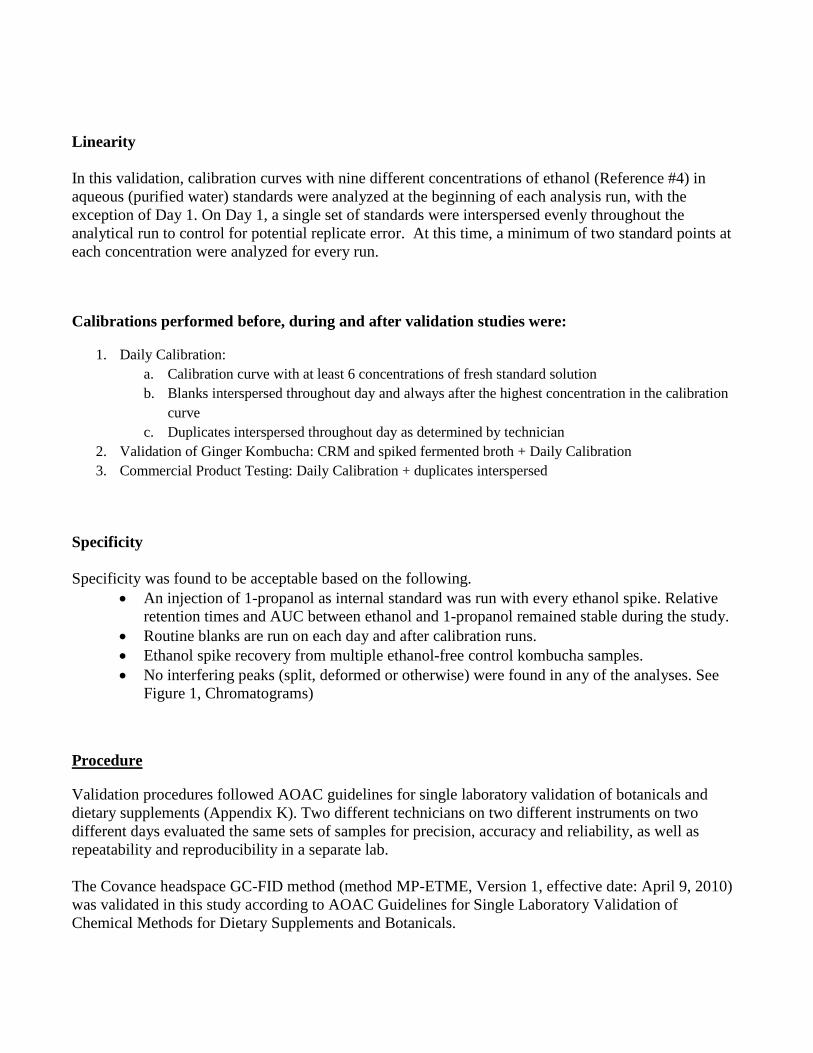
Linearity
In this validation, calibration curves with nine different concentrations of ethanol (Reference #4) in
aqueous (purified water) standards were analyzed at the beginning of each analysis run, with the
exception of Day 1. On Day 1, a single set of standards were interspersed evenly throughout the
analytical run to control for potential replicate error. At this time, a minimum of two standard points at
each concentration were analyzed for every run.
Calibrations performed before, during and after validation studies were:
1. Daily Calibration:
a. Calibration curve with at least 6 concentrations of fresh standard solution
b. Blanks interspersed throughout day and always after the highest concentration in the calibration
curve
c. Duplicates interspersed throughout day as determined by technician
2. Validation of Ginger Kombucha: CRM and spiked fermented broth + Daily Calibration
3. Commercial Product Testing: Daily Calibration + duplicates interspersed
Specificity
Specificity was found to be acceptable based on the following.
An injection of 1-propanol as internal standard was run with every ethanol spike. Relative
retention times and AUC between ethanol and 1-propanol remained stable during the study.
Routine blanks are run on each day and after calibration runs.
Ethanol spike recovery from multiple ethanol-free control kombucha samples.
No interfering peaks (split, deformed or otherwise) were found in any of the analyses. See
Figure 1, Chromatograms)
Procedure
Validation procedures followed AOAC guidelines for single laboratory validation of botanicals and
dietary supplements (Appendix K). Two different technicians on two different instruments on two
different days evaluated the same sets of samples for precision, accuracy and reliability, as well as
repeatability and reproducibility in a separate lab.
The Covance headspace GC-FID method (method MP-ETME, Version 1, effective date: April 9, 2010)
was validated in this study according to AOAC Guidelines for Single Laboratory Validation of
Chemical Methods for Dietary Supplements and Botanicals.

Different amounts of equivalent concentrations may be substituted and are documented. Only the
alcohols requested will be prepared in the standard preparation. Standard preparations are acceptable for
use on the date of preparation only.
General Storage and Handling for Kombucha:
1. Purchase samples only if stored cold under refrigeration, with tamper-proof seal and labeled with
unique identifier (lot #).
2. Keep all materials cold at all times and do not freeze. Record all temperatures before shipment
and after receiving.
3. Transport samples in PolarTech validated insulated carton shipper with 1.5” thick refrigerant
packs or similar.
4. Use expedited (overnight) shipping unless temperature data allows for alternative transport.
5. Notify the laboratory in advance of all precautions.
6. The laboratory storage chamber must be set to maintain 5±3° C.
7. Do not permit samples to remain outside of refrigerated conditions for more than two hours.
8. Do not allow containers to remain open for more time than is needed to retrieve samples.
9. Transfer samples based on weight, not volume, to account for dissolved gases.
Standard preparation
See Reference Materials Table. The internal standard 1-propanol (Reference #2) was used as an internal
standard, since it is commonly used as an internal standard for analysis of ethanol in alcoholic beverages
and blood alcohol analysis. An amount of 1-Propanol is spiked into the commercial kombucha sample,
and separately into the ethanol standard solution at a concentration half of that expected for ethanol.
Internal Standard Preparation
1. Place approximately 70 mL water into a 100-mL volumetric flask
2. Add one to two drops of 1-propanol to the flask
3. Mix vigorously and allow settling.
Stock Standard Preparation
1. Place approx. 95 mL water into a100 mL volumetric flask
2. Add two to four drops of ethanol to the flask and record the mass.
3. Dilute to volume with water and mix well.
Working Standard Preparation
1. Place an appropriate amount of water into a 20-mL headspace vial, such athat the addition of the
Stock Standard Preparation will give a final volume of 10 mL.
2. Add an appropriate amount of Stock Standard Preparation. Typical volumes include 0.010,
0.050, 0.20, 0.50, 2.0, 5.0 and 10mL.
3. Add 50 or 100 microliters of the Internal Standard Preparation to each vial.
4. Cap and mix.

Method Blank Preparation
1. Place 10mL water into a 20-mL headspace vial.
2. Add the same amount of the Internal Standard Preparation as was added to the standards to each
vial.
3. Cap and swirl to mix.
Before preparation, commercial and control kombucha samples were allowed to warm to room
temperature in ambient conditions before opening. The samples were then weighed and transferred to
headspace vials or volumetric dilution glassware. Specific gravity was measured from a separate aliquot
of the same sample using Covance method SPGPiv.
Sample Preparation
1. Place an appropriate amount of sample (0.01-2g) into a 20-mL headspace vial.
2. Add 10 mL water to the vial, or a volume sufficient to bring it to the same level as is present in
the method blank.
3. Add the same amount of the Internal Standard Preparation as was added to the standards to each
vial.
4. Cap and Swirl to mix.
Sample Recovery Preparation
1. Place an appropriate amount of sample (0.01 to 2g) into a 20-mL headspace vial.
2. Spike 0.5 mL (or other appropriate volume) of the Stock Standard Preparation into the vial.
3. Bring the total volume to 10 mL with water
4. Add the same amount of the Internal Standard Preparation as was added to the standards to each
vial.
5. Cap and Swirl to mix.
To prepare spiked samples, pure ethanol was transferred volumetrically by the lab into a pre-weighed
amount of kombucha reference sample.
Certified Reference Materials were tested by the lab, with the expected (certified) content blinded to the
lab. Samples (intact glass ampoules) were received by NaturPro from the certifying agency (LGC,
Cerilliant or NIST). Labels were removed from the ampoules and attached into the lab notebook.
Unique identifier codes concealing the certifier code were assigned to the samples, to blind the
laboratory to the expected amount.
All samples are heated and agitated in a 20-mL headspace vial. A portion of the headspace is injected
into a gas chromatograph (GC) with a flame ionization detector (FID).
Quantitation is performed using a 6-point calibration curve generated by a weighted (1/concentration)
least squares linear regression analysis. The area response ratio of the ethanol to the 1-propanol is used
to normalize changes in injection volumes or detector response over time.
Identity of Ethanol
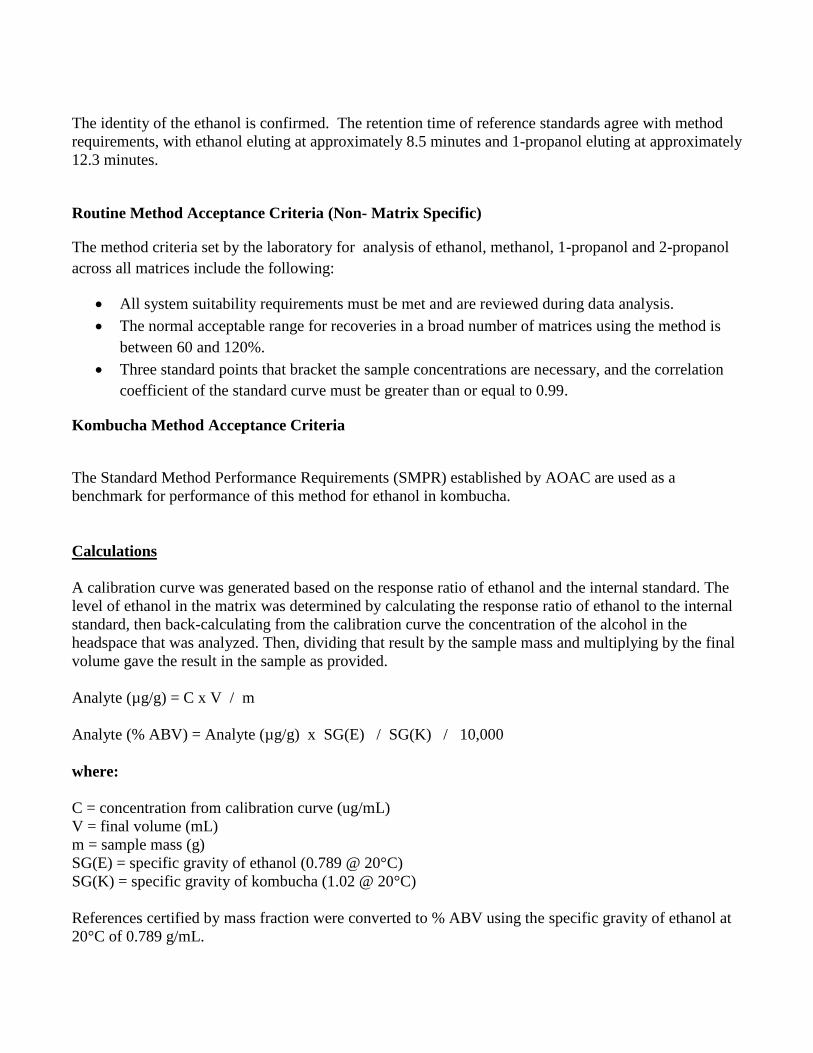
The identity of the ethanol is confirmed. The retention time of reference standards agree with method
requirements, with ethanol eluting at approximately 8.5 minutes and 1-propanol eluting at approximately
12.3 minutes.
Routine Method Acceptance Criteria (Non- Matrix Specific)
The method criteria set by the laboratory for analysis of ethanol, methanol, 1-propanol and 2-propanol
across all matrices include the following:
All system suitability requirements must be met and are reviewed during data analysis.
The normal acceptable range for recoveries in a broad number of matrices using the method is
between 60 and 120%.
Three standard points that bracket the sample concentrations are necessary, and the correlation
coefficient of the standard curve must be greater than or equal to 0.99.
Kombucha Method Acceptance Criteria
The Standard Method Performance Requirements (SMPR) established by AOAC are used as a
benchmark for performance of this method for ethanol in kombucha.
Calculations
A calibration curve was generated based on the response ratio of ethanol and the internal standard. The
level of ethanol in the matrix was determined by calculating the response ratio of ethanol to the internal
standard, then back-calculating from the calibration curve the concentration of the alcohol in the
headspace that was analyzed. Then, dividing that result by the sample mass and multiplying by the final
volume gave the result in the sample as provided.
Analyte (µg/g) = C x V / m
Analyte (% ABV) = Analyte (µg/g) x SG(E) / SG(K) / 10,000
where:
C = concentration from calibration curve (ug/mL)
V = final volume (mL)
m = sample mass (g)
SG(E) = specific gravity of ethanol (0.789 @ 20°C)
SG(K) = specific gravity of kombucha (1.02 @ 20°C)
References certified by mass fraction were converted to % ABV using the specific gravity of ethanol at
20°C of 0.789 g/mL.

Intermediate precision (RSD(R)) is presented as the standard deviation from 12 data points of
commercial kombucha taken over two days on different instruments by different technicians.
Controls
Laboratory Management
This work was performed in compliance with Covance standard operating procedures (SOPs) and
general documentation requirements of ISO 17025. Although method validations do not fall under the
scope of Good Laboratory Practice (GLPs), GLP’s were used as guidance where necessary and practical.
In many cases, this study sought to exceed testing validation requirements under GLP’s and AOAC
guidances.
Quality Assurance
A daily 6-pt calibration curve is prepared which brackets results with R>0.995. Blanks are injected after
the standards at the beginning of the sequence to assess analyte carry-over within the instrument, and
then interspersed throughout the day. Recovery samples were prepared on at least 10% of all samples in
a batch by spiking a sample with a known volume of stock standard. Duplicates were run at the
discretion of the analyst, at least once every 10 runs. Control charts from daily calibration curves are
kept and monitored.
Acceptance criteria
90-110% recovery was required for this study, based on the limits specified in the AOAC SMPR. The
minimum requirements for routine use of the method include three standard points with concentrations
bracketing the expected sample concentration, and correlation coefficient greater than or equal to 0.99.
In this validation, calibration curves with at least six different concentrations (excluding the blank) were
analyzed at the beginning of each validation analysis run except on Day 1, when calibration samples
were evenly interspersed throughout the run.
Control of bias
All samples were treated in a similar manner during purchasing, storage, transportation and processing
to minimize assay bias. All samples were stored and processed according to instructions.
Disposition of test samples
No testing of a previously opened sample shall be performed without full material review and
disclosure. Remaining unused test samples and reference standards may be kept as retained samples
under refrigerated conditions.

Data management
The raw data, including documentation, study protocol, final report, and study correspondence, resulting
from this study will be retained for at least 3 years from the date of report finalization.

Results of Validation
The study was conducted between March and July 2016. The validation was performed over multiple
days several weeks apart; the first phase included control and a commercial kombucha sample, while the
second phase added an additional control sample and seven additional commercial samples.
According to these results, the method meets the draft AOAC SMPR (Version 4, December 9, 2015) for
ethanol in kombucha.
Identification
All matrices were first identified by product labeling as ‘kombucha’, as well as visual and organoleptic
analysis. In general, kombucha was considered to be any beverage that labeled as kombucha and listing,
tea, organic acids and sugar. Matrices were selected based on a survey of the most common kombucha
products sold by nine food retailers in Carmel, Indiana. Selections were also based on preliminary
results on the alcohol content of various brands to represent a wide analytical range (0.2-2%), and were
also selected to represent a wide array of flavors, ingredients and manufacturers.
Matrices:
1. Apple Kombucha (Manufactuer #1)
2. Berry Kombucha (Manufacturer #2)
3. Elderberry Kombucha (Manufacturer #3)
4. Ginger Kombucha (Manufacturer #4)
5. Ginger Lemon Kombucha (Manufacturer #1)
6. Original Kombucha (Manufacturer #4)
7. Pineapple Kombucha (Manufacturer #5)
8. Raspberry Kombucha (Manufacturer #4)
9. Ethanol-free fermented tea, unflavored
10. Ethanol-free unfermented tea, flavored
References 9 and 10 were confirmed to contain less than 0.05% ABV.
Table 1a. Nutritional
Composition (per 8 oz
serving)
Ginger Kombucha
(Label)
Ginger Kombucha
(Result)
Ethanol-free kombucha
(Result)

Table 1a. Nutritional
Composition (per 8 oz
serving)
Ginger Kombucha
(Label)
Ginger Kombucha
(Result)
Ethanol-free kombucha
(Result)
Ethanol “This product contains a
trace amount of ethanol.”
1.44% (initial screen) <0.015%
Specific gravity (g/mL)
@ 20C
not listed 1.02% 1.00%
Moisture (%) not listed 96.5 97.1
Calories 30 33 27
Calories from Fat 0 <2.4 <2.4
Cholesterol (mg/g) 0 <0.24 <0.24
Carbohydrates (g) 7 7.8 6.4
Total Sugar (g) 2 7.8 5.4
Sucrose (g) not listed 0.5 5.4
Glucose (g) not listed 2.8 <0.1%
Fructose (g) not listed 4.5 <0.1%
Protein (g) 0 0.4 0.4
Vitamin C (mg/g) not listed <1.0 <1.0
Vitamin A (IU/g) not listed <1 <1
Calcium (mg) not listed 1 20
Iron (mg) not listed <0.2 <0.2
Sodium (mg) 10 6 38
Acetic acid (mg) 15 608 1225
Citric acid (mg) not listed 213 <118

Units 2 3 4 5 6 7 8 9
Ethanol % ABV 0.11 2.18 1.3 1.21 1.56 0.07 2.22 <0.05%
Specific gravity g/mL 1.013 1.009 1.017 1.016 1.025 1.016 1.024 1.03
Aerobic plate count
CFU/mL <10 >250000 <10 490 110000 180000 38000 >250000
Sucrose g / 100g <0.1 0.4 0.4 <0.1 0.6 7.1 0.8 4.9
Glucose g / 100g 1.2 0.6 1.6 1.3 1.2 0.3 1.3 0.3
Fructose g / 100g 1.9 0.9 2.4 2 1.9 0.2 2.1 0.5
Maltose g / 100g <0.1 <0.1 <0.1 <0.1 <0.1 <0.1 <0.1 <0.1
Lactose g / 100g <0.1 <0.1 <0.1 <0.1 <0.1 <0.1 <0.1 0.3
Total Sugar g / 100g 7.5 4.7 4.4 8 3.7 7.7 4.2 6
Sorbitol g / 100g <0.0500 <0.0500 <0.0500 <0.0500 <0.0500 <0.0500 0.0616 <0.0500
Mannitol g / 100g <0.0500 <0.0500 <0.0500 <0.0500 <0.0500 <0.0500 <0.0500 <0.0500
Maltitol g / 100g <0.0500 <0.0500 <0.0500 <0.0500 <0.0500 <0.0500 <0.0500 <0.0500
Erythritol g / 100g <0.0500 <0.0500 <0.0500 <0.0500 <0.0500 <0.0500 <0.0500 <0.0500
Xylitol g / 100g <0.0500 <0.0500 <0.0500 <0.0500 <0.0500 <0.0500 <0.0500 <0.0500
Lactitol g / 100g <0.0500 <0.0500 <0.0500 <0.0500 <0.0500 <0.0500 <0.0500 <0.0500
Isomalt GPS g / 100g <0.0500 <0.0500 <0.0500 <0.0500 <0.0500 <0.0500 <0.0500 <0.0500
Isomalt GPM g / 100g <0.0500 <0.0500 <0.0500 <0.0500 <0.0500 <0.0500 <0.0500 <0.0500
Total sugar alcohol
g / 100g <0.0500 <0.0500 <0.0500 <0.0500 <0.0500 <0.0500 0.0616 <0.0500
Table 1a (above) and 1b (previous). Nutritional analysis of commercial and control kombucha.

Figure 1: GC chromatograms of commercial kombucha and references. In spiked samples, the ethanol spike
corresponded to the internal propanol standard. The retention time of reference standards agreed with method requirements,
with ethanol eluting at approximately 8.5 minutes and 1-propanol eluting at 12.3 minutes. The identity of the ethanol was
confirmed by the corresponding retention time and relative retention time to 1-propanol. A. Commercial kombucha sample
(1); B. Water blank with 1-propanol internal standard (Ref #2); C. Ethanol standard at LOQ of 0.01272%; D. Control
kombucha with no detectable ethanol. Three replicates were analyzed and found to contain no detectable ethanol; E. Spiked
control kombucha at 0.127% ABV; F. Spiked control kombucha at 1.27% ABV; G. Spiked control kombucha at 3.30%
ABV.

See Figure 2. The required range of 0.1% to 2.8% corresponded to an “on instrument” range of 31.865
to 887.20 µL/mL. Nine concentrations were prepared for the standard curve covering an actual range of
0.005% to 5.09 % ABV. The linearity of both the interspersed and consecutive standards in the nine-
point curve had an acceptable linear regression on each day (r > 0.9996). The method was acceptable
since the standard curve had a correlation coefficient (r) of greater than or equal to 0.995, and the
individual back-calculated standard concentrations were within ±15% (±20% for LOQ) of nominal.
Day Correlation Coefficient (r)
1 0.999999
2 0.999967
3 0.999722
Figure 2: Linearity. On three separate days, nine-point calibration curves from 0.005% to 5.09% ABV were prepared with
serial dilutions of pure ethanol (Ref #4) in purified water. The correlation coefficient (r) based on linear regression analysis
was greater than 0.9996 on each day.
Precision
0
5
10
15
20
25
30
0 1 2 3 4 5 6
Are
a (x
10
0,0
00
)
% ABV

Precision was determined by analyzing six replicates of each sample of commercial kombucha over a
minimum of two days, including one day with a second analyst on a different instrument using a
different type of headspace vial (12 total replicates), intended to represent a measure of intermediate
precision.
Intermediate precision (RSD(R)) was taken as the standard deviation from all 12 data points of
commercial kombucha taken over two days. An alternative calculation for total standard deviation,
taken as the square root of the sum of each day’s standard deviations divided by the number of samples,
gave a similar result. See Figure 3.
Results (%ABV)
Replicate Day 1
1 1.5860
2 1.5885
3 1.5937
4 1.6154
5 1.5967
6 1.6102
Mean 1.60
SD 0.119
RSD(r) (%) 0.743
Day 2
1 1.6830
2 1.6048
3 1.4589
4 1.6444
5 1.6345
6 1.7181
Mean 1.62

SD 0.0900
RSD(r) (%) 5.542
Overall Mean 1.61
Overall SD 0.0626
Intermediate Precision
RSD(R) (%) 3.888
Figure 3: Precision. Ginger kombucha was found to contain 1.61% alcohol by volume (ABV) with a relative standard
deviation of +/- 0.06%. Intermediate precision, measured by the relative standard deviation (RSD) across different days,
instruments and technicians, was < 4%. Abbreviations: SD: Standard deviation; RSD: Relative standard deviation; RSD(r):
Repeatability (same-day %RSD); RSD(R) Intermediate precision (interday %RSD)
The method was considered acceptable because both the intra-day precision and intermediate precision
between days had a relative standard deviation (RSD) meeting the repeatability requirement of <4%
established by the AOAC SMPR’s. Additional data on other matrices was consistent, data available
upon request.
Accuracy
Accuracy was determined by testing duplicates at each of three spike levels of pure ethanol (Reference
#4 spiked into control kombucha (Reference #3) over three days (totaling 18 total replicates). The spike
levels were 0.13, 1.3, and 3.3% ABV.
Percent recovery ranged from 98.3 to 104.2%. The accuracy was considered acceptable since the means
of each spike level were between 90% to 110%. This method is accurate for the quantification of
ethanol in kombucha at concentrations between 0.13 to 3.3% ABV. See Figure 4.
Results
Day 0.13% 1.3% 3.3%
1 98.3 99.7 99.9

99.9 99.5 99.1
2 99.7 99.5 98.4
100.4 99.6 99.2
3 103.2 100.0 102.5
96.2 104.2 103.4
Mean 99.6 100.4 100.4
RSD(R) (%) 2.33 1.84 2.03
Figure 4a: Accuracy. Recovery for lab-spiked control kombucha samples (Reference #9) ranged from 98.3 to 104.2%
across spike levels of 0.13%, 1.3% and 3.3% ABV. Intermediate precision for each concentration ranged from 1.84 to
2.33%, with an average inter-instrument RSD (Sr) of 2.07%
Day 1
50% of 0.5% ABV spike (0.25%) 96.1%
100% of 0.5% ABV spike (0.5%) 98.0%
150% of 0.5% ABV spike (0.75%) 98.0%
Day 2
50% of 1% ABV spike (0.50%) 100.2%
100% of 1% ABV spike (1.0%) 99.6%
150% of 1% ABV spike (1.5%) 100.7%
Day 3
50% of 2% ABV spike (1.0%) 103.7%
100% of 2% ABV spike (2.0%) 104.4%
150% of 2% ABV spike (3.0%) 104.9%
Figure 4b: Accuracy. Recovery for lab-spiked control kombucha samples
Certified Reference Material (CRM) evaluation
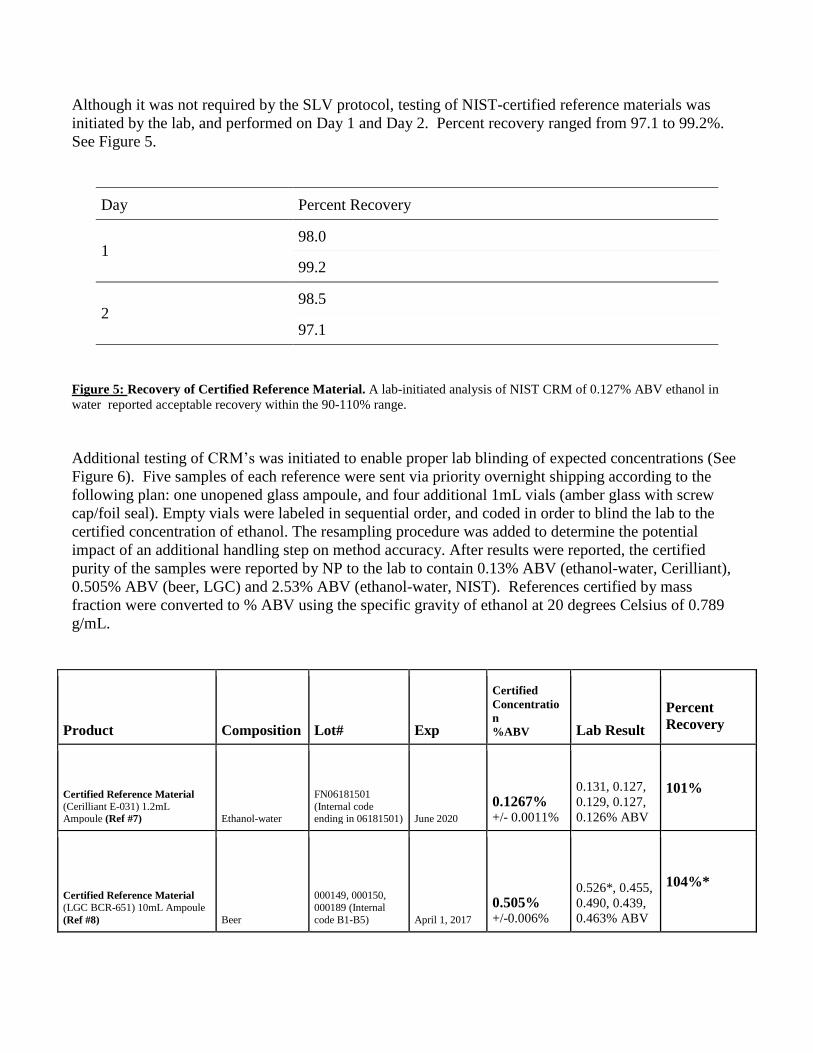
Although it was not required by the SLV protocol, testing of NIST-certified reference materials was
initiated by the lab, and performed on Day 1 and Day 2. Percent recovery ranged from 97.1 to 99.2%.
See Figure 5.
Day Percent Recovery
1 98.0
99.2
2 98.5
97.1
Figure 5: Recovery of Certified Reference Material. A lab-initiated analysis of NIST CRM of 0.127% ABV ethanol in
water reported acceptable recovery within the 90-110% range.
Additional testing of CRM’s was initiated to enable proper lab blinding of expected concentrations (See
Figure 6). Five samples of each reference were sent via priority overnight shipping according to the
following plan: one unopened glass ampoule, and four additional 1mL vials (amber glass with screw
cap/foil seal). Empty vials were labeled in sequential order, and coded in order to blind the lab to the
certified concentration of ethanol. The resampling procedure was added to determine the potential
impact of an additional handling step on method accuracy. After results were reported, the certified
purity of the samples were reported by NP to the lab to contain 0.13% ABV (ethanol-water, Cerilliant),
0.505% ABV (beer, LGC) and 2.53% ABV (ethanol-water, NIST). References certified by mass
fraction were converted to % ABV using the specific gravity of ethanol at 20 degrees Celsius of 0.789
g/mL.
Product Composition Lot# Exp
Certified
Concentratio
n
%ABV Lab Result
Percent
Recovery
Certified Reference Material
(Cerilliant E-031) 1.2mL Ampoule (Ref #7) Ethanol-water
FN06181501
(Internal code ending in 06181501) June 2020
0.1267% +/- 0.0011%
0.131, 0.127,
0.129, 0.127,
0.126% ABV
101%
Certified Reference Material (LGC BCR-651) 10mL Ampoule
(Ref #8) Beer
000149, 000150,
000189 (Internal
code B1-B5) April 1, 2017
0.505% +/-0.006%
0.526*, 0.455,
0.490, 0.439,
0.463% ABV
104%*

Certified Reference Material (NIST 2897a) 10mL Ampoule
(Ref #9) Ethanol-water
Not specified (Internal code E1-
E5) April 30, 2025
2.53% +/-0.057%
2.59*, 2.34,
2.50, 2.29,
2.34% ABV
102%*
Figure 6: Recovery of Certified Reference Material. Recovery of ethanol from all spiked samples was found to be within
acceptable limits of 90-110%. Labs were blinded to expected concentration
Average percent recovery from unopened ampoules was 102% with <4% RSD. Average recovery of
ethanol from all ampoules including repackaged ones was 95% with 6% RSD. These were all considered
acceptable since average recovery was between 95 and 102% and RSD values were similar to those
established by AOAC Method Performance Requirements for kombucha.
The intermediate precision and repeatability for the validation samples were considered acceptable.
Although Horwitz ratio (HorRat) is intended for assessing reproducibility for interlaboratory
collaborative studies, it was calculated for the validation samples based on different instruments and
technicians. Results were considered to be within the acceptable range of .
Matrix Analyte HorRat Mean % v/v Confidence
Int. %RSD
2 Ethanol % v/v 0.40 0.11 0.00 2.21
3 Ethanol % v/v 0.60 2.18 0.03 2.14
4 Ethanol % v/v 0.57 1.30 0.02 2.18
5 Ethanol % v/v 0.46 1.21 0.01 1.80
6 Ethanol % v/v 0.45 1.56 0.02 1.67
7 Ethanol % v/v 0.28 0.07 0.00 1.70
8 Ethanol % v/v 0.46 2.22 0.02 1.62
Figure 7. % RSD and Horwitz ratio for validation samples..
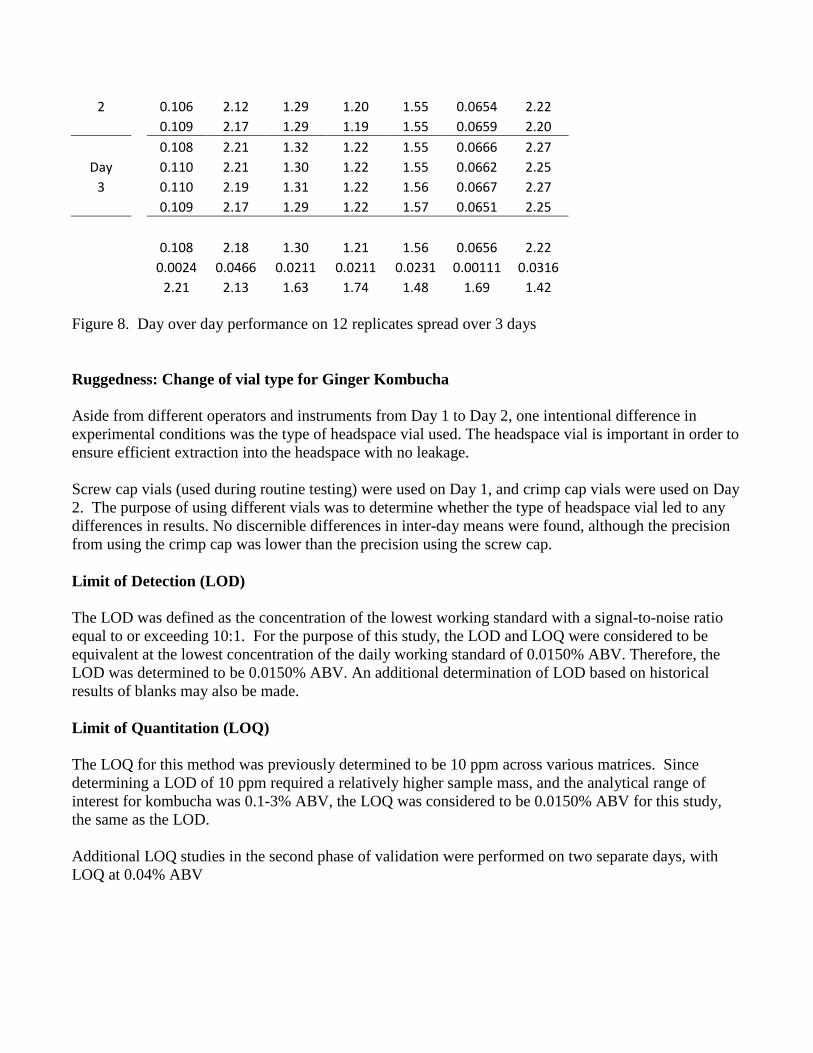
Day over Day Performance
2 3 4 5 6 7 8
0.112 2.09 1.34 1.23 1.61 0.0642 2.20
Day
0.111 2.24 1.27 1.24 1.58 0.0669 2.20
1
0.105 2.24 1.27 1.25 1.59 0.0630 2.17
0.108 2.23 1.27 1.18 1.58 0.0658 2.21
0.104 2.17 1.30 1.19 1.54 0.0660 2.22
Day
0.109 2.16 1.29 1.21 1.53 0.0656 2.20
2
0.106 2.12 1.29 1.20 1.55 0.0654 2.22
0.109 2.17 1.29 1.19 1.55 0.0659 2.20
0.108 2.21 1.32 1.22 1.55 0.0666 2.27
Day
0.110 2.21 1.30 1.22 1.55 0.0662 2.25
3
0.110 2.19 1.31 1.22 1.56 0.0667 2.27
0.109 2.17 1.29 1.22 1.57 0.0651 2.25
0.108 2.18 1.30 1.21 1.56 0.0656 2.22
0.0024 0.0466 0.0211 0.0211 0.0231 0.00111 0.0316
2.21 2.13 1.63 1.74 1.48 1.69 1.42
Figure 8. Day over day performance on 12 replicates spread over 3 days
Ruggedness: Change of vial type for Ginger Kombucha
Aside from different operators and instruments from Day 1 to Day 2, one intentional difference in
experimental conditions was the type of headspace vial used. The headspace vial is important in order to
ensure efficient extraction into the headspace with no leakage.
Screw cap vials (used during routine testing) were used on Day 1, and crimp cap vials were used on Day
2. The purpose of using different vials was to determine whether the type of headspace vial led to any
differences in results. No discernible differences in inter-day means were found, although the precision
from using the crimp cap was lower than the precision using the screw cap.
Limit of Detection (LOD)
The LOD was defined as the concentration of the lowest working standard with a signal-to-noise ratio
equal to or exceeding 10:1. For the purpose of this study, the LOD and LOQ were considered to be
equivalent at the lowest concentration of the daily working standard of 0.0150% ABV. Therefore, the
LOD was determined to be 0.0150% ABV. An additional determination of LOD based on historical
results of blanks may also be made.
Limit of Quantitation (LOQ)
The LOQ for this method was previously determined to be 10 ppm across various matrices. Since
determining a LOD of 10 ppm required a relatively higher sample mass, and the analytical range of
interest for kombucha was 0.1-3% ABV, the LOQ was considered to be 0.0150% ABV for this study,
the same as the LOD.
Additional LOQ studies in the second phase of validation were performed on two separate days, with
LOQ at 0.04% ABV
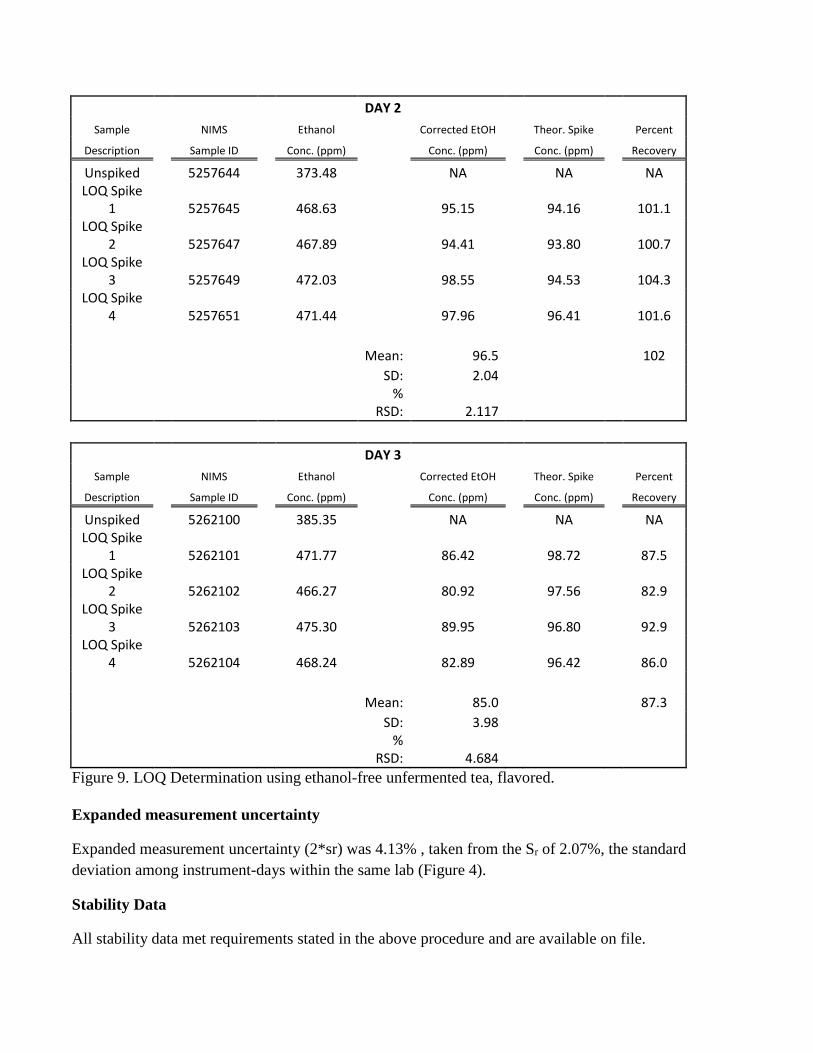
DAY 2
Sample
NIMS
Ethanol
Corrected EtOH
Theor. Spike
Percent
Description
Sample ID
Conc. (ppm)
Conc. (ppm)
Conc. (ppm)
Recovery
Unspiked
5257644
373.48
NA
NA
NA LOQ Spike
1
5257645
468.63
95.15
94.16
101.1 LOQ Spike
2
5257647
467.89
94.41
93.80
100.7 LOQ Spike
3
5257649
472.03
98.55
94.53
104.3 LOQ Spike
4
5257651
471.44
97.96
96.41
101.6
Mean: 96.5
102
SD: 2.04
%
RSD: 2.117
DAY 3
Sample
NIMS
Ethanol
Corrected EtOH
Theor. Spike
Percent
Description
Sample ID
Conc. (ppm)
Conc. (ppm)
Conc. (ppm)
Recovery
Unspiked
5262100
385.35
NA
NA
NA LOQ Spike
1
5262101
471.77
86.42
98.72
87.5 LOQ Spike
2
5262102
466.27
80.92
97.56
82.9 LOQ Spike
3
5262103
475.30
89.95
96.80
92.9 LOQ Spike
4
5262104
468.24
82.89
96.42
86.0
Mean: 85.0
87.3
SD: 3.98
%
RSD: 4.684
Figure 9. LOQ Determination using ethanol-free unfermented tea, flavored.
Expanded measurement uncertainty
Expanded measurement uncertainty (2*sr) was 4.13% , taken from the Sr of 2.07%, the standard
deviation among instrument-days within the same lab (Figure 4).
Stability Data
All stability data met requirements stated in the above procedure and are available on file.

i AOAC Standard Method Performance Requirements, 2012 ii AOAC Guidelines for Single Laboratory Validation of Chemical Methods for Dietary Supplements
and Botanicals iii Covance Method MP-ETME, Ref. Anthony, Sutheimer and Sunshine, Acetaldehyde, Methanol and
Ethanol Analysis by Headspace Gas Chromatography, Journal of Analytical Toxicology, Vol 4, Number
1, January 1980 43-45 iv Covance method SPGP, Ref NIST Handbook 133 for Net Content of Packaged Goods.