
Singapore’s Electricity Industry - iitk.ac.in - 15 - Singapore/ppts/Day - 1... · the economic...
23
Singapore’s Electricity Industry
Transcript of Singapore’s Electricity Industry - iitk.ac.in - 15 - Singapore/ppts/Day - 1... · the economic...
Singapore’s Electricity Industry
Smart Energy, Sustainable Future
About the Energy Market Authority (EMA)
2
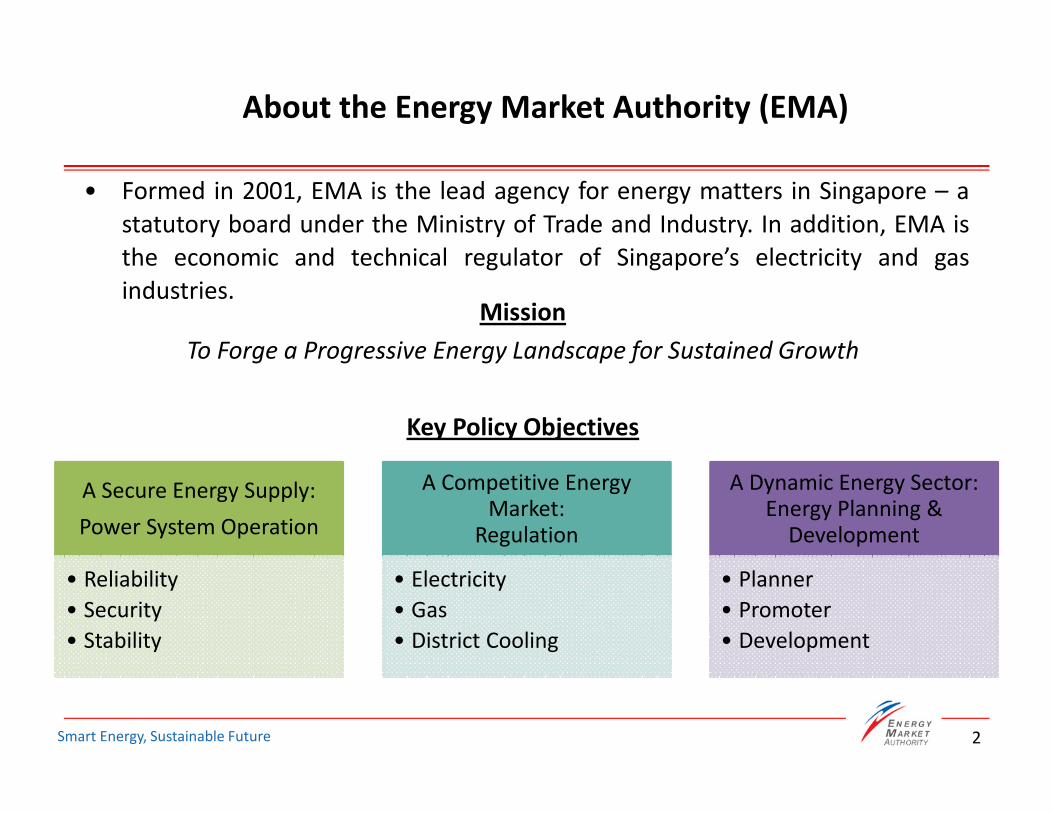
Mission
To Forge a Progressive Energy Landscape for Sustained Growth
Key Policy Objectives
• Formed in 2001, EMA is the lead agency for energy matters in Singapore – a
statutory board under the Ministry of Trade and Industry. In addition, EMA is
the economic and technical regulator of Singapore’s electricity and gas
industries.
A Secure Energy Supply:
Power System Operation
• Reliability
• Security
• Stability
A Competitive Energy Market:
Regulation
• Electricity
• Gas
• District Cooling
A Dynamic Energy Sector:Energy Planning &
Development
• Planner
• Promoter
• Development
Smart Energy, Sustainable Future
Reform of Singapore’s Electricity Industry
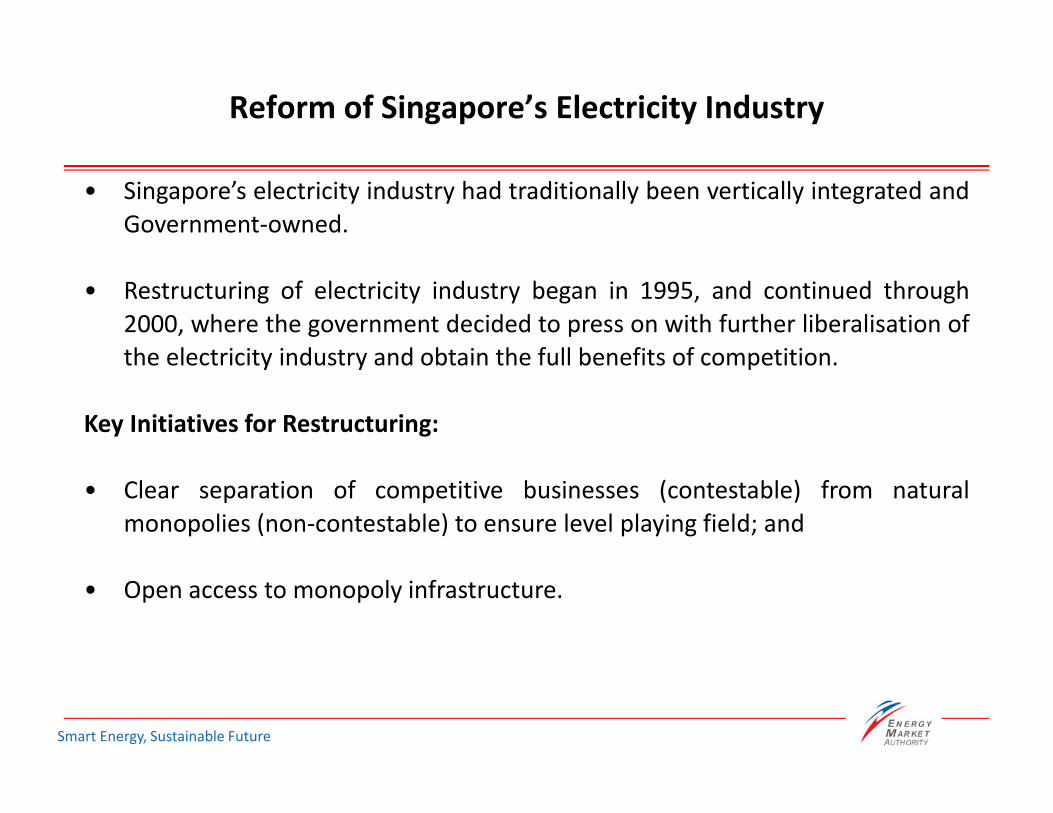
• Singapore’s electricity industry had traditionally been vertically integrated and
Government-owned.
• Restructuring of electricity industry began in 1995, and continued through
2000, where the government decided to press on with further liberalisation of
the electricity industry and obtain the full benefits of competition.
Key Initiatives for Restructuring:
• Clear separation of competitive businesses (contestable) from natural
monopolies (non-contestable) to ensure level playing field; and
• Open access to monopoly infrastructure.
Smart Energy, Sustainable Future
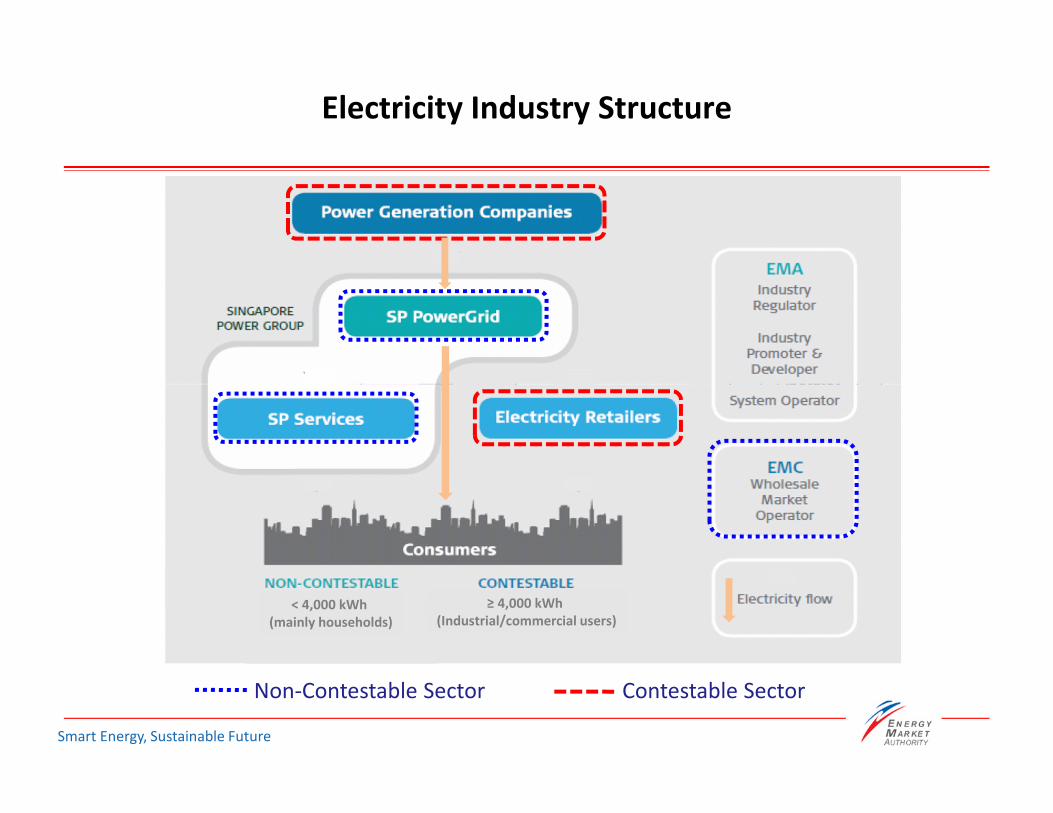
Electricity Industry Structure
Non-Contestable Sector Contestable Sector
≥ 4,000 kWh
(Industrial/commercial users)< 4,000 kWh
(mainly households)
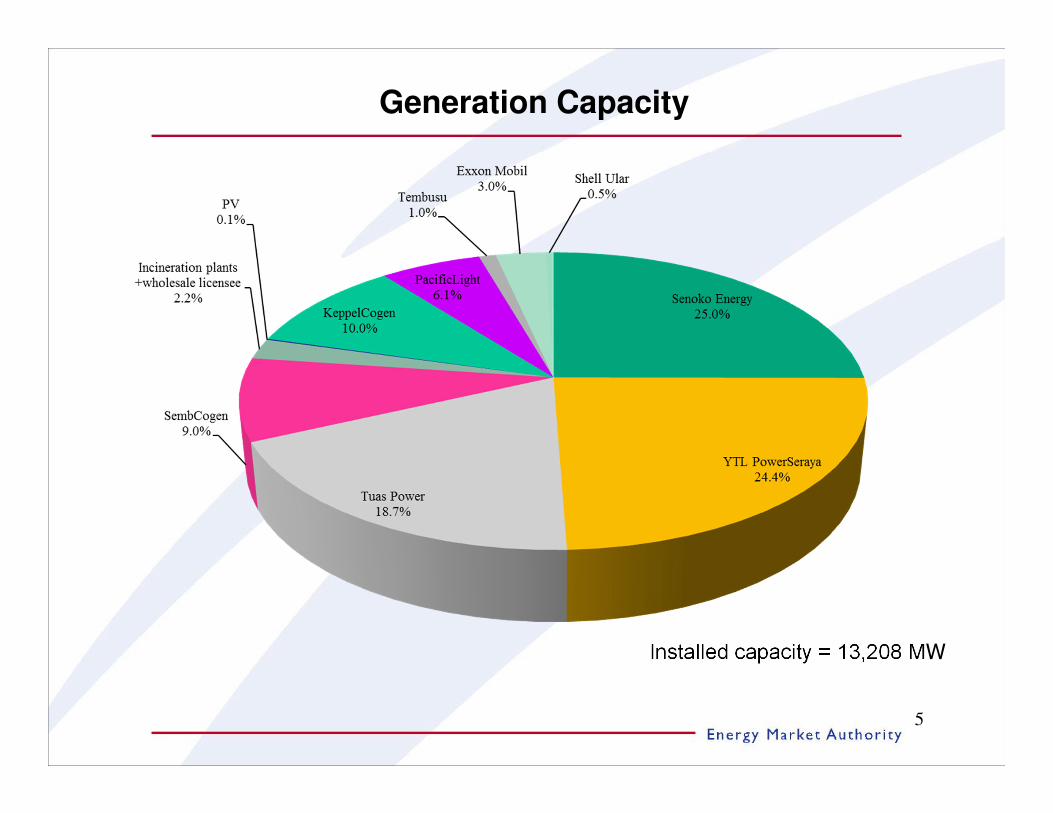
Generation Capacity
5
Installed capacity = 13,208 MW
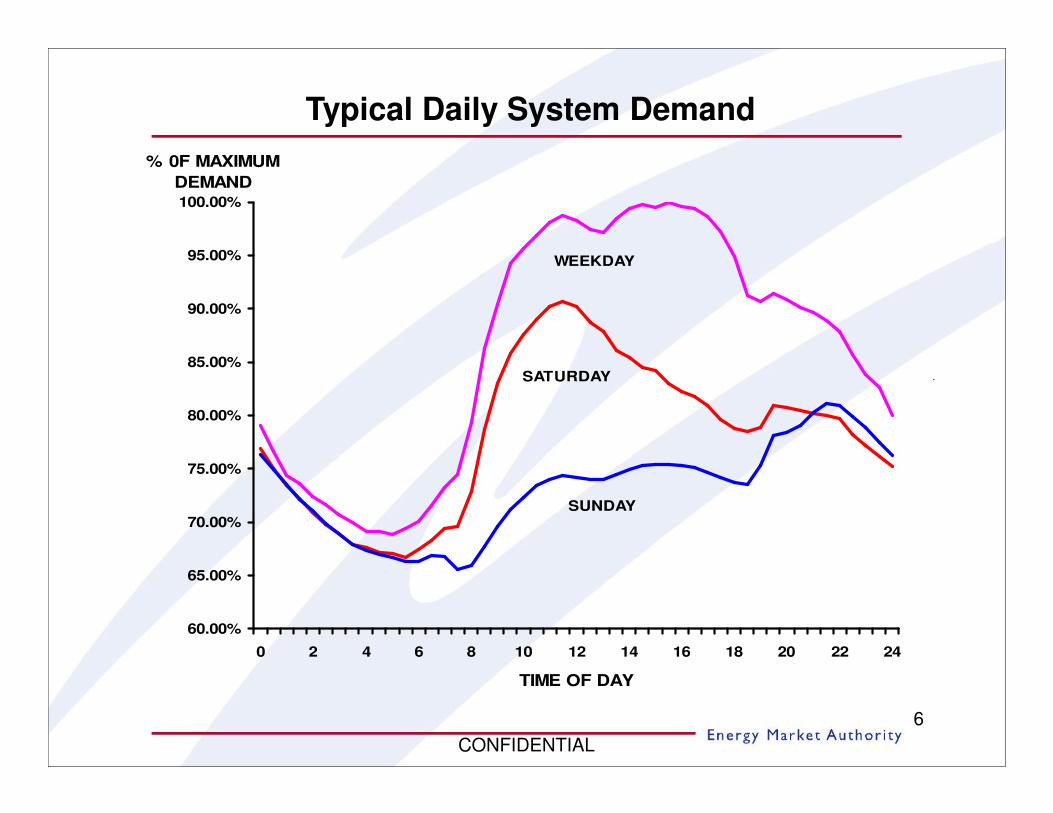
Typical Daily System Demand
60.00%
65.00%
70.00%
75.00%
80.00%
85.00%
90.00%
95.00%
100.00%
0 2 4 6 8 10 12 14 16 18 20 22 24
TIME OF DAY
% 0F MAXIMUM
DEMAND
WEEKDAY
SATURDAY
SUNDAY
6
CONFIDENTIAL
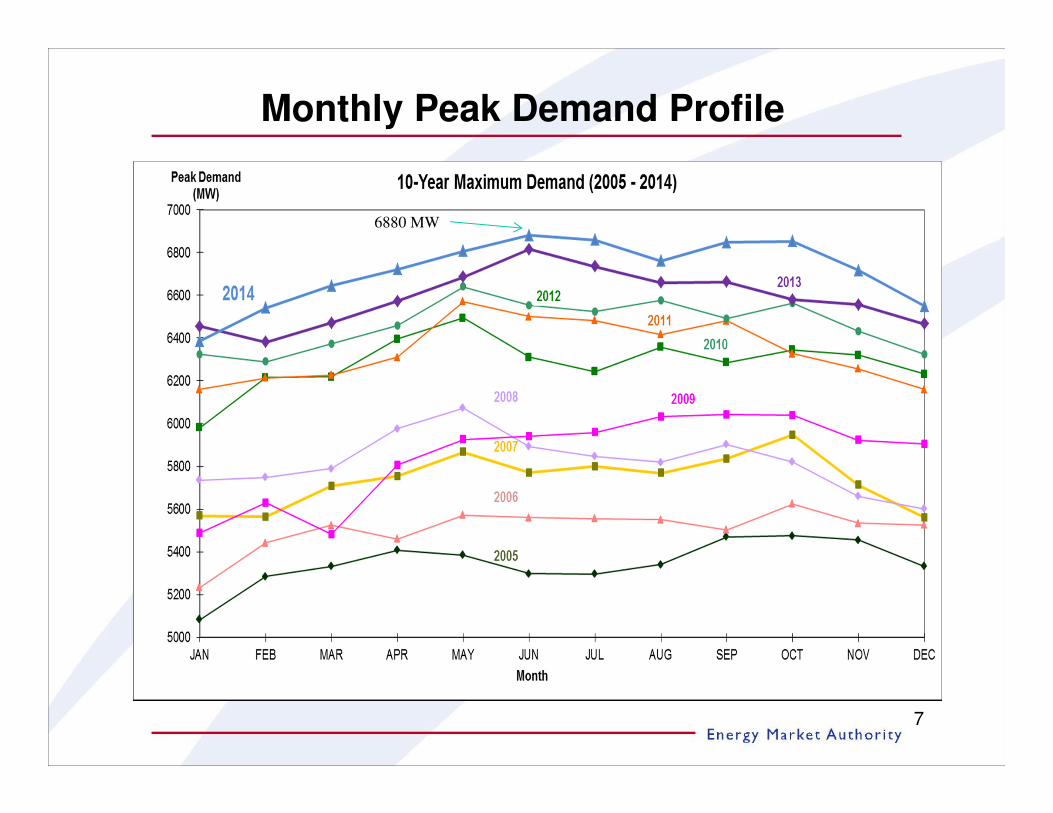
Monthly Peak Demand Profile
7
6880 MW
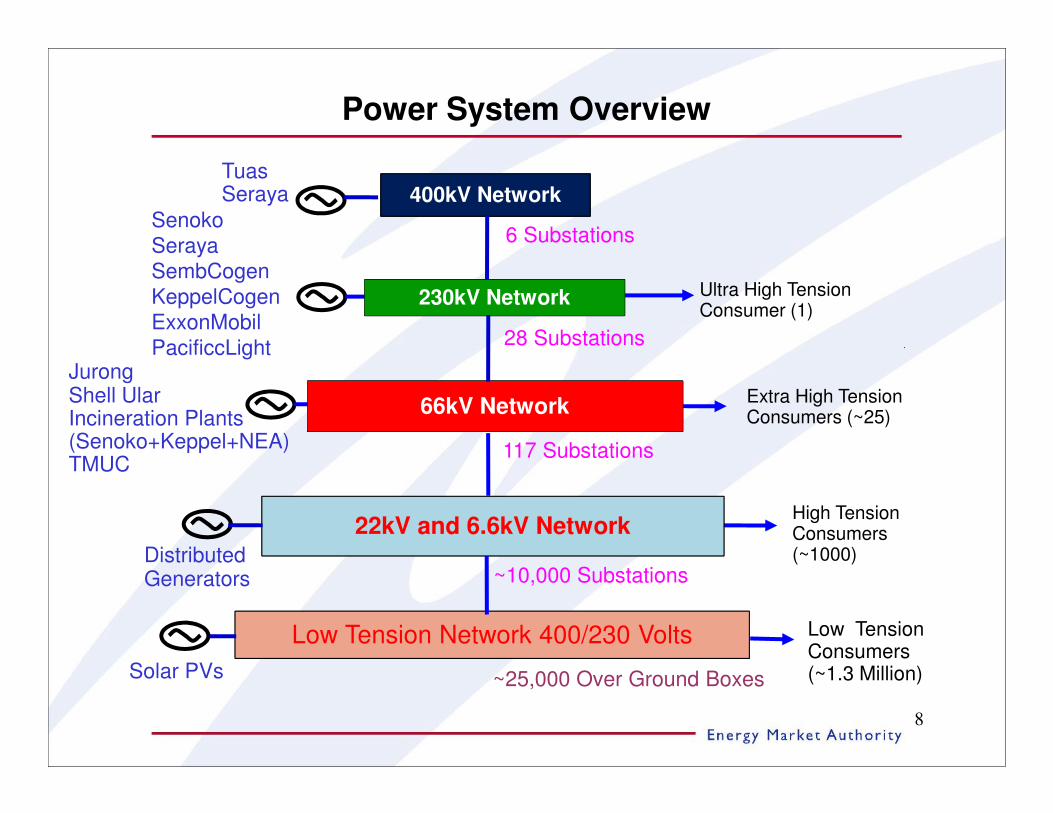
Power System Overview
High Tension Consumers (~1000)
~10,000 Substations
TuasSeraya
Low Tension Network 400/230 Volts
400kV Network
Ultra High Tension Consumer (1)
Senoko
Seraya
SembCogen
KeppelCogen
ExxonMobil
PacificcLight
Extra High Tension Consumers (~25)
117 Substations
28 Substations
6 Substations
Low Tension Consumers (~1.3 Million)
230kV Network
66kV Network
22kV and 6.6kV Network
~25,000 Over Ground Boxes
JurongShell UlarIncineration Plants (Senoko+Keppel+NEA)TMUC
Distributed Generators
Solar PVs
8
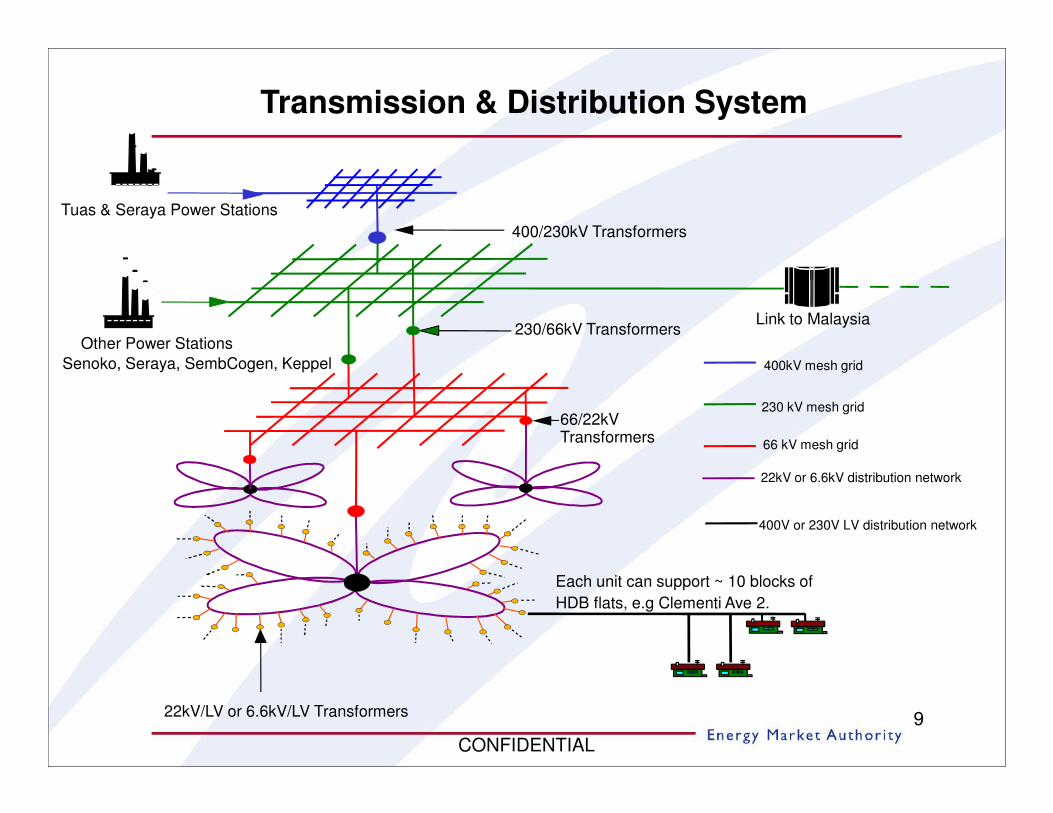
Transmission & Distribution System
9
Tuas & Seraya Power Stations
Other Power Stations
Senoko, Seraya, SembCogen, Keppel
22kV/LV or 6.6kV/LV Transformers
Link to Malaysia
400kV mesh grid
22kV or 6.6kV distribution network
66 kV mesh grid
230 kV mesh grid
230/66kV Transformers
66/22kV Transformers
400/230kV Transformers
Each unit can support ~ 10 blocks of
HDB flats, e.g Clementi Ave 2.
400V or 230V LV distribution network
CONFIDENTIAL
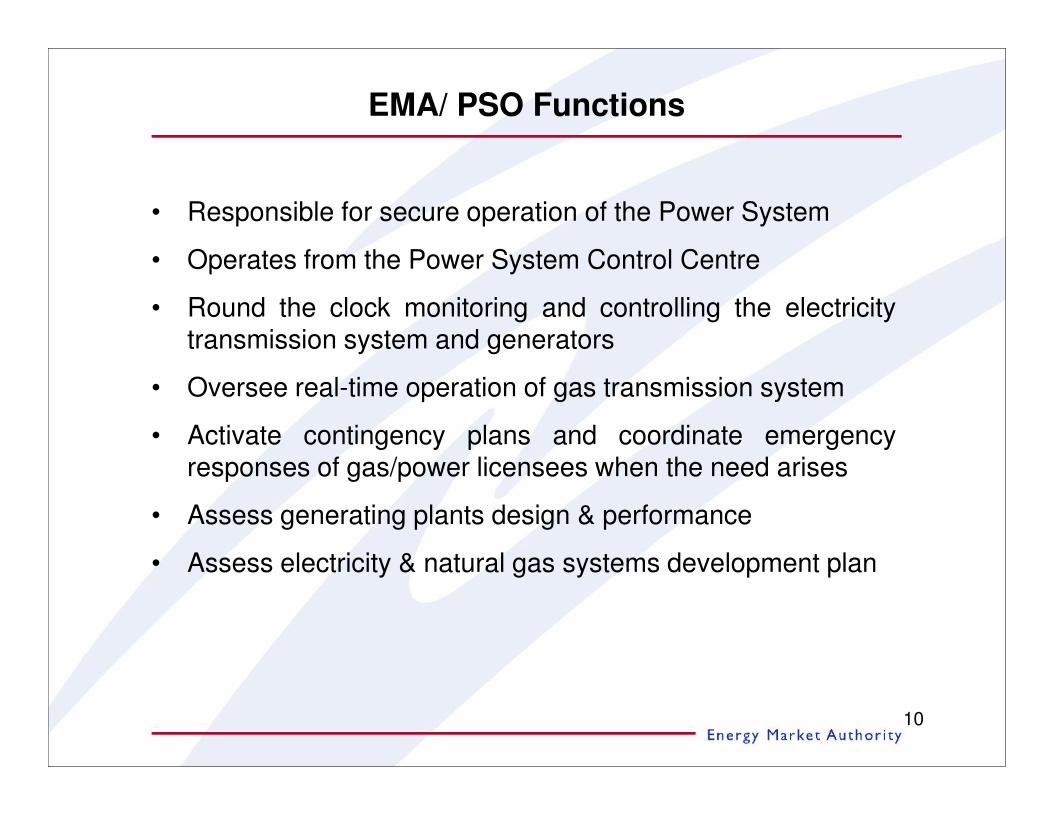
• Responsible for secure operation of the Power System
• Operates from the Power System Control Centre
• Round the clock monitoring and controlling the electricitytransmission system and generators
• Oversee real-time operation of gas transmission system
• Activate contingency plans and coordinate emergencyresponses of gas/power licensees when the need arises
• Assess generating plants design & performance
• Assess electricity & natural gas systems development plan
EMA/ PSO Functions
10
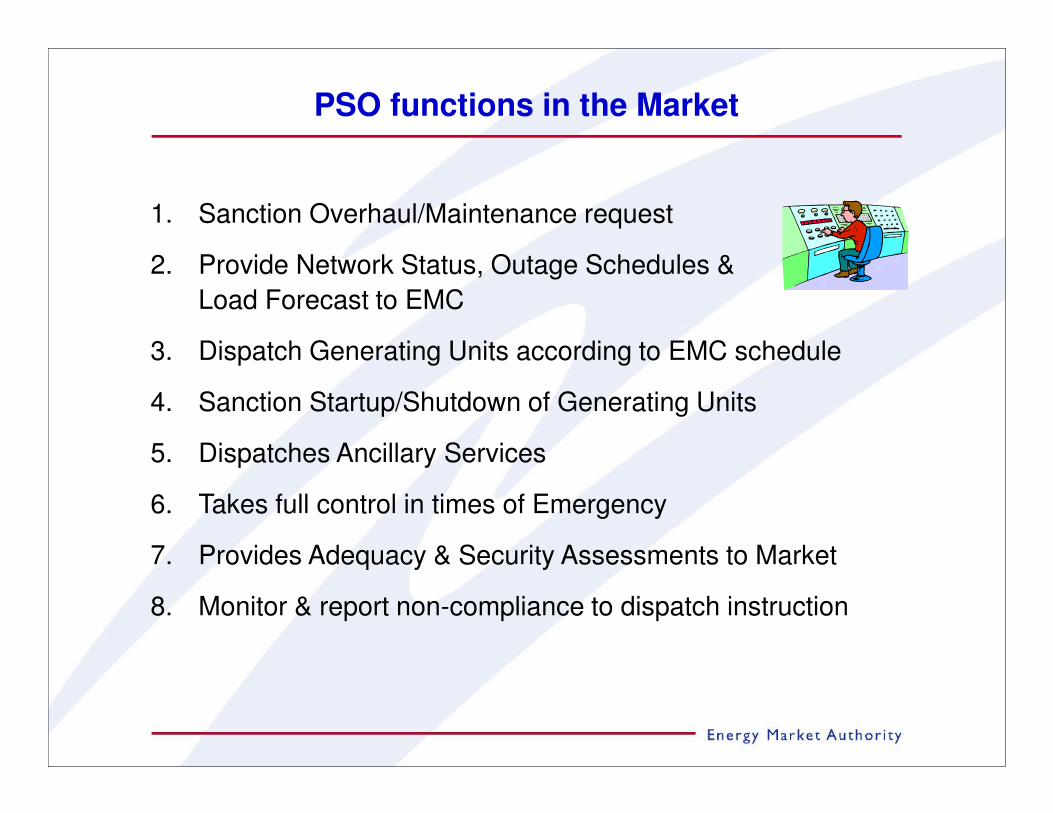
1. Sanction Overhaul/Maintenance request
2. Provide Network Status, Outage Schedules &
Load Forecast to EMC
3. Dispatch Generating Units according to EMC schedule
4. Sanction Startup/Shutdown of Generating Units
5. Dispatches Ancillary Services
6. Takes full control in times of Emergency
7. Provides Adequacy & Security Assessments to Market
8. Monitor & report non-compliance to dispatch instruction
PSO functions in the Market
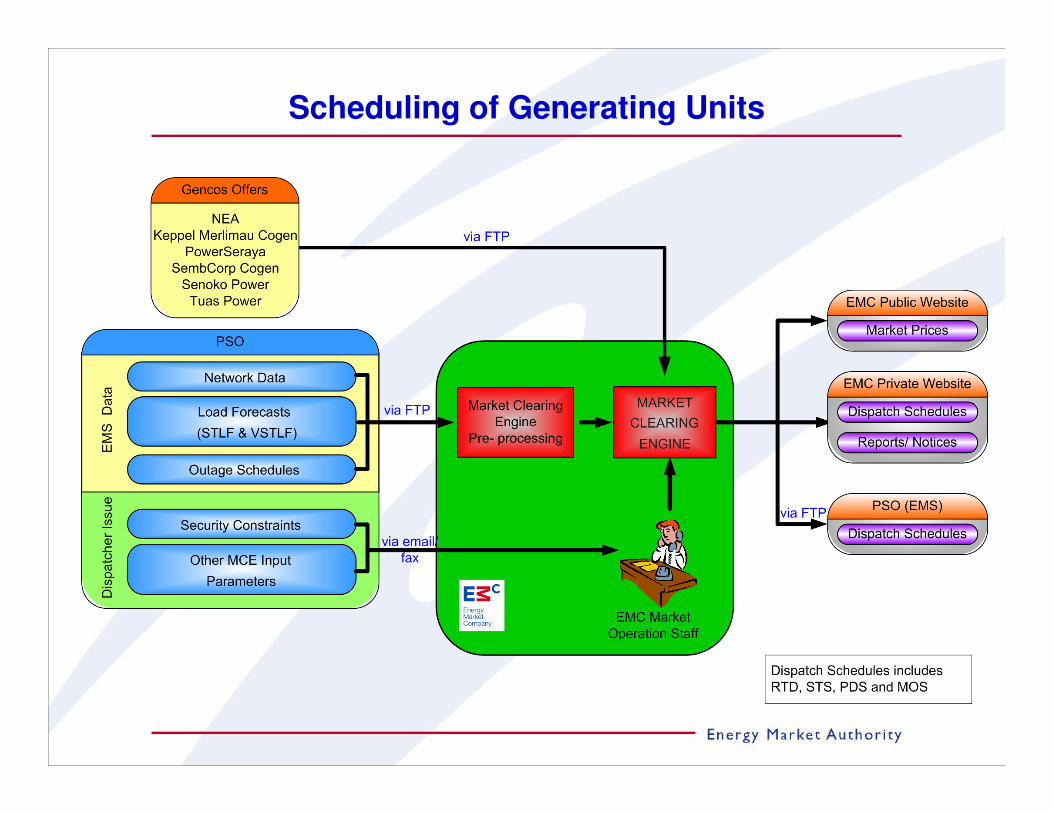
Scheduling of Generating Units
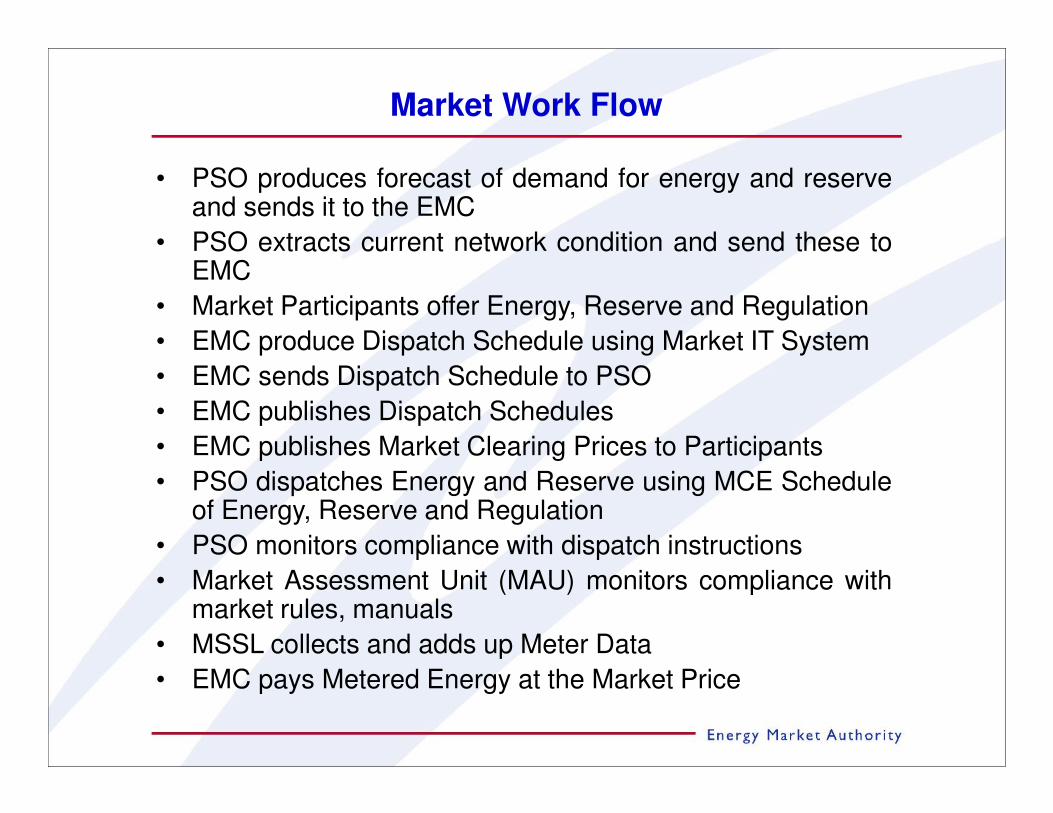
Market Work Flow
• PSO produces forecast of demand for energy and reserveand sends it to the EMC
• PSO extracts current network condition and send these toEMC
• Market Participants offer Energy, Reserve and Regulation
• EMC produce Dispatch Schedule using Market IT System
• EMC sends Dispatch Schedule to PSO
• EMC publishes Dispatch Schedules
• EMC publishes Market Clearing Prices to Participants
• PSO dispatches Energy and Reserve using MCE Scheduleof Energy, Reserve and Regulation
• PSO monitors compliance with dispatch instructions
• Market Assessment Unit (MAU) monitors compliance withmarket rules, manuals
• MSSL collects and adds up Meter Data
• EMC pays Metered Energy at the Market Price
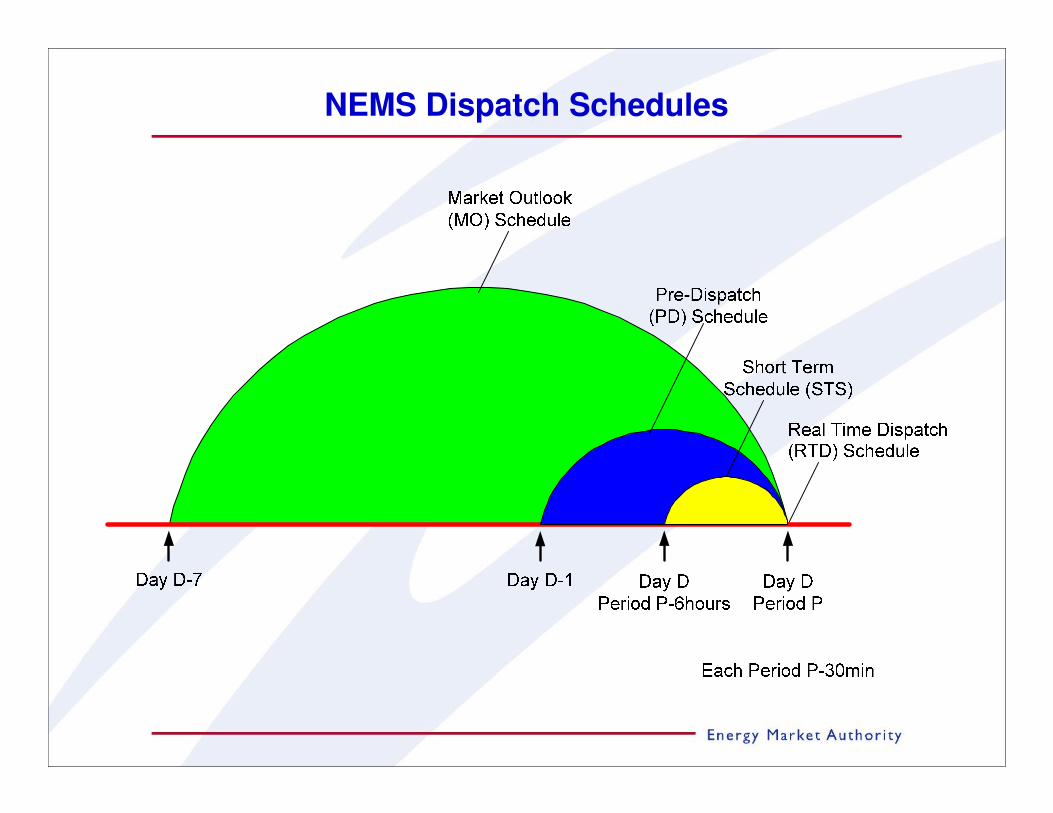
NEMS Dispatch Schedules
Smart Energy, Sustainable Future
REGULATORY FRAMEWORK
Smart Energy, Sustainable Future
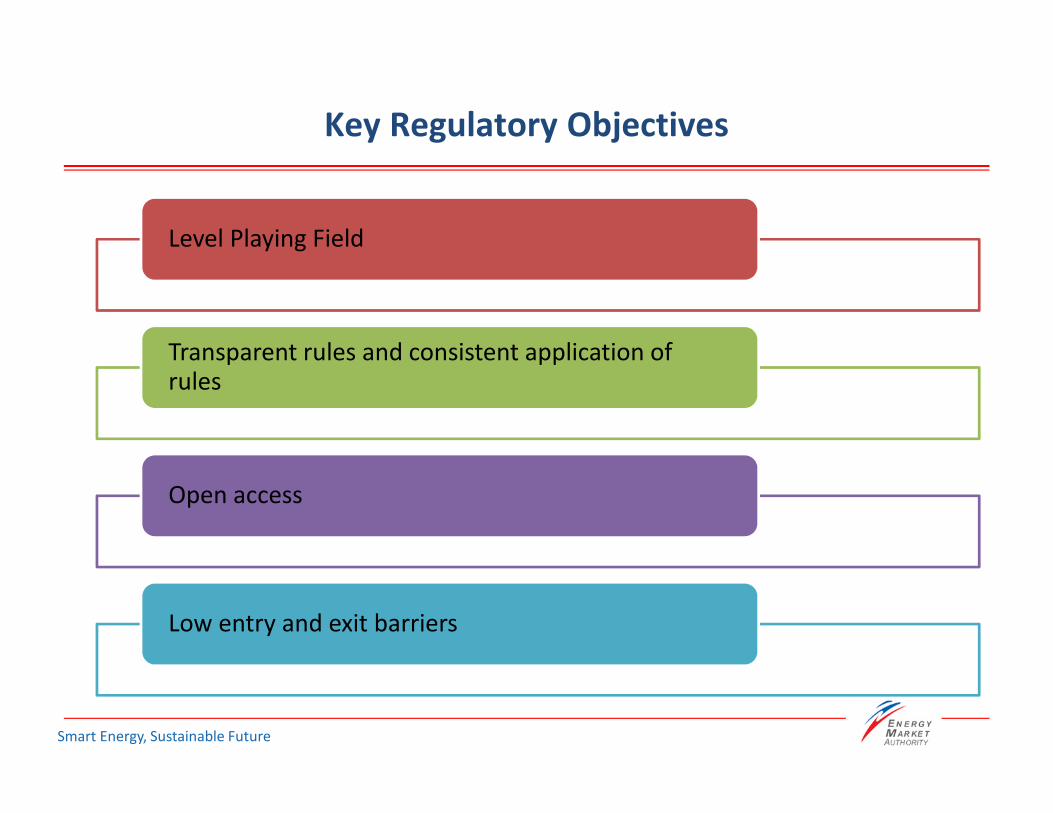
Key Regulatory Objectives
Level Playing Field
Transparent rules and consistent application of rules
Open access
Low entry and exit barriers
Smart Energy, Sustainable Future
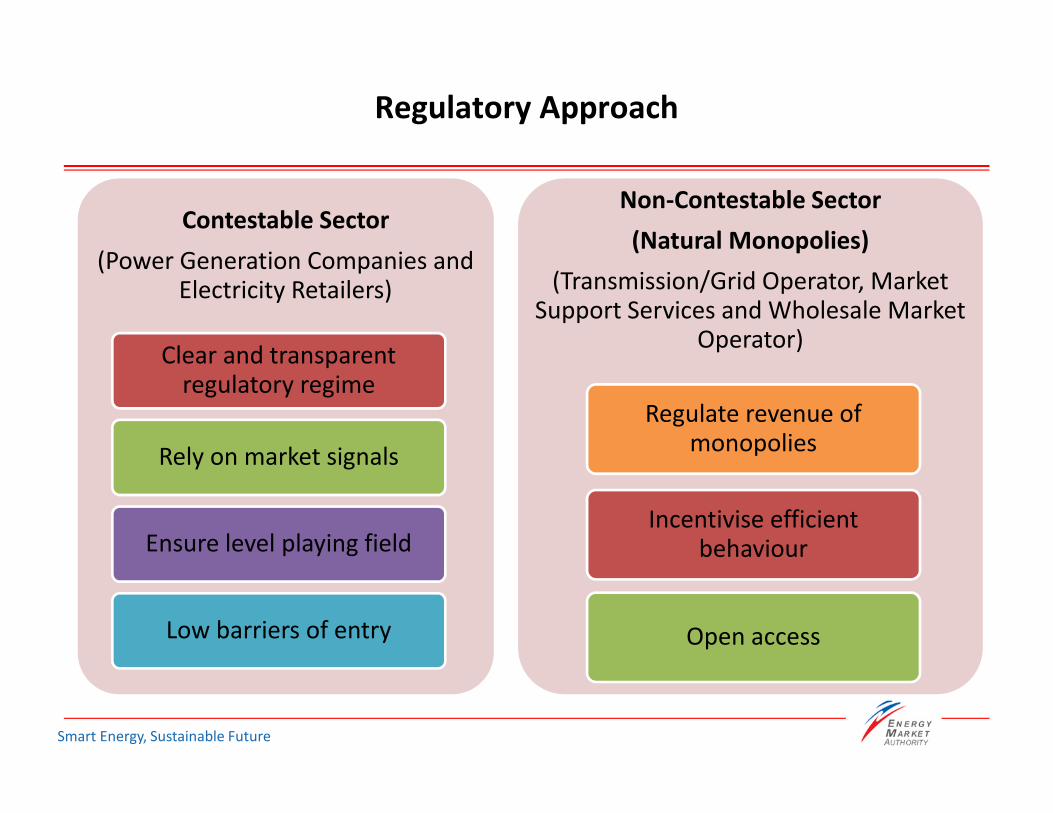
Regulatory Approach
Contestable Sector
(Power Generation Companies and Electricity Retailers)
Clear and transparent regulatory regime
Rely on market signals
Ensure level playing field
Low barriers of entry
Non-Contestable Sector
(Natural Monopolies)
(Transmission/Grid Operator, Market Support Services and Wholesale Market
Operator)
Regulate revenue of monopolies
Incentivise efficient behaviour
Open access
Smart Energy, Sustainable Future
Competition in Contestable Sector
• In the electricity generation and retail businesses, companies compete with
one another for dispatch and customers. By keeping the market competitive,
these companies should be unable to raise price at the detriment of
consumers.
• However, there are three large Gencos in the electricity generation business.
As such, EMA introduced the Vesting Contracts to curb the potential exercise
of market power.
Smart Energy, Sustainable Future
• Introduced in 2004 as a regulatory instrument to curb the potential exercise of
market power by the gencos. Specifically, Vesting Contracts:
� Commit gencos to sell a specified amount of electricity (viz. Vesting Contract level)
at a specified price (viz. Vesting Price).
� Removes incentive for gencos to withhold capacity to bid up spot prices in the
wholesale electricity market.
• Vesting contract level and price reviewed every two years:
� Vesting contract level is set based on projected demand and supply at the point of
review and using a game theoretic simulation model to simulate non-collusive
interactions among the gencos.
� Vesting price is set based on the long run marginal cost (LRMC) of the most
efficient generation technology that accounts for at least 25% of our system
demand.
Mitigating Market Power
Smart Energy, Sustainable Future
Economic Regulation of Non-Contestable Sector
• Transmission and Grid Operator, Market Support Services and Wholesale
Market Operator are natural monopolies. These companies have the potential
to raise price and restrict the quantity/quality of goods and services offered.
Example: SP PowerAssets (SPPA)
� SPPA is the entity that owns the national electricity transmission system used to
transmit electricity from gencos to consumers.
� Consumers pay grid charges (also known as UOS charges) to SPPA. Consumers
connected at HT and above need to contract for capacity with SPPA and pay
contracted capacity charges.
� SPPA’s average grid charges are regulated by EMA and are determined under its 5-
year regulatory framework.
Smart Energy, Sustainable Future
Price-Regulation Framework
• Building Block approach
• Allowed Revenue = operating costs + depreciation + taxes + allowed return
• Incentive mechanism to incentivise efficient behaviour
• 5-year Regulatory period - Parameters are fixed during the 5-year period.
Smart Energy, Sustainable Future
Results of Market Liberalisation
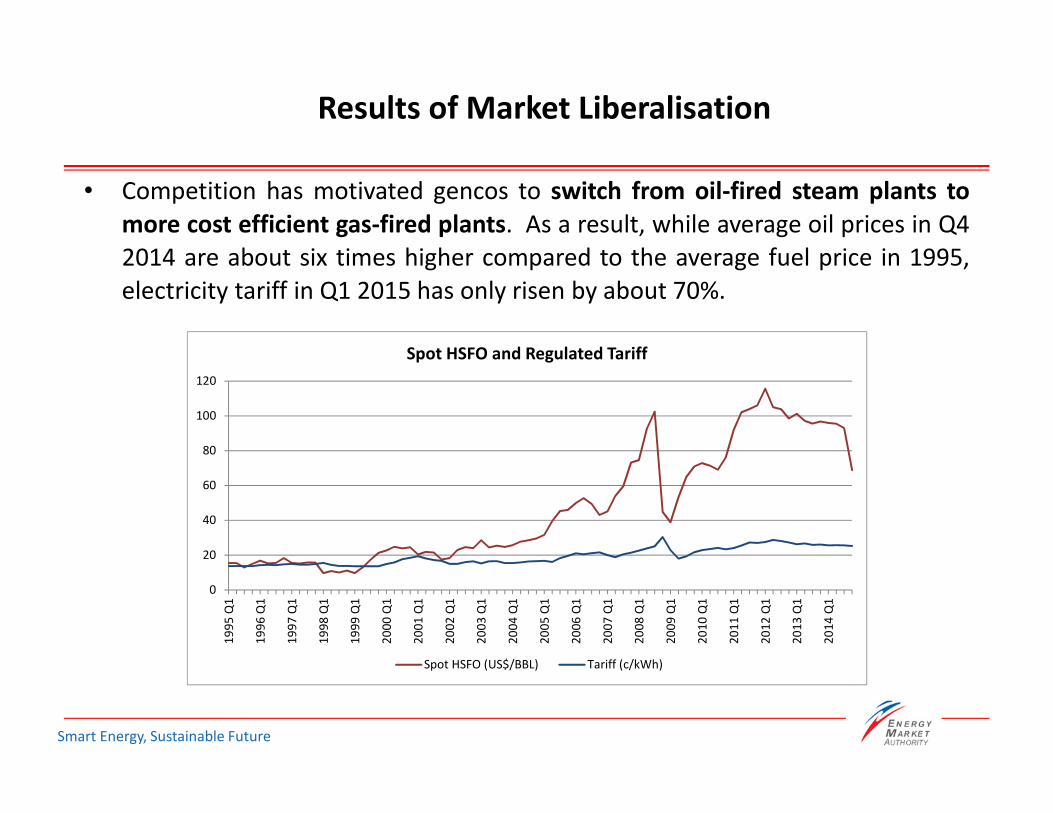
• Competition has motivated gencos to switch from oil-fired steam plants to
more cost efficient gas-fired plants. As a result, while average oil prices in Q4
2014 are about six times higher compared to the average fuel price in 1995,
electricity tariff in Q1 2015 has only risen by about 70%.
0
20
40
60
80
100
120
19
95
Q1
19
96
Q1
19
97
Q1
19
98
Q1
19
99
Q1
20
00
Q1
20
01
Q1
20
02
Q1
20
03
Q1
20
04
Q1
20
05
Q1
20
06
Q1
20
07
Q1
20
08
Q1
20
09
Q1
20
10
Q1
20
11
Q1
20
12
Q1
20
13
Q1
20
14
Q1
Spot HSFO and Regulated Tariff
Spot HSFO (US$/BBL) Tariff (c/kWh)
Smart Energy, Sustainable Future
Results of Market Liberalisation
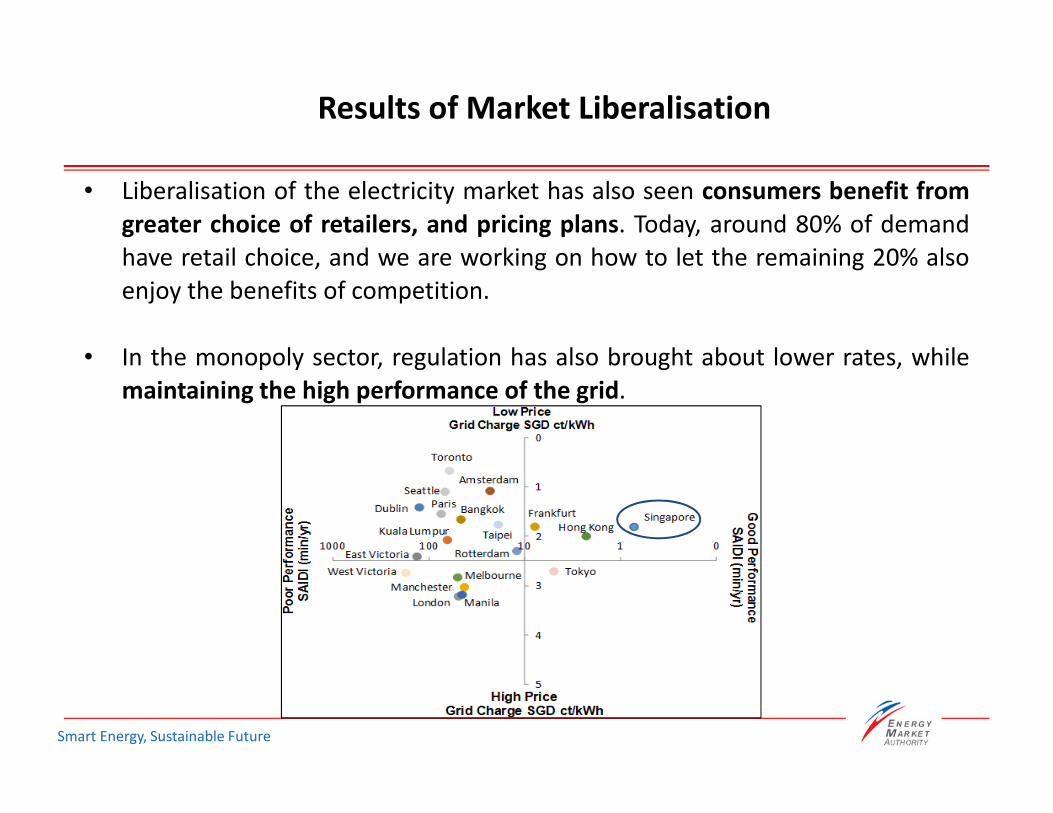
• Liberalisation of the electricity market has also seen consumers benefit from
greater choice of retailers, and pricing plans. Today, around 80% of demand
have retail choice, and we are working on how to let the remaining 20% also
enjoy the benefits of competition.
• In the monopoly sector, regulation has also brought about lower rates, while
maintaining the high performance of the grid.