Singapore Tourism Board Tourism Board International Visitor Arrivals Statistics Published Date: 29...
6
Singapore Tourism Board International Visitor Arrivals Statistics Published Date: 29 February 2016 Statistical Tables 1.1 All Mode of Arrival 1.2 Air 1.3 Sea 1.4 Land Explanatory Note CONTENTS Monthly International Visitor Arrivals by Country of Residence and Mode of Arrival, January-December 2015
Transcript of Singapore Tourism Board Tourism Board International Visitor Arrivals Statistics Published Date: 29...
Singapore Tourism BoardInternational Visitor Arrivals Statistics
Published Date: 29 February 2016
Statistical Tables
1.1 All Mode of Arrival
1.2 Air
1.3 Sea
1.4 Land
Explanatory Note
CONTENTS
Monthly International Visitor Arrivals by Country of Residence and Mode of Arrival, January-December 2015

Singapore Tourism BoardInternational Visitor Arrivals Statistics
Published Date: 29 February 2016
JAN FEB MAR APR MAY JUN JUL AUG SEP OCT NOV DEC JAN-DEC JAN FEB MAR APR MAY JUN JUL AUG SEP OCT NOV DEC JAN-DEC
Country of Residence 2015 2015 2015 2015 2015 2015 2015 2015 2015 2015 2015 2015 2015 15 vs 14 15 vs 14 15 vs 14 15 vs 14 15 vs 14 15 vs 14 15 vs 14 15 vs 14 15 vs 14 15 vs 14 15 vs 14 15 vs 14 15 vs 14
TOTAL 1,252,608 1,188,818 1,201,648 1,208,624 1,222,836 1,184,747 1,519,233 1,445,062 1,131,976 1,246,947 1,203,992 1,424,978 15,231,469 -6.9 -4.0 -7.4 -2.9 1.2 0.3 7.9 6.0 3.0 3.6 5.2 4.7 0.9
AMERICAS 64,780 57,924 64,765 49,145 48,014 55,325 56,524 49,943 42,354 52,975 55,156 60,391 657,296 7.3 -1.8 -3.2 0.7 3.6 9.3 3.6 4.1 -0.2 10.4 5.4 4.2 3.5
Canada 10,875 9,915 10,515 7,086 6,637 5,914 6,984 6,734 5,196 7,858 8,581 9,952 96,247 5.4 -2.0 -3.6 3.3 -2.4 7.2 -1.0 1.4 3.5 17.4 12.0 7.8 3.7
USA 46,845 42,427 48,341 36,186 37,117 44,929 45,139 39,090 32,749 39,683 41,457 45,546 499,509 7.1 -3.7 -2.8 -1.1 5.0 8.0 3.7 2.7 -0.9 9.3 4.4 5.5 3.0
Other Countries in Americas 7,060 5,582 5,909 5,873 4,260 4,482 4,401 4,119 4,409 5,434 5,118 4,893 61,540 11.9 15.9 -5.3 9.6 1.4 27.7 10.1 25.9 1.1 9.4 2.9 -11.6 6.9
ASIA 893,645 907,897 891,636 930,884 985,040 941,205 1,206,941 1,128,948 853,919 939,692 910,028 1,094,866 11,684,701 -8.6 -3.6 -8.5 -0.9 1.9 -0.3 9.5 6.5 4.0 1.7 4.6 4.6 1.0
Southeast Asia 448,133 380,389 461,999 478,213 512,074 496,392 579,570 444,137 414,155 465,052 455,128 612,913 5,748,155 -9.9 -13.6 -9.2 -6.6 -6.9 -10.2 2.0 -7.5 -5.1 -4.1 -1.7 -1.0 -6.0
Brunei Darussalam 5,521 4,759 6,989 4,977 5,378 4,992 7,237 4,585 5,761 4,825 6,191 12,379 73,594 -14.0 -6.2 -7.4 5.0 -14.0 -32.5 14.8 -9.7 2.9 -11.3 6.6 3.2 -5.2
Indonesia 236,295 184,183 211,347 207,138 238,688 238,403 305,600 205,671 187,629 204,574 200,687 311,475 2,731,690 -16.8 -15.9 -14.2 -10.0 -10.8 -14.3 2.9 -12.4 -9.2 -9.7 -8.5 -1.2 -9.7
Malaysia 86,193 82,408 101,929 90,515 100,340 100,074 102,347 88,834 93,334 88,338 106,214 130,551 1,171,077 -3.7 -9.6 -4.7 -4.7 -0.3 -8.1 0.9 -4.7 -6.0 -9.1 -0.1 -8.9 -5.0
Myanmar 7,825 6,204 9,681 12,969 9,162 9,326 8,757 8,000 7,461 8,762 7,625 9,680 105,452 0.2 -17.4 -1.1 -15.0 -3.9 -2.1 -6.3 -10.1 -10.0 -2.2 -4.4 -1.8 -6.5
Philippines 42,839 41,155 53,649 72,259 72,159 53,329 49,724 52,997 48,209 58,357 60,583 68,114 673,374 -2.0 -7.6 -6.0 -1.8 -6.3 -5.1 0.4 3.8 2.0 -0.4 13.2 5.6 -0.5
Thailand 36,798 29,889 43,504 47,838 45,674 40,121 45,729 39,579 39,567 63,693 38,576 45,441 516,409 4.4 -15.0 -6.1 -14.8 -2.2 2.7 4.4 -3.1 12.7 18.1 9.8 16.4 2.0
Vietnam 28,632 28,150 30,907 36,472 35,974 45,490 54,711 39,519 28,282 30,686 29,284 30,159 418,266 9.8 -14.8 -0.5 20.6 -1.8 -7.2 -2.2 -5.4 -2.3 0.4 -2.2 -3.3 -1.4
Other Countries in Southeast Asia 4,030 3,641 3,993 6,045 4,699 4,657 5,465 4,952 3,912 5,817 5,968 5,114 58,293 -7.1 -21.7 4.5 -10.6 -13.2 7.0 8.0 6.4 -24.4 53.6 16.7 30.3 2.2
North Asia 337,946 441,859 321,769 332,230 311,285 313,438 500,104 561,447 332,891 353,457 334,602 351,717 4,492,745 -11.9 8.2 -10.6 6.7 16.0 20.2 17.6 22.8 16.1 12.7 10.1 15.1 10.0
Hong Kong SAR 34,012 46,985 41,803 58,959 45,742 45,453 82,817 89,436 40,315 41,272 37,241 45,853 609,888 -18.8 -3.0 -3.3 -15.4 -4.4 -3.7 2.5 2.6 1.0 2.8 -4.6 0.4 -3.4
Japan 58,479 62,422 79,941 46,687 52,971 53,257 67,682 92,793 73,972 66,416 67,840 66,719 789,179 -1.8 -9.8 -7.0 -8.0 -2.2 -5.0 -2.5 -2.6 -0.6 -3.2 -2.3 -7.2 -4.3
China 140,548 238,011 130,827 153,784 141,375 144,533 246,819 267,122 149,929 165,649 158,736 168,831 2,106,164 -25.3 16.9 -21.0 21.6 47.3 58.0 36.6 53.4 41.7 23.6 20.5 35.5 22.3
South Korea 71,820 51,415 42,872 41,602 43,883 37,193 48,375 60,468 39,063 50,582 44,988 44,821 577,082 20.2 -1.0 4.6 14.8 4.6 -1.1 3.7 6.8 -0.5 12.9 11.8 9.5 7.5
Taiwan 30,685 40,059 24,694 29,229 25,498 30,565 50,278 45,292 27,836 27,525 24,062 22,303 378,026 -4.2 21.9 11.7 13.0 -4.5 18.4 13.7 17.9 9.7 13.8 13.3 20.1 12.0
Other Countries in North Asia 2,402 2,967 1,632 1,969 1,816 2,437 4,133 6,336 1,776 2,013 1,735 3,190 32,406 4.4 24.1 -10.0 -15.2 3.8 -11.2 15.5 12.4 -9.9 2.5 -19.6 -16.8 -0.2
South Asia 94,529 76,576 91,552 108,179 151,623 121,413 106,930 101,316 91,560 110,301 109,202 114,739 1,277,920 10.3 -5.7 1.3 4.3 9.1 3.6 16.4 6.2 6.5 -0.1 18.2 7.2 6.5
Bangladesh 10,923 7,960 10,186 9,809 10,447 9,737 11,793 10,353 10,159 10,394 9,272 11,554 122,587 4.7 -14.8 -5.0 -0.1 6.0 -12.3 16.7 -11.4 7.1 -3.1 -7.5 -0.7 -1.9
India 73,605 60,016 70,302 84,041 130,511 101,773 83,806 77,137 69,846 86,649 88,350 87,950 1,013,986 12.3 -4.7 -0.3 5.7 9.7 7.4 15.2 10.3 6.2 -2.5 23.5 6.6 7.5
Nepal 1,497 1,167 1,288 1,249 892 1,199 1,260 1,526 1,514 2,397 1,662 1,567 17,218 20.6 18.0 33.2 21.4 -7.3 -10.7 6.0 17.7 12.6 37.3 53.3 13.6 18.2
Pakistan 1,500 870 1,234 1,125 1,291 1,947 2,281 2,250 1,383 1,857 1,446 1,764 18,948 19.1 -22.1 -21.4 -8.2 -4.9 -30.4 66.0 15.3 24.0 59.9 16.4 17.2 7.2
Sri Lanka 6,139 5,987 7,640 11,103 7,652 5,832 6,782 8,965 7,477 8,083 7,432 9,960 93,052 -4.7 -0.3 32.4 -0.3 9.4 -8.4 18.8 -7.1 -0.8 15.7 -2.2 15.7 4.8
Other Countries in South Asia 865 576 902 852 830 925 1,008 1,085 1,181 921 1,040 1,944 12,129 9.6 -21.4 8.9 -16.7 3.8 3.4 39.4 26.3 58.1 4.0 20.1 42.4 15.4
West Asia 13,037 9,073 16,316 12,262 10,058 9,962 20,337 22,048 15,313 10,882 11,096 15,497 165,881 13.7 -21.6 4.5 -0.7 2.1 -22.9 23.7 -20.0 28.0 -27.0 2.3 5.7 -2.5
Iran 601 632 2,937 548 488 646 665 889 1,473 943 1,048 1,397 12,267 -33.1 -29.5 -14.4 -5.0 10.2 -5.7 -21.2 -0.3 17.5 24.7 38.3 49.6 -0.8
Israel 1,425 1,347 1,414 1,264 1,188 1,087 1,266 1,323 1,356 1,456 1,421 1,196 15,743 7.5 -13.4 7.1 -0.7 10.5 -8.9 18.9 13.5 19.6 1.0 -11.3 6.8 3.1
Kuwait 1,420 519 546 476 463 538 1,631 2,395 1,024 550 327 878 10,767 85.4 -64.7 -7.0 6.3 18.7 -30.0 35.0 -14.0 92.5 -38.6 -19.1 12.4 -2.4
Saudi Arabia 2,500 948 1,777 873 711 735 2,177 1,932 1,845 893 797 903 16,091 -4.5 -28.3 -12.8 -36.7 -54.3 -66.7 23.7 -63.5 -20.2 -62.0 -52.0 -30.1 -37.6
United Arab Emirates 4,612 3,871 7,588 6,628 5,278 5,101 10,044 10,164 6,781 4,984 5,450 8,192 78,693 20.0 -4.9 20.7 1.8 14.5 -10.1 17.6 -14.3 35.3 -25.7 14.6 4.1 3.9
Other Countries in West Asia 2,479 1,756 2,054 2,473 1,930 1,855 4,554 5,345 2,834 2,056 2,053 2,931 32,320 23.0 -22.3 5.3 14.8 8.5 -22.7 50.9 -4.1 65.0 -25.3 23.2 9.7 7.9
EUROPE 158,515 147,150 160,337 128,143 99,877 88,462 136,818 163,404 119,885 139,243 146,330 147,561 1,635,725 -2.5 -6.0 -4.9 -8.7 -0.7 -0.5 9.9 6.5 -0.8 7.7 9.0 7.5 1.1
Austria 2,645 2,429 2,137 1,722 1,377 1,141 2,290 2,644 2,029 2,076 2,370 2,248 25,108 8.1 -16.6 -22.0 -18.2 -9.3 -7.3 -11.1 1.4 -5.2 12.6 2.9 7.7 -5.3
Belgium & Luxembourg 2,063 1,968 2,594 2,369 1,765 1,599 3,225 2,905 2,155 2,336 2,271 2,329 27,579 -7.1 -20.7 -8.0 -11.1 -1.5 -3.3 8.0 -1.4 -3.5 15.1 -10.8 0.3 -3.9
Denmark 3,440 3,634 3,246 2,301 1,642 1,635 3,786 2,161 1,974 2,590 2,656 2,324 31,389 -7.5 -5.9 0.4 -13.1 1.1 -1.1 15.0 5.3 -10.2 -6.0 12.0 -6.5 -1.6
Finland 3,740 3,390 3,110 2,198 1,373 1,551 1,308 1,222 1,451 2,569 2,761 3,231 27,904 -15.5 -26.0 -9.8 -4.6 -8.2 1.2 3.3 10.3 -17.5 1.9 -9.6 0.7 -9.1
France 11,285 13,590 12,789 13,135 11,686 8,969 16,926 22,241 9,816 13,334 12,269 11,443 157,483 -5.7 -4.2 -18.7 -3.7 -2.5 -3.4 17.5 8.3 -4.9 8.0 4.3 6.9 0.4
Germany 24,529 24,937 31,468 20,086 16,266 13,660 18,815 26,784 22,303 24,718 27,994 35,172 286,732 -2.6 -1.9 2.1 -9.2 5.5 2.9 10.6 9.1 0.7 12.8 30.1 45.6 8.8
Greece 727 701 787 710 661 595 681 711 856 891 719 828 8,867 -1.5 8.5 2.5 17.9 8.9 2.9 -4.1 -6.9 12.8 33.2 4.1 8.5 6.9
Italy 5,470 4,192 5,311 4,870 3,923 3,915 5,402 15,817 5,291 5,042 5,317 4,800 69,350 0.8 -15.2 -10.6 4.0 5.7 6.6 4.8 19.1 2.5 14.9 -4.4 -6.3 3.4
Netherlands 6,405 6,678 7,127 5,989 5,797 4,553 9,364 8,040 5,761 6,557 6,627 6,154 79,052 -16.2 -10.5 -10.6 -8.1 -1.5 -8.2 15.8 -5.9 -4.4 8.4 2.8 -1.1 -3.4
Norway 2,859 3,123 3,535 2,652 1,497 2,260 3,874 1,978 2,068 2,675 2,615 2,514 31,650 -16.8 -11.2 4.1 -32.7 -19.3 8.0 16.4 -3.0 -3.0 14.9 -2.8 -8.8 -5.5
Poland 2,306 2,084 1,716 1,389 1,213 1,100 1,766 2,117 1,387 1,923 2,437 1,409 20,847 21.8 -15.5 -10.7 13.7 -3.9 21.7 19.8 4.3 -21.8 6.0 -3.3 -18.6 -0.8
Rep of Ireland 1,551 1,277 1,617 1,434 1,224 1,369 1,576 1,631 1,335 1,386 1,480 1,467 17,347 2.4 -3.6 10.5 12.2 10.0 0.9 -9.1 14.1 4.2 2.4 8.6 22.5 5.7
Russian Federation 12,650 4,861 5,154 4,371 4,523 3,644 4,071 4,618 3,725 4,900 5,518 5,807 63,842 -19.8 -46.9 -46.1 -37.5 -21.3 -25.2 -22.9 -24.7 -30.8 -24.7 -23.8 -27.4 -29.6
Spain 3,546 2,893 3,715 3,094 2,953 2,717 4,875 8,377 4,330 4,046 4,464 3,064 48,074 14.6 -4.3 7.9 -8.8 11.1 8.0 20.5 14.8 4.3 16.0 18.8 -8.5 8.7
Sweden 6,295 4,556 4,284 3,138 1,985 2,091 2,911 1,946 2,102 3,753 4,078 5,423 42,562 -8.9 -13.9 -11.1 -14.6 -17.9 -3.2 7.2 5.7 3.3 12.7 16.6 1.1 -3.4
Switzerland 9,470 8,475 8,777 9,308 6,699 5,203 10,657 8,253 6,938 9,188 9,481 8,400 100,849 1.6 -5.8 -0.6 -7.2 -0.2 -4.6 1.5 -6.6 -9.2 -3.4 5.5 -2.7 -2.5
Turkey 2,432 1,898 1,993 1,774 1,285 1,160 1,496 1,714 2,045 1,453 1,451 1,588 20,289 -5.4 -11.7 22.0 28.6 2.1 -5.0 13.3 0.6 53.4 -9.6 10.1 32.0 8.5
UK 44,909 47,046 50,729 39,808 28,113 25,533 36,628 41,068 37,361 40,852 42,022 39,741 473,810 6.1 6.9 2.6 -8.9 1.6 1.6 14.3 7.1 3.9 10.5 10.8 3.4 4.8
Other Countries in Eastern Europe 10,476 7,822 8,179 6,186 4,731 4,496 5,603 6,990 5,051 6,961 7,769 8,065 82,329 0.9 -10.6 -5.8 11.3 -0.7 3.2 11.6 26.6 3.8 10.4 8.4 -1.2 3.5
Other Countries in Western Europe 1,717 1,596 2,069 1,609 1,164 1,271 1,564 2,187 1,907 1,993 2,031 1,554 20,662 9.9 7.9 12.3 -14.4 2.8 22.8 -0.4 14.4 22.5 31.7 32.7 10.7 12.2
OCEANIA 129,274 72,276 79,760 94,027 85,227 95,694 113,551 96,655 110,596 109,158 87,044 113,008 1,186,270 -7.0 -6.0 -3.4 -14.9 -5.5 2.1 -6.9 2.3 1.1 11.5 6.2 3.4 -1.8
Australia 115,584 65,009 70,708 83,497 73,965 82,755 97,583 83,063 97,071 96,340 76,369 101,624 1,043,568 -8.4 -5.9 -5.2 -16.3 -5.5 1.5 -8.5 0.7 -0.6 10.0 4.2 3.9 -2.9
New Zealand 12,330 6,349 7,854 9,492 10,077 11,593 14,756 12,497 12,412 11,462 9,070 9,726 127,618 7.5 -7.9 14.3 -0.3 -6.8 6.1 4.8 14.2 17.2 25.3 22.0 -2.9 7.5
Other Countries in Oceania 1,360 918 1,198 1,038 1,185 1,346 1,212 1,095 1,113 1,356 1,605 1,658 15,084 -2.7 1.0 6.4 -9.3 7.2 8.5 -2.0 -3.0 -7.2 15.5 26.2 18.8 5.3
AFRICA 6,391 3,567 5,150 6,424 4,675 4,061 5,398 6,111 5,219 5,876 5,429 9,152 67,453 11.3 -16.0 3.6 2.0 8.4 -7.5 -0.9 -5.8 7.5 39.7 -1.6 -4.7 2.1
Egypt 453 268 419 348 355 226 296 574 444 532 325 298 4,538 13.5 -23.6 27.7 4.5 10.2 -26.4 38.3 28.1 11.3 31.0 -18.1 -34.8 4.1
Mauritius 828 557 567 858 513 600 601 694 411 474 1,087 1,549 8,739 28.2 15.8 18.6 14.7 31.5 14.3 -15.1 6.0 -13.5 -0.2 6.2 9.1 8.9
South Africa (Rep of) 3,255 1,619 2,541 2,885 2,351 2,048 2,752 2,183 2,642 2,981 2,347 4,866 32,470 15.1 -6.4 11.4 -14.2 23.0 13.8 12.4 7.2 12.2 60.9 1.6 0.5 9.1
Other Countries in Africa 1,855 1,123 1,623 2,333 1,456 1,187 1,749 2,660 1,722 1,889 1,670 2,439 21,706 -0.6 -33.4 -13.8 26.1 -13.7 -32.5 -15.7 -20.5 5.8 28.3 -6.5 -15.5 -9.3
NOT STATED 3 4 0 1 3 0 1 1 3 3 5 0 24 -85.7 -81.8 -100.0 -83.3 -66.7 -100.0 200.0 -98.5 25.0 -100.0 -91.7
Source: Embarkation / Disembarkation Cards
© 2016 Singapore Tourism Board.
All rights reserved. No part of this publication may be reproduced, distributed, or transmitted in any form or by any means, electronic, mechanical, photocopying, recording or otherwise, without the prior permission of STB, or as otherwise permitted herein.
Contents of this report may be reproduced accurately in part in other publications if STB is acknowledged and attributed as copyright owner.
STB shall not be liable for any loss, damage or injury caused by or arising out of the use of the data in this publication. All information in this publication are deemed to be correct at time of printing.
1.1_ALL MODES OF ARRIVAL (AIR/SEA/LAND)
Number of Arrivals % Change
Singapore Tourism BoardInternational Visitor Arrivals Statistics
Published Date: 29 February 2016
JAN FEB MAR APR MAY JUN JUL AUG SEP OCT NOV DEC JAN-DEC JAN FEB MAR APR MAY JUN JUL AUG SEP OCT NOV DEC JAN-DEC
Country of Residence 2015 2015 2015 2015 2015 2015 2015 2015 2015 2015 2015 2015 2015 15 vs 14 15 vs 14 15 vs 14 15 vs 14 15 vs 14 15 vs 14 15 vs 14 15 vs 14 15 vs 14 15 vs 14 15 vs 14 15 vs 14 15 vs 14
TOTAL 948,689 900,198 940,077 939,370 945,080 930,642 1,184,753 1,136,524 925,233 991,913 930,209 1,058,414 11,831,102 -8.8 -3.5 -5.3 -2.9 0.5 1.1 9.1 6.1 3.6 4.8 4.6 4.6 1.2
AMERICAS 51,946 43,863 52,197 42,572 42,851 47,439 50,264 43,992 37,952 44,636 45,944 49,532 553,188 3.1 -6.6 -3.0 3.1 3.5 6.0 5.2 5.0 1.2 12.2 4.7 2.7 2.9
Canada 8,031 6,863 7,557 5,925 5,702 4,767 5,876 5,565 4,514 5,953 6,582 7,348 74,683 -0.2 -6.8 -6.2 5.7 -2.6 1.6 -1.6 1.8 7.7 14.7 10.3 7.0 1.9
USA 38,620 32,505 39,701 31,465 33,347 38,842 40,375 34,785 29,459 34,130 35,300 38,021 426,550 3.7 -8.5 -2.1 1.4 5.1 5.1 5.5 3.7 -0.1 11.6 4.3 3.7 2.7
Other Countries in Americas 5,295 4,495 4,939 5,182 3,802 3,830 4,013 3,642 3,979 4,553 4,062 4,163 51,955 4.3 10.1 -4.9 11.6 -0.4 24.3 13.2 25.7 4.5 13.8 -0.6 -11.7 6.1
ASIA 650,838 673,356 681,833 701,035 734,304 714,353 904,265 858,650 674,688 724,393 679,719 784,844 8,782,278 -10.2 -1.2 -6.0 -0.5 1.5 1.2 11.0 6.8 5.0 3.2 4.5 5.3 1.8
Southeast Asia 301,434 254,988 332,791 341,398 360,198 357,057 400,192 320,412 308,424 340,931 326,055 411,079 4,054,959 -11.8 -17.4 -8.9 -7.3 -6.7 -7.6 4.2 -6.2 -2.6 -1.9 0.1 1.4 -5.2
Brunei Darussalam 4,886 4,325 6,224 4,481 4,976 4,626 6,674 4,302 5,234 4,410 5,744 10,036 65,918 -10.0 -3.4 1.6 4.3 -12.7 -29.2 15.6 -5.9 2.2 -13.1 8.1 5.5 -3.0
Indonesia 132,786 99,961 125,808 123,212 139,552 142,925 173,389 124,121 117,274 125,277 118,841 165,565 1,588,711 -23.7 -25.3 -19.3 -15.0 -14.1 -12.8 2.6 -13.6 -7.6 -10.2 -8.0 1.2 -12.1
Malaysia 66,708 61,482 82,932 72,938 79,873 81,803 81,555 70,125 76,485 71,584 83,877 103,065 932,427 0.8 -9.9 0.3 -1.7 2.6 -4.3 8.0 -1.4 -3.9 -5.6 1.0 -7.8 -2.0
Myanmar 7,340 5,689 9,216 11,954 8,664 8,852 8,366 7,477 7,128 8,346 7,152 9,030 99,214 1.3 -19.1 0.9 -9.8 -2.9 -1.4 -4.3 -10.6 -8.2 -0.8 -3.8 -2.1 -5.1
Philippines 32,690 32,365 42,881 55,697 54,539 42,449 40,891 43,265 39,648 46,803 47,550 53,700 532,478 -4.2 -7.4 -4.2 -1.8 -4.8 -3.2 5.0 6.9 3.9 1.4 13.6 8.7 1.1
Thailand 28,690 24,289 34,776 37,247 38,583 34,155 39,672 34,232 34,334 53,351 32,769 38,141 430,239 2.0 -16.0 -6.4 -13.9 1.6 1.9 7.3 -0.7 15.6 24.5 12.8 22.1 4.1
Vietnam 24,906 23,760 27,347 31,299 30,131 38,188 45,043 32,747 24,834 26,213 25,102 27,128 356,698 8.4 -13.3 3.6 19.3 -4.1 -5.6 1.0 -6.5 -0.5 0.2 -2.1 -0.9 -0.5
Other Countries in Southeast Asia 3,428 3,117 3,607 4,570 3,880 4,059 4,602 4,143 3,487 4,947 5,020 4,414 49,274 -12.2 -23.1 6.4 -13.6 -15.8 4.7 4.7 2.6 -22.7 41.6 23.1 33.0 0.7
North Asia 260,227 346,509 256,381 255,966 244,098 249,499 395,972 431,792 273,860 280,939 255,931 266,211 3,517,385 -14.0 16.9 -5.5 7.4 10.8 16.8 16.8 20.5 13.9 11.2 7.2 11.0 9.5
Hong Kong SAR 28,013 35,643 35,883 44,738 38,682 37,667 59,901 61,067 35,314 34,909 31,946 35,664 479,427 -18.4 1.7 3.3 -11.1 -2.1 -0.6 6.2 4.9 1.9 5.5 -3.3 2.2 -0.6
Japan 47,358 52,713 67,646 39,367 45,472 44,727 58,168 80,922 64,608 56,094 56,081 55,295 668,451 -2.7 -7.6 -4.7 -9.2 -2.0 -5.2 -3.5 -3.1 -0.1 -1.8 -0.3 -7.7 -3.9
China 111,290 191,067 101,924 118,388 106,560 112,783 200,210 206,666 118,724 128,781 114,796 121,981 1,633,170 -26.4 32.6 -14.6 22.8 33.7 44.2 31.2 44.8 32.4 18.5 12.9 23.9 19.9
South Korea 47,979 35,610 29,672 29,751 32,833 29,177 39,151 46,883 30,817 36,917 32,226 32,989 424,005 17.8 5.0 9.1 17.2 3.5 1.0 8.2 9.4 4.1 14.6 13.3 14.5 9.8
Taiwan 23,478 29,131 19,833 22,075 18,951 22,998 35,292 31,826 22,800 22,454 19,368 17,664 285,870 -8.2 19.3 13.8 4.8 -11.8 19.5 14.8 18.5 13.1 13.5 10.9 20.0 10.4
Other Countries in North Asia 2,109 2,345 1,423 1,647 1,600 2,147 3,250 4,428 1,597 1,784 1,514 2,618 26,462 3.3 25.7 -6.1 -11.3 3.3 -5.9 17.7 8.1 -8.2 6.4 -20.6 -15.7 0.3
South Asia 77,908 63,916 78,964 92,656 120,751 98,882 90,379 88,210 79,298 93,095 87,998 94,191 1,066,248 10.1 -3.9 3.1 5.9 11.6 4.7 16.5 8.9 5.8 4.5 15.5 7.4 7.6
Bangladesh 9,970 7,312 9,554 9,231 9,854 9,305 11,297 10,014 9,868 10,097 9,042 11,024 116,568 6.7 -13.1 -1.8 2.0 8.6 -8.4 22.1 -6.7 12.4 3.4 -3.3 2.0 1.8
India 59,361 49,204 59,473 70,917 101,086 80,993 68,876 66,108 59,398 71,514 68,609 70,113 825,652 11.5 -3.1 0.8 7.1 11.9 8.6 14.0 12.6 4.7 1.7 19.7 6.1 8.1
Nepal 888 693 889 848 695 739 929 980 935 1,631 1,150 1,148 11,525 4.1 24.9 22.5 17.3 -2.5 -11.0 14.0 24.2 7.3 68.7 49.0 19.0 20.3
Pakistan 1,257 770 1,111 935 1,201 1,659 2,031 1,953 1,231 1,598 1,262 1,516 16,524 16.0 -19.6 -16.6 -11.9 -2.2 -30.1 69.7 25.8 29.9 56.7 14.0 23.4 9.5
Sri Lanka 5,700 5,430 7,135 9,965 7,151 5,383 6,304 8,178 6,845 7,420 6,998 8,892 85,401 3.3 5.3 40.6 4.8 16.3 -6.4 19.1 -2.9 -1.8 17.7 2.1 16.5 8.6
Other Countries in South Asia 732 507 802 760 764 803 942 977 1,021 835 937 1,498 10,578 6.1 -26.2 10.0 -19.0 5.7 -0.4 51.7 30.4 50.1 11.5 17.1 52.5 15.6
West Asia 11,269 7,943 13,697 11,015 9,257 8,915 17,722 18,236 13,106 9,428 9,735 13,363 143,686 13.9 -19.9 11.3 2.2 5.7 -22.0 23.4 -19.9 27.9 -26.3 1.4 6.3 -1.2
Iran 210 199 1,190 280 243 318 281 329 479 289 335 519 4,672 -21.6 -10.8 -1.7 23.3 34.3 25.7 -5.7 15.4 19.8 11.6 18.8 73.6 11.6
Israel 1,385 1,291 1,381 1,253 1,182 1,082 1,263 1,313 1,339 1,322 1,376 1,178 15,365 6.5 -15.3 10.9 -1.0 11.3 -8.1 20.7 14.9 19.4 -0.6 -9.1 6.3 3.6
Kuwait 1,197 454 495 444 429 458 1,463 1,964 881 522 299 807 9,413 71.7 -64.7 3.1 5.2 17.2 -35.8 33.7 -14.3 76.6 -34.1 -19.6 13.5 -3.2
Saudi Arabia 2,213 865 1,617 778 655 641 1,969 1,582 1,634 791 716 786 14,247 -6.7 -24.7 -10.3 -33.4 -49.8 -66.4 24.1 -63.4 -20.9 -58.2 -53.4 -31.7 -36.0
United Arab Emirates 4,256 3,684 7,140 6,083 5,041 4,798 8,992 9,061 6,352 4,720 5,155 7,510 72,792 19.8 -3.8 20.7 2.8 16.6 -10.7 16.3 -14.4 35.6 -23.4 14.9 5.7 4.5
Other Countries in West Asia 2,008 1,450 1,874 2,177 1,707 1,618 3,754 3,987 2,421 1,784 1,854 2,563 27,197 18.0 -23.7 13.1 22.1 12.5 -19.6 44.2 -3.9 64.0 -24.1 31.2 16.7 9.8
EUROPE 133,102 119,181 132,417 109,866 88,831 77,262 121,309 142,485 107,584 123,304 122,414 118,282 1,396,037 -4.5 -9.7 -3.7 -9.1 0.0 -1.8 10.7 6.3 -0.7 7.7 4.7 3.4 0.1
Austria 2,103 1,864 1,755 1,387 1,218 1,003 2,048 2,300 1,817 1,870 1,873 1,658 20,896 3.1 -23.8 -13.2 -22.1 -10.6 -7.0 -11.6 1.3 -5.3 14.4 -5.6 2.5 -7.0
Belgium & Luxembourg 1,737 1,650 2,171 2,078 1,582 1,438 2,856 2,583 1,930 2,144 2,077 1,944 24,190 -4.3 -18.3 -7.3 -10.2 0.8 -3.0 9.8 2.7 -2.0 20.8 -9.0 -2.4 -2.0
Denmark 3,073 3,113 2,806 1,979 1,457 1,481 3,363 1,887 1,798 2,332 2,361 2,076 27,726 -8.1 -8.0 0.8 -12.0 4.1 1.0 16.3 4.7 -10.7 -4.9 16.2 -7.4 -1.2
Finland 3,334 2,967 2,782 1,957 1,228 1,363 1,143 1,111 1,298 2,323 2,376 2,887 24,769 -15.1 -26.3 -6.9 -3.8 -9.8 -0.7 5.2 17.2 -19.9 2.6 -11.0 -0.2 -8.9
France 10,071 12,086 11,340 11,506 10,323 7,930 14,846 19,040 8,793 11,980 10,922 10,190 139,027 -4.3 -5.0 -15.2 -4.4 -2.4 -4.0 19.2 8.6 -5.1 8.4 6.0 6.7 1.0
Germany 17,614 17,995 23,134 16,792 14,606 11,969 16,818 23,607 19,849 21,875 21,239 20,669 226,167 -7.1 -9.1 0.4 -11.8 6.1 1.2 11.6 9.1 1.8 11.0 12.3 29.3 4.1
Greece 643 560 678 638 566 518 589 635 759 781 648 731 7,746 -1.7 9.6 3.5 26.6 4.2 6.8 -1.3 -9.4 13.5 32.6 9.5 15.8 8.6
Italy 4,708 3,672 4,603 3,853 3,508 3,410 4,792 13,951 4,697 4,538 4,390 4,123 60,245 -0.5 -15.8 -8.6 -8.5 7.1 6.4 4.5 19.1 1.4 17.8 2.1 -8.0 3.2
Netherlands 5,263 5,351 5,716 4,949 4,963 3,881 8,210 6,581 5,047 5,749 5,833 5,158 66,701 -15.7 -9.3 -7.1 -9.0 1.3 -7.6 18.9 -6.0 -4.2 9.2 3.5 -0.7 -2.1
Norway 2,473 2,559 3,021 2,243 1,260 1,958 3,133 1,668 1,809 2,341 2,202 2,201 26,868 -14.6 -9.9 6.3 -31.5 -20.2 5.4 13.9 -5.4 -3.1 16.6 -4.1 -8.3 -5.3
Poland 1,933 1,712 1,418 1,197 1,051 904 1,455 1,825 1,145 1,581 2,064 1,185 17,470 24.1 -18.1 -10.3 15.4 4.2 16.0 12.9 8.7 -23.3 -0.2 -3.6 -12.4 -0.7
Rep of Ireland 1,310 1,021 1,385 1,188 1,062 1,167 1,386 1,375 1,193 1,163 1,245 1,259 14,754 -2.7 -10.7 9.0 12.2 7.4 -0.1 -4.0 11.3 6.5 -4.0 10.4 21.3 4.3
Russian Federation 10,772 4,289 4,678 3,989 4,126 3,362 3,725 4,218 3,488 4,524 5,023 5,398 57,592 -25.2 -49.8 -47.1 -38.5 -23.5 -26.1 -22.8 -26.2 -30.7 -24.2 -24.0 -26.3 -31.2
Spain 3,006 2,408 3,136 2,654 2,663 2,333 4,353 7,455 3,920 3,615 3,776 2,695 42,014 17.5 -1.9 14.3 -5.9 21.3 3.7 22.0 13.5 5.8 18.3 13.6 -8.7 10.0
Sweden 5,551 3,887 3,679 2,638 1,703 1,820 2,459 1,702 1,907 3,313 3,584 4,859 37,102 -7.9 -14.3 -10.0 -12.6 -11.3 -1.1 7.5 6.5 7.0 11.9 16.2 0.0 -2.4
Switzerland 8,684 7,612 7,342 8,257 6,257 4,857 9,660 7,572 6,514 8,506 7,960 7,663 90,884 2.5 -6.4 -5.6 -9.9 0.1 -3.9 -0.4 -5.0 -9.7 -2.8 -4.1 -3.6 -4.1
Turkey 2,230 1,724 1,798 1,619 1,135 1,053 1,356 1,460 1,879 1,325 1,285 1,422 18,286 -3.3 -9.6 22.1 28.4 2.9 -2.5 13.8 -5.4 62.1 -9.9 8.7 36.3 9.4
UK 38,226 36,903 42,279 34,294 25,035 21,932 32,938 35,677 33,600 35,724 35,232 34,063 405,903 2.6 1.0 6.9 -6.6 1.9 -0.6 16.0 6.9 3.6 11.7 7.1 3.8 4.5
Other Countries in Eastern Europe 8,881 6,515 6,988 5,229 4,026 3,759 4,765 5,912 4,414 5,888 6,535 6,720 69,632 -0.2 -11.2 -4.5 9.6 -0.6 -0.3 12.7 26.9 4.6 6.1 11.6 -2.0 3.1
Other Countries in Western Europe 1,490 1,293 1,708 1,419 1,062 1,124 1,414 1,926 1,727 1,732 1,789 1,381 18,065 7.3 2.3 7.5 -15.3 3.9 24.5 -1.1 9.2 20.3 29.4 26.8 15.4 10.0
OCEANIA 107,836 60,809 69,119 80,375 75,105 88,088 104,195 86,352 100,365 94,599 77,694 98,068 1,042,605 -10.6 -11.0 -3.0 -15.3 -9.5 0.7 -4.8 0.0 -0.4 9.4 5.3 2.0 -3.3
Australia 95,829 54,327 61,040 70,900 64,657 75,991 89,234 73,833 87,855 83,075 67,886 87,896 912,523 -12.2 -11.5 -4.9 -16.9 -10.3 -0.3 -6.6 -1.8 -2.1 7.8 3.3 2.3 -4.7
New Zealand 10,802 5,655 7,036 8,555 9,326 10,879 13,838 11,481 11,462 10,240 8,347 8,648 116,269 5.4 -7.6 16.5 0.4 -6.0 6.7 8.3 13.5 16.2 23.0 22.4 -4.0 7.7
Other Countries in Oceania 1,205 827 1,043 920 1,122 1,218 1,123 1,038 1,048 1,284 1,461 1,524 13,813 -4.7 -2.2 1.4 -16.7 8.4 11.3 -1.1 -0.1 -5.4 17.8 21.6 18.5 4.4
AFRICA 4,965 2,988 4,511 5,521 3,989 3,500 4,720 5,044 4,642 4,979 4,436 7,688 56,983 8.0 -17.8 4.8 1.3 4.5 -9.6 2.3 -3.9 7.5 36.1 -1.6 -4.0 1.7
Egypt 364 232 386 317 333 206 265 533 427 451 302 267 4,083 2.8 -24.2 35.9 7.1 14.0 -27.2 41.0 35.3 13.6 17.1 -19.5 -35.4 3.5
Mauritius 549 439 462 557 406 478 491 568 352 395 752 1,088 6,537 23.1 16.4 14.1 -8.1 20.5 8.9 -13.9 14.1 -12.2 15.2 2.5 7.7 6.0
South Africa (Rep of) 2,512 1,316 2,203 2,500 1,977 1,771 2,471 1,994 2,334 2,461 1,932 4,208 27,679 11.2 -11.2 10.6 -14.4 16.7 8.8 14.8 8.6 12.5 50.5 5.7 0.4 7.7
Other Countries in Africa 1,540 1,001 1,460 2,147 1,273 1,045 1,493 1,949 1,529 1,672 1,450 2,125 18,684 0.2 -32.0 -10.2 32.0 -14.8 -31.3 -12.3 -22.7 4.1 29.1 -7.6 -11.2 -7.6
NOT STATED 2 1 1 1 2 2 2 11 -81.8 -90.0 -100.0 -80.0 -100.0 -100.0 -99.0 -50.0 -100.0 -95.7
Source: Embarkation / Disembarkation Cards
© 2016 Singapore Tourism Board.
All rights reserved. No part of this publication may be reproduced, distributed, or transmitted in any form or by any means, electronic, mechanical, photocopying, recording or otherwise, without the prior permission of STB, or as otherwise permitted herein.
Contents of this report may be reproduced accurately in part in other publications if STB is acknowledged and attributed as copyright owner.
STB shall not be liable for any loss, damage or injury caused by or arising out of the use of the data in this publication. All information in this publication are deemed to be correct at time of printing.
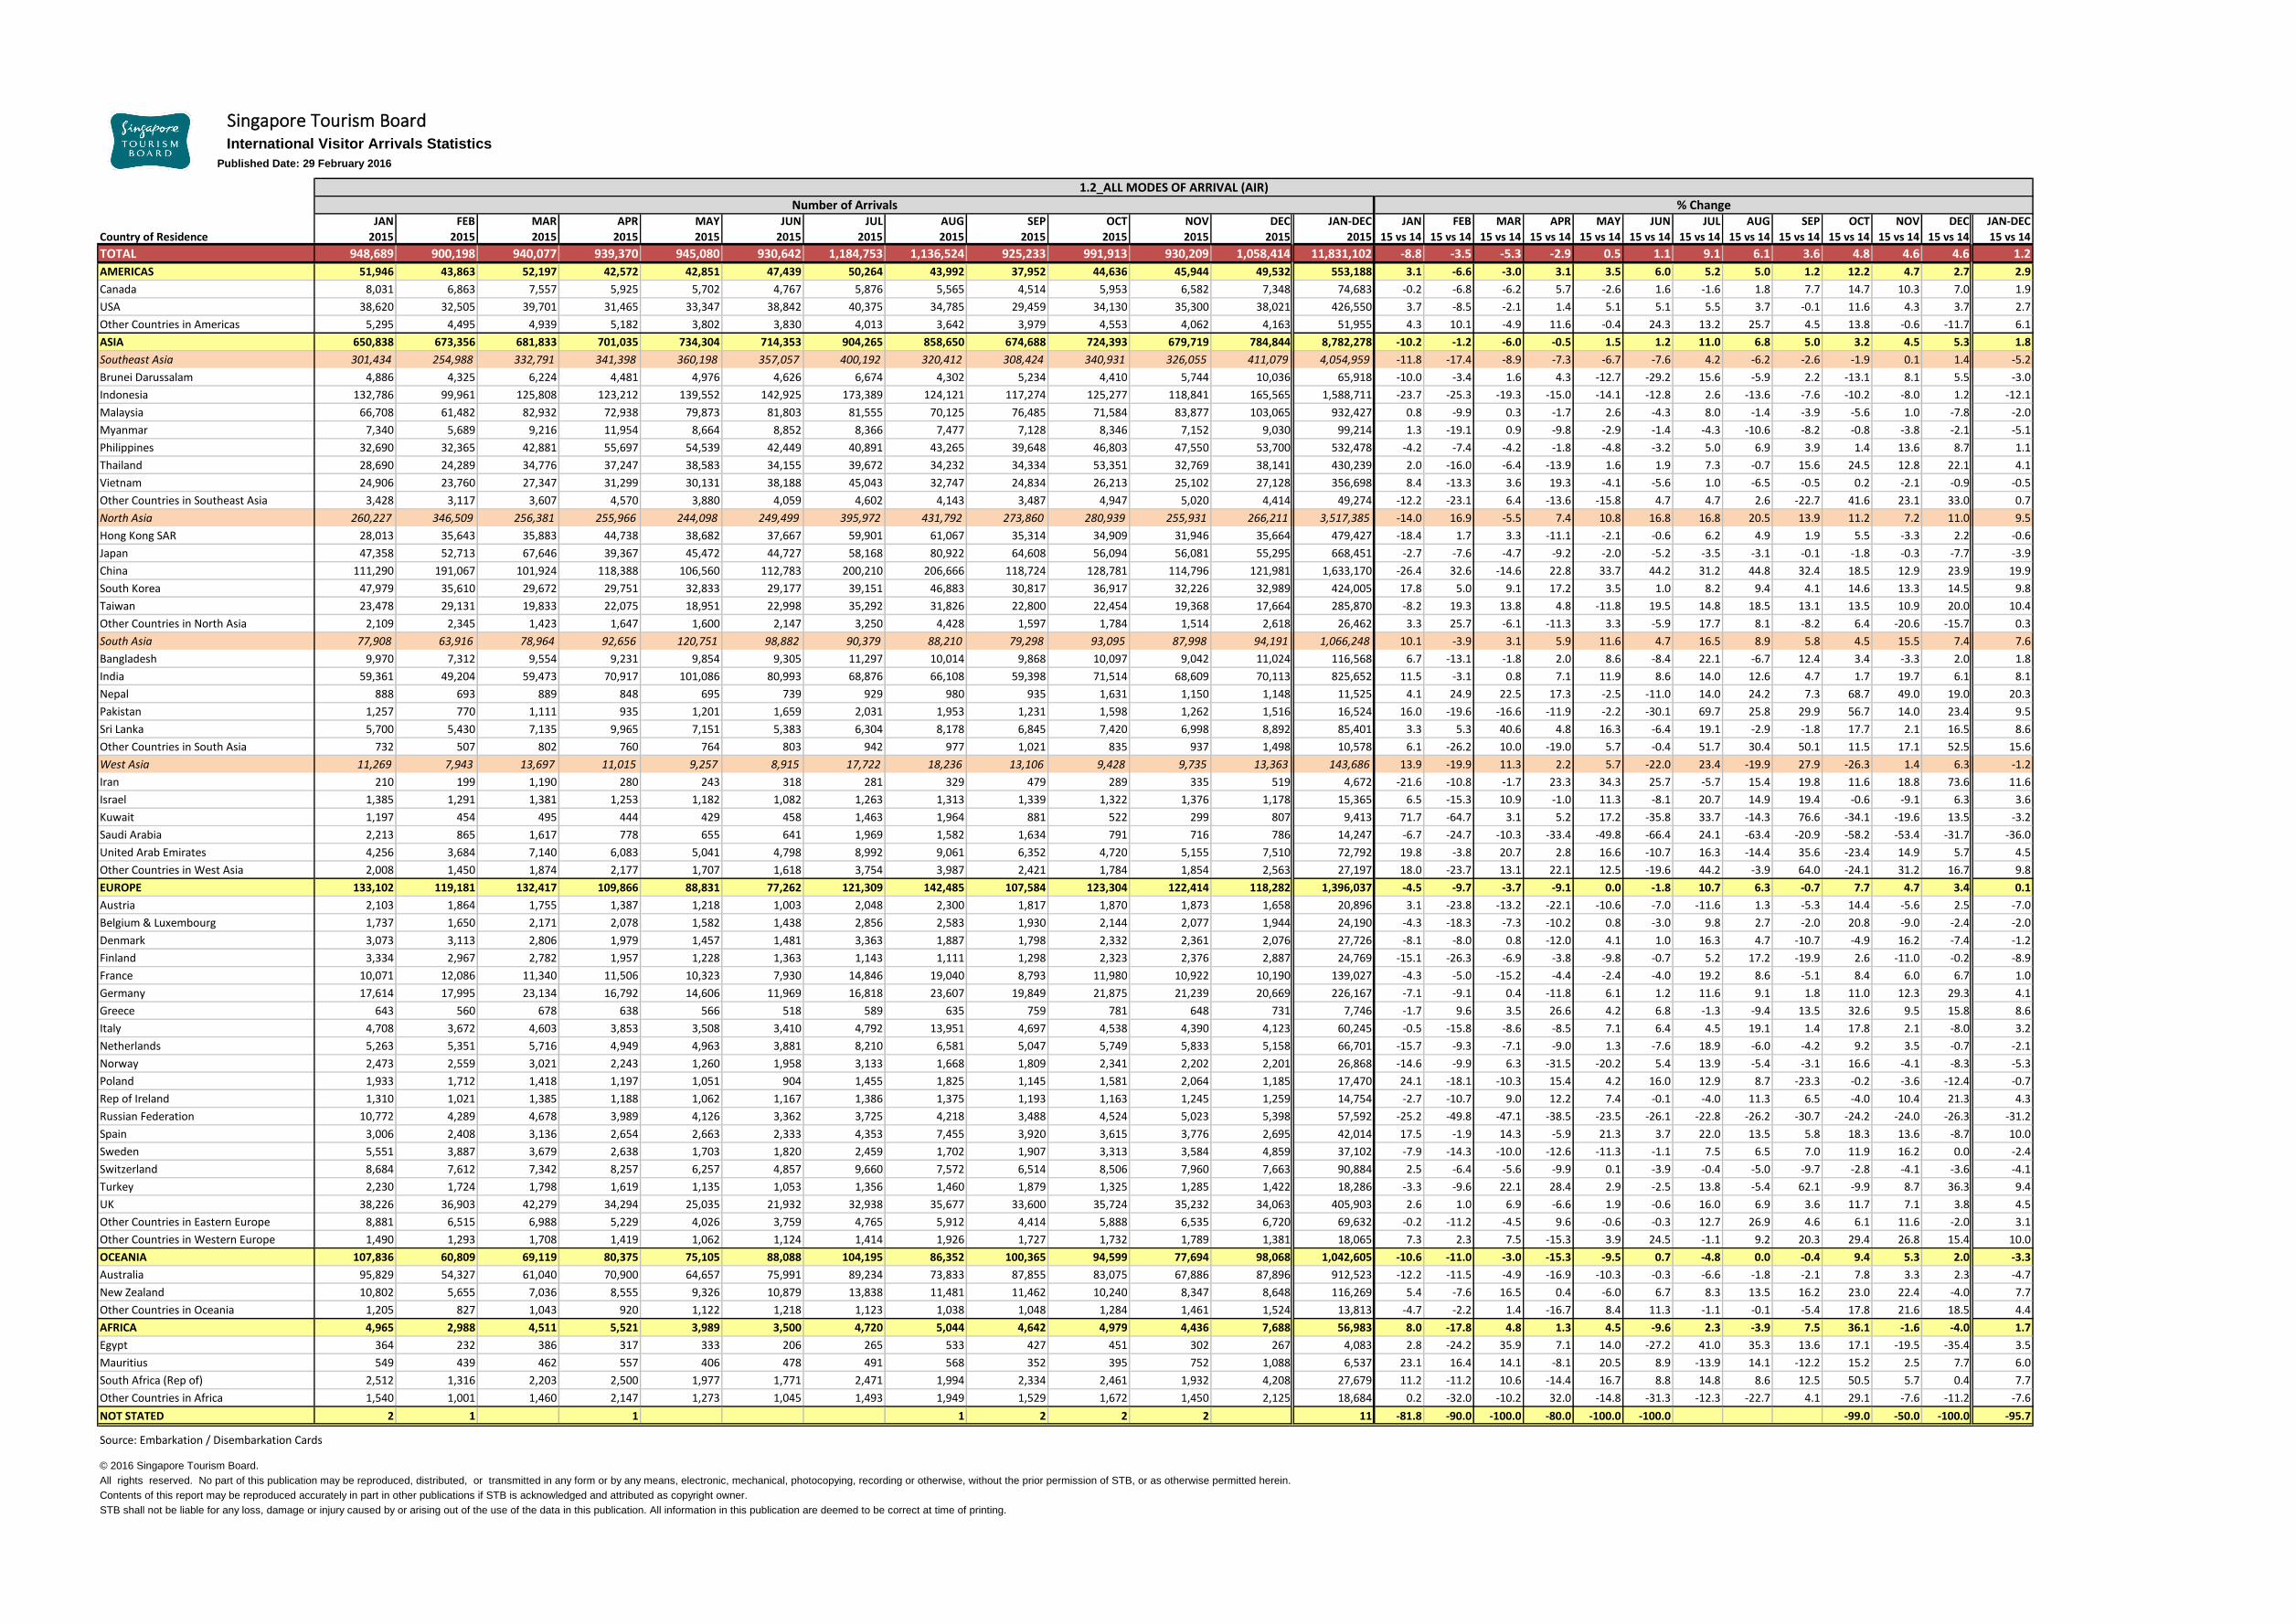
1.2_ALL MODES OF ARRIVAL (AIR)
Number of Arrivals % Change
Singapore Tourism BoardInternational Visitor Arrivals Statistics
Published Date: 29 February 2016
JAN FEB MAR APR MAY JUN JUL AUG SEP OCT NOV DEC JAN-DEC JAN FEB MAR APR MAY JUN JUL AUG SEP OCT NOV DEC JAN-DEC
Country of Residence 2015 2015 2015 2015 2015 2015 2015 2015 2015 2015 2015 2015 2015 15 vs 14 15 vs 14 15 vs 14 15 vs 14 15 vs 14 15 vs 14 15 vs 14 15 vs 14 15 vs 14 15 vs 14 15 vs 14 15 vs 14 15 vs 14
TOTAL 154,708 151,618 133,632 118,120 123,136 115,631 139,088 117,490 95,408 119,491 138,730 195,431 1,602,483 9.8 7.2 -5.4 2.9 4.4 2.8 3.3 4.4 -1.2 -0.6 8.5 7.1 3.8
AMERICAS 8,595 10,118 8,241 3,067 1,410 3,608 1,357 1,738 1,751 5,037 5,988 6,939 57,849 60.4 38.2 -2.6 -12.7 12.4 164.3 -17.6 10.6 -17.4 2.5 25.3 23.7 20.7
Canada 1,966 2,213 1,977 536 195 520 182 267 226 1,213 1,354 1,680 12,329 71.3 35.1 19.7 0.8 21.9 316.0 -14.2 39.1 -32.9 31.0 40.3 18.9 32.6
USA 5,246 7,204 5,627 2,184 1,085 2,728 1,108 1,276 1,336 3,269 3,792 4,827 39,682 51.9 36.4 -8.0 -19.7 8.3 144.7 -17.9 1.4 -10.4 -0.9 14.8 30.3 16.4
Other Countries in Americas 1,383 701 637 347 130 360 67 195 189 555 842 432 5,838 82.5 75.3 -8.7 33.5 41.3 188.0 -21.2 62.5 -35.3 -19.4 64.8 -12.2 29.1
ASIA 116,258 114,529 100,617 97,948 111,102 104,179 131,299 104,197 84,228 97,002 110,517 157,737 1,329,613 3.5 -1.1 -4.3 4.7 1.4 -2.4 5.7 1.3 -4.0 -5.4 1.3 1.3 0.3
Southeast Asia 83,644 75,528 77,146 75,632 84,316 80,015 102,012 73,156 65,509 71,504 81,295 131,252 1,001,009 0.9 2.9 -3.4 4.8 -0.9 -6.3 4.3 2.5 -7.0 -6.1 -2.6 0.1 -0.8
Brunei Darussalam 117 105 114 67 66 59 69 34 59 90 50 226 1,056 18.2 59.1 -13.0 26.4 -48.4 -28.0 102.9 -41.4 -9.2 18.4 -12.3 32.9 3.6
Indonesia 74,485 66,393 68,402 67,386 75,287 71,020 93,375 64,753 57,592 62,825 67,130 114,019 882,667 -0.3 4.3 -0.4 5.6 -1.3 -7.0 4.9 2.0 -8.0 -6.3 -5.7 0.7 -0.8
Malaysia 3,876 4,442 3,758 3,237 4,169 4,344 4,122 4,245 4,191 3,406 8,254 10,739 58,783 10.0 -12.1 -35.0 -7.6 4.7 -15.4 -8.2 12.7 -5.1 -24.8 14.6 -11.8 -7.5
Myanmar 298 303 294 527 347 297 264 367 242 303 277 454 3,973 5.3 0.3 -28.3 -41.2 -9.6 -10.5 -36.5 -8.9 -12.0 -7.1 -27.1 8.1 -17.7
Philippines 2,902 2,332 2,575 2,635 2,719 2,222 1,992 2,154 2,208 3,144 3,160 3,767 31,810 11.4 -12.6 -25.5 -0.1 -5.5 3.3 -11.0 4.8 17.1 33.2 15.6 14.4 2.7
Thailand 1,037 974 1,188 669 672 742 497 530 536 605 1,309 1,084 9,843 -9.4 4.7 48.9 -10.9 0.3 37.9 -21.5 -22.5 -9.8 -20.5 62.4 8.1 5.7
Vietnam 889 960 789 1,041 1,019 1,283 1,634 1,051 662 1,081 1,037 884 12,330 68.4 42.0 51.1 127.8 50.7 70.2 68.1 17.2 6.4 14.0 0.9 10.8 38.9
Other Countries in Southeast Asia 40 19 26 70 37 48 59 22 19 50 78 79 547 33.3 -36.7 -49.0 25.0 37.0 100.0 55.3 -18.5 -32.1 92.3 36.8 113.5 26.9
North Asia 23,739 32,237 16,597 15,292 12,731 11,629 19,410 24,898 12,607 16,872 17,179 15,854 219,045 -0.6 -7.8 -9.5 0.2 6.3 3.2 0.6 2.4 1.4 2.3 1.6 0.2 -0.9
Hong Kong SAR 1,915 2,051 678 1,050 753 776 1,332 1,382 691 839 1,200 1,470 14,137 103.1 13.4 -24.4 -43.0 0.9 11.5 -18.0 -15.4 -10.3 -26.0 -8.5 -4.4 -5.4
Japan 3,595 1,932 2,262 2,775 1,619 2,042 3,889 4,290 2,399 1,819 3,268 2,993 32,883 25.3 -50.3 -44.5 53.1 -10.4 32.7 69.8 22.3 19.5 -19.8 24.7 6.8 4.4
China 6,112 19,561 5,430 4,102 3,905 3,965 9,275 11,962 4,621 6,208 4,485 4,578 84,204 -41.0 3.5 9.6 -10.3 -6.3 0.9 -5.2 7.2 26.9 -1.0 -20.6 -9.7 -4.8
South Korea 11,299 7,541 7,695 6,748 5,962 4,173 4,123 6,340 4,308 7,314 7,251 5,877 78,631 26.0 -17.8 0.0 11.0 25.5 -8.5 -13.3 -12.1 -16.8 19.1 8.2 2.3 2.2
Taiwan 744 1,076 515 568 473 617 765 854 565 669 943 898 8,687 4.2 -2.5 -18.0 -37.0 0.0 18.7 -4.7 22.7 -30.6 2.3 59.6 50.4 2.3
Other Countries in North Asia 74 76 17 49 19 56 26 70 23 23 32 38 503 138.7 -2.6 -81.7 -5.8 -40.6 143.5 -40.9 -27.1 -17.9 -25.8 0.0 -48.6 -18.1
South Asia 8,533 6,561 6,699 6,832 13,946 12,436 9,693 5,879 5,937 8,368 11,802 10,439 107,125 59.6 -9.4 1.0 15.2 13.2 25.2 40.4 -14.5 29.0 -12.4 39.4 21.3 15.9
Bangladesh 69 47 119 56 86 53 99 46 59 45 53 91 823 53.3 -51.5 11.2 75.0 24.6 10.4 17.9 -46.5 -16.9 -61.5 -23.2 68.5 -6.4
India 8,251 6,299 6,369 6,499 13,716 12,230 9,385 5,669 5,772 7,903 11,517 10,141 103,751 62.1 -9.5 0.4 14.0 13.3 26.6 40.1 -13.7 33.0 -14.3 41.3 21.3 16.3
Nepal 74 51 80 52 53 65 50 69 53 90 132 63 832 15.6 -8.9 63.3 44.4 -8.6 -5.8 0.0 56.8 43.2 -2.2 222.0 80.0 31.9
Pakistan 28 17 20 11 18 38 27 17 12 163 54 22 427 -33.3 -54.1 -58.3 -57.7 -10.0 18.8 80.0 -56.4 -42.9 365.7 125.0 -42.1 13.3
Sri Lanka 100 138 98 199 66 47 126 61 35 159 40 111 1,180 7.5 58.6 18.1 51.9 11.9 -58.4 168.1 -50.8 -71.8 103.8 -76.3 2.8 -3.0
Other Countries in South Asia 11 9 13 15 7 3 6 17 6 8 6 11 112 -8.3 28.6 225.0 114.3 16.7 -62.5 -33.3 30.8 -14.3 -46.7 -25.0 22.2 6.7
West Asia 342 203 175 192 109 99 184 264 175 258 241 192 2,434 67.6 -9.4 -37.3 19.3 -44.7 -35.7 -6.6 -23.7 -29.4 -31.6 -4.4 -22.9 -15.7
Iran 42 6 9 5 7 2 7 5 8 10 12 5 118 740.0 -25.0 -89.5 25.0 133.3 -60.0 0.0 0.0 100.0 -23.1 33.3 -76.2 -30.6
Israel 36 54 26 5 2 5 8 123 41 17 317 80.0 107.7 -62.9 66.7 -60.0 -100.0 -100.0 -44.4 33.3 15.0 -51.2 325.0 -10.2
Kuwait 34 22 5 2 1 1 29 17 1 14 9 135 183.3 83.3 25.0 -33.3 -75.0 -50.0 -100.0 81.3 325.0 -90.9 27.3 50.0 43.6
Saudi Arabia 79 22 23 17 1 9 8 39 25 7 15 18 263 92.7 -54.2 9.5 -56.4 -98.9 -84.2 -60.0 -68.5 -72.5 -93.5 -64.3 -35.7 -62.9
United Arab Emirates 85 55 69 112 63 54 127 115 78 59 82 114 1,013 10.4 -1.8 -6.8 36.6 0.0 -6.9 11.4 2.7 -31.6 -24.4 26.2 -8.8 -0.5
Other Countries in West Asia 66 44 43 51 35 33 42 71 39 58 77 29 588 34.7 -40.5 79.2 70.0 6.1 37.5 16.7 -11.3 34.5 -3.3 87.8 -55.4 7.9
EUROPE 16,661 19,107 18,336 8,979 3,798 4,523 3,817 5,329 4,455 8,177 16,566 21,970 131,718 18.8 32.3 -10.4 5.2 -0.6 63.5 1.8 23.1 14.8 22.1 70.1 50.6 23.1
Austria 397 359 226 200 26 40 49 86 57 76 337 458 2,311 42.8 47.7 -57.7 55.0 -38.1 2.6 4.3 95.5 29.5 -26.9 75.5 39.2 14.1
Belgium & Luxembourg 188 199 266 113 54 48 63 86 60 81 125 241 1,524 -30.1 -33.7 -18.9 -37.6 -34.9 -38.5 -42.2 -27.7 -37.5 -20.6 -2.3 18.7 -23.6
Denmark 186 290 183 94 47 37 63 69 59 76 169 98 1,371 3.3 25.0 1.1 -20.3 -7.8 0.0 -24.1 19.0 20.4 -25.5 -8.2 16.7 0.9
Finland 163 173 125 84 58 78 71 52 87 144 233 199 1,467 -13.3 -2.3 -38.7 10.5 31.8 50.0 77.5 44.4 117.5 41.2 29.4 53.1 15.6
France 570 622 690 736 427 319 436 556 319 534 756 573 6,538 -24.1 0.3 -42.5 57.3 13.3 36.3 13.2 25.8 11.9 30.2 -6.6 10.0 0.6
Germany 5,460 5,608 6,345 1,583 387 589 386 676 541 1,362 5,359 13,302 41,598 12.7 34.8 7.9 28.0 -11.2 92.5 -7.0 26.8 -3.0 69.4 294.3 95.2 52.1
Greece 70 101 85 44 75 56 73 51 75 91 53 84 858 55.6 44.3 7.6 -8.3 120.6 -18.8 -12.0 59.4 29.3 56.9 -32.1 5.0 16.9
Italy 441 228 337 685 160 197 229 394 236 242 647 370 4,166 23.2 -16.2 -44.4 258.6 6.7 41.7 13.9 36.3 31.8 13.6 -33.9 12.8 6.7
Netherlands 691 937 938 580 302 284 333 349 273 401 432 570 6,090 -13.8 -10.2 -24.4 26.6 -26.5 24.0 4.1 -6.4 -8.4 22.6 21.0 12.0 -4.4
Norway 247 341 296 191 116 169 221 153 137 211 272 192 2,546 -26.0 -21.1 -11.9 -48.4 -21.1 81.7 47.3 14.2 7.0 17.2 -3.5 0.5 -8.3
Poland 155 173 143 67 57 86 56 72 79 127 181 88 1,284 -4.3 66.3 25.4 42.6 -38.7 152.9 93.1 -5.3 61.2 76.4 -6.7 -55.1 9.7
Rep of Ireland 117 129 128 89 41 82 32 55 32 117 135 87 1,044 42.7 57.3 43.8 36.9 17.1 192.9 -8.6 27.9 -22.0 143.8 5.5 40.3 41.5
Russian Federation 1,509 366 287 214 225 155 178 181 141 255 332 275 4,118 52.9 3.7 -30.8 -14.4 19.0 5.4 -23.9 -13.0 -32.5 -27.6 -26.2 -40.0 -3.2
Spain 242 226 318 230 52 89 75 202 108 173 383 170 2,268 -21.7 -19.9 -19.1 6.5 -53.6 -13.6 -44.0 8.6 -1.8 13.8 102.6 -2.9 -3.9
Sweden 335 293 246 142 96 83 81 78 86 167 264 214 2,085 -10.9 -0.7 3.4 -46.8 -63.6 31.7 5.2 44.4 -11.3 17.6 52.6 15.7 -6.5
Switzerland 466 507 1,079 572 136 97 180 138 112 273 1,163 489 5,212 -5.5 22.2 49.0 53.4 8.8 3.2 2.9 -13.2 -17.6 -25.6 183.0 30.1 35.4
Turkey 81 52 63 61 65 36 37 61 42 70 114 66 748 -27.0 -27.8 61.5 125.9 66.7 50.0 362.5 96.8 68.0 79.5 132.7 -20.5 36.7
UK 4,390 7,662 5,787 2,786 1,088 1,589 922 1,512 1,639 3,104 4,823 3,628 38,930 61.6 68.4 -18.2 -22.7 28.2 116.5 1.2 25.2 38.1 16.8 69.6 14.8 23.6
Other Countries in Eastern Europe 792 635 539 425 332 393 304 474 307 515 621 768 6,105 20.4 3.4 -12.6 26.5 5.1 65.1 8.2 73.6 17.2 31.0 -8.9 33.1 16.4
Other Countries in Western Europe 161 206 255 83 54 96 28 84 65 158 167 98 1,455 103.8 64.8 48.3 15.3 116.0 269.2 -15.2 171.0 124.1 119.4 135.2 -22.2 69.0
OCEANIA 12,496 7,575 6,170 7,869 6,518 3,162 2,447 6,069 4,756 8,735 5,194 8,257 79,248 43.4 105.1 -11.5 -12.3 98.5 99.9 -48.5 72.2 76.8 47.9 35.6 37.9 32.3
Australia 11,700 7,208 5,653 7,381 6,109 2,845 2,135 5,524 4,260 8,125 4,845 7,738 73,523 41.2 108.0 -12.5 -13.4 115.0 99.0 -50.6 71.2 81.4 47.8 36.5 39.0 32.4
New Zealand 752 323 484 430 385 285 289 530 475 591 334 490 5,368 96.9 56.8 8.3 -3.4 -9.2 99.3 -29.7 90.0 45.3 55.9 24.6 25.3 30.9
Other Countries in Oceania 44 44 33 58 24 32 23 15 21 19 15 29 357 0.0 100.0 -45.9 544.4 33.3 255.6 9.5 -21.1 50.0 -32.1 25.0 -9.4 23.5
AFRICA 697 286 268 257 305 159 168 157 218 539 462 528 4,044 41.4 30.6 24.1 -5.9 238.9 93.9 -29.1 -25.9 47.3 211.6 -7.0 -7.5 25.9
Egypt 30 12 13 6 4 5 5 9 3 56 12 7 162 233.3 -14.3 -7.1 -14.3 -42.9 -28.6 0.0 0.0 -40.0 833.3 71.4 -56.3 52.8
Mauritius 108 21 23 27 2 4 8 16 8 24 111 121 473 56.5 110.0 43.8 58.8 -66.7 0.0 -57.9 0.0 -50.0 500.0 30.6 -4.0 21.9
South Africa (Rep of) 456 213 184 185 263 120 124 82 175 359 304 334 2,799 39.0 60.2 28.7 -13.6 353.4 328.6 17.0 15.5 98.9 241.9 -9.0 17.2 47.9
Other Countries in Africa 103 40 48 39 36 30 31 50 32 100 35 66 610 18.4 -35.5 11.6 11.4 89.5 -30.2 -71.0 -56.9 -17.9 72.4 -50.7 -54.2 -26.0
NOT STATED 1 3 3 1 3 11 -80.0 -62.5 -100.0 200.0 -100.0 -31.3
Source: Embarkation / Disembarkation Cards
© 2016 Singapore Tourism Board.
All rights reserved. No part of this publication may be reproduced, distributed, or transmitted in any form or by any means, electronic, mechanical, photocopying, recording or otherwise, without the prior permission of STB, or as otherwise permitted herein.
Contents of this report may be reproduced accurately in part in other publications if STB is acknowledged and attributed as copyright owner.
STB shall not be liable for any loss, damage or injury caused by or arising out of the use of the data in this publication. All information in this publication are deemed to be correct at time of printing.
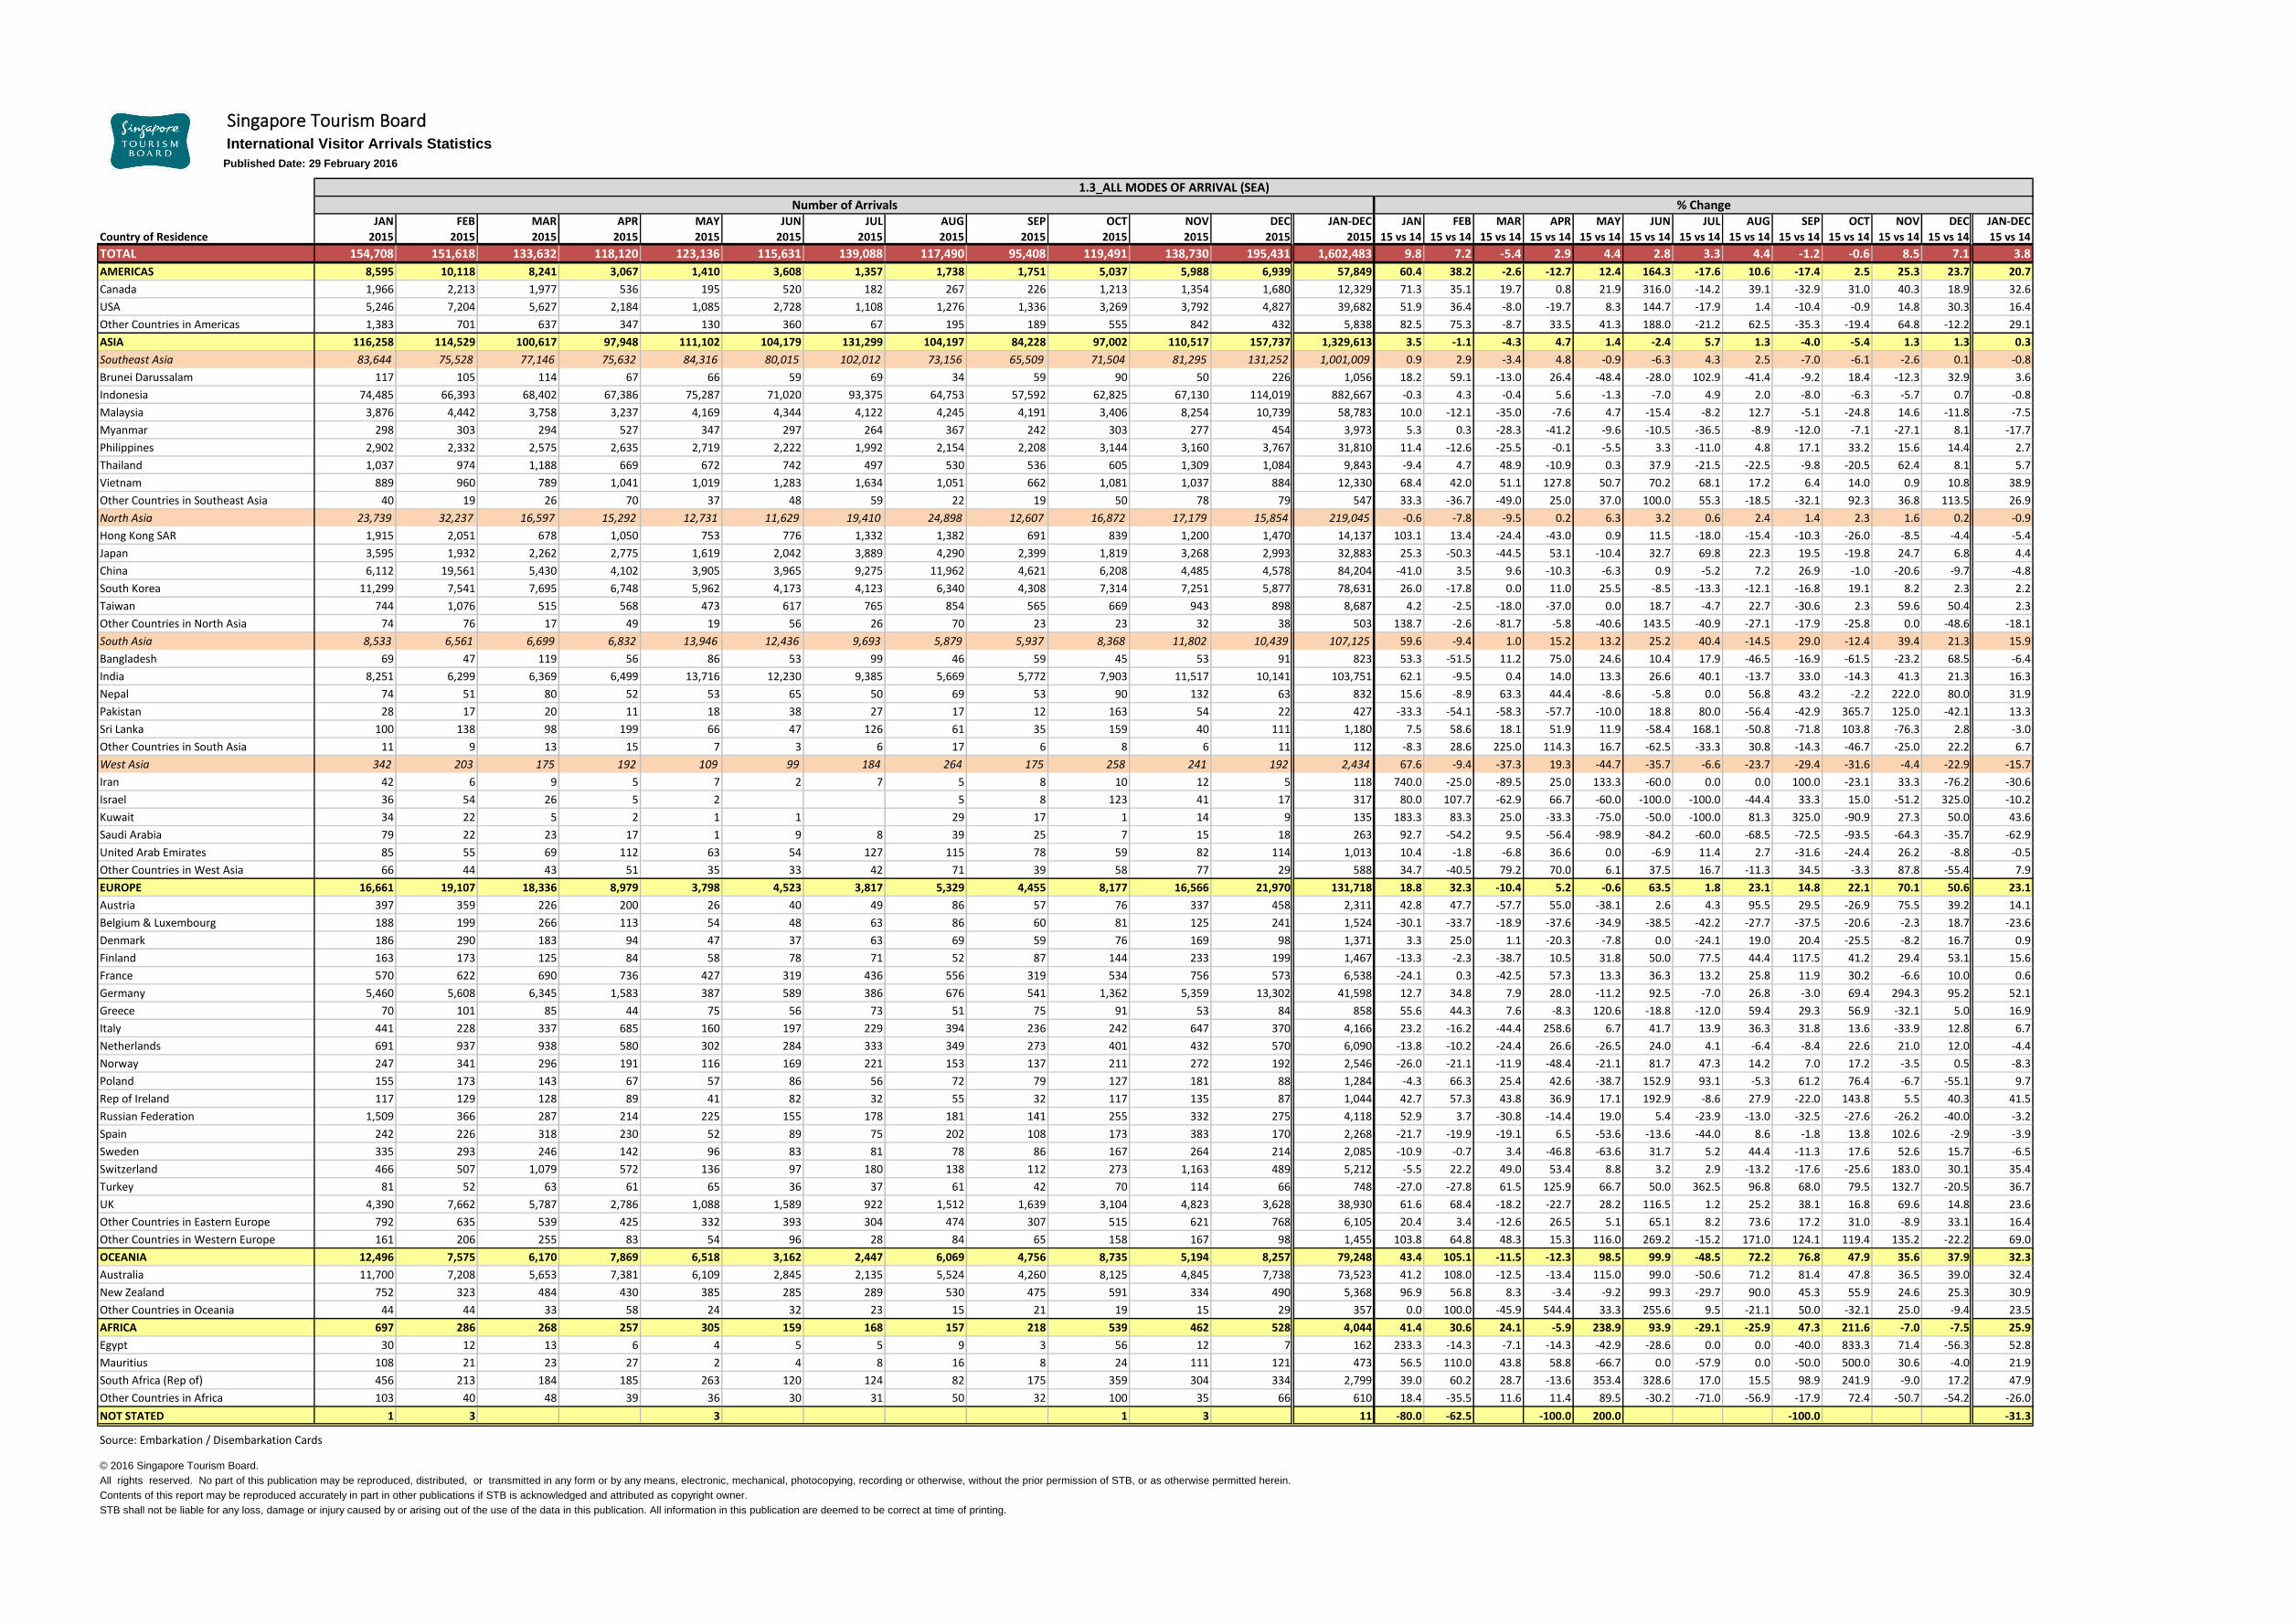
1.3_ALL MODES OF ARRIVAL (SEA)
Number of Arrivals % Change
Singapore Tourism BoardInternational Visitor Arrivals Statistics
Published Date: 29 February 2016
JAN FEB MAR APR MAY JUN JUL AUG SEP OCT NOV DEC JAN-DEC JAN FEB MAR APR MAY JUN JUL AUG SEP OCT NOV DEC JAN-DEC
Country of Residence 2015 2015 2015 2015 2015 2015 2015 2015 2015 2015 2015 2015 2015 15 vs 14 15 vs 14 15 vs 14 15 vs 14 15 vs 14 15 vs 14 15 vs 14 15 vs 14 15 vs 14 15 vs 14 15 vs 14 15 vs 14 15 vs 14
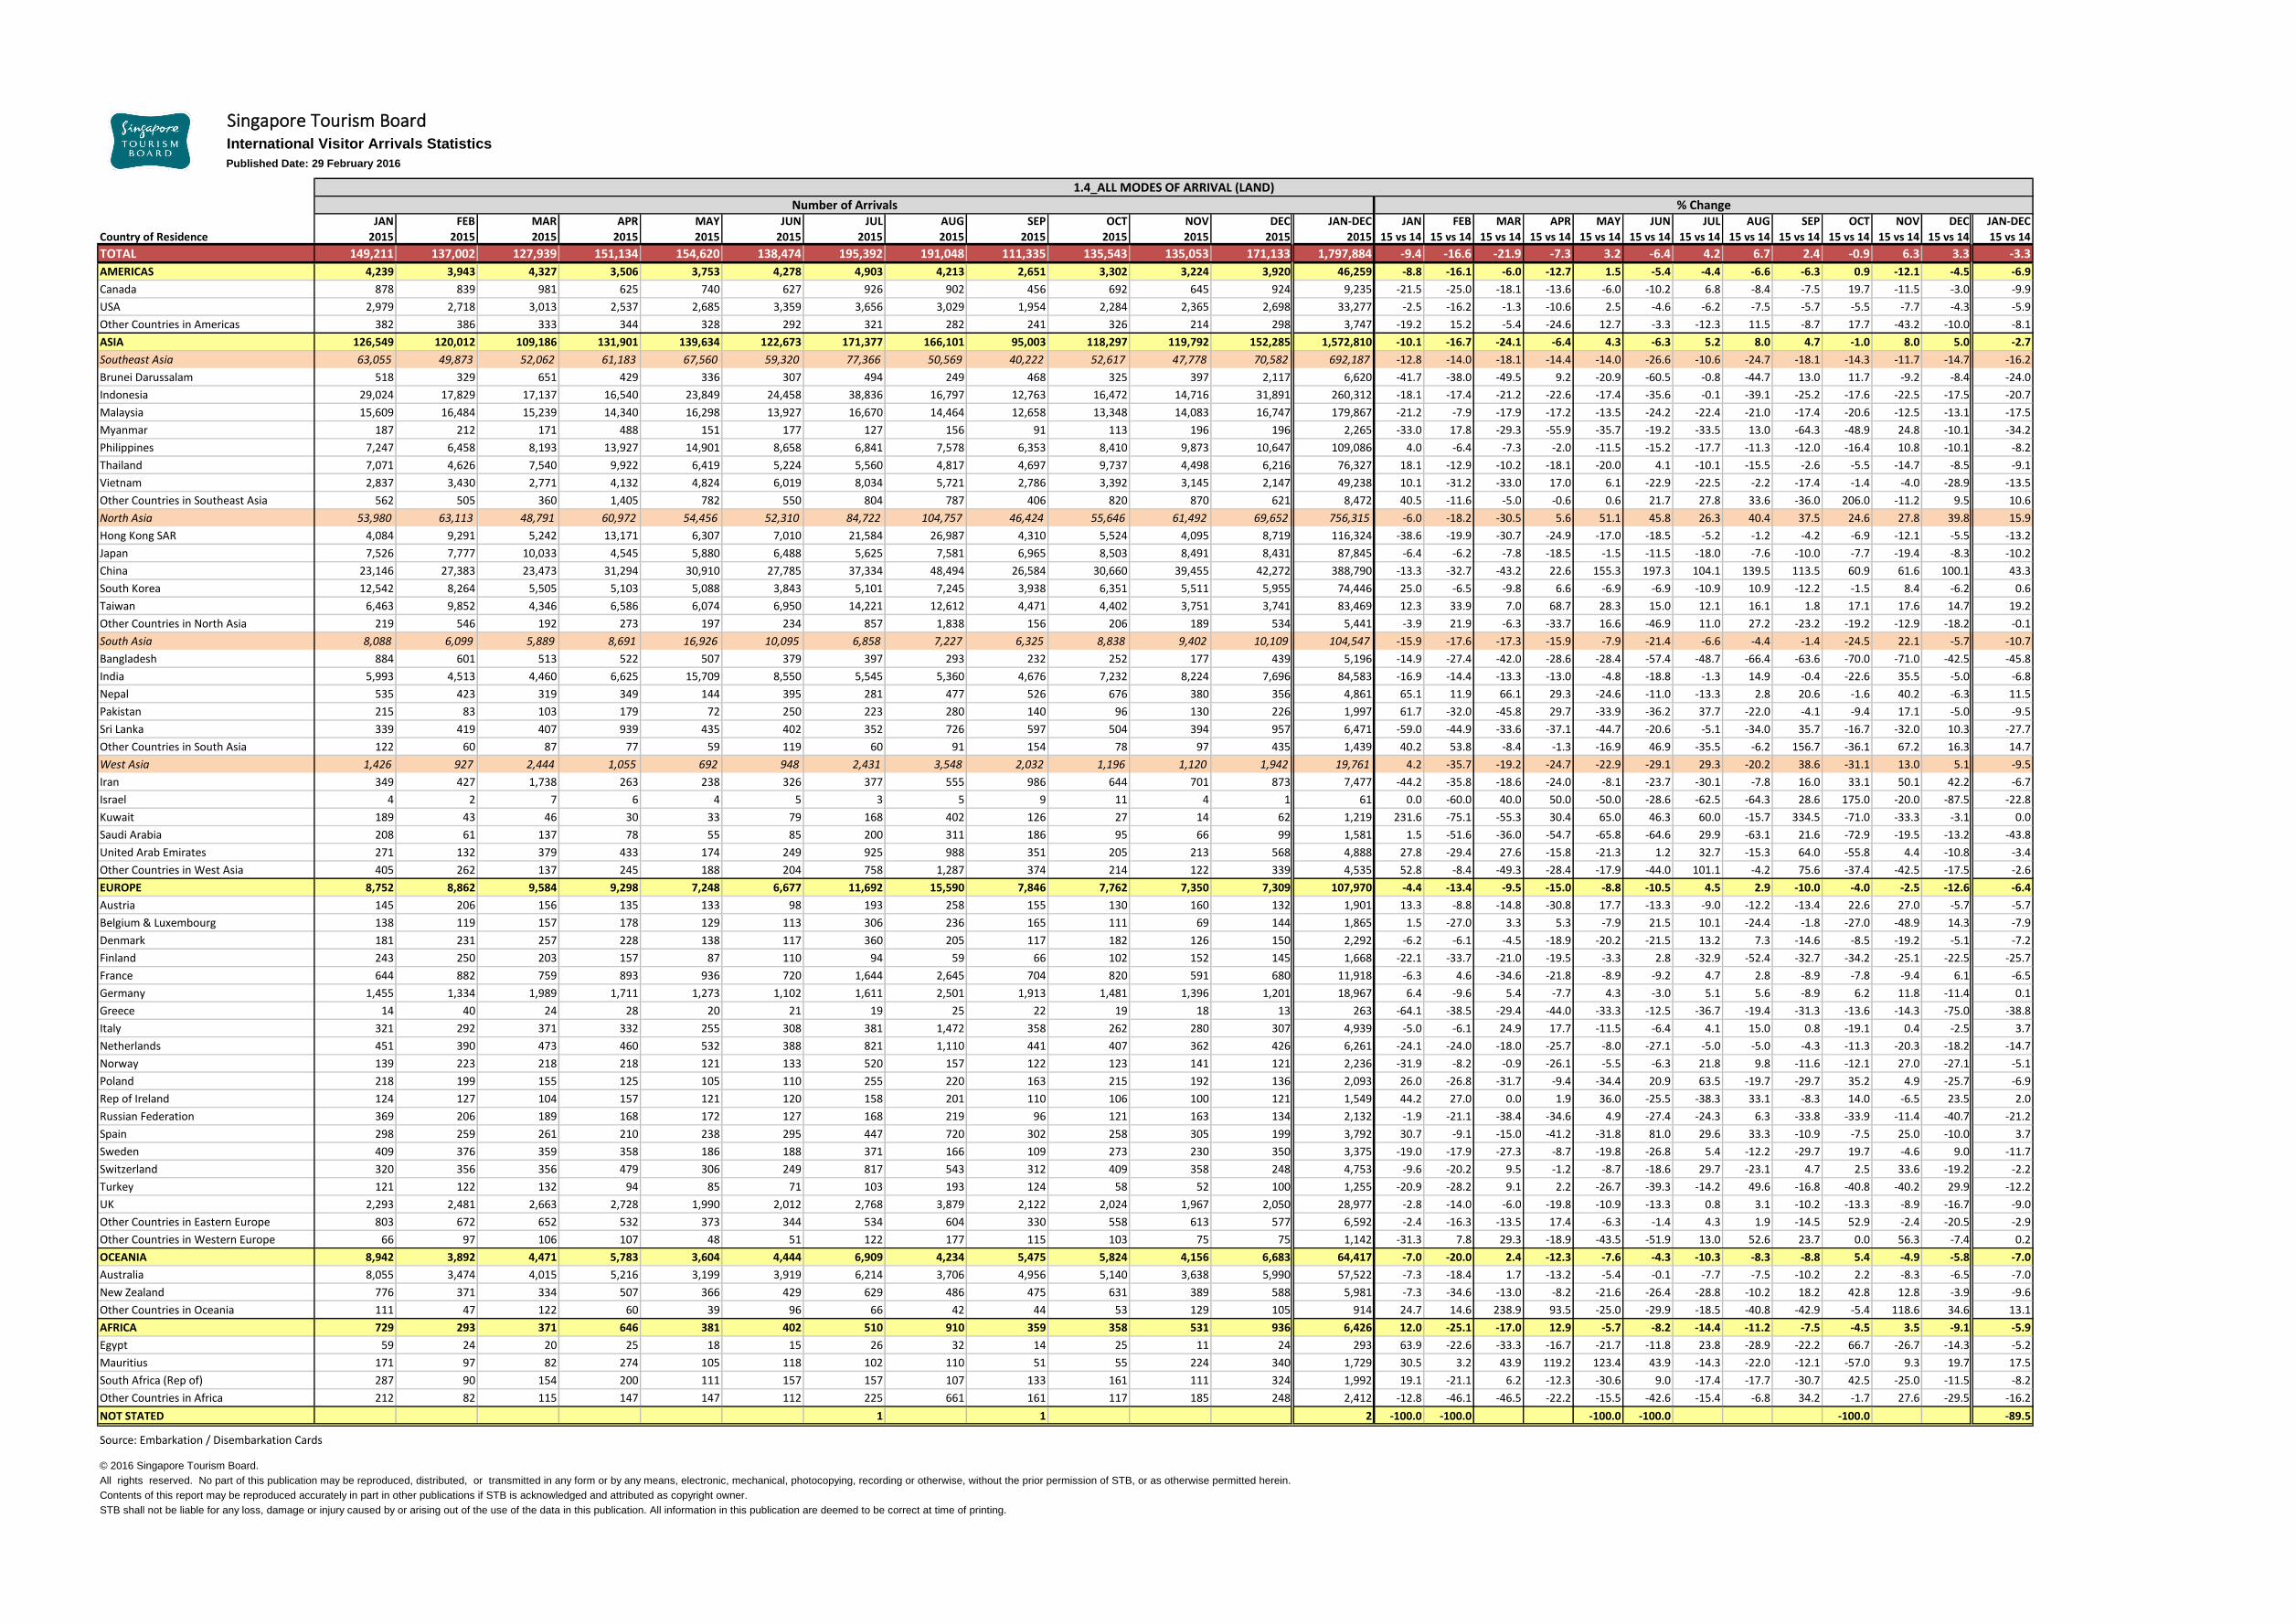
TOTAL 149,211 137,002 127,939 151,134 154,620 138,474 195,392 191,048 111,335 135,543 135,053 171,133 1,797,884 -9.4 -16.6 -21.9 -7.3 3.2 -6.4 4.2 6.7 2.4 -0.9 6.3 3.3 -3.3
AMERICAS 4,239 3,943 4,327 3,506 3,753 4,278 4,903 4,213 2,651 3,302 3,224 3,920 46,259 -8.8 -16.1 -6.0 -12.7 1.5 -5.4 -4.4 -6.6 -6.3 0.9 -12.1 -4.5 -6.9
Canada 878 839 981 625 740 627 926 902 456 692 645 924 9,235 -21.5 -25.0 -18.1 -13.6 -6.0 -10.2 6.8 -8.4 -7.5 19.7 -11.5 -3.0 -9.9
USA 2,979 2,718 3,013 2,537 2,685 3,359 3,656 3,029 1,954 2,284 2,365 2,698 33,277 -2.5 -16.2 -1.3 -10.6 2.5 -4.6 -6.2 -7.5 -5.7 -5.5 -7.7 -4.3 -5.9
Other Countries in Americas 382 386 333 344 328 292 321 282 241 326 214 298 3,747 -19.2 15.2 -5.4 -24.6 12.7 -3.3 -12.3 11.5 -8.7 17.7 -43.2 -10.0 -8.1
ASIA 126,549 120,012 109,186 131,901 139,634 122,673 171,377 166,101 95,003 118,297 119,792 152,285 1,572,810 -10.1 -16.7 -24.1 -6.4 4.3 -6.3 5.2 8.0 4.7 -1.0 8.0 5.0 -2.7
Southeast Asia 63,055 49,873 52,062 61,183 67,560 59,320 77,366 50,569 40,222 52,617 47,778 70,582 692,187 -12.8 -14.0 -18.1 -14.4 -14.0 -26.6 -10.6 -24.7 -18.1 -14.3 -11.7 -14.7 -16.2
Brunei Darussalam 518 329 651 429 336 307 494 249 468 325 397 2,117 6,620 -41.7 -38.0 -49.5 9.2 -20.9 -60.5 -0.8 -44.7 13.0 11.7 -9.2 -8.4 -24.0
Indonesia 29,024 17,829 17,137 16,540 23,849 24,458 38,836 16,797 12,763 16,472 14,716 31,891 260,312 -18.1 -17.4 -21.2 -22.6 -17.4 -35.6 -0.1 -39.1 -25.2 -17.6 -22.5 -17.5 -20.7
Malaysia 15,609 16,484 15,239 14,340 16,298 13,927 16,670 14,464 12,658 13,348 14,083 16,747 179,867 -21.2 -7.9 -17.9 -17.2 -13.5 -24.2 -22.4 -21.0 -17.4 -20.6 -12.5 -13.1 -17.5
Myanmar 187 212 171 488 151 177 127 156 91 113 196 196 2,265 -33.0 17.8 -29.3 -55.9 -35.7 -19.2 -33.5 13.0 -64.3 -48.9 24.8 -10.1 -34.2
Philippines 7,247 6,458 8,193 13,927 14,901 8,658 6,841 7,578 6,353 8,410 9,873 10,647 109,086 4.0 -6.4 -7.3 -2.0 -11.5 -15.2 -17.7 -11.3 -12.0 -16.4 10.8 -10.1 -8.2
Thailand 7,071 4,626 7,540 9,922 6,419 5,224 5,560 4,817 4,697 9,737 4,498 6,216 76,327 18.1 -12.9 -10.2 -18.1 -20.0 4.1 -10.1 -15.5 -2.6 -5.5 -14.7 -8.5 -9.1
Vietnam 2,837 3,430 2,771 4,132 4,824 6,019 8,034 5,721 2,786 3,392 3,145 2,147 49,238 10.1 -31.2 -33.0 17.0 6.1 -22.9 -22.5 -2.2 -17.4 -1.4 -4.0 -28.9 -13.5
Other Countries in Southeast Asia 562 505 360 1,405 782 550 804 787 406 820 870 621 8,472 40.5 -11.6 -5.0 -0.6 0.6 21.7 27.8 33.6 -36.0 206.0 -11.2 9.5 10.6
North Asia 53,980 63,113 48,791 60,972 54,456 52,310 84,722 104,757 46,424 55,646 61,492 69,652 756,315 -6.0 -18.2 -30.5 5.6 51.1 45.8 26.3 40.4 37.5 24.6 27.8 39.8 15.9
Hong Kong SAR 4,084 9,291 5,242 13,171 6,307 7,010 21,584 26,987 4,310 5,524 4,095 8,719 116,324 -38.6 -19.9 -30.7 -24.9 -17.0 -18.5 -5.2 -1.2 -4.2 -6.9 -12.1 -5.5 -13.2
Japan 7,526 7,777 10,033 4,545 5,880 6,488 5,625 7,581 6,965 8,503 8,491 8,431 87,845 -6.4 -6.2 -7.8 -18.5 -1.5 -11.5 -18.0 -7.6 -10.0 -7.7 -19.4 -8.3 -10.2
China 23,146 27,383 23,473 31,294 30,910 27,785 37,334 48,494 26,584 30,660 39,455 42,272 388,790 -13.3 -32.7 -43.2 22.6 155.3 197.3 104.1 139.5 113.5 60.9 61.6 100.1 43.3
South Korea 12,542 8,264 5,505 5,103 5,088 3,843 5,101 7,245 3,938 6,351 5,511 5,955 74,446 25.0 -6.5 -9.8 6.6 -6.9 -6.9 -10.9 10.9 -12.2 -1.5 8.4 -6.2 0.6
Taiwan 6,463 9,852 4,346 6,586 6,074 6,950 14,221 12,612 4,471 4,402 3,751 3,741 83,469 12.3 33.9 7.0 68.7 28.3 15.0 12.1 16.1 1.8 17.1 17.6 14.7 19.2
Other Countries in North Asia 219 546 192 273 197 234 857 1,838 156 206 189 534 5,441 -3.9 21.9 -6.3 -33.7 16.6 -46.9 11.0 27.2 -23.2 -19.2 -12.9 -18.2 -0.1
South Asia 8,088 6,099 5,889 8,691 16,926 10,095 6,858 7,227 6,325 8,838 9,402 10,109 104,547 -15.9 -17.6 -17.3 -15.9 -7.9 -21.4 -6.6 -4.4 -1.4 -24.5 22.1 -5.7 -10.7
Bangladesh 884 601 513 522 507 379 397 293 232 252 177 439 5,196 -14.9 -27.4 -42.0 -28.6 -28.4 -57.4 -48.7 -66.4 -63.6 -70.0 -71.0 -42.5 -45.8
India 5,993 4,513 4,460 6,625 15,709 8,550 5,545 5,360 4,676 7,232 8,224 7,696 84,583 -16.9 -14.4 -13.3 -13.0 -4.8 -18.8 -1.3 14.9 -0.4 -22.6 35.5 -5.0 -6.8
Nepal 535 423 319 349 144 395 281 477 526 676 380 356 4,861 65.1 11.9 66.1 29.3 -24.6 -11.0 -13.3 2.8 20.6 -1.6 40.2 -6.3 11.5
Pakistan 215 83 103 179 72 250 223 280 140 96 130 226 1,997 61.7 -32.0 -45.8 29.7 -33.9 -36.2 37.7 -22.0 -4.1 -9.4 17.1 -5.0 -9.5
Sri Lanka 339 419 407 939 435 402 352 726 597 504 394 957 6,471 -59.0 -44.9 -33.6 -37.1 -44.7 -20.6 -5.1 -34.0 35.7 -16.7 -32.0 10.3 -27.7
Other Countries in South Asia 122 60 87 77 59 119 60 91 154 78 97 435 1,439 40.2 53.8 -8.4 -1.3 -16.9 46.9 -35.5 -6.2 156.7 -36.1 67.2 16.3 14.7
West Asia 1,426 927 2,444 1,055 692 948 2,431 3,548 2,032 1,196 1,120 1,942 19,761 4.2 -35.7 -19.2 -24.7 -22.9 -29.1 29.3 -20.2 38.6 -31.1 13.0 5.1 -9.5
Iran 349 427 1,738 263 238 326 377 555 986 644 701 873 7,477 -44.2 -35.8 -18.6 -24.0 -8.1 -23.7 -30.1 -7.8 16.0 33.1 50.1 42.2 -6.7
Israel 4 2 7 6 4 5 3 5 9 11 4 1 61 0.0 -60.0 40.0 50.0 -50.0 -28.6 -62.5 -64.3 28.6 175.0 -20.0 -87.5 -22.8
Kuwait 189 43 46 30 33 79 168 402 126 27 14 62 1,219 231.6 -75.1 -55.3 30.4 65.0 46.3 60.0 -15.7 334.5 -71.0 -33.3 -3.1 0.0
Saudi Arabia 208 61 137 78 55 85 200 311 186 95 66 99 1,581 1.5 -51.6 -36.0 -54.7 -65.8 -64.6 29.9 -63.1 21.6 -72.9 -19.5 -13.2 -43.8
United Arab Emirates 271 132 379 433 174 249 925 988 351 205 213 568 4,888 27.8 -29.4 27.6 -15.8 -21.3 1.2 32.7 -15.3 64.0 -55.8 4.4 -10.8 -3.4
Other Countries in West Asia 405 262 137 245 188 204 758 1,287 374 214 122 339 4,535 52.8 -8.4 -49.3 -28.4 -17.9 -44.0 101.1 -4.2 75.6 -37.4 -42.5 -17.5 -2.6
EUROPE 8,752 8,862 9,584 9,298 7,248 6,677 11,692 15,590 7,846 7,762 7,350 7,309 107,970 -4.4 -13.4 -9.5 -15.0 -8.8 -10.5 4.5 2.9 -10.0 -4.0 -2.5 -12.6 -6.4
Austria 145 206 156 135 133 98 193 258 155 130 160 132 1,901 13.3 -8.8 -14.8 -30.8 17.7 -13.3 -9.0 -12.2 -13.4 22.6 27.0 -5.7 -5.7
Belgium & Luxembourg 138 119 157 178 129 113 306 236 165 111 69 144 1,865 1.5 -27.0 3.3 5.3 -7.9 21.5 10.1 -24.4 -1.8 -27.0 -48.9 14.3 -7.9
Denmark 181 231 257 228 138 117 360 205 117 182 126 150 2,292 -6.2 -6.1 -4.5 -18.9 -20.2 -21.5 13.2 7.3 -14.6 -8.5 -19.2 -5.1 -7.2
Finland 243 250 203 157 87 110 94 59 66 102 152 145 1,668 -22.1 -33.7 -21.0 -19.5 -3.3 2.8 -32.9 -52.4 -32.7 -34.2 -25.1 -22.5 -25.7
France 644 882 759 893 936 720 1,644 2,645 704 820 591 680 11,918 -6.3 4.6 -34.6 -21.8 -8.9 -9.2 4.7 2.8 -8.9 -7.8 -9.4 6.1 -6.5
Germany 1,455 1,334 1,989 1,711 1,273 1,102 1,611 2,501 1,913 1,481 1,396 1,201 18,967 6.4 -9.6 5.4 -7.7 4.3 -3.0 5.1 5.6 -8.9 6.2 11.8 -11.4 0.1
Greece 14 40 24 28 20 21 19 25 22 19 18 13 263 -64.1 -38.5 -29.4 -44.0 -33.3 -12.5 -36.7 -19.4 -31.3 -13.6 -14.3 -75.0 -38.8
Italy 321 292 371 332 255 308 381 1,472 358 262 280 307 4,939 -5.0 -6.1 24.9 17.7 -11.5 -6.4 4.1 15.0 0.8 -19.1 0.4 -2.5 3.7
Netherlands 451 390 473 460 532 388 821 1,110 441 407 362 426 6,261 -24.1 -24.0 -18.0 -25.7 -8.0 -27.1 -5.0 -5.0 -4.3 -11.3 -20.3 -18.2 -14.7
Norway 139 223 218 218 121 133 520 157 122 123 141 121 2,236 -31.9 -8.2 -0.9 -26.1 -5.5 -6.3 21.8 9.8 -11.6 -12.1 27.0 -27.1 -5.1
Poland 218 199 155 125 105 110 255 220 163 215 192 136 2,093 26.0 -26.8 -31.7 -9.4 -34.4 20.9 63.5 -19.7 -29.7 35.2 4.9 -25.7 -6.9
Rep of Ireland 124 127 104 157 121 120 158 201 110 106 100 121 1,549 44.2 27.0 0.0 1.9 36.0 -25.5 -38.3 33.1 -8.3 14.0 -6.5 23.5 2.0
Russian Federation 369 206 189 168 172 127 168 219 96 121 163 134 2,132 -1.9 -21.1 -38.4 -34.6 4.9 -27.4 -24.3 6.3 -33.8 -33.9 -11.4 -40.7 -21.2
Spain 298 259 261 210 238 295 447 720 302 258 305 199 3,792 30.7 -9.1 -15.0 -41.2 -31.8 81.0 29.6 33.3 -10.9 -7.5 25.0 -10.0 3.7
Sweden 409 376 359 358 186 188 371 166 109 273 230 350 3,375 -19.0 -17.9 -27.3 -8.7 -19.8 -26.8 5.4 -12.2 -29.7 19.7 -4.6 9.0 -11.7
Switzerland 320 356 356 479 306 249 817 543 312 409 358 248 4,753 -9.6 -20.2 9.5 -1.2 -8.7 -18.6 29.7 -23.1 4.7 2.5 33.6 -19.2 -2.2
Turkey 121 122 132 94 85 71 103 193 124 58 52 100 1,255 -20.9 -28.2 9.1 2.2 -26.7 -39.3 -14.2 49.6 -16.8 -40.8 -40.2 29.9 -12.2
UK 2,293 2,481 2,663 2,728 1,990 2,012 2,768 3,879 2,122 2,024 1,967 2,050 28,977 -2.8 -14.0 -6.0 -19.8 -10.9 -13.3 0.8 3.1 -10.2 -13.3 -8.9 -16.7 -9.0
Other Countries in Eastern Europe 803 672 652 532 373 344 534 604 330 558 613 577 6,592 -2.4 -16.3 -13.5 17.4 -6.3 -1.4 4.3 1.9 -14.5 52.9 -2.4 -20.5 -2.9
Other Countries in Western Europe 66 97 106 107 48 51 122 177 115 103 75 75 1,142 -31.3 7.8 29.3 -18.9 -43.5 -51.9 13.0 52.6 23.7 0.0 56.3 -7.4 0.2
OCEANIA 8,942 3,892 4,471 5,783 3,604 4,444 6,909 4,234 5,475 5,824 4,156 6,683 64,417 -7.0 -20.0 2.4 -12.3 -7.6 -4.3 -10.3 -8.3 -8.8 5.4 -4.9 -5.8 -7.0
Australia 8,055 3,474 4,015 5,216 3,199 3,919 6,214 3,706 4,956 5,140 3,638 5,990 57,522 -7.3 -18.4 1.7 -13.2 -5.4 -0.1 -7.7 -7.5 -10.2 2.2 -8.3 -6.5 -7.0
New Zealand 776 371 334 507 366 429 629 486 475 631 389 588 5,981 -7.3 -34.6 -13.0 -8.2 -21.6 -26.4 -28.8 -10.2 18.2 42.8 12.8 -3.9 -9.6
Other Countries in Oceania 111 47 122 60 39 96 66 42 44 53 129 105 914 24.7 14.6 238.9 93.5 -25.0 -29.9 -18.5 -40.8 -42.9 -5.4 118.6 34.6 13.1
AFRICA 729 293 371 646 381 402 510 910 359 358 531 936 6,426 12.0 -25.1 -17.0 12.9 -5.7 -8.2 -14.4 -11.2 -7.5 -4.5 3.5 -9.1 -5.9
Egypt 59 24 20 25 18 15 26 32 14 25 11 24 293 63.9 -22.6 -33.3 -16.7 -21.7 -11.8 23.8 -28.9 -22.2 66.7 -26.7 -14.3 -5.2
Mauritius 171 97 82 274 105 118 102 110 51 55 224 340 1,729 30.5 3.2 43.9 119.2 123.4 43.9 -14.3 -22.0 -12.1 -57.0 9.3 19.7 17.5
South Africa (Rep of) 287 90 154 200 111 157 157 107 133 161 111 324 1,992 19.1 -21.1 6.2 -12.3 -30.6 9.0 -17.4 -17.7 -30.7 42.5 -25.0 -11.5 -8.2
Other Countries in Africa 212 82 115 147 147 112 225 661 161 117 185 248 2,412 -12.8 -46.1 -46.5 -22.2 -15.5 -42.6 -15.4 -6.8 34.2 -1.7 27.6 -29.5 -16.2
NOT STATED 1 1 2 -100.0 -100.0 -100.0 -100.0 -100.0 -89.5
Source: Embarkation / Disembarkation Cards
© 2016 Singapore Tourism Board.
All rights reserved. No part of this publication may be reproduced, distributed, or transmitted in any form or by any means, electronic, mechanical, photocopying, recording or otherwise, without the prior permission of STB, or as otherwise permitted herein.
Contents of this report may be reproduced accurately in part in other publications if STB is acknowledged and attributed as copyright owner.
STB shall not be liable for any loss, damage or injury caused by or arising out of the use of the data in this publication. All information in this publication are deemed to be correct at time of printing.
1.4_ALL MODES OF ARRIVAL (LAND)
Number of Arrivals % Change
EXPLANATORY NOTES FOR STATISTICS ON INTERNATIONAL VISITOR ARRIVALS
Source of Data
Definitions
International visitor arrivals
Back to Contents International Visitor Arrivals 2015
Visitors arriving in Singapore are required to complete prescribed disembarkation/embarkation cards which serve as the source of
statistics on visitor arrivals and departures. The accuracy of figures pertaining to the characteristics of visitors therefore depends
on how accurately visitors complete these cards.
All visitors are classified by country of residence unless otherwise stated. Total international visitor arrivals include all visitors
coming by air and sea and non-Malaysian citizens coming by land.