SINGAPORE REPORT - RLBassets.rlb.com/production/2017/09/08062907/RLB-Singapore...Singapore Post...
12
SINGAPORE REPORT CONTRUCTION MARKET QUARTERLY UPDATE ISSUE NO. 78 | JUNE 2017
-
Upload
truongdieu -
Category
Documents
-
view
214 -
download
1
Transcript of SINGAPORE REPORT - RLBassets.rlb.com/production/2017/09/08062907/RLB-Singapore...Singapore Post...

SINGAPORE REPORTCONTRUCTION MARKET QUARTERLY UPDATE
ISSUE NO. 78 | JUNE 2017

KALLANG RIVERSIDE @ KAMPONG BUGISPROJECT FEATURE
|SINGAPORE REPORT
JUNE 2017
1 |
Artist Impression courtesy of ID Architects Pte Ltd
Designed by ID Architects, this 30 storey mixed-use condominium development overlooks the Kallang River, and commands stunning panoramic views of the Kallang riverside waterfront. It has a total construction floor area of approximately 40,600m2 and offers 212 apartment units.
Strategically located at the edge of the central business district, Kallang Riverside is easily accessible via the Kallang-Paya Lebar Expressway (KPE) from East Coast Parkway (ECP) or the Marina Coastal Expressway (MCE) from Marina Bay. There are three MRT stations to serve residents and visitors in the vicinity, namely the Lavender and Kallang MRT stations and the Stadium Circle Line station at the Sports Hub.
In order to be in sync with site conditions and in response to the call for a more sustainable mode of living amidst Singapore’s dense urban environment, the architectural design allowed the ground floor space to give the impression of a fenceless public space to encourage fluid pedestrian circulation between the development and the surrounding park. Lush greenery is also incorporated extensively, with sky gardens, planters and green walls well integrated into every public and residential communal area, providing a seamless transition between the park and the development.
Kallang Riverside has achieved the Building Construction Authority (BCA) Green Mark GoldPlus award. RLB is proud to be the quantity surveyor of this project.

MARKET TRENDS
SINGAPORE ECONOMY
SINGAPORE REPORT | JUNE 2017
2 |
The global economic slowdown has impacted much of the Singapore economy, causing uneven growth across its sectors. Singapore’s economy stayed resilient in 1Q 2017, with a gross domestic product (GDP) expansion of 2.7% on a year-on-year (y-o-y) basis, according to the Ministry of Trade and Industry (MTI).
For 2Q 2017, advanced estimates by MTI forecasts a 2.5% y-o-y growth. The biggest contributor to the first quarter’s GDP was the manufacturing sector as it grew 8.0%, and extended the 11.0% expansion from the preceding quarter. Comparatively, the construction sector declined for the third consecutive quarter by registering -1.4% y-o-y for 1Q 2017, as the slowdown in private sector construction activities persist.
CPI-All Items inflation rose to 1.4% in May from 0.4% in the preceding month, due to energy-related components and the impact of administrative processing increases. MAS Core inflation also eased to 1.6% in May from 1.7% recorded in the previous month. Based on MTI’s growth data, the government is confident the economy for 2017 will clock its fastest growth rate in three years as global growth is expected to strengthen considerably. While the Monetary Authority of Singapore (MAS) maintains its earlier growth forecast for 2017 at 1.0% to 3.0%, economists cautioned the water tariff hike, from 1 July this year could weigh on domestic demands in the second half of the year and may impede on the government’s targeted annual growth.
Local labour market conditions remain slack and this is expected to dampen underlying wage pressures. Overall labour productivity grew by 2.7% in 1Q 2017, compared to the same period a year ago. The manufacturing and construction sectors achieved the highest productivity growth at 12.0% and 3.0% respectively.
Prime Minister Lee Hsien Loong emphasized on job creation and tackling unemployment at the recent May Day Rally after unemployment levels crept to 2.3% in 1Q 2017, up from 2.2% in December 2016. To reverse the unemployment trend, the government is helping unemployed citizens to find alternative jobs, especially professionals, managers, executives and technicians (PMETs) through schemes such as SkillsFuture, job-matching and Professional Conversion Programmes for older and/or retrenched workers.
Rising business costs has been weighing heavily on the sales and profit margins of small and medium enterprises (SMEs), causing many them to struggle to stay afloat. Budget 2017 will see the government bringing in new businesses and investments, and upgrade existing companies. SMEs will also get financial assistance to upgrade themselves, go overseas, expand and build new capabilities. Additionally, the government continues to create opportunities for transformation in the built environment sector. The Ministry of National Development (MND) wants this sector “to be technologically advanced, coordinated across the entire construction value chain, and be supported by a highly skilled workforce with a strong Singaporean PMET core”.

SINGAPORE REPORT | JUNE 2017
previous quarter. Although market stock for office space increased slower by 31,000m2, (compared with the increase of 66,000m2 in the preceding quarter), occupancy rates for office space fell drastically by 6,000m2 (compared to the increase of 1,000m2 in the previous quarter). This caused the island-wide vacancy rate of office space to rise to 11.6% in 1Q 2017, from 11.1% at the end of the previous quarter.
The retail market in particular, will continue to face headwinds in rental rates as consumerism habits lean towards e-commerce. URA estimated some 6.2 million sq ft (approximately 576,000m2) of new retail space will be completed between 2017 and 2020. New retail completions this year includes Singapore Post Centre at Paya Lebar, The Heart at Marina One, and Hillion Mall at Bukit Panjang. Analysts believe the growing popularity of e-commerce will continue to put pressure on retailers, as supported by URA statistics which showed that the island-wide vacancy rate of retail space rose to 7.7% at the end of 1Q 2017, from 7.5% at the end of the 4Q 2016.
Jurong Town Council (JTC) reported the price and rental indices in 1Q 2017 for the overall industrial property market fell by 2.2% and 0.9% respectively from the previous quarter. JTC estimates there will be about 2 million square metres of industrial space, including 421,000m2 of multiple-user factory space to come on stream between 2Q 2017 and 4Q 2017. This is higher than the average annual supply and demand in the past three years, which were around 1.8 million square metres and 1.3 million square metres respectively. Therefore, JTC expects the industrial property market to remain soft for the rest of the year with further downward pressure on occupancy rates, prices and rentals, translating to reduced business costs for industrialists.
The year 2016 and the earlier part of 2017 was a lacklustre one for the overall market for office, retail, and industrial properties. It is especially so with the leasing market, where deals were dominated by renewals and relocations. This trend is expected to continue, albeit moderated, for the rest of 2017 as global and domestic economic growth remains soft.
According to the Urban Redevelopment Authority (URA), prices of private residential properties for 1Q 2017 decreased by 0.4%, compared with the 0.5% decline in 4Q 2016. Developers were less aggressive in their property launches in 1Q 2017 with 1,949 uncompleted private residential units (excluding ECs) released for sale, compared to the 2,944 units in 4Q 2016. As at the end of 1Q 2017, there was a total supply of 36,942 uncompleted private residential units (excluding ECs) in the pipeline, compared with the 40,913 units in the previous quarter and of this number, 15,930 units remained unsold. For 2Q 2017, URA’s flash estimates showed the overall private residential property index (PPI) fell 0.4 points from 136.7 points in 1Q 2017 to 136.3 points in 2Q 2017. This represents a decline of 0.3%, compared with the 0.4% decline in the previous quarter. Similarly, landed residential property prices fell by 0.4%, compared to the 1.8% decrease in the previous quarter.
In the office sector, sale prices of office space decreased by 4.0% in 1Q 2017, compared with the 0.6% decline in the preceding quarter. Office space rental rates also went down by 3.4% in 1Q 2017, compared with the decline of 1.8% in 4Q 2016. As at the end of 1Q 2017, there was a total supply of about 826,000m2 gross floor area (GFA) of office space in the pipeline, more than the 786,000m2 GFA of office space that was in the pipeline in the
3 |
MARKET TRENDS
SINGAPORE PROPERTY MARKET

4 |
SINGAPORE REPORT | JUNE 2017
Due to persistent weakness in private sector construction works, the overall construction sector contracted by 1.4% in 1Q 2017, extending the 2.8% decline recorded in 4Q 2016. The Building Construction Authority (BCA) maintains its forecast for construction demand to come in at S$28 million to S$35 million for the full year with the public sector projected to account for approximately 70% of the total construction demand.
Although Budget 2017 gave the construction sector a boost by bringing forward the start dates for about $700 million worth of public-sector infrastructure projects to this year and 2018, the overall construction sector is expected to experience aggressive tender competition while tender opportunities are likely to remain uneven across both the private and public sectors.
While the local construction industry undergoes a major revamp to reduce its reliance on foreign workers, and to improve productivity to offer better paying jobs for locals, employment in the construction sector declined by 12,900 for the third consecutive quarter due to continued weakness in private sector construction activities. The decline in employment in 1Q 2017 was mainly due to the reduction in Work Permit Holders (WPH) in the manufacturing and construction sectors.
The government constantly urges local construction firms, especially small and medium-sized enterprises (SMEs) to keep pace with the technology push despite the tough economic outlook. These technologies include offsite construction methods, which are more expensive, but can shorten building time and cut manpower
needs and digital building design, which requiresinvestment and skilled manpower. The road map for the future of the construction sector, known as the Industry Transformation Map (ITM), is scheduled to be released in late 2017.
In its push to get more contractors to adopt pre-fabricated building technologies (i.e. Design for Manufacturing and Assembly (DfMA)), the government will extend a tax relief scheme, called the Land Intensification Allowance (LIA) scheme, till June 2020. The LIA scheme aims to promote the intensification of industrial land use towards more land-efficient and higher value-added activities. Construction firms can receive a tax relief on the capital expenditure incurred in the construction of Integrated Construction and Prefabrication Hubs (ICPHs), which are multi-storey advanced manufacturing facilities for producing prefabricated construction elements. In addition, the government is looking to pilot a government land sales (GLS) site that specifies productivity outcomes to encourage innovative solutions by offering developers the flexibility to propose the most suitable technologies to adopt.
BCA is currently exploring the use of automated checking software to identify non-compliance of building requirements when processing building plans. Productivity levels are expected to be raised higher when there is easier and more transparent processing.
Based on current demand and cost trends, and barring any significant contraction in the public sector construction programme, building tender prices in 2017 is anticipated to continue on a downward trend.
MARKET TRENDS
SINGAPORE CONSTRUCTION MARKET

5 |
In its latest World Economic Outlook report, the International Monetary Fund (IMF) raised its global growth forecast for 2017 to 3.5% after a 3.2% expansion last year. The World Trade Organisation (WTO) projects a 2.4% growth in global trade volume for 2017 but cautioned against heavy uncertainty regarding the volatile global economic environment, trade policy, monetary policy and other political factors, especially US President Trump’s protectionist trade policy plans.
The U.S. Commerce Department revised the country’s gross domestic product (GDP) for 1Q 2017 to a 1.2% annual rate from the 0.7% pace, still showing the weakest performance since 1Q 2016. The IMF forecasts the U.S. economy to grow 2.3% for the whole year. The Trump administration’s ambitious goal to sharply boost economic growth rates to 3.0% remains a challenge as the country has only expanded at an average 2.0% rate since year 2000. The Commerce Department also reported the country’s construction spending fell by 1.3% to annual rate of US$1.21 trillion in June 2017, following an upwardly revised May figure of US$1.22 trillion. The unexpected decline in construction was due to a sharp drop in public spending of 5.4% to a rate of US$265.1 billion, the largest drop since March 2002.
The eurozone economy expanded 0.5% in 1Q 2017, achieving the same as the previous quarter. The United Kingdom had the lowest GDP growth rate in the European Union (EU) in 1Q 2017, according to the European statistics agency Eurostat. Moreover, the terms of Britain’s exit from the European Union (EU) and the single market remain unsettled and the impact of Brexit on Britain’s economy is expected to be manifold when it formally leaves the EU in 2019. Meantime, the IMF expects stable economic momentum in the euro area for the rest of 2017 and projects a 1.7% growth for the whole year.
SINGAPORE REPORT | JUNE 2017
MARKET TRENDS
GLOBAL ECONOMY
In Asia, as the Chinese government continues to tighten monetary conditions and regulate overseas investments, GDP in 1Q 2017 rose 6.9% to mark a second quarter of accelerating growth, heavily driven by infrastructure spending and real estate construction. Preliminary figures released by the National Bureau of Statistics of China (NBSC) showed GDP maintained a growth of 6.9% for 2Q 2017, staying on par with the preceding quarter. According to the National Bureau of Statistics of China (NBSC), preliminary GDP grew by 6.9% in 2Q 2017, staying on par with the preceding quarter. The official manufacturing Purchasing Managers’ Index (PMI) climbed up to 51.7 points in June, marking the eleventh month of expansion and also the fastest pace of growth since March. This suggests the country could be on track to meet its annual growth target of 6.5% for 2017. The IMF projects China will expand 6.6% in 2017.
Regarded as one of the world’s fastest growing emerging economies by the IMF, India’s GDP expanded at a three-year low of 6.1% ending March for fiscal year (FY) 2016/17, and the country tries to tackle its pressing economic, human development and social equity issues. India is projected to surpass China to become the world’s most populous country by 2024, prompting rapid urban population growth, which will challenge the government’s capacities to provide basic services and infrastructure. Due to the recent demonetization of its currency and a new goods and services tax (GST) that will come into effect latest by September this year, the Reserve Bank of India (RBI) expects India’s economy to grow 7.3% in FY 2017/18 on the back of the GST rollout, political stability, reforms in the real estate sector and for foreign direct investments (FDI). But the IMF forecasts India’s economy to slow temporarily this FY 2017/18 to 6.6% and at 7.2% in FY2018/19.

6 |
Data Sources: BCA and RLB
Variances between the RLB and the BCA Tender Price index arise from differences in the index derivation methodology, the basket
of items and weightages used for each index and the variety of building projects utilised. The index basket here excludes piling works
and Mechanical & Electrical services.
Base Year 2010 = 100
* Average indices as at 1st Quarter 2017
Note:
Data Source: BCA
Annual change 2017 2007 2008 2009 2010 2011 2012 2013 2014 2015 2016 2017*
RLB TPI -3.6% 106.2 123.2 100.2 100.0 103.1 105.7 110.5 112.0 110.2 105.3 101.5
BCA TPI -1.3% 107.1 119.9 101.3 100.0 99.7 99.8 104.6 106.8 104.0 98.0 96.7
BUILDING TENDER PRICE INDICES
Annual change 2017 2007 2008 2009 2010 2011 2012 2013 2014 2015 2016 2017*
HDB Flats -4.3% 103.6 124.3 107.2 100.0 93.0 92.0 97.8 99.8 96.0 85.8 82.1
PrivateNon-Landed
-1.0% 110.9 120.0 101.9 100.0 101.7 103.5 108.0 110.1 107.6 104.7 103.6
CommercialOffices
-1.4% 110.5 118.4 102.0 100.0 102.5 103.5 106.3 107.0 103.7 99.9 98.5
JUNE 2017|SINGAPORE REPORT
80
90
100
110
120
130
TENDER PRICE TRENDS
BCA TENDER PRICE INDICES
80
90
100
110
120
130
0
500
1,000
1,500
2,000
2,500
3,000
3,500
4,000
4,500
5,000
5,500
6,000
6,500
USD/TonneUSD/Tonne
400
450
500
550
600
650
700
CRUDE OIL PRICES
Data Source: BCA
Data Source: IMF
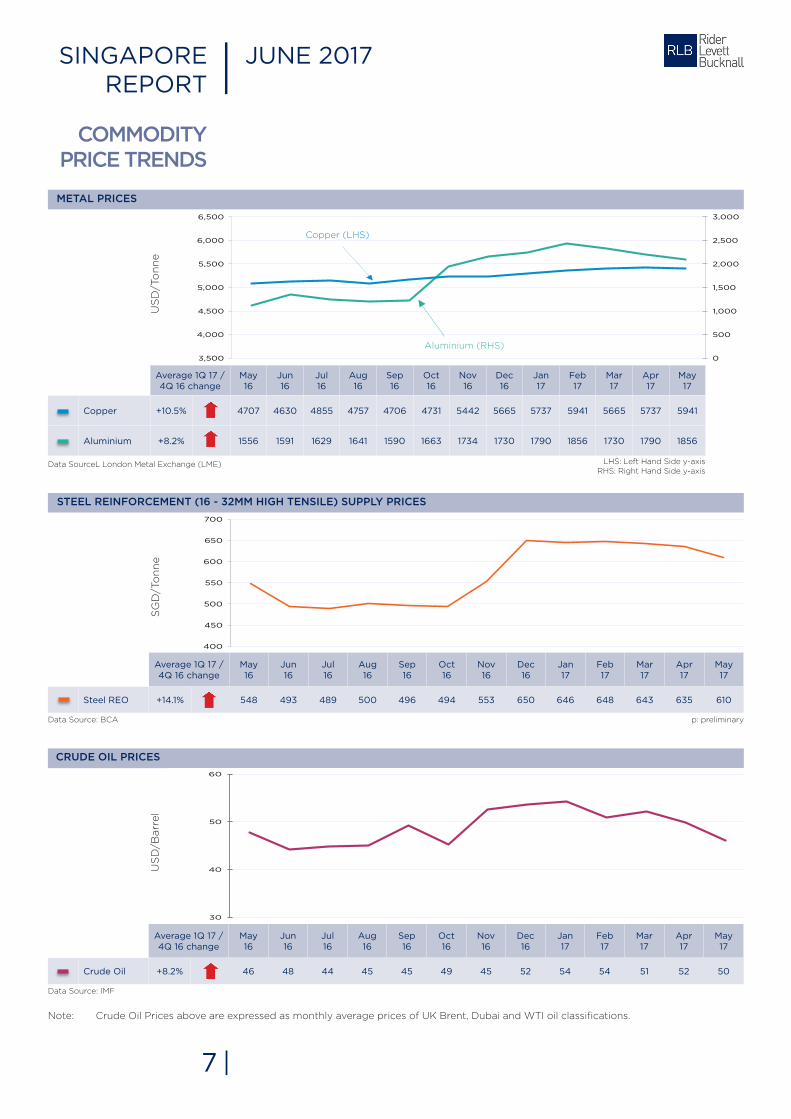
Note: Crude Oil Prices above are expressed as monthly average prices of UK Brent, Dubai and WTI oil classifications.
7 |
STEEL REINFORCEMENT (16 - 32MM HIGH TENSILE) SUPPLY PRICES
METAL PRICES
Average 1Q 17 / 4Q 16 change
May16
Jun16
Jul16
Aug16
Sep16
Oct16
Nov16
Dec 16
Jan 17
Feb17
Mar17
Apr17
May17
Crude Oil +8.2% 46 48 44 45 45 49 45 52 54 54 51 52 50
US
D/B
arr
el
SG
D/T
on
ne
US
D/T
on
ne
LHS: Left Hand Side y-axisRHS: Right Hand Side y-axis
SINGAPORE REPORT | JUNE 2017
COMMODITY PRICE TRENDS
Average 1Q 17 / 4Q 16 change
May16
Jun16
Jul16
Aug 16
Sep16
Oct16
Nov 16
Dec 16
Jan17
Feb17
Mar17
Apr17
May17
Steel REO +14.1% 548 493 489 500 496 494 553 650 646 648 643 635 610
Average 1Q 17 / 4Q 16 change
May16
Jun16
Jul16
Aug 16
Sep16
Oct16
Nov 16
Dec 16
Jan 17
Feb17
Mar 17
Apr17
May17
Copper +10.5% 4707 4630 4855 4757 4706 4731 5442 5665 5737 5941 5665 5737 5941
Aluminium +8.2% 1556 1591 1629 1641 1590 1663 1734 1730 1790 1856 1730 1790 1856
Copper (LHS)
Aluminium (RHS)
p: preliminary
Data SourceL London Metal Exchange (LME)
30
40
50
60

50.0
100.0
150.0
0.0
20.0
40.0
60.0
80.0
100.0
120.0
Jun 16 Jul 16 Aug 16 Sep16 Oct16 Nov16 Dec16 Jan 17 Feb 17 Mar 17 Apr 17 May 17 Jun 17P
S$/m3S$/Tonne
BASIC CONSTRUCTION MATERIALS
Data Source: BCA
Prices of rebar other than 16-32mm dimensions may be subject to surcharge.Prices of granite and concreting sand exclude local delivery charges to concrete batching plants.The market prices of rebar (without cut & bend) are based on fi xed price supply contracts with contract period 6 months or less.The market prices of ready mixed concrete are based on contracts with non-fi xed price, fi xed price and market retail price for Grade 40 Pump.
Note:
CURRENCYEXCHANGE RATES
Data Sources: IMF, Oanda
Note: Exchange rates above are expressed in terms of currency units per US Dollar; averaged monthly from daily unit rates.
8 |
CURRENCY UNITS PER USD
UNIT JAN 17 FEB 17 MAR 17 APR 17 MAR 17 JUN 17
Singapore Dollar $ SGD 1 1.43 1.41 1.41 1.40 1.40 1.38
Euro € EUR 1 0.94 0.94 0.94 0.93 0.90 0.83
U.K. Pound Sterling ₤ GBP 1 0.81 0.80 0.81 0.79 0.77 0.77
Australian Dollar $ AUD 1 1.34 1.30 1.31 1.33 1.35 1.30
Chinese Yuan ¥ CNY 1 6.90 6.87 6.90 6.89 6.89 6.81
Malaysian Ringgit RM MYR 1 4.46 4.45 4.44 4.41 4.32 4.28
Japanese Yen ¥ JPY 100 1.15 1.13 1.13 1.10 1.12 1.11
Myanmar Kyat K MMK 100 13.77 13.89 13.87 13.79 13.82 13.83
Indonesian Rupiah Rp IDR 1000 13.36 13.34 13.35 13.31 13.32 13.30
Vietnamese Dong ₫ VND 1000 22.88 22.98 23.02 23.00 22.96 22.96
Average 1Q17 / 4Q16 change
Jun 16
Jul 16
Aug 16
Sep 16
Oct 16
Nov 16
Dec 16
Jan 17
Feb 17
Mar 17
Apr 17
May 17
Jun 17P
Conc. Sand % 19.4 17.9 16.4 16.2 15.9 16.2 16.2 16.3 16.7 17.0 16.3 16.9 16.9
Granite (20mm) % 15.3 15.1 14.8 14.6 14.6 15.0 15.0 15.2 15.0 15.1 15.7 16.1 16.6
Cement % 82.6 81.2 81.1 80.5 80.1 79.3 79.0 76.8 76.3 75.9 76.5 76.2 76.7
Ready Mixed Conc. % 84.6 83.7 82.8 82.2 81.6 80.8 80.8 81.4 81.1 80.7 80.3 80.2 80.3
SINGAPORE REPORT | JUNE 2017
MATERIAL PRICE TRENDS
p: preliminaryLHS: Left Hand Side y-axis
RHS: Right Hand Side y-axis
Granite (LHS)Concreting Sand (LHS)
Cement (LHS)
Ready-Mixed Concrete (RHS)

LOCALCONSTRUCTION
PRICES
Notes:CFA - Construction Floor Area is the area of all building enclosed covered spaces measured to the outside face of the external walls including covered basement and above ground car park areas.
GFA - Gross Floor Area is the area of building enclosed covered spaces excluding car park and driveway areas calcu- lated for purposes of planning submissions.
All Singapore construction prices stated herein are as at 1st Quarter 2017, and include a general allowance for founda-tion, carpark and external works. The price ranges herein are indicative and due consideration should be given to the impact of varying design, specifications, size, location and nature of each project when utilising this information. Prices described here may not fully reflect the extent of current market forces and tendering conditions on any specific project.
Exclusions:• Land cost • Legal and professional fees • Development charges • Authority fees • Finance costs • Loose furniture, fit-tings and works of art (unless otherwise stated) • Tenancy work • Site infrastructure work • Diversion of existing services • Green Mark cost premiums • Resident site staff cost • Models and prototypes • Future cost escalation • Goods and Services Tax
Disclaimer: While Rider Levett Bucknall LLP (“RLB”) has endeavoured to ensure the accuracy of the information and materials in this report (the “Materials”), it does not warrant its accuracy, adequacy, completeness or reasonableness and expressly disclaims liability for any errors in, or omissions therefrom. RLB shall not be liable for any damage, loss or expense whatsoever arising out of or in connection with the use or reliance on the Materials. The Materials are pro-vided for general information only. Professional advice should be obtained for your particular factual situation before making any decision. The Materials may not, in any medium, be reproduced, published, adapted, altered or otherwise used in whole or in part in any manner without the prior written consent of RLB.
9 |
DEVELOPMENT TYPE COST PER CFA
S$/m2
LANDED RESIDENTIAL
Terrace House 2,300 – 2,700
Semi-detached House 2,400 – 3,250
Detached House 3,400 – 5,600
Cluster Housing 2,400 – 2,950
INSTITUTIONAL
Institution of Higher Learning
2,750 – 3,450
Medical Institution 4,000 – 5,450
INDUSTRIAL
Single Storey Warehouse 1,100 – 1,600
Light Industrial Building 1,200 – 1,700
Heavy Industrial Building 1,450 – 2,000
CAR PARK
Above Grade Car Park 700 – 1,400
Basement Car Park 1,500 – 2,250
HEALTHCARE
Nursing Home 1,700 – 3,150
Medical Centre 2,900 – 3,300
Hospital 3,400 – 3,800
SINGAPORE REPORT | JUNE 2017
DEVELOPMENT TYPE COST PER CFA COST PER GFA
S$/m2 S$/m2
OFFICE
Standard (outside CBD) 2,000 – 3,200 2,450 – 4,100
Standard (within CBD) 2,050 – 3,300 2,950 – 4,350
Prestige (within CBD) 2,950 – 4,150 4,100 – 5,400
HOTEL (INCLUDING FF&E)
Serviced Apartment 3,050 – 3,550 4,050 – 4,650
Three Star 3,250 – 3,650 4,050 – 4,750
Four Star 3,550 – 4,400 4,650 – 5,800
Five Star 4,250 – 5,500 5,400 – 7,300
RETAIL
Medium Quality 2,000 – 2,850 3,000 – 3,600
Good Quality 2,950 – 3,350 3,700 – 4,400
CONDOMINIUM
Medium Quality Condominium
1,950 – 2,600 2,600 – 3,350
Good Quality Condominium
2,500 – 3,150 3,350 – 4,300
Luxury Quality Condominium
3,200 – 4,350 4,350 – 5,900
Cover: Night view of Singapore’s Central Business District and Downtown Core

PROFESSIONAL SERVICESRIDER LEVETT BUCKNALL (RLB) is an independent, global property and construction practice with over 3,500 people in more than 120 offices across Asia, Oceania, Europe, Middle East, Africa and the Americas, serving major local and international clientele.
RLB’s global expertise and significant project experience provides comprehensive services and solutions to the development and construction of the built environment, extending to building and civil infrastructure, commercial, residential and hospitality buildings, healthcare, industrial and civil engineering projects. As a multi-disciplinary group, RLB offers a full range of services required by clients in the property and construction industry, ranging from cost consultancy and quantity surveying, project management, advisory services and market research.
RLB Research’s expertise in economic and market studies, industry participation and research publications position us as the choice consultant for advice on construction cost trends and market updates for the regional construction markets.
The extensive range of professional consultancy provided by RLB covers the following core services:
OTHER REGIONAL RLB PRACTICES
MALAYSIA
RL Bersepadu Sdn BhdB2-6-3 Solaris Dutamas No. 1 Jalan Dutamas 150480 Kuala Lumpur MalaysiaTel: +60 3 6207 9991Fax: +60 3 6207 9992Email: [email protected]: Lai Kar Fook
VIETNAM
Rider Levett Bucknall Co. LtdCentec Tower, 16th Floor Unit 1603, 72-74 Nguyen Thi Minh Street Ward 6, District 3, Ho Chi Minh City, VietnamTel: +84 83 823 8070Fax: +84 83 823Email: [email protected]: Ong Choon Beng
MYANMAR
Rider Levett Bucknall LimitedUnion Business CentreNat Mauk Road, Bo Cho Quarter, Bahan Township, Suite 03-02, Yangon 11121, MyanmarTel: +95 1 860 3448 Ext 4004 Fax: - Email: [email protected]: Serene Wong
INDONESIA
PT. Rider Levett BucknallJl. Jend. Sudirman Kav. 45-46 Sampoerna Strategic Square, South Tower Level 19Jakarta 12930, IndonesiaTel: +62 21 5795 2308 Fax: - Email: [email protected]: Widitomo Puntoadi
QS and Cost Consultancy Project Management Advisory and Research Services
Feasibility Studies Client Representation Asset Advisory
Value Engineering Project Management Services Transaction Review
Cost Planning and Estimating Development Management Technical Due Diligence
Tender & Contract Documentation Contract Administration Replacement Cost Assessment
Contract Procurement and Delivery Construction Management Capital Cost Allowances Assessment
Cost Management Procurement Management Building RElifing Services
Progress and Variation Valuations Facilities Management Consulting
Post-Contract Services Litigation Support
Project Risk Management Risk Mitigation and Due Diligence
Financial Reporting and Management Procurement Strategies
Final Accounts Construction Market Research
Auditing Services Industry Trend Analysis
Cost Escalation and Cost Bench-marking by Sectors

rlb.com
A Quarterly Publication from RLB Research of:
Rider Levett Bucknall LLP 150 Beach Road #09-01 Gateway West Singapore 189720 Tel: +65 6339 1500 | Fax: +65 6339 1521 | Web: www.rlb.com | E-mail: [email protected]
MCI (P) 140/06/2016